Embed Size (px)
Citation preview

1
Shetland’s Commission on Tackling Inequalities
Background Information

2
Poverty is having too few resources to be able to follow ‘ordinary living
patterns, customs and activities’
Peter Townsend (1979)
Townsend, P. (1979) Poverty in the United Kingdom, London: Penguin.
• Standard definitions of poverty distinguish between different levels of poverty:
•Relative Poverty: equates to a household income of less than 60% of UK average •Severe Poverty: equates to a household income of less than 50% of UK average •Extreme Poverty: equates to a household income of less than 40% of UK average
• For a single person in Scotland, living in relative poverty means a household income of £9,200 per year; for a couple with two children, the household income is £21,000.
• Minimum living costs for those living in remote rural Scotland are estimated to be
10-40% higher than the equivalent in urban UK.

3
Unequal Societies
4
Source: Wilkinson, R.G. & Pickett, K. (2009) The Spirit Level: Why More Equal Societies Almost Always Do Better, London: Allen Lane This book from 2009 brings together a considerable amount of data to demonstrate the authors’ argument that, in developed countries, the more unequal a society, the poorer the outcomes for all those within that society. The book primarily used some 30 years of accumulated research into the poor health and social outcomes associated with inequality.

5
Income per Head & Life-Expectancy: Rich & Poor Countries
Source: Wilkinson, R. & Pickett, K., (2009) The Spirit Level www.equalitytrust.org.uk
This graph shows the developed world countries to the right hand side levelling off along a line. These are the same countries analysed in The Spirit Level. What appears to be happening here is that, as countries get richer they no longer deliver longer life expectancy. A similar pattern is also revealed when plotting “Happiness” scores. This is the first time in human history when we appear to be reaching the limits of what economic growth can do for developed countries: the graphs are flattening out and we are heading for diminishing returns from growth. By contrast, if we look to the countries on the left hand side of the graph – the developing world countries – we can see that small increases in wealth (small moves along the x-axis) still deliver large jumps up the life expectancy scale (the y-axis). Economic growth still matters very much to developing world countries.

6
How Much Richer are the Richest 20% Compared to the Poorest 20%?
Source: Wilkinson,R.G & Pickett, K., (2009) The Spirit Level , London: Allen Lame www.equalitytrust.org.uk
This graph shows the income gap between the richest fifth and poorest fifth in a number of developed countries. The Spirit Level predominantly used data from these developed world countries, where data was available. When the analyses were re-tested on the 50 U.S. States, results were strikingly similar. The relationships were tested on two separate test-beds and have been found to be robust. The UK is one of the most unequal of the developed world countries with a seven-fold gap between the average wealth of the top and bottom 20% of the population. Throughout The Spirit Level it was found that the same countries tended to do well or do badly on all the health and social outcomes analysed. Those doing well were generally the Nordic countries and Japan. Those performing badly were generally the UK, US, Portugal (and Singapore where data was available). Although Scotland is less unequal than the UK as a whole, we would rank 20th in the OECD* for income inequality, as measured by the Gini Coefficient. The Spirit Level found that countries can choose different routes to greater equality. They can use Nordic style tax and spend via large welfare states or they can opt for narrower spreads of income before tax like in Japan and have modest taxes and social spending. Another key finding was that the most equal countries e.g. Sweden and Japan, compared to the UK, had between two and ten times better outcomes. *OECD: Organisation for Economic Co-operation and Development

7
Trends in Income Inequality 1979-2005/6 (Gini Coefficient, Great Britain)
Brewer, M., Goodman A. et al. (2007) Poverty and Inequality in the UK. London: Institute of Fiscal Studies
Within the UK, this graph demonstrates the increase in inequality. The Gini coefficient is a measure favoured by economists to measure the income gap between rich and poor. It doesn’t much matter how you measure income inequality (top 20% v bottom 20% or top 10% v bottom 10%) the picture is pretty much the same. Inequality in the UK trended gently downwards from 1945 until the 1980s. The graph above shows that inequality rose sharply under the Thatcher governments during the 1980s and has levelled off subsequently whilst refusing to reduce. It now seems to be entrenched. At national level, there has been a social policy focus on addressing poverty and not inequality. This has gone hand in hand with a political discourse around equality of opportunity and social mobility. Government efforts have been targeted at raising up the poor whilst the rich have largely been left out of the policy mix. The stubbornly high levels of inequality in the UK are due to any improvements made at the bottom being more than exceeded by increases in incomes at the top. Therefore, whilst some progress has been made in tackling poverty (in particular, child poverty) the problems of relative deprivation remain, feeding into enduringly high levels of health and social problems.

8
Index of: • Life expectancy
• Math & Literacy
• Infant Mortality
• Homicides
• Imprisonment
• Teenage Births
• Trust
• Obesity
• Mental Illness –incl. Drug & Alcohol Addiction
• Social Mobility
Health and Social Problems are Worsein More Unequal Countries
Source: Wilkinson, R. & Pickett, K., (2009) The Spirit Level
www.equalitytrust.org.uk The main argument of The Spirit Level is that health and social impacts on society are statistically sensitive to inequality. This graph is repeated again and again, within the book, in terms of the
countries or US states and each of the indexes / outcomes on the left. The graph brings all of this together and is known as the Index Graph. When all the health and social problems analysed in The Spirit Level are combined into an index there is a very strong relationship with income inequality. More unequal countries, such as the UK, tend to score worse on all these indicators than more equal ones. There is a strong correlation, therefore, between inequality at a national level and social outcomes. Although correlation is not causation, the aforementioned relationship is very strong and all the listed social problems move together. A society with high levels of one type of problem will almost always score badly on all the other indices, even when the problems are quite obviously unrelated e.g. rates of obesity and rates of homicide. This suggests a single underlying cause outside of individual health and social problems and no one has yet suggested a more comprehensive or compelling underlying cause than inequality. Wilson and Pickets’ argument is that, as humans, we are sensitive to inequality because it gets under our skin. We are social animals who tend to see ourselves through other people’s eyes. People who live in more unequal societies are more likely to consider their social position more often. Where there are great disparities in income within a society, social distances are increased and the overall quality of social relations is damaged. People are more likely to suffer from prolonged stress, which leads to chronic ill-health. In turn, this can affect personal relationships. It can also be the trigger for violence, if people feel disrespected or threatened by social comparisons. The Spirit Level spends a lot of time discussing the psycho-social pathways that lead from inequality to poor health and social outcomes. It is a relatively new area of study, but is becoming increasingly understood as more research is carried out.

9
Health and Social Problems are not Related to Average Income in Rich Countries
Index of: • Life
Expectancy
• Math & Literacy
• Infant Mortality
• Homicides
• Imprisonment
• Teenage births
• Trust
• Obesity
• Mental Illness – incl. Drug & Alcohol Addiction
• Social Mobility
Source: Wilkinson, R. & Pickett, K., (2009) The Spirit Level
www.equalitytrust.org.uk When the same index of health and social problems is plotted against national income in the graph above, the strong relationship seen in the original Index Graph disappears altogether. This suggests that, whilst addressing income inequality is a potentially powerful lever in reducing a society’s scale of health and social problems, simply getting richer as a society is not such a reliable lever.

10
Levels of Trust are Higher in More Equal Rich Countries
Source: Wilkinson, R. & Pickett, K., (2009) The Spirit Level
www.equalitytrust.org.uk
The Spirit Level sets out that, if we are to make our societies more equal and more sustainable, we are all going to have to change the way we live and, to gain acceptance for those changes, we are going to have to trust each other a lot more.
As the graph above demonstrates, barely 1 in 3 people in the UK currently think most other people can be trusted. This feeds into our problematic social discourse, where it can seem as if everyone is pitched against one another. One section of society is often depicted as gaining at someone else’s expense.
With such low levels of trust, it makes it very hard to make social progress.
If we had a more equal society (similar to Sweden for example, where 2 out of 3 routinely trust other people) we would have far more chance of constructing a consensus around how to create the “Good Society”, one that is healthy, socially better and more sustainable.

11
The key facts in the following slides are from Scotland, taken from the Joseph Rowntree Foundation (JRF) report: Monitoring Poverty and Social Exclusion in Scotland 2015. Source: Kenway, P., Bushe, S., et al. (2015) Monitoring Poverty and Social Exclusion in Scotland 2015 http://www.jrf.org.uk/publications/monitoring-poverty-and-social-exclusion-scotland-2015
12
Key Facts for Scotland
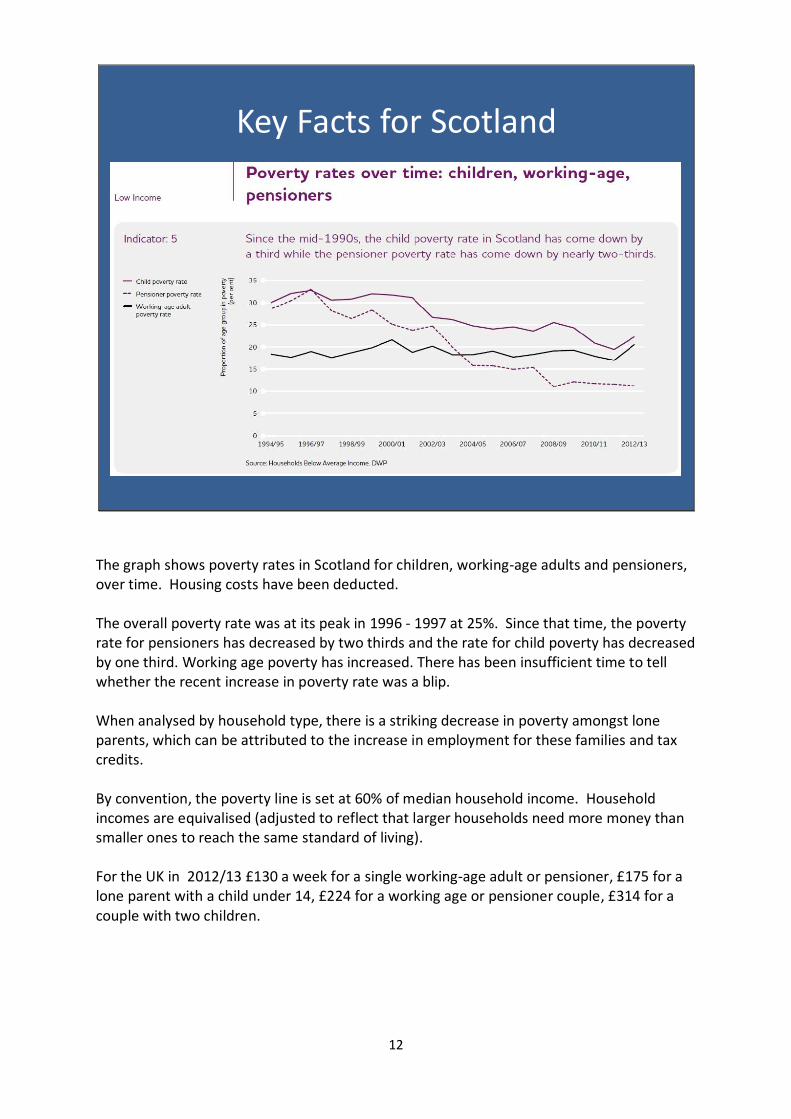
The graph shows poverty rates in Scotland for children, working-age adults and pensioners, over time. Housing costs have been deducted. The overall poverty rate was at its peak in 1996 - 1997 at 25%. Since that time, the poverty rate for pensioners has decreased by two thirds and the rate for child poverty has decreased by one third. Working age poverty has increased. There has been insufficient time to tell whether the recent increase in poverty rate was a blip. When analysed by household type, there is a striking decrease in poverty amongst lone parents, which can be attributed to the increase in employment for these families and tax credits. By convention, the poverty line is set at 60% of median household income. Household incomes are equivalised (adjusted to reflect that larger households need more money than smaller ones to reach the same standard of living). For the UK in 2012/13 £130 a week for a single working-age adult or pensioner, £175 for a lone parent with a child under 14, £224 for a working age or pensioner couple, £314 for a couple with two children.

13
Key Facts for Scotland
This shows the number of people in poverty when divided into five age groups. The adult face of poverty is changing: it’s becoming younger.

14
Key Facts for Scotland
The above image shows the proportion of people with (equivalised) household incomes below 50% (deep poverty), below 60% (poverty) and below 70% of median income. The graphic is also divided into those who have at least one disabled adult in their family and those who don’t. DLA (Disability Living Allowance) and AA (Attendance Allowance) are removed from household income: these benefits are awarded to meet the higher cost of living faced by people with disabilities. 27% of people with a disabled adult in their family are in poverty, compared to 15% of families with no disabled adult.

15
Key Facts for Scotland
The above graphic shows the proportion of people in poverty when divided into children, working-age adults and pensioners. It also shows whether the family is working. Working-age adults in working families are sub-divided further according to whether there are one or two adults in the family and whether they have dependent children. Of the 920,000 people in poverty for this period, 23% were children, 64% were working-age adults and 13% were pensioners.

16
Income DistributionOver the long-term, income levels in Scotland have risen. However, the
distribution of income is skewed by a small proportion with very high incomes.
Focussing on low incomes alone is unlikely to reduce income inequality.
The bottom 40% of
households have just
over 20% of household
income in Scotland.
The middle 50% have approx.
half of all income. This is the
case across time and
internationally.
Inequality is driven by how the
remaining 50% is divided
between the top 10% and the
bottom 40%.
The top 10% of
households have
approx. 25% of
household income
in Scotland.
16
Source: Scottish Government Income Inequality Briefing March 2015 Income: the total net household income, from all sources, adjusted for household size and composition (includes earnings and benefits in kind).

17
Wealth Distribution
Wealth is far more unequally distributed than income
The bottom 40%
had 5% of wealth.
The middle 50%
had 51% of wealth.
The top 10% had
over 44% of wealth.
The top 2% alone
had 17% of all
wealth
17
Source: Scottish Government Income Inequality Briefing March 2015 Wealth: Net household assets, including financial wealth, property wealth, private pension wealth, and physical wealth. Net wealth is the value of assets minus any outstanding debts (such as mortgages).

18
Shetland Compared to Scotland
Reports
Health & Wellbeing Profile_Shetland.pdf
Shetland Islands SIMD2012.pdf
Indicators in the SIMD 2012 domains_Shetland 24Jun15.pdf
Two Key Pieces of Information, which enable us to compare Shetland on measures of
inequality with the rest of Scotland.
Care needs to be taken with both, because of our remote geography and small numbers.

19
POVERTY: See it Change it
Kelvin Anderson and Kaylee Mouat
MSYPs
Scottish Youth Parliament Report (October 2015) It’s not a Choice: an analysis of young people’s perceptions of poverty and rights http://www.syp.org.uk/img/its_not_a_choice/Its_not_a_choice_Final_Report.pdf “It’s not a choice seeks to gain a better understanding of how Scotland’s young people perceive poverty, its causes, and impacts, and what more should be done to tackle it. The findings demonstrate that young people have accurate understanding of poverty, who it affects, and its causes and impacts. The report also outlines that young people think that both the Scottish Government and the United Kingdom Government need to do more.” Jordan Linden MSYP
Chair of the Scottish Youth Parliament

20
The Background
In 1999, the UK Government made the commitment to tackle child poverty in the nation by 2020. The UK Child Poverty Act 2010 made this commitment into law. As 2020 is now only five years away, the Scottish Youth Parliament has launched a national campaign, See It Change It. The Scottish Youth Parliament wants to see this commitment seen through. We want to see child poverty tackled within the next 5 years. This issue was never going to be an easy one to resolve but if we work hard enough we can help change the lives of so many young people in Scotland and the rest of the UK. Every young person deserves a good start in life. The Child Poverty Act 2010 sets out legally binding targets against four measures, which effectively define poverty in terms of: relative poverty; absolute poverty; combined low income and material deprivation; and persistent poverty. The 2010 Act also: places a duty on the Secretary of State to ensure the targets are met by 2020; establishes the Social Mobility and Child Poverty Commission (SMCPC) which reports on progress annually; and places a duty on the devolved administrations to produce regional strategies. However, recent publications, most notably by the Institute of Fiscal Studies and the SMCPC itself, have shown that the targets set out in the 2010 Act are likely to be missed by a considerable margin, with relative poverty actually increasing over the decade. Evidence suggests that in Scotland specifically, the number of children living in poverty is expected to rise by between 50,000 and 100,000 by 2020.

21
The Campaign
• “POVERTY: See it Change it” was launched On 23rd January in Glasgow.
• The campaign aims to:
• Raise awareness among young people about child and youth
poverty, and their right to an adequate standard of living;
• Combat popular stigma associated with poverty; and,
• Challenge elected leaders and key stakeholders to work
together to uphold the UK-wide commitment to tackle child
poverty by 2020.
•We want to see and understand child and youth poverty, and then work together to change it and improve the lives of young people across Scotland. •Child poverty means that children grow up in families without the resources to have the same diets, opportunities, and living conditions that are considered normal in Scotland. Poverty can often undermine the health, wellbeing, and the educational opportunities of children and young people.

22
Key Messages
• The key messages of the campaign are centred on the
• notion of recognising poverty in Scotland and working
• to change it:
• See it.
• Change it.
• Keep it.
See it. – We want Scotland to have a more complete understanding of the reality of child and youth poverty, the rights of children and young people to be free from poverty, and break down stigmas and stereotypes. Change it. – We want to raise awareness about the one in five children in Scotland who live in poverty, and demand change. Keep it. – We want to ensure elected leaders uphold the 2020 commitment to tackle child poverty. With five years to go, and statistics indicating that child poverty is likely to increase, now is the time to seriously act.
The Facts

23
Our findings
The findings from ‘It’s not a choice’ show that young people: 1 Understand who is affected by poverty. 3 Have a strong understanding of the causes of poverty. 2 Do not believe that people are in poverty solely because of their choices, and are less likely to believe this is the case than the wider population. 4 Strongly recognise and understand the emotional, social, and financial impacts of poverty among young people. 5 Believe governments do not spend enough money tackling poverty. 6 Display a lack of awareness about what governments are doing to tackle poverty among young people. 7 Believe the solutions to poverty reside in increasing vocational education, paying the living wage, improving further and higher education, providing affordable childcare, and improving schools in deprived areas. 8 Believe governments have a responsibility to protect the rights of children and young people. 9 Believe the views of children and young people must be listened to by decision-makers when deciding how to tackle poverty. 10 See poverty and the defence of their rights (or lack thereof) as being linked.
Read a copy of It’s not a Choice online:

24
Participants also expanded on their views if some of the causes of poverty.
“Gender : women tend to find it harder to gain higher paid, long term work.”
“I think the education system in communities compared to that in more affluent areas is a
big factor. Young people in disadvantaged areas are not given the same chances as those
form middle and upper class families.”
“Going to uni and not being able to meet basic living costs so you get into debt you can’t
pay, take a job, and then flunk because of the pressure when you should have just been able
to focus on studying. This is not a problem for people coming from better off families.”

25
Does the Government spend enough on tackling poverty?
Governments do not spend enough money tackling poverty. An overwhelming majority (68%) of the children and young people who participated in the study believed that governments do not spend enough money tackling poverty. Although not directly comparable, the findings show that young people are more in favour of increasing public spending to tackle poverty than the wider population. There is lack of awareness about what governments are doing to tackle poverty among young people. Around one in five participants indicated that they “Don’t know” whether governments are spending enough to tackle poverty. There is a clear narrative throughout the qualitative responses, that there is a lack of awareness among children and young people about the policies and strategies employed by governments to tackle poverty. Even among participants who show some level of the awareness, it is often generalised and limited in nature. This finding is mirrored in studies about awareness of the wider population, although the comparison should be treated with caution.

26
Their comments

27
The sole purpose of It’s not a choice is to give children and young people a voice in the existing wide ranging debates about poverty in Scotland. Although modest in scope and scale, the findings of It’s not a choice confirm exactly that; young people do not believe that living in poverty is a choice. This is a significant and important finding given that it would appear that young people are much less likely to believe this than the wider population. This is a positive story. In addition, it is a positive finding insomuch as it demonstrates, along with other findings, that young people have a strong understanding of who is affected by poverty, and its key structural causes. A further interesting finding is that young people believe that governments should invest in longer term strategies to tackle the root causes of poverty, rather than to mitigate its effects. Again, this would appear to stand in contrast to the views of the wider population. Finally, the findings confirm that young people believe that governments have a responsibility to protect their rights, and that their voices should be listened to when policies are being developed to tackle poverty. The findings further tentatively suggest that young people see a link between poverty and rights; or rather, they see the existence of poverty as a failure to defend their rights. This finding merits further consideration and research in light of the increasing emphasis on viewing poverty, and approaches to tackling it, from a rights-based perspective in Scotland. Although there is intrinsic value in ensuring the views of children and young people are heard in the current discussions about poverty in Scotland, it is hoped that the findings and insights in this report will be useful to policy-makers and anti-poverty organisations, as well as building on the existing work on the children and young people’s rights agenda and identifying areas for further research.
Final Observations
“The government should invest in longer term
strategies to tackle to root causes of crime, rather than to mitigate it’s effects”
“ Young people see a link between poverty ad rights; or rather, they see the existence of poverty as a failure to defend their rights.”
Final Observations
“The government should invest in longer term
strategies to tackle to root causes of crime, rather than to mitigate it’s effects”
“ Young people see a link between poverty ad rights; or rather, they see the existence of poverty as a failure to defend their rights.”

28
ScotPHO: Health & Wellbeing Profiles
• Large number of indicators where Shetland performs ‘statistically “better” than national average’
• Two areas were ‘statistically “worse” than national average’
ScotPHO: Scottish Public Health Observatory (http://www.scotpho.org.uk/)

29
Scottish Index of Multiple Deprivation (SIMD)
• Measure of Relative Deprivation
• Multiple and Individual Domains
• Datazones: 30 in Shetland
The Scottish Index of Multiple Deprivation (SIMD) is the Scottish Government's official tool for identifying those places in Scotland suffering from deprivation. It incorporates several different aspects of deprivation and combines them into a single index. Scotland is divided into 6,505 small areas, called datazones, each containing around 350 households. The Index gives a relative ranking for each datazone, from 1 (most deprived) and 6,505 (least deprived). By identifying small areas with concentrations of multiple deprivation, the SIMD can be used to target policies and resources at the places with greatest need. Multiple Deprivation The terms 'deprivation' and 'poverty' are sometimes used interchangeably. In this context, however, deprivation is defined more widely as the range of problems that arise due to lack of resources or opportunities. This definition of deprivation covers health, safety, education, employment, housing and access to services, as well as financial aspects. The SIMD uses data relating to multiple aspects of life in order to gain the fullest possible picture of deprivation across Scotland. Seven different aspects are identified - the seven SIMD domains - and data from these domains are combined to produce the index. There are 30 datazones in Shetland. Domains and Indicators The seven domains used to measure the multiple aspects of deprivation in SIMD 2012 are:
Employment Geographic Access to Services Income Education, Skills and Training Crime Housing Health
The SIMD 2012 contains the same domains as the SIMD 2009 and SIMD 2006. As well as providing an overall ranking for each datazone, the SIMD also provides a ranking for each datazone within each of the seven domains. It is therefore possible to look at individual aspects of deprivation for each area, as well as the overall level of deprivation.

30
Scottish Index of Multiple Deprivation (SIMD)
• Middle to Upper Distribution of Datazones• Most Deprived (2012) is Sandveien (2447)• As expected, ‘access’ is where Shetland scores less well• 6.6% of the Population are income deprived, compared
to 13.4% across Scotland as a whole– Sandveien is in the 35% most income deprived datazones
in Scotland (2277)
• 6.6% of the population are employment deprived, compared to 12.8% across Scotland as a whole (has increased over time)– Holmsgarth, is in the 45% most employment deprived
datazones in Scotland (2927)

31
Shetland’s Inequalities

32
IncomeWeekly Monthly Annual
JSA, income-based (18-24) (2013/14) 57.90 251.86 3,022.38
JSA, income-based (25+) (2013/14) 73.10 317.98 3,815.82
JSA, contribution-based (similar to ESA, support group) (2013/14)
109.00 474.15 5,689.80
ESA, work-related (2013/14) 102.15 444.35 5,332.23
Minimum Wage, 37 hours (2013) 233.47 1,015.60 12,187.13
Living Wage, 37 hours 283.05 1,231.27 14,775.21
Full time, Median (2013) 506.95 2,205.25 26,463.01
Source: www.dwp.com Crude calculation to provide the net income for those on JSA, compared to the median wage for full time workers in Shetland.

33
Employment
• High Number of Vacancies• Relatively Low Rates of Unemployment (ONS, Jan to Dec 2014)
– 400, 2.9% of those aged 16 and over, as proportion of economically active
• Those on JSA / ESA Work Related have many barriers to employment, limiting choice and opportunities, with links to stigma– Mental Health– Criminal Record– Substance Misuse– Poor Qualifications and Educational Experience– Poor Self-Esteem
Source: Shetland Islands Council (2015), Research conducted for ESF Bid Shows links between income /earning potential and employment, and the challenge of moving into employment. Shows links between barriers to employment and educational attainment.

34
Education
Shetland Wide:- Attainment: 50% pupils achieved 5 or more Standard Grades or
equivalent by end of S4 (August 2013) (national average is 39.4%)- Attendance Rates (Secondary): 91.1% (Jan to Mar 2015) (national
average is 91.1%, 2012/13)- Positive Destinations: 93.4% (2013/14) (national average is 92.3%)
- Characteristics (from SDS DataHub)
Looked After Children: - Attainment: 4 year average tariff score is 141 (2009/13)- Positive Destinations: 67.7% initial and follow-up (2012/13) from 6
LACs
Source: SIC, SDS Datahub

35
Crime
Criminal Justice System, Shetland 2013/14
- 115 cases (98 individuals)
- 105 male, 16 to 55 years
- 10 female, 18 to 50 years
- 3 in education / 41 employed or self-employed / 71 unemployed
- 113 white British

36
Benefits and Service Data (Early 2013)
• 1030 Residents of Working Age in Receipt of Out of Work Benefits
• 230 seeking work • 690 Employment Support Allowance & Incapacity Benefit
• 100+ in Criminal Justice system (60-70% UN)• 139 homeless applications• 76 in substitute prescribers (50-60% UN)• 137 adults with learning difficulties (50% UN)• 26+ UN young people (16-24) – 50%+ LACs• 35 UN for >12mths / 30 UN for 6-12mths
Source: DWP

37
Access
• Car Ownership– 14,234 private cars & light goods (2014), UK
– Of 9,950 households, 1901 do not have a car (2011, census) – 19.1%
• 9.54% of home owners / 37.17% of rental
• Cost of Running a Car:– Small (<£16,000 when new):
• 41.08p / mile, for 10,000 miles / year = £4,108 / year to drive 10,000 miles (Diesel) – 139p / litre (2014)
• 37.68p / mile (Petrol) – 129p / litre (2014)
Sources: Census, AA

38
Local Evidence Base
Source: Community Planning and Development, (2015) Deprivation and Social Exclusion in Shetland – Summary, Lerwick: SIC Community Planning and Development, (2015) Deprivation and Social Exclusion in Shetland – Full Report Lerwick: SIC

39
Deprivation and Social Exclusion in Shetland (2006)
• To get a real understanding of the circumstances of individuals and families in Shetland – statistics are not enough
• To provide evidence – causes and impact
• Based on and built on statistics
• Conversations with people
Source: Community Planning and Development, (2015) Deprivation and Social Exclusion in Shetland – Summary, Lerwick: SIC

40
Findings – More than Numbers
Income and Employment‘Shoes, that is such an expense for
the children. It's the things you don't budget for, that's when it hits.’
‘We don't have enough money to do what we need to do and it’s not possible to earn more money with the jobs that are
on offer.’
‘Feel stressed with basically trying to make ends meet - it's all to do with money, most
of the time. I suppose I am anxious.’
‘The children love grapes, but they are very expensive. I have to be
careful with the money.’
‘Because Shetland is such a small place, everybody knows everybody and makes switching jobs difficult. Too much pressure not to rock the
boat.’
Despite the apparent absence of poverty in Shetland, a large number of people are in debt and a significant number are struggling to make ends meet. The relatively high cost of living for essential items means that nationally decided benefit levels do not go so far. The complexity of the national benefits system alongside the distances involved in people accessing the service hinders people claiming. To lack financial resources in Shetland means not to be able to take advantage of the opportunities that are accessible to the majority. Meanwhile, the opportunity cost of participating in low skilled, low paid jobs is higher when the cost of private transport to access work is included. Private transport is a necessary requirement to access shift work in central areas.

41
Findings – More than Numbers
Health‘If mum or dad are feeling
rubbish then I can't go out. I have to stay in to make sure nothing goes
wrong.’
‘I feel outcast by society at times due to my weight
problems, because of thyroid problems and diabetes.’
‘Sometimes depression means I can't go out, can't go to
school or town.’
‘I feel guilty spending money on fags but it
helps the stress.’
The health of people experiencing deprivation and / or social exclusion in Shetland is generally poor. The daily pressure of making ends meet and / or feeling isolated, result in considerable anxiety and depression. In turn, these, impinge on an individual’s ability to care for other areas of their health. Some are able to manage their health sufficiently, whilst others have or will reach crisis point, leading to serious mental health issues, suicidal thoughts and / or a dependency.

42
Findings – More than Numbers
Housing
‘Our mental health has been destroyed
because the house is too small, too far away from others and we are packed in together all
the time and can’t afford to get out.’
‘Our house is in the middle of
nowhere.’
‘Electricity comes first and then I make do with what
I have left.’
Homeless teenager, Lerwick
A typical case would be a young person of no fixed
abode in temporary work in Lerwick. This is obviously not
cardboard box land, but sleeping a few nights on the sofa at one friend’s house
and then moving on to another’s.
The poor standard of housing is a typical problem for deprived households in remote areas of Shetland with inhabitants seldom in the financial or health situation to resolve the issue. Housing shortages are more common closer to Lerwick. Living in a poor and / or temporary housing situation can have a large impact on the health of household members, which in turn can impact on their ability to access opportunities.

43
Findings – More than Numbers
Access
‘We can't afford to fix the car that's supposed to be mine. My partner has to have the other car. You don't like having to ask for lifts, it's not a good feeling, but
it’s just the way it is.’
‘I would love to go and play football in Lerwick
but the car is never home.’
‘We have young people in Mossbank who find it almost impossible to access the town
for certain appointments without spending the whole
day in Lerwick and when on a very limited budget finding
something to do in Lerwick is very difficult.’
‘How could I get there? What would
the cost of that be?’
Access is a fundamental factor in relation to social exclusion and deprivation in Shetland: a lack of access to opportunities restricts development in most other areas of people’s lives. A section of the Shetland community is unable to take part in opportunities that the majority, with a private vehicle and sufficient funds, take for granted. To date, their isolation has meant their needs, including access, have never before been comprehensively captured.

44
Findings – More than Numbers
Community
‘I can get to where I need to go to when I have the money to pay for a taxi. If I don't have money I don't go to where I need to go. I have to limit the number of times I go out during the week. This adds to my feeling of
isolation.’
‘ Incomer children can still encounter hostility at primary
school (and occasionally
amongst adults as well). ’
‘I would like to volunteer and be part of community things, but can't give commitment.
People do speak and say they will come along but don't. I
think they may be embarrassed by disabled
child.’
‘As an incomer it can be
difficult to go to places.’
On the face of it, community life in Shetland enables people to feel included and part of society. However factors such as culture, race, age, disability and past history can influence the extent to which people feel included. For those born into Shetland communities there is generally a safety net of family and community networks should times become difficult. This safety net is less readily available to incomers. For others, circumstances can lead to extreme feelings of isolation and exclusion both from the community and community events.

45
Findings – More than Numbers
Learning
‘I don’t feel I would do my best because of my dyslexia and folk make me feel thick.’
‘I'd like to learn how to use a computer so I can see what all this fuss about the internet is! It would help me keep up with the rest of the family!’
Although learning is not a priority for those facing deprivation and / or social exclusion, it is very often the single most important factor in assisting people to improve opportunities and access to a better life.

46
Conclusions
More than numbers:
- Day to day existence for 7% + of the population is a challenge (2012 data)
- Looks and feels very different to urban poverty
- Dispersed
- Hiding circumstances – pressure and isolation
There are higher numbers of deprived individuals in the more remote areas of Shetland and spatial pockets of deprivation discernible within concentrations of local authority housing. Nevertheless, deprived individuals and households are fairly evenly distributed throughout Shetland. This indicates that factors beyond location are in operation.

47
POVERTY IS BAD ! LET’S FIX IT ! A youth-led participatory investigation into poverty, social
exclusion and inequality in Shetland
Final Report, 6th December 2011
Source: http://www.shetland.gov.uk/youth_services/documents/Shetland20Report0Final20Draft.pdf Shoormal: A Documentary by local youth film group, Maddrim Media, explores poverty, social exclusion and inequality in Shetland.

48
Minimum Income Standard for Remote and Rural Scotland
Minimum Income Standard for Remote and Rural Scotland: Full Report available from Highlands and islands Enterprise

49
• Research assessed how much it costs for people to live at a minimum acceptable standard in remote rural Scotland
• Used a well-established measure that allows comparisons with the rest of the UK
• Considered living costs in remote rural Scotland in the context of the fragility and sustainability of local communities and the ability of pensioners, working-age adults and families with children, on a range of incomes, to live satisfactory lives there
Minimum Income Standard (MIS)
The method is based on the minimum budget needed to have the opportunities and choices necessary to participate in society. It’s about “living” not “surviving” and about “needs” not “wants” The basic requirements are generally the same (food, clothing, shelter; household goods and services; social participation) but there are some key additional requirements and costs.

50
The budgets that households need to achieve a minimum acceptable living standard in remote rural Scotland are typically 10% to 40% higher than elsewhere in the UK.
Three principal sources of this premium are:
• Higher prices for food, clothes and household goods;
• Much higher household fuel bills, influenced by climate and fuel sources;
• The longer distances people have to routinely travel, particularly to work.
MIS – Key Findings
Costs - For households living in the most remote island locations (too far from towns to make
regular shopping trips) and those relying on heating oil in older homes, additional costs can be even greater than 40%.
- Higher prices: costs in local stores and small supermarkets, the cost of ordering and delivery charges, higher petrol prices.
- Fuel bills: types of fuel, climate and home type all contribute to higher household bills. - Travel: travel to work is a big additional cost, non-work travel is more variable and there
is an islanders’ trade-off between travel and greater isolation. - Childcare: also an issue especially in remote rural areas. Options can be limited and
accessing childcare provision where and when it is needed can be problematic, especially when travelling longer distances to work.
The influence of these three factors varies by household type e.g. for singles, the cost of a long commute is particularly high; for pensioners, the combination of higher fuel costs means having to buy many goods locally or by mail order.

51
Additional costs compared to urban UK households
MIS – additional costs
These premiums are most modest for pensioners and greatest for single people and families supporting children.

52
Income relative to MIS (single adult)
MIS – Key Findings
0
20
40
60
80
100
120
140
Income Support Minimum Wage Average earnings
English urban
Highland town
Remote island settlement
These additional costs make it much harder for people on modest incomes to make ends meet. For working-age people, living on benefits is even harder in remote rural Scotland than elsewhere in the UK (though pensioners on means-tested benefits can live at closer to the MIS level, though still below – this explains why they often soldier on, whereas working-age people may need to move away). A single person on income support has less than a third of what they require. It is important to note that on an average wage, it is possible to live adequately in remote rural Scotland, so getting jobs with decent pay is part of the battle.

53
• Many different sources of additional cost, affecting different groups differently
• Social and economic investments can affect these greatly
• Costs would be even higher without existing investments e.g. ferries, communications, housing
MIS - Conclusions
Social and economic investments: these include free personal care, universal delivery charges, RET. Anything that lowers cost, raises the standard of living.

54
Weekly Food Basket by Area Type(Single adult working-age)
English rural
town
A) Remote
Scottish
town
B)
Accessible
settlement
C)
Inaccessible
mainland
settlement
D) Less
accessible
island
settlement,
E) Remote
island
settlement
£36.91
£40.67 £40.98 £40.75£43.48
£57.44

55
Weekly Household Fuel Bill by Area and Tenure
(Single Adult Working Age)
English rural town
Mainland or Western Isles
town
Northern Isles town
Mainland or Western Isles
settlement
Northern Isles settlement
12.36
20.77
22.99
31.63
35.13
26.45
28.98
39.74
43.50
Social housing
Private renting

56
Shetland Specific Information
Examples of minimum weekly household budget requirement, excluding rent and childcare
UK urban Lerwick Most remote part of
Shetland
Single person £198 £264 £345
Couple with two
children £463 £597 £769
Pensioner couple £238 £300 £334
Shetland Specific Information
Northern Isles Town
Single Pensioner Couple Lone Parent
+1
Couple +2
MIS excluding
rent / CT and
additional petrol £224.25 £286.51 £319.83 £550.93
Income Support /
Pension Credit £463 £597 £769 £258.83
Benefit Income
as % of MIS 32% 77% 48% 47%

57
Young People in Shetland
Attitudes and Aspirations
Extracts from HIE Report (November 2015)
OUR NEXT GENERATION
This HIE report presents the findings of a study to explore the attitudes and aspirations of young people aged 15-30 in the Highlands and Islands, with a particular focus on young people in Shetland. The report is available at http://www.hie.co.uk/common/handlers/download-document.ashx?id=96be3ad1-b156-49b3-909c-0ae2fbd63b2e Overall, a total of 4,409 young people from within and outwith the H&I participated in the research. The HIE summary report analyses the views of 122 young people in Shetland who contributed. Where possible, analysis is also provided for young people living in Lerwick (the administrative centre), highlighting where their views differ from those living elsewhere in Shetland. Study Context The H&I have a deficit of young people, and there has traditionally been an outflow of young people from the region; this has also been the case with Shetland. There are a wide range of factors that impact on the choices and aspirations of young people, including educational and employment opportunities, the cost of living, transport, housing, cultural and connectivity issues. There are also strong local factors affecting decision-making, including close community ties for many young people in the region.

58
Perceptions of Stayers and Leavers
The young people questioned are very positive about Shetland and there are extremely high levels of pride in local communities. More young people describe themselves as committed stayers than the regional (H&I) average, and more wish to work and live locally. More than two thirds (67%) of young people in Shetland consider that those who stay in the local area following school have a strong commitment to the local community. This compares to 54% in the H&I. The same proportion also think that those who stay value the good quality of life in the H&I, and that they are lucky to be able to stay and earn a living or study locally. This is nine and five percentage points higher than corresponding H&I figures, and indicative of a stronger positive view of other young people who choose to stay in the local area after finishing school. These positive perceptions of others’ decisions to stay are even higher in areas outwith Lerwick. For instance, 71% consider stayers to be lucky to be able to do so, and 81% think that they value the good quality of life.

59
Aspirations of School Leavers
Across Shetland as a whole, the most popular destinations for post-school activity are locally (29%) and elsewhere in Scotland (23%). For the latter this is comparable with the regional average (22%), but more young people wish to stay locally than in the H&I (14%). Outwith Lerwick, the proportion of those wishing to stay locally rises significantly by 12 percentage points to 41%. Notably, in Shetland, males are much more likely to want to stay locally – 47% wish to do so, compared with just 7% of females, likely to be linked to the nature of employment opportunities in the male-dominated oil and gas and related sectors.

60
Views on HE Provision
Young people in Shetland consider there to be a good educational offering in the H&I (57% think so). There is particularly good feedback on the range of FE/college courses available (61%, higher than the 54% regionally), and 62% feel they are able to study locally, compared to 57% across the H&I. Further, some 63% think that the educational offer is well aligned to employment opportunities, a full ten percentage points higher than the H&I average of 53%. More also consider there to be courses of interest on offer (46% rather than 40% regionally). Cost is slightly more of an issue, however, with 59% considering studying in the H&I to be affordable, against 61% across the region. HE is viewed less favourably, with fewer young people agreeing that there is a good range of HE/university level opportunities (40%), lower than the 45% across the H&I). Whilst over a third (35%) disagree that there is a wide range of HE/University level opportunities, this rises to half (50%) for those in Lerwick, where half (50%) also disagree that what is on offer is interesting to them. Outwith Lerwick, the proportion disagreeing falls to 24% and 28% respectively. UHI is seen as a good place to be a mature student (80% of respondents think this is the case compared to 64% for the H&I), and this rises to 91% for those living outwith Lerwick. Fewer respondents see UHI as a good place to be an undergraduate student, and the proportion is slightly lower amongst those in Shetland (48%) than across the H&I as a whole (46%).

61
Views on Employment
Opportunities for apprenticeships are viewed more positively by young people in Shetland than elsewhere in the H&I. Some seven in ten (69%) regard the opportunities as quite (39%) or very good (30%), compared to 49% across the H&I. Opportunities are viewed most positively in Lerwick (82% stating they are quite or very good), and slightly less so outwith Lerwick (62%), although this is still 13 percentage points higher than the H&I overall. Nearly twice as many young people in Shetland view local employment opportunities as quite or very good (64%) than across the H&I overall (35%). This is especially true in Lerwick (70%), though it falls slightly for those living outwith (60%). Respondents tend to become more positive about local employment opportunities as they get older, with 70% of those aged 25-30 rating these positively, compared to 60% aged 19-24. Encouragingly, 64% of those aged 15-18 perceive there to be good local opportunities, which compares to 36% for this age group across the region. Male respondents are more positive than females, with 75% of males perceiving local employment opportunities as good, compared to 59% of females. None of the males responding viewed local employment opportunities as poor. Young people in Shetland are positive about pay levels, with 57% seeing these as quite or very good, twice the proportion across the H&I overall (27%). This is higher for those living outwith Lerwick (62%) than in Lerwick itself (54%), and may again be due to the oil and gas sector effect which is typically relatively better paid than average.

62
In all, just over 45% rate opportunities for personal development locally as quite or very good (compared with 37% for the H&I) and almost four in ten are positive about opportunities for local career progression (38%), compared with 29% overall. Optimism in relation to career progression opportunities reduces with age, with 43% of 15-18 year olds rating them as good, compared to 38% amongst 19-24 year olds and 30% of 25-30 year olds. Overall, only 5% regard local career progression opportunities as very good. Despite favourable ratings about the overall level of employment opportunities in the local area, young people in Shetland are far less positive about the diversity of local employment opportunities. Of all the employment-related factors, diversity of employment is viewed least positively, with just 28% describing this as quite or very good, in line with the regional average of 29%. Male respondents are again more positive than females, with 38% perceiving the diversity of employment opportunities as good (and 16% viewing these as poor), compared to 22% of females (with 36% describing these as poor).

63
Views on Housing
The lack of available and affordable housing is a significant issue for young people and one that has risen in importance since 2009, relative to other factors. Whilst market conditions mean that housing has likely become an issue for young people more generally, housing availability and affordability are clear concerns for those in the H&I. This is also true for young people in Shetland. In terms of housing in the region, the views of young people in Shetland reflect those across the H&I, although they are more pronounced. Just over 18% consider there to be an appropriate choice of housing to buy while 69% do not think so, compared to 26% and 57% across the H&I. Similarly, 17% think there is a good choice of appropriate rental housing in the H&I, although nearly three quarters (73%) disagree, compared to 29% and 53% regionally. The cost of living is a more serious issue for young people in Shetland compared with elsewhere in the region. Less than one in four (24%) believe costs are affordable, compared to 41% across the H&I. The cost of living is felt most acutely for those in Lerwick, where just one in seven (14%) believe living costs are affordable. For those living outwith Lerwick this is 33%. Just over a third (34%) of young people in Shetland agree that community land ownership makes building your own home a more realistic option – higher than across the H&I (28%). A slightly smaller proportion (29%) agree that there are sufficient opportunities to buy serviced sites for self-build, again above those from across the H&I (25%).

64
Views on Transport
Transport is a key issue for young people in Shetland, particularly amongst those from Lerwick. Ferry availability is rated as good by 71% and air travel availability by 63%. Air travel availability is rated slightly more highly by those from outside Lerwick, perhaps due to the main airport being located 20 miles south of Lerwick. Both modes, however, are deemed unaffordable by young Shetlanders, particularly air travel where seven in ten (70%) think it poor. This was higher in Lerwick than outwith Lerwick. More than half (55%) of young people rate ferry affordability as poor. The availability of bus travel within Shetland is rated as at least ‘quite good’ by four in ten (40%) young people, in line with the H&I as a whole. Bus travel affordability is highly rated, with nearly two thirds (65%) rating it well, far higher than the average for the region (34%).

65
Views on Digital Connectivity
In all, 98% of young people in Shetland had access to broadband internet (standard broadband or NGA broadband), in line with the H&I average of 96%, although the vast majority of this is standard broadband. Just 3% currently have access to NGA broadband at the time of the survey (April 2015), compared to 14% across the H&I, although this is set to change significantly in the next 12-18 months with the roll out of NGA. Broadband reliability in Shetland rates more favourably than elsewhere in the H&I, with around half of young people rating it positively (compared to the regional average of 43%), and just 16% rating it negatively. This may in part be due to the presence of Shetland Telecom on the Islands that has provided a certain amount of broadband infrastructure. Broadband speeds, however, are rated positively by just a third (32%), below the regional average of 38% (and only young people from the Outer Hebrides and Orkney are more negative). The first two of the three key benefits of NGA broadband reported by young people in Shetland were the same as for those across the H&I, namely: 1) better music, film and entertainment streaming 2) improved communication with family and friends. The third most important benefit in Shetland is better access to education and learning materials compared with better access to social media across the region.

66
Views on Mobile Connectivity
Mobile connectivity in Shetland is not rated as highly as broadband connectivity and fewer young people perceive mobile connectivity to be good compared to the H&I average. One third (33%) of young people rate mobile reliability positively (compared to 35% across H&I) and just 22% rate mobile coverage positively, compared to 29% regionally. Mobile reliability is rated more poorly by those living outwith Lerwick. Most notably, some two thirds (67%) of young people rate access to 3G/4G as ‘very poor’, significantly higher than the regional average of 49%, and poorest of all H&I areas bar Orkney (87%).

67
Views on Leisure
The top three most available offers in Shetland are gym/ leisure centres (rated as quite good or very good by 81% of young people), sports facilities and clubs (82%) and cinemas (80%), all in excess of the regional averages. Access to live music venues (74%), museums, galleries and exhibitions (65%), outdoor attractions and pursuits (60%), social venues and clubs (55%) and theatres (50%) also rate well, and above the regional average. On the whole, there is little variation on the perception of the availability of cultural offerings between those from Lerwick and those living outwith Lerwick, suggesting that those from the more remote parts of Shetland still find most leisure and cultural offerings to be accessible to them. The greatest degree of mismatch between importance of and availability of cultural offering extended to access to social venues and clubs, where 81% rated this as important, and 55% considered it available to them. Over eight in ten (84%) deemed good access to live music venues to be important, while less than three quarters (74%) rated this as available. On the whole, access to various cultural offers was more important to those from Lerwick than those living elsewhere in Shetland.

68
Views on Community
Young people are strongly engaged with their community in Shetland, more so than in the H&I overall. Almost six in ten (59%) attend community events (45% for H&I as a whole), while around four in ten (39%) are members of local youth groups or clubs (32% for the H&I) and a similar proportion (38%) undertake volunteer work for the community (31% for the H&I). Just one fifth (20%) do not participate in the community in any of these ways, lower than for the H&I as a whole (29%). Against a number of indicators on local community, Shetland is perceived more positively by its young people than is the case for many other parts of the H&I. This includes being a place that is building upon its strengths (81% agree, compared to 63% for the H&I), being a good place to live as a young person (nearly three quarters agree, compared to 59% for the H&I), and being a place where young people’s needs are being met (some six in ten agree, compared to 41% for the H&I). Those living outwith Lerwick perceive their local community slightly more positively than those from Lerwick.

69
Making H&I an Attractive Place to Live In
While high quality jobs and career progression opportunities are still important, housing and the cost of living are greater concerns, ranked as 1 and 2, and rated as very important by 81% and 72% in making the region attractive to young people. These are clearly significant issues in Shetland. For cost of living, little difference is evident across Shetland, whereas access to housing is even more important to those from Lerwick. Affordable transport is an important issue for virtually all young people in Shetland, particularly for those outwith Lerwick. Having good access to education (FE or HE) is very important to almost two thirds of respondents as is the availability of high quality jobs. Despite limitations for career progression evident in preceding Chapters of the report, having opportunities for career progression ranks slightly lower in Shetland than the H&I as a whole (although still the 6th most important issue), but is still considered very important by 61%.

70
Making H&I an Attractive Place to Live In
All of the 15 themes explored in the survey were reported as important for at least 89% of young people in Shetland, and very important for at least 38%, with the exception of a supportive environment for Gaelic.

71
In the Future…
Of all the areas within the H&I, Shetland has the largest proportion of young people aspiring to stay in their local area. Despite this, Shetland has the lowest proportion (41%) of young people believing the H&I to be a better place to live now than it was five years ago (the H&I average is 51%). Over half (51%) were unsure. Those from Lerwick are more optimistic about the future than those living outwith Lerwick.

72
Concluding Remarks from HIE Report
Young people in Shetland are very positive about the place and there are extremely high levels of pride in local communities. More young people describe themselves as committed stayers than the regional average, and more wish to work and live locally. There are good employment opportunities locally, with opportunities to progress greater than the regional average, and fewer young people think that leaving constrains ambition. There are particularly good apprenticeship opportunities, FE is viewed positively and there are good prospects for remote learning away from Lerwick. Yet this positive feedback belies a number of issues for young Shetlanders. The cost of living is a significant factor, including the cost and availability of housing, and the cost of travel to/from the islands. Mobile connectivity is poor and a major concern for young people. The perception is also of a narrow employment base with limited diversity of employment, and those wishing to stay to work must do so in existing key sectors. Awareness of the Financial and Business Services and Life Sciences growth sectors is limited, although awareness of Creative industries and Energy is higher in Shetland than across the H&I. There is a need to continue to broaden and diversify the employment base and to further reduce barriers to living, learning and working in Shetland, including the costs of doing so.