Embed Size (px)
Citation preview

" -■\ ^
AD_
Award Number: DAMD17-02-1-0716
TITLE: Portable Physical Activity Monitors for Measuring Energy Metabolism in ROTC Cadets
PRINCIPAL INVESTIGATOR: Kong Y. Chen, Ph.D.
CONTRACTING ORGANIZATION: VanderbiIt University Medical Center Nashville, Tennessee 37232-2103
REPORT DATE: September 2003
TYPE OF REPORT: Annual
PREPARED FOR: U.S. Army Medical Research and Materiel Command Fort Detrick, Maryland 21702-5012
DISTRIBUTION STATEMENT: Approved for Public Release; Distribution Unlimited
The views, opinions and/or findings contained in this report are those of the author(s) and should not be construed as an official Department of the Army position, policy or decision \inless so designated by other documentation.
20031216 125
__.
■v_

REPORT DOCUMENTATION PAGE Form Approved
0MB No. 074-0188 Public repocttng burden fbr this collection of infbmetion is esb'nnted to average 1 hour per response, induding the time f^ the data needed, and completing and reviewing this collection or infbnnation. Send comments regarding this burden estimate or any other aspect of this collection of infbmetion, Including suggeslicns for reducing this burden to Washington H^Klquarters Services, Directorate fbr Information Operations and Reports, 121S Jefferson Davis Highv«ay, Suite 1204, Arlington. VA 22202-4302, and to the CMce of Management and Budget Papenmorit Reduction Project (0704^)188), Washington, DC 20503
1. AGENCY USE ONLY (Leave blankj
2. REPORT DATE September 2003
3. REPORT TYPE AND DATES COVERED Annual (1 Oct 2002 - 30 Sep 2003)
4. TITLE AND SUBTITLE Portable Physical Activity Monitors for Measuring Energy Metabolism in ROTC Cadets
6. AUTHORtS) Kong y. Chen, Ph.D.
5. FUNDING NUMBERS DAMD17-02-1-0716
7. PERFORMING ORGANIZATIONNAME(S) AND ADDRESSfES) Vanderbilt University Medical Center Nashville, Tennessee 37232-2103
E-MaB: kong. chen@vanderbilt. edu
8. PERFORMING ORGANIZATION REPORT NUMBER
9. SPONSORING/MONrrORING AGENCY NAMEfSI AND ADDRESSfES)
U.S. Arniy Medical Research and Materiel Command Fort Detrick, Maryland 21702-5012
to. SPONSORING / MONTTORING AGENCY REPORT NUMBER
11. SUPPLEMENTARY NOTES
12a. IMSTRIBUTION/AVAILABILITY STATEMENT Approved for Public Release; Distribution Unlimited
726. DISTRIBUTION CODE
13. ABSTRACT (Maximum 200 Words)
The announcement of the Research Program in Technologies for Metabolic Monitoring (DAMD17- BAA-TMM02) called for »new, novel and unconventional approaches to the field of metabolic monitoring.' Given the significance of physical activity and energy expenditure (EE) to health for both military and civilian populations, we proposed a feasibility study to achieve the following goals: 1) to develop and validate non-invasive portable techniques in monitoring detailed physical activity and accurately predict EE, and 2) to determine specific physical training related energy costs and physiological responses in ROTC cadets. The specific tasks are: 1) To measuring physical activity and EE xmder laboratory conditions. 2) To develop accurate EE prediction models. 3) To measure energy demands during field training in ROTC cadets. 4) To perform nutritional and fitness assessments. We have designed a two-stage data collection periods, expanding one academic year (Fall- Spring) . Despite several delays, we initiated the studies in September 2003. Up-to-date, we have collected 58, 83, and 100% data for tasks 1,3 and 4, respectively, for the 1*' stage assessments. We will complete this stage at the end of November 2003 and the data processing for task 2 will be perfoinned. Phase 2 of the study is being planned.
74. SUBJECT TERMS No Subject Terms Provided.
75. NUMBER OF PAGES 38
16. PRICE CODE
17. SECURTTY CLASSIFICATION OF REPORT
Unclassified
18. SECURITY CLASSIFICATION OF THIS PAGE
Unclassified
19. SECURITY CLASSIFICATION OF ABSTRACT
Unclassified
20. UMITAVON OF ABSTRACT
Unlimited NSN 7540-01-280-5500 Standard Fonn 298 (Rev. 2-89)
PratcribMl by ANSI Std. Z39.18 298-102
Table of Contents
COVER 1
SF298 2
Table of Contents 3
Introduction ■ 4
BODY 4
Key Research Accomplishments 6
Reportable Outcomes 6
Conclusions 6
References 6
Appendices 7

INTRODUCTION »
This proposed study was in response to the specific call from the US Army Medical Research and Materiel Command (MRMC) for Technology of Metabolic Monitoring program (DAMD-BAA-TMM02), in which research projects were solicited to "identify and assess technologies that can improve our ability to collect and interpret metabolic data ... and to use that data to extend our understanding of human metabolism in healthy, diseased, and stressed states". The predominant contributor to a person's energy metabolism is physical activity. However, current knowledge in physical activity and its contribution to the health and diseases of humans is limited. This is mostly due to limited technology in accurate and detail measurements of the highly variable nature of human physical activity and its related energy expenditure (EE). Our research expertise and environment position us in an inimitable position for developing and vaUdating portable devices for EE measurement in humans. In this study, we propose to develop a novel and non-invasive approach to accurately determining the detailed metabohc demands in ROTC cadets during physical training (PT). This study will establish close collaborations between clinical researchers and biomedical engineers in advancing the technologies of portable metabolic monitoring, which are essential in determining the inner relationships between energy balance and health for military personnel (Fridel et. al, 1997) as well as the general pubHc. Working in close collaboration with the Vanderbilt University Army ROTC program, we will further investigate the physiological demands during PT, while setting long-term goals to optimize soldiers' health, fitness, and conditionings.
BODY
The approved specific tasks for this project are: 1) ascertain simultaneous physical movement data from a new activity/posture monitor and EE data from our room calorimeter; 2) establish accurate models of prediction EE from the body motion parameters; 3) validate the accuracy and reproducibility of the models with gold-standard techniques under field conditions; and 4) assess nutritional, fitness, and other physiological measures prospectively. We are approved to study 12 Vanderbih ROTC cadets. The approved schedule is as the following:
Protocol Calendar
09-2003 10 11 12 01-2004 02 03 04 05 r T T \\
08-2004 n
Academic Calendar Fall 2003 Winter Spring 2004
: Summer Data process
Week 1 (baseline)
Doubly-labeled water total energy expenditure
Field tests during regular PT Task 3. PT periods (AM or PM): IDEEA, SenseWear, Heart rate, & KAb^ Task 4. Body composition, V02max, & Ibod intake.
-L DayO
Hour 07:00 13:00 19:00 01:00 07:00
Figure 1. Approved study design and timeline.

Accomplishments to date:
Pre-testing: we have successfully recruited 12 cadets (10 males and 2 females; 8 Caucasians, 2 African- American, 1 Asian, and 1 other). The general characteristics are:
Mean ± SD Range
Body mass (kg) 79.2 ±13.8 60.3-100.0
Height (cm) 176.4 ±8.23 158.0-188.0 Age(yrs) 19.8 ±1.0 18-21
BMI (kg • m-^) 25.3 ±3.4 20.2-30.2
We received the Surgeon General's Army Human Subjects Research Review Board (HSRRB) approval in July 10*, 2003.
Task 1: For week 1 (1*' of the two phases), we have collected seven 24-hour period data, with all five others schedule to complete by November 23''^, 2003. There were no adverse events during these testings.
Task 2: We will proceed with data processing as soon as we finished the five collections from Task 1. This is to minimize processing bias and errors while improving efficiency.
Task 3: We have attempted field data acquisition in 11 of the 12 recruited cadets, complete data was collected in eight of the 11 trials. We are currently pre-processing such data.
Task 4: We have measured body composition in 11/12 cadets, and in all 12 for fitness levels (V02max) and food intake. The results of the body composition and fitness levels are as follow:
Mean ± SD Range
Body Composition (%fat) 17.5 ± 7.2 7.1 - 31.2
V02max (ml 02 /kg • min) 53.8 ± 8.0 43.0-69.5
Problems encountered:
Pre-testing:
Delay of testing cycle: due to the actual fimding did not start until October 2002, our original proposed testing cycle (with academic year) had to be change to 1 year later. This was approved.
Acquiring doubly-labeled water (DLW): although we started the process of finding suppliers immediately after we received grant approval, we were only able to get enough isotopes for 12 cadets in October 2003. We then change the original design of validation from using the DLW for both Phases to only the final Phase, and received approval.
Task 3: Since our test instruments are not waterproof, several of all field trials were proponed due to weather.
Our original proposal of field trials was designed to be conducted in the afternoon PT sessions. However, starting the Fall 2003 semester, all Vanderbilt Army ROTC PT has been changed to 0600 AM. Since it takes about 20 minutes to equip a test subject with all the test instruments, the demands on testing cadets to be in the field about 1 hour earlier (3-4 trials conducted simultaneously, as approved) has been somewhat challenging. We have also encountered some incomplete collections (3 from the K4b^, 1 from the IDEEA, and 4 from the

heart rate monitors) during these field trials, of which some were due to operational errors in the darkness, and others were due to equipment failure. We are researching potential improvements to decrease errors in our future field trials for Phase 2.
Key Research Accomplishments
Technical improvements in physical activity monitoring devices. Development of advanced analytical modeling techniques.
Reportable Outcomes
1. During the last funding period, the PI was invited to present in the Metabolic Monitoring Technologies for Military Field Applications. Committee on Military Nutrition Research Food and Nutrition Board. Listitute of Medicine, the National Academies, Jan 8-9,2003. (With an invited manuscript to the lOM report, please see Appendix I).
2. The PI also submitted a manuscript (using previously collected data) to the Diabetes Technology & Therapy in March 2003, which will be pubhshed in the December 2003 issue in the Military MetaboUc Monitoring Section (please see Appendix II).
Conclusions
• This study should initiate the crucial steps towards fundamental changes in the development of field techniques to accurately measure detailed physical activity and EEACT-
• The results of this research should also lead to larger studies to better evaluate the physical and physiological demands involved in physical trainings in military personnel.
• The apphcations of these devices in the field need further modifications.
Reference
1. Friedl KE, Hoyt RW. (1997) Development and biomedical testing of military operation rations. Annu Rev Nutr. 17:51-75.

TITLE
The use of portable accelerometers in predicting activity energy expenditure
Kong Y. Clien
For
Metabolic Monitoring Teclinologies for Military Field Applications
Committee on Military Nutrition Research
Food and Nutrition Board, Institute of Medicine, The National Academies.
Contact:
Kong Y. Chen, Ph.D.
C2104 Medical Center North
1161 Garland Ave.
Vanderbilt University
Nashville, IN 37232-2279
email: [email protected]
phone: (615) 322-5536
fax:(615)343-6229

INTRODUCTION
"A soldier's level of physical fitness has a direct impact on his combat readiness" (US
Army, 1998). The balance of energy intake (El) and energy expenditure (EE) can significantly
affect soldiers' physical fitness, conditioning, and overall health. The predonunant contributor to
the variations of EE is physical activity. Unlike most civiUan populations, soldiers often are
subjected to extreme negative energy balance (EE far exceeds El) (Fridel et. al, 1997). In order
to achieve optimum energy balance, accurate and detailed measurements of both El and EE are
crucial. However, our current techniques in assessing physical activity are limited, such that
possible associations between physical activity and the related EE (EEACT) with respect to the
health and performance in military personnel have not been well determined.
Daily EE can be categorized into three major components: basal or resting EE (also
called basal metabolic rate, or BMR), thermic effect of food (or food-mduced thermogenesis),
and EEACT- Resting EE is the rate of EE measured in postabsorptive, well rested, and
thermoneutral conditions. In sedentary subjects, resting EE is the major component of EE (Flatt
1978). Inter-individual variations in resting EE of normal humans can be explained by
differences in fat-free mass (the primary contributor), age, sex, familial traits, and fat mass
(Ravussin et. al, 1986,1987). Thermic effect of food represents the increase in EE foUowmg
meal ingestion for absorbing, processing, and storing the nutrients. There are two recognized
subcomponents, obligatory and facultative thermogenesis, which combine to represent a small
component to total EE (<8-10%) (Jequier et. al,1988 and Wells et. al, 1981). EEACT is the largest
variability to total EE in humans. Moderate walking can increase EE by 3 times, while a more
vigorous activity such as running can elevate EE by 10 times. Compared to civilians who
generally have more sedentary lifestyles, EEACT is particularly important in soldiers' nutritional

and physiological state, affecting performance and overall health (DeLany et. al, 1989 and
Burstein et. al, 1996).
MATERIAL AND METHODS
Measuring energy expenditure
Doubly Labeled Water (DLW) is considered as the "gold standard" for measuring EE in
the field or fi-ee-living conditions. It determines the net disappearance of hydrogen (in water) and
oxygen (in water and carbon dioxide) by labeling them with stable isotopes ^Ha'^O (Schoeller, et.
al, 1982, 1996). The major advantage of the DLW is its non-invasiveness and non-intrusiveness.
It has been used to assess EE of soldiers in the field and the impact of different rations (DeLany
1989), climates (Burstein 1996), and other training conditions (Forbes-Ewan et. al, 1989).
However, the main limitation of DLW is that it measures total EE during a period of 7-14 days,
without being able to detect the type, duration, and intensity of physical activity, or to trace
variations in physical activity and related EE within certain periods. Furthermore, the high cost
and relative limited availability of '*0 make this method difficult to apply.
Indirect calorimetry is the "gold standard" method of measuring resting EE, thermic
effect of food, and EEACT under controlled or laboratory enviroiunents. It uses a facemask, a
ventilated hood, or a respiratory chamber (Sim et. al, 1994), to measure oxygen consumption and
carbon dioxide production non-invasively. Major advantages of indirect calorimetry are the
immediate and detailed measurements of the rates of EE and nutrient oxidation. The major
disadvantage is the limited application under fi-ee-living conditions.
Methods of assessing physical activity
Studying the relationship between physical activity and health is complicated by the
variable nature of physical activity. A particularly challenging area has been the development

and application of accurate, valid, and cost-effective techniques to quantify physical activity
under field conditions (Wilson et. al, 1986, Paffenbarger et. al, 1993, and Washbum et. al. 1986).
Numerous methods have been utilized to measure EE during physical activities. They vary
greatly in their usefulness in different study populations and designs (Shultz et. al, 2001). They
can generally be categorized as subjective and objective methods.
Subjective methods include the use of direct observations, physical activity records, and
survey and recall questionnaires. These techniques are used for various time periods and settings.
Although inexpensive and easy to implement, their accuracies are severely limited by the
recording, recall, interviewer, and other biases. Results from most subjective physical activity
monitoring methods are also difficult to quantify and to compare inter-individually. Predictions
of EEACT using these methods could be further flawed by interpretation and translation errors.
Objective metliods for current measurements of physical activity mainly consist of
mechanical/electronic devices. Since walking and running are the most common types of
physical activities, step counters are often used estimate overall activity levels. Several types of
step counters exist, including pedometers using a mechanical movement counter (Bassey et. al,
1987 and Washbum et. al, 1980), mercury switches (Cauley et. al, 1987), and electronic load
transducers and foot contact monitors inserted into the heels of shoes sensing loads held, lifted,
or carried, and walking activity (Barber et. al, 1973, Dion et. al, 1982, Hoyt et. al, 1994, and
Weyand et. al, 2001). These are generally simple, small, and relatively inexpensive devices that
are based on the principle that EEACT is correlated with individual step fi-equency and foot
contact times (Kram et. al, 1990). The main limitation is that the sensitivity and accuracy of step
counting may vary significantly among activity types inter- and inti-a-individually. Furthermore,
stride lengths, a crucial element of the velocity and distance traveled, are usually estimated.

Researchers have recently focused on an array of new activity monitors based on
accelerometers, which directly measure body movements in terms of acceleration. The most
currently used accelerometers are piezoelectric sensors that detect accelerations in one (typically
vertical direction) or in three orthogonal planes (anterior-posterior, lateral, and vertical). Results
can be recorded in a microcomputer. Most current marketed monitors are usually placed on the
hip or waist (for its closeness to the center of body mass), although ankle or wrist monitors are
also used. Caltrac, Tritrac-R3D (both by Hemokinetics, Madison WI), RT3 (Stayhealthy,
Monrovia CA), Computer Science and Application (CSA, Shalimar FL), Tracmor (Maastricht,
The Netherlands), and ActiWatch (Minimitter, Sunriver OR) are just a few examples of
marketed systems. In several validation studies using these monitors, correlation values ranged
from 0.65 to 0.92 between EE measured by indirect calorimetry and accelerometer readings
during various activities (Bray et. al, 1994, Bouten et. al, 1994, Chen, et. al, 1997, and Freedson
et. al, 1998), where level walking showed the highest correlation with the waist worn triaxial
accelerometers. The advantages of the accelerometry devices include their small size and most
are wireless, non-invasiveness, and minimally intrusive to normal subject movements during
daily activities. Additionally, they are easy to use for subjects and testers, detectable relative
mtensity, frequency, and duration, and the ability for extended measuring periods (minute-by-
minute data for up to 28 days), thus making free-living monitoring more feasible. The major
limitations include their inability to detect activity types for which the associations between
measured acceleration and EEACT are dependent upon, single site monitoring that is unable to
detect movements from other body segments, limited prediction algorithms to estimate EEACT
across a wide range (Chen 1997), and inability to differentiate EE due to postural changes and
other low intensity physical activities. To compensate for these errors, a combination of using

accelerometry devices and inclmometer(s) or mercury switches was used to detect posture and
motions were reported (Levine et. al, 2001 and Walker et. al, 1997). Recently, several research
labs have reported the feasibility of using accelerometer arrays that were positioned at different
body segments, mainly the chest and thighs, to monitor the types of activities by postural
identifications (Fahrenberg et. al, 1997, Foerster et. al, 2000, Bussman et. al, 2001, Zhang et. al,
2003). However, EEACT predictions from these monitors have yet to be careftiUy validated.
Works from the Vanderbilt Energy Balance Lab
Equipped with the state-of-the-art whole-room indirect calorimeter at Vanderbilt, we are
in a unique environment to develop and validate methods of EEACT predictions using portable
activity monitors. The room calorimeter is a small, airtight environmental room (2.6x3.3x2.3 m^,
19,500 liters in net volume), equipped with a desk, chair, outside window, toilet, sink, telephone,
TVAi^CR, audio system/alarm clock, and fold-down mattress to simulate free-living conditions
(Figure 1). Oxygen consumption and carbon dioxide production are calculated by measuring the
changes of oxygen and carbon dioxide content of the air inside the calorimeter and by the flow
rate of the purged air times its concentration of gases. A special multi-channel air sampling
system was designed to ensure an even sampling of the gas expired by the subject. Temperature,
baromefric pressure, and humidity of the room are precisely controlled and monitored. With
these measures, the minute-by-minute EE is calculated with the highest precision reported (>90%
with each minute and >99% over 24 hours) (Sun 1994).
RESULTS
In a previous study (Chen 1997), we used a hip-worn triaxial accelerometer monitor, the
Tritrac-R3D Research Ergometer (Hemokinetics, Inc. Madison WI), to detect body motion
during physical activities. A heterogeneous group of healthy adult volunteers (85 women and 40
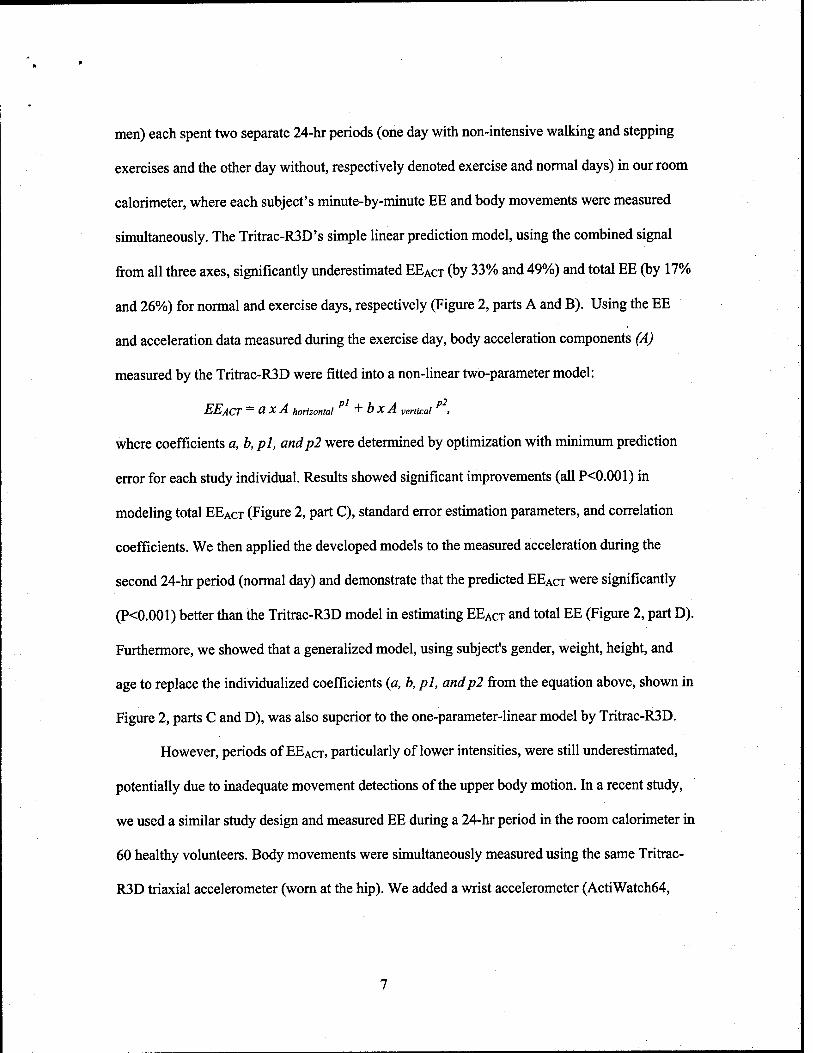
men) each spent two separate 24-hr periods (one day with non-intensive walking and stepping
exercises and the other day without, respectively denoted exercise and normal days) in our room
calorimeter, where each subject's minute-by-minute EE and body movements were measured
sunultaneously. The Tritrac-R3D's simple linear prediction model, using the combined signal
from all three axes, significantly underestimated EEACT (by 33% and 49%) and total EE (by 17%
and 26%) for normal and exercise days, respectively (Figure 2, parts A and B). Using the EE
and acceleration data measured during the exercise day, body acceleration components (A)
measured by the Tritrac-R3D were fitted into a non-linear two-parameter model:
EEACT — O X A horizontal + b X A vertical ,
where coefficients a, b, pi, andp2 were determined by optimization with mmimimi prediction
error for each study individual. Resuhs showed significant improvements (all P<0.001) in
modeling total EEACT (Figure 2, part C), standard error estimation parameters, and correlation
coefficients. We then applied the developed models to the measured acceleration during the
second 24-hr period (normal day) and demonstrate that the predicted EEACT were significantly
(P<0.001) better than the Tritrac-R3D model in estimating EEACT and total EE (Figure 2, part D).
Furthermore, we showed that a generalized model, using subject's gender, weight, height, and
age to replace the individualized coefficients (a, b, pi, andp2 from the equation above, shown in
Figure 2, parts C and D), was also superior to the one-parameter-linear model by Tritrac-R3D.
However, periods of EEACT, particularly of lower intensities, were still underestimated,
potentially due to inadequate movement detections of the upper body motion. In a recent study,
we used a similar study design and measured EE during a 24-hr period in the room calorimeter in
60 healthy volunteers. Body movements were simultaneously measured using the same Trifrac-
R3D triaxial accelerometer (worn at the hip). We added a wrist accelerometer (ActiWatch64,

Minimitter, Sunriver OR) on the dominant arm for upper body movement measurements. The
non-Unear power-fitting model was then expanded to include the arm accelerations:
EEACT — O X A hip, horizontal "^ O X A hip, vertical "T C X A arm >
We found the Tritrac-R3D and the ActiWatch combined model accurately estimated EEACT in all
intensity categories compared to measured EEACT by the calorimeter (Figure 3). The particular
improvements were in the measurement of lower intensity physical activities, in which sedentary
individuals tend to spend most of their time. A second 24-hour study was repeated in a subgroup
of 12 volunteers and showed accurate EEACT prediction compare to measured values (Figure 4).
DISCUSSION AND CONCLUSIONS
In view of the number of current field techniques for measuring detailed physical activity,
accelerometers have been shown to be valid and usefial. However, the applications of portable
monitors to accurately predict energy demands in military personnel during training and field
operations are unique. Compared to the more sedentary civilian populations for whom the most
current activity monitors are designed, soldiers participate in routine training regiments that are
often subject to increased physical demands. Marching and running with significant added loads
(>10kg), crawling, jumping, climbing, and many other lifting or pulling activities are just a few
of the activity types that will present challenges to existing technologies. Furthermore, many
trainings and operations are conducted in extreme external environmental conditions, such as hot
or cold climates (Burstein 1996), dry desert or humid jungles (Forbes-Ewan 1989), and high
altitude (Hoyt et. al, 1994), while the internal stress from the imbalance of high total energy
demands vs. low energy intake, sleep deprivation, fatigue, and psychological stress (Nindl et. al,
2002 and Troumbley et. al, 1990) may further exacerbate the complexity of the physical activity
and EEACT estimations. Thus, we need to develop and optimize more specific portable methods

for the measurements of the various activity types, intensities, durations, and frequencies, and
extend to the associated energy demands in military personnel during sustained field operations.
Two general areas of improvement are: sensor technologies and model development.
Current marketed accelerometry activity monitors primarily use the piezoresistive
sensors, either stand-alone or build in the surface-mounted and integrated chips. Although mostly
unpublished, the ranges of acceleration are generally 0.05-1.0 g, with resolution of 0.02 or worse,
and sampling rates of 32 Hz or lower. Although this may be sufficient for monitoring majority of
the physical movements of the center of mass (e.g., for the hip-worn units), movements of upper
extremities can have higher frequency components and may exceed the maximum range in short
bursts. These limitations would introduce inaccuracies in measurements. Most current activity
monitors only use the dynamic component (or the AC component) of the raw signals from the
sensors, partially due to the fact that the baseline (or the static or DC component) of piezoelectric
sensors drifts with temperature and directional changes. However, if the sensor(s) are positioned
at proper locations, such as the chest, it may be useftil to access such baseline change with
respect to sensor direction for assessing body postures, which may indicate the type of the
activities. The dynamic signal from the sensor is generally filtered (corrected for baseline drifts),
digitized, fiiU-wave rectified (turn the negative values to positive), and integrated to 15-second
epoch or longer to yield the output of activity coxmts. Although most of the current accelerometry
monitors are packaged for easy operations for field researchers, almost all current marketed
monitors do not allow user to change key parameters such as sampling rate or to collect raw
signals, which are crucial to improve signal ranges and enables model improvements.
Since current available monitors have lunited ability to detect wide ranges of physical
activity types and intensities, the modeling of the acceleration output to predict EEACT is an area
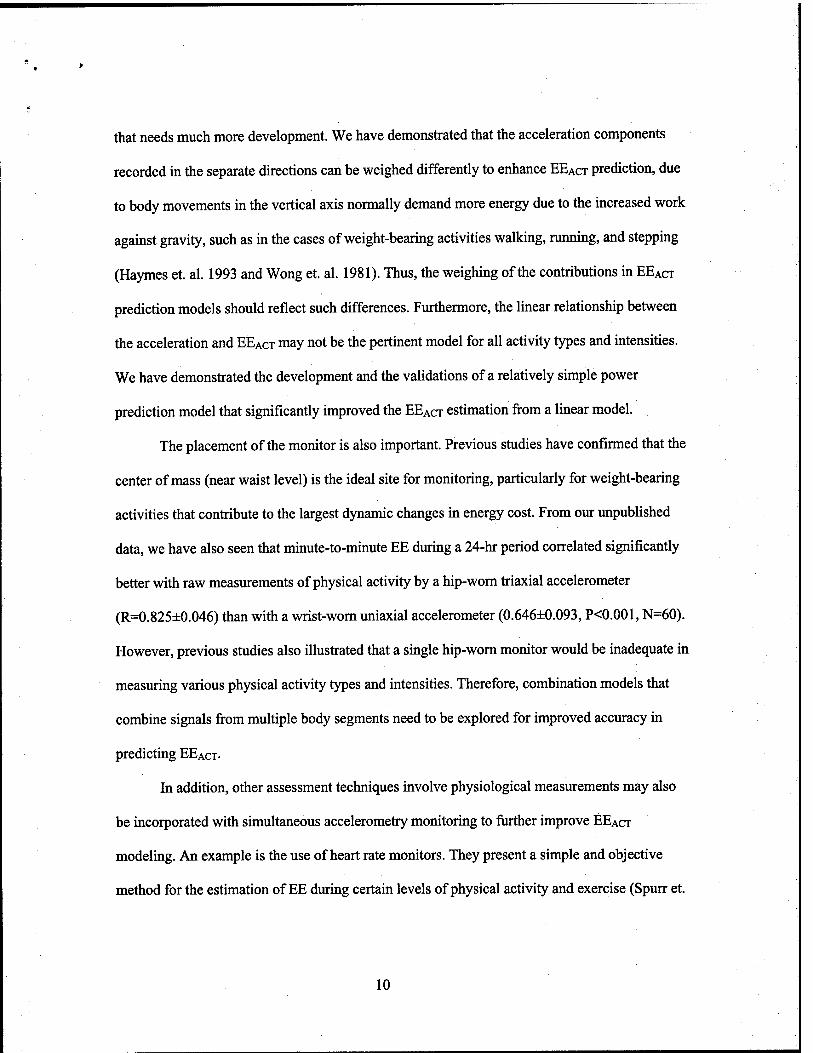
that needs much more development. We have demonstrated that the acceleration components
recorded in the separate directions can be weighed differently to enhance EEACT prediction, due
to body movements in the vertical axis normally demand more energy due to the increased work
against gravity, such as in the cases of weight-bearing activities walking, running, and steppmg
(Haymes et. al. 1993 and Wong et. al. 1981). Thus, the weighing of the contributions in EEACT
prediction models should reflect such differences. Furthermore, the linear relationship between
the acceleration and EEACT may not be the pertinent model for all activity types and intensities.
We have demonstrated the development and the validations of a relatively simple power
prediction model that significantly improved the EEACT estimation from a linear model.
The placement of the monitor is also important. Previous studies have confirmed that the
center of mass (near waist level) is the ideal site for monitoring, particularly for weight-bearing
activities that contribute to the largest dynamic changes in energy cost. From our unpublished
data, we have also seen that minute-to-minute EE during a 24-hr period correlated significantly
better with raw measurements of physical activity by a hip-worn triaxial accelerometer
(R=0.825±0.046) than with a wrist-worn uniaxial accelerometer (0.646±0.093, P<0.001, N=60).
However, previous studies also illustrated that a single hip-worn monitor would be inadequate in
measuring various physical activity types and intensities. Therefore, combination models that
combine signals from multiple body segments need to be explored for improved accuracy in
predicting EEACT-
In addition, other assessment techniques involve physiological measurements may also
be incorporated with simultaneous accelerometry monitoring to fiirther improve EEACT
modeling. An example is the use of heart rate monitors. They present a simple and objective
method for the estimation of EE during certain levels of physical activity and exercise (Spurr et.
10

al, 1986). Moreover, heart rate monitoring may facilitate the measurements on fatigue, state of
hydration, body temperature changes, and emotional state (stress) that could affect the energy
metabolism (Yoshida et. al, 1994 and Nielsen et. al, 1993). Other physiological parameters, such
as core body temperature (Gass et. al, 1998 and van Marken et. al, 2001), galvanic skin
conductance (estimating heat loss through sweatmg), and surface electromyography (measures of
muscular activity), may also be explored to optimize the prediction of EEACT-
In summary, to enhance our abilities to assess the energy demands in soldiers in the field,
future research in technologies should focus on small and wireless sensors that can be positioned
non-invasively and non-intrusively to measiu-e body movements as well as physiological
responses. Accelerometers are suitable for many aspects of the physical activity monitoring;
however, much can be improved to increase their sensitivity and further reduce their size. The
complex nature of the human physical activity patterns, large inter- and intra-individual
differences in energetic efficiencies, and inherent limitations of the sensors, dictates that the
development of models to accurately predict EEACT should integrate more unique features of the
signals from the sensors. This requires that we collect the raw signals from sensors. Moreover,
advanced pattern recognition and automated classification modeling techniques, such as artificial
neural networks that can incorporate multiple input parameters and output feedbacks for non-
linear and adaptive modeling, need to be explored. The ideal development processes of such
portable activity monitors should include the use of a respiratory chamber for sensor and model
explorations under laboratory conditions, portable indirect calorimeter imits for short-term field
evaluations, and DLW for overall validations. Furthermore, we should optimize such monitoring
systems to the specific appUcations through modeling, such as weather conditions and external
loads, while broadening the general applications to civilian medical research.
11

REFERENCES
1. Barber C, Evans D, Fentem PH, Wilson MA. (1973) A simple load transducer suitable for
long-term recording of activity patterns in human subjects. J Physiol (Land). 231:94-95.
2. Bassey EJ, Dallosso HM, Fentem PH, Irving JM, Patrick JM. (1987) Validation of a simple
estimation of walking activity. Eur J Appl Physiol. 56:323-330.
3. Bouten CV, Westerterp KR, Verduin M, Janssen JD. (1994) Assessment of energy
expenditure for physical activity using a triaxial accelerometer. Med Sci Sports Exerc.
12:1516-1523.
4. Bray MS, Wong WW, Morrow JR, Butte NF, Pivamik JM. (1994) Caltrac versus
calorimeter determination of 24-hour energy expenditure in female children and
adolescents. Med Sci Sports Exerc. 26:1524-1530.
5. Burstein R, Moran D, Coward AW et al. (1996) Energy expenditure variations in soldiers
performing military activities under cold and hot climate conditions. Mil Med. 161(12):
750-754.
6. Bussman JBJ, Martens WLJ, Tulen JHM, et al. (2001) Measuring daily behavior using
ambulatory accelerometry: the activity monitor. Behav Res Methods Inst Comp. 33:349-
356.
7. Cauley, JA, LaPorte RE, Black-Sandier R, Schramm M.M, Kriska AM. (1987) Comparison
of methods to measure physical activity in postmenopausal women. Am J Clin Nutr.
45:1422.
8. Chen KY, Sun M. Improving energy expenditure estimation by using a triaxial
accelerometer. (1997) J Appl Physiol. 83(6): 2112-2122.
9. DeLanyJP,Schoeller DA, HoytRW, Askew EW, Sharp MA. (1989) Field use of Dz'^O
12
to measure energy expenditure of soldiers at different energy intake. J Appl Physiol.
67(5): 1922-1929.
10. Dion JL, Foufllot JP, Leblanc A. Ambulatory monitoring of walking using a thin capacitive
force transducer. (1982) In: Scott FD, Raftery EB, Clement DL, Wright SL, eds.
Proceedings of the 4th international symposium on ambulatory monitoring, and the second
gent workshop on blood pressure variability. London: Academic Press. 420- 425.
11. Fahrenberg J, Foerster F, Mueller W, Smeja M. (1997) Assessment of posture and motion
by multi-channel piezoresistive accelerometer recordings. Psychophysiology. 34:607-612.
12. Flatt JP. (1978) The biochemistry of energy expenditure. In: Recent Advances in Obesity II,
edited by Gray, G.S. London: Newmann, 211-228.
13. Foerster F, Fahrenberg, J. (2000) Motion pattern and posture: Correctly assessed by
calibrated accelerometers. Behav Res Methods Inst Comp. 32:450-457.
14. Forbes-Ewan CH, Morrissey BL, Gregg GC, Waters DR. (1989) Use of doubly labeled
water technique in soldiers training for jungle warfare. J Appl Physiol. 67(1): 14-18.
15. Freedson PS, Melanson E, Sirard J. (1998) Calibration of the Computer Science and
Applications, Inc. accelerometer. Med Sci Sports Exerc. 30:777-781.
16. Friedl KE, Hoyt RW. (1997) Development and biomedical testing of military operation
rations. Aimu Rev Nutr. 17:51-75.
17. Gass EM, Gass GC. (1998) Rectal and esophageal temperatures during upper and lower
body exercise. Euro J Appl Physio. 78(l):38-42.
18. Haymes EM, Byrnes WC. (1993) Walking and running energy expenditure estimated by
Caltrac and mdirect calorimetry. Med Sci Sports Exerc. 25:1365-1369.
19. Hoyt RW, Knapik JJ, Lanza JF, Jones BH, Staab JS. (1994) Ambulatory foot contact
13

monitor to estimate metabolic cost of human locomotion. J Appl Physiol. 76(4):1818-1822
20. Jequier E, Schutz Y. Energy expenditure in obesity and diabetes. (1998) Diabetes Metab
Rev. 4: 583-593.
21. Kram R, Taylor CR. (1990) Energetics of running: a new prospective. Nature Lond.
346:265-267.
22. Levine JA, Melanson EL, Westerterp KR, Hill JO. (2001) Measurement of the
components of nonexercise activity thermogenesis. Am J Physiol Endocrinol Metab.
281:670-675.
23. Nielsen B, Astnip A, Samuelsen P, Wenghoh H, Christensen NJ. (1993) Effect of physical
training on thermogenic response to cold and ephedrine in obesity. Intern J Obes Rel Metab
Disord. 17:383-90.
24. Nindl BC, Leone CD, Tharion WJ, et al. (2002) Physical performance responses during 72 h
of military operational stress. Med Sci Sports Exerc. 34(11):1814-1822.
25. Paffenbarger RS, Blair SN, Lee IM, Hyde RT. (1993) Measurement of physical activity to
assess health effect in free-living populations. Med Sci Sports Exerc. 25:60-70.
26. Ravussin E, Bogardus C. (1989) Relationship of genetics, age, and physical fitness to daily
energy expenditure and fuel utilization. Am J Clin Nutr. 49: 968-975.
27. Ravussin E, Lillioja S, Anderson TE, Christin L, Bogardus C. (1986) Determinants of
24-hour energy expenditure in man: methods and results using a respiratory chamber. J Clin
Invest 78: 1568-1578.
28. Schoeller DA, Hlinicka JM. (1996) Reliability of the doubly labeled water method for the
measurement of total daily energy expenditure in free living subjects. J Nutr. 126:348S-
354S.
14
29. Schoeller DA, Ravussin E, Schutz Y, Acheson P, Baertschi P, Jequier E. (1982) Energy
expenditure by doubly labeled water: validation and proposed calculation. Am J Physiol.
250:R823-R830.
30. Shultz Y, Weinsier RL, Hunter GR. (2001) Assessment of free-living physical activity in
humans: an overview of current available and proposed new measures. Obesity Research.
9:368:379.
31. Spun- GB, Prentice AM, Day KC, et al. (1986) Energy expenditure from minute-by-minute
heart rate recording: comparison with indirect calorimetry. Am J Clin Nutr. 44:596-602.
32. Sun M, Reed GW, Hill JO. (1994) Modification of a whole-room calorimeter for measurement
of rapid changes in energy expenditure. J Appl Physiol. 2686-2691.
33. Troumbley PF, Rinkle WJ, Burman KD, Lenz ER. (1990) A comparison of the health risk,
health status, self-motivation, psychological symptomatic distress, and physical fitness of
overweight and normal-weight soldiers. Mil Med. 155(9): 424-429.
34. US Army (1998) Physical fitness training field manual (FM21-20). Page 1.
35. Van Marken Lichtenbelt WD, Westerterp-Plantenga MS, Van Haydonek P. (2001)
Individual variation in the relation between body temperature and energy expenditure in
response to elevated ambient temperature. Physio Behav 73(102): 235-242.
36. Walker DJ, Heslop PS, Plummer CJ, Essex T, Chandker S. (1997) A continues patient
activity monitor: validation and relation to disability. Physiol Meas. 18:49-59.
37. Washbum RA, Montoye HJ. (1986) The assessment of physical activity by questionnaire.
Am J Epidem. 125:563-576.
38. Washbum R, Chin MK, Montoye HJ. (1980) Accuracy of pedometer in walking and
running. Res Q Exerc Sports. 51:695-702.
15

39. Welles S, Lilavivat U, Campbell RG. (1981) Thermic effect of feeding in man: increased
norepinephrine levels following glucose but not protein or fat consumption. Metabolism.
30:953-958.
40. Weyand PG, Kelly M, Blackadar T, et al. (2001) Ambulatory estimates of maximal aerobic
power from foot -ground contact times and heart rates in running himians. J Appl Physiol.
91(l):451-8
41. Wilson PWF, Paffenbarger RS, Morris JN, Havlik RJ. (1986) Assessment methods for
physical activity and physical fitness in population studies. Am Heart J. 11:1177-1192.
42. Wong TC, Webster JG, Montoye HJ, Washbum R. (1981) Portable accelerometer device
for measuring human energy expenditure. IEEE Trans Biomed. Eng. 28:467-471.
43. Yoshida T, Sakane N, Umekawa T, Kondo M. (1994) Relationship between basal metabolic
rate, thermogenic response to caffeine, and body weight loss following combined low
calorie and exercise treatment in obese women. Intern J Obes Rel Metab Disord. 18:345-50.
44. Zhang K, Werner P, Sun M, Pi-Sunyer FX, Boozer C. (2003) Measurement of human daily
physical activity. Obes Res. 11:33-40.
16

Figure legends
Figure 1. The whole-room indirect calorimeter at Vanderbilt University.
Figure 2. Total daily energy expenditure (TEE) estimated by the Tritrac-R3D model (A.
Exercise Day, and B. Normal Day) in 85 healthy women and 40 men, and by the
two-component nonlinear models (C. Exercise Day, and D. Normal Day) versus
TEE measured by the calorimeter. The line of identity signifies a perfect match
between the estimated and the measured values in the room calorimeter. In C and
D, individual (Ind.) model represents the parameters fitted for each voltmteer
(from A and B), and general (Gen.) model represents the model using only the
subject's gender, weight, height, and age to replace the individualized coefficients.
Figure 3. Averaged energy expenditure (EE) in separate intensity categories of one 24-hour
period in 60 healthy sedentary women (age 35.4±9.0 years and BMI 30.0±5.9
kg/m^). Comparison between EE measured in the whole-room indirect
calorimeter, estimated by the ActiWatch, the Tritrac-R3D, and the ActiWatch and
Tritrac-R3D monitors combined. METs: metaboUc equivalents, calculated as ratio
of individual energy expenditure and resting energy expenditure. (* P<0.05
compared to the measured values).
Figure 4. Total energy expenditure of physical activity (EEACT) in 12 healthy women during
two 24-hr periods (identical protocol) measured in the room calorimeter,
compared to the estimated from the activity monitors. One day was randomly
selected for fitting with combinations of ActiWatch on the wrist of the dominant
hand and Tritrac-R3D at the waist, and the second day used as prediction
validation.
17

Figure 1.
18

5 10 15 20 25 TEE measured (MJ/24hr)
5 10 15 20 25 TEE measured (MJ/24hr)
25 C. TheiNonlinear'Models
Rgeh. =0.939
5 10 15 20 25 TEE measured (MJ/24hr)
10 15 20
TEE measured (MJ/24hr)
Figure 2.
19

2500
2000
5 1500 - •Pi*
s g- 1000
v 500 -
0
93 52 74
87 *
204 l.>0 * 197 197
222;3 ^WM 2|£:: 2||:'
- 1002 1062 961 1008
571
1
550
1
526 *
1
544
B >6 METs ■ 4-6METS ■ 2.5-4 METs ■ 1-2.5 METs ■ Sleep
Measured ActiWatch Tritrac Combined
Figure 3.
20
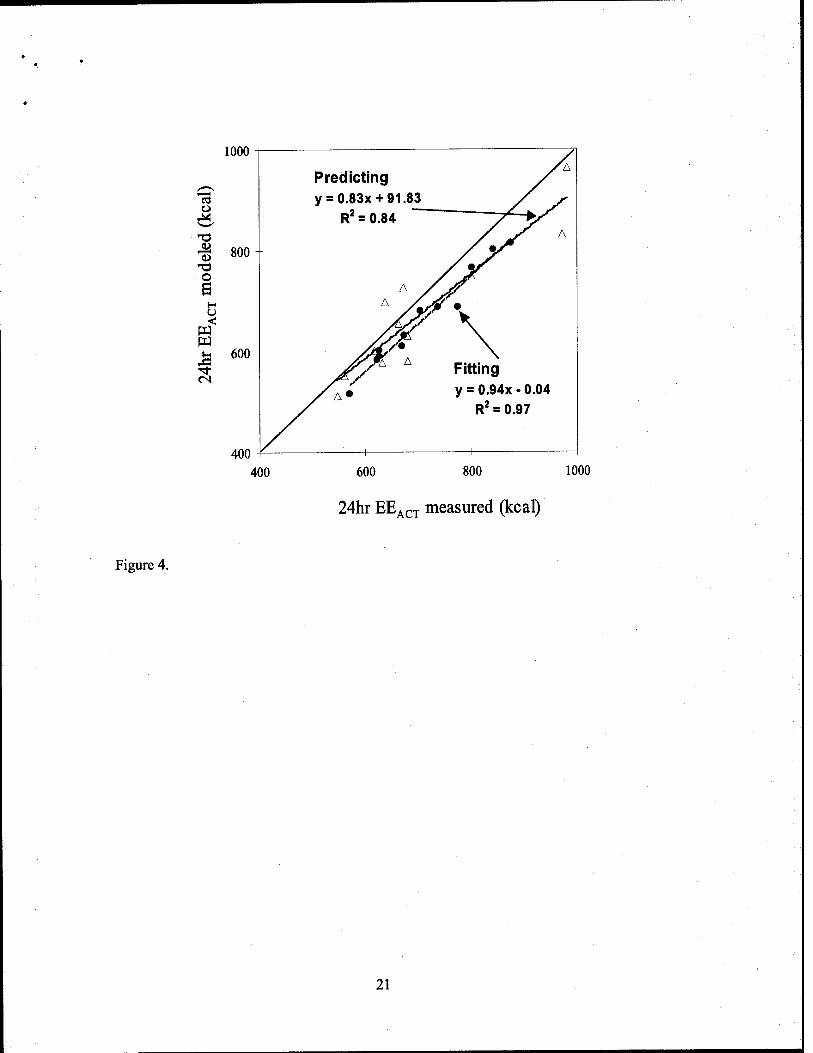
Figure 4.
1000
o
I 800 O
O <
600
400
Predicting yl
y = 0.83x +91.83 0 ■' ■■ <./
R^ = 0.84 / V ̂ .
--
^^ A y V^ A yC/i
y^V» \ >V^ A Fitting
y^A» y = 0.94x -0.04 R^ = 0.97
400 600 800 1000
24hr EE^cT measured (kcal)
21

DIABETES TECHNOLOGY & THERAPEUTICS Volume 5, Number 6, 2003 © Maiy Ann Liebert, Inc.
Military Metabolic Monitoring
Predicting Energy Expenditure of Physical Activity Using Hip- and Wrist-Worn Accelerometers
KONG Y. CHEN, Ph.D.,i SARI A. AGRA, M.D.,2 KAREN MAJGHRZAK, M.S.,i GANDICE L. DONAHUE, B.S.,' LEMONT BAKER. Ph.D.,3* LINDA CLEMENS, Ph.D.,"
MING SUN, Ph.D.,1 and MAGIEJ S. BUGHOWSKI, Ph.D.i'S
ABSTRACT
To investigate the association between physical activity and health, we need accurate and de- tailed free-living physical activity measurements. The determination of energy expenditure of activity (EEACT) may also be useful in the treatment and maintenance of nutritional dis- eases such as diabetes mellitus. Minute-to-minute energy expenditure during a 24-h period was measured in 60 sedentary normal female volunteers (35.4 ± 9.0 years, body mass index 30.0 ± 5.9 kg/m^), using a state-of-the-art whole-room indirect calorimeter. The activities ranged from sedentary deskwork to walking and stepping at different intensities. Body move- ments were simultaneously measured using a hip-worn triaxial accelerometer (Tritrac-R3D, Hemokentics, Inc., Madison, Wisconsin) and a wrist-worn uniaxial accelerometer (ActiWatch AW64, MiniMitter Co., Sunriver, Oregon) on the dominant arm. Movement data from the ac- celerometers were used to develop nonlinear prediction models (separately and combined) to estimate EEACT and compared for accuracy. In a subgroup (n = 12), a second 24-h study pe- riod was repeated for cross-validation of the combined model. The combined model, using Tritrac-R3D and ActiWatch, accurately estimated total EEACT (97.7 ± 3.2% of the measured values, p = 0.781), as compared with using ActiWatch (86.0 ± 4.7%, p < 0.001) or Tritrac-R3D (90.0 ± 4.6%, p < 0.001) alone. This model was also accurate for all intensity categories dur- ing various physical activities. The subgroup cross-validation also showed accurate and re- producible predictions by the combination model. In this study, we demonstrated that move- ment measured using accelerometers at the hip and wrist could be used to accurately predict EEACT of various types and intensity of activities. This concept can be extended to develop valid models for the accurate measurement of free-living energy metabolism in clinical pop- ulations.
Departments of 'Medicine, ^Pediatrics, and ^Biomedical Engineering, Vanderbilt University; and 'Department of Family and Community Medicine, Meharry Medical College, Nashville, Tennessee.
^Department of Consumer Science and Education, University of Memphis, Memphis, Tennessee. 'Present address: St. Paul, Minnesota.
1023

1024 CHEN ET AL.
INTRODUCTION
PHYSICAL ACTIVITY has been known to be have beneficial effects on overall health, particu-
larly in decreasing the incidence of morbid- ity/mortality associated with common chronic diseases such as coronary heart disease, hy- pertension, and type II diabetes.'-^ However, little quantitative evidence has yielded causal relationships,^'* mostly because of the large in- dividual and time variations in the character- istics of the parameters of activity and health, and the lack of ability to accurately quantify physical activity. For example, both observa- tional studies and clinical trials in a variety of populations have supported the hypothesis that physical activity plays a significant role in the prevention and treatment of type II dia- betes, but what is less clear is how much phys- ical activity is needed.^'^ Objective and accurate measurements of physical activity and energy expenditure (EE) are crucial in the treatment and maintenance of such chronic diseases.
EE of activity (EEACT) varies within and among individuals, and contributes the largest variability to total EE in humans.^ This contri- bution has significant consequences on overall energy balance, which determines the long- term body weight outcome. The current stan- dard in objective measuring methods for EE are doubly labeled water^-^ and the indirect calorimeteK.*°ii The doubly labeled water method provides a mean value of EE for the entire measurement period, usually around 10-14 days, and does not allow one to calcu- late the day-to-day variation in EE. The other disadvantages of the technique are its high cost and the limited availability of '^O. The indirect calorimeter is the best method to measure the components of daily EE [resting EE (REE), ther- mic effect of food, and EEACTI- It is relatively simple, and can be used either with a ventilated hood system (for a resting subject) or in a res- piratory chamber for a longer period of time.^^ A major advantage of indirect calorimetry is the immediate response of oxygen consump- tion. Another advantage of indirect calorime- try in comparison with other methods is the possibility of assessing nutrient oxidation rates. However, it can only measure EE accurately under laboratory conditions.
Portable accelerometers, developed to objec- tively measure body movements and record detailed data for an extensive period, have been adopted to assess physical activities and EE- ^^.j, 13-20 ^e previously showed that EE esti- mated by a hip-worn triaxial accelerometer (Tritrac-R3D, Hemokentics, Inc., Madison, WI) significantly underestimated EEACT as com- pared with EEACT measured by a whole-room indirect calorimeter.'^ We then developed and validated a nonlinear model that used the ac- celeration components from the Tritrac-R3D for the estimation of EEACT- Although the esti- mation was accurate for the group, individual variation in EEACT prediction still existed, po- tentially because of undetected upper body movements. Since small errors over time can be significantly contribute to overall energy balance, our mission is to minimize individual errors. Therefore, we hypothesize that by adding an upper-body acceleration component (measured by ActiWatch AW64, MiniMitter Co., Sunriver, OR) to our previous hip-worn ac- celerometer model, the overall estimation ac- curacy of EEACT would be improved, com- pared with using each individual monitor alone. This investigation was also to demon- strate the process of using a whole-room indi- rect calorimeter to develop subject-specific EEACT predictive equations from portable ac- celerometers in humans.
SUBJECTS AND METHODS
Subjects
The data were part of a prospective study looking at possible seasonal variations in phys- ical activity in sedentary women. A group of normal healthy women (n = 60) of heteroge- neous characteristics and sedentary by self-re- port wa^recruited from local areas. Signed in- formed consent approved by the Institutional Review Board at Vanderbilt University was ob- tained before their participation in the study. Women were eligible for participation if they were apparently healthy, with no evidence of past or present metabolic diseases (e.g., thyroid disorders and type II diabetes), were not preg- nant as determined by a serum pregnancy test.

MODELING ACTIVITY ENERGY BY BODY ACCELERATION 1025
T1
did not use drugs known to affect energy me- tabolism, were eating a balanced diet, and were non-smokers. All participants were studied be- tween days 3 and 12 after the onset of menses (foUicular phase) to eliminate the influence of menstrual function on energy expenditure.^^ Study participants were compensated for tak- ing part in the study. During the 2 weeks prior to the study, all participants were encouraged to maintain their normal pattern of activity. To cross-validate the models developed from this study, a randomly selected subgroup of sub- jects was asked to volunteer to repeat the pro- tocol under identical conditions within 4 days of the first study. Characteristics of all study •participants are shown in Table 1.
Experimental procedures
All participants reported to the General Clin- ical Research Center (GCRC) after a 10-h overnight fast. The 24-h study protocol in- volved spontaneous daily activities and an ex- ercise protocol that was similar to the manual work and leisure activities that participants would perform in daily life. Specifically, the ex- ercise protocol consisted of three 10-min walk- ing periods with average speeds of 0.6 m/s, 0.9 m/s, and 1.2 m/s across the room and three 10-min stepping periods with average speed of 12 steps/10 s, 18 steps/10 s, and 24 steps/min, respectively, all with at least 10-min resting pe- riods between each exercise. During the walk- ing and stepping segments, subjects followed the appropriate exercise cadence set by a metronome. The spontaneous physical activi- ties included various types and intensities, such as sitting, TV viewing, deskwork, walk- ing around the room, and even some voluntary
exercises using the provided treadmill and stepper. Meals designed by the registered di- etitian to maintain approximate energy balance were prepared at the Vanderbilt University GCRC metabolic kitchen and provided to the subject at 8:30 a.m., 12:30 p.m., and 5:00 p.m. The participants were asked to go to bed from 9:30 p.m. until 6:00 a.m.
Measurement of physical activity. The Tritrac- R3D monitor (weighing 170 g and measuring 11.1 X 6.7 X 3.2 cm) was placed in a nylon pouch secured to the belt at the waistline on the right hip to measure body acceleration in three dimensions (x or anteroposterior, y or vertical, and zor medial-lateral axis). The Ac- tiWatch (weighing 17 g and measuring 2.8 X 2.7 X 1 cm), a uniaxial accelerometer, was worn at the wrist of the dominant hand to assess arm movements. The ActiWatch was worn during the entire study period, while the Tritrac-R3D was not worn during sleep for better comfort. Both monitors were set to record data at 1-min intervals.
Measurement ofEE. The rate of EE was mea- sured minute-by-minute in a whole-room in- ^—-v^^ direct calorimeter (Fig. 1), an airtight environ-<( F1 ) mental room that is temperature and humidity controlled. To provide facilities for daily living and to bridge the difference between laboratory and free-living environments, the room is equipped with a desk, chair, outside window, toilet, sink, telephone, TV/VCR, audio sys- tem/alarm clock, and fold-down mattress. It has been validated as a highly accurate system for determining detailed EE and physical ac- tivity. ^''^^ Oxygen consumption (Vo2) and car-
TABLE 1. SUBJECT PHYSICAL CHARACTERISTICS
All(n-- = 60) Subgroup (h = --12)
Mean ± SD Range Mean ± SD Range
Body mass (kg) Height (cm) Age (yrs) BMI 0<g m-2)
70.7 ± 16.4 164.9 ± 7.3 35.4 ± 9.0 30.0 ± 5.9
45.0-131.1 151.0-184.0 20.0-52.0 16.7-47.0
65.9 ± 9.4 164.9 ± 8.3 27.6 ± 5.1« 24.2 ± 2.3
54.4-83.5 156.0-184.0 22.0-38.0 21.4-30.3
BMI, body mass index. ^Significantly different compared with the rest of the subjects (n = 48), p = 0.004.

1026 CHEN ET AL.
Whole-room Indirect Calorimeter environ- ment control & moni- toring
measure- ment & calibration instru- ments
noise filtering |. & alarm
Energy expenditure & respiratory
quotient
sensors for chair, mattress, commode, food pass, TV/VCR
event recordings for meal, exercise, sleep, REE
Physical activity & exercise
measurement system
Behavior monitoring
system
FIG. 1. Schematic diagram of the whole-room indirect calorimetry chamber at Vanderbilt University.
bon dioxide production (Vco2) are used to cal- culate minute-by-minute EE with a system er- ror of less than 1%.*' This accuracy is critical for validation and model development of EE.
Anthropometry. Body weight was measured to the nearest 0.05 kg with a digital scale. Height was measured to the nearest 0.5 cm with a stadiometer.
Model development
The model development algorithm was sim- ilar to our previous studies.'^'^ The body ac- celerations ascertained from the Tritrac-R3D and the ActiWatch were used to fit the mea- sured EEACT (EE - REE), first in separate mod- els, and then combined in one model. REE was calculated during the 30-min resting supine posture while awake and immediately follow- ing overnight fasting and sleeping. A nonlin- ear model was previously proven to be supe- rior compared with linear models,^ and thus was also adopted for the current study. After
synchronizing the acceleration outputs with the measured EE, the acceleration counts from the Tritrac-R3D were stratified into the hori- zontal component (denoted H, where H = Vx2 + z2), and the vertical component (de- noted V,V = y). Each component was modeled by nonlinear power parameters to model indi- vidual EEACT as the following:
Tritrac-R3D: EEAciik)
= a X H(A)Pi + bx V(*)P2 (1)
ActiWatch: ££ACT(*) = a X AW{k)P (2)
Tritrac-R3D-f-ActiWatch: EEAciik)
= a X Hik)P^ + bx V(Jt)p2 -i- cx AW{k)i^ (3)
where EBACAH) represents the estimated EEACT at the Mh minute, and parameters such as a, b, c, p, pi, p2, and p3 were optimized to predict EEACT that had the best fit compared with the measured EEACT-

MODELING ACTIVITY ENERGY BY BODY ACCELERATION 1027
Statistical analysis
Descriptive data were expressed in mean ± 1 standard deviation (SD). Optimization was performed using the least sum of squared er- ror algorithm with universal minimum. Corre- lation coefficient (Pearson's r) and standard er- rors of estimation (SEE) were used as the evaluation criteria:
SEE = SD(££estlmated — ££measured) (4)
where ££estimated represents the estimated EE value by each model, and ££measured represents the EE measured by the indirect calorimeter for each study participant. The MATLAB software package (for Windows, version 6.1, Math- Works, Inc., Natick, MA) was used for the model development and evaluation of final predictions. Differences were compared by analysis of variance (ANOVA, Tukey's test) us- ing SPSS for Windows (for Windows, version 11.0, SPSS, Inc., Chicago, IL); 95% confidence interval and p < 0.05 were used to identify sta- tistical significance. Bland-Altman^^ plots, which express the difference with respect to the mean of the two measurements in a scatter graph, were used to explore differences be- tween modeled and measured total EEACT across the study population.
To further evaluate the accuracy of the mod- els for various activity intensities, the time pe- riods of the study day were categorized ac- cording to the intensity. We stratified the non-sleeping activities into four categories: 1-2.5, 2.5-4.0, 4.0-6.0, and >6.0 times the REE (METs, including EEACT and REE), using mea-
sured EE as the standard. The estimated EE from the prediction models within the same time periods of these intensities was also cate- gorized and compared with the measured EE using ANOVA.
RESULTS
Table 1 presents descriptive data for the 60 study participants and for the cross-validation subgroup (n = 12).
The 24-h EE was 2,132 ± 335 kcal, total EE-
ACT was 821 ± 167 kcal, and REE was 1,403 ± 233 kcal for the entire group. Physical activity, measured in counts per minute for each indi- vidual by the Tritrac-R3D (vector magnitude) and ActiWatch, was significantly correlated with measured EEACT {R = 0.825 ± 0.046 and 0.646 ± 0.093, respectively, p< 0.001). The es- timated EEACT yielded from the predictive models (Eqs. 1-3) was significantly (p < 0.001) correlated with measured EEACT. and was higher (p < 0.001) than the correlation between ^—^ the raw counts and measured EEACT (Table 2). ■^( """2 ) However, compared with the EEACT measured in the room calorimeter, models using Acti- Watch (Eq. 2) and Tritrac-R3D (Eq. 1) individ- ually significantly underestimated total EEACT: -113 (-189, -38) kcal (p< 0.001) and -85 (-161, -10) kcal (p= 0.019), respectively. The total EEACT predicted using the Tritrac+Acti- Watch model (Eq. 3) was not statistically dif- ferent from the measured EEACT: ~28 (—103, 48) kcal (p = 0.781). The degrees of agreement between estimated EEACT using each of these
TABLE 2. MINUTE-BY-MINUTE R AND SEE BETWEEN EEACT MEASURED BY THE INDIRECT CALORIMETER AND ESTIMATED BY THE MODELS
Model R (estimated vs. measured EE) SEE (kcal/min)
Tritrac-R3D (Eq. 1) Mean ± SD Range
ActiWatch (Eq. 2) Mean ± SD Range
Tritrac ± ActiWatch (Eq. 3) Mean ± SD Reinge
0.90 ± 0.03 0.81-0.95
0.73 ± 0.08^ 0.53-0.90
0.92 ± 0.03 0.81-0.96
0.364 ± 0.088 0.234-0.570
0.575 ± 0.142« 0.356-0.862
0.334 ± 0.087 0.212-0.546
^Significantly different from the Tritrac-R3D model and the Tritrac + ActiWatch model, all p < 0.001.

1028 CHEN ET AL.
50
0
-50
-100
-150
-200
ActiWatch Model
^ -250
i 2
s
_, _MeM+2Sp_
■ Mean
■■■■%_%■
. — _ —■ » » . '■"■/■^
■ ^ ^ -^"
y= 7
= -0.12x + 6.6
R^ = p.l8
Mean-2SD
400 600 800 1000 1200 1400 1600
Tritrac-R3D Model
"2 S V
. o s
<
s
5U -
0 Mean-(-2SD -50-
100- ■fr-;*ii ■ ^ean
150-
200- m y = -0.03x-91.5
R^ = 0.02 1 1 ■ .L 1
Mean-2SD 1 ._
400
50
0
-50
-100
-150
-200
-250
600 800 1000 1200 1400
Tritrac-R3D + ActiWatch Model
1600
Mean+2SD
~Ti" H——■ ■■~ r -i \r.-y-~- Mean
Mean-2SD
y = -0.05x-t-9.8
R^=0.08
400 600 800 1000 1200
Mean total EE^f^T (kcal) 1400 1600
FIG. 2. Mean ± 2 SD of the difference between the measured (calorimeter) and estimated 24-h EEACT using predic- tion models (ActiWatch, Tritrac-R3D, eind Trltrac-R3D-l-ActiWatch, in Eqs. 2, 1, and 3, respectively), with respect to the mean of the EEACT values.

MODELING ACTIVITY ENERGY BY BODY ACCELERATION 1029
three predictive models and EEACT measured ^—^ in the room calorimeter are presented by the ( F2 Vfiland-Altman plots in Figure 2. These plots ^ show that the main differences among the three
predictive models were the magnitude of mean error and the range of deviations in estimating total EEACT- This analysis demonstrates that the combination of two accelerometers im- proved both parameters over the two individ- ual models.
Furthermore, both the Tritrac-R3D model (Eq. 1) and the Tritrac+ActiWatch model (Eq. 3) significantly (all p< 0.001) increased corre- lation coefficient (i?) values and reduced SEE compared with the ActiWatch model (Eq. 2). The improvements from the Tritrac-R3D model to the combination model, although all in pos- itive directions, did not reach statistical signif- icance in terms of i? (p = 0.278) or SEE (p = 0.218). The summary results of the fitting pa- rameters of the models for Tritrac-R3D, Acti- Watch, and the two monitors combined (Eqs. 1-3) are summarized in Table 2. When com- pared among different intensity categories, we
^—-. found the performance from the three predic- C F3 J^tive models varied (Fig. 3). The ActiWatch ^-—^ model underestimated the EE when intensity
exceeded 4 METs (p < 0.001). Only the combi- nation model was able to produce nonsignifi- cant differences in EEACT values in all physical activity intensities.
In the smaller cross-validation subgroup, 12 subjects (characteristics summarized in Table 1) who repeated the 24-h measurements ex-
pended 2,008 ± 260 kcal/day and 2,000 ± 295 kcal/day for the first and second study day (p = 0.840), respectively. EEACT was also com- parable between the two days (820 ±199 kcal/day and 761 ±201 kcal/day, p= 0.763). One of the two study days was selected ran- domly for model development. The fitting pa- rameters in the combined model (Eq. 3) for each of these individuals were then applied to the acceleration output from the other study day, thus deriving the predicted EEACT- The com- parison between the predicted and measured EEACT from the room calorimeter would then yield the cross-validity of the models. Total EEACT during the study period used for mod- eling was 710.4 ± 96.7 kcal and 665.2 ± 92.1 kcal for measured and fitted (6.4 ± 2.3%, p = 0.014), respectively. Total EEACT during the cross-validation study day was 724.5 ± 108.3 kcal and 684.2 ± 104.2 kcal for measured and predicted (4.3 ± 4.8%, p = 0.140), respectively. The scatter plot for the measured versus pre- ^—-v,^^ dieted EEACT (Fig- 4) further illustrates that the^T F4j) model appears stable and is able to accurately ^-—-^ reproduce total EEACT for the majority of these subjects.
DISCUSSION
The need for accurate assessment of physical activity and its associated EE under free-living conditions is underscored by the rising toll of chronic diseases, such as obesity, type II dia-
1600
FIG. 3. Group mean EEACT in dif- ferent intensity categories eis mea- sured by the calorimeter, modeled by the ActiWatch, Tritrac-R3D, and combined (Tritrac-R3D+Acti- Watch) models, 'p < 0.05 compared with the measured values.
O >6 METs B 4-6 METs ■ 2.5-4 METs ■ 1-2.5 METs
Measured ActiWatch Tritrac-R3D Combined

1030 CHEN ET AL.
1000
Cross-validation y>0.83x + 91.83
1^ = 0.84
1^ = 0.97
400 600 800 1000
24hr EE^CT measured (kcal)
FIG. 4. Estimated total EEACT from the modeled day (dotted with dashed trend line) and the cross-validation day (triangle with solid trend line), versus the measured EEACT in the subgroup (n = 12). The line of identity is also shown for theoretical "perfect" fit.
betes, and cardiovascular disease. While con- siderable evidence supports a relationship between physical inactivity and type II dia- betes,^'^ the appropriate amount of physical ac- tivity needed to aid in the prevention or ame- lioration of this disease epidemic is somewhat speculative, largely because of the lack of ac- curate and validated methodology for measur- ing free-living physical activity and its associ- ated EE. Portable accelerometers have been recognized as a reliable and objective technique for measuring physical activities under free-liv- ing conditions.^*'^^ However, their ability to es- timate EEACT has been an area that needs great improvement. Results of this study have shown that EEACT could be accurately assessed using these noninvasive movement monitors.
Estimation of EE by accelerometers has been studied under laboratory and free-living con- ditions. In earlier studies in which uniaxial ac- celerometers were attached at different ana- tomic sites, vertical acceleration at the hip had the highest correlation coefficient with mea- sured EE during common activities such as walking and stepping.'^'^^-^^ Subsequent stud- ies have demonstrated improvements of the EE-acceleration associations with three-dimen-
sional (triaxial) accelerometers in walking, run- ning, and step exercise under laboratory con- ditions.^^'^^ The current prediction models adopted by the Tritrac-R3D use the linear re- gression approach and only the vector magni- tude of counts from all three axes. The perfor- mance of this model was shown to be acceptable for level walking and jogging (40-70% Vogmax on a treadmill) for a small group of young and fit individuals in one study,^* but both overestimationsi^-^"'^^'^" and underestimations^''-^' have been reported in walking and other free-living physical activi- ties. Previously, we also found a significant un- derestimation of total EEACT by 50-70% using the Tritrac-R3D linear regression model.'^
Furthermore, we developed an approach to model EEACT using a hip-worn triaxial ac- celerometer (Tritrac-R3D) by separating hori- zontal and vertical components and using a nonlinear power model to associate accelera- tion and EEACT over the broad intensity range of daily physical activities. Both approaches significantly (p < 0.01) improved the estima- tion accuracy of EEACT*^'^^ However, the Tri- trac-RSD monitor was mainly sensitive to body movements at the center of mass, and thus could not adequately measure changes in EE due to physical activities performed by the up- per body, which are a major part of many sedentary activities.
Swartz et al.^^ reported a bivariate regression model that combined hip and wrist accelera- tion data (uniaxial) and significantly improved prediction of EE in free-living physical activi- ties. In our current study, we add a wrist-worn uniaxial accelerometer to our previously tested hip-worn triaxial accelerometer model, and further advanced this modehng concept using nonlinear modeling. One major advantage of this type of nonlinear modeling was that if a better fitting could be achieved with a linear model, then the power parameters (p values in Eqs. 1-3) would then be equal or very close to 1. In all three models, all power parameters were significantly less than 1 (all p < 0.01). This was in agreement with our previous findings.'^
By comparing the results from different models, the estimated EEACT using Tritrac-R3D (Eq. 1) was significantly better than using Ac- tiWatch (Eq. 2), in terms of SEE and R (Table

MODELING ACTIVITY ENERGY BY BODY ACCELERATION 1031
2). This indicated stronger associations be- tween EEACT and the acceleration components measured at or close to the center of body mass rather than at the wrist, logically reflecting higher energy costs due to weight-bearing movements. Movements from the arm can of- ten be quick even with little force exertion, thus leading to the slight overestimation of EEACT (6.2 ± 4.7%, p = 0.121) during low-intensity ac- tivities (1-2.5 METs) by the ActiWatch model (Fig. 3). In contrast, the ActiWatch model sig- nificantly underestimated EEACT during activ- ities of higher intensity (>4.0 METs) because of less upper body motion during walking and stepping. The Tritrac-R3D model in Eq. 1 slightly underestimated the lower-intensity physical activities (-4.3 ± 6.9% during 1-2.5 METs, p = 0.459), very likely because of the lack of signals picked up by the monitor dur- ing upper body movements, which was con- sistent with our previous study.'^ By adding the ActiWatch, the combination model shghtly improved SEE and R values, compared with the Tritrac-R3D model (Table 2). Although nei- ther achieved statistical significance, this model was the only one that showed nondifferential estimation of EEACT during all non-sleeping physical activity intensity categories. As a re- sult, total EEACT was predicted most accurately by the combined model (97.7 ± 3.2%), com- pared with ActiWatch (86.0 ± 4.7%) and Tri- trac-R3D (90.0 ± 4.6%) models. The contribu- tions to the total estimated EEACT by the combination model were 67 ± 23% and 33 ± 18% from the acceleration components from the Tritrac-R3D and the ActiWatch, respec- tively. In line with our hypothesis, these find- ings collectively suggest that the combination model used Tritrac-R3D data for most of the weight-bearing activities when EE intensities were relatively high, and used the ActiWatch data for upper body activities during more sedentary activities when the intensities were lower.
This study had some limitations. First, it only included healthy normal adult females (11 African Americans, two Asian American, and 47 Caucasians), which may limit the gen- eralizability of these model parameters. Un- like our previous study, we did not derive the generalized parameters for our models.
mainly because this was a fairly homoge- neous population (middle-aged sedentary fe- males) that lacked the spectrum of variations for generalization. However, the concept of using activity monitors to assess EEACT has been proven valid and feasible. Furthermore, we concentrated on a sedentary population with relatively high body mass index. This approach, however, allows us to establish a baseline for future studies on energy metab- olism and physical activity in obesity and type II diabetes.
In conclusion, this investigation evaluated several EEACT prediction models using a hip- worn triaxial accelerometer (Tritrac-R3D) and a wrist-worn uniaxial accelerometer (Acti- Watch) in a group of healthy women under close to free-living conditions in a whole-room indirect calorimeter. We found that a combined model using both monitors better estimated EEACT across all intensities compared with any single monitor model. In our study group, it has a 96.5% chance to detect total EEACT within ±75 kcal, which may be clinically significant in exercise or diet prescription. This model was further vaUdated for its predictive accuracy and stability in a subgroup. It is possible that the concept of developing predictive models for healthy individuals described in this study can be extended and validated in disease pop- ulations, such as type II diabetes. This may fa- cilitate development of physical activity guide- hnes used as adjuvant therapy for the prevention and treatment of type II diabetes. Currently, we are using this approach to con- duct a prospective study in assessing physical activity levels and EE in type II diabetic pa- tients under various intensities of disease man- agement protocols.
ACKNOWLEDGMENTS
The authors wish to dedicate this paper to the memory of Mr. Jin Feng Chai for his as- sistance in data collection and technical ex- pertise. This work was supported by grants RR00095, DK26657, DK02973, and DK46084 from the National Institutes of Health and grant DAMD17-02-1-0716 from the Depart- ment of Defense.

1032 CHEN ET AL.
REFERENCES
1. Blair SN, Kohl HW, Paffenbarger RS, Clark PG, Cooper CH, Gibbons LK: Physical fitness and all- cause mortality: a prospective study of healthy men and women. JAMA 1989;262:2395-2401.
2. Paffenbarger, RS, Hyde RT, Wing AL, Hsieh C: Phys- ical activity, all-cause mortality, and longevity of col- lege alumni. N Engl J Med 1986;314:605-613.
3. Ainsworth BE, Basset DR, Strath SJ, Swartz AM, O'Brien WL, Thompson RW, Jones DA, Macera CA, Kimsey CD: Comparison of three methods for measuring the time spent in physical activity. Med Sci Sports Exerc 2000;32(Suppl): S457-S464.
4. Paffenbarger RS, Blair S, Lee I, Hyde RT: Measure- ment of physical activity to assess health effects in free-living populations. Med Sci Sports Exerc 1993; 25:60-70.
5. Kriska A: Physical activity and the prevention of type 2 diabetes mellitus. Sports Med 2000;29:147-151.
6. MuUooly C: Cardiovascular fitness and type 2 dia- betes. Curr Diabetes Rep 2002;2:441-447.
7. Ravussin E, Lillioja S, Anderson TE, Christin L, Bog- ardus C: Determinants of 24-hour energy expenditure in man: methods and results using a respiratory chamber. J Clin Invest 1986,78:1568-1578.
8. Heyman MB, Fuss P, Young VR, Evans WJ, Roberts SB: Prediction of total energy expenditure using the Caltrac activity monitor [abstract]. Int J Obesity 1991;15(Suppl 1):23.
9. Shulz S, Westerterp KR, Bruck K: Comparison of en- ergy expenditure by the doubly labeled water tech- nique with energy intake, heart rate, and activity recording in man. Am J Clin Nutr 1989;49: 1146-1154.
10. Spun- GB, Prentice AM, Murgatroyd PR, Goldberg GR, Reina JC, Christman NT: Energy expenditure from minute-by-minute heart-rate recordings: com- parison with indirect calorimetry. Am J Clin Nutr 1988;48:552-559.
11. Sun M, Reed GW, Hill JO: Modification of a whole room indirect calorimeter for measurement of rapid changes in energy expenditure. J Appl Physiol 1994; 76:2686-2691.
12. Jequier E: Direct and indirect calorimetry in man. In: Garow JS, Halliday D, eds. Substrate and Energy Me- tabolism. London: J. Libbey, 1985:82-92.
13. Bouten CV, Westerterp KR, Verduin M, Janssen JD: Assessment of energy expenditure for physical activ- ity using a triaxial accelerometer. Med Sci Sports Ex- erc 1994;12:1516-1523.
14. Bouten CV, Verboeket-van de Venne WP, Westerterp KR, Verduin M, Janssen JD: Physical activity assess- ment: comparison between movement registration and doubly labeled water. J Appl Physiol 1996;81: 1019-1026.
15. Chen KY, Sun M: Improving energy expenditure es-
timation by using a triaxial accelerometer. J Appl Physiol 1997;83:2112-2122.
16. Chen KY, Sun M, Butler MG, Thompson T. Carlson MG: Development and validation of a measurement system for assessment of energy expenditure and physical activity in Prader-Willi syndrome. Obes Res 1999;7:387-394.
17. Jakicic JM, Winters C, Lagally K, Ho J, Robertson RJ, Wing RR: The accuracy of the Tritrac-R3D ac- celerometer to estimate energy expenditure. Med Sci Sports Exerc 1999;31:747-754.
18. Westerterp KR: Assessment of physical activity level in relation to obesity: current evidence and research issues. Med Sci Sports Exerc 1999;31(Suppl):S522- S525.
19. Campbell CL, Crocker PRE, McKenzie DC: Field evaluation of energy expenditure in women using Tri- trac accelerometers. Med Sci Sports Exerc 2002;34: 1667-1674.
20. Leenders NYJM, Nelson TE, Sherman WM: Ability of different physical activity monitors to detect move- ment during treadmill walking. Int J Sports Med 2003;24:43-50.
21. Webb P: 24-hour energy expenditure and the men- strual cycle. Am J Clin Nutr 1986;44:616-619.
22. Sun M, Hill JO: A method for measuring mechanical work and work efficiency during human activities. J Biomech 1993;26:229-241.
23. Bland JM, Altman DG: Statistical methods for assess- ing agreement between two methods of clinical mea- surement. Lancet 1986;1:307-310.
24. Haymes EM, Byrnes WC: Walking and running en- ergy expenditure estimated by Caltrac and indirect calorimetry. Med Sci Sports Exerc 1993;25:1365- 1369.
25. Wong TC, Webster JG, Montoye HJ, Washbum R: Portable accelerometer device for measuring human energy expenditure. IEEE Trans Biomed Eng 1981; 28:467-471.
26. Ayen TG, Montoye HJ: Estimation of energy expen- diture with a simulated three-dimensional ac- celerometer. J Ambulatory Monit 1988;1:293-301.
27. Meijer GA, Westerterp KR, Verhoeven MH, Koper BM, Hoor F: Methods to assess physical activity with special reference to motion sensors and ac- celerometers. IEEE Trans Biomed Eng 1991;38: 221-228.
28. Sherman WM, Morris DM, Kirby TE, Petosa RA, Smith BA, Frid DJ, Leenders N: Evaluation of a com- mercial accelerometer frritrac-R3D) to measure en- ergy expenditure during ambulation. Int J Sports Med 1998;19:43-47.
29. Nichols JF, Morgan CG, Sarkin JA, Sallis, JF, Calfas KJ: Validity, reliability, and calibration of the Tritrac accelerometer as a measure of physical activity. Med Sci Sports Exerc 1999;31:908-912.
30. Welk GJ, Blair SN, Wood K, Jones S, Thompson RW: A comparative evaluation of three accelerometry-

MODELING ACTIVITY ENERGY BY BODY ACCELERATION 1033
based physical activity monitors. Med Sci Sports Ex- erc 2000;32(Suppl):S489-S497.
31. Bassett DR, Ainsworth BE, Swartz AM, Strath SJ, O'Brien WL, King GA: Validity of four motion sen- sors in measuring moderate intensity physical ac- tivity. Med Sci Sports Exerc 2000;32(Suppl):S471- S480.
32. Swartz AM, Strath SJ, Bassett DR, O'Brien WL, King GA, Ainsworth BE: Estimation of energy expenditure using CSA accelerometers at hip and wrist sites. Med Sci Sports Exerc 2000;32(Suppl):S450-S456.
Address reprint requests to: Kong Y. Chen, Ph.D.
Department of Medicine Vanderbilt University
C2104 MCN 1161 21st Avenues.
Nashville, TN 37232-2279
£-maii: [email protected]