Embed Size (px)
Citation preview
Aviation Market in Transition
Director Marketing
Vladimir Kamynin
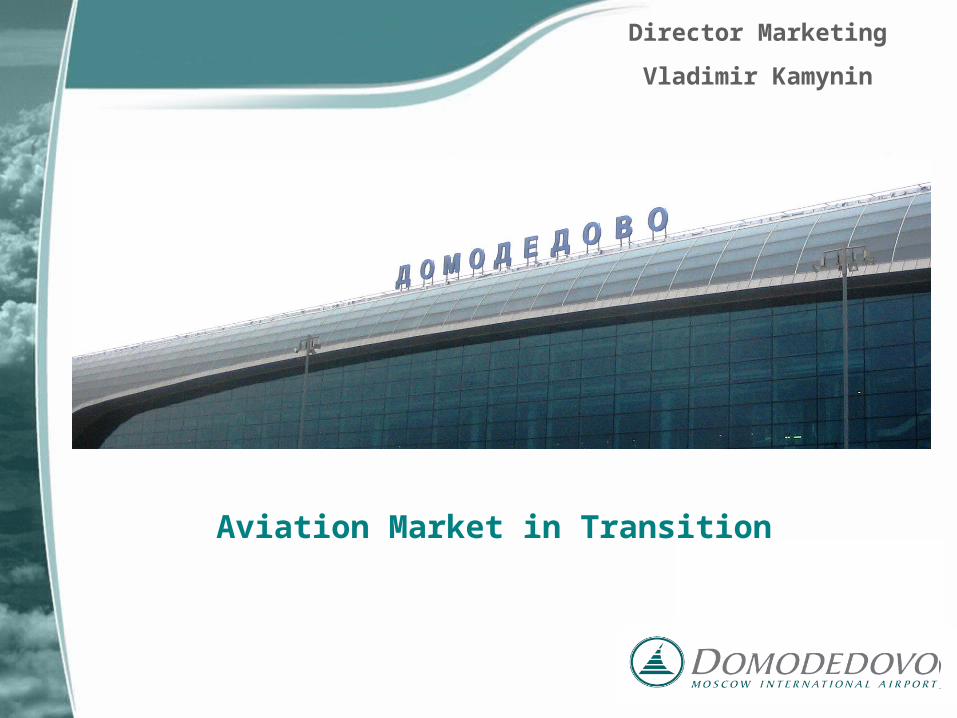
INVESTIGATED FACTORS
The main forecast factors:
• GDP• Jet fuel price• The factor of
limitedness of labour resources
Investigated factors for the market of the
Russian Federation:
• GDP• Jet fuel price• Real income of
population• Investments into main
production.
Factors rendering essential/critical influence:
• Global incidents and threats (atypical pneumonia (SARS)), bird flue (H5N1), pork flue (A/H1N1),earthquakes, hurricanes, tsunami)
• Aviation accidents (catastrophes and acts of terrorism)
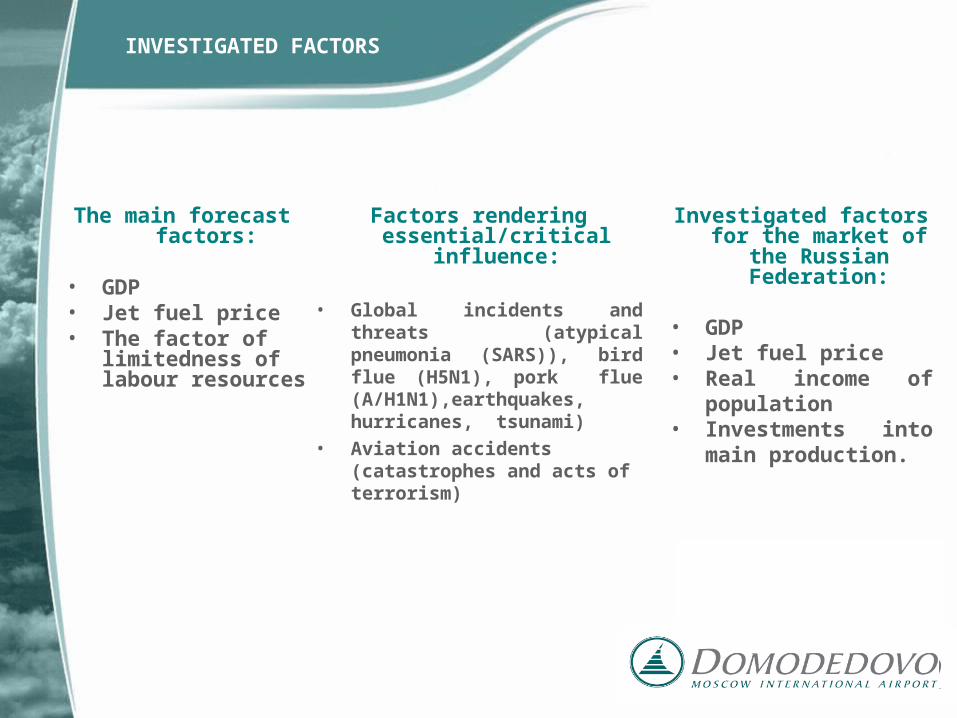
The Russian Federation
Dynamics of the basic macroeconomic indicators of the Russian Federation
Source: ROSSTAT Source: MER
Crisis-25%
-20%
-15%
-10%
-5%
0%
5%
10%
15%
20%
25%
2001 2002 2003 2004 2005 2006 2007 2008 2009
Real GDP
Real income of population
Investments into fixed capital
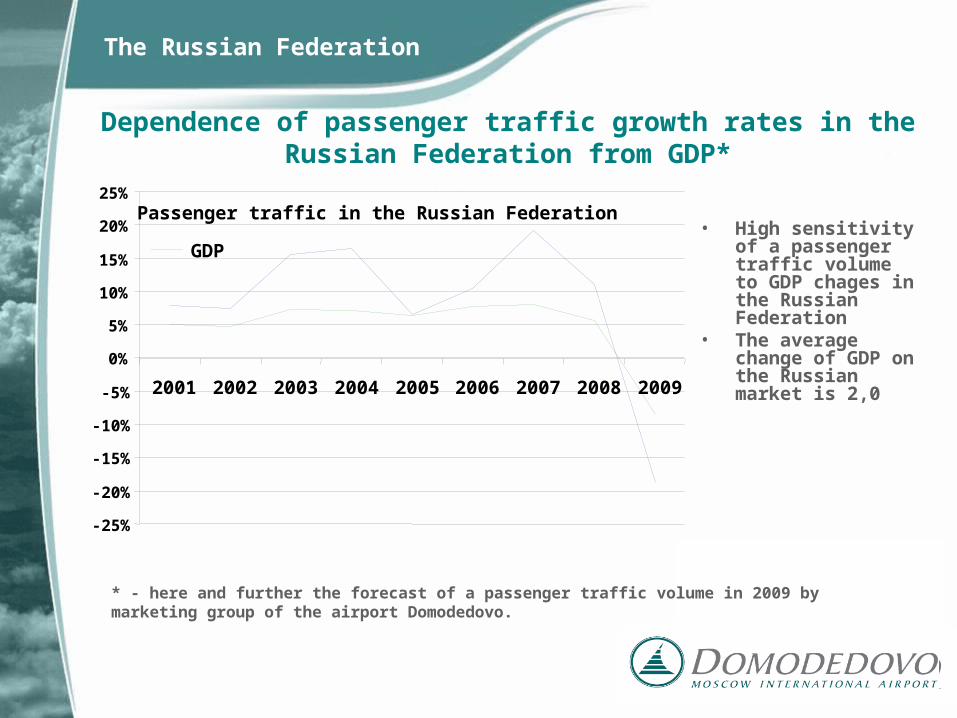
Dependence of passenger traffic growth rates in the Russian Federation from GDP*
The Russian Federation
* - here and further the forecast of a passenger traffic volume in 2009 by marketing group of the airport Domodedovo.
• High sensitivity of a passenger traffic volume to GDP chages in the Russian Federation
• The average change of GDP on the Russian market is 2,0
-25%
-20%
-15%
-10%
-5%
0%
5%
10%
15%
20%
25%
2001 2002 2003 2004 2005 2006 2007 2008 2009
Passenger traffic in the Russian Federation
GDP
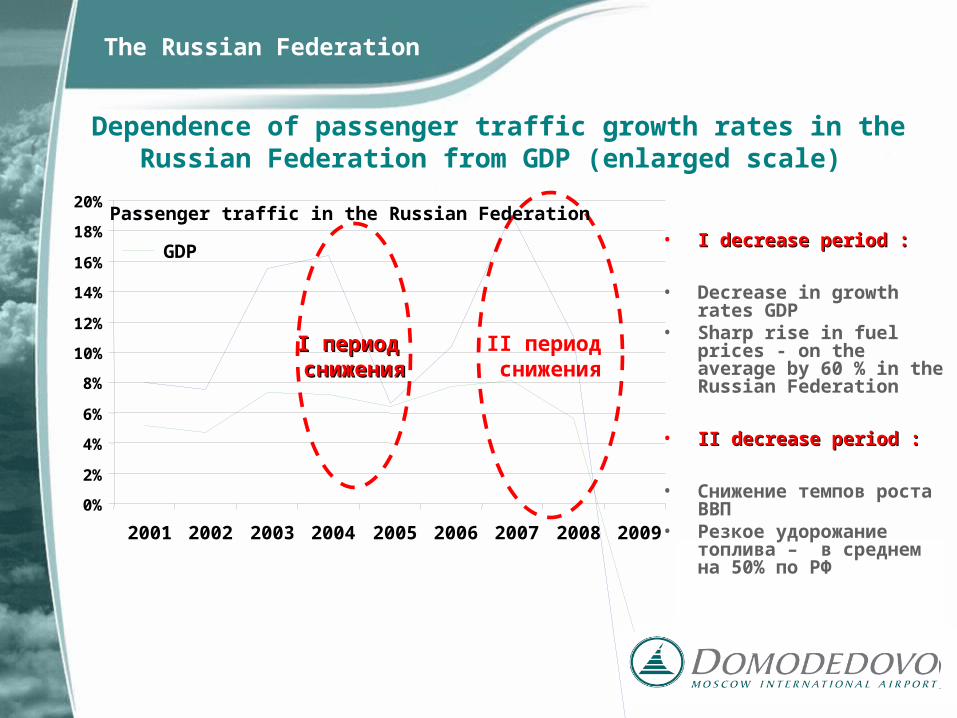
Dependence of passenger traffic growth rates in the Russian Federation from GDP (enlarged scale)
The Russian Federation
II период период сниженияснижения
II период снижения
• II decrease period decrease period ::
• Decrease in growth rates GDP
• Sharp rise in fuel prices - on the average by 60 % in the Russian Federation
• IIII decrease period decrease period ::
• Снижение темпов роста ВВП
• Резкое удорожание топлива – в среднем на 50% по РФ
0%
2%
4%
6%
8%
10%
12%
14%
16%
18%
20%
2001 2002 2003 2004 2005 2006 2007 2008 2009
Passenger traffic in the Russian Federation
GDP
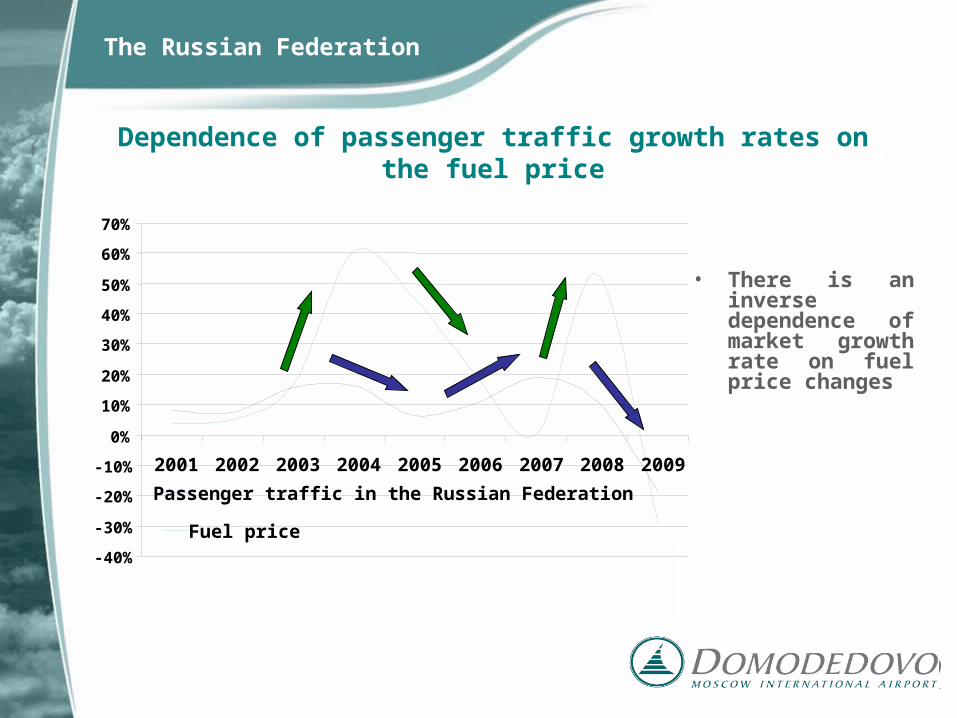
Dependence of passenger traffic growth rates on the fuel price
The Russian Federation
• There is an inverse dependence of market growth rate on fuel price changes
-40%
-30%
-20%
-10%
0%
10%
20%
30%
40%
50%
60%
70%
2001 2002 2003 2004 2005 2006 2007 2008 2009
Passenger traffic in the Russian Federation
Fuel price
-25%
-20%
-15%
-10%
-5%
0%
5%
10%
15%
20%
25%Пассажиропоток РФ
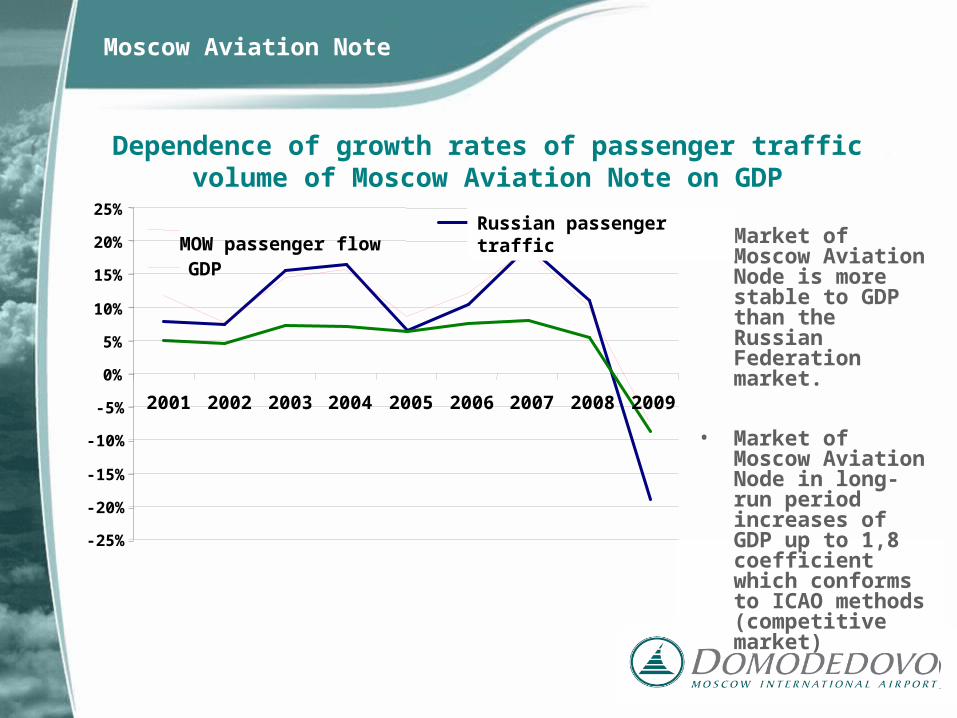
Dependence of growth rates of passenger traffic volume of Moscow Aviation Note on GDP
Moscow Aviation Note
• Market of Moscow Aviation Node is more stable to GDP than the Russian Federation market.
• Market of Moscow Aviation Node in long-run period increases of GDP up to 1,8 coefficient which conforms to ICAO methods (competitive market)
-25%
-20%
-15%
-10%
-5%
0%
5%
10%
15%
20%
25%
2001 2002 2003 2004 2005 2006 2007 2008 2009
MOW passenger flowGDP
Russian passenger traffic
-10%
-5%
0%
5%
10%
15%
20%
Пассажиропоток МВЛ МАУ
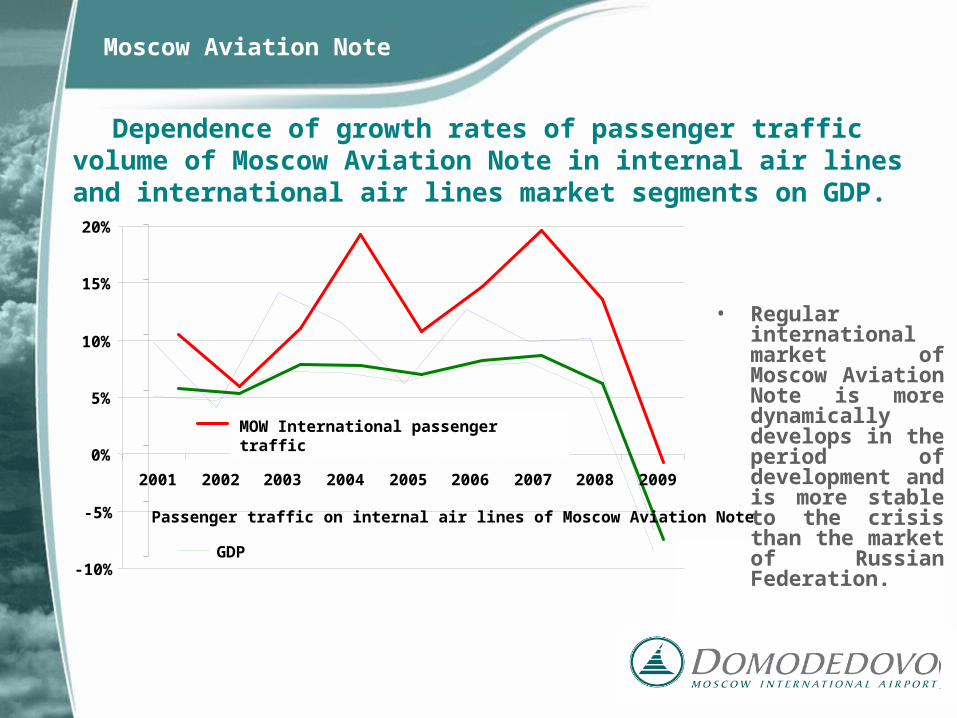
Dependence of growth rates of passenger traffic volume of Moscow Aviation Note in internal air lines and international air
lines market segments on GDP.
Moscow Aviation Note
• Regular international market of Moscow Aviation Note is more dynamically develops in the period of development and is more stable to the crisis than the market of Russian Federation.
-10%
-5%
0%
5%
10%
15%
20%
2001 2002 2003 2004 2005 2006 2007 2008 2009
Passenger traffic on internal air lines of Moscow Aviation Note
GDP
MOW International passenger traffic
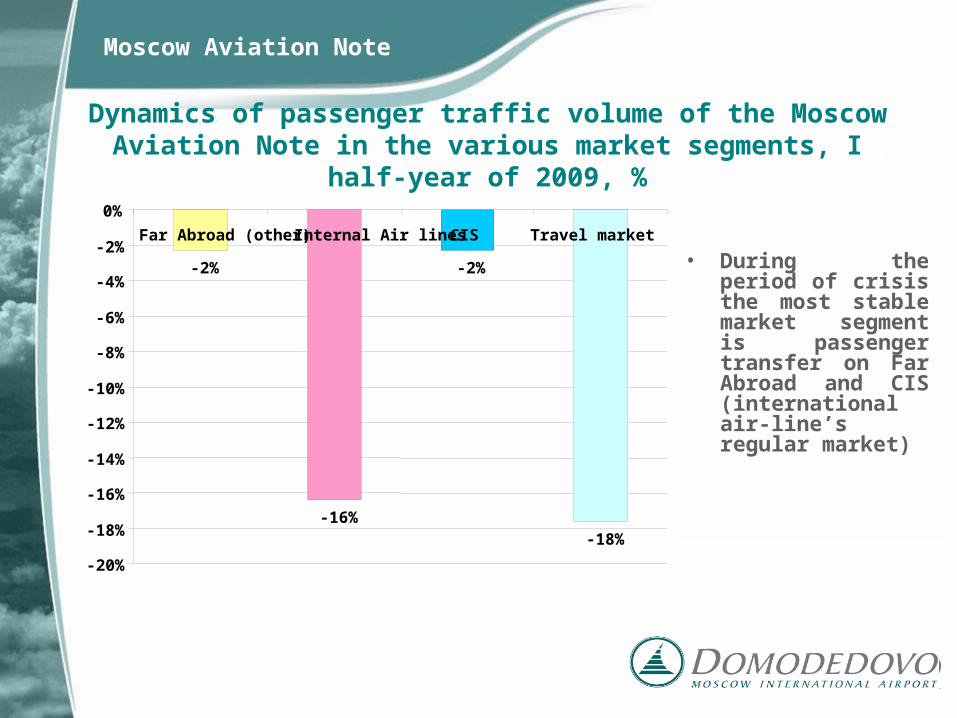
Dynamics of passenger traffic volume of the Moscow Aviation Note in the various market segments, I half-year of 2009, %
• During the period of crisis the most stable market segment is passenger transfer on Far Abroad and CIS (international air-line’s regular market)
Moscow Aviation Note
-2%
-16%
-2%
-18%
-20%
-18%
-16%
-14%
-12%
-10%
-8%
-6%
-4%
-2%
0%
Far Abroad (other) Internal Air lines CIS Travel market
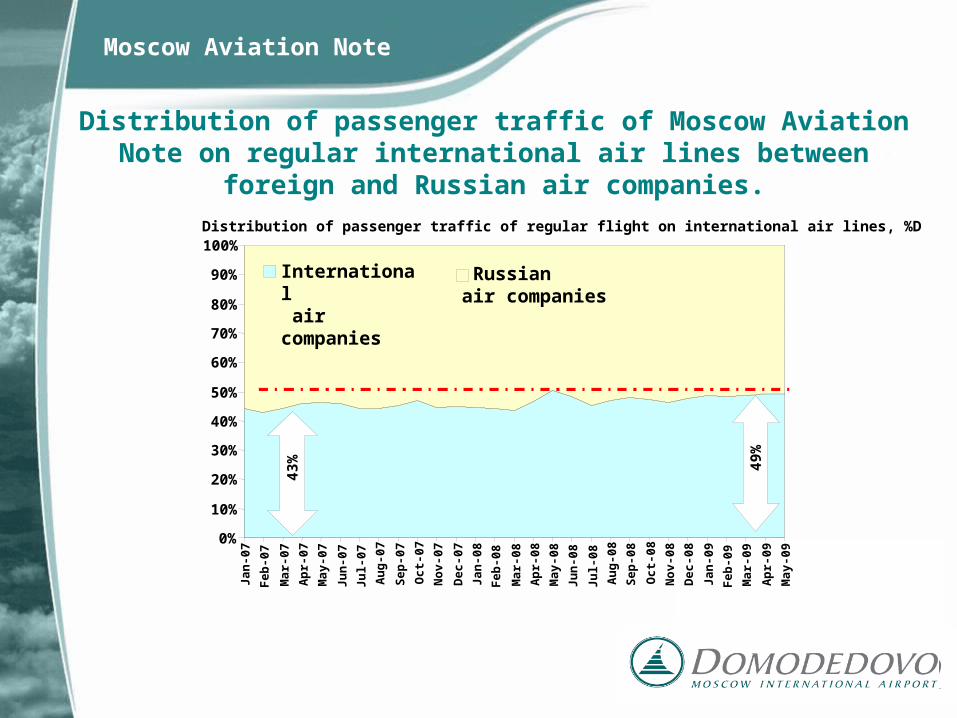
Distribution of passenger traffic of Moscow Aviation Note on regular international air lines between foreign and Russian air companies.
Moscow Aviation Note
Distribution of passenger traffic of regular flight on international air lines, %D
0%
10%
20%
30%
40%
50%
60%
70%
80%
90%
100%J
an
-07
Fe
b-0
7
Ma
r-0
7
Ap
r-0
7
Ma
y-0
7
Ju
n-0
7
Ju
l-0
7
Au
g-0
7
Sep
-07
Oct
-07
No
v-0
7
Dec
-07
Ja
n-0
8
Fe
b-0
8
Ma
r-0
8
Ap
r-0
8
Ma
y-0
8
Ju
n-0
8
Ju
l-0
8
Au
g-0
8
Sep
-08
Oct
-08
No
v-0
8
Dec
-08
Ja
n-0
9
Fe
b-0
9
Ma
r-0
9
Ap
r-0
9
Ma
y-0
9
International air companies
Russian air companies
43% 49
%
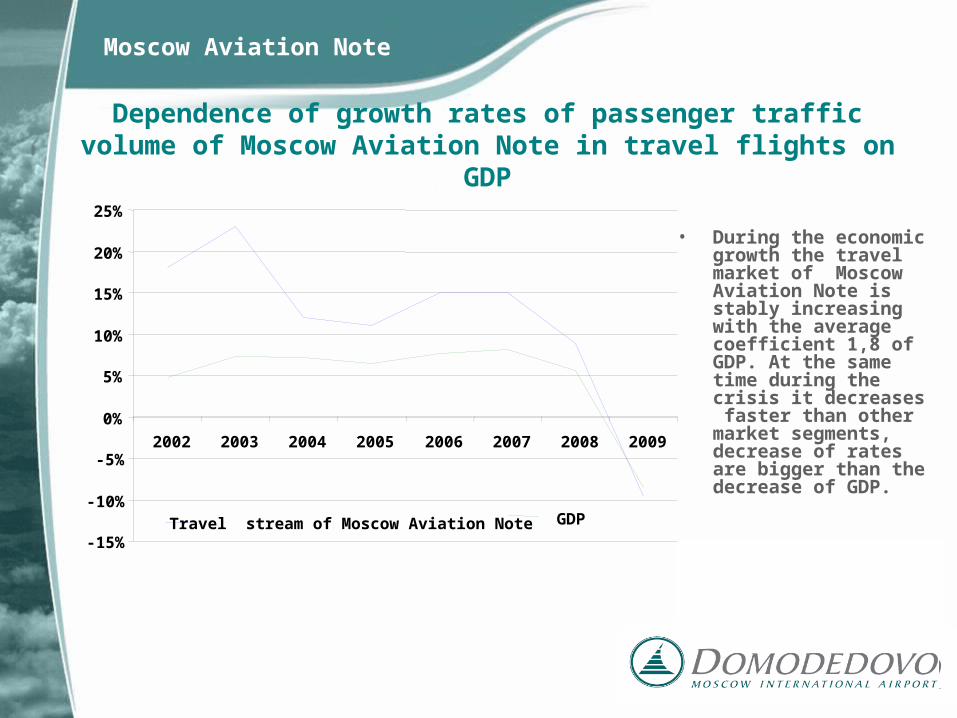
Dependence of growth rates of passenger traffic volume of Moscow Aviation Note in travel flights on GDP
Moscow Aviation Note
• During the economic growth the travel market of Moscow Aviation Note is stably increasing with the average coefficient 1,8 of GDP. At the same time during the crisis it decreases faster than other market segments, decrease of rates are bigger than the decrease of GDP.
-15%
-10%
-5%
0%
5%
10%
15%
20%
25%
2002 2003 2004 2005 2006 2007 2008 2009
Travel stream of Moscow Aviation Note GDP
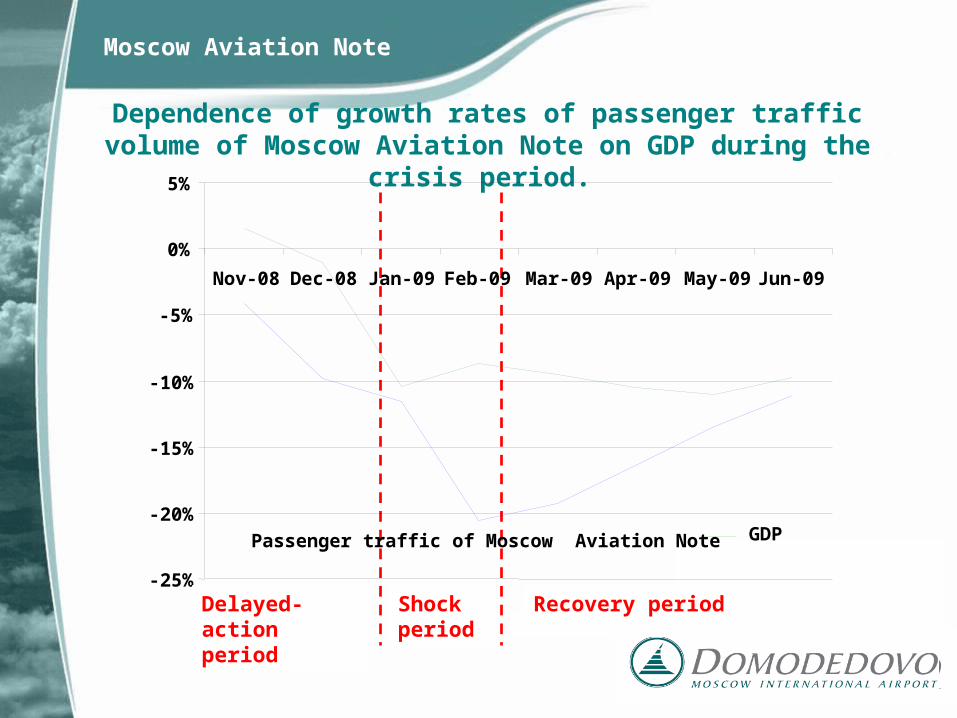
Dependence of growth rates of passenger traffic volume of Moscow Aviation Note on GDP during the crisis period.
Moscow Aviation Note
Инерционный период
Восстановительныйпериод
Шоковый период
-25%
-20%
-15%
-10%
-5%
0%
5%
Nov-08 Dec-08 Jan-09 Feb-09 Mar-09 Apr-09 May-09 Jun-09
Passenger traffic of Moscow Aviation Note GDP
Delayed-action period
Shock period
Recovery period
-25%
-20%
-15%
-10%
-5%
0%
5%
10%
15%
20%
25%Пассажиропоток МАУ
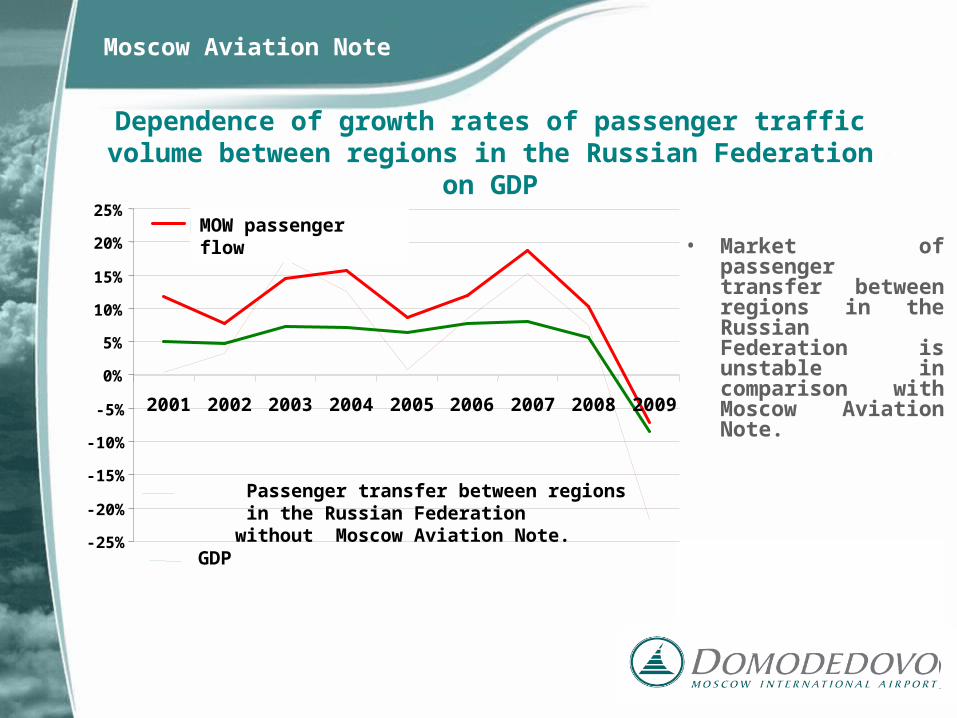
Dependence of growth rates of passenger traffic volume between regions in the Russian Federation on GDP
Moscow Aviation Note
• Market of passenger transfer between regions in the Russian Federation is unstable in comparison with Moscow Aviation Note.
-25%
-20%
-15%
-10%
-5%
0%
5%
10%
15%
20%
25%
2001 2002 2003 2004 2005 2006 2007 2008 2009
Passenger transfer between regions in the Russian Federation without Moscow Aviation Note.
GDP
MOW passenger flow
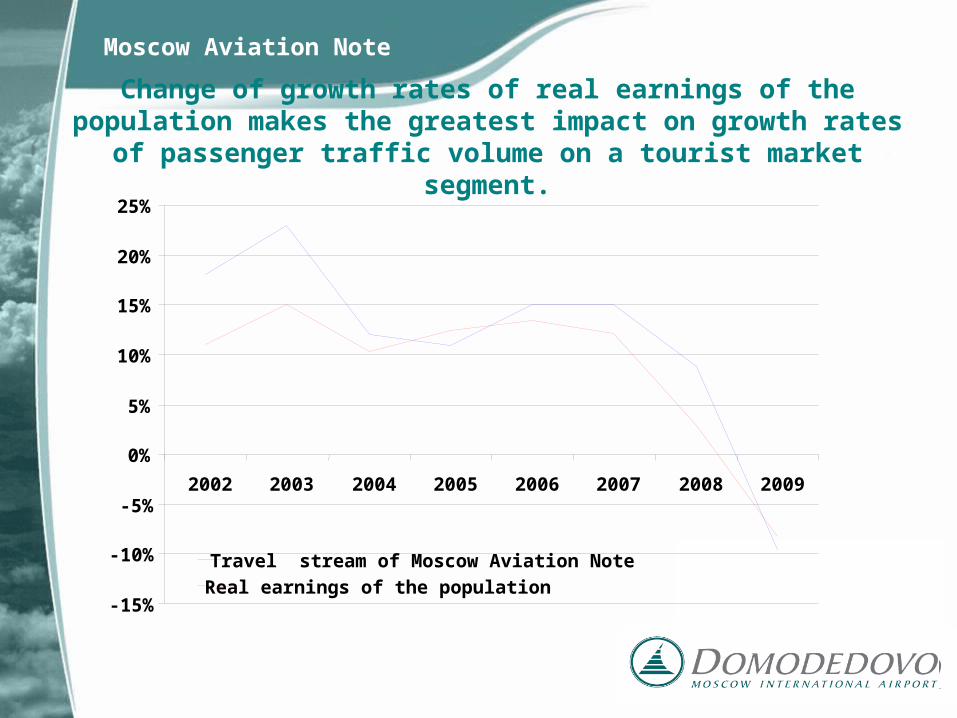
Change of growth rates of real earnings of the population makes the greatest impact on growth rates of passenger traffic volume
on a tourist market segment.
Moscow Aviation Note
-15%
-10%
-5%
0%
5%
10%
15%
20%
25%
2002 2003 2004 2005 2006 2007 2008 2009
Travel stream of Moscow Aviation Note
Real earnings of the population
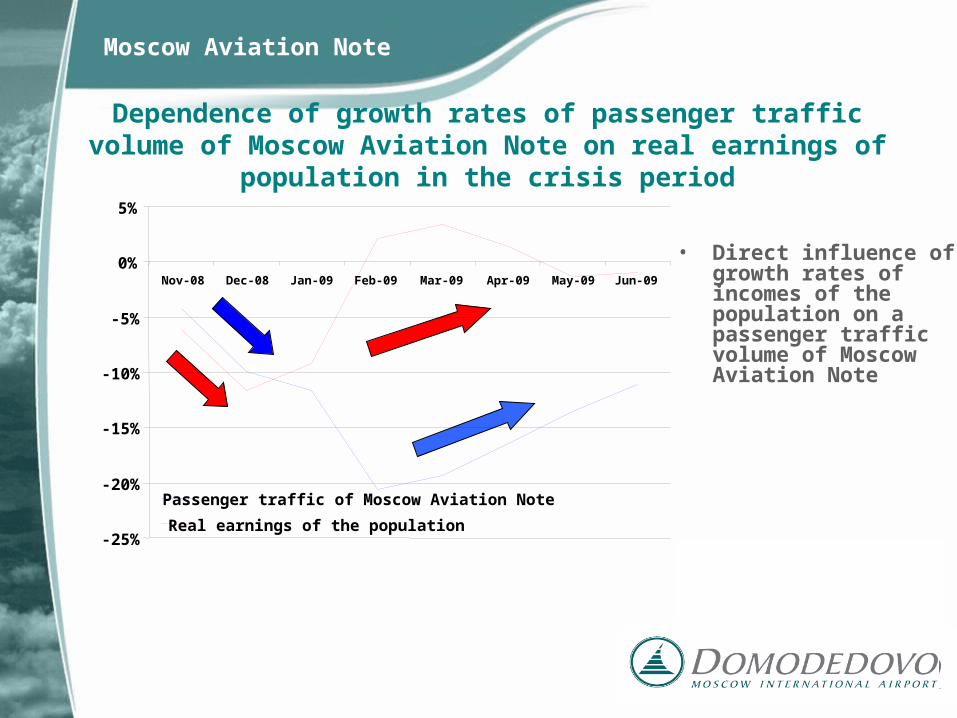
Dependence of growth rates of passenger traffic volume of Moscow Aviation Note on real earnings of population in the crisis
period
• Direct influence of growth rates of incomes of the population on a passenger traffic volume of Moscow Aviation Note
Moscow Aviation Note
-25%
-20%
-15%
-10%
-5%
0%
5%
Nov-08 Dec-08 Jan-09 Feb-09 Mar-09 Apr-09 May-09 Jun-09
Passenger traffic of Moscow Aviation Note
Real earnings of the population
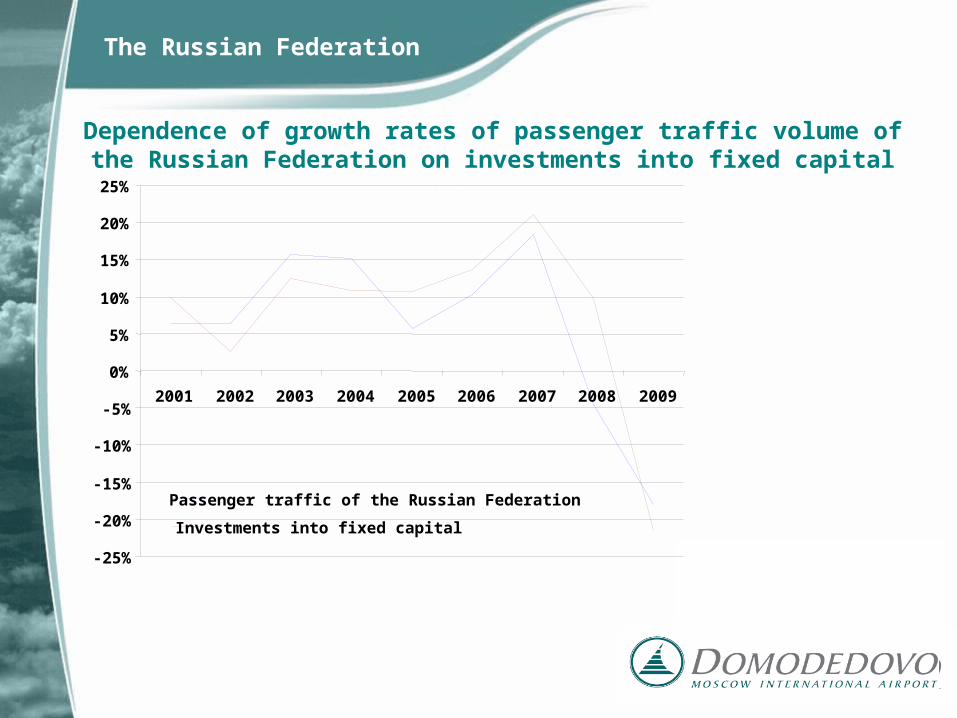
Dependence of growth rates of passenger traffic volume of the Russian Federation on investments into fixed capital
The Russian Federation
-25%
-20%
-15%
-10%
-5%
0%
5%
10%
15%
20%
25%
2001 2002 2003 2004 2005 2006 2007 2008 2009
Passenger traffic of the Russian Federation
Investments into fixed capital
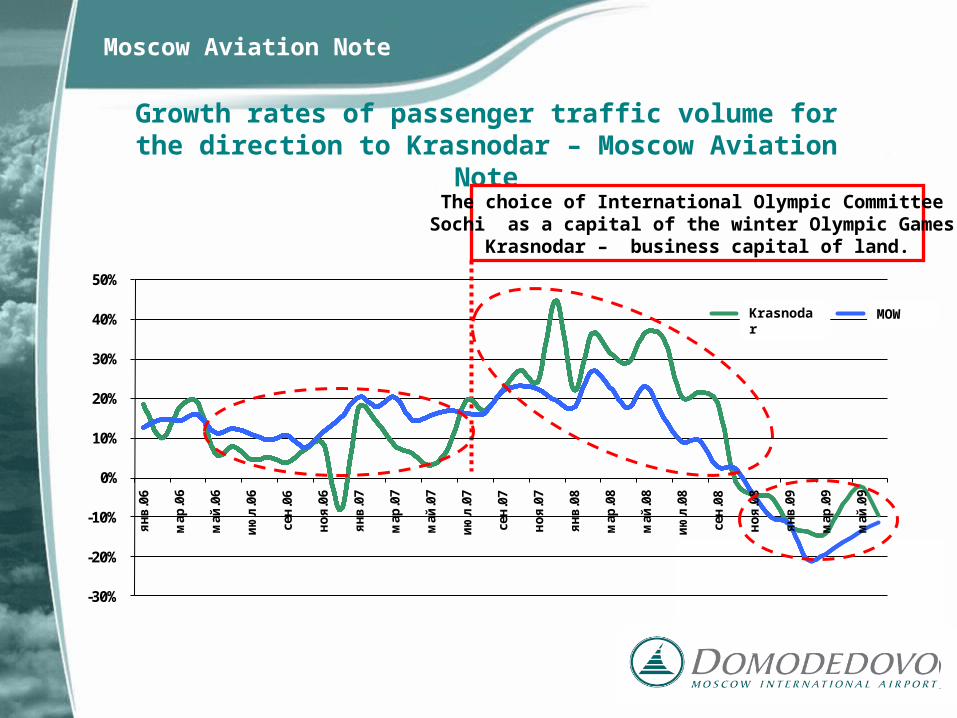
Growth rates of passenger traffic volume for the direction to Krasnodar – Moscow Aviation Note
The choice of International Olympic Committee Sochi as a capital of the winter Olympic Games.
Krasnodar – business capital of land.
Moscow Aviation Note
-30%
-20%
-10%
0%
10%
20%
30%
40%
50%
ян
в.0
6
мар
.06
май
.06
ию
л.0
6
сен
.06
но
я.0
6
ян
в.0
7
мар
.07
май
.07
ию
л.0
7
сен
.07
но
я.0
7
ян
в.0
8
мар
.08
май
.08
ию
л.0
8
сен
.08
но
я.0
8
ян
в.0
9
мар
.09
май
.09
Краснодар МАУKrasnodar MOW
-25%
-20%
-15%
-10%
-5%
0%
5%
10%
15%
20%
25%
ВВП
-25%
-20%
-15%
-10%
-5%
0%
5%
10%
15%
20%
25%
Реальные доходы населения
-25%
-20%
-15%
-10%
-5%
0%
5%
10%
15%
20%
25%
Инвестиции в основной капитал
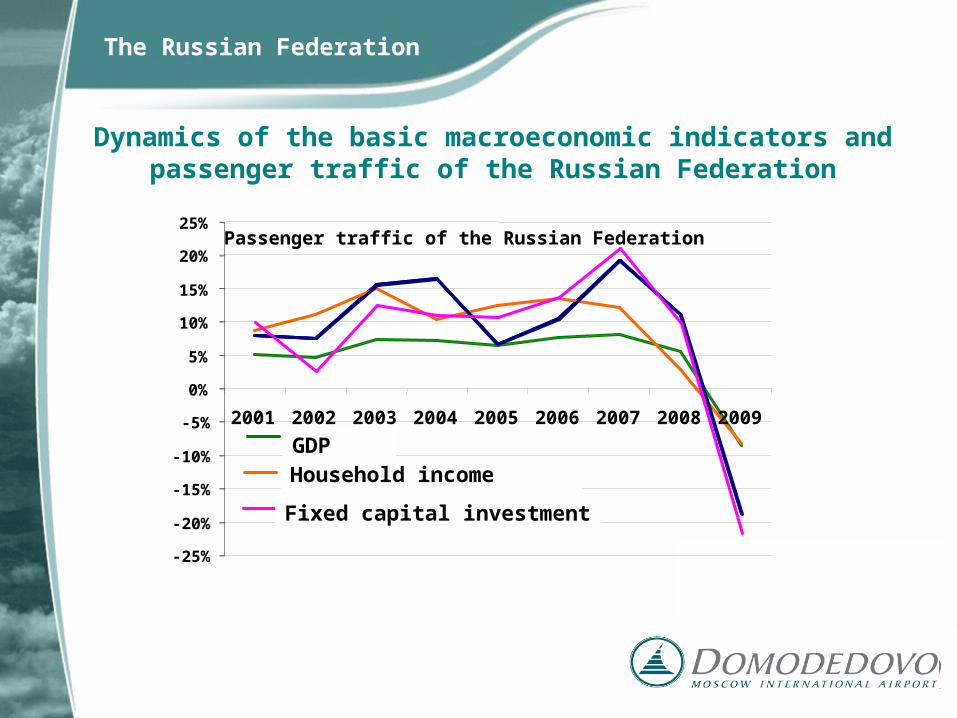
The Russian Federation
Dynamics of the basic macroeconomic indicators and passenger traffic of the Russian Federation
-25%
-20%
-15%
-10%
-5%
0%
5%
10%
15%
20%
25%
2001 2002 2003 2004 2005 2006 2007 2008 2009
Passenger traffic of the Russian Federation
Household income
Fixed capital investment
GDP
Thank you!