Embed Size (px)
Citation preview

AOTW: METHOD EVALUATING AND MONITORING AIRLINE PROCEDURES
1
AVAILABLE OPERATIONAL TIME WINDOW (AOTW):
A METHOD FOR EVALUATING AND MONITORING AIRLINE PROCEDURES
Abstract:
Airline Standard Operational Procedures (SOP) define the sequence of flight crew actions to handle the
set of mission situations that can emerge in the execution of a commercial airline flight. Failure to
complete an SOP within an Allowable Operational Time Window (AOTW) can result in a hazardous
outcome. For dynamic plants (e.g. airliner) the AOTW is a distribution that varies with the interaction
between environment, plant, and operator actions. For complex systems, such as airliners, the AOTW is
not always known a-priori and can change over time without notification.
This paper describes a method to characterize the AOTW distribution for procedures using data
traditionally used for maintenance and performance analysis. A three step process is described: identify
time-critical events with hazardous outcomes, map time-stamped data to the events, and generate
AOTW time distributions. A case study analysis of a procedure for airline operations demonstrates how
the AOTW can be used for procedure design and for monitoring procedure efficacy in a way that
supplements existing anomaly detection analyses by capturing changes in the operational environment
that affect the execution of the procedures. The implication of these results for monitoring safety
margins and the limitations of this method are discussed.

AOTW: METHOD EVALUATING AND MONITORING AIRLINE PROCEDURES
2
SECTION 1 INTRODUCTION
Airline flight deck operations are governed by airline Standard Operating Procedures (SOPs). These SOPs
identify the flight crew actions in response to plausible situations that might emerge in the execution of
a revenue-service airline flight. By standardizing procedures, the airline can ensure safe and efficient
operations that are in adherence to its overall operational philosophy and policies [1], [2]. The SOPs also
enable crew members to be paired with other crew members with whom they may have never flown
before, and to provide the basis for objective flight crew proficiency evaluation.
The SOPs, categorized into normal, non-normal procedures, specify: (1) what task to perform, (2) when
to perform the task (timing and sequence), (3) what actions are required to perform the task, (4) who
conducts the task (i.e. pilot-flying (PF) or pilot-monitoring (PM)), and (5) what feedback to provide (i.e.,
call-outs) [1], [2].
The Federal Aviation Administration (FAA) Advisory Circular AC 120-71A “Standard Operating
Procedures for Flight Deck Crewmembers” provides guidelines on the background, basic concepts, and
philosophy of SOPs [3], [4]. To meet these guidelines, SOPs must be carefully designed to maintain
appropriate workload by ensuring the sequential execution of actions and by ensuring the correct
information is available before it is required in the procedure [2]. For example, during a segment of the
takeoff procedure, between aircraft rotation (i.e. nose-up) and the first flap retraction airspeed, the
flight crew must accomplish the following tasks in the exact sequence to establish the required aircraft
state before the next task can be performed: (1) climb at the required pitch angle, (2) maintain the
required airspeed, (3) raise the landing gear, (4) engage the autopilot, (5) select the NAV mode on the
autopilot, (6) reduce thrust, and (7) set a new airspeed target on the autopilot Mode Control Panel
(MCP).

AOTW: METHOD EVALUATING AND MONITORING AIRLINE PROCEDURES
3
Most often, procedures are designed by the aircraft manufacturer with primary, if not exclusive,
attention to intended use of aircraft systems and the engineering requirements. The procedures are
then adapted by the airlines to reflect company philosophy, policy, and the type and location of
operations. The modified procedures are vetted by a team of experts with human factors, aircraft
systems, and operations knowledge. Following the review process, the procedures can be validated
empirically by testing them against the behavior of regular pilots [1, page 51]. The test takes place in a
flight simulator using a sample of the target population of pilots to serve as subjects for the test. Due to
the complexity of the operating environment, even a well-funded test with 20 flight crews, may not be
able to cover all the plausible scenarios that can occur that constrain the design of a procedure.
A significant part of procedure design is making sure the actions can be completed within the Allowable
Operational Time Window (AOTW) defined by the circumstances of each flight. However, due to the
complex environment in which the procedure is performed, the AOTW is not a fixed time but a time
distribution that can exhibit a large variance (Figure 1). The variance is a result of a large number of
uncontrollable factors including: aircraft performance, atmospheric conditions, ATC instructions, and air
traffic.
Likewise, the time to complete the SOP actions, known as Time on Procedure (ToP), can vary due to
factors such as individual technique, variability in attention and reaction times, and fatigue (Figure 1).
When the ToP is in excess of the AOTW it may be of no consequence, or it may place the aircraft in a
potentially hazardous situation (e.g. flap over speed, altitude deviation), or result in an inefficiency (e.g.
extra leg in a Holding Pattern, extended along-track distance, go-around).
The difference between the 95th %-tile of the ToP and the 5th %-tile of the AOTW is the Procedure Buffer
Time (PBT) [5]. When the PBT is less than zero, the degree to which the right tail of the distribution for
ToP overlaps the left tail of the distribution for AOTW determines the probability of failure to complete

AOTW: METHOD EVALUATING AND MONITORING AIRLINE PROCEDURES
4
the procedure on time (Figure 1). A probability of failure to complete the procedure above a design
threshold (e.g. 0.05) could therefore serve as a quantitative indication that the procedure needs to be
modified.
From a procedure design standpoint, the designer must have knowledge of the AOTW. Not just the
mean, but also, critically, the 5th percentile which serves as the shortest time to complete the procedure.
Information on the AOTW is not readily available. However, the recent availability of Flight Data
Monitoring (FDM)/Flight Operations Quality Assurance (FOQA), typically used for aircraft performance
and maintenance purposes, provides a means to measure the AOTW. This paper describes a three step
method for calculating the AOTW distribution for use in procedure design.
Figure. 1. Distributions for Time-on-Procedure (ToP) relative to the Allowable Operational Time Window (AOTW). The difference between the 95th %-tile for ToP and the 5th %-tile of the AOTW is the Procedure Buffer Time (PBT).
To demonstrate the application of the method for design and monitoring the efficacy of procedures, a
case study of the SOPs for the takeoff procedure for a jet aircraft was conducted. The case study
Allowable Operational Time Window (AOTW)
Time
Time-on-Procedure(T-o-P)
Probability of Failure to Complete
Allowable Operational Time Window (AOTW)
Time
Time-on-Procedure (T-o-P)
95th %-tile 5th %-tile
Procedure Buffer Time > 0
Freq
uen
cyFr
equ
ency
Procedure Buffer Time < 0

AOTW: METHOD EVALUATING AND MONITORING AIRLINE PROCEDURES
5
highlighted the variance in the AOTW for four segments of a procedure that ranged from 28% of the
mean to 60% of the mean. At worst case, this yielded 5.39 SOP actions per second. At best case, one
SOP action every two seconds. The AOTW for one of the segments exhibited a bi-modal time
distribution that was a result of a change in air traffic operations at one location. This change was
managed by an adaptation to the procedure by the flight crews in the field that extended the AOTW to
allow for the interruption. This change had not migrated to a change in the procedures.
This paper is organized as follows: Section 2 describes the process for identifying segments of a
procedure. Section 3 describes the data and method to generate the statistics for the AOTW. Section 4
describes a case-study for the takeoff procedure for a jet aircraft. Section 5 provides a discussion of the
implications of this method.
SECTION 2: DETERMINING SEGMENTS OF A PROCEDURE
An airline SOP can be defined as a sequence of actions. These actions include: (1) physical/motor actions
(e.g. select NAV1 button, place hand on throttles, set autopilot speed to 146 knots), (2) call-outs (e.g.
“GEAR UP”), and (3) perceptual actions (e.g. visually check FMA “AP” is green). Many of these actions
must be completed before a specific operational event to avoid a hazardous outcome such as an over
speed (e.g. flap overspeed on takeoff), violating airspace restrictions (e.g. altitude deviation, turn radius
deviation), and separation restrictions or unstable approach resulting in a go-around.
One class of these events are generally associated with the position of the aircraft in three-dimensional
space. For example, failure to raise the Clearance Altitude prior to reaching the altitude capture point
can result in an altitude deviation [6], or failure to perform actions can result in separation or airspace
violations. Another class of these events is associated with aircraft trajectory. For example, failure to

AOTW: METHOD EVALUATING AND MONITORING AIRLINE PROCEDURES
6
retract the flaps prior to reaching the maximum safe operating airspeed for the current flap setting can
result in a flap over speed hazard.
Events associated with hazardous or inefficient outcomes are considered time-critical hazard events and
define the segments of a procedure. For example, the events associated with the Takeoff procedure for
a jet (see Appendix A) and their potential hazardous outcomes are illustrated in Figure 2.
FIGURE 2: Summary of takeoff SOP for jet airliner. SOP includes 79 actions that can be divided into 4 segments determined by time-critical events
An analysis of the actions in a Flaps 24 takeoff procedure, listed in Appendix A, identified time critical
hazard events: 80 knots, V1, VR, VF18 and VF0. Four segments of the procedure between these events are
summarized in Table 1.
TABLE 1: Example SOP Events and Segments
Speed for Flap Retraction
Current Speed and Trend Vector
80 Knots V1 VR
VflapRetract
VflapRetract
Obstacle
Gear Up
350’ AGL
Altitude
Flaps 18
Flaps Zero
Gear Up
80 Knots
V -ONE
ROTATE
Not Drawn to Scale
Runway
XXXX 123 Runway 16, cleared for
Takeoff
ATC
Hazard Events
1,500’ AGL
Engage AP NAV 1
Climb Nor/Max
Set
Roll Rotate Climb-out Flaps 24 to 18
Engage AP NAV 1

AOTW: METHOD EVALUATING AND MONITORING AIRLINE PROCEDURES
7
Time-critical Hazard
Events
Segment of Procedure Outcome
80 knots to V1 Roll Hazard: runway excursion
Hazard: Insufficient thrust
V1 to VR Rotate Hazard: stall from early rotate,
extended takeoff roll for early rotate
Hazard: obstacle clearance from late
rotate
Hazard: tail strike
VR to VF18 (schedule
speed for flap retraction
from 24⁰ to 18⁰)
Climb-out
Hazard: flap over speed from late
retraction
Hazard: stall from early retraction of
flap
VF18 to VF0 (schedule
speed for flap retraction
from 18⁰ to 0⁰)
Flap Retraction
Hazard: flap over speed from late
retraction
Hazard: stall from early retraction of
flap
SECTION 3: CALCULATING THE AOTW DISTRIBUTION This section describes the FDM/FOQA data and the method used to derive the AOTW distribution.
Data FDM or FOQA data can provide time-stamp for each event. The time stamp is the time when the event
occurred. For example, the time that the aircraft achieve the V1 speed. Example FDM/FOQA data and
time stamps are shown in Appendix B.
Calculating the AOTW Distribution between Critical Events (i.e. Segments)

AOTW: METHOD EVALUATING AND MONITORING AIRLINE PROCEDURES
8
The AOTW for Segment 𝑥, flight i, or 𝐴𝑂𝑇𝑊 (𝑥𝑖) is the difference between the time stamps for
sequential critical events in a flight.
𝐴𝑂𝑇𝑊 (𝑥𝑖) = 𝑡@𝐶𝑟𝑖𝑡𝑖𝑐𝑎𝑙 𝑃𝑜𝑖𝑛𝑡(𝑖,2) − 𝑡@𝐶𝑟𝑖𝑡𝑖𝑐𝑎𝑙 𝑃𝑜𝑖𝑛𝑡(𝑖,1)
Where: 𝑖 𝑖𝑠 𝑡ℎ𝑒 𝑓𝑙𝑖𝑔ℎ𝑡 𝑖𝑛𝑑𝑒𝑥
The distribution for AOTW for each Segment, across all flights is the aggregation of these flights. The
statistical parameters of this distribution can be calculated as follows:
To characterize the AOTW, measures and metrics were defined:
(1) the number of SOP actions done by the flight crew between two critical events
(2) the 5th percentile of the AOTW distribution as a measure to how fact the segment can get
5𝑡ℎ 𝑝𝑒𝑟𝑐𝑒𝑛𝑡𝑖𝑙𝑒 𝐴𝑂𝑇𝑊 (𝑥) = 𝜇𝐴𝑂𝑇𝑊 + 𝑍0.05 ∗ 𝜎𝐴𝑂𝑇𝑊
(3) the 95th percentile to have a sense of the right tail of the distributions, or the slower cases
95𝑡ℎ % − 𝑡𝑖𝑙𝑒 𝐴𝑂𝑇𝑊 (𝑥) = 𝜇𝐴𝑂𝑇𝑊 + 𝑍0.95 ∗ 𝜎𝐴𝑂𝑇𝑊
(4) median
𝑀𝑒𝑑𝑖𝑎𝑛 𝐴𝑂𝑇𝑊 (𝑥) = {(𝑛 + 1)
2}
𝑡ℎ
𝑉𝑎𝑙𝑢𝑒
(5) mean
𝑀𝑒𝑎𝑛 𝐴𝑂𝑇𝑊 (𝑥) = ∑ 𝐴𝑂𝑇𝑊(𝑥)𝑛
𝑖
𝑛
Where:
𝑖 𝑖𝑠 𝑡ℎ𝑒 𝑓𝑙𝑖𝑔ℎ𝑡 𝑖𝑛𝑑𝑒𝑥
n is the number of total recorded flights
x is the procedure segment
(6) standard deviation

AOTW: METHOD EVALUATING AND MONITORING AIRLINE PROCEDURES
9
(7) skew are the parameters that enable the visualization of the distribution, and the metrics
(8) Signal-to-Noise Ratio to measure the variability relative to the mean
(9) Action Tempo is the fraction of the number of actions to the 5th percentile as an estimation
the workload.
Action Temp = (𝐴𝑐𝑡𝑖𝑜𝑛𝑠5𝑡ℎ 𝑃𝑒𝑟𝑐𝑒𝑛𝑡𝑖𝑙𝑒 𝑇𝑖𝑚𝑒⁄ ).
SECTION 4: CASE STUDY – TAKEOFF PROCEDURE The Takeoff Procedure for a jet aircraft is one of the most complex procedures in the airline revenue
service mission. The aircraft must generate sufficient lift to become airborne within the constraints of
the runway length and aircraft performance, and then climbout with sufficient lift to generate a climb
rate that will avoid obstacles (Figure 2). During this procedure the aircraft is physically reconfigured from
“ground operations” to “airborne operations” by retracting the landing gear and by retracting the high
lift (but high drag) flaps on the wings to configure the wings for low drag flight. The procedure includes
several time-critical events with potential for hazardous outcomes summarized in Figure 2 and Table 1
above.
The SOP for the takeoff procedure for a jet aircraft, listed in Appendix A, is described by 79 actions.
These actions include physical/motor actions (e.g. select Flaps 18⁰), verbal communication (e.g. call
outs) and perceptual actions (e.g. visual check of parameter). Although not shown as part of the
procedure, all of the actions are associated with various types of cognitive demands (e.g. decision-
making).

AOTW: METHOD EVALUATING AND MONITORING AIRLINE PROCEDURES
10
FDM data for 5,312 departures for a jet aircraft were analyzed. Among these, 1,042 flights were
performed with 24⁰ flap configuration for takeoff and departed from multiple airports. The flights
occurred between January 2014 and June 2014.
The analysis of the Takeoff Procedure identified 5 time-critical events associated with hazardous
outcomes (Table 1 above).
Results
The AOTW for the 4 segments of the Takeoff procedure are summarized in Table 2. The Takeoff Roll
segment from 80 knots the V1 decision airspeed has 7 SOP actions. The AOTW for the actions ranges
between 0 seconds and 18 seconds depending on the acceleration of the aircraft based on aircraft
performance, runway conditions and weather. The distribution skewed with a right tail. To meet the 5th
percentile AOTW, the flight crew would need to perform 2.8 SOP actions per second. This is an
estimation of the tempo at which the flight crew should perform their actions in the fastest operations.
The Rotate segment of the procedure has 3 SOP actions. The AOTW ranges between 0 and 8.5 seconds.
The distribution is symmetrical with a median of 3.3 seconds and a mean of 3.4 seconds. To meet the 5th
percentile AOTW tempo, the flight crew would need to perform 2.4 SOP actions per second.
The Climbout segment from rotation speed to the speed to retract flaps from 24⁰ to 18⁰, is the highest
workload segment with 27 SOP actions. These SOP actions include: gear-up, engage autopilot, engage
NAV, thrust reduction, and setting the speed on the MCP. The AOTW ranges between 3.5 and 97
seconds. The distribution is skewed to the right with a median of 8.5 seconds and a mean of 20.9
seconds. To meet the 5th percentile AOTW tempo, the flight crew would need to perform 5.39 SOP
actions per second.

AOTW: METHOD EVALUATING AND MONITORING AIRLINE PROCEDURES
11
The Flaps Retraction segment from the speed to retract flaps from 18⁰ to 0⁰ has 13 SOP actions. The
AOTW ranges between 23.8 and 288.8 seconds. The distribution is skewed to the right with a median of
109.6 seconds and a mean of 6.5 seconds. To meet the 5th percentile AOTW tempo, the flight crew
would need to perform 0.2 SOP actions per second.
TABLE 2: Summary of AOTW Statistics AOTW Distributions (sec.)
Segments
Critical Events
SOP
act
ion
s in
th
is S
egm
en
t
5th
% t
ile
Me
dia
n
Me
an
95
% t
ile
Std
.
Skew
Sign
al-t
o-N
ois
e
5th
%ti
le A
ctio
n
Tem
po
(𝒔
𝒆𝒄
−𝟏
)
Roll (80 kts. to V1)
Hazard: V1 is final decision event to abort takeoff and stop the aircraft before the end of the runway 7 2.5 6.3 6.5 12.5 2.6 1.1 2.5 2.80
Rotate (V1 to VR)
Efficiency: VR is the airspeed to pitch the aircraft up to climb (i.e. rotate) 3 1.3 3.3 3.4 6.0 1.4 0.4 2.4 2.40
Climbout (VR to VF18)
Hazard: VF18 is the airspeed at which the Flaps must be retracted
(from 24⁰) to 18⁰ to avoid an over speed 27 5.0 8.5 20.9 73.2 22.4 1.5 0.9 5.39
Flap 18 to 0 (VF18 to VF0)
Hazard: VF0 is the airspeed at which the Flaps must be fully retracted (i.e. Zero degrees) to avoid an over speed 13 66.1 109.6 118.5 189.0 42.0 0.6 0.2 0.20
The AOTW time distributions for each of the 4 segments of the procedure are shown in Figure 3.
The distribution for V1 to VR segment is symmetric. However, the other 3 segments are asymmetric
with long right-tailed distributions.

AOTW: METHOD EVALUATING AND MONITORING AIRLINE PROCEDURES
12
The distribution for the Flap Retraction segments (i.e.: from VF18 to VF0), in particular exhibits a bimodal
form. Analysis of aircraft dynamics for this segment showed that service operating out a specific airport
required an immediate turn during the takeoff procedure. Although not specified explicitly in the
procedure, company procedure is to add 10 knots to the Flap Retract target speed and delay the
retraction of the flaps until the aircraft is wings level. In this data set 44% of the flights performed a turn
and retracted flaps later than the standard schedule speed, resulting in a longer AOTW and a change of
workload. Although the flight crews routinely perform this procedure without issues using guidance in
other parts of the operator procedure manual, the deviation from the procedure is not explicitly
documented in the takeoff procedure. In this case the additional 10 knots is sufficient delay to complete
the turn.
0
50
100
150
200
250
300
350
0 5
10
15
20
25
30
35
40
45
50
55
60
65
70
75
80
85
90
95
10
0
VR to VF18 (Climb out)
0
50
100
150
200
250
300
350
1 2 3 4 5 6 7 8 9 10 11 12 13 14 15 16 17 18 19 20
V1 to VR (Rotate)
0
50
100
150
200
250
300
350
1 2 3 4 5 6 7 8 9 10 11 12 13 14 15 16 17 18 19 20
80 to v1 (Roll)
0
5
10
15
20
25
30
35
1
16
31
46
61
76
91
10
6
12
1
13
6
151
16
6
18
1
19
6
21
1
22
6
241
25
6
27
1
28
6
VF18 to VF0 (Retract Flaps 24 to 18)
AOTW: METHOD EVALUATING AND MONITORING AIRLINE PROCEDURES
13
FIGURE 3: Distributions for the 4 segments of the Takeoff Procedure: (a) Takeoff Roll, (b) Rotate, (c) Climbout, and (d) Retract Flaps 24 to 18.
Table 3 summarizes the fit for each AOTW distribution for each segment. The Rotate segment has a Beta
distribution for AOTW with parameters of shape α=4.49 and β = 7.84. The Rotate segment data fits best
a Weibull distribution with parameters of scale of λ = 3.76, and shape k = 2.43. The Climbout segment fit
a lognormal distribution with mean μ = 17.5 and σ = 30.5. The Flaps Retraction segment as explained
above exhibits a bimodal distribution composed of gamma distribution with scale α = 17.2 and shape r =
6.88 and a beta distribution with shape α = 1.77 and β = 4.59 sec. These distributions can be used for the
design and testing of new or modified procedures. They can also be used as the reference for
monitoring trends in the field.
TABLE 3: Summary of AOTW Distribution Fit for each Segment
Segment Distribution Square Error Roll 18 * Beta (4.49, 7.84)
0.009127
Rotate Wei (3.76, 2.43) 0.010956
Climbout 3 + LnN (17.5, 30.5)
0.038238
Flaps Retraction Bimodal (Gamma + Beta) Gamma (17.2, 6.88); 90 + 199 * Beta (1.77, 4.59)
0.015141; 0.001706
SECTION 5 CONCLUSIONS The Available Operational Time Window (AOTW) distribution provides a means to establish the time
constraints for the design and evaluation of procedures. The AOTW also provides a powerful tool for
monitoring operations in the field to understand how the changes in the environment impact procedure
efficacy.
Design and Evaluation of Procedures

AOTW: METHOD EVALUATING AND MONITORING AIRLINE PROCEDURES
14
Traditional airline industry practices convert aircraft manufacturer’s procedures into airline specific
procedures. The airline procedures reflect company philosophies and policies as well as operational
constraints of airline network and locations. These procedures are generally vetted by subject matter
experts such as pilots, training specialists, human factors, aircraft systems and flight operations staff. In
some cases, procedures are tested in simulators by a sample of representative flight crews. For complex
procedures, the new procedures are tested in simulators with a larger sample size (e.g. 20 crews).
However, even under these circumstances, the full range of plausible scenarios in which the procedure
may be used cannot be covered.
The availability of FDM/FOQA data provides a powerful mechanism to provide the time distribution of
the Allowable Operational Time Window (AOTW) for the purpose of designing the procedure. It can
provide important information on the tempo and timing of the SOP actions in particular for the short
AOTW (i.e. 5th percentile AOTW).
Further, the AOTW explicitly provides data on the variability in time to complete the procedure that is
affected by weather conditions, aircraft performance, air traffic, etc. form a real-world environment.
This information is not always known by the SME and cannot be easily duplicated in simulator tests. This
information provides a critical constraint for the design of the procedure.
Monitoring Procedures Efficacy Use of FDM/FOQA data for monitoring operations is a widespread practice. This analysis generally takes
the form of anomaly detection such as unusual attitudes, speed deviations, mode changes are
identified. The AOTW can supplement this type of monitoring. It is different in four ways. First, the
AOTW reflects changes in environment such as air traffic control procedures that are not part of the
anomaly detection analysis. Second, the AOTW provides a measure of efficacy of the procedures that

AOTW: METHOD EVALUATING AND MONITORING AIRLINE PROCEDURES
15
may result in unusual attitudes and speed deviations. Third the AOTW accounts for stochastic nature of
the operations that can exhibit long tails that are not necessarily anomalies. Fourth, it provides a means
to monitor the trends over time. A hypothetical example, illustrated in Figure 4, shows the Statistical
Process Control (SPC) chart for AOTW for the Flap Retract segment of the takeoff procedure. A change in
the distribution reflects service to a new destination with air traffic control procedures that interrupt the
procedures and require a procedural adaptation by the flight crews. This change may be worthy of
review by the airline procedure designers.
FIGURE 4: Statistical Process Control Chart of AOTW identifies the operational change in the field that should be addressed by changes to the standard operating procedures. Limitations and Future Work The quality of the FDM/FOQA data is critical for accurate results. Data preprocessing must be conducted
to prune the data set of unreasonable values. The time and cost of this task should not be under
estimated. Further several critical parameters may not be available in the data and can be estimated
using kinematic models of aircraft performance.
Future work involves using the FDM/FOQA data and similar analytical techniques to quantify the Time-
on-Procedure (ToP) and make assessments of the Probability of Failure to Complete the procedure
0
50
100
150
200
250
0 100 200 300 400 500 600
AO
TW (
secs
)
DateStart of new operations
Change in ops results in bi-modal distribution

AOTW: METHOD EVALUATING AND MONITORING AIRLINE PROCEDURES
16
(PFtoC). These statistics form the basis for a quantitative measure of flight deck the workload in each
segment of the procedure. In addition, Monte Carlo simulation of the SOPs using empirically derived
distributions for each of the actions could be used to test procedures without extensive, expensive
human-in-the-loop testing [5], [7].
A data-mining algorithm can also be developed to monitor the AOTW at each operation (e.g. i.e.
departure runway) to create SPC charts that can be used to identify changes in operations.
Acknowledgements: The authors are grateful for the technical and editorial assistance from anonymous airline staff, Loukia Loukopoulou (San Jose State University), Immanuel Barshi (NASA), Mike Feary (NASA), Robert Mauro (Decision Research Inc.), Julia Trippe (University of Oregon), John Shortle, George Donohue, Anvardh Nanduri, Seungwon Noh, Zhenming Wang (Center for Air Transportation Systems Research at George Mason University). References [1] Barshi, I., R. Mauro, A. Degani, L. Loukopoulou (2016) Designing Flightdeck Procedures.
NASA/TM—2016–219421 [2] Degani, A., and E. Wiener (1997) Procedures in Complex Systems: The Airline Cockpit. IEEE
Transactions on Systems, Man, and Cybernetics—Part A: Systems And Humans, Vol. 27, No. 3, May 1997
[3] FAA (2016) AC 120-71B Standard Operating Procedures and Pilot Monitoring Duties for Flight Deck Crewmembers. AFS-200, Federal Aviation Administration, Washington. D.C.
[4] FAA (2003) AC 120-71A - Standard Operating Procedures for Flight Deck Crewmembers. AFS-
200, AFS-210, Federal Aviation Administration, Washington. D.C.
[5] Kourdali, H., L. Sherry (2016 )A System Engineering Method for Analysis and Simulation of Standard Operational Procedures In Proceedings 2016 HCIAero, Paris, France, September 14-16, 2016
[6] Learmount, D. (1994).A330 crash caused by series of small errors. Flight International: 6.Archived from the original on 18 July 2012. Retrieved 18 July 2012.
[7] Stimpson, A.J., J.C. Ryan, M.L. Cummings (2016) Assessing Pilot Workload in Single-Pilot Operations with Advanced Autonomy. In Proceedings of the Human Factors and Ergonomics Society 2016 Annual Meeting, Washington, D.C. Sept 19-23.

AOTW: METHOD EVALUATING AND MONITORING AIRLINE PROCEDURES
17
APPENDIX A: Note: Assume AC lined up on the runway ready for departure
1. ATC gives clearance to Takeoff: “XXX123, RNW16, cleared for takeoff”
2. PF reads back clearance “Cleared for takeoff, XXX123”
3. PM announces “TAKE-OFF”
4. PM announces “YOUR CONTROLS” simultaneously holds ailerons into wind
5. PF puts right hand on the nose wheel steering control and simultaneously keeps left hand on
lap, and simultaneously confirms “MY CONTROLS”
6. PM advances throttle levers
7. PM checks that all 4 engines accelerate symmetrically beyond 50% N1
8. PM activates auto throttles by means of TOGA buttons
9. PM checks FMA auto-throttle engagement: A/T green arc and FADEC trim arrow extinguished (if
applicable)
10. PF simultaneously checks FMA auto-throttle engagement: A/T green arc and FADEC trim arrow
extinguished (if applicable)
11. PM: before reaching 80 kts. Checks that take-off thrust is set
12. Needs time/aircraft dynamics awareness
13. PM: reports “TAKE-OFF THRUST SET”
14. PF verifies that takeoff thrust is set
15. PF confirms “CHECKED”
16. PM checks engine parameters throughout the take-off toll to be within limits
17. Aircraft Reaches 80 kts
18. PM sees 80 kts (or past)
19. PM calls “80 KTS”
20. PF compares speed indication on his/her side of the PFD
21. PF releases NWS
22. PF takes over control column with both hands
23. PF simultaneously confirms “MY COLUMN”
24. PM simultaneously keeps his right hand on the thrust levers throughout the take-off roll until V1
25. AC reaches V1=115kts (average) speed

AOTW: METHOD EVALUATING AND MONITORING AIRLINE PROCEDURES
18
26. PM sees V1 (e.g. 115 kts) on the PFD
27. PF calls “V1”
28. PM takes his/her hand away from the thrust lever after passing V1 = 115kts.
29. AC reaches VR
30. PM sees VR
31. PM calls “ROTATE”
32. PF starts a smooth rotation with about 3 ⁰/sec. to simultaneously follow the FD pitch command.
If FD is not usable, pilot needs to know climb with max V2+10 (initially 12⁰-15⁰ ANU)
33. PF sees clear of ground
34. PF sees positive rate of climb (simultaneously since previous step is in the field of vision?)
35. PF orders “GEAR UP”
36. PM silently checks positive rate of climb
37. PM selects gear up
38. PM monitors gear retraction
39. PF checks above 350 ft. RA (Do not engage the autopilot in the TO mode below 350 ft AGL. Do
not deselect the TO mode until obstacle clearance is assured.)
40. PF orders “ENGAGE AUTOPILOT NAV1” (or NAV2)
41. PM pushes AP engage button on the MCP
42. PM pushes NAV1 button on the MCP
43. PM checks annunciation on FMA (…)
44. PM confirms “AP NAV1”
45. PF checks FMA AP green
46. PF confirms “CHECKED”
47. PF sees thrust reduction altitude (1,500ft AAL.)
48. PF sets (retards) thrust to climb thrust
49. PF calls “CLIMB NORM/MAX SET”
50. PM checks thrust on PFD
51. PM reports “CHECKED”
52. PF after thrust reduction and passing acceleration altitude accelerates (Acceleration altitude
1500 ft. AAL of 3000 ft. AAL if not otherwise stated in OM-C)

AOTW: METHOD EVALUATING AND MONITORING AIRLINE PROCEDURES
19
53. PF sees acceleration altitude 1,500 ft. AAL (check previous step) sets speed (VF18+20. E.g.
146kts)
54. PF calls “SPEED 146 SET”
55. PM sees 146 kts on the MCP
56. PM reports “CHECKED”
57. SPEED ACHIEVES VF18 (e.g. 126 knots)
58. PF sees VF18 (e.g. 126kts) on PFD
59. PF orders “FLAPS 18”
60. PM silently checks VF18 (e.g. 126 kts) on the PFD
61. PM selects flaps lever to 18⁰
62. PM monitors flaps transition on flaps position indicator
63. PM confirms “FLAPS 18”
64. PF checks flaps position 18⁰ on flaps position indicator
65. PF confirms “CHECKED”
66. PF checks altitude on the PFD
67. PF sets appropriate speed VFT0+20 (e.g. 155kts)
68. PF states “SPEED 155”
69. PM sees 155 kts on the MCP
70. PM report “CHECKED”
71. SPEED ACHIEVES VF0 (e.g. 135 knots)
72. PF sees VF0 (e.g. 135 kts) on the PFD ~ flap retraction from 18 to 0
73. PF orders “FLAPS 0”
74. PM silently checks VF0 on the PFD
75. PM selects flaps lever t 0⁰
76. PM monitors flap retraction on flap position indicator ~ end
77. PM confirms after clean-up “FLAPS AT 0”
78. PF checks flaps position 0⁰
79. PF confirms “CHECKED”
AOTW: METHOD EVALUATING AND MONITORING AIRLINE PROCEDURES
20
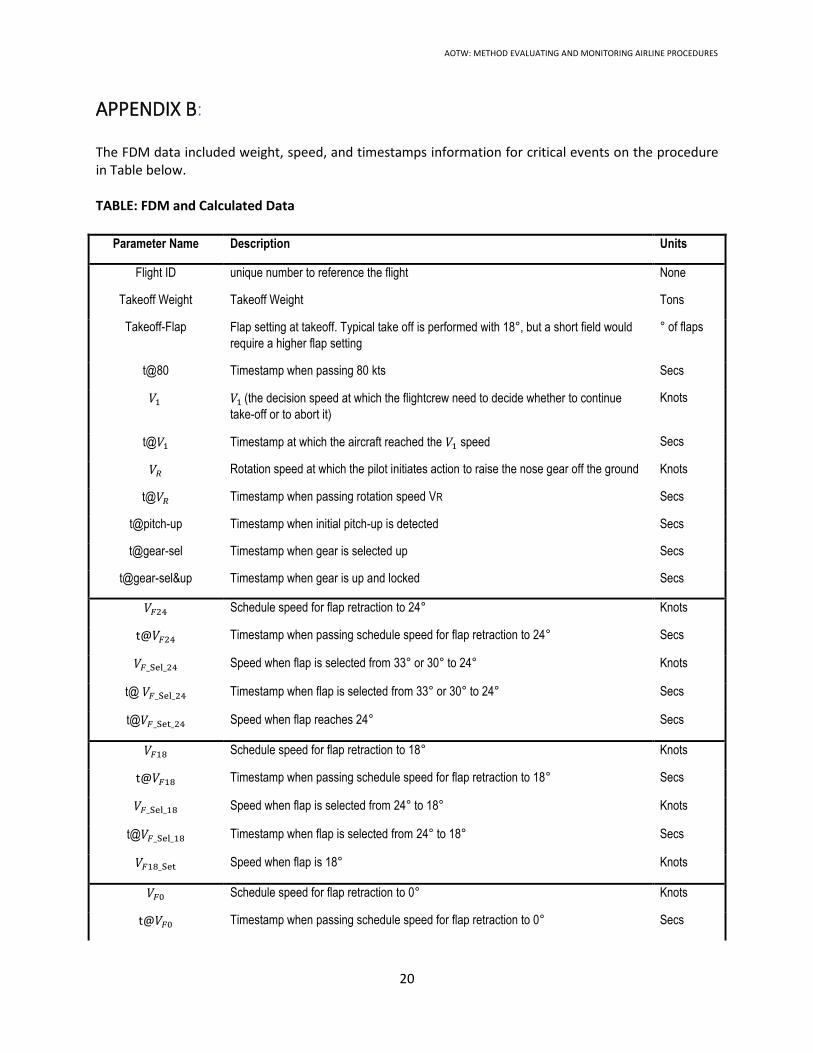
APPENDIX B: The FDM data included weight, speed, and timestamps information for critical events on the procedure in Table below. TABLE: FDM and Calculated Data
Parameter Name Description Units
Flight ID unique number to reference the flight None
Takeoff Weight Takeoff Weight Tons
Takeoff-Flap Flap setting at takeoff. Typical take off is performed with 18°, but a short field would
require a higher flap setting
° of flaps
t@80 Timestamp when passing 80 kts Secs
𝑉1 𝑉1 (the decision speed at which the flightcrew need to decide whether to continue
take-off or to abort it)
Knots
t@𝑉1 Timestamp at which the aircraft reached the 𝑉1 speed Secs
𝑉𝑅 Rotation speed at which the pilot initiates action to raise the nose gear off the ground Knots
t@𝑉𝑅 Timestamp when passing rotation speed VR Secs
t@pitch-up Timestamp when initial pitch-up is detected Secs
t@gear-sel Timestamp when gear is selected up Secs
t@gear-sel&up Timestamp when gear is up and locked Secs
𝑉𝐹24 Schedule speed for flap retraction to 24° Knots
t@𝑉𝐹24 Timestamp when passing schedule speed for flap retraction to 24° Secs
𝑉𝐹_Sel_24 Speed when flap is selected from 33° or 30° to 24° Knots
t@ 𝑉𝐹_Sel_24 Timestamp when flap is selected from 33° or 30° to 24° Secs
t@𝑉𝐹_Set_24 Speed when flap reaches 24° Secs
𝑉𝐹18 Schedule speed for flap retraction to 18° Knots
t@𝑉𝐹18 Timestamp when passing schedule speed for flap retraction to 18° Secs
𝑉𝐹_Sel_18 Speed when flap is selected from 24° to 18° Knots
t@𝑉𝐹_Sel_18 Timestamp when flap is selected from 24° to 18° Secs
𝑉𝐹18_Set Speed when flap is 18° Knots
𝑉𝐹0 Schedule speed for flap retraction to 0° Knots
t@𝑉𝐹0 Timestamp when passing schedule speed for flap retraction to 0° Secs

AOTW: METHOD EVALUATING AND MONITORING AIRLINE PROCEDURES
21
𝑉𝐹_Sel_0 speed when flap is selected from 18° to 0°. Knots
t@𝑉𝐹_Sel_0 timestamp when flap is selected from 18° to 0° Secs
𝑉𝐹0_Set speed when flap is 0°. Knots


![A Comparison of Two Takeoff and Climb Out Flap Retraction ...catsr.ite.gmu.edu/pubs/ICNS_2016_CompareFlapRetract_12292015[1].pdf · Procedure Flap retraction is part of the takeoff](https://img.dokumen.tips/doc/110x75/5b3c16137f8b9a986e8cc9c4/a-comparison-of-two-takeoff-and-climb-out-flap-retraction-catsritegmuedupubsicns2016compareflapretract122920151pdf.jpg)