Embed Size (px)
DESCRIPTION
membran
Citation preview
AUTOPSY OF MEMBRANES1
Ahmed S. Al-Amoudi and Mohammed Farooque
Saline Water Conversion Corporation P.O.Box 8328, Al-Jubail -31951, Saudi Arabia Tel: + 966-3-343 0012, Fax: + 966-3-343 1615
Email: [email protected] ABSTRACT Desalination membranes such as NF and RO membranes tend to undergo performance
deterioration with time, which depends on the efficiency of the pretreatment. The
decline in performance due to fouling or scaling of the membrane, in many cases, can
be restored to some extent by means of chemical cleaning. However, the performance
decline due to irreversible damage to membrane polymer cannot be restored. In order
to find out the actual reason for the irreversible decline in membrane performance,
autopsy becomes very essential, in addition to the investigation of the operation history
of the membrane. Membrane autopsy procedure involves dissection of membranes,
visual inspection of the surface of the membranes as well as other components of
module to discover any physical damage. Furthermore, the foulants and the membrane
itself are analyzed by various analytical procedures. A wet chemical analysis of the
foulants deposited on the membrane is carried out to identify the chemical composition
of the foulant, which is also supplemented by EDAX analysis. The SEM analysis gives
detail micrographic view of the membrane surface, which shall help in establishing
nature of deposits. Biological analyses are conducted to study the possibility of
biofouling. Tensile testing and intrinsic viscosity measurements are used to determine
membrane polymer degradation, if any. This paper describes a few cases of membranes
autopsy carried out at RDC to find out the reason for membrane poor performance.
Cases studied include both NF and RO spiral wound membranes and hollow fine fiber
RO membranes made of both polyamide as well as cellulose triacetate polymers.
1 Presented at the 3rd Acquired Experience Symposium, Al-Jubail, Saudi Arabia, 4-6 Feb. 2002.
INTRODUCTION One serious problem faced in the sweater reverse osmosis (SWRO) desalination
phenomenon that has not been defined precisely but in general the term is used to
describe the undesirable formation of deposits on membrane surfaces. This occurs
when rejected solids are not transported from the surface of the membrane back to the
bulk stream. Fouling can be classified mainly into (1) inorganic fouling due to
deposition on membrane surface of inorganic scales or colloidal matter and (2)
biofouling due to microbial attachment to membrane surface followed thereafter by
their growth and multiplication in presence of adequate supply of nutrients in the
pretreated feed. To a great extent fouling can be prevented by the proper plant design,
including an efficient pretreatment system and also by good plant operation and
maintenance. However, if the feed pretreatment is inadequate and is unable to remove
all the potential membrane foulant matter from it, membrane fouling becomes almost
inevitable, and it takes place sooner or later. Membrane fouling leads to reduction not
only in product water quantity and quality but also it is detrimental to membrane
service life. SWRO, brackish water reverse osmosis (BWRO) and nanofiltration (NF)
membranes of different configurations, hollow fine fiber (HFF) as well as spiral wound
(SW), are either made of aromatic polyamide or cellulose acetate base polymers.
Cellulose acetate (CA) membranes are widely used in RO desalination industries
because of the overall advantages of their properties, cost and ease of use. A major
cause for the chemical degradation of CA is oxidation. Oxidation is accelerated at high
concentration of oxidizing agents such as chlorine (Cl2), which is used in RO process as
disinfectant [1]. Studies [2] indicated that chlorine in presence of heavy metals lead to
oxidation as well as some times to hydrolysis of CA membranes. Cobalt and copper
have a remarkable effect on the deterioration of the CA membranes while iron,
manganese and nickel affect membrane performance but to a lesser extent. Also,
temperature, pH and chlorine concentration have an influence on CA membrane
performance. The effect of oxidation is mainly through the scission of membrane
polymer chain, thus reducing both its molecular weight as well as mechanical strength,
resulting in a decline in salt rejection and to an increase in permeates flux of RO
membrane. The oxidation can be detected by either mechanical strength measurement
and/or by molecular weight determination. Several methods are used in determination
of molecular weight of polymer including intrinsic viscosity, which is directly
proportional to the polymer molecular weight. In this study degree of acetylation,
intrinsic viscosity and tensile strength measurements, were used for identifying the
causes of the poor performance of two cellulose triacetate hollow fine fiber membranes
obtained from a commercial SWRO plant after being in operation for five and two
years, respectively.
Aromatic polyamide membrane (B-9) also is widely used in BWRO systems. A major
cause for the chemical degradation of aromatic polyamide is oxidation by chlorine
(Cl2). Two B-9 membranes with good performance and poor performance were
analyzed at RDC. Autopsy was conducted on two B-9 membranes after their
performance evaluation using NaCl solution as feed.
. SWRO pretreatment using NF membranes lead to a significant improvement in the
seawater desalination processes. Two NF membranes out of 10 NF membrane used in a
NF pilot plant which were operated continuously for more than 10,000 hours was
subjected to autopsy, which includes biological, chemical and physical analyses of
membranes and foulant deposits on its surfaces.
Five different SWRO membranes of different configuration of HFF as well as SW were
evaluated using feed water pretreated by conventional coagulation-filtration using
FeCl3.
which includes biological, chemical and physical analyses as well as SEM &EDX of
membranes and foulant deposits on its surfaces.
The objective of this paper is to describe various method used for identifying the
foulants and causes of the membrane degradation for different types and configuration
of membranes by means of autopsy.
EXPERIMENTAL Membranes The two different configurations of HFF and SW membranes are used in SWRO, NF
and BWRO processes. HFF membranes are made from cellulose triacetate and aromatic
polyamide while SW is made from thin film composite polyamide. Both the
commercial membranes (HFF & SW) were autopsied and samples were collected from
inner, middle and outer portions in case of HFF and feed side, brine side and middle
side portion in case of SW for detailed analyses.
Autopsy and analysis were conducted on all membranes using the standard procedure
adopted for SWRO, BWRO and NF [3]. It involved cutting open the membrane, visual
inspection of surface, estimation of amount of deposits on the membrane surface after
drying, chemical analyses of deposits using Atomic Absorption Spectroscopy (AAS)
and Inductively Coupled Plasma (ICP) and bacterial enumeration on membrane surface.
After removing the samples for bacterial enumeration, foulant deposits were scrapped
off from the surface and thoroughly dried before analyzing for various inorganic
elements using AAS and ICP. Also, Scanning Electron Microscopy (SEM) and Energy
Dispersive X-ray (EDX) analyses were conducted on representative samples cut from
the membranes which were thoroughly dried and were used without any cleaning. In
addition to abovementioned analyses HFF membranes were also subjected to stress
strain measurement and intrinsic viscosity measurement. Moreover, degree of
acetylation also was determined for HFF-CA membranes.
Performance Evaluation Performance of membranes is evaluated using seawater or NaCl solution at different
feed pressure as well as feed flow at ambient temperature. The results obtained are
then normalized using standard ASTM procedure [4].
Biological Analyses Samples are aseptically collected from membranes and are analyzed for both bacteria
and fungi according to standard protocol [5]. Bacteria and Fungi attached to membrane
surfaces are counted using a pour plat technique and numbers are expressed per cm2.
SEM and EDAX Samples as well as reemay samples were collected from membranes and dried
thoroughly before analyzing the deposits on the membrane surfaces using SEM &
EDAX.
ICP & AAS After removing the samples for bacterial enumeration, foulant deposits were scrapped
off from the surface and thoroughly dried before analyzing for various inorganic
elements using AAS and ICP.
Degree of Acetylation Acetylation degree of membranes, which is normally expressed as percent of acetyl
group in the polymer, was determined using standard ASTM procedure with slight
modification [6]. In this method, a known amount of membrane sample (0.7 g) was
first added to 70 ml of acetone in an Erlenmeyer flask and kept stirring using a
magnetic stirrer, for 1 hour followed by addition of 5 ml of methanol. After 30 minutes
of additional stirring, 1N NaOH was added in excess (15 ml), to the highly swollen (not
completely soluble) membrane sample solution and kept stirring for another 1 hour.
After adding hot (60oC) distilled water for washing down the sides of the flask and
continuing stirring for another 10 minutes, the unreacted excess amount of NaOH was
titrated against standard sulfuric acid (0.5 N) using phenolphthalein indicator. When the
pink color disappeared completely, an excess (0.2 - 0.3ml) of sulfuric acid was added
and re-titrated with 0.1 N NaOH. For each sample, a duplicate was also carried out as
well as two blank analyses. The acetylation degree was then calculated as the
percentage weight of combined acetic acid formed to the total weight of membrane
polymer during hydrolysis by the excess NaOH.
Stress Strain Measurements Instron Series IX automated Materials Testing System, Series 4200 Interface, was used
to measure the tensile properties. Hollow fine fibers samples of length 7 to 8 cm were
soaked in distilled water prior to the tensile measurement. To prevent the fibers from
drying, distilled water was sprayed on to the fiber while running the test. The test
conditions were as follows :
Number of test specimens 10
Sample length between the grips 2 cm
Cross head speed 2 cm/min.
Percentage elongation and tensile strength at break were automatically calculated by the
computerized Instron for each of the fibers.
Intrinsic viscosity measurement The intrinsic viscosity [ηη], which is related to the polymer molecular weight, was
determined following the standard procedure [7]. Ubbelohde type capillary viscometer
was used at constant temperature of 30 ± 1oC. After determining the efflux time (to ) for
the solvent DMSO or methylene chloride/ methanol (9/1) mixture, the same (ti) was
determined for the known concentration of the sample. For each concentration of
sample, five measurements were made and average of three measurements were taken
after discarding both the lowest and highest readings. The measurements were made at
different concentrations for each sample by successive dilution using the above solvent.
The intrinsic viscosity [ηη] was then obtained as intercept of the plot of ηηsp / c against c,
where c is concentration (g/dl) of membrane sample and ηηsp is specific viscosity. The
specific viscosity can be obtained from relative viscosity (ηηrel) as ηηrel - 1. The ηηrel can
be determined from the efflux time of solvent to and sample ti as ηηrel = t i / to.
RESULTS & DISCUSSION NF, SWRO and BWRO of different configuration such as HFF and SW membranes
are discussed separately.
NF membranes (SW TFC) At the end of the 10,000 h operation of NF membranes in the aforementioned
arrangement, the total normalized product flow of NF membranes were decreased from
a value of about 16 l/min to about 11.2 ml/min amounting to a 30% decline. Before
performing autopsy, the performance of each of the five modules (contains two NF
elements) were determined and the obtained normalized product flow are tabulated in
Table 1. It can be observed that the modules containing lead elements (V5 & V6) are
having the least performance. The performance of remaining elements were better as
we progressively move to the last element as can be seen from the same table. Only one
of the lead element was autopsied along with last element for comparison.
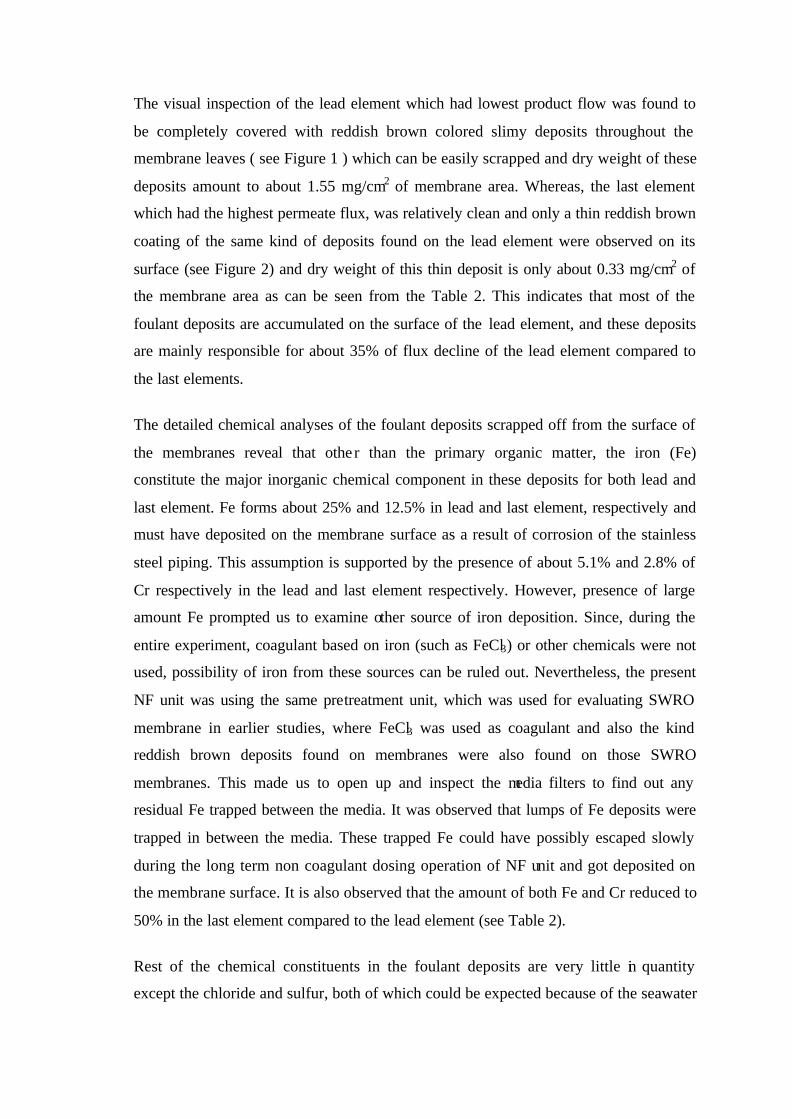
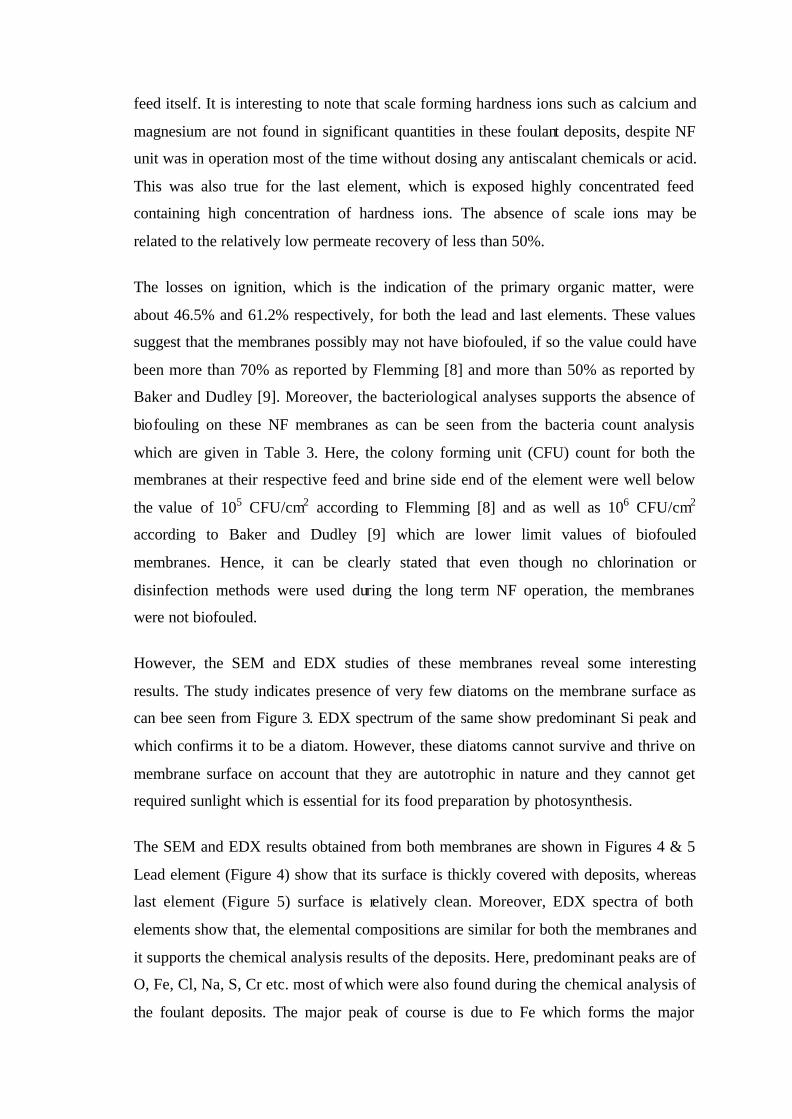
The visual inspection of the lead element which had lowest product flow was found to
be completely covered with reddish brown colored slimy deposits throughout the
membrane leaves ( see Figure 1 ) which can be easily scrapped and dry weight of these
deposits amount to about 1.55 mg/cm2 of membrane area. Whereas, the last element
which had the highest permeate flux, was relatively clean and only a thin reddish brown
coating of the same kind of deposits found on the lead element were observed on its
surface (see Figure 2) and dry weight of this thin deposit is only about 0.33 mg/cm2 of
the membrane area as can be seen from the Table 2. This indicates that most of the
foulant deposits are accumulated on the surface of the lead element, and these deposits
are mainly responsible for about 35% of flux decline of the lead element compared to
the last elements.
The detailed chemical analyses of the foulant deposits scrapped off from the surface of
the membranes reveal that othe r than the primary organic matter, the iron (Fe)
constitute the major inorganic chemical component in these deposits for both lead and
last element. Fe forms about 25% and 12.5% in lead and last element, respectively and
must have deposited on the membrane surface as a result of corrosion of the stainless
steel piping. This assumption is supported by the presence of about 5.1% and 2.8% of
Cr respectively in the lead and last element respectively. However, presence of large
amount Fe prompted us to examine other source of iron deposition. Since, during the
entire experiment, coagulant based on iron (such as FeCl3) or other chemicals were not
used, possibility of iron from these sources can be ruled out. Nevertheless, the present
NF unit was using the same pretreatment unit, which was used for evaluating SWRO
membrane in earlier studies, where FeCl3 was used as coagulant and also the kind
reddish brown deposits found on membranes were also found on those SWRO
membranes. This made us to open up and inspect the media filters to find out any
residual Fe trapped between the media. It was observed that lumps of Fe deposits were
trapped in between the media. These trapped Fe could have possibly escaped slowly
during the long term non coagulant dosing operation of NF unit and got deposited on
the membrane surface. It is also observed that the amount of both Fe and Cr reduced to
50% in the last element compared to the lead element (see Table 2).
Rest of the chemical constituents in the foulant deposits are very little in quantity
except the chloride and sulfur, both of which could be expected because of the seawater
feed itself. It is interesting to note that scale forming hardness ions such as calcium and
magnesium are not found in significant quantities in these foulant deposits, despite NF
unit was in operation most of the time without dosing any antiscalant chemicals or acid.
This was also true for the last element, which is exposed highly concentrated feed
containing high concentration of hardness ions. The absence of scale ions may be
related to the relatively low permeate recovery of less than 50%.
The losses on ignition, which is the indication of the primary organic matter, were
about 46.5% and 61.2% respectively, for both the lead and last elements. These values
suggest that the membranes possibly may not have biofouled, if so the value could have
been more than 70% as reported by Flemming [8] and more than 50% as reported by
Baker and Dudley [9]. Moreover, the bacteriological analyses supports the absence of
biofouling on these NF membranes as can be seen from the bacteria count analysis
which are given in Table 3. Here, the colony forming unit (CFU) count for both the
membranes at their respective feed and brine side end of the element were well below
the value of 105 CFU/cm2 according to Flemming [8] and as well as 106 CFU/cm2
according to Baker and Dudley [9] which are lower limit values of biofouled
membranes. Hence, it can be clearly stated that even though no chlorination or
disinfection methods were used during the long term NF operation, the membranes
were not biofouled.
However, the SEM and EDX studies of these membranes reveal some interesting
results. The study indicates presence of very few diatoms on the membrane surface as
can bee seen from Figure 3. EDX spectrum of the same show predominant Si peak and
which confirms it to be a diatom. However, these diatoms cannot survive and thrive on
membrane surface on account that they are autotrophic in nature and they cannot get
required sunlight which is essential for its food preparation by photosynthesis.
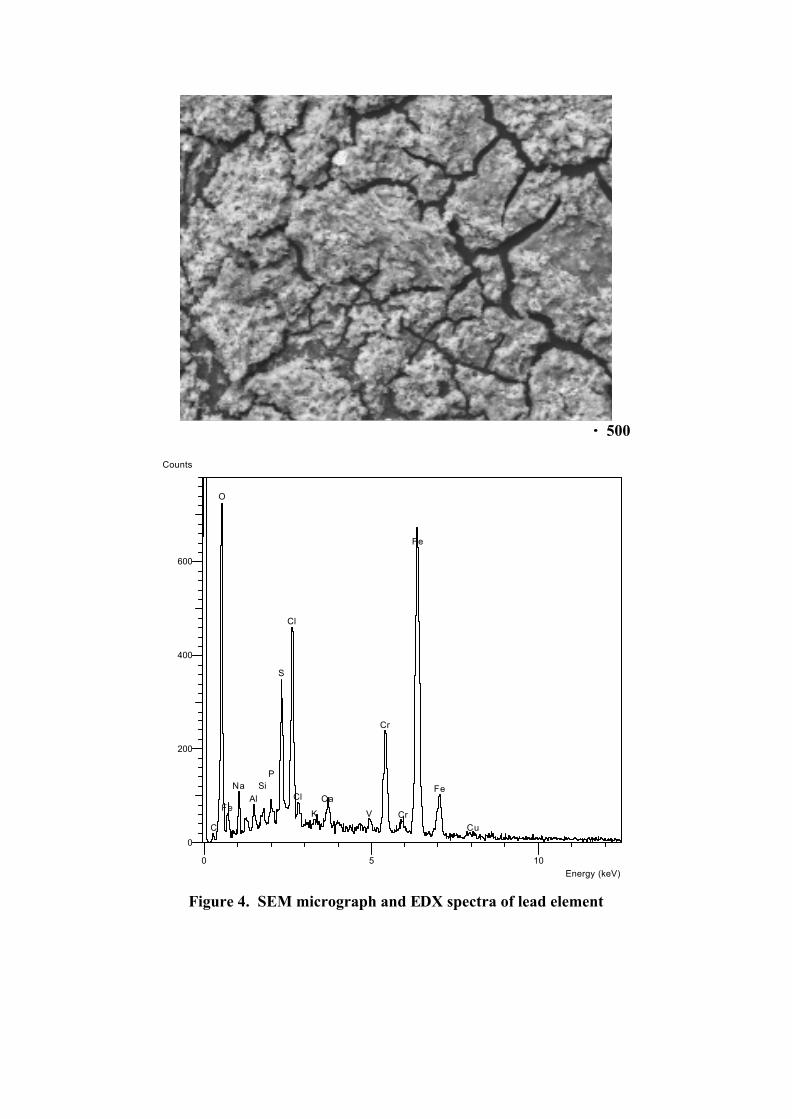
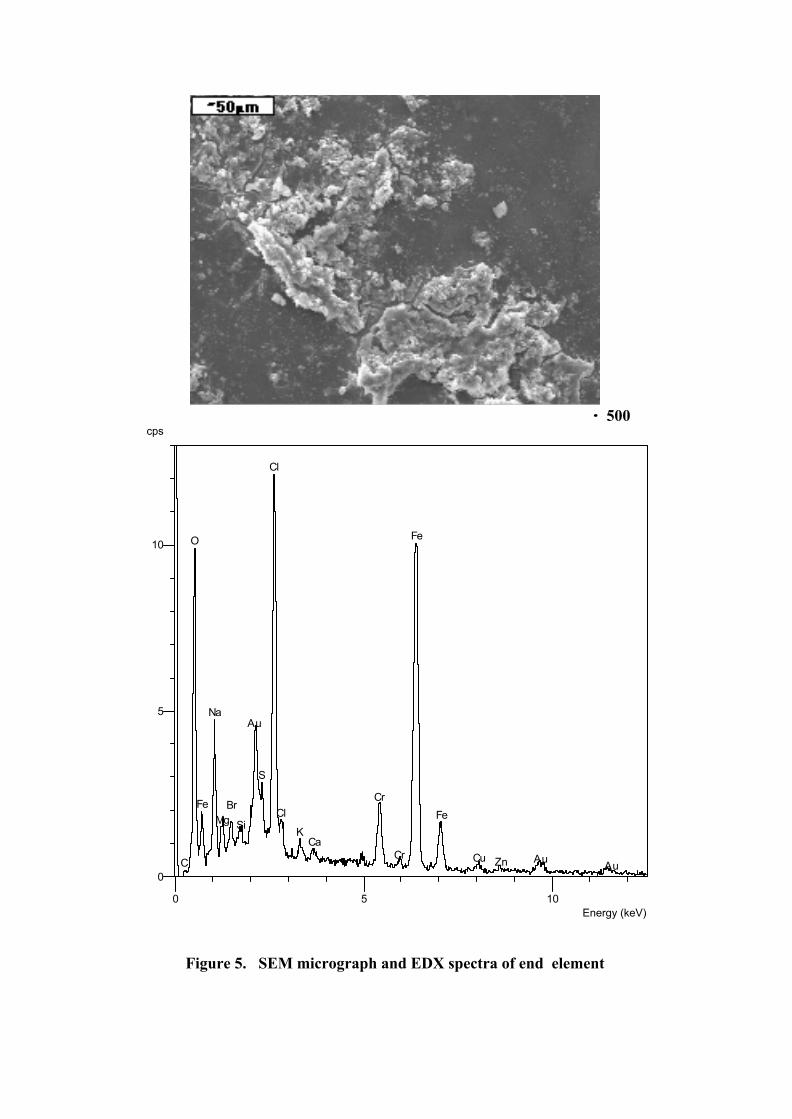
The SEM and EDX results obtained from both membranes are shown in Figures 4 & 5
Lead element (Figure 4) show that its surface is thickly covered with deposits, whereas
last element (Figure 5) surface is relatively clean. Moreover, EDX spectra of both
elements show that, the elemental compositions are similar for both the membranes and
it supports the chemical analysis results of the deposits. Here, predominant peaks are of
O, Fe, Cl, Na, S, Cr etc. most of which were also found during the chemical analysis of
the foulant deposits. The major peak of course is due to Fe which forms the major
inorganic foulant as was confirmed by the chemical analyses results. Other chemical
constituents are of minor in nature. The peaks due to sulfur could be both from the
sulfate deposited on the membrane surface as well as the from the polysulfone support
of the TFC membrane.
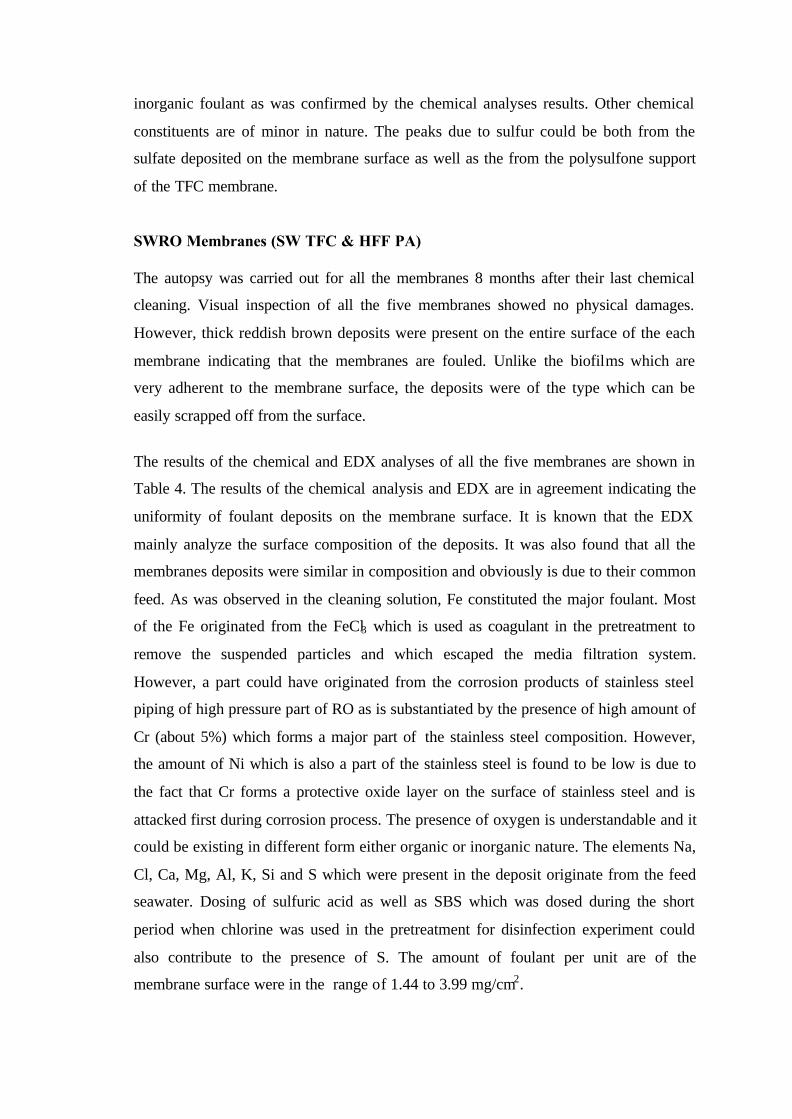
SWRO Membranes (SW TFC & HFF PA) The autopsy was carried out for all the membranes 8 months after their last chemical
cleaning. Visual inspection of all the five membranes showed no physical damages.
However, thick reddish brown deposits were present on the entire surface of the each
membrane indicating that the membranes are fouled. Unlike the biofilms which are
very adherent to the membrane surface, the deposits were of the type which can be
easily scrapped off from the surface.
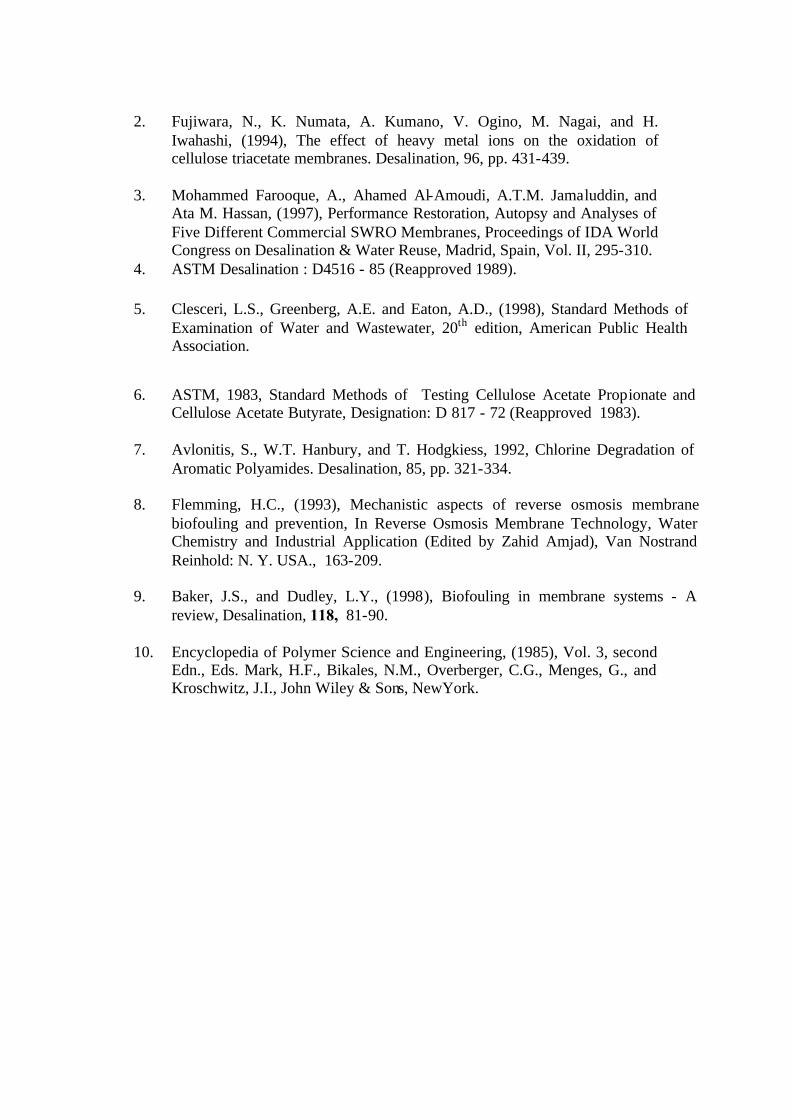
The results of the chemical and EDX analyses of all the five membranes are shown in
Table 4. The results of the chemical analysis and EDX are in agreement indicating the
uniformity of foulant deposits on the membrane surface. It is known that the EDX
mainly analyze the surface composition of the deposits. It was also found that all the
membranes deposits were similar in composition and obviously is due to their common
feed. As was observed in the cleaning solution, Fe constituted the major foulant. Most
of the Fe originated from the FeCl3 which is used as coagulant in the pretreatment to
remove the suspended particles and which escaped the media filtration system.
However, a part could have originated from the corrosion products of stainless steel
piping of high pressure part of RO as is substantiated by the presence of high amount of
Cr (about 5%) which forms a major part of the stainless steel composition. However,
the amount of Ni which is also a part of the stainless steel is found to be low is due to
the fact that Cr forms a protective oxide layer on the surface of stainless steel and is
attacked first during corrosion process. The presence of oxygen is understandable and it
could be existing in different form either organic or inorganic nature. The elements Na,
Cl, Ca, Mg, Al, K, Si and S which were present in the deposit originate from the feed
seawater. Dosing of sulfuric acid as well as SBS which was dosed during the short
period when chlorine was used in the pretreatment for disinfection experiment could
also contribute to the presence of S. The amount of foulant per unit are of the
membrane surface were in the range of 1.44 to 3.99 mg/cm2.
The loss on ignition at 550 oC which is taken as measure of primary organic matter is
about 28% for all the membranes indicating absence of any major biofouling of the
membranes. This is in spite of no disinfectant was employed in the feed pretreatment.
Usually biofouled membrane on which the biofilm is formed on their surface tend to
contain above 70% of organic matter [8]. This also have been supported by the low
bacterial count which was observed on all the membranes in the range of 2.4 × 10³ to
2.2 × 10⁴ cfu/cm2. This number is also low compared to the biofouled membranes of
more than 105 [8]. The bacterial count obtained were similar in range to that reported
earlier in the feed to the membrane.
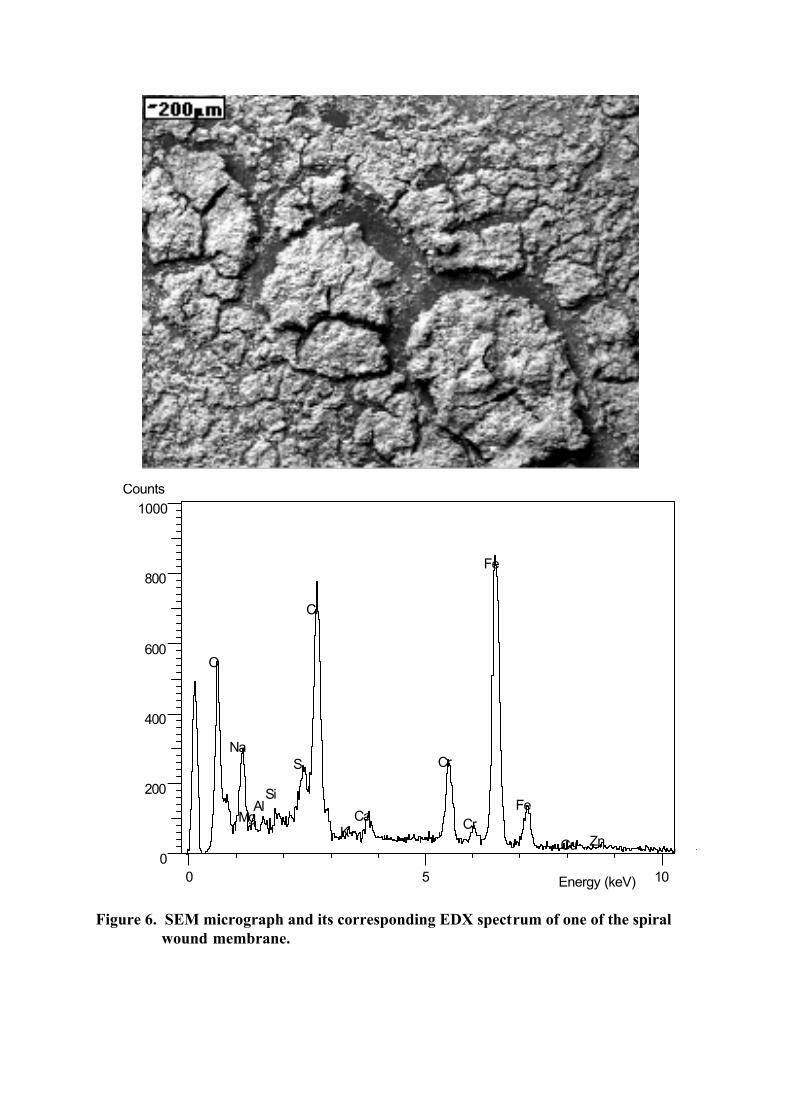
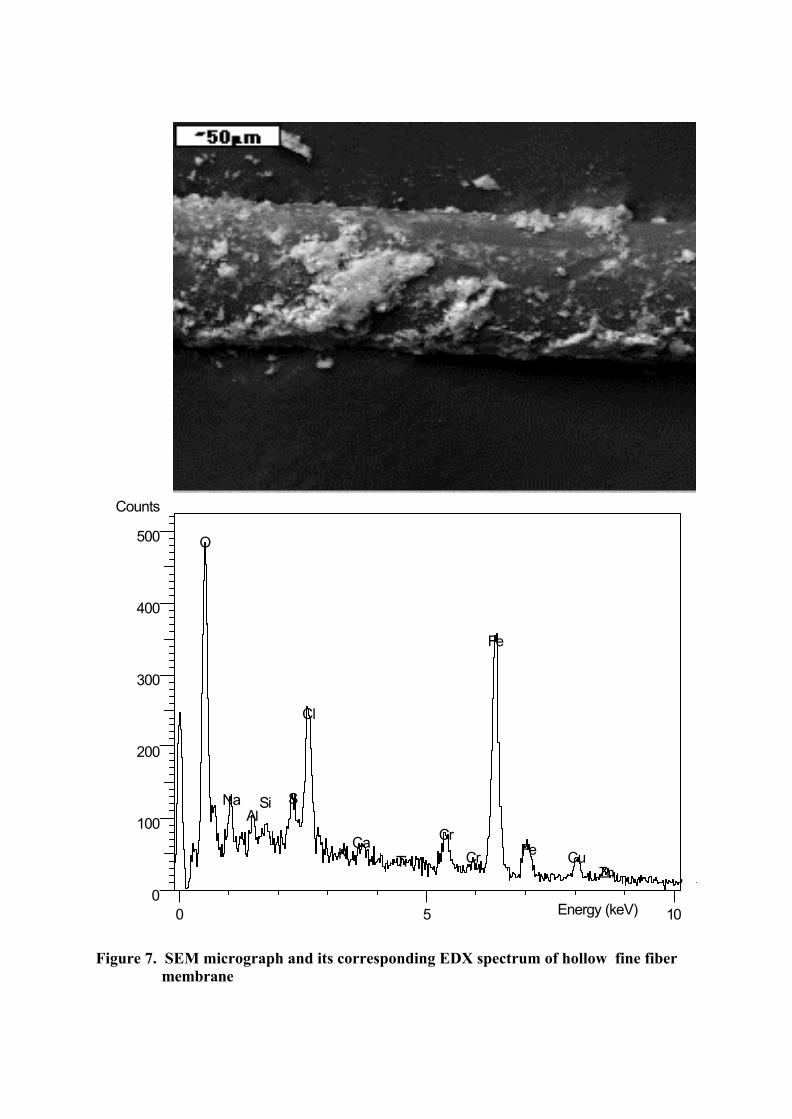
Figures 6 & 7 show typical SEM micrographs of one of the SW membranes and HFF
membrane and their corresponding EDX spectrum. The SEM results show presence of
very thick deposits on the surface of all the membranes. No other significant features
were observed on the surface of the membranes. Performance evaluation of membranes
cut from the feed and brine side end areas of membrane were carried out and it was
found that it had similar performance regardless of the area from which it were cut.
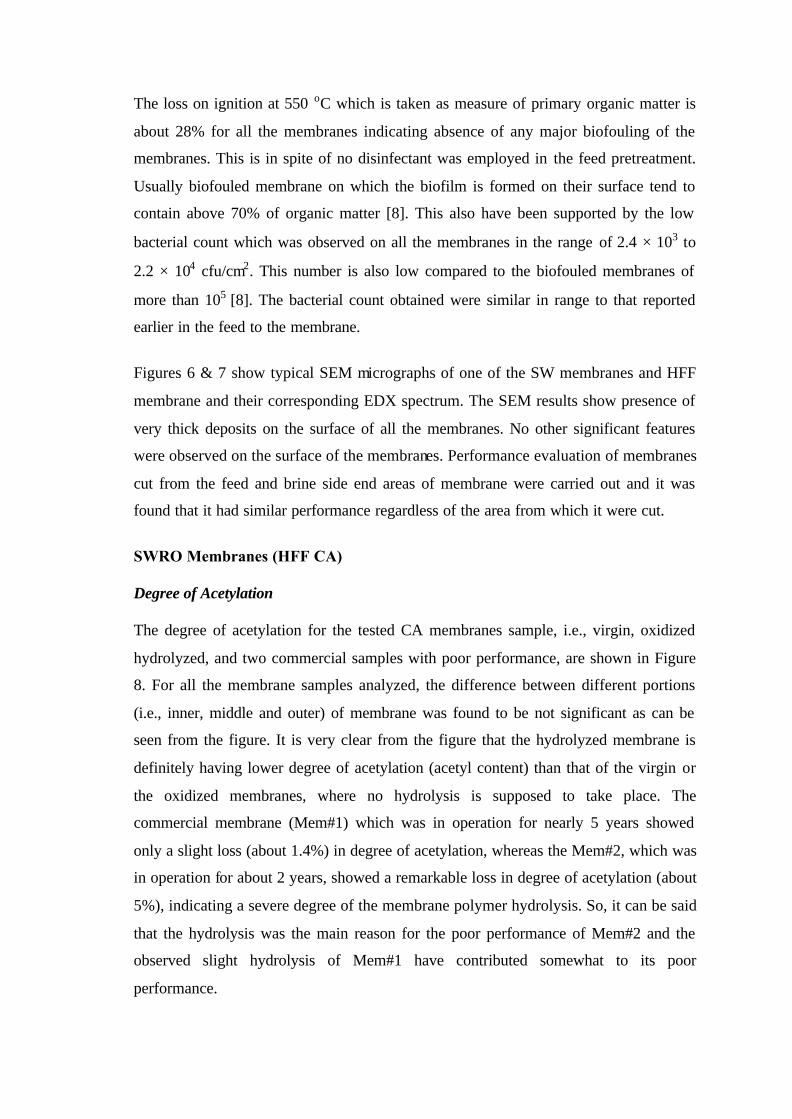
SWRO Membranes (HFF CA) Degree of Acetylation The degree of acetylation for the tested CA membranes sample, i.e., virgin, oxidized
hydrolyzed, and two commercial samples with poor performance, are shown in Figure
8. For all the membrane samples analyzed, the difference between different portions
(i.e., inner, middle and outer) of membrane was found to be not significant as can be
seen from the figure. It is very clear from the figure that the hydrolyzed membrane is
definitely having lower degree of acetylation (acetyl content) than that of the virgin or
the oxidized membranes, where no hydrolysis is supposed to take place. The
commercial membrane (Mem#1) which was in operation for nearly 5 years showed
only a slight loss (about 1.4%) in degree of acetylation, whereas the Mem#2, which was
in operation for about 2 years, showed a remarkable loss in degree of acetylation (about
5%), indicating a severe degree of the membrane polymer hydrolysis. So, it can be said
that the hydrolysis was the main reason for the poor performance of Mem#2 and the
observed slight hydrolysis of Mem#1 have contributed somewhat to its poor
performance.
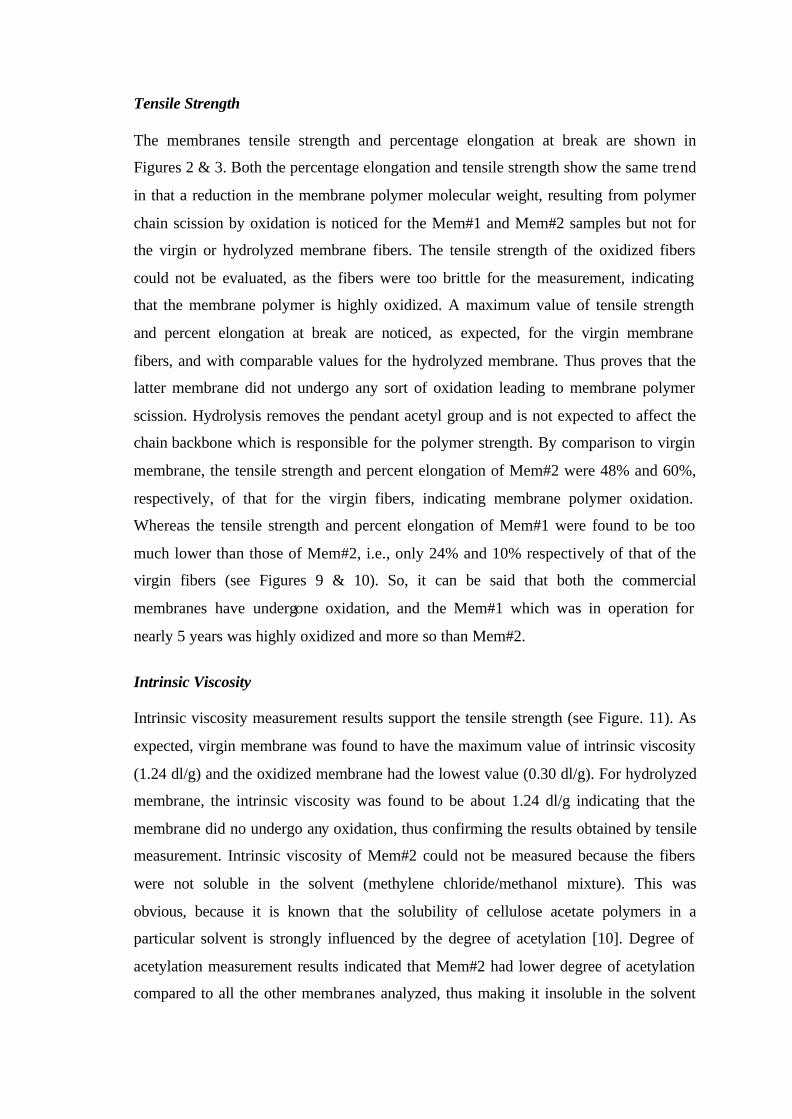
Tensile Strength The membranes tensile strength and percentage elongation at break are shown in
Figures 2 & 3. Both the percentage elongation and tensile strength show the same trend
in that a reduction in the membrane polymer molecular weight, resulting from polymer
chain scission by oxidation is noticed for the Mem#1 and Mem#2 samples but not for
the virgin or hydrolyzed membrane fibers. The tensile strength of the oxidized fibers
could not be evaluated, as the fibers were too brittle for the measurement, indicating
that the membrane polymer is highly oxidized. A maximum value of tensile strength
and percent elongation at break are noticed, as expected, for the virgin membrane
fibers, and with comparable values for the hydrolyzed membrane. Thus proves that the
latter membrane did not undergo any sort of oxidation leading to membrane polymer
scission. Hydrolysis removes the pendant acetyl group and is not expected to affect the
chain backbone which is responsible for the polymer strength. By comparison to virgin
membrane, the tensile strength and percent elongation of Mem#2 were 48% and 60%,
respectively, of that for the virgin fibers, indicating membrane polymer oxidation.
Whereas the tensile strength and percent elongation of Mem#1 were found to be too
much lower than those of Mem#2, i.e., only 24% and 10% respectively of that of the
virgin fibers (see Figures 9 & 10). So, it can be said that both the commercial
membranes have undergone oxidation, and the Mem#1 which was in operation for
nearly 5 years was highly oxidized and more so than Mem#2.
Intrinsic Viscosity Intrinsic viscosity measurement results support the tensile strength (see Figure. 11). As
expected, virgin membrane was found to have the maximum value of intrinsic viscosity
(1.24 dl/g) and the oxidized membrane had the lowest value (0.30 dl/g). For hydrolyzed
membrane, the intrinsic viscosity was found to be about 1.24 dl/g indicating that the
membrane did no undergo any oxidation, thus confirming the results obtained by tensile
measurement. Intrinsic viscosity of Mem#2 could not be measured because the fibers
were not soluble in the solvent (methylene chloride/methanol mixture). This was
obvious, because it is known that the solubility of cellulose acetate polymers in a
particular solvent is strongly influenced by the degree of acetylation [10]. Degree of
acetylation measurement results indicated that Mem#2 had lower degree of acetylation
compared to all the other membranes analyzed, thus making it insoluble in the solvent
by altering the solubility property of the polymer. The Mem#1 sample showed a
remarkable reduction in intrinsic viscosity (0.72 dl/g) indicating that membrane
polymer molecular weight was decreased by polymer chain scission due oxidation, thus
supporting the tensile study that the membrane was oxidized.
BWRO Membranes (HFF PA) The normalized product flow and salt passage for both membranes are given in Table 5.
It is evident from the results that Mem#2 has higher product flow (2.81 m3/h) as well as
salt passage (78.52%) compared to Mem#1 (1.72m3/h and 18.63%, respectively)
indicating a possible damage to Mem#2. This has confirmed by the viscosity data,
where Mem#2 is found to have lower intrinsic viscosity (0.4033 dl/g) compared to
Mem#1 (0.4924 dl/g), indicating a decrease in molecular weight of membrane polymer
of Mem#2. The decrease in molecular weight occurs due to polymer chain scission, as a
result of oxidation reaction. Usually this happens to an aromatic polyamide membrane
when exposed to Cl2 or similar strong oxidizing agents. As RWWA claims that the
membranes are operated in non chlorinated environment, it is surprising to see such
type of oxidation in the membrane, which occurred after preservation of the same in
SBS. It seems that the membrane is some how exposed to some strong oxidizing agent,
which resulted in chain scission of membrane polymer thus leading to higher salt
passage as well as product flow for Mem #2.
Biological analysis is done at RDC after carrying out performance evaluation of
membrane using standard NaCl solution, which could alter biological nature of
membranes and may not reflect real biological status of the membrane. Nevertheless by
assuming that not much change has taken place, the analyses are conducted. Bio-
analyses showed that both average bacterial and fungal population on the membrane
surface of Mem#2 (4.91 × 10⁴ cell/cm2) is higher than that of Mem#1 (2.62 × 10³
cell/cm2). However, even the higher value for Mem#2 is less than the lower limit
termed for a biofouled membrane of 105/cm2 according to Flemming et al [8] and
106/cm2 according to Baker et al [9]. Hence, it can be said that both the membranes are
not biofouled.
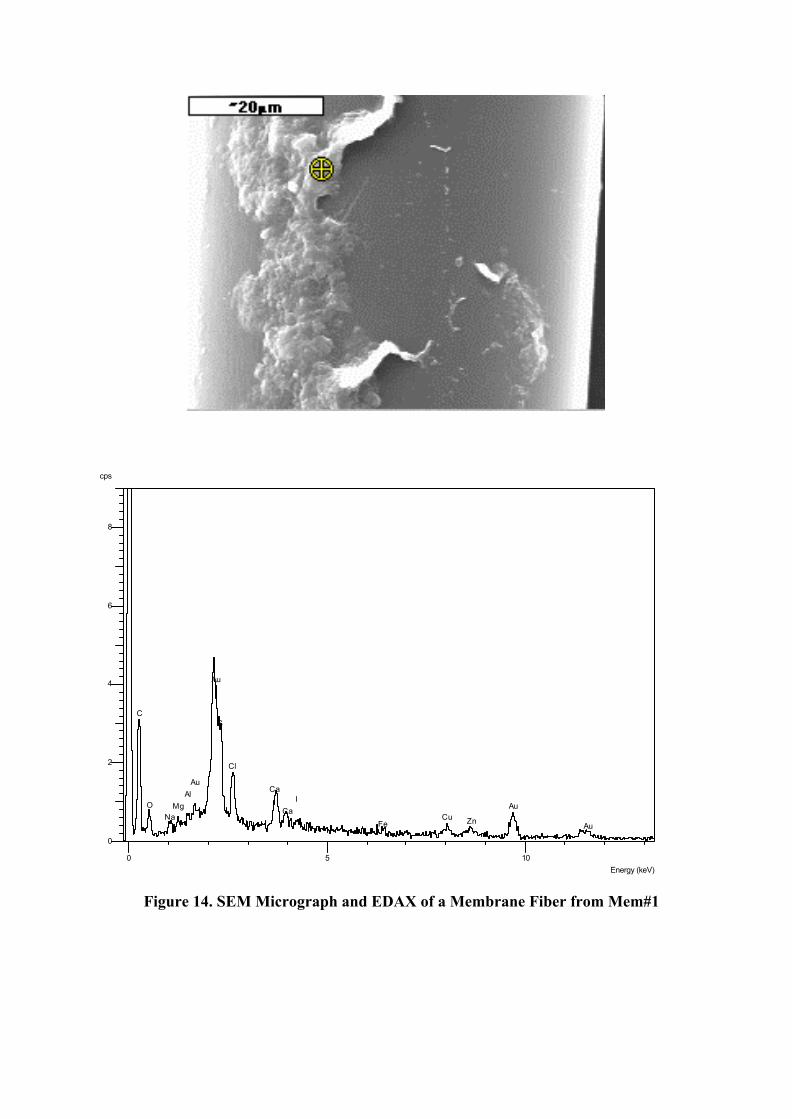
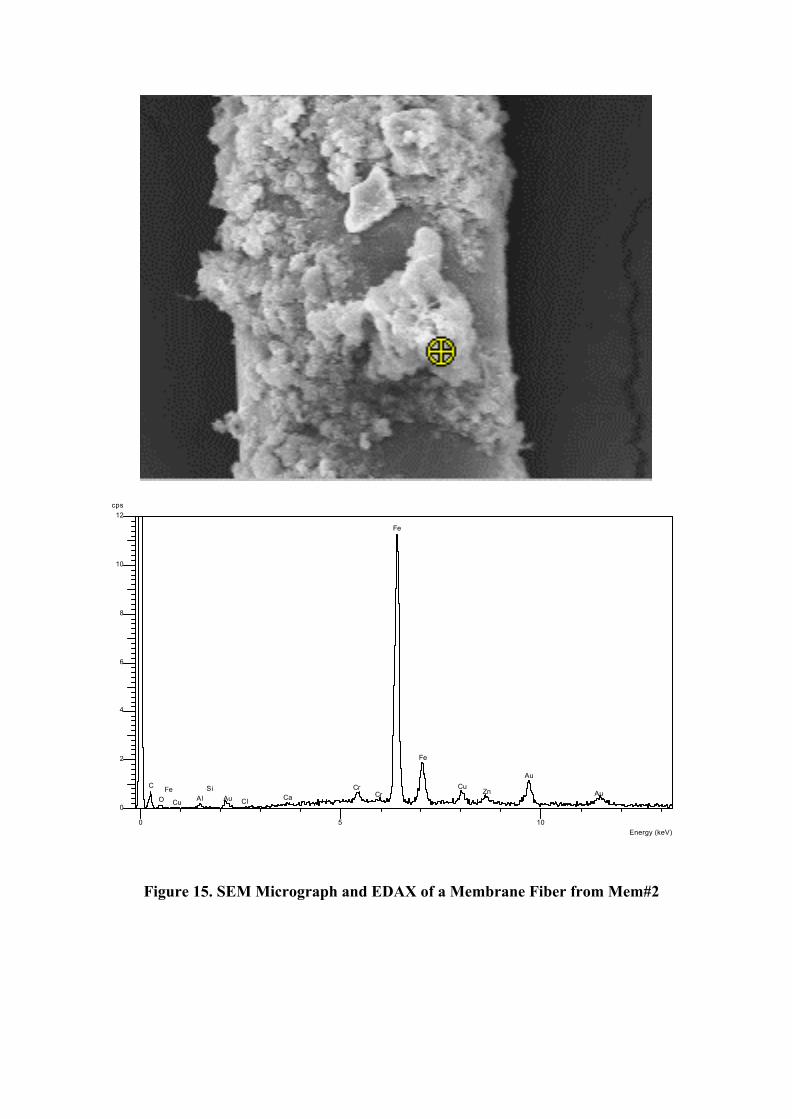
Relatively cleaner membranes, which are observed (Fig 12 & 13) during visual
inspection, indicate that the pretreatment is efficient. The SEM micrographs for both
membranes also show that they are relatively clean and very little deposits are seen on
the fibers especially on the inner fibers, which are closer to the feed tube (Fig 14 & 15),
more on Mem#2 than Mem#1. EDAX analyses of both membranes showed similar
composition in their foulant deposit and mainly consists of Fe, Mg, S, Ca, Zn, Si, Co,
Na, Cr and O, which have to be removed by proper chemical cleaning in order for an
effective PT-A and PT-B treatment to take place. Fe and Cr, which could have
originated as a result of corrosion of stainless steel parts are found to be more in
Mem#2 than on Mem #1. The presence of heavy metals could enhance oxidation in
presence of oxidation agent, which is reported in the case of CTA membrane [2].
CONCLUSION The autopsies of different types of commercial membranes of both SW and HFF, which
receive a different feed, reveal that the composition of foulant deposited on surface of
all membranes is similar regardless of the type feed as well as type of membrane.
Corrosion products and other trace elements also were found on all membranes surfaces
in different ratio. Membrane that received feed using coagulation filtration system,
was found that, the foulant deposits in the membrane surfaces consist mainly of oxides
of Fe, which is due to the usage of the coagulant FeCl3 that could not be completely
removed by the media filtration.
The presence of low primary organic matter as well as bacterial count suggest that the
membranes were not biologically fouled in spite of feed disinfection or no feed
disinfection. It was established that same CTA HFF membrane exposure to high
concentration of chlorine and to high pH induced decreases in polymer chain molecular
weight and in degree of acetylation. Also, it was established that polyamide aromatic
B-9 BWRO membranes have poor performance due to oxidative degradation of
membrane.
REFERENCES 1. Motomura, H., and Y. Taniguchi, (1981), Durability study of cellulose
acetate reverse osmosis membrane under adverse circumstances for desalting, Synthetic Membranes : Vol. 1 Desalination, Ed. A.F. Turbak, ACS Symposium Series 153, American Chemical Society, Washington, D.C.
2. Fujiwara, N., K. Numata, A. Kumano, V. Ogino, M. Nagai, and H.
Iwahashi, (1994), The effect of heavy metal ions on the oxidation of cellulose triacetate membranes. Desalination, 96, pp. 431-439.
3. Mohammed Farooque, A., Ahamed Al-Amoudi, A.T.M. Jamaluddin, and
Ata M. Hassan, (1997), Performance Restoration, Autopsy and Analyses of Five Different Commercial SWRO Membranes, Proceedings of IDA World Congress on Desalination & Water Reuse, Madrid, Spain, Vol. II, 295-310.
4. ASTM Desalination : D4516 - 85 (Reapproved 1989). 5. Clesceri, L.S., Greenberg, A.E. and Eaton, A.D., (1998), Standard Methods of
Examination of Water and Wastewater, 20th edition, American Public Health Association.
6. ASTM, 1983, Standard Methods of Testing Cellulose Acetate Propionate and
Cellulose Acetate Butyrate, Designation: D 817 - 72 (Reapproved 1983). 7. Avlonitis, S., W.T. Hanbury, and T. Hodgkiess, 1992, Chlorine Degradation of
Aromatic Polyamides. Desalination, 85, pp. 321-334. 8. Flemming, H.C., (1993), Mechanistic aspects of reverse osmosis membrane
biofouling and prevention, In Reverse Osmosis Membrane Technology, Water Chemistry and Industrial Application (Edited by Zahid Amjad), Van Nostrand Reinhold: N. Y. USA., 163-209.
9. Baker, J.S., and Dudley, L.Y., (1998), Biofouling in membrane systems - A
review, Desalination, 118, 81-90. 10. Encyclopedia of Polymer Science and Engineering, (1985), Vol. 3, second
Edn., Eds. Mark, H.F., Bikales, N.M., Overberger, C.G., Menges, G., and Kroschwitz, J.I., John Wiley & Sons, NewYork.

Table 1. Individual module (2 elements/vessel) performance at the end of NF operation
Vessel number Normalized Flow (liter/minute)
V5 1.8
V7 2.0
V6 1.8
V8 2.9
V9 2.7
Table 2 : Foulant deposit analyses results on NF membranes
Parameter Membrane
(%) Lead Element Last Element
Ca 0.41 0.42 Fe 24 12.5 Cr 5.1 2.8 Cu 0.05 0.03 Mg 0.24 0.49 Ni 0.01 ND Si 0.08 0.09 Cl 2.9 7.2 S 5.5 3.4
Loss on ignition at 550 oC
46.5 61.2
Foulant per unit area (mg/cm2)
1.55 0.30
ND = Not detected
Table 3: Bacteria count on the membrane surface
No. of Bacteria (CFU/cm2)
Membrane Lead Element Last Element
Feed Side 1.34 × 10⁴ 5.88 × 10³
Brine Side 2.45 × 10⁴ 7.32 × 10³
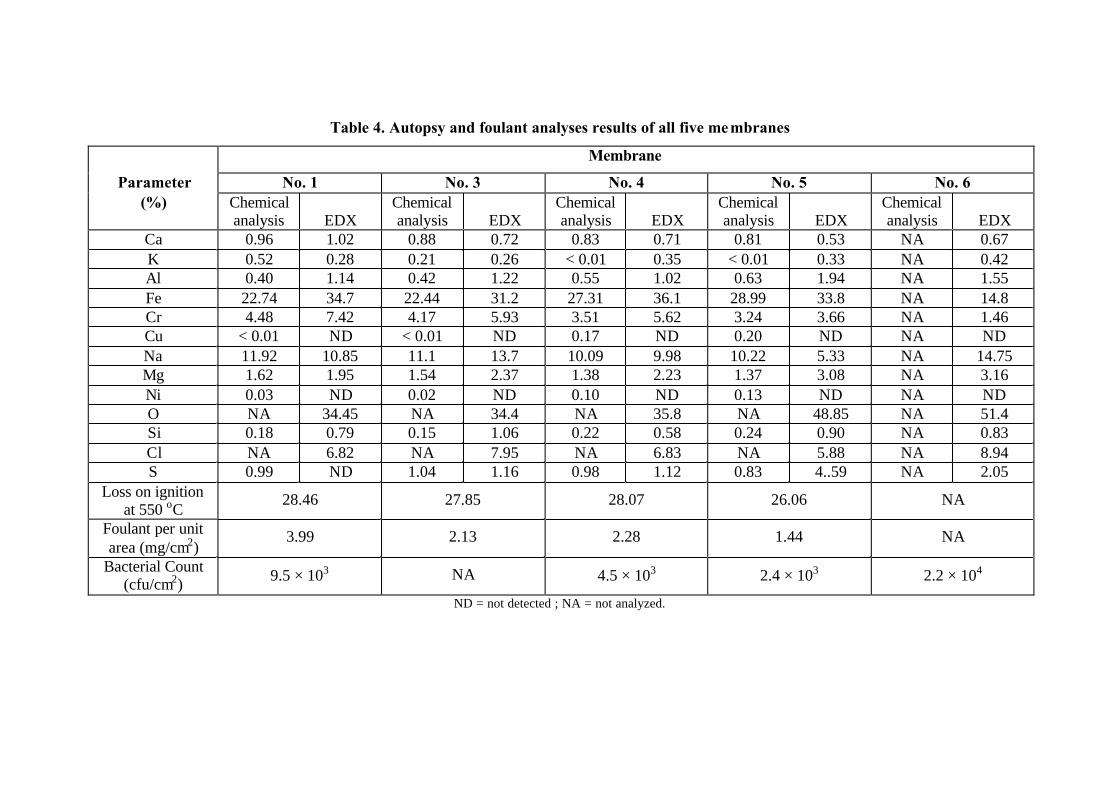
Table 4. Autopsy and foulant analyses results of all five membranes
Membrane
Parameter No. 1 No. 3 No. 4 No. 5 No. 6 (%) Chemical
analysis
EDX Chemical analysis
EDX
Chemical analysis
EDX
Chemical analysis
EDX
Chemical analysis
EDX
Ca 0.96 1.02 0.88 0.72 0.83 0.71 0.81 0.53 NA 0.67 K 0.52 0.28 0.21 0.26 < 0.01 0.35 < 0.01 0.33 NA 0.42 Al 0.40 1.14 0.42 1.22 0.55 1.02 0.63 1.94 NA 1.55 Fe 22.74 34.7 22.44 31.2 27.31 36.1 28.99 33.8 NA 14.8 Cr 4.48 7.42 4.17 5.93 3.51 5.62 3.24 3.66 NA 1.46 Cu < 0.01 ND < 0.01 ND 0.17 ND 0.20 ND NA ND Na 11.92 10.85 11.1 13.7 10.09 9.98 10.22 5.33 NA 14.75 Mg 1.62 1.95 1.54 2.37 1.38 2.23 1.37 3.08 NA 3.16 Ni 0.03 ND 0.02 ND 0.10 ND 0.13 ND NA ND O NA 34.45 NA 34.4 NA 35.8 NA 48.85 NA 51.4 Si 0.18 0.79 0.15 1.06 0.22 0.58 0.24 0.90 NA 0.83 Cl NA 6.82 NA 7.95 NA 6.83 NA 5.88 NA 8.94 S 0.99 ND 1.04 1.16 0.98 1.12 0.83 4..59 NA 2.05
Loss on ignition at 550 oC 28.46 27.85 28.07 26.06 NA
Foulant per unit area (mg/cm2)
3.99 2.13 2.28 1.44 NA
Bacterial Count (cfu/cm2) 9.5 × 10³ NA 4.5 × 10³ 2.4 × 10³ 2.2 × 10⁴
ND = not detected ; NA = not analyzed.
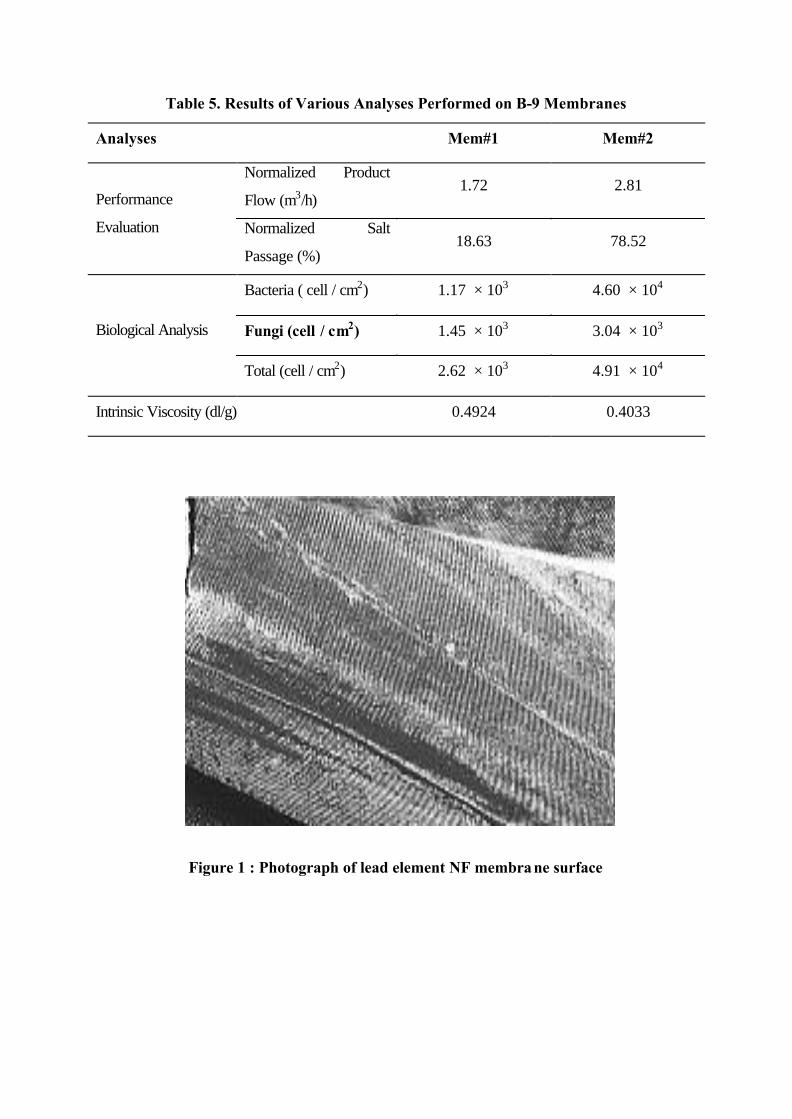
Table 5. Results of Various Analyses Performed on B-9 Membranes
Analyses Mem#1 Mem#2
Normalized Product
Flow (m3/h) 1.72 2.81
Performance
Evaluation Normalized Salt
Passage (%) 18.63 78.52
Bacteria ( cell / cm2) 1.17 × 10³ 4.60 × 10⁴
Fungi (cell / cm2) 1.45 × 10³ 3.04 × 10³ Biological Analysis
Total (cell / cm2) 2.62 × 10³ 4.91 × 10⁴
Intrinsic Viscosity (dl/g) 0.4924 0.4033
Figure 1 : Photograph of lead element NF membrane surface
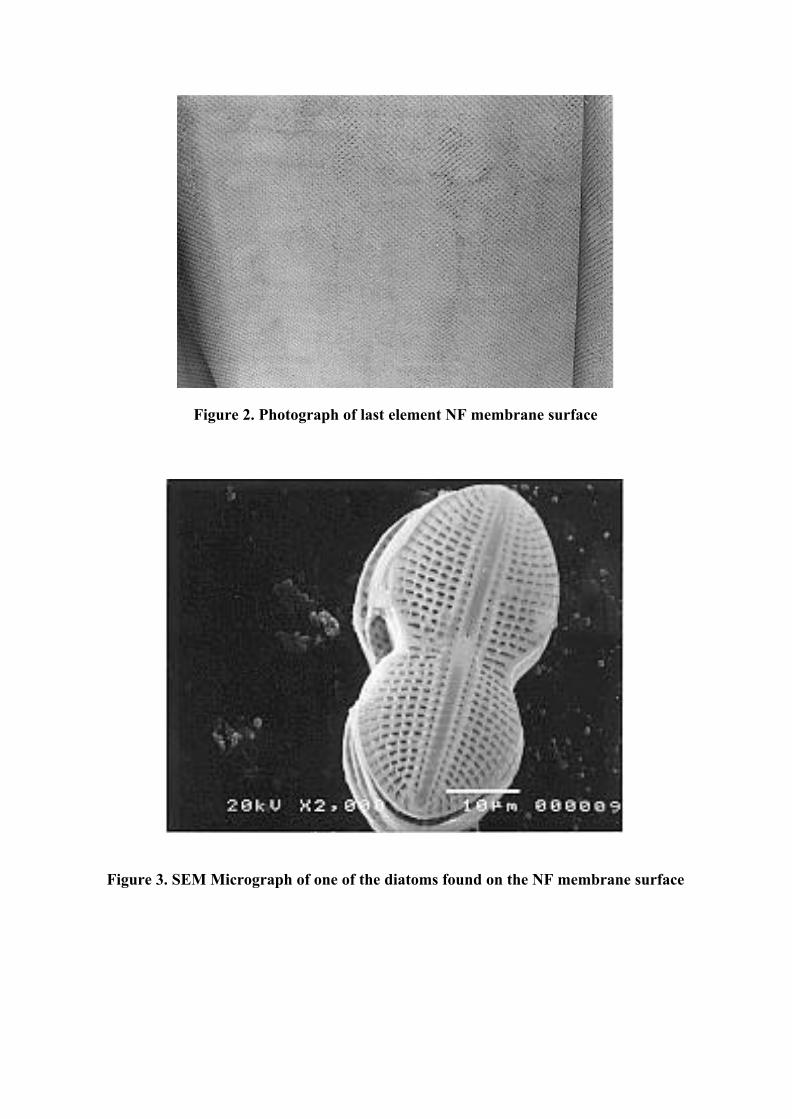
Figure 2. Photograph of last element NF membrane surface
Figure 3. SEM Micrograph of one of the diatoms found on the NF membrane surface
×× 500
0 5 10
Energy (keV)
0
200
400
600
Counts
C
O
Fe
Na
Al
SiP
S
Cl
Cl
K
Ca
V
Cr
Cr
Fe
Fe
Cu
Figure 4. SEM micrograph and EDX spectra of lead element
×× 500
0 5 10Energy (keV)
0
5
10
cps
C
O
Fe
Na
MgBr
Si
Au
S
Cl
Cl
KCa
Cr
Cr
Fe
Fe
Cu Zn AuAu
Figure 5. SEM micrograph and EDX spectra of end element
0 5 10Energy (keV)
0
200
400
600
800
1000Counts
O
Na
MgAl
Si
S
Cl
KCa
Cr
Cr
Fe
Fe
Cu Zn
Figure 6. SEM micrograph and its corresponding EDX spectrum of one of the spiral wound membrane.
0 5 10Energy (keV)0
100
200
300
400
500
Counts
O
NaAl
Si S
Cl
KCa
Ti
Cr
Cr
Fe
Fe CuZn
Figure 7. SEM micrograph and its corresponding EDX spectrum of hollow fine fiber membrane
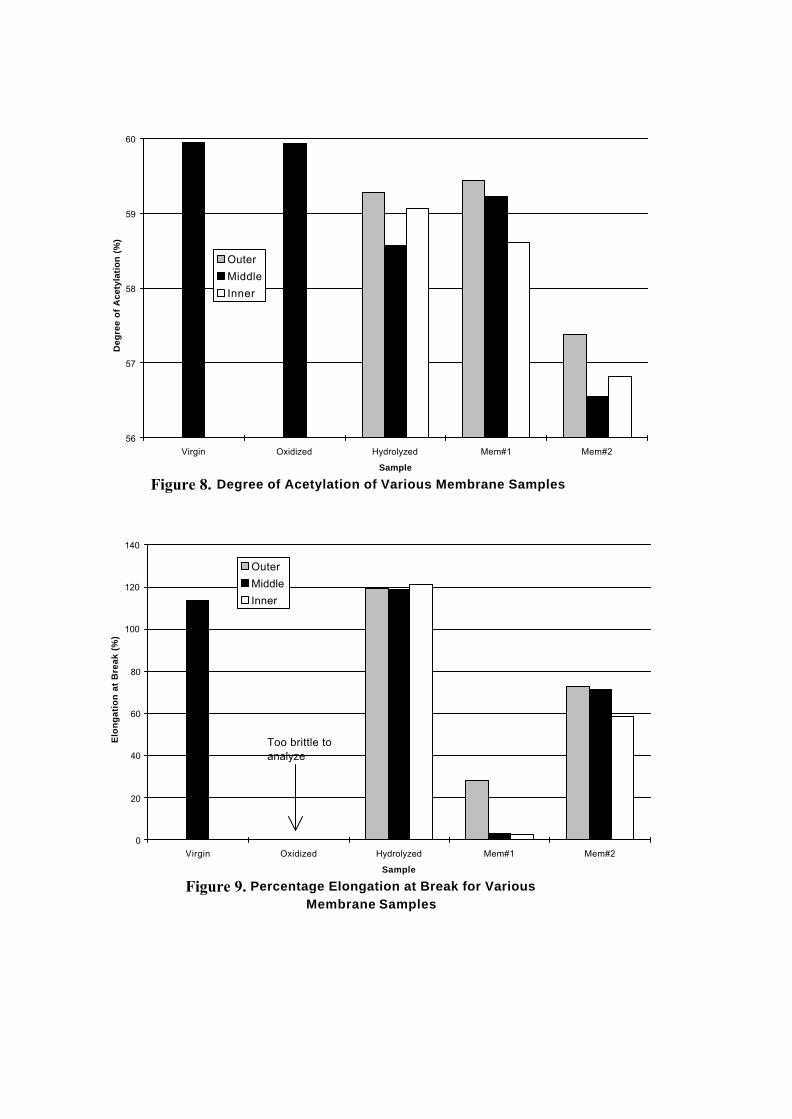
Fig.1 : Degree of Acetylation of Various Membrane Samples
56
57
58
59
60
Virgin Oxidized Hydrolyzed Mem#1 Mem#2
Sample
Deg
ree
of
Ace
tyla
tio
n (
%)
Outer
Middle
Inner
Fig. 2 : Percentage Elongation at Break for Various Membrane Samples
0
20
40
60
80
100
120
140
Virgin Oxidized Hydrolyzed Mem#1 Mem#2
Sample
Elo
ng
atio
n a
t B
reak
(%
)
Outer
Middle
Inner
Too brittle to analyze
Figure 8.
Figure 9.
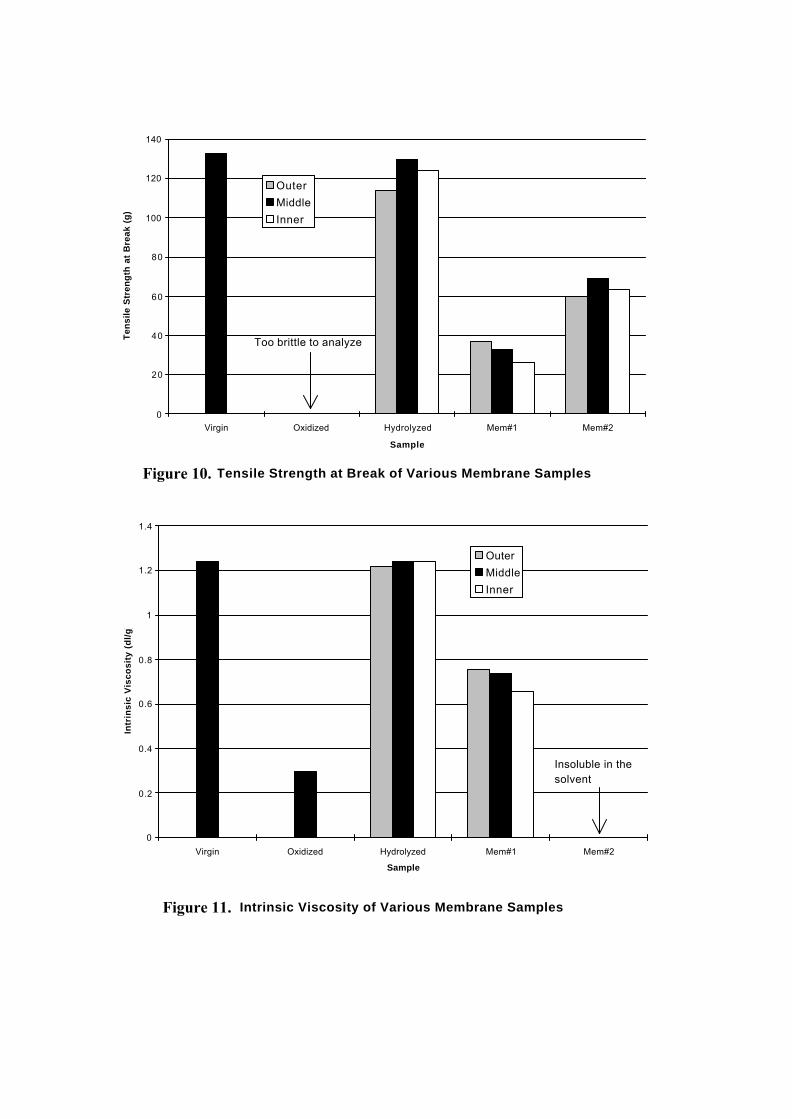
Fig. 3 : Tensile Strength at Break of Various Membrane Samples
0
20
40
60
80
100
120
140
Virgin Oxidized Hydrolyzed Mem#1 Mem#2
Sample
Ten
sile
Str
eng
th a
t B
reak
(g
)
Outer
Middle
Inner
Too brittle to analyze
Fig. 4 : Intrinsic Viscosity of Various Membrane Samples
0
0.2
0.4
0.6
0.8
1
1.2
1.4
Virgin Oxidized Hydrolyzed Mem#1 Mem#2
Sample
Intr
insi
c V
isco
sity
(d
l/g
)
Outer
Middle
Inner
Insoluble in the solvent
Figure 10.
Figure 11.
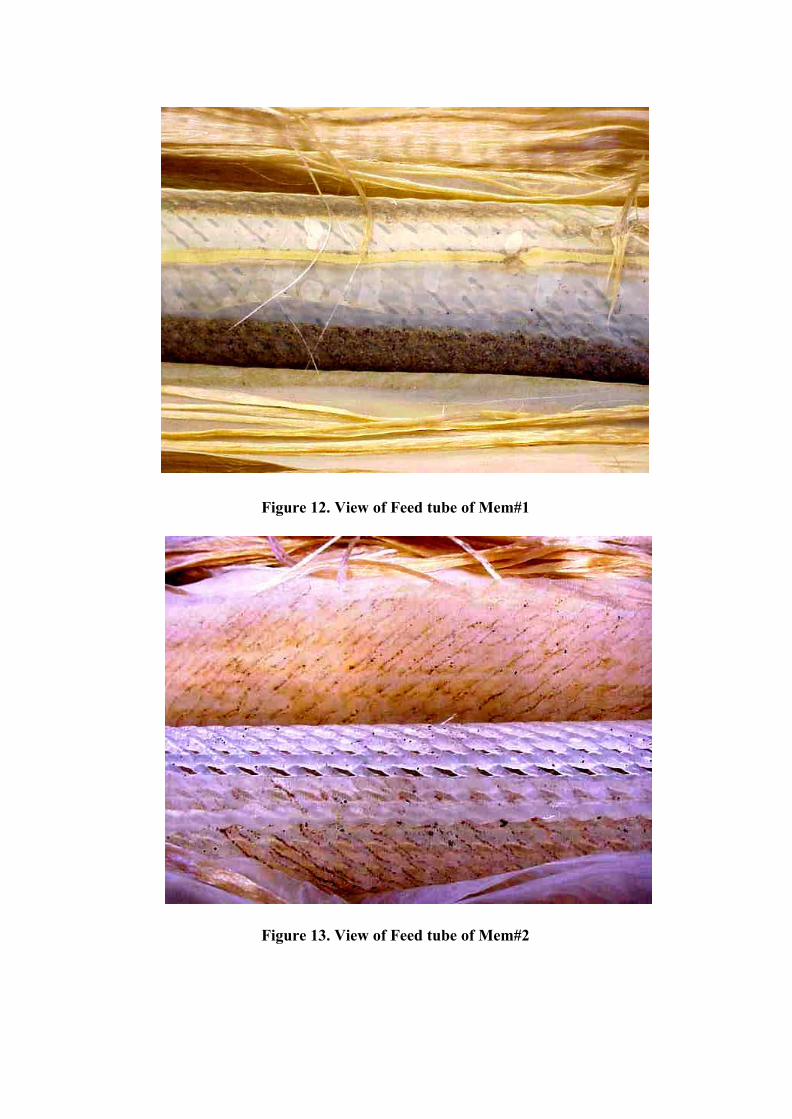
Figure 12. View of Feed tube of Mem#1
Figure 13. View of Feed tube of Mem#2
0 5 10
Energy (keV)
0
2
4
6
8
cps
C
O
NaMg
Al
Au
Au
S
Cl
Ca
Ca
I
FeCu Zn
Au
Au
Figure 14. SEM Micrograph and EDAX of a Membrane Fiber from Mem#1
0 5 10Energy (keV)
0
2
4
6
8
10
12cps
C
OFe
Cu AlSi
Au Cl CaCr
Cr
Fe
Fe
CuZn
Au
Au
Figure 15. SEM Micrograph and EDAX of a Membrane Fiber from Mem#2