Embed Size (px)
Citation preview
Automotive Battery Committee
European Starter Battery Market 2012-2016
Johann-Friedrich Dempwolff
Johnson Controls EMEA
EUROBAT AGM - Rome
June 7, 2013

1. Automotive Battery Market Volumes 2012 - 2016
2
2. Automotive Sector : Market figures
3. Automotive Sector: Trends
Automotive Battery Committee - June 2013
Agenda

Automotive Battery Market Volumes 2012 - 2016
* PC/LCV according to POLK
HCV According to LMC
Calculation Method OEM
Production figures Car and LCV* = OEM Battery potential Cars and LCV
Production figures HCV* x 1,7 Batteries = OEM Battery potential HCV
Automotive Battery Committee - June 2013 3

467 489 492 553 602
17.007 16.595 17.674 19.005 19.365
17.474 17.084 18.166
19.557 19.968
2012 2013 2014 2015 2016
HCV CARS + LCV
PC/LCV according to POLK
HCV According to LMC
Vehicle Production Europe* 2012-2016 (in m units)
Automotive Battery Market Volumes 2012 - 2016
Automotive Battery Committee - June 2013 4

PC/LCV according to POLK
HCV According to LMC
5.753 5.673 5.748 5.815 5.829
1.942 2.084 2.261 2.522 2.585
1.981 1.832 2.073 2.031 1.929
1.575 1.574 1.663 1.776 1.857 769 667 799
1.087 1.109 12.019 11.830
12.545 13.232 13.308
0
2.000
4.000
6.000
8.000
10.000
12.000
14.000
2012 2013 2014 2015 2016
Germany Spain France UK Italy
Vehicle Production per country 2012-2016 (in m units)
BIG-5 countries W. EU
Automotive Battery Market Volumes 2012 - 2016
Automotive Battery Committee - June 2013 5
PC/LCV according to POLK
HCV According to LMC
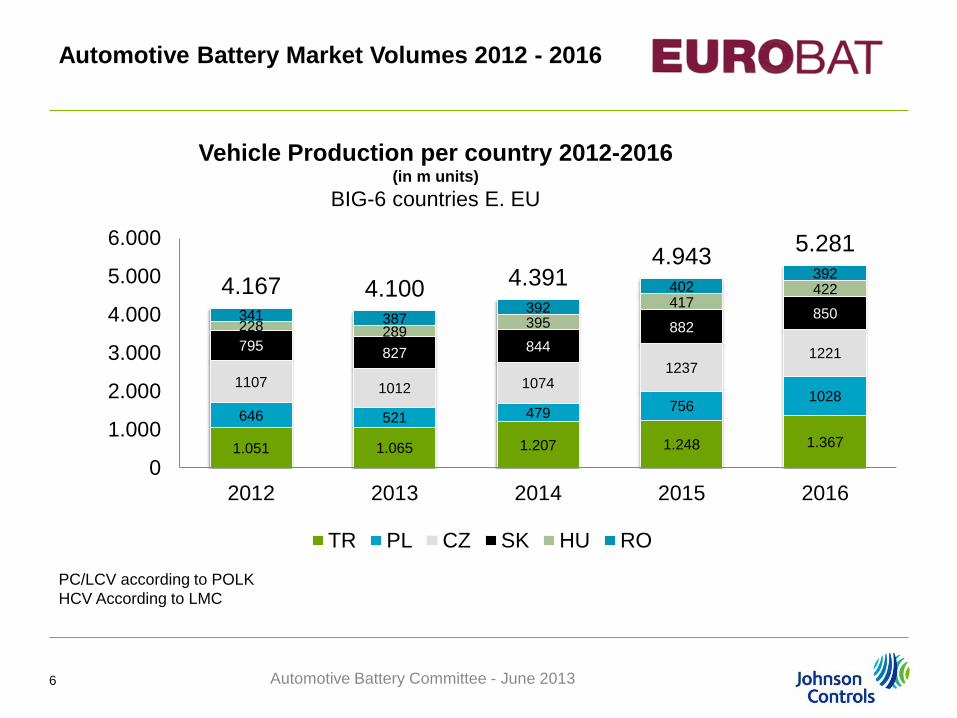
1.051 1.065 1.207 1.248 1.367
646 521 479 756
1028 1107 1012 1074
1237 1221
795 827 844
882 850
228 289 395
417 422
341 387 392
402 392
4.167 4.100 4.391 4.943
5.281
0
1.000
2.000
3.000
4.000
5.000
6.000
2012 2013 2014 2015 2016
TR PL CZ SK HU RO
Vehicle Production per country 2012-2016 (in m units)
BIG-6 countries E. EU
Automotive Battery Market Volumes 2012 - 2016
Automotive Battery Committee - June 2013 6

* Source: POLK
** Source: GIPA
Car park figures Car and LCV*
Battery replacement rate
per country (in %) **
= AM Battery potential Cars and LCV
Calculation Method Aftermarket Battery Potential
X
Automotive Battery Market Volumes 2012 - 2016
Automotive Battery Committee - June 2013 7

Replacement calculation
Replacement rate historical (up to 2012):
Evaluation of the replacement rate is provided by end consumer market
research (GIPA)
Main European countries (D,UK,ES,FR,IT,PL,CZ,H,RO,SLO,SK) are covered
by individual market studies. For the other countries a weighted average is
taken.
Replacement rate development (2013-2016):
Three different scenarios are build up , based on following presumptions:
Declining
Stable
Average
Automotive Battery Market Volumes 2012 - 2016
Automotive Battery Committee - June 2013 8
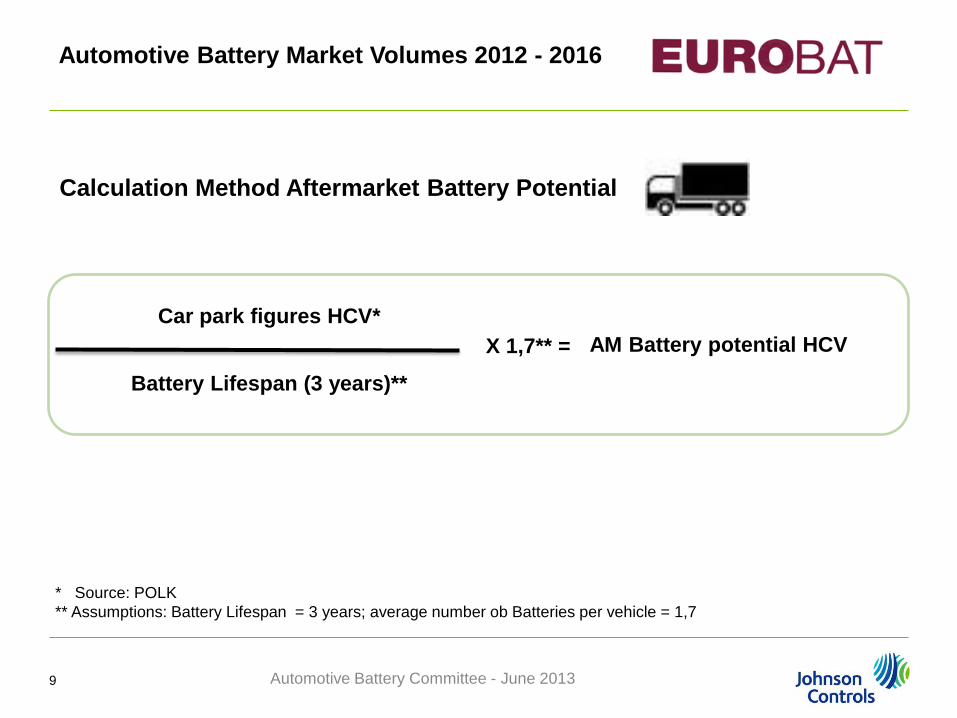
* Source: POLK
** Assumptions: Battery Lifespan = 3 years; average number ob Batteries per vehicle = 1,7
Calculation Method Aftermarket Battery Potential
Car park figures HCV*
Battery Lifespan (3 years)**
X 1,7** = AM Battery potential HCV
Automotive Battery Committee - June 2013 9
Automotive Battery Market Volumes 2012 - 2016

4.147 4.190 4.243 4.306 4.370
40.736 40.780 41.065 41.476 42.094
44.883 44.970 45.309 45.782 46.464
2012 2013 2014 2015 2016
HCV CARS + LCV
After market battery volume* 2012-2016 (in m Units)
* According to POLK and GIPA
Automotive Battery Committee - June 2013 10
Automotive Battery Market Volumes 2012 - 2016

* According to POLK and GIPA
0 2.000 4.000 6.000 8.000
IS
ET
LV
CY
M
SL
IRL
SK
LT
DK
N
H
FIN
CH
S
A
RO
CZ
P
GR
B/LUX
NL
TR
PL
GB
E
F
I
D
Battery MV Aftermarket 2013 (in m units)
D; 16%
I; 16%
F; 13%
E; 8%
GB; 8%
PL; 7%
TR; 5%
Battery Aftermarket 2013 Share per Country
Automotive Battery Committee - June 2013 11
Automotive Battery Market Volumes 2012 - 2016

17.802 17.427 18.511 19.944 20.389
44.883 44.970 45.309 45.782 46.464
62.685 62.397 63.820 65.726 66.853
2012 2013 2014 2015 2016
OEM AM
Battery Market Volumes 2012 – 2016 (in m units)
* According to POLK and GIPA
Automotive Battery Committee - June 2013 12
Automotive Battery Market Volumes 2012 - 2016

1. Automotive Battery Market Volumes 2012 - 2016
13
2. Automotive Sector : Market figures
3. Automotive Sector: Trends
Automotive Battery Committee - June 2013
Agenda

Global New Passenger Vehicle Registrations continue to increase
2012 - Overall growth of 7.2% 2011 registrations to reach 66.6 million units
Automotive Sector : Market figures
Automotive Battery Committee - June 2013 14

Global Passenger Vehicle Registrations per region 2011-2012
2012 was an excellent year for the automotive industry.......
Country/Region 2012 change from 2011
China 13.5 million +9.3%
United States 14.5 million +13%
EU 12 million -8.2%
Japan 4.6 million +29.5%
Brazil 2.9 million +7.7%
Russia 2.7 million +10.9%
India 2.5 million +11.1%
South Africa 443,000 +11%
Global 66.6 million +7.2%
* According to Volkswagen Annual Report
Automotive Battery Committee - June 2013 15
Automotive Sector : Market figures
16
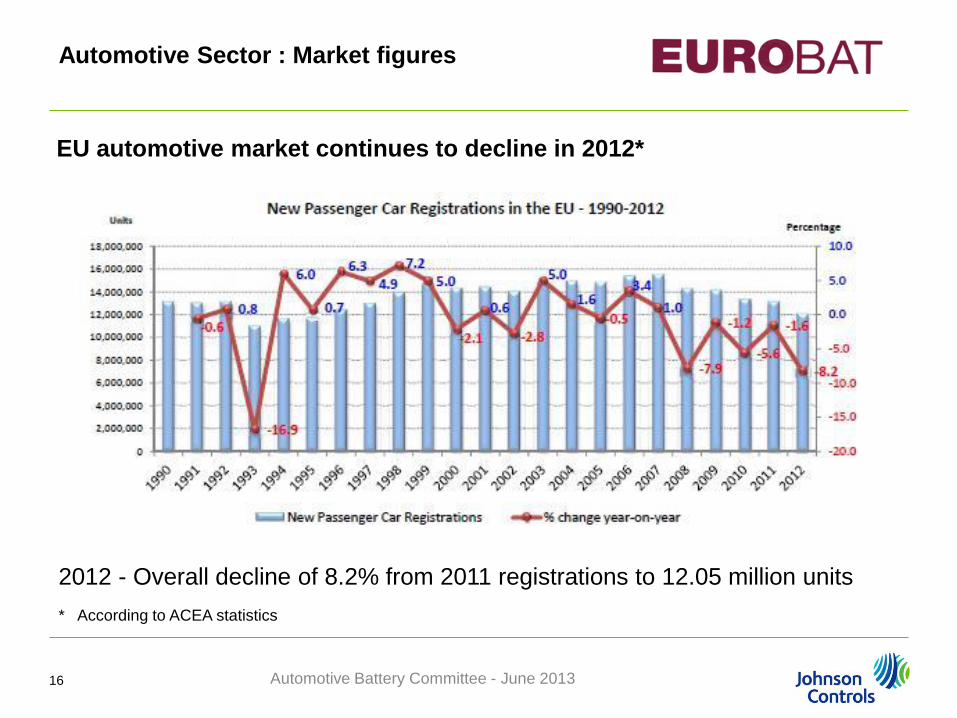
EU automotive market continues to decline in 2012*
* According to ACEA statistics
2012 - Overall decline of 8.2% from 2011 registrations to 12.05 million units
Automotive Battery Committee - June 2013
Automotive Sector : Market figures

Passenger vehicle registrations in Europe continue to decline*
Country 2012 2011 % change
Germany 3,082,504 3,173,634 -2.9
United Kingdom 2.044,609 1,941,3253 +5.3
France 1,898,760 2,204,229 -13.9
Italy 1,402,089 1,749,739 -19.9
Spain 699,589 808,051 -13.4
Rest of EU 2,926,353 3,253,560 -11.2
EU-27 12,053,904 13,130,466 -8.2
* A
cco
rdin
g to
AC
EA
sta
tistics
• Eurozone steepest decline, with registrations dropping by 11.3%
• Registrations only increase in UK, Hungary, Slovakia, Poland,
Bulgaria, Estonia, Czech Republic and Denmark
• Resulting in jobs cuts and plant closures in different Member States
Automotive Battery Committee - June 2013 17
Automotive Sector : Market figures

1. Automotive Battery Market Volumes 2012 - 2016
18
2. Automotive Sector : Market figures
3. Automotive Sector: Trends
Automotive Battery Committee - June 2013
Agenda

Automotive Battery Committee - June 2013
Automotive Sector: Trends
19
Europe
– 15% by 2015
– 25% improvement over 2015
levels by 2020
United States
– 15% by 2016
– 40+% improvement in average
fuel economy by 2025
China
‒ Aligning requirements around
EU regulations
Existing and pending legislation continues to
push automakers to introduce new technologies
179 160 116
182 162 132
154 130 95
2012 2015 2020 CO2 Targets
grams CO2/km

335.611 394.802 450.872 509.396 579.509
2012 2013 2014 2015 2016
Automotive Sector: Trends
Hybrid Electric Vehicles in operation Europe (2012-2016)*
* According to POLK and GIPA, based on models on the market in 2011/2. Surveyed countries – AU, BE, HR, CZ, DE,
FI, DE, HU, IR, IT, LU, NL, NO, PO, PT, RO, RU, ES, SI, SK, SE, CH, TU, UK
18.652 31.173
50.316 72.333
95.195
2012 2013 2014 2015 2016
Full Electric Vehicles in operation Europe (2012-2016)*
Automotive Battery Committee - June 2013 20

Automotive Battery Committee - June 2013
Future Start/Stop Technologies
Start-Stop with voltage stabilization system
“eHDi” technology with lead-acid AGM battery
and Supercaps
“Hybrid Air “ system PSA/Bosch w/o specific battery Engine off while approaching a stop,
but at vehicle speed < 20 km/h
(not after complete vehicle standstill as today)
“Stop-in-motion”: Engine off at higher
whenever acceleration is not needed
Future Market
Start-Stop functionality in 70% of new European vehicles
Research tells that 90% of all owners are very satisfied
Global Start/Stop market for new vehicles to reach 35 million by 2017
21
Automotive Sector: Trends
Automotive Battery Committee - June 2013
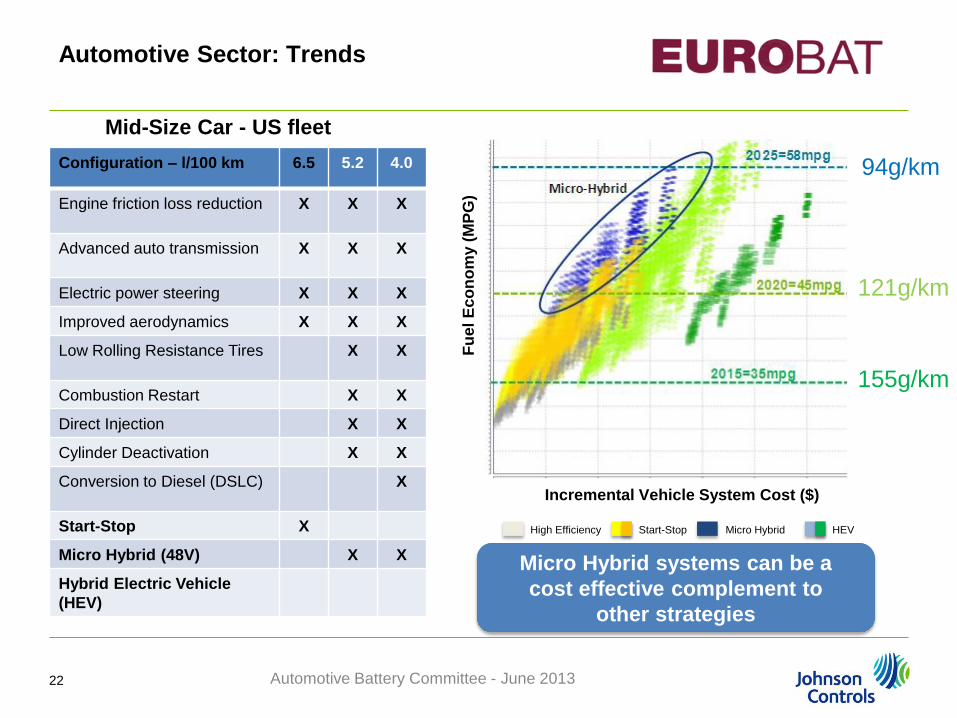
Mid-Size Car - US fleet
Configuration – l/100 km 6.5 5.2 4.0
Engine friction loss reduction X X X
Advanced auto transmission X X X
Electric power steering X X X
Improved aerodynamics X X X
Low Rolling Resistance Tires X X
Combustion Restart X X
Direct Injection X X
Cylinder Deactivation X X
Conversion to Diesel (DSLC) X
Start-Stop X
Micro Hybrid (48V) X X
Hybrid Electric Vehicle
(HEV)
Incremental Vehicle System Cost ($)
X
X
Fu
el
Ec
on
om
y (
MP
G)
X
High Efficiency Start-Stop Micro Hybrid HEV
Micro Hybrid systems can be a
cost effective complement to
other strategies
22
Automotive Sector: Trends
94g/km
121g/km
155g/km

23 Automotive Battery Committee - June 2013
€1,21 US, €1,62 EU, €1,41 China Global Gas Average € / l:
2020 Forecast (2012 look)
Updated 2020
Outlook
< 50 V +
+
+ +
Automotive Sector: Trends

Automotive Battery Committee - June 2013 24
Cost and driving range remains
the challenge for consumers
Lack of charging infrastructure also a limitation –
but EU Clean Fuels Strategy sets binding 2020
targets for charging points in Member States
Pike Research estimates 1.8 million EVs
+ 1.2 million PHEVs on EU roads by 2020
Automotive Sector: Trends

Automotive Battery Committee - June 2013 25
Thank you for
your attention !
Automotive Battery Committee