Embed Size (px)
Citation preview

Automobile Inspection and Readjustment Program Department of Public Health and Environment Performance Evaluation
November 2017
Prepared for the Colorado Office of the State Auditor by dKC de la Torre Klausmeier Consulting _____________________________________
1401 Foxtail Cove
Austin, TX 78704
(512) 447-3077
E-mail: [email protected]

Representative Tracy Kraft-Tharp – Chair Senator Tim Neville – Vice-Chair Senator Kerry Donovan Representative Lori Saine Senator Cheri Jahn Senator Jim Smallwood Representative Dan Nordberg Representative Faith Winter
Dianne E. Ray State Auditor Monica Bowers Deputy State Auditor Greg Fugate Contract Monitor de la Torre Klausmeier Consulting Contractor
AN ELECTRONIC VERSION OF THIS REPORT IS AVAILABLE AT
WWW.COLORADO.GOV/AUDITOR
A BOUND REPORT MAY BE OBTAINED BY CALLING THE
OFFICE OF THE STATE AUDITOR
303.869.2800
PLEASE REFER TO REPORT NUMBER 1680P WHEN REQUESTING THIS REPORT
LEGISLATIVE AUDIT COMMITTEE
OFFICE OF THE STATE AUDITOR
November 8, 2017
Members of the Legislative Audit Committee:
This report contains the results of a performance evaluation of the Automobile Inspection and Readjustment Program (AIR Program). The evaluation was conducted pursuant to Section 42-2-316, C.R.S., which requires the State Auditor to conduct a performance evaluation of the AIR Program every 5 years. The Office of the State Auditor contracted with de la Torre Klausmeier Consulting to conduct the evaluation. This report presents our findings, conclusions, and recommendations, and the responses of the Department of Public Health and Environment.
Robert Klausmeier Principal Consultant de la Torre Klausmeier Consulting

THIS PAGE LEFT BLANK INTENTIONALLY

Table of Contents Report Highlights 1
Glossary of Terms and Acronyms 3
Chapter 1 7
Ozone Air Quality Standards 7
Colorado’s AIR Program 11
Evaluation Purpose, Scope, and Methodology 15
Chapter 2 19
Ozone Precursor Emission Reductions 19
Air Quality and Attainment of the Ozone Standards 25
Costs and Cost-Effectiveness of the AIR Program 33
Program Modifications 37
Recommendation No. 1 41
Appendix A-1

THIS PAGE LEFT BLANK INTENTIONALLY

REPORT HIGHLIGHTS
AIR QUALITY BACKGROUND • Ozone is a common pollutant that, in high concentrations,
can cause health problems, especially in sensitive populations. Ozone is formed in the atmosphere through photochemical reactions involving ozone precursors (nitrogen oxides, hydrocarbons, and carbon monoxide). The largest source of ground-level ozone precursors comes from human activities, including fossil fuel combustion (e.g., motor vehicle emissions) and solvent usage. Naturally occurring sources of ozone precursor emissions include plants, soil, wildfires, and lightning.
• The 2008 federal ozone standards set the maximum 8-hour ozone concentration limit over a 3-year period at 75 parts per billion (ppb). In 2012, the U.S. Environmental Protection Agency (EPA) classified the Denver Metro/Northern Front Range (DM/NFR) area as being in “marginal” attainment of the 2008 ozone standards with a deadline to come into compliance by July 2015. In May 2016, the EPA redesignated the DM/NFR area from “marginal” to “moderate” nonattainment due to the failure to attain the 2008 ozone standards by the 2015 deadline.
• The 2015 federal ozone standards, which are not yet fully in effect, reduced the legal ambient ozone limit from 75 ppb to 70 ppb. Given the DM/NFR area’s current nonattainment designation under the 2008 ozone standards, this additional 5 ppb reduction in allowable ozone concentrations under the 2015 ozone standards will be a challenge for the DM/NFR area to meet.
AIR PROGRAM BACKGROUND • The AIR Program is part of the State’s overall strategy for
ensuring compliance with federal air quality standards. • The AIR Program covers all of Broomfield, Boulder, Denver,
Douglas, and Jefferson counties and parts of Adams, Arapahoe, Larimer, and Weld counties.
• Vehicles in the Program Area must pass an emissions test before they can be registered. The frequency and type of emissions test performed depends on the age of the vehicle.
• RapidScreen, which was implemented in 2004, allows qualifying vehicles to be registered based on readings from roadside monitors, thereby skipping the need for the traditional emissions test at a brick-and-mortar facility.
• In Calendar Year 2016, approximately 882,000 vehicles received an emissions test through the AIR Program. Approximately 184,000 vehicles were registered based on the results of RapidScreen readings.
• The total net cost of the AIR Program in Calendar Year 2016 was about $68.4 million. Costs borne by vehicle owners include the emissions test fee, an additional registration fee that funds the AIR Program, repair costs on vehicles that fail the emissions test, and inconvenience costs. These costs are netted against cost savings to vehicle owners from improved fuel economy as a result of vehicle repairs.
• The Colorado Department of Public Health and Environment (Department) is responsible for overseeing and administering the technical aspects of the AIR Program.
RECOMMENDATION The Department should consider (a) using on-board diagnostic information for specific diagnostic trouble codes in conjunction with IM240 test results when setting emissions pass/fail standards for certain vehicles, (b) identifying ways to reduce the number of vehicles that qualify for RapidScreen when the vehicle’s malfunction indicator light is illuminated, and (c) including an estimate of inconvenience costs in its calculations when reporting on the Program’s cost-effectiveness. The Department agreed with this recommendation.
KEY CONCLUSIONS • The Automobile Inspection and Readjustment Program (AIR Program) decreases ozone precursor emissions by about
14% or 25 tons per day, thereby providing a significant portion of the controllable ozone precursor emission reductions needed to attain compliance with the National Ambient Air Quality Standards for ozone.
• The AIR Program reduces the emission of ozone precursors at a cost of about $7,500 per ton, indicating that the Program is a cost-effective pollution control measure.
• The AIR Program’s emissions reduction benefits are primarily derived from the approximately 9% of vehicles that fail the emissions test and are subsequently repaired and pass a retest or are removed from the vehicle fleet.
Department of Public Health and Environment Automobile Inspection and Readjustment Program Performance Evaluation, November 2017

THIS PAGE LEFT BLANK INTENTIONALLY

de la Torre Klausmeier Consulting 3
Glossary of Terms and Acronyms Automobile Inspection and Readjustment Program (AIR Program or Program) – Colorado’s vehicle inspection and maintenance program authorized by Section 42-4-301, et seq., C.R.S.
AIR Program Area or Program Area – The geographic area defining those vehicles that are subject to the AIR Program’s requirements. The Program Area includes five complete counties (Boulder, Broomfield, Denver, Douglas, and Jefferson) and four partial counties (Adams, Arapahoe, Larimer and Weld). The Program Area excludes the primarily rural areas of Larimer and Weld Counties and is a subset of the larger Denver Metro/Northern Front Range area used for air quality planning purposes.
Attainment Demonstration – Refers to an analytic component of the State Implementation Plan demonstrating that the specific emissions reductions included in the State Implementation Plan are sufficient to attain the National Ambient Air Quality Standards by the applicable deadline for the nonattainment area.
Carbon Monoxide (CO) – A criteria pollutant emitted from the combustion of fossil fuels.
Criteria Pollutant – The six common, ground-level air pollutants named in the federal Clean Air Act: carbon monoxide, lead, nitrogen dioxide, ozone, particulate matter, and sulfur dioxide.
Colorado Air Quality Control Commission (Commission) – Responsible for overseeing Colorado’s air quality program pursuant to the Colorado Air Pollution Prevention and Control Act, including the development of the State Implementation Plan and the promulgation of state rules and regulations to implement the Automobile Inspection and Readjustment Program.
Colorado Department of Public Health and Environment (Department) – The state agency responsible for administering the technical aspects of the Automobile Inspection and Readjustment Program, including maintaining and analyzing emissions inspection data, reporting emissions data to the Colorado Air Quality Control Commission, and administering the licensing tests for emissions inspectors and mechanics.
Denver Metro/Northern Front Range (DM/NFR) Area – The area defined by the U.S. Environmental Protection Agency that is collectively subject to attaining the National Ambient Air Quality Standards. The DM/NFR area includes seven complete counties (Adams, Arapahoe, Boulder, Broomfield, Denver, Douglas, and Jefferson) and two partial counties (Larimer and Weld).
Diagnostic Trouble Code – Technicians use diagnostic trouble codes from the vehicle’s on-board computer to diagnose specific problems with the vehicle, such as a worn-out catalytic converter.

4 Automobile Inspection and Readjustment Program, Performance Evaluation, November 2017
Exceptional Event – An unusual or naturally occurring high-pollution event that can affect air quality (e.g., volcano eruption, wildfire, stratospheric ozone intrusion) but is not reasonably controllable or preventable by pollution control measures.
Hydrocarbons (HC) – Organic compounds consisting entirely of hydrogen and carbon. Hydrocarbons are the primary components of transportation fuels including gasoline, diesel, natural gas and propane.
IM240 Test – A dynamometer-based (rolling road) test that uses a prescribed driving cycle of accelerations and decelerations to evaluate tailpipe emissions of hydrocarbons, carbon monoxide, and nitrogen oxides. The IM240 test is a driving cycle that corresponds to 240 seconds of the Federal Test Procedure, which is used on all new vehicles to determine if they meet new vehicle certification standards.
Malfunction Indicator Lamp (MIL) – The “check engine” or “service engine soon” light on the vehicle’s instrument panel that illuminates when a potential emissions-related problem is detected.
Motor Vehicle Emission Simulator (MOVES) – A state-of-the-science modeling system developed by the U.S. Environmental Protection Agency used to estimate ozone precursor emissions from on-road motor vehicles.
National Ambient Air Quality Standards (standards) – Established by the U.S. Environmental Protection Agency under the federal Clean Air Act that specify maximum allowable levels for criteria pollutants necessary to protect public health.
Nitrogen Oxides (NOx) – Collectively refers to the two forms of gaseous oxides of nitrogen (nitric oxide and nitrogen dioxide) that are key to pollution formation. NOx emissions are produced from the reaction between nitrogen and oxygen during the combustion of fossil fuels, such as those used in electric power generation and motor vehicles. NOx emissions also occur naturally from lightning strikes and soil chemistry.
On-Board Diagnostic (OBD) – Most model-year 1996 and newer light-duty vehicles sold in the United States are equipped with OBD systems that monitor virtually all components that make up the vehicle’s engine management and emissions control systems. OBD systems can detect malfunctions or deterioration of components often well before the motorist becomes aware of any performance problems.
Ozone Design Value (ODV) – Represents the fourth-highest daily maximum 8-hour ozone concentration over the course of a year from within a geographically designated attainment area and then averaged across three consecutive years.
Parts Per Billion (ppb) – The number of units of volume of a contaminant per billion units of total volume.

de la Torre Klausmeier Consulting 5
Regional Air Quality Council (Council) – Serves as the lead air quality planning agency for the Denver Metro/Northern Front Range nonattainment area, including developing plans and proposing amendments to the State Implementation Plan to ensure compliance with the National Ambient Air Quality Standards.
Remote Sensing Device – A specially designed monitor placed at a fixed location or in a mobile unit that uses low-intensity infrared and ultraviolet beams to measure vehicle emissions under normal everyday driving conditions without the need for the vehicle to slow down or stop.
State Implementation Plan (SIP) – A state-prepared plan for complying with the federal Clean Air Act, subject to review and approval by the U.S. Environmental Protection Agency.
Two-Speed Idle (TSI) Test – A non-driving test that monitors an idling vehicle's tailpipe emissions at two distinct engine speeds (e.g., revolutions per minute).
U.S. Environmental Protection Agency (EPA) – The federal agency charged with administering the federal Clean Air Act.

6 Automobile Inspection and Readjustment Program, Performance Evaluation, November 2017
THIS PAGE LEFT BLANK INTENTIONALLY

de la Torre Klausmeier Consulting 7
Chapter 1 – Overview of the Automobile Inspection and Readjustment Program The federal Clean Air Act requires the U.S. Environmental Protection Agency (EPA) to establish National Ambient Air Quality Standards (standards), which specify the maximum allowable ambient concentrations of six common pollutants in outdoor air to protect public health. The six pollutants, also called “criteria” pollutants, are carbon monoxide, lead, ground-level ozone, nitrogen dioxide, particulate matter, and sulfur dioxide. The EPA periodically reviews and revises the standards associated with each criteria pollutant. The two most recent revisions of the standards occurred in 2012 for particulate matter and in 2015 for ozone.
The EPA refers to a geographic area that fails to comply with the standards as being in “nonattainment.” Currently, the Denver Metro/Northern Front Range (DM/NFR) area is in attainment of the standards for all criteria pollutants except ground-level ozone. Thus, the EPA has designated the DM/NFR as being in nonattainment of the ozone standards.
Federal law requires states to implement pollution-reduction strategies, such as vehicle inspection and maintenance programs, in all major metropolitan areas whose air quality fails to meet federal standards [see 42 USC 7511a(b)(4)]. Colorado’s inspection and maintenance program, known as the Automobile Inspection and Readjustment Program (AIR Program or Program), has existed since 1981 and is part of the State’s overall strategy for ensuring compliance with the standards. Mobile source emissions, which include emissions from on-road motor vehicles, constitute one of the larger categories of controllable emissions that contribute to ground-level ozone concentrations. The AIR Program specifically targets on-road emissions sources.
Ozone Air Quality Standards Ozone is the molecule formed from three oxygen atoms and is a powerful oxidant. Ozone is the common pollutant in smog and, in ground-level concentrations that exceed the standards, causes distress to humans, including chest pain, difficulty breathing, coughing, respiratory pathway irritation, diminished lung capacity, lung tissue damage, and premature death. Individuals who are most at risk from ozone pollution include those who are active outdoors, sensitive populations (e.g., children and older adults), and those with respiratory ailments such as asthma, emphysema, and chronic bronchitis. Children are at greatest risk from exposure to ozone because their lungs are still developing and they are more likely to be active outdoors when ozone levels are high, which increases their exposure. Children are also more likely than adults to have asthma.
Ground-level ozone is not a directly emitted pollutant. Rather, ozone is formed in the atmosphere by chemical reactions between gaseous oxides of nitrogen (NOx) and volatile organic compounds in the presence of sunlight. Most volatile organic compound emissions from motor vehicles are in the form of hydrocarbons, which are the primary components of gasoline and other fuels.

8 Automobile Inspection and Readjustment Program, Performance Evaluation, November 2017
Hydrocarbon and NOx emissions are termed ozone precursors because they contribute to ground-level ozone formation. Carbon monoxide is also often included as an ozone precursor because it can contribute to ground-level ozone formation, although to a lesser extent than hydrocarbons or NOx. Because increased sunlight and higher temperatures speed up the ozone-forming reactions, ground-level ozone pollution is generally a summer-season pollution phenomenon. The largest source of ground-level ozone precursors comes from human activities, including fossil fuel combustion (e.g., motor vehicle emissions) and solvent usage. However, there are also naturally occurring sources of ozone precursor emissions including plants, soil, wildfires, and lightning.
The EPA qualifies ground-level ozone as “bad ozone” to differentiate it from the ozone occurring in the Earth's upper atmosphere (i.e., the stratosphere). The EPA qualifies stratospheric ozone as “good ozone” because it forms naturally and yields environmental benefits by absorbing most ultraviolet radiation hitting the Earth, thereby providing a protective layer for plants and animals. However, there are instances under certain meteorological conditions when air from the upper atmosphere folds into the lower atmosphere and can result in elevated ground-level ozone readings.
The EPA permits nonattainment areas to exclude “exceptional events” from ozone attainment calculations. Exceptional events are unusual or naturally occurring high-pollution events (e.g., volcano eruptions, wildfires, stratospheric ozone intrusions) that can affect air quality but are not reasonably controllable or preventable by pollution control measures. Wildfires and stratospheric ozone intrusions are exceptional events that are likely to affect air quality in the DM/NFR area. It is also important to note that “exceptional” does not mean infrequent; exceptional events can be common occurrences in certain areas. The EPA must provide approval before a state can exclude exceptional events from its ozone attainment calculations.
Compliance with Ozone Standards
Upon establishing new or revised standards, the EPA goes through an implementation process, which includes the identification and designation of individual nonattainment areas based on air quality monitoring data. This designation establishes the geographic boundary of the nonattainment area, assigns a classification that categorizes the severity of the pollution problem (i.e., marginal, moderate, serious, severe, or extreme), and sets an attainment deadline based on the classification assigned.
The EPA’s determination of the DM/NFR area’s compliance with the ozone standards is based on monitoring data from air quality monitors located throughout the area. The monitoring stations record hourly ambient ozone levels from which a daily maximum 8-hour concentration is determined. At the end of each calendar year, the fourth-highest daily maximum 8-hour ozone concentration is identified for each monitor and then averaged with the monitor’s fourth-highest daily maximum ozone reading from the previous 2 years. The resulting 3-year average is known

de la Torre Klausmeier Consulting 9
as the monitor’s Ozone Design Value (ODV). If any individual monitor’s ODV exceeds the maximum ozone standards, the entire area is considered to be in nonattainment. The ODV assigned to the nonattainment area is the maximum ODV of the individual monitors meeting certain data coverage criteria (i.e., 3 years of continuous measurement, 75% of valid hourly measurements per quarter).
The EPA first established the ozone standards in 1971. There have been four revisions to the ozone standards, typically referenced by the year the revised standards were established. The two most recent revisions of the ozone standards are relevant to Colorado’s current and future ozone planning and pollution-control efforts for the DM/NFR area.
• The 2008 ozone standards set the maximum 8-hour ozone concentration limit over a 3-year period at 75 parts per billion (ppb). In 2012, the EPA classified the DM/NFR area, with an ODV of 80 ppb, as “marginal” nonattainment with a deadline to come into compliance by July 2015. In May 2016, the EPA redesignated the DM/NFR area from “marginal” to “moderate” nonattainment due to the failure to attain the 2008 ozone standards by the 2015 deadline. This increase in the classification severity reset the attainment deadline to July 20, 2018. Thus, the DM/NFR area is currently in the process of attaining the 2008 ozone standards by the July 2018 deadline.
• The 2015 ozone standards lowered the maximum allowable 8-hour ozone concentration limit over a 3-year period to 70 ppb. Although this more stringent threshold has been established, the EPA is in the initial stages of implementing the 2015 ozone standards. One of the first actions will be the identification and designation of individual nonattainment areas. The EPA’s internal deadline for completing nonattainment designations was October 2017; however, the EPA had not officially released the designations by the time this report was finalized. Once released, the EPA’s designations will provide key details including classifications and attainment deadlines. It is highly probable that the DM/NFR area will be designated as being in nonattainment of the 2015 ozone standards. One of the EPA’s final implementation actions will be the revocation of the 2008 ozone standards. Until revoked, the 2008 ozone standards and associated requirements remain in place and legally enforceable.
Exhibit 1.1 shows the 2003 to 2016 ODVs for the DM/NFR area (i.e., the maximum ODV observed over all monitors in the nonattainment area) relative to the ozone standards. The maximum allowable ODVs (denoted by the dashed line) are those limits established by the 1997 and 2008 ozone standards applicable during the period shown. The 2015 ozone standards are not shown because they were not fully implemented by the end of 2016. Exhibit 1.1 illustrates how close the DM/NFR area is to attaining the ozone standards. Specifically, by the end of 2016, the 2014-2016 ODV of 78 ppb is 3 ppb over the 75-ppb threshold set in the 2008 ozone standards.

10 Automobile Inspection and Readjustment Program, Performance Evaluation, November 2017
Exhibit 1.1. Maximum Monitor 8-hour Ozone Design Value (ODV)1 in the DM/NFR Area Three-Year Periods Ending 2003 Through 20162
Source: dKC’s analysis of air quality monitoring data provided by the Colorado Department of Public Health and Environment. 1The reported ODVs exclude Department-flagged exceptional events. 2The year reported on the horizontal axis represents the final year of the 3-year averaging period used to calculate the ODV (i.e., the year shown and the prior 2 years).
State Implementation Plan
Upon the initial designation of nonattainment, a state typically has a 3-year period to develop a State Implementation Plan (SIP), which is a federally enforceable plan that contains pollution control measures and strategies for attaining and, once achieved, maintaining compliance with the ozone standards. Subsequent to the EPA’s redesignation of the DM/NFR area to “moderate” nonattainment in May 2016, the State developed and formally adopted a revised SIP in November 2016 (referred to herein as the 2016 SIP).
The 2016 SIP includes a number of state and local air pollution control efforts for the DM/NFR area, including the AIR Program, which is described in detail in the next section of this chapter. The 2016 SIP includes an “attainment demonstration” of the 2008 ozone standards. “Attainment demonstration” is a specific term that refers to an air quality evaluation showing how an area can achieve the pollutant reductions needed to go from nonattainment to attainment of a given air

de la Torre Klausmeier Consulting 11
quality standard by a specific deadline. An attainment demonstration includes detailed, historical data for a base year (which is 2011 for the 2016 SIP), assessment of necessary control measures, and a modeled, future year attainment (which is 2017 for the 2016 SIP). The 2016 SIP for the DM/NFR area includes an attainment demonstration of the 2008 ozone standards by the end of the 2017 ozone season. The attainment deadline of July 20, 2018, is to allow for time to process and validate the 2017 ozone season measurements.
The ability of the DM/NFR area to come into compliance with the 2008 ozone standards by the 2018 deadline established for moderate nonattainment areas will depend upon measured ozone concentrations over the 2015-2017 period and the resulting ODV. Given that ozone concentrations for 2015 and 2016 are already recorded, the final measured ozone concentrations for 2017 will determine one of three possible outcomes for Colorado’s air quality planning efforts:
1. Attainment – Compliance with the 2008 ozone standard will be achieved with a 2015-2017 ODV of 75 ppb or below. The EPA would require preparation of a 20-year Maintenance Plan demonstrating continued compliance with the ozone standards.
2. Extension – The EPA would likely grant a 1-year extension of the attainment deadline for a 2015-2017 ODV above 75 ppb and a fourth-highest daily maximum ozone reading observed in Calendar Year 2017 at or below 75 ppb. The area would retain its “moderate” nonattainment designation. There is no mechanism for a downward reclassification (i.e., going back to “marginal” attainment) once the associated attainment deadline for the classification has passed.
3. Redesignation – The EPA would likely redesignate the area as “serious” nonattainment for a 2015-2017 ODV above 75 ppb and a fourth-highest daily maximum ozone reading observed in Calendar Year 2017 above 75 ppb. The attainment deadline would likely be extended by 3 years and a revised SIP would be required.
Colorado’s AIR Program The AIR Program covers all of Broomfield, Boulder, Denver, Douglas, and Jefferson counties and parts of Adams, Arapahoe, Larimer, and Weld counties (Program Area). The AIR Program requires that gasoline-powered cars and trucks pass an emissions test before they can be registered in the Program Area. Vehicles that fail the emissions test or inspection component must be repaired and undergo a successful retest before being registered. Program enforcement occurs through the denial of vehicle registrations by local county clerks’ offices.
The frequency of emissions testing depends on the age of the vehicle, as follows:
• The seven most recent model years are exempt from emissions testing requirements.

12 Automobile Inspection and Readjustment Program, Performance Evaluation, November 2017
• Model-year 1982 and newer vehicles are subject to biennial emissions testing after the seven-model-year exemption period.
• Model-year 1981 and older vehicles are subject to annual emissions testing.
With a few exceptions, vehicles must also undergo an emissions test upon a change in ownership or upon initial registration in the Program Area.
Emissions Testing Procedures
Vehicles registered in the Program Area receive one of the following three emissions tests, depending upon the age of the vehicle:
• IM240 Test – 1982 and newer vehicles that are more than 11 years old undergo a dynamometer test, called an IM240 test, which uses a treadmill-like device to simulate a driving cycle typical of urban driving. The IM240 test evaluates emissions of hydrocarbons, carbon monoxide, and NOx. Colorado has established hydrocarbon, carbon monoxide, and NOx “cutpoints” for the IM240 test that are much higher than the federal certification standards for new vehicles. Vehicles fail the IM240 test only when they exceed the cutpoints. The higher cutpoints help ensure that the IM240 test only fails those vehicles that clearly emit these pollutants at substantially higher rates than the federal standards for new vehicles.
• Two-Speed Idle (TSI) Test – Model-year 1981 and older vehicles and heavy-duty vehicles weighing more than 8,500 pounds receive a TSI test for emissions. This test measures emissions when the vehicle is at idle and at raised idle (i.e., the gas pedal is depressed to increase the engine speed to 2,500 revolutions per minute). The TSI test measures only hydrocarbon and carbon monoxide emissions and does not evaluate NOx emissions. Colorado’s TSI test uses cutpoints that were developed by the EPA.
• On-Board Diagnostic (OBD) Test – Effective January 1, 2015, all vehicles that are 8 to 11 years old undergo an OBD test. All 1996 and newer vehicles less than 8,501 pounds are equipped with OBD systems. OBD systems have up to 11 diagnostic monitors, which run periodic tests on specific systems and components (e.g., catalytic converter, oxygen sensors) to ensure that they are performing as prescribed. If the OBD system detects a problem, the malfunction indicator lamp (MIL) is illuminated. The MIL is the dashboard “check engine” or “service engine soon” light. With an OBD test, the emissions test system is plugged into the vehicle’s OBD connector and information on the status of the OBD system is downloaded. Vehicles will fail the OBD test if the MIL is commanded “on” during the test.
Colorado stopped performing IM240 or TSI tests on 8-to-11-year-old vehicles unless the vehicle has any of the following conditions:

de la Torre Klausmeier Consulting 13
o The OBD system is “not ready” to be tested. For example, Colorado requires that all OBD-inspected vehicles have the catalytic converter, oxygen sensor, and heated oxygen sensor (if equipped) monitors set to “ready” in order to have an OBD test. If the vehicle is not driven long enough or far enough for a monitor to complete its full diagnostic drive cycle, the monitor is “not ready” to relay OBD information. Some diagnostic monitors run whenever the vehicle is operating, whereas other monitors run only periodically. Depending on the vehicle, a full diagnostic drive cycle can include a combination of highway driving, stop-and-go driving, idling, and even an overnight cool-down period.
o The OBD systems’ diagnostic link connector (connection port) is damaged or missing.
o The vehicle’s OBD system could not communicate with the emissions inspection system.
Vehicles are also subjected to a gas cap test to ensure the cap is able to hold pressure and a visible smoke test to ensure there is no visible smoke being emitted from the tailpipe. Further, model year 1975 through 1995 vehicles receive an anti-tampering inspection to ensure that all of a vehicle’s key emissions devices (i.e., catalytic converter, air injection and oxygen sensor) are present and have not been subject to tampering. The IM240 test, TSI test, OBD test, gas cap test, visible smoke test, and anti-tampering inspection collectively represent the traditional emissions test currently conducted at the AIR Program’s emissions testing facilities. The current price for an emissions test is $25 for 1982 and newer vehicles and $15 for 1981 and older vehicles. In Calendar Year 2016, approximately 882,000 vehicles received traditional emissions tests through the AIR Program.
RapidScreen
RapidScreen, which was implemented in 2004, serves as an alternative to the traditional emissions test. RapidScreen uses remote sensing devices to measure emissions as vehicles drive by roadside monitors. Specifically, the monitors capture a vehicle’s hydrocarbon, carbon monoxide, and NOx emissions levels and license plate information. Vehicles that are observed to have low emissions based on the remote sensing device readings are given the opportunity to skip the traditional emissions test performed at a brick-and-mortar emissions testing facility. Two criteria are used to determine whether a vehicle passes emissions testing requirements based on RapidScreen results:
• 2-RSD – A vehicle qualifies for RapidScreen if it passes its two most recent consecutive readings within a 12-month window in the 14 months prior to registration renewal.

14 Automobile Inspection and Readjustment Program, Performance Evaluation, November 2017
• Hybrid – A vehicle qualifies for RapidScreen if it has one passing reading within a 12-month window in the 14 months prior to registration renewal and the vehicle model has historically had an exhaust failure rate less than or equal to 4%.
If a vehicle qualifies for RapidScreen, the vehicle owner is notified that he or she can forego the traditional emissions test and use the RapidScreen results to register the vehicle, thereby saving a trip to one of the brick-and-mortar emissions testing facilities. If the owner chooses to use the RapidScreen results to register his or her vehicle, he or she must pay the $25 emissions testing fee along with the registration renewal fee. Vehicles that pass emissions testing requirements based on RapidScreen results do not receive a gas cap test, visible smoke test, or an anti-tampering inspection. In Calendar Year 2016, owners registered approximately 184,000 vehicles via RapidScreen, which is about 17 percent of the 1,066,000 vehicles in the Program Area that were subject to initial tests (excluding retests).
Testing Locations
The nine-county Program Area is served by 18 emissions testing facilities with 97 inspection lanes. There are also two independent test-only stations for model year 1981 and older vehicles and 19 fleet stations that allow licensed vehicle fleet owners to self-inspect their own qualifying commercial and governmental fleet vehicles. The RapidScreen program consists of an average of 14 roadside remote sensing devices per day that are rotated among 124 locations throughout the Program Area, with the primary locations being highway entrance ramps. The State contracts with Envirotest Systems Corporation to operate and maintain all of the emissions testing facilities and the remote sensing devices.
Changes in the AIR Program Since 2012
Subsequent to the Office of the State Auditor’s last evaluation of the AIR Program in 2012, the following major changes were made to the Program’s requirements with an effective date of January 1, 2015:
• Expansion of model year exemptions from the newest four model years to the newest seven model years. Vehicles that are 8 or more years old must undergo an emissions test.
• Requirement that 8-to-11-year-old vehicles pass OBD test standards, instead of the IM240 test standards.
AIR Program Administration
Two departments share responsibility for the administration of the AIR Program. The Colorado Department of Public Health and Environment (Department) is responsible for the technical aspects of the AIR Program, including maintaining and analyzing emissions inspection data, reporting emissions data to the Colorado Air Quality Control Commission, and administering the

de la Torre Klausmeier Consulting 15
licensing tests for emissions inspectors and mechanics. For Fiscal Year 2018, the Department was appropriated about $3.8 million in cash funds from vehicle registration fees and 26.4 full-time-equivalent positions for activities related to the AIR Program.
The Department of Revenue is responsible for most of the oversight of the emissions testing facilities. These duties include issuing all inspection station, facility, mechanic, and inspector licenses and performing announced and unannounced evaluations of emissions testing facilities and remote sensing devices to ensure compliance with statutes, rules, and regulations. For Fiscal Year 2018, the Department of Revenue was appropriated about $1.3 million in cash funds from vehicle registration fees and 15 full-time equivalent positions for activities related to the AIR Program.
In addition to these two departments, the Colorado Air Quality Control Commission (Commission) and the Regional Air Quality Council (Council) have responsibilities for improving air quality in Colorado.
• The Commission is responsible for overseeing Colorado’s air quality program pursuant to the Colorado Air Pollution Prevention and Control Act [Title 25, Article 7 of the Colorado Revised Statutes]. Among the Commission’s duties are the development of the SIP and the promulgation of state rules and regulations to implement the AIR Program. The Commission’s nine members are appointed by the Governor and confirmed by the Senate.
• The Council works closely with the Commission and serves as the lead air quality planning agency for the DM/NFR nonattainment area, including developing plans and proposing amendments to the SIP to ensure compliance with national air quality standards. Established by an Executive Order of the Governor, the Council’s membership consists of no fewer than 24 members appointed by the Governor and includes state and local government leaders and representatives of the business community, environmental groups, and the general public.
Evaluation Purpose, Scope, and Methodology Section 42-4-316, C.R.S., requires the State Auditor to conduct a performance evaluation of the AIR Program every 5 years. The OSA contracted with de la Torre Klausmeier Consulting (dKC) to conduct the current evaluation. dKC is an international expert in motor vehicle inspection and maintenance programs and has worked with the OSA on three previous evaluations of Colorado’s AIR Program. As part of the current evaluation, dKC subcontracted with Oak Leaf Environmental to perform modeling and analysis of air quality data and with Eastern Research Group to assist with data compilation. Work on this evaluation was completed from March through September 2017. We appreciate the cooperation and assistance provided by management and staff at the Department of Public Health and Environment in completing this evaluation.

16 Automobile Inspection and Readjustment Program, Performance Evaluation, November 2017
In accordance with statute, the overall purpose of this evaluation was to determine the ongoing public need for the AIR Program by taking into consideration the following factors:
1. The demonstrable effect of the AIR Program on ambient air quality.
2. The cost to the public of the AIR Program.
3. The cost-effectiveness of the AIR Program relative to other air pollution control programs.
4. The need, if any, for further reduction of air pollution caused by mobile sources to attain or maintain compliance with national ambient air quality standards.
5. The AIR Program’s ability to assure compliance with legally required warranties covering air pollution control equipment.
To accomplish the evaluation’s objectives, we performed the following work:
• Reviewed federal and state statutes and regulations related to the federal Clean Air Act, the National Air Quality Control Standards, and Colorado’s AIR Program.
• Reviewed studies, reports, technical support documents, and other literature relevant to pollution control programs, air quality modeling, ambient data analysis and emission inventory development, control program cost-effectiveness, local pollutant transport and air circulation patterns, and implementation of the 2008 and 2015 ozone standards.
• Obtained and analyzed data from the following sources:
o Traditional emissions tests performed at emissions testing facilities in 2014 through 2016.
o RapidScreen remote sensing device readings in 2015 and 2016.
o AIR Program cost data for 2016.
o Air quality monitoring data for the DM/NFR area from 2000 through 2016.
• Reviewed the 2016 SIP and related attainment demonstration, including estimated ozone relative response factors and ozone source apportionment documentation and electronic modeling tools.
• Reviewed air quality modeling results from the EPA’s Regulatory Impact Analysis supporting the 2015 ozone standards.
The analyses used in this evaluation of the AIR Program are complex. We communicated with AIR Program staff throughout the evaluation to ensure common understanding and agreement of the underlying datasets, time frames, assumptions, and methodologies we used for our analyses and the basis for our conclusions. However, due to differences in the underlying datasets, time frames, assumptions, and methodologies used, the specific figures reported in this report may differ slightly from those reported by the AIR Program. These differences are expected and,

de la Torre Klausmeier Consulting 17
except where specifically noted, should not be construed as indicative of deficiencies in the AIR Program’s analyses.
Scope Exclusions
The scope of this evaluation did not include:
• The activities of the Department of Revenue or its contractor, Envirotest Systems Corporation. The evaluation focused only on the Department of Public Health and Environment.
• Quantifying the specific health benefits resulting from the AIR Program’s ozone reduction control measures. Although studies have associated excessive levels of ozone with various negative effects on public health, estimating the health benefits of reduced ozone levels was beyond the scope of this evaluation.
• Comparative analysis with the results of prior evaluations and audits due to changes in Program requirements in 2015, as well as changes in emissions testing technology, that affect the comparability of the data over time. This evaluation primarily examined Program data from Calendar Years 2015 and 2016, except where specifically noted in the report.

18 Automobile Inspection and Readjustment Program, Performance Evaluation, November 2017
THIS PAGE LEFT BLANK INTENTIONALLY

de la Torre Klausmeier Consulting 19
Chapter 2 – Effects of the AIR Program on Air Quality In accordance with state statute [Section 42-4-316, C.R.S.], the overall purpose of this evaluation was to determine the ongoing public need for the Automobile Inspection and Readjustment Program (AIR Program or Program). Overall, our analyses show that the AIR Program decreases emissions of ozone precursors in the Denver Metro/Northern Front Range (DM/NFR) area, thereby contributing to Colorado’s efforts to attain compliance with the National Ambient Air Quality Standards (standards) for ozone. In particular, on days with conditions conducive to high ozone levels, the AIR Program provides a significant portion of the controllable emission reductions needed for compliance.
This chapter discusses the results of analyses of the AIR Program’s effect on ozone precursor emissions and ambient air quality, the cost to the public of the AIR Program and the Program’s cost-effectiveness, and a recommendation to the Department of Public Health and Environment (Department) for possible Program improvements.
Ozone Precursor Emission Reductions The goal of the AIR Program is to identify high-emitting vehicles and require that they be repaired to meet emission standards. Therefore, the AIR Program’s benefits are primarily derived from the approximately 9 percent of vehicles that fail the emissions test and are (1) subsequently repaired and pass a retest or (2) removed from the vehicle fleet. Vehicle inspection and maintenance programs also have positive effects on emissions because they encourage proper vehicle maintenance before testing and deter vehicle owners from tampering with their vehicles’ emissions control systems.
As described in the following sections, we relied on three different approaches to assess the AIR Program’s impact on emissions reductions—statistical modeling, analysis of IM240 test data, and analysis of remote sensing device readings. Although the datasets and related methodologies are different from one another, they each provide independent and corroborating estimates of emissions reductions achieved through the AIR Program.
Emission Reductions Based on Statistical Modeling
We used a statistical model to estimate the AIR Program’s effect on reducing levels of ozone precursor emissions—hydrocarbons, nitrogen oxides (NOx), and carbon monoxide. Specifically, the Motor Vehicle Emission Simulator (MOVES) is a state-of-the-science modeling system developed by the U.S. Environmental Protection Agency (EPA) used to estimate ozone precursor emissions from on-road motor vehicles. MOVES incorporates a broad array of modeling parameters, including vehicle miles traveled, type of driving (e.g., high-speed freeway driving

20 Automobile Inspection and Readjustment Program, Performance Evaluation, November 2017
versus stop-and-go in-town driving), vehicle fleet characteristics, fuel quality, the presence of a vehicle inspection and maintenance program, and ambient conditions (e.g., temperature, humidity, and altitude). MOVES is the model required by federal regulations to use for estimating on-road vehicle emissions for all areas of the United States except California.
We used the current version of the EPA’s MOVES model (i.e., MOVES2014a) and 2015-2016 data from Colorado’s AIR Program to calculate reductions in ozone precursor emissions both in terms of a percent reduction and a tons-per-day reduction. Exhibit 2.1 shows that, overall, we estimate the AIR Program reduces ozone precursor emissions from on-road sources (e.g., passenger cars and light-duty trucks) by about 14% or 25 tons per day.
Exhibit 2.1. Estimated Ozone Precursor Emissions Reductions from On-Road Sources Based on MOVES Modeling
Ozone Precursors Hydrocarbons
(HC) Exhaust1
Hydrocarbons (HC)
Fuel Evaporation1
Carbon Monoxide
(CO)
Nitrogen Oxides (NOx)
Percent Reduction 22.9% 4.0% 16.3% 15.4% Tons Per Day Reduction 9.45 1.30 128.03 12.16 All Ozone Precursors
Percent Reduction Tons Per Day Reduction2
14.0% 25.05
Source: MOVES2014a model using input data provided by the Colorado Department of Public Health and Environment. Assumes average July weekday. 1Hydrocarbons are broken down into exhaust and evaporative emissions because gasoline is a volatile fuel and, as a result, about half of the hydrocarbon emissions are due to fuel evaporation. 2Tons-per-day reduction amounts estimated for the individual ozone precursors are combined using the following formula: HC+NOx+CO/60. This formula discounts the tons-per-day reduction amounts for carbon monoxide when combining with the other ozone precursors to recognize that carbon monoxide has a smaller impact on ozone levels than hydrocarbons and NOx.
Emission Reductions Based on IM240 Test Data
The AIR Program uses the IM240 test to measure ozone precursor emissions from vehicles that are more than 11 years old. We calculated the percent change in fleet emissions that resulted from the approximately 40,000 vehicles that failed their initial IM240 test and were subsequently repaired and passed a retest in the 2015-2016 inspection cycle. Overall, our analysis showed that hydrocarbon, carbon monoxide, and NOx emissions from the fleet of vehicles receiving IM240 tests were reduced by 14%, 15%, and 6%, respectively, from these repairs. These reductions are for one inspection cycle; as discussed later in this section, greater reductions are calculated for multiple inspection cycles.
Exhibit 2.2 shows the results for vehicles failing IM240 tests in terms of grams of precursor emissions emitted per mile. The difference between emissions measurements for vehicles that

de la Torre Klausmeier Consulting 21
failed the initial test and passed the retest (denoted by the red arrow) demonstrates that vehicle repairs were effective at reducing emissions. In fact, the data show that the after-repair passing retest values are close to the average values for those vehicles that passed their initial test and did not require repairs.
Exhibit 2.2. Ozone Precursor Emissions by Test Disposition 2015-2016 IM240 Test Data
Source: dKC’s analysis of AIR Program data provided by the Colorado Department of Public Health and Environment. 1Exhaust emissions only; the IM240 test does not measure evaporative emissions. 2Carbon monoxide emissions are divided by 10 to put them on the same scale as hydrocarbons and nitrogen oxides.
We also analyzed results from IM240 tests over multiple years’ inspection cycles to provide an estimate of the emission reductions from the AIR Program over a 5-year period. Specifically, we compared final test results from the 2015-2016 inspection cycle (821,746 total vehicles) with initial test results from 2011 (549,080 total vehicles). Exhibit 2.3 shows that hydrocarbon, carbon monoxide, and NOx emissions in the 2015-2016 test cycle for vehicles receiving IM240 tests were lower than 2011 values for vehicles receiving IM240 tests, despite the fact that the same model year vehicles were 4 to 5 years older in 2015-2016. In the absence of influences such as the AIR Program, emission rates by model year are expected to increase as vehicles age, due to deterioration in the performance of emission control devices such as catalytic converters.
0
0.2
0.4
0.6
0.8
1
1.2
1.4
1.6
Hydrocarbons(1) Carbon Monoxide(2) Nitrogen Oxides
gram
s per
mile
Fail Initial Pass After Fail Pass Initial

22 Automobile Inspection and Readjustment Program, Performance Evaluation, November 2017
Exhibit 2.3. Ozone Precursor Emissions Based on IM240 Test Data for Multiple Inspection Cycles (2011 to 2015-2016)
Parameters
Ozone Precursors
Hydrocarbons1 Carbon
Monoxide Nitrogen Oxides
Grams Emitted Per Mile (2011) 0.37 4.68 0.81 Grams Emitted Per Mile (2015-2016) 0.25 3.59 0.66 Percent Reduction (2011 to 2015-2016)2 32.10% 23.24% 18.54%
Source: dKC’s analysis of AIR Program data provided by the Colorado Department of Public Health and Environment. 1Exhaust emissions only; the IM240 test does not measure evaporative emissions. 2Analysis uses the same model year distribution.
Emission Reductions Based on Remote Sensing Device Readings
RapidScreen relies on remote sensing device readings taken as vehicles drive by roadside monitors. Readings are collected for most vehicles that drive by the roadside monitors, regardless of whether the results are ultimately used as the basis for passing the emissions testing requirement through RapidScreen. Therefore, even for those vehicles that undergo a traditional emissions test (i.e., IM240, OBD, or TSI), we can use remote sensing device readings from before and after the traditional emissions test to independently measure emissions reductions.
We analyzed remote sensing device data from 2015 and 2016 for those vehicles that went through a traditional emissions test during the 2015-2016 inspection cycle. We developed a dataset of 74,842 vehicles that had a remote sensing device reading up to 180 days before their initial emissions tests and also had a remote sensing device reading up to 180 days after their final emissions tests. Overall, our analysis showed that remote sensing device readings prior to vehicles’ inspections at an emissions testing facility were higher than remote sensing device readings post-inspection. Specifically, Exhibit 2.4 shows that the tested vehicle fleet experienced hydrocarbon, carbon monoxide, and NOx emissions reductions across all test types. Even vehicles that passed their initial emissions test and were not subjected to a retest consistently had lower remote sensing device readings after inspection. We attribute these emissions reductions to vehicle repairs made prior to going to the emissions testing facility, since vehicle inspection and maintenance programs tend to encourage good preventative maintenance practices. For example, a drop in the vehicle’s fuel economy, engine start problems, an illuminated malfunction indicator light (MIL), or other engine performance issues are likely to cause vehicle owners to pursue repairs prior to inspection at an emissions testing facility.

de la Torre Klausmeier Consulting 23
Exhibit 2.4. Percent Reduction in Remote Sensing Device Readings for Vehicles Undergoing Traditional Emissions Inspections in 2015-2016
Ozone Precursor Percent Reduction, All Test
Types1 Hydrocarbons2 9.07% Carbon Monoxide 9.98% Nitrogen Oxides 5.81%
Source: dKC’s analysis of AIR Program data provided by the Colorado Department of Public Health and Environment. 1Includes vehicles undergoing IM240, OBD, or TSI tests. 2Exhaust emissions only; the IM240, OBD, and TSI tests do not measure evaporative emissions.
In addition to providing a way to independently measure emissions reductions for those vehicles undergoing a traditional emissions test, the remote sensing device data also provide a way to compare, on a limited basis, the effectiveness of OBD tests with IM240 tests. Beginning in January 2015, vehicles that are between 8 and 11 years old are subjected to OBD pass/fail standards instead of IM240 pass/fail standards. Vehicles more than 11 years old continue to receive advisory-only OBD tests, but pass/fail determination is based solely on IM240 test results. We analyzed remote sensing device data on all vehicles that received both OBD and IM240 tests after passing by the roadside monitors. Emission levels for vehicles that passed OBD tests were lower than emission levels for vehicles that passed IM240 tests—hydrocarbon emissions were 7% lower, carbon monoxide emissions were 3% lower, and NOx emissions were 4% lower. These results indicate that the Colorado Air Quality Control Commission’s (Commission) decision to subject 8-to-11-year-old vehicles to OBD test standards instead of IM240 test standards appears to have increased the AIR Program’s emissions reduction benefits. However, due to the limited nature of our analysis, which was not to perform a comprehensive comparison of the two test types, these results should not be considered conclusive support for further expanding the use of OBD testing on older vehicles.
Expanding Model-Year Exemptions
Section 42-4-306(8), C.R.S., grants the Commission the authority to exempt vehicles of any make, model, or model year from the testing requirements of the AIR Program. Effective January 1, 2015, the Commission expanded model-year exemptions from the most recent four model years to the most recent seven model years. Seven model years is currently the highest exemption limit in vehicle inspection and maintenance programs nationwide.
As part of our evaluation, we analyzed AIR Program data to determine whether additional model-year exemptions are warranted. Based on the results of our analysis, we do not recommend expanding model-year exemptions beyond the current seven model years. The primary reason for this is because, as discussed previously, the AIR Program’s benefits are derived mainly from those high-emitting vehicles that fail the emissions test and are (1) subsequently repaired and

24 Automobile Inspection and Readjustment Program, Performance Evaluation, November 2017
pass a retest or (2) removed from the vehicle fleet. The more older vehicles that are exempted from emissions testing requirements, the less of a benefit in terms of emissions reductions the AIR Program provides.
Exhibit 2.5 shows the cumulative emissions reductions from the highest to lowest model year. The oldest model year in our analysis was 1994; there were too few observations of 1993 and older vehicles to provide reliable results. The newest model years falling just after the 7-year exemption period and that currently undergo emissions testing account for a significant portion of the emissions reductions. For example, emissions testing on model year 2009 vehicles is estimated to account for between 2% and 3% of the total emissions reductions. Therefore, if three more model years were exempted from emissions testing requirements (i.e., model years 2007 through 2009), we estimate that emission reductions would drop by 9% based on MOVES model estimates and 12% based on analysis of remote sensing device data.
Exhibit 2.5. Cumulative Emissions Reductions in 2016 by Model Year
Model Year
Emissions Reductions Based on MOVES Model Estimates1
Based on Remote Sensing Device Data2
2009 3% 2% 2008 6% 6% 2007 9% 12% 2006 14% 16% 2005 18% 20% 2004 23% 27% 2003 30% 35% 2002 37% 44% 2001 43% 52% 2000 51% 63% 1999 59% 76% 1998 64% 84% 1997 68% 91% 1996 74% 95% 1995 89% 99% 1994 100% 100%
Source: dKC’s analysis of AIR Program data provided by the Colorado Department of Public Health and Environment. 1Based on the results of dKC’s MOVES modeling to estimate tons-per-day reductions in ozone precursor emissions. Cumulative emissions reductions shown are for 1994 and newer vehicles. MOVES estimates that 30% of the AIR Program’s emissions reduction benefits are from 1993 and older vehicles. 2Based on an analysis of before- and after-test remote sensing device readings for vehicles undergoing a traditional emissions test. Remote sensing device data were not adequate to estimate emission reductions from 1993 and older vehicles.

de la Torre Klausmeier Consulting 25
A secondary factor in assessing expanded model year exemptions is the impact on RapidScreen, which, due to its convenience, is a popular component of the AIR Program. When model year exemptions went from 4 to 7 years, the number of vehicles qualifying for RapidScreen dropped by 28% because relatively lower-emitting vehicles, which are prime candidates for RapidScreen, were exempted from emissions testing requirements. If three more model years were exempted, we estimate that the number of RapidScreen candidates would drop by an additional 32%. This drop in the number of RapidScreen candidates may ultimately affect the cost-effectiveness of this component of the AIR Program. The cost to collect the remote sensing device data would remain the same; however, fewer qualifying vehicles would be available to bear these costs.
Air Quality and Attainment of the Ozone Standards We evaluated the air quality impact of the AIR Program on ground-level ozone concentration relative to both the 2008 and 2015 versions of the ozone standards. The starting point for our analysis was to examine ambient air quality monitoring data for the past 11 years to ascertain ozone pollution trends and to quantify the State’s progress in meeting the July 2018 deadline for attainment of the 2008 ozone standards.
The ozone design value (ODV) is the 3-year average of the fourth-highest daily 8-hour maximum observed ozone reading over the course of a year. The EPA permits nonattainment areas to exclude monitor results from ODV calculations on those days when exceptional events were occurring. Exceptional events are unusual or naturally occurring high-pollution events, such as wildfires and stratospheric ozone intrusions, that can affect air quality but are not reasonably controllable or preventable by pollution control measures. The EPA administers a notification and approval process for exceptional events before they can be officially excluded from ODV calculations. The Department began flagging exceptional events in 2010. The Department has flagged all exceptional event dates in the EPA’s Air Quality System and has developed and submitted one exceptional event demonstration to the EPA (for May 24, 2010). The EPA declined to act on this event because it did not affect the DM/NFR area’s designation status. With this understanding, the Department has not taken the time needed to develop and submit other formal ozone exceptional event documents to the EPA, but reports that it will do so, as needed, to demonstrate attainment of the 2008 ozone standards. ODVs used to determine Colorado's compliance with the ozone standards will ultimately exclude air quality readings for any high-pollution days resulting from approved exceptional events. The following discussion of air quality and attainment of the ozone standards generally excludes Department-flagged exceptional events under the presumption that they would be approved by the EPA.
Exhibit 2.6 summarizes the trends in ambient air quality monitoring data from 2006 through 2016 for the seven monitors in the DM/NFR area with the highest recorded ozone concentrations. Overall, the results show an average decline in ozone concentrations and confirm the overall trend within the nonattainment area towards reduced ozone concentrations over the period examined.

26 Automobile Inspection and Readjustment Program, Performance Evaluation, November 2017
Exhibit 2.6. Annual Change in Ozone Concentrations Calendar Years 2006 Through 2016
(parts per billion per year)
Monitor1
Annual Change in Ozone Concentration
2006 Through 2016 Including Exceptional
Events
Annual Change in Ozone Concentration 2010 Through 2016
Excluding Exceptional Events2
Chatfield
-0.28 -0.50 Fort Collins West -0.71 -0.57 Highland -0.30 -1.62 National Renewable Energy Lab 0.21 0.36 Rocky Flats North3 -0.85 -0.36 Welby -0.20 -0.07 Welch -0.40 -0.46 Average, All Monitors -0.40 -0.50 Source: dKC’s analysis of air quality monitoring data provided by the Colorado Department of Public Health and Environment. 1The seven monitors in the Denver Metro/Northern Front Range area with the highest recorded ozone concentrations over the period examined. 2The Colorado Department of Public Health and Environment began flagging exceptional events in 2010. 3Only the Rocky Flats North trend from 2006 to 2016 that includes exceptional events is statistically significant at a 90% confidence level.
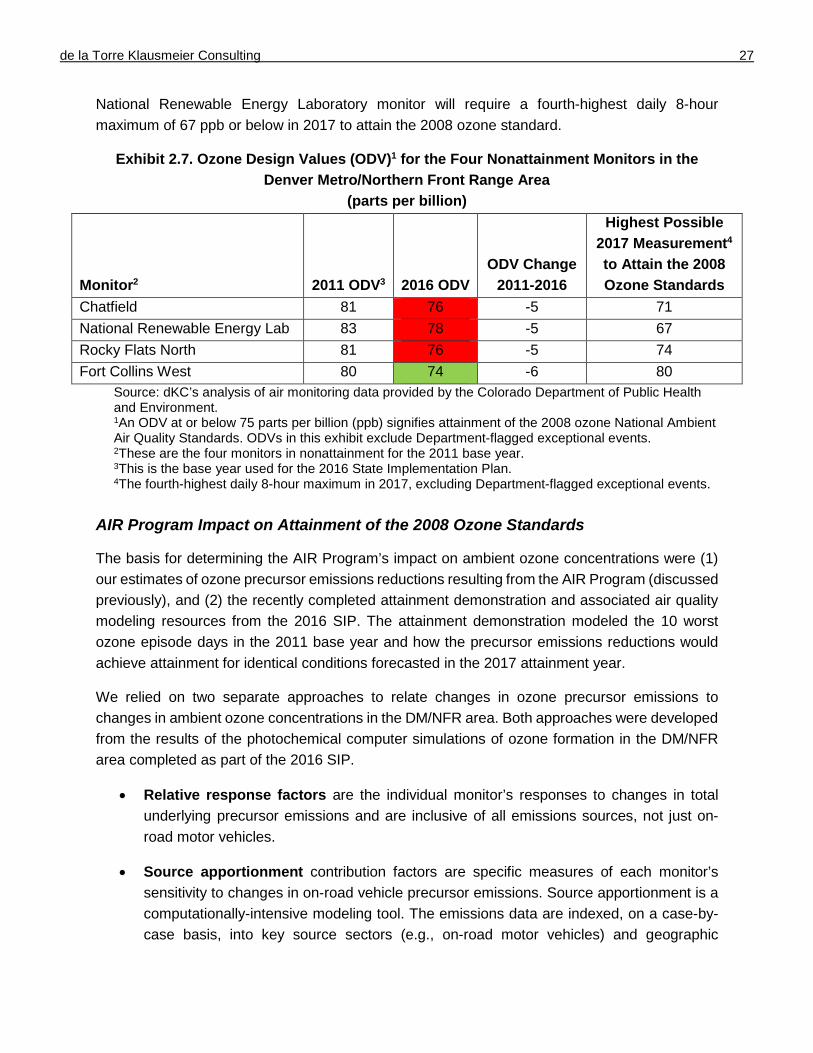
According to the State Implementation Plan for the 2008 ozone standards submitted to the EPA in 2016 (referred to herein as the 2016 SIP), four of the DM/NFR area’s ozone monitors were out of attainment in 2011 (Chatfield, National Renewable Energy Lab, Rocky Flats North, and Fort Collins West), which was the base year for the SIP. Of these, three monitors remained out of attainment in 2016 (Chatfield, National Renewable Energy Lab, and Rocky Flats North). Attainment of the 2008 ozone standards will be achieved if the 2017 ODV–a 3-year average over 2015 to 2017–equals 75 ppb or less. Exhibit 2.7 summarizes the relevant monitoring data that show an ODV reduction of 5 to 6 ppb for each nonattainment monitor in the 5-year period since 2011. Notably, only the Fort Collins West monitor (shaded in green) has achieved attainment based on the 2016 ODV. The remaining three monitors (shaded in red) remain 1 to 3 ppb from attainment, even after excluding exceptional events, and, therefore, are keeping the entire DM/NFR area in nonattainment.
Colorado has until July 20, 2018, to come into compliance with the 2008 ozone standards. Attainment will be determined based on ambient ozone measurements through 2017 (i.e., 2017 ODV). Because the 2017 ODV is based on a 3-year average, and we already know measurements for 2015 and 2016, in Exhibit 2.7 we calculate what the highest possible ozone measurement for 2017 can equal while still attaining the 2008 ozone standards. For example, the
de la Torre Klausmeier Consulting 27
National Renewable Energy Laboratory monitor will require a fourth-highest daily 8-hour maximum of 67 ppb or below in 2017 to attain the 2008 ozone standard.
Exhibit 2.7. Ozone Design Values (ODV)1 for the Four Nonattainment Monitors in the Denver Metro/Northern Front Range Area
(parts per billion)
Monitor2 2011 ODV3 2016 ODV ODV Change
2011-2016
Highest Possible 2017 Measurement4 to Attain the 2008 Ozone Standards
Chatfield 81 76 -5 71 National Renewable Energy Lab 83 78 -5 67 Rocky Flats North 81 76 -5 74 Fort Collins West 80 74 -6 80
Source: dKC’s analysis of air monitoring data provided by the Colorado Department of Public Health and Environment. 1An ODV at or below 75 parts per billion (ppb) signifies attainment of the 2008 ozone National Ambient Air Quality Standards. ODVs in this exhibit exclude Department-flagged exceptional events. 2These are the four monitors in nonattainment for the 2011 base year. 3This is the base year used for the 2016 State Implementation Plan. 4The fourth-highest daily 8-hour maximum in 2017, excluding Department-flagged exceptional events.
AIR Program Impact on Attainment of the 2008 Ozone Standards
The basis for determining the AIR Program’s impact on ambient ozone concentrations were (1) our estimates of ozone precursor emissions reductions resulting from the AIR Program (discussed previously), and (2) the recently completed attainment demonstration and associated air quality modeling resources from the 2016 SIP. The attainment demonstration modeled the 10 worst ozone episode days in the 2011 base year and how the precursor emissions reductions would achieve attainment for identical conditions forecasted in the 2017 attainment year.
We relied on two separate approaches to relate changes in ozone precursor emissions to changes in ambient ozone concentrations in the DM/NFR area. Both approaches were developed from the results of the photochemical computer simulations of ozone formation in the DM/NFR area completed as part of the 2016 SIP.
• Relative response factors are the individual monitor’s responses to changes in total underlying precursor emissions and are inclusive of all emissions sources, not just on-road motor vehicles.
• Source apportionment contribution factors are specific measures of each monitor’s sensitivity to changes in on-road vehicle precursor emissions. Source apportionment is a computationally-intensive modeling tool. The emissions data are indexed, on a case-by-case basis, into key source sectors (e.g., on-road motor vehicles) and geographic

28 Automobile Inspection and Readjustment Program, Performance Evaluation, November 2017
locations (e.g., in-state and out-of-state sources). This indexing information is retained throughout the photochemical modeling analysis. The end result is that the model tracks ozone formation and can “apportion” the ozone produced back to the originally prescribed set of source sectors and/or geographic locations.
Although both approaches are informative and presented herein for comparative purposes, we believe that the analysis based on source apportionment contribution factors provides a more accurate assessment of the AIR Program’s impacts because it uses a direct measurement of ozone changes resulting from changes in on-road emissions, whereas the relative response factors treat all emissions sources (e.g., on-road vehicles, other off-road mobile sources, and stationary sources such as power plants) equally. The ozone source apportionment data from the 2016 SIP have not previously been available and, therefore, represent new information for improving the Department’s and other air quality planning agencies’ understanding of the effects of the AIR Program on ozone concentrations in the DM/NFR area.
Fundamentally, the benefit of the AIR Program has to be determined relative to the absence of the Program. Therefore, we forecasted the emissions impact of the AIR Program in 2017 based on the application of the MOVES model for two cases—with and without the AIR Program. We also completed additional MOVES modeling for 2011 and 2017 to validate consistency between the method employed in this evaluation with that of the 2016 SIP.
The 2016 SIP estimates that the AIR Program will reduce the total on-road ozone precursor emissions inventory (hydrocarbons, carbon monoxide, and NOx) in 2017 by about 14 percent, or 21 tons per average ozone season day. This estimated decrease in on-road ozone precursor emissions in 2017 yields the projected changes in ambient air quality shown in Exhibit 2.8. Specifically, our analysis using the source apportionment contribution factors shows that the effect of the AIR Program, as quantified by the change in estimated 2017 ODVs for the four nonattainment monitors in the 5-year period since 2011, is a 0.6 to 0.8 ppb reduction in the ozone levels that would not have otherwise occurred in the absence of the Program. Additionally, for these four monitors, our analysis using the source apportionment contribution factors shows a higher estimated air quality impact (when compared with the analysis using the relative response factors), signifying that emissions from on-road sources such as motor vehicles disproportionately produce more ozone than the equivalent emissions from the remaining sources (e.g., other off-road mobile sources and stationary sources such as power plants).

de la Torre Klausmeier Consulting 29
Exhibit 2.8. Estimated Effect of the AIR Program on Ambient Air Quality Change in 2017 Ozone Design Values (ODV)
(parts per billion)
Monitor
Change in Estimated 2017 ODVs Analysis Using
Relative Response Factors
Analysis Using Source Apportionment Contribution Factors
Chatfield -0.4 -0.8 Rocky Flats North -0.3 -0.7 National Renewable Energy Laboratory -0.3 -0.7 Fort Collins West -0.5 -0.6 Source: dKC’s analysis of AIR Program data provided by the Colorado Department of Public Health and Environment and relative response factors and ozone source apportionment factors from the 2016 State Implementation Plan.
Potential for Further Ambient Ozone Reductions
The new 2015 ozone standards reduced the legal ambient ozone limit from 75 ppb to 70 ppb. The EPA’s internal deadline for completing nonattainment designations was October 2017; however, the EPA had not officially released the designations by the time this report was finalized. Upon publication of the nonattainment regions, the Department and the Commission will likely have a 3-year period to develop a SIP for attaining the 2015 ozone standards.
The additional 5 ppb reduction in ozone concentrations called for by the 2015 ozone standards will be a challenge for the DM/NFR area to meet. Based on our analyses of the 2016 ODVs, the four monitors that are currently out of attainment with the 2008 ozone standards (Chatfield, Rocky Flats North, National Renewable Energy Laboratory, and Fort Collins West) would likely be out of attainment with the 2015 ozone standards and, therefore, so would be the entire DM/NFR area. The 2016 ODVs for the remaining 15 monitors in the area were at or below 70 ppb in 2016.
Exhibit 2.9 shows data on the average ozone concentrations used in the 2016 SIP to demonstrate attainment of the 75-ppb threshold for the four nonattainment monitors in the DM/NFR area. The data show that between 16 and 19 ppb of the total ozone in the DM/NFR area originated from in-state emissions sources. Therefore, to reduce ozone concentrations an additional 5 ppb to meet the new 2015 ozone standards, these monitors would have to register further reductions of ozone from in-state sources of 25% to 30%.

30 Automobile Inspection and Readjustment Program, Performance Evaluation, November 2017
Exhibit 2.9. Average Ozone Concentrations from the 10 Highest 8-Hour Ozone Dates in the 2016 State Implementation Plan1 by Emissions Source
(parts per billion)
Monitor All Emissions
Sources
In-State Emissions Sources
Out-of-State Emissions Sources
Chatfield 71.8 16.4 55.4 Rocky Flats North 71.7 18.3 53.4 National Renewable Energy Laboratory 71.9 17.5 54.4 Fort Collins West 70.6 19.1 51.6
Source: dKC’s analysis of data and results from the 2016 State Implementation Plan’s attainment demonstration. 1In-state versus out-of-state sources were identified through ozone source apportionment modeling as part of the 2016 State Implementation Plan. The modeling domain of the ozone simulations included the whole of North America in order to adequately capture pollutant transport and minimize the impact regarding boundary condition assumptions.
A significant component of the out-of-state ozone concentrations reported in Exhibit 2.9 is “background” ozone. The EPA defines the United States background ozone as the estimated ozone concentration if all U.S. man-made emissions sources were eliminated. In the absence of U.S. man-made emissions, background ozone occurs from (1) international transport (i.e., ozone from transpacific sources and Canada and Mexico), (2) sources such as volcanoes and wildfires, and (3) stratospheric ozone intrusions.
States in the Rocky Mountain region have the highest ozone background concentrations in the nation. Exhibit 2.10 is the graphical representation of the EPA’s spatial analysis of the United States background ozone showing that 41 to 50 ppb is the typical range observed for the Rocky Mountain region, including the DM/NFR area. Although the EPA’s allowances for excluding exceptional events from ODV calculations is intended to remove the influence of non-man-made events such as wildfires and stratospheric ozone intrusions, the higher levels of background ozone observed in the DM/NFR area potentially puts it at a disadvantage in attaining the lower 2015 ozone standards because the allowable threshold for ozone formation from human-related activities is correspondingly less.

de la Torre Klausmeier Consulting 31
Exhibit 2.10. EPA-Estimated Seasonal Mean U.S. Background Ozone Concentrations at U.S. Surface Monitoring Locations
Source: U.S. Environmental Protection Agency, White Paper for Discussion, “Implementation of the 2015 Primary Ozone NAAQS: Issues Associated with Background Ozone,” December 2015.

32 Automobile Inspection and Readjustment Program, Performance Evaluation, November 2017
AIR Program Impact on Attainment of the 2015 Ozone Standards
Technically, it is not possible to assess the AIR Program’s impact on attainment of the 2015 ozone standards until the nonattainment classifications and associated attainment dates are published by the EPA for each area. However, the most relevant information available on the 2015 ozone standards at the time of our evaluation was a national air quality analysis completed by the EPA that examined the emissions and costs associated with attaining the 2015 ozone standards over the contiguous 48 states. Attainment was based on a forecasted 2025 deadline to achieve the 2015 ozone standard.
Exhibit 2.11 presents the current (2016) and EPA-forecasted (2025) ODVs of the four nonattainment monitors in the DM/NFR area that are the focus of the attainment demonstration in the 2016 SIP. Specifically, the 2025 ODVs projected by the EPA represent reductions of 3 to 7 ppb from the current 2016 values for all four monitors. However, three of the monitors (shaded in red) are still projected to exceed the 2015 ozone standards with estimated 2025 ODVs of 71 ppb. The EPA’s 2025 projections included emissions reductions resulting from the AIR Program, indicating that it would take additional emissions controls beyond those already enacted to bring these three monitors into attainment of the 2015 ozone standards.
Exhibit 2.11. 2016 ODVs and EPA-Projected 2025 ODVs for the Four Nonattainment Monitors in the Denver Metropolitan/Northern Front Range Area
(parts per billion)
Monitor 2016 ODVs EPA-Projected 2025
ODVs Chatfield 76 70 Rocky Flats North 78 71 National Renewable Energy Laboratory 76 71 Fort Collins West 74 71 Source: dKC’s analysis of data from the U.S. Environmental Protection Agency’s Regulatory Impact Analysis supporting rulemaking for the 2015 National Ambient Air Quality Standards.
We performed an independent 2025 projection of vehicle activity, on-road emissions inventory, and the emissions impact of the AIR Program within the DM/NFR area, factoring in current demographic projections by county. The results of this projection are summarized in Exhibit 2.12 and show that the inventory of on-road ozone precursor emissions is projected to decrease by 38 percent by 2025, despite an estimated 16 percent increase in the number of vehicles and vehicle miles traveled. Nationally, the on-road emissions inventory is declining over time as newer, cleaner vehicles replace older, higher-emitting vehicles. Although there is a level of uncertainty when projecting into the future, these projections suggest that reductions in ozone precursor emissions resulting from the AIR Program are expected to decline over time, as will the AIR Program’s impact on ozone levels.

de la Torre Klausmeier Consulting 33
Exhibit 2.12. 2017 and 2025 Projected AIR Program Impact and On-Road Inventory, Denver Metro/Northern Front Range Area
Parameter 2017 2025
Percent Change to
2025 Precursor Emissions, On-Road (tons per day)1 150.58 93.77 -38% AIR Program Precursor Benefit (tons per day reduction)1 20.70 12.76 -38% AIR Program Precursor Benefit (percent reduction)1 14% 14% 0% Vehicle Miles Traveled (billion miles per year) 34.66 40.23 16% Vehicles (millions) 3.19 3.70 16%
Source: dKC’s analysis of data from the Colorado Department of Public Health and Environment, Colorado State Office of Demography, U.S. Environmental Protection Agency, and the U.S. Census Bureau. 1Estimates are based on an average July Weekday.
Costs and Cost-Effectiveness of the AIR Program Vehicle owners in the Program Area are required to pass an emissions test before their vehicles can be registered. The fee for the emissions test, the time involved to have the test performed, and any related vehicle repair costs are all costs to the individual vehicle owner that must be weighed against the public benefits and outcomes the Program is intended to achieve. We used data provided by the Department on inspections conducted in 2016 and other publicly available information to assess the cost-effectiveness of the AIR Program. Cost-effectiveness is a measure that quantifies the degree to which something is effective or productive in relation to its cost. For vehicle inspection and maintenance programs, cost-effectiveness typically is expressed as a ratio of costs per ton of pollutant emissions reduction.
Total Net Costs
We estimated the total net costs for the AIR Program, which represents the numerator of the cost-effectiveness ratio. The following costs are borne by vehicle owners as a result of having to comply with the AIR Program’s emissions testing requirements:
• Test Fee. Vehicle owners pay a fee to have their vehicles tested at an emissions testing facility. The fee for OBD and IM240 tests is $25; the fee for the TSI test is $15 or $25, depending on the vehicle’s age. Vehicle owners whose vehicles pass emissions based on RapidScreen’s remote sensing device readings also pay a $25 test fee. Total costs for test fees were estimated based on the number of vehicles receiving paid emission tests in 2016 multiplied by the applicable test fee.
• Additional Registration Fee. Vehicle owners pay a $2.20 administrative fee when registering their vehicles. This fee, which is in addition to other license fees and ownership

34 Automobile Inspection and Readjustment Program, Performance Evaluation, November 2017
taxes paid upon vehicle registration, funds the AIR Program’s administration and activities. Total costs for the additional registration fee were estimated based on the number of vehicles registered in the Program Area multiplied by the additional registration fee amount.
• Repair Costs. Vehicle owners whose vehicles fail the emissions test incur costs to repair the vehicle and pass a retest. Repair costs are reported to the Department by the vehicle owner and are maintained as part of the vehicle test database. Based on our analysis of repair cost data for 2016, the average repair costs for each test type are as follows:
o $480 for IM240 test failures
o $544 for OBD test failures
o $322 for TSI test failures
Data on gas cap repairs are not collected; therefore, for estimation purposes, we assumed a $20 cost to repair gas cap failures. Total repair costs were estimated using the average repair cost multiplied by the number of vehicles that failed the emissions test.
The average repair cost includes vehicles that received warranty coverage. When evaluating the public need for the AIR Program, Section 42-4-316, C.R.S., requires the State Auditor to consider the AIR Program’s ability to assure compliance with legally required warranties covering air pollution control equipment. For example, the federal Clean Air Act requires vehicle manufacturers to provide a Performance Warranty that covers specific major emission control components (i.e., the catalytic converters, the electronic emissions control unit or computer, and the OBD device or computer) for the first 8 years or 80,000 miles, whichever occurs first.
The AIR Program’s emissions testing requirements should help ensure that vehicle manufacturers comply with emissions control system warranty requirements, because owners of vehicles that fail the emissions test would seek out eligible warranty repairs (if the vehicle is still under warranty) prior to retesting the vehicle. We did not find any information in the course of performing this evaluation to suggest that vehicle owners have been unable to get emissions systems repairs completed under warranty when those warranties were still in effect.
• Inconvenience Costs. Vehicle owners also bear an “inconvenience” cost, which generally represents the time and effort expended in order to complete the emissions test at a brick-and-mortar emissions testing facility. Vehicle owners who pass emissions through RapidScreen do not incur an inconvenience cost because the test data are collected remotely as they drive by the roadside monitors. We used data on average distance and time spent traveling to and from an emissions testing facility, average times spent waiting in line prior to the test and while the test is performed, and consumer wage

de la Torre Klausmeier Consulting 35
rates reported by the U.S. Bureau of Labor and Statistics as inputs for our analysis. Inconvenience costs were estimated by calculating the total inconvenience cost per test multiplied by the total number of tests performed.
Vehicle owners realize some degree of cost savings from improved fuel economy as a result of vehicle repairs precipitated by the AIR Program’s emissions testing requirements. Therefore, it is important to offset the total costs by these fuel economy savings. We estimated that the AIR Program reduces fuel consumption by approximately 1.5 million gallons per year based on emissions test data for those vehicles that received full-length IM240 tests for both the initial and final tests. Total fuel economy savings were estimated using the total estimated gallons of fuel saved per year multiplied by the average cost per gallon ($2.14) for the Denver Metropolitan Area in 2016. This was the cost per gallon reported by the Energy Information Agency for regular unleaded gasoline in 2016. Fuel economy savings reduce the overall estimated costs of the AIR Program to vehicle owners.
Overall, as shown in Exhibit 2.13, we estimate that the total net cost of the AIR Program to vehicle owners was about $68.4 million in 2016. Test fees account for 40% of the total net cost. Repair costs and inconvenience costs accounted for an additional 31% and 24%, respectively, of the total net cost of the AIR Program in 2016. Detailed information about our cost analysis is available in the Appendix.
Exhibit 2.13. Estimated Total Net Costs of the AIR Program, Calendar Year 2016
Estimated Cost
(in millions) Percent of Total1 Test Fee $27.4 40% Additional Registration Fee $6.4 9% Repair Costs $21.3 31% Inconvenience Cost $16.4 24% Fuel Economy Savings ($3.1) (5%) Total Net Cost $68.4 100%
Source: dKC’s analysis of AIR Program data provided by the Colorado Department of Public Health and Environment and other publicly available information. 1Percentages may not total 100% due to rounding.
Cost per Ton of Ozone Precursors Removed
Earlier in this chapter, we provided the results of our analysis to estimate reductions in ozone precursor emissions as a result of the AIR Program (see related discussion of Exhibit 2.1). This tons-per-day emissions reduction benefit represents the denominator of the cost-effectiveness ratio.

36 Automobile Inspection and Readjustment Program, Performance Evaluation, November 2017
Exhibit 2.14 shows the calculation of the cost-effectiveness ratio for the AIR Program in 2016. Overall, our analysis shows that the AIR Program reduces ozone precursor emissions at a cost of about $7,500 per ton.
Exhibit 2.14. Cost-Effectiveness of the AIR Program, Calendar Year 2016 Total Net Cost $68.4 million Total Daily Emissions Reduction Benefit1 25.05 tons per day Total Annual Emissions Reduction Benefit (daily emissions reduction benefit × 365 days) 9,143 tons Cost-Effectiveness Ratio (Total Net Cost/Annual Benefit) $7,481 per ton
Source: dKC’s analysis of AIR Program data provided by the Colorado Department of Public Health and Environment. 1Based on the results of dKC’s MOVES modeling.
There are no national standards on cost-effectiveness. However, as a point of reference, California generally considers a pollution control measure to be cost-effective if it costs less than $18,260 per ton of hydrocarbons plus NOx removed, excluding carbon monoxide. California uses this threshold to determine if it will fund voluntary control measures through a state grant program that provides funding for cleaner-than-required engines and equipment. The threshold of $18,260 was determined by adjusting for inflation the $12,000-per-ton threshold originally established for the grant program.
To provide an appropriate comparison with California’s cost-effectiveness benchmark, Exhibit 2.15 shows that basing our benefit calculation only on reductions in hydrocarbons and NOx (excluding carbon monoxide), the cost-effectiveness ratio for the AIR Program is about $8,200 per ton of emissions removed.
Exhibit 2.15. Cost-Effectiveness of the AIR Program by Pollutant, Calendar Year 2016
Pollutant
Emission Reductions
(Tons Per Day1)
Cost-Effectiveness Ratio (Annual Cost Per Ton
Reduced) Hydrocarbons (HC) 10.75 $17,432 Carbon Monoxide (CO) 128.03 $1,464 Nitrogen Oxides (NOx) 12.16 $15,411 HC + NOx 22.91 $8,180 HC + NOx + CO/602 25.05 $7,481
Source: dKC’s analysis of AIR Program data provided by the Colorado Department of Public Health and Environment. 1Based on the results of dKC’s MOVES modeling. 2Tons-per-day reduction amounts estimated for the individual ozone precursors are combined using the following formula: HC+NOx+CO/60. This formula discounts the tons-per-day reduction amounts for carbon monoxide when combining with the other ozone precursors to recognize that carbon monoxide has a smaller impact on ozone levels than hydrocarbons and NOx.

de la Torre Klausmeier Consulting 37
Considering our ozone modeling using newly available source apportionment data (see related discussion of Exhibit 2.8) indicates that ozone precursor emissions from on-road sources such as motor vehicles disproportionately produce more ozone precursors than the equivalent emissions from the remaining sources, and based on our cost-effectiveness analysis, the AIR Program would be considered a cost-effective pollution control measure.
Program Modifications In the legislative declaration to the Colorado Air Pollution Prevention and Control Act [Section 25-7-102, C.R.S.], the General Assembly states its intention that the State of Colorado “use all available practical methods which are technologically feasible and economically reasonable so as to reduce, prevent, and control air pollution” and develop an air quality control program in which “the benefits of the air pollution control measures utilized bear a reasonable relationship to the economic, environmental, and energy impact and other costs of such measures.” To achieve this legislative intent, the Department, in partnership with the Commission and the Council, is continually assessing ways to improve Colorado’s overall air quality control program, including the AIR Program.
Although the DM/NFR area has not yet attained the national ozone standards, our analyses in the previous sections show that the AIR Program has a positive effect on the DM/NFR area’s current and future compliance efforts. As discussed in this section, we also found there are some possible opportunities for making targeted changes to the AIR Program to help it operate as effectively as possible while also considering the cost impacts to vehicle owners and operational realities.
Expanded Use of OBD Test Results
As discussed previously on page 23, the Commission’s decision to subject 8-to-11-year-old vehicles to OBD testing requirements increased the emission reductions from the AIR program. Thus, we investigated expanding the population of vehicles that are subject to OBD tests. Currently, all 1996 and newer vehicles that are more than 11 years old receive IM240 tests and advisory-only OBD tests. That is, OBD testing is performed, but the vehicle’s emissions pass/fail status is based solely on the results of the IM240 test.
We investigated the option of using OBD test results in conjunction with IM240 test results to determine the emissions pass/fail status for 1996 and newer vehicles (i.e., OBD-equipped vehicles) that are more than 11 years old. Specifically, we estimated overall emissions reductions if the AIR Program were to fail OBD-equipped vehicles more than 11 years old that meet both of the following criteria: (1) have IM240 emissions levels between 50% and 100% of the IM240 cutpoints and (2) have an illuminated MIL with diagnostic trouble codes indicating emissions-related problems (e.g., worn-out catalytic converter, exhaust gas recirculation malfunctions, fuel metering system problems, evaporative emission control system problems, and ignition system

38 Automobile Inspection and Readjustment Program, Performance Evaluation, November 2017
issues). We found that the Department could increase the emissions benefits of the AIR Program without significantly increasing test failure rates or costs through such a combination.
Based on a comparison with the current program, we estimate that the combined use of IM240 and OBD test results would increase the hydrocarbon, carbon monoxide, and NOx emission reductions by 20%, 23%, and 26%, respectively, for 2002 to 2005 vehicles (the model years we assumed would be subject to the revised criteria). Our MOVES modeling estimated that this combined test option would increase total reductions in ozone precursor emissions by 0.82 tons per day. This option would require no change in current emissions testing procedures; the only change is in how the test results are applied.
In terms of cost and cost-effectiveness, Exhibit 2.16 shows that the total estimated net cost for the combined test option is about $1.3 million more than the current program. Repair costs and inconvenience costs would be slightly increased because the overall failure rate for this option is slightly greater than the current overall failure rate (8.9% versus 8.6%), meaning more vehicles would be required to undergo repairs. However, this option is also estimated to have offsetting increased fuel economy savings of about 10%. On a cost-per-ton basis, the cost-effectiveness ratio for the combined test option is lower—about $7,400 versus $7,500 per ton of emissions removed—indicating that it is slightly more cost-effective than the current program. Thus, the primary advantage of the combined IM240/OBD test option is that it yields additional emissions reductions and reduces the overall cost per ton of emissions reduced.
Exhibit 2.16. Estimated Total Net Cost and Cost-Effectiveness Current AIR Program versus Combined IM240/OBD Test Option
(Dollars in Millions)
Current AIR
Program
Combined IM240/OBD Test
Option Test Fee $27.4 $27.4 Additional Registration Fee $6.4 $6.4 Repair Costs $21.3 $22.9 Inconvenience Cost1 $16.4 $16.5 Fuel Economy Savings ($3.1) ($3.4) Total Net Cost $68.4 $69.8 Total Daily Emissions Reduction Benefit2 25.05 tons per day 25.87 tons per day Total Annual Emissions Reduction Benefit (daily emissions reduction benefit × 365 days)
9,143 tons 9,443 tons
Cost-Effectiveness Ratio (Total Net Cost/Annual Benefit) $7,481 $7,392
Source: dKC’s analysis of AIR Program data provided by the Colorado Department of Public Health and Environment and other publicly available information. 1Vehicle owners who pass emissions through RapidScreen do not incur an inconvenience cost. 2Based on the results of dKC’s MOVES modeling.

de la Torre Klausmeier Consulting 39
RapidScreen Modifications
As discussed previously, RapidScreen is a key element of the AIR Program that helps promote the reduction of ozone precursor emissions while providing greater convenience to vehicle owners. Section 42-4-307.7(5), C.R.S., requires the Department to work with the RapidScreen contractor to minimize false test results. As a quality control measure, the AIR Program requires 2% of the vehicles that qualify for RapidScreen to receive a full IM240 test at a traditional test facility. Also, to comply with the emissions reductions set forth in the 2016 SIP, no more than 50% of the testable vehicle fleet may be exempted from traditional emissions testing through RapidScreen.
Overall, we estimate that 19% of the vehicles that qualify for RapidScreen end up having a traditional emissions test at a brick-and-mortar emissions testing facility. We analyzed OBD test results for 21,752 qualifying RapidScreen candidates that were between 8 and 11 years old and were tested in 2015 and 2016. We found that 4.6% of the vehicles between 8 and 11 years old that qualified for RapidScreen but were tested in brick-and-mortar emissions testing facilities had an illuminated MIL and, therefore, failed the OBD test. This indicates that some proportion of those vehicles that qualify to be registered based on RapidScreen readings may have problems with their emissions control systems, as indicated by an illuminated MIL. Emissions reductions are not achieved by allowing vehicles to be registered based on RapidScreen readings when a MIL-on condition exists that would otherwise cause an OBD test failure.
Because the status of the MIL cannot be measured remotely as vehicles drive by the roadside monitors, we conducted an analysis using OBD test results for qualifying RapidScreen candidates to develop an index that ranked specific vehicle make, model, and model year combinations according to MIL-on percentages. For example, we found that the overall percent of qualifying RapidScreen candidates with MILs on could be reduced by about 40% if the top 20% of vehicles based on this “MIL-On Index” were excluded from receiving RapidScreen notices. The Department could use the results of our analysis, or conduct its own, to identify vehicle make, model, and year combinations that are at high risk of passing RapidScreen with a MIL-on status and, therefore, should undergo traditional emissions testing. We recognize that in developing and implementing a MIL-On Index the Department will also need to consider the convenience benefits of RapidScreen to vehicle owners and how use of a MIL-On Index could affect the overall number of RapidScreen candidates.
Inconvenience Costs
As with any public program, understanding the value the AIR Program provides in relation to its costs is important. The fee for the emissions test, the time involved to have the test performed, and any related vehicle repair costs are all costs to the individual vehicle owner that must be weighed against the Program’s emissions-reduction benefits.

40 Automobile Inspection and Readjustment Program, Performance Evaluation, November 2017
The Department’s Air Pollution Control Division, which administers the AIR Program, issues an annual report that contains summary data and information about the Program, including information about the Program’s overall cost-effectiveness. Similar to the analysis we performed for this evaluation, the Department’s cost-effectiveness calculation includes emissions test fees, additional vehicle registration fees, repair costs, and fuel economy savings. However, the Department’s cost-effectiveness calculation does not include an estimate of inconvenience costs.
In our cost estimates described previously, inconvenience costs totaled approximately $16.4 million, or nearly one-quarter of the total estimated net costs for the Program in Calendar Year 2016. As described in more detail in Exhibit A.5 in the Appendix, the time vehicle owners spend driving to and from the emissions testing facility, plus the vehicle owner’s wait time and the test time itself, totaled about 44 minutes per vehicle. In the AIR Program’s 2016 annual report, the Department specifically highlights “motorist convenience” as a primary advantage of RapidScreen.
Inconvenience costs are a significant cost component of the AIR Program both quantitatively and qualitatively. The Department could improve its methodology and provide the public with a more complete perspective about the cost-effectiveness of the AIR Program by including an estimate of inconvenience costs in its calculations. We added our estimate of inconvenience costs to the Department’s cost-effectiveness calculation for Calendar Year 2016 to determine the effect on the resulting cost-effectiveness ratio. Exhibit 2.17 shows that by excluding inconvenience costs from its calculation, the Department is underestimating the Program’s total net costs relative to the Program’s emissions-reduction benefits, thereby understating the Program’s cost per ton of ozone precursors removed from the atmosphere. The Department’s reported cost-effectiveness ratio for 2016 would be higher—about $7,100 per ton of emissions reduction—if inconvenience costs were factored into the calculation.

de la Torre Klausmeier Consulting 41
Exhibit 2.17. Department-Estimated Total Net Cost and Cost-Effectiveness of the AIR Program, Calendar Year 2016
(Dollars in Millions)
Excluding
Inconvenience Costs
Including Inconvenience
Costs Test Fee $27.4 $27.4 Additional Registration Fee $6.4 $6.4 Repair Costs $19.7 $19.7 Inconvenience Cost1 — $16.4 Fuel Economy Savings ($2.8) ($2.8) Total Net Cost $50.7 $67.1 Total Daily Emissions Reduction Benefit 25.90 tons per day 25.90 tons per day Total Annual Emissions Reduction Benefit (daily emissions reduction benefit × 365 days)
9,454 tons 9,454 tons
Cost-Effectiveness Ratio (Total Net Cost/Annual Benefit) $5,362 $7,098
Source: Colorado Department of Public Health and Environment’s 2016 AIR Program Annual Report. 1Based on the dKC’s analysis of AIR Program data provided by the Colorado Department of Public Health and Environment and other publicly available data.
Recommendation No. 1: The Colorado Department of Public Health and Environment (Department) should consider the following modifications with respect to the Automobile Inspection and Readjustment Program (AIR Program):
a. Using on-board diagnostic (OBD) information for specific diagnostic trouble codes in conjunction with the IM240 test results when setting the emissions pass/fail standards for OBD-equipped vehicles that are more than 11 years old.
b. Identifying ways to reduce the number of vehicles that qualify for RapidScreen when the vehicle’s malfunction indicator light (MIL) is illuminated.
c. Including an estimate of inconvenience costs in its calculations when reporting to the public about the AIR Program’s overall cost-effectiveness.

42 Automobile Inspection and Readjustment Program, Performance Evaluation, November 2017
Department of Public Health and Environment’s Response: a. Agree
Implementation Date: July 2018 The Department looks forward to investigating this hybrid tailpipe and OBD emissions test process using contemporary local data collected since the 2015 program overhaul. The proposed hybrid tailpipe-OBD testing combination of these middle-aged vehicles could potentially improve ozone precursor reduction benefit in the existing program without greatly increasing repair costs or vehicle owner inconvenience. However, because this is an untested approach it is unclear whether it can be developed into the existing AIR program. The Department will consider a range of options including various model years, diagnostic codes, passing tailpipe emissions elevated above the mean, and cost effectiveness.
b. Agree Implementation Date: July 2018 Roadside emissions “RapidScreen” is a significant convenience element for drivers of the cleanest cars in the inspected fleet. However the Department is cognizant of the emissions reduction disbenefit that may occur by clean screening a vehicle with an illuminated MIL (Check Engine Light). The Department will investigate the concept of a “MIL-On Index” to possibly eliminate the clean screen option for some vehicle make/model/year combinations that have higher rates of MIL illumination. Before implementing a MIL-On Index, the Department will analyze existing data to help quantify the potential emissions reduction benefit from this strategy. The Department will also consider the loss of convenience to the affected motorists who are no longer able to be clean screened, and the long-term viability of the RapidScreen program, in assessing whether implementing a MIL-On Index is a cost-effective strategy that should be incorporated into the Program.

de la Torre Klausmeier Consulting 43
c. Agree Implementation Date: July 2018 The Department weighed the use of convenience costs to AIR Program customers many years ago and ultimately stopped utilizing this approach as it did not find a satisfactory way to set consistent assumptions over time regarding convenience cost estimates. The Department will re-examine the issue to determine if it merits incorporating this metric into our cost effectiveness reporting and accountability. In an effort to make convenience costs as credible and meaningful as possible, the Department intends to use locally-derived contemporary values to the greatest extent possible in our analysis. If a formula and inputs for customer convenience are established, any subsequent changes or modifications must be carefully considered. Significant future adjustments to convenience costs make it difficult to account for and understand swings or shifts in overall program cost effectiveness from year to year.

THIS PAGE LEFT BLANK INTENTIONALLY

APPENDIX

THIS PAGE LEFT BLANK INTENTIONALLY

de la Torre Klausmeier Consulting A-1
Exhibit A.1. Test Fees by Test Type
Calendar Year 2016
Test Type
Number of Paid
Tests1 Test Fee Total
IM240 580,612 $25 $14,515,300 OBD 286,467 $25 $7,161,675
TSI2 8,965 $15 $134,475
38,083 $25 $952,075 RapidScreen 183,753 $25 $4,593,825 Total 1,097,880 $27,357,350 Source: dKC’s analysis of AIR Program data provided by the Colorado Department of Public Health and Environment. 1Paid tests include vehicles that receive two or more retests. 2The fee for the TSI test is $15 or $25, depending on the vehicle’s age.
Exhibit A.2. Additional Registration Fees Calendar Year 2016
Number of Registered Vehicles1 Fee Total 2,900,406 $2.20 $6,380,893
Source: AIR Program 2016 Annual Report by the Colorado Department of Public Health and Environment. 1Based on the number of passenger vehicles and light-duty trucks registered in the AIR Program Area, including those newer vehicles that are exempt from emissions testing requirements.
Exhibit A.3. Estimated Total Repair Costs by Test Type Calendar Year 2016
Test Type
Average Cost to Repair Failed
Vehicles Count of Test
Failures Count of Gas Cap Failures1
Total Repair Cost
IM240 $480 26,906 25,288 $13,410,202 OBD $544 12,285 7,534 $6,834,986 TSI $322 3,340 578 $1,088,266 Total 42,531 33,400 $21,333,454
Source: dKC’s analysis of AIR Program data provided by the Colorado Department of Public Health and Environment. 1Each gas cap repair is assumed to cost $20.
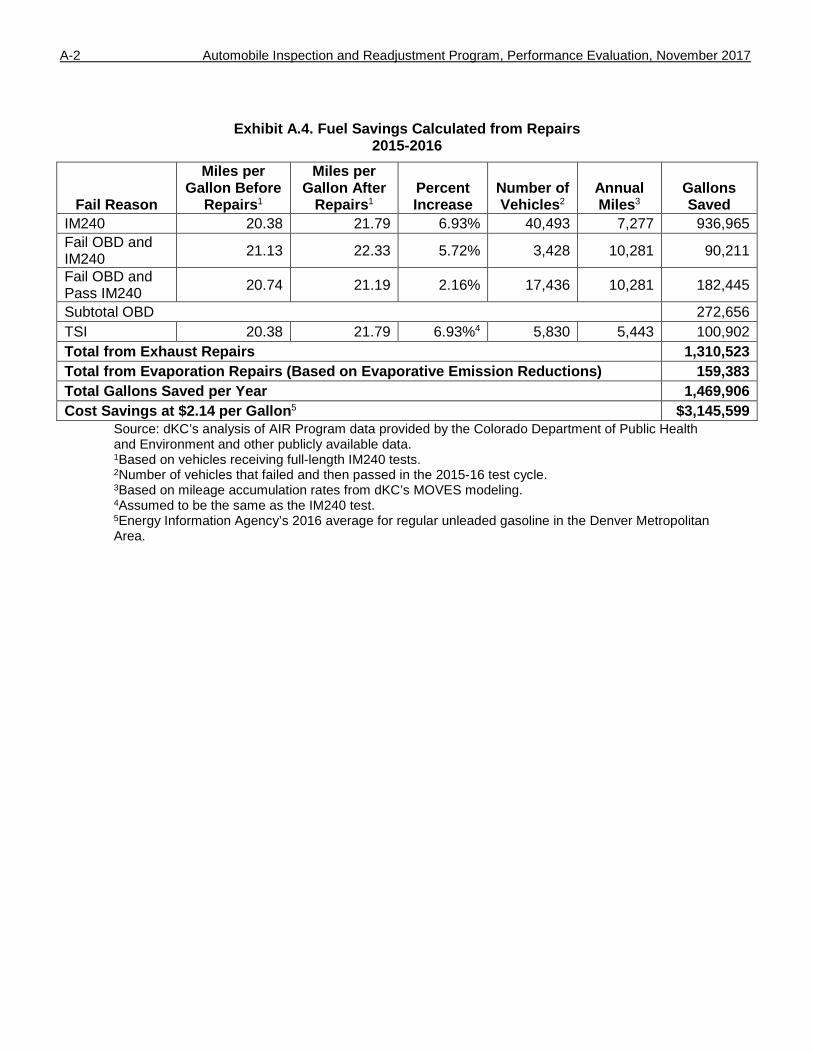
A-2 Automobile Inspection and Readjustment Program, Performance Evaluation, November 2017
Exhibit A.4. Fuel Savings Calculated from Repairs
2015-2016
Fail Reason
Miles per Gallon Before
Repairs1
Miles per Gallon After
Repairs1 Percent Increase
Number of Vehicles2
Annual Miles3
Gallons Saved
IM240 20.38 21.79 6.93% 40,493 7,277 936,965 Fail OBD and IM240 21.13 22.33 5.72% 3,428 10,281 90,211
Fail OBD and Pass IM240 20.74 21.19 2.16% 17,436 10,281 182,445
Subtotal OBD 272,656 TSI 20.38 21.79 6.93%4 5,830 5,443 100,902 Total from Exhaust Repairs 1,310,523 Total from Evaporation Repairs (Based on Evaporative Emission Reductions) 159,383 Total Gallons Saved per Year 1,469,906 Cost Savings at $2.14 per Gallon5 $3,145,599
Source: dKC’s analysis of AIR Program data provided by the Colorado Department of Public Health and Environment and other publicly available data. 1Based on vehicles receiving full-length IM240 tests. 2Number of vehicles that failed and then passed in the 2015-16 test cycle. 3Based on mileage accumulation rates from dKC’s MOVES modeling. 4Assumed to be the same as the IM240 test. 5Energy Information Agency’s 2016 average for regular unleaded gasoline in the Denver Metropolitan Area.

de la Torre Klausmeier Consulting A-3
Exhibit A.5. Parameters Used to Estimate Customer Inconvenience Cost
for AIR Program Inspections Calendar Year 2016
Parameter Value A. Average Distance to Testing Station1 7 miles B. Average Cost per Mile to Operate Vehicle2 $0.54 C. Mileage Cost (A × B × 2) $7.56 D. Average Time to/from Testing Station1 22.24 minutes E. Average Wait Time3 7.5 minutes F. Average Test Time3 14 minutes G. Total Time per Test (D + E + F) 43.74 minutes H. Average Hourly Consumer Wage Rate4 $25.34 I. Cost per Test for Motorists’ Time (G/60 × H/2)5 $9.24 J. Total Inconvenience Cost per Test (C + I) $16.80 K. Number of Tests Performed (including retests) 978,258 L. Total Inconvenience Cost (J × K) $16,431,242
Source: dKC’s analysis of AIR Program data provided by the Colorado Department of Public Health and Environment and other publicly available data. 1Based on motorists’ surveys by Envirotest Systems Corporation (the State’s emissions testing contractor) in 2017. 2U.S. Internal Revenue Service-defined mileage reimbursement rate for 2016. 3Based on motorists’ surveys by Envirotest Systems Corporation in 2012. 4U.S. Bureau of Labor Statistics, Occupational Employment Statistics, May 2016 State Occupational Employment and Wage Estimates – Colorado. 5AIR Program evaluations since 2003 have used 50% of the average wage rate to calculate the cost of the time spent getting inspections. The 2003 evaluation referenced Calfee and Winston (1998) and Small, Winston and Yan (Brookings Institution, 2003).


![1[1].land readjustment mongolia](https://img.dokumen.tips/doc/110x75/55a70d171a28abe74a8b465b/11land-readjustment-mongolia.jpg)