Embed Size (px)
Citation preview

ARTICLE IN PRESS
0030-3992/$ - se
doi:10.1016/j.op
�CorrespondE-mail addr
Optics & Laser Technology 40 (2008) 1082–1090
www.elsevier.com/locate/optlastec
Automatic determination of refractive index profile, sectional area, andshape of fibers having regular and/or irregular transverse sections
A.A. Hamzab,c, T.Z.N. Sokkarb, M.A. El-Morsya, M.A.E. Nawarega,�
aDepartment of Physics, Faculty of Science, Mansoura University, New Damietta, Damietta 34517, EgyptbDepartment of Physics, Faculty of Science, Mansoura University, Mansoura, Egypt
cBritish University, El Sherouk City, Cairo, Egypt
Received 5 July 2007; received in revised form 27 November 2007; accepted 29 January 2008
Available online 18 March 2008
Abstract
A new method based on a mathematical model and a computer program is suggested to determine the refractive index profile of fibers
having regular and/or irregular transverse sectional shape. Microinterferogram of both multiple-beam Fizeau fringes and the duplicated
image from two-beam interference microscope are used for the determination of refractive index profile, cross-sectional area and shape of
three different types of fibers. To confirm the suggested model, the calculated area and the shape of the transverse section of these fibers
are compared with those results obtained using conventional methods.
r 2008 Elsevier Ltd. All rights reserved.
Keywords: Irregular fiber; Refractive index profile; Interferometry
1. Introduction
It is widely recognized that the main characteristicsof physical properties of fibers can be related to theirrefractive index profiles. In other words, the values ofrefractive indices of the fibers give useful informationabout the structural parameters of these fibers. Also, theyprovide information about the microscopic parameterssuch as oscillation energy, dispersion energy, and themolecular polarizability. So it is important to establish notonly easy and simple but also efficient and accuratemethods and tools for measuring the refractive indexprofiles. The interferometric methods represent easy andprecise tools for investigating the fibers. Different inter-ferometric methods have been applied successfully tomeasure the refractive indices of natural and syntheticfibers [1–13].
It is well known that there are many natural andsynthetic fibers having different cross-sectional shapes andareas due to their nature and fabrication. These geome-
e front matter r 2008 Elsevier Ltd. All rights reserved.
tlastec.2008.01.022
ing author. Fax: +2057 3403868.
ess: [email protected] (M.A.E. Nawareg).
trical parameters are important and necessary for thedetermination of the refractive indices of fibers.Many authors described different interferometric tech-
niques to overcome the difficulty of irregular transversesections of fibers [1–4,14,15]. Simmens [1] described atechnique using the Babinet compensator to determine theoptical properties of fibers of constant weight per unitlength but irregular sectional shape. Hamza [2] introduceda method to measure the mean refractive indices andbirefringence of fibers with irregular transverse sections bya complementary technique using double beam interferenceand scanning electron microscopy. Hamza et al. [3,4]applied multiple-beam Fizeau fringes to obtain meanrefractive indices and birefringence of fibers with irregulartransverse sections. Hamza et al. [14] applied variablewavelength microinterferometry to determine the disper-sion curves of irregular fibers. Hamza et al. [15] suggested amethod to determine the regular and/or irregular trans-verse sectional shape and area of homogeneous fibers. Inthis method, the transverse sectional shapes of the fibersare determined by measuring the thickness profiles andvarying the angle of rotation for these fibers.In this paper, we developed an accurate and simple
method with the aid of automatic fringe analysis not only
ARTICLE IN PRESSA.A. Hamza et al. / Optics & Laser Technology 40 (2008) 1082–1090 1083
to measure the mean refractive indices but also to obtainthe refractive index profile for natural, synthetic, andoptical fibers with regular and/or irregular transversesections. Also in this work, we are able to calculate thetransverse sectional area of the fiber with any cross-sectional shape.
2. Theoretical considerations
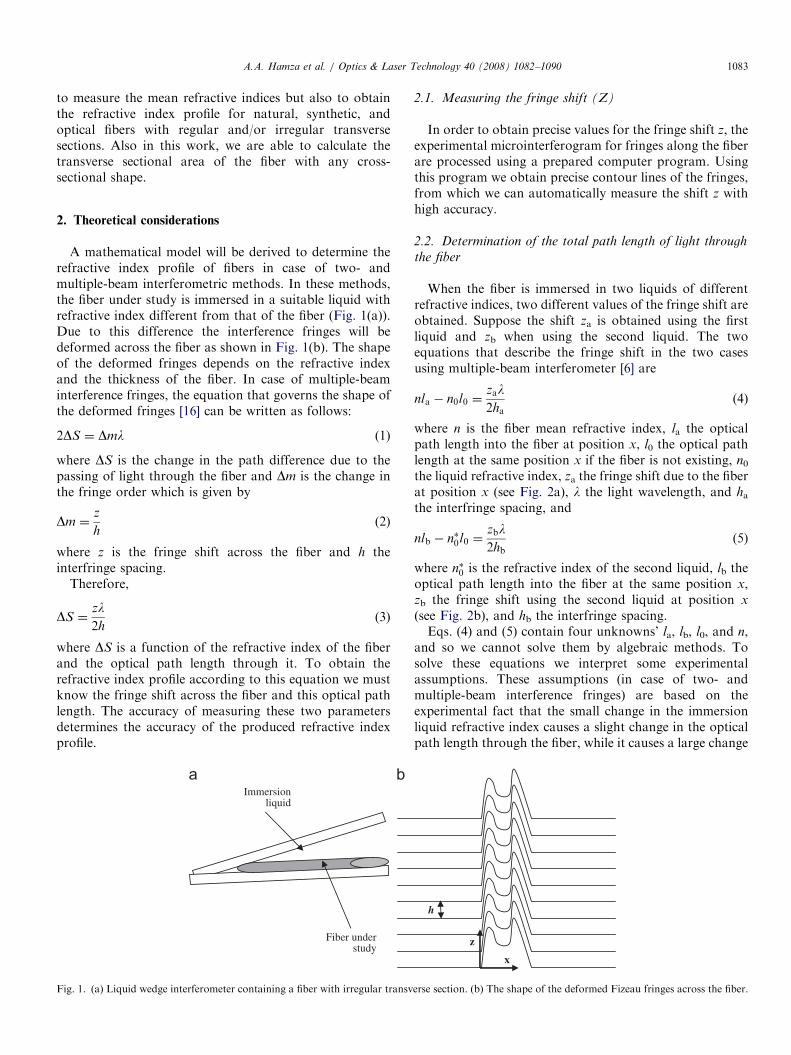
A mathematical model will be derived to determine therefractive index profile of fibers in case of two- andmultiple-beam interferometric methods. In these methods,the fiber under study is immersed in a suitable liquid withrefractive index different from that of the fiber (Fig. 1(a)).Due to this difference the interference fringes will bedeformed across the fiber as shown in Fig. 1(b). The shapeof the deformed fringes depends on the refractive indexand the thickness of the fiber. In case of multiple-beaminterference fringes, the equation that governs the shape ofthe deformed fringes [16] can be written as follows:
2DS ¼ Dml (1)
where DS is the change in the path difference due to thepassing of light through the fiber and Dm is the change inthe fringe order which is given by
Dm ¼z
h(2)
where z is the fringe shift across the fiber and h theinterfringe spacing.
Therefore,
DS ¼zl2h
(3)
where DS is a function of the refractive index of the fiberand the optical path length through it. To obtain therefractive index profile according to this equation we mustknow the fringe shift across the fiber and this optical pathlength. The accuracy of measuring these two parametersdetermines the accuracy of the produced refractive indexprofile.
Fiber understudy
Immersionliquid
Fig. 1. (a) Liquid wedge interferometer containing a fiber with irregular transv
2.1. Measuring the fringe shift (Z)
In order to obtain precise values for the fringe shift z, theexperimental microinterferogram for fringes along the fiberare processed using a prepared computer program. Usingthis program we obtain precise contour lines of the fringes,from which we can automatically measure the shift z withhigh accuracy.
2.2. Determination of the total path length of light through
the fiber
When the fiber is immersed in two liquids of differentrefractive indices, two different values of the fringe shift areobtained. Suppose the shift za is obtained using the firstliquid and zb when using the second liquid. The twoequations that describe the fringe shift in the two casesusing multiple-beam interferometer [6] are
nla � n0l0 ¼zal2ha
(4)
where n is the fiber mean refractive index, la the opticalpath length into the fiber at position x, l0 the optical pathlength at the same position x if the fiber is not existing, n0the liquid refractive index, za the fringe shift due to the fiberat position x (see Fig. 2a), l the light wavelength, and hathe interfringe spacing, and
nlb � n�0l0 ¼zbl2hb
(5)
where n�0 is the refractive index of the second liquid, lb theoptical path length into the fiber at the same position x,zb the fringe shift using the second liquid at position x
(see Fig. 2b), and hb the interfringe spacing.Eqs. (4) and (5) contain four unknowns’ la, lb, l0, and n,
and so we cannot solve them by algebraic methods. Tosolve these equations we interpret some experimentalassumptions. These assumptions (in case of two- andmultiple-beam interference fringes) are based on theexperimental fact that the small change in the immersionliquid refractive index causes a slight change in the opticalpath length through the fiber, while it causes a large change
x
z
h
erse section. (b) The shape of the deformed Fizeau fringes across the fiber.
ARTICLE IN PRESS
z
n0
za
x
y
l0lan
zb
x
y
l0lbn
n0*
z
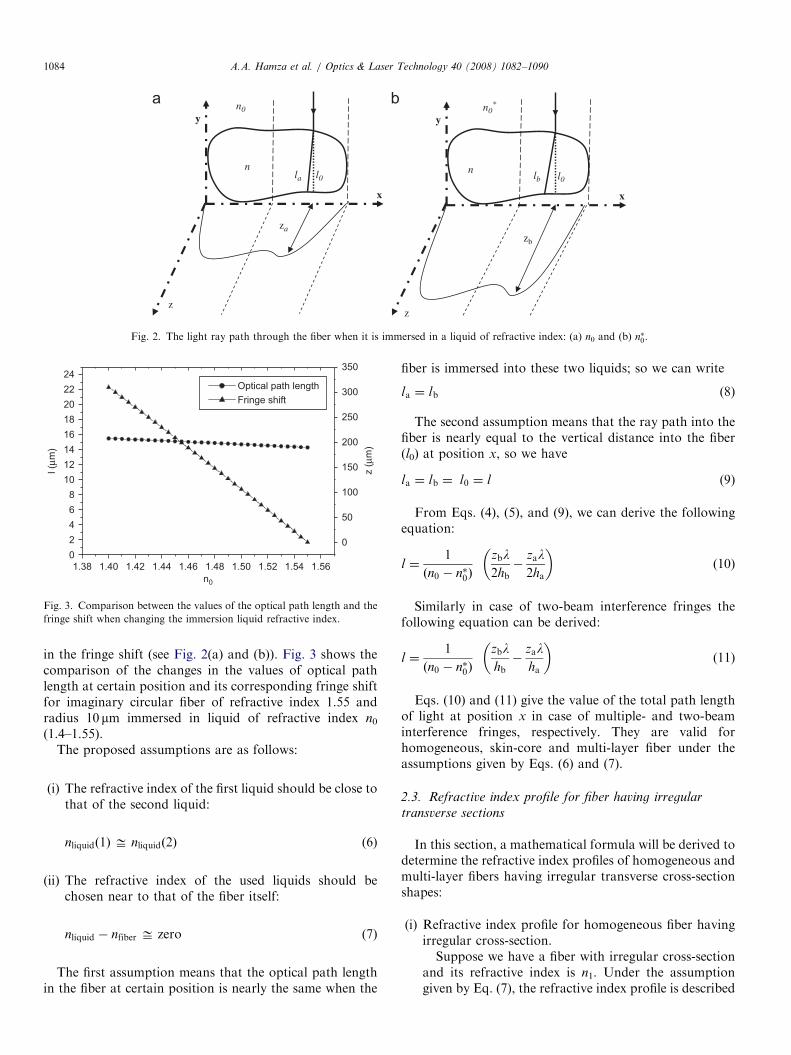
Fig. 2. The light ray path through the fiber when it is immersed in a liquid of refractive index: (a) n0 and (b) n�0.
1.3802468
1012141618202224
Optical path length Fringe shift
n0
l (µm
)
0
50
100
150
200
250
300
350z
(µm
)
1.561.541.521.501.481.461.441.421.40
Fig. 3. Comparison between the values of the optical path length and the
fringe shift when changing the immersion liquid refractive index.
A.A. Hamza et al. / Optics & Laser Technology 40 (2008) 1082–10901084
in the fringe shift (see Fig. 2(a) and (b)). Fig. 3 shows thecomparison of the changes in the values of optical pathlength at certain position and its corresponding fringe shiftfor imaginary circular fiber of refractive index 1.55 andradius 10 mm immersed in liquid of refractive index n0(1.4–1.55).
The proposed assumptions are as follows:
(i)
The refractive index of the first liquid should be close tothat of the second liquid:nliquidð1Þ ffi nliquidð2Þ (6)
(ii)
The refractive index of the used liquids should bechosen near to that of the fiber itself:nliquid � nfiber ffi zero (7)
The first assumption means that the optical path lengthin the fiber at certain position is nearly the same when the
fiber is immersed into these two liquids; so we can write
la ¼ lb (8)
The second assumption means that the ray path into thefiber is nearly equal to the vertical distance into the fiber(l0) at position x, so we have
la ¼ lb ¼ l0 ¼ l (9)
From Eqs. (4), (5), and (9), we can derive the followingequation:
l ¼1
ðn0 � n�0Þ
zbl2hb�
zal2ha
� �(10)
Similarly in case of two-beam interference fringes thefollowing equation can be derived:
l ¼1
ðn0 � n�0Þ
zblhb�
zalha
� �(11)
Eqs. (10) and (11) give the value of the total path lengthof light at position x in case of multiple- and two-beaminterference fringes, respectively. They are valid forhomogeneous, skin-core and multi-layer fiber under theassumptions given by Eqs. (6) and (7).
2.3. Refractive index profile for fiber having irregular
transverse sections
In this section, a mathematical formula will be derived todetermine the refractive index profiles of homogeneous andmulti-layer fibers having irregular transverse cross-sectionshapes:
(i)
Refractive index profile for homogeneous fiber havingirregular cross-section.Suppose we have a fiber with irregular cross-sectionand its refractive index is n1. Under the assumptiongiven by Eq. (7), the refractive index profile is described
ARTICLE IN PRESS
z
x
y
A.A. Hamza et al. / Optics & Laser Technology 40 (2008) 1082–1090 1085
by the following equation:
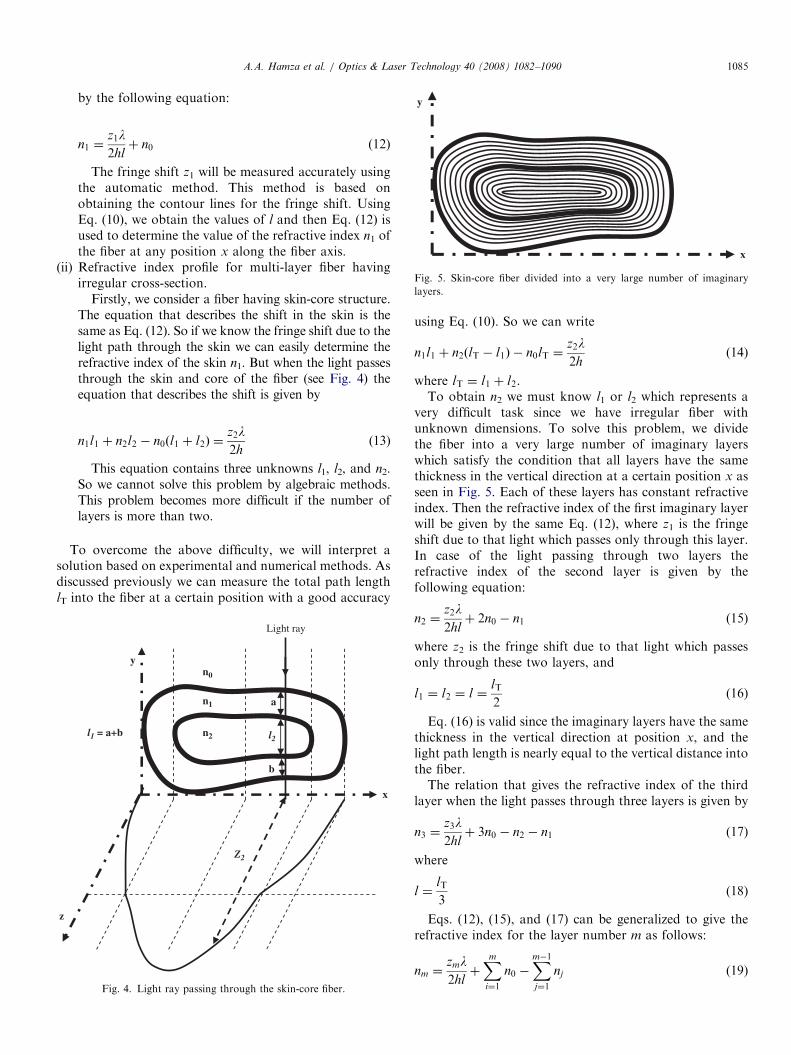
n1 ¼z1l2hlþ n0 (12)
The fringe shift z1 will be measured accurately usingthe automatic method. This method is based onobtaining the contour lines for the fringe shift. UsingEq. (10), we obtain the values of l and then Eq. (12) isused to determine the value of the refractive index n1 ofthe fiber at any position x along the fiber axis.
(ii)
Fig. 5. Skin-core fiber divided into a very large number of imaginarylayers.
Refractive index profile for multi-layer fiber havingirregular cross-section.
Firstly, we consider a fiber having skin-core structure.The equation that describes the shift in the skin is thesame as Eq. (12). So if we know the fringe shift due to thelight path through the skin we can easily determine therefractive index of the skin n1. But when the light passesthrough the skin and core of the fiber (see Fig. 4) theequation that describes the shift is given by
n1l1 þ n2l2 � n0ðl1 þ l2Þ ¼z2l2h
(13)
This equation contains three unknowns l1, l2, and n2.So we cannot solve this problem by algebraic methods.This problem becomes more difficult if the number oflayers is more than two.
To overcome the above difficulty, we will interpret asolution based on experimental and numerical methods. Asdiscussed previously we can measure the total path lengthlT into the fiber at a certain position with a good accuracy
Z2
x
y
l1 = a+b
a
l2
b
Light ray
n0
n1
n2
Fig. 4. Light ray passing through the skin-core fiber.
using Eq. (10). So we can write
n1l1 þ n2ðlT � l1Þ � n0lT ¼z2l2h
(14)
where lT ¼ l1 þ l2.To obtain n2 we must know l1 or l2 which represents a
very difficult task since we have irregular fiber withunknown dimensions. To solve this problem, we dividethe fiber into a very large number of imaginary layerswhich satisfy the condition that all layers have the samethickness in the vertical direction at a certain position x asseen in Fig. 5. Each of these layers has constant refractiveindex. Then the refractive index of the first imaginary layerwill be given by the same Eq. (12), where z1 is the fringeshift due to that light which passes only through this layer.In case of the light passing through two layers therefractive index of the second layer is given by thefollowing equation:
n2 ¼z2l2hlþ 2n0 � n1 (15)
where z2 is the fringe shift due to that light which passesonly through these two layers, and
l1 ¼ l2 ¼ l ¼lT
2(16)
Eq. (16) is valid since the imaginary layers have the samethickness in the vertical direction at position x, and thelight path length is nearly equal to the vertical distance intothe fiber.The relation that gives the refractive index of the third
layer when the light passes through three layers is given by
n3 ¼z3l2hlþ 3n0 � n2 � n1 (17)
where
l ¼lT
3(18)
Eqs. (12), (15), and (17) can be generalized to give therefractive index for the layer number m as follows:
nm ¼zml2hlþXm
i¼1
n0 �Xm�1j¼1
nj (19)

ARTICLE IN PRESSA.A. Hamza et al. / Optics & Laser Technology 40 (2008) 1082–10901086
where
l ¼lT
m(20)
and zm is the fringe shift due to the light path through the m
layers.A prepared computer program based on Eqs. (10), (19),
and (20) is used to calculate the refractive index profile ofthe multi-layer fiber, where the program read the values ofthe fringe shift as a function of the position. Then thesevalues are used to calculate the refractive index of eachlayer of the fiber.
In case of two-beam interference fringes, Eq. (19) can begiven in the following form:
nm ¼zmlhlþXm
i¼1
n0 �Xm�1j¼1
nj (21)
2.4. Determining the area and drawing the shape of the fiber
cross-section
The methods used for determining the cross-sectionalarea of fibers with an irregular cross-section [17,18] aredifficult and yield only a statistical estimate of the area.Also, the method [15] is applicable only for homogeneousfibers. We suggest a method to measure the area of theirregular cross-section of the fiber. This method bases oninterferometry and gives high accuracy. In this method, wecalculate the summation
A ¼Xm�1i¼1
xi
li þ liþ1
2
� �(22)
This summation gives the value of the fiber cross-sectional area A, where li is the length of line representingthe vertical path length into the fiber at position i givenby Eq. (10), xi the distance between two successive lines(see Fig. 6) and m the number of these lines.
With the help of a computer program we can draw thecross-sectional shape of the fiber using the calculatedvalues of the vertical path l. This method is applicable only
li
xi
Fig. 6. The lines representing the light paths through the fiber.
for drawing the shapes of fibers with cross-sectional shapeshaving at least one axis of symmetry.
3. Experimental results and discussion
Using the suggested model, the refractive index profile,cross-sectional area, and the shape are calculated for threefibers of different types and shapes. The first fiber is theCortelle fiber, which represents a model of homogeneousand regular fiber. The second one is a single-mode opticalfiber. This fiber represents a skin-core regular fiber. Thethird fiber is the Dralon fiber, which represents a model ofmulti-layer irregular fiber.
3.1. Cortelle fiber (with regular cross-section)
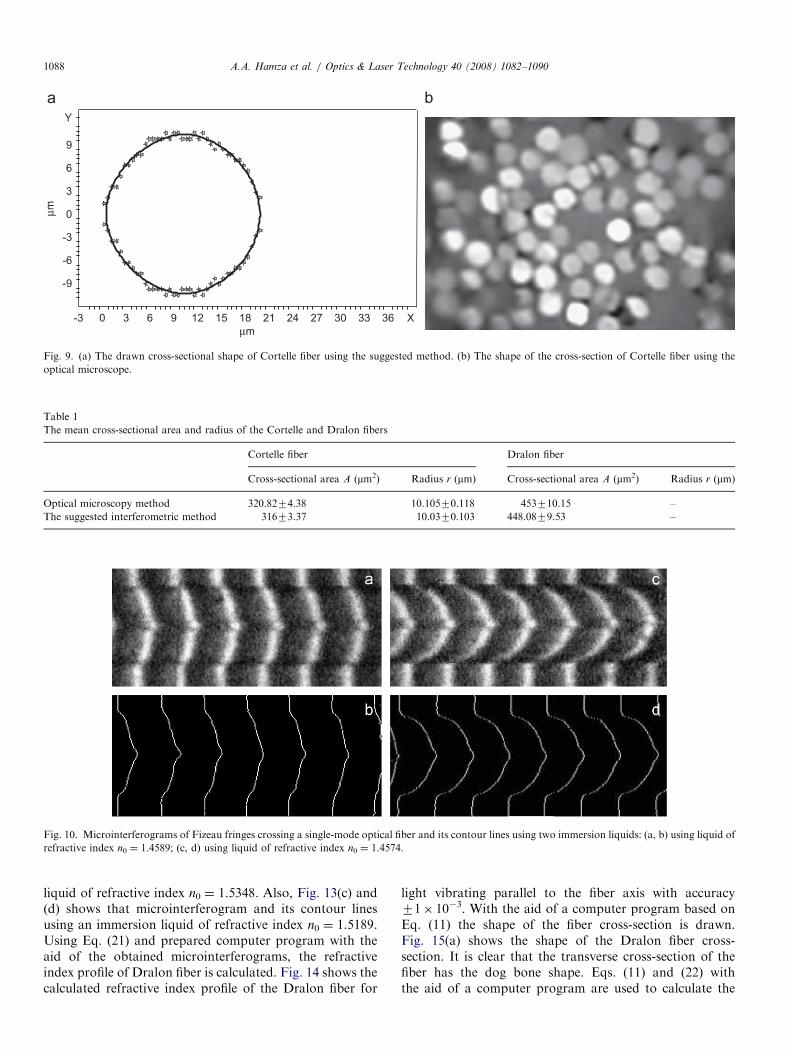
The Pluta polarizing interference microscope [19,20]attached to a CCD camera, which are connected to a PC, isused to determine the refractive index profile for this fiber.About 3 cm of the fiber is fixed at two ends on a microscopeslide, and a drop of a suitable liquid is placed on it. Fig. 7(a)and (b) shows the microinterferogram of the totallyduplicated image of the Cortelle fiber and its contour linesusing immersion liquid of refractive index n0 ¼ 1.5213.Also Fig. 7(c) and (d) shows the microinterferogram and itscontour lines using immersion liquid of refractive indexn0 ¼ 1.5158. These microinterferograms are obtained attemperature 29.5 1C using monochromatic light of wave-length 546.1 nm. Using Eqs. (11) and (12), the refractiveindex profile of the Cortelle fiber in case of light vibratingparallel and perpendicular to the fiber axis are calculated.Fig. 8(a) and (b) shows these profiles, respectively. It isclear that the fiber has constant refractive index along itsdiameter. The measured refractive index of the parallelcomponent is n|| ¼ 1.51471� 10�3 and that for theperpendicular component is n? ¼ 1.51771� 10�3. UsingEq. (11) and the prepared computer program, the shape ofthe cross-section is drawn. Fig. 9(a) shows the shape of thecross-section of the Cortelle fiber, which is nearly circular.Using Eqs. (11) and (22) with the aid of a computerprogram, the area of the Cortelle fiber is calculated. Thearea of the Cortelle fiber is then calculated using an opticalmicroscopy method, where the cross-section of a bundle ofthe Cortelle fibers is enlarged using the optical microscope(see Fig. 9(b)). Using this figure, the average area of 25cross-sections is calculated. The calculated values for thearea and the radius of the Cortelle fiber using the twomethods are given in Table 1. It is clear that there is a slightdifference between values obtained from the two methods.So the conventional optical microscopy method confirmsour suggested method.
3.2. Single-mode optical fiber (skin-core regular fiber)
It is well known that the single-mode optical fibers havesmall cores with radius 2oro5 mm. So it represents adifficult task to detect the profile of this small core

ARTICLE IN PRESS
Fig. 7. Microinterferograms of two-beam interference fringes crossing Cortelle fiber using Pluta microscope and its contour lines using two immersion
liquids: (a, b) using liquid of refractive index n0 ¼ 1.5213; (c, d) using liquid of refractive index n0 ¼ 1.5158.
1.493
1.500
1.507
1.514
1.521
1.528
1.535
0.0 1.7 3.4 5.1 6.8 8.5 10.2 11.9 13.6 15.3 17.0 18.7 20.4
n׀׀
x (µm)
1.489
1.496
1.503
1.510
1.517
1.524
0.0 1.7 3.4 5.1 6.8 8.5 10.2 11.9 13.6 15.3 17.0 18.7 20.4
n┴
x (µm)
Fig. 8. (a) Refractive index profile of Cortelle fiber for light vibrating
parallel to the fiber axis (nJ). (b) The refractive index profile of Cortelle
fiber for light vibrating perpendicular to the fiber axis (n?).
A.A. Hamza et al. / Optics & Laser Technology 40 (2008) 1082–1090 1087
compared with the large cladding. Our suggested methodsucceeds in measuring the refractive index profile of thissmall core. The automated multiple-beam Fizeau inter-ferometer in transmission [11] is used. In this interferom-eter 2 cm of the fiber under study is immersed in a liquid ofsuitable refractive index in a silvered wedge. We use plane-polarized light of wavelength l ¼ 546.1 nm at temperature29.5 1C. Fig. 10(a) and (b) shows the microinterferogram ofFizeau fringes crossing the single mode optical fiber and itscontour lines using an immersion liquid of refractive indexn0 ¼ 1.4589. Also, Fig. 10(c) and (d) shows the micro-interferogram and its contour lines using immersion liquidof refractive index n0 ¼ 1.4574. A prepared computerprogram based on Eqs. (10), (19), and (20) is used tocalculate the refractive index profile for the fiber. Fig. 11gives the refractive index profile of the fiber under studywhere we have cladding with refractive index 1.4596 andcore with refractive index 1.463. With the aid of a computerprogram we can draw the cross-sectional shape of the usedoptical fiber using the calculated values of the vertical pathl which is given from Eq. (10). Fig. 12 shows the drawnshape of the cross-section of the single-mode optical fiber.Using Eq. (22), the area of this fiber is calculated. The areaof this fiber is A ¼ 115637327.29 mm2 and its radiusr ¼ 60.670.756 mm.
3.3. Dralon fiber (with irregular cross-section)
Using the Pluta polarizing interference microscope withthe aid of CCD camera, the microinterferograms forDralon fiber (where 3 cm of the fiber is immersed insuitable liquid) are captured. Fig. 13(a) and (b) shows themicrointerferogram of a totally duplicated image of thisDralon fiber and its contour lines using an immersion
ARTICLE IN PRESS
Y
µm
-9
-6
-3
0
3
6
9
Xµm
-3 0 3 6 9 12 15 18 21 24 27 30 33 36
Fig. 9. (a) The drawn cross-sectional shape of Cortelle fiber using the suggested method. (b) The shape of the cross-section of Cortelle fiber using the
optical microscope.
Table 1
The mean cross-sectional area and radius of the Cortelle and Dralon fibers
Cortelle fiber Dralon fiber
Cross-sectional area A (mm2) Radius r (mm) Cross-sectional area A (mm2) Radius r (mm)
Optical microscopy method 320.8274.38 10.10570.118 453710.15 –
The suggested interferometric method 31673.37 10.0370.103 448.0879.53 –
Fig. 10. Microinterferograms of Fizeau fringes crossing a single-mode optical fiber and its contour lines using two immersion liquids: (a, b) using liquid of
refractive index n0 ¼ 1.4589; (c, d) using liquid of refractive index n0 ¼ 1.4574.
A.A. Hamza et al. / Optics & Laser Technology 40 (2008) 1082–10901088
liquid of refractive index n0 ¼ 1.5348. Also, Fig. 13(c) and(d) shows that microinterferogram and its contour linesusing an immersion liquid of refractive index n0 ¼ 1.5189.Using Eq. (21) and prepared computer program with theaid of the obtained microinterferograms, the refractiveindex profile of Dralon fiber is calculated. Fig. 14 shows thecalculated refractive index profile of the Dralon fiber for
light vibrating parallel to the fiber axis with accuracy71� 10�3. With the aid of a computer program based onEq. (11) the shape of the fiber cross-section is drawn.Fig. 15(a) shows the shape of the Dralon fiber cross-section. It is clear that the transverse cross-section of thefiber has the dog bone shape. Eqs. (11) and (22) withthe aid of a computer program are used to calculate the
ARTICLE IN PRESS
1.428
1.436
1.444
1.452
1.460
1.468
0 10 20 30 40 50 60 70 80 90 100 110 120
n
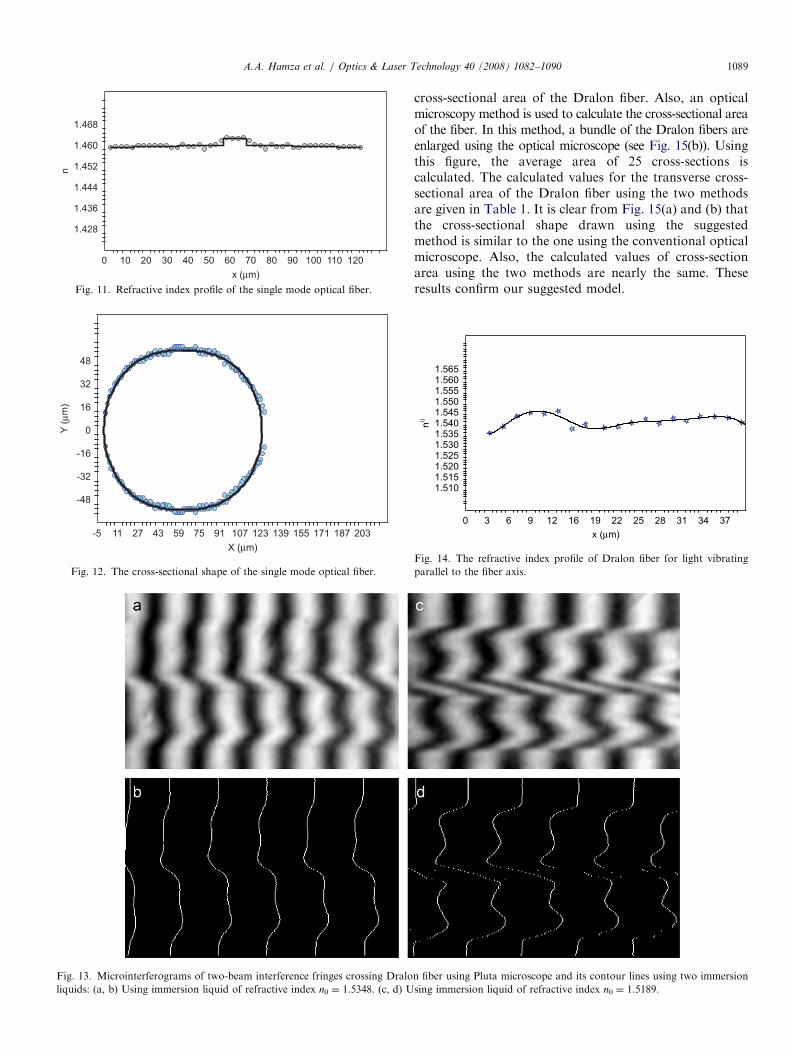
x (µm)Fig. 11. Refractive index profile of the single mode optical fiber.
-48
-32
-16
0
16
32
48
-5 11 27 43 59 75 91 107 123 139 155 171 187 203
Y (µ
m)
X (µm)
Fig. 12. The cross-sectional shape of the single mode optical fiber.
Fig. 13. Microinterferograms of two-beam interference fringes crossing Dralo
liquids: (a, b) Using immersion liquid of refractive index n0 ¼ 1.5348. (c, d) U
A.A. Hamza et al. / Optics & Laser Technology 40 (2008) 1082–1090 1089
cross-sectional area of the Dralon fiber. Also, an opticalmicroscopy method is used to calculate the cross-sectional areaof the fiber. In this method, a bundle of the Dralon fibers areenlarged using the optical microscope (see Fig. 15(b)). Usingthis figure, the average area of 25 cross-sections iscalculated. The calculated values for the transverse cross-sectional area of the Dralon fiber using the two methodsare given in Table 1. It is clear from Fig. 15(a) and (b) thatthe cross-sectional shape drawn using the suggestedmethod is similar to the one using the conventional opticalmicroscope. Also, the calculated values of cross-sectionarea using the two methods are nearly the same. Theseresults confirm our suggested model.
n fiber using Pluta microscope and its contour lines using two immersion
sing immersion liquid of refractive index n0 ¼ 1.5189.
1.5101.5151.5201.5251.5301.5351.5401.5451.5501.5551.5601.565
0 3 6 9 12 16 19 22 25 28 31 34 37
n׀׀
x (µm)
Fig. 14. The refractive index profile of Dralon fiber for light vibrating
parallel to the fiber axis.

ARTICLE IN PRESS
Y
µm
-7
-3
0
4
7
10
14
Xµm
-0 3 7 10 13 17 20 24 27 30 34 37 41 44
Fig. 15. (a) Cross-sectional shape of Dralon fiber using the suggested method. (b) The shape of the cross-section of Dralon fiber using the optical
microscope.
A.A. Hamza et al. / Optics & Laser Technology 40 (2008) 1082–10901090
4. Conclusion
We have successfully developed a method based onmathematical model for measuring the refractive indexprofile of fibers having regular and/or irregular transversecross-sectional shape. Using this method, we are also ableto measure the cross-sectional area and draw the cross-section shape with real dimensions. All calculations andresults are performed automatically using prepared com-puter programs. We applied the suggested method for threedifferent fibers of different types and shapes. We obtainedaccurate results compared with the conventional methods.For instance, the measured cross-sectional areas of theDralon and Cortelle fiber are 448.0879.53 and 31673.37mm2, respectively, while the measured values using theconventional optical microscopy method are 453710.15and 320.8274.38 mm2, respectively. Also, the conventionalmethods give only the mean refractive indices for irregularfibers, but our method succeeded in measuring therefractive index profile of the irregular Dralon withaccuracy 71� 10�3. High accuracy and high speed ofdata analysis are the most important advantages of thedeveloped method.
References
[1] Simmens SC. Birefringence determination in objects of irregular
cross-sectional shape and constant weight per unit length. Nature
1958;181:1260–1.
[2] Hamza AA. A contribution to the study of optical properties
of fibres with irregular transverse sections. Text Res J 1980;50:
731–4.
[3] Hamza AA, Sokkar TZN, Kabeel MA. Multiple-beam interfero-
metric studies on fibres with irregular transverse sections. J Phys D:
Appl Phys 1985;18:1773–80.
[4] Hamza AA, Sokkar TZN, Kabeel MA. Interferometric determina-
tion of optical properties of fibres with irregular transverse sections
and having skin-core structure. J Phys D: Appl Phys 1985;18:
2321–8.
[5] Hamza AA, Fouda IM, Hashish AH, El-Farahaty KA. Measuring
refractive indices and birefringence of multiple skin polymer fibres
from their interference patterns. Text Res J 1984;54:802–7.
[6] Hamza AA, Kabeel MA. Multiple-beam Fizeau fringes crossing a
cylindrical fibre having multi-layers. J Phys D: Appl Phys 1986;19:
1175–82.
[7] Barakat N. Interferometric studies on fibres. Part I: Theory of
interferometric determination of indices of fibres. Text Res J 1971;41:
167–70.
[8] Barakat N, El-Hennawi HA. Interferometric studies on fibres. Part
II: Interferometric determination of refractive indices and birefrin-
gence of acrylic fibres. Text Res J 1971;41:391–6.
[9] Sokkar TZN. Determination of the index profile of a graded-index
elliptical optical fiber using multiple-beam microinterferometry. Opt
Commun 1991;85:187–90.
[10] Sokkar TZN. Index profile of multilayer fibers of an elliptical cross-
section. Appl Optics 1992;31:1229–33.
[11] El-Morsy MA, Yatagai T, Hamza AA, Mabrouk MA, Sokkar
TZN. Automatic refractive index profiling of fibers by phase
analysis method using Fourier transform. Opt Laser Eng 2002;38:
509–25.
[12] Hamza AA, Sokkar TZN, El-Bakary MA, Ali AM. An interfero-
metric method for studying the influence of temperature on the mean
refractive indices and cross-sectional area of irregular fibers. Polym
Test 2003;22:83–91.
[13] Barakat N, Hamza AA. Interferometry of fibrous materials. Bristol:
Adam Hilger; 1990.
[14] Hamza AA, Sokkar TZN, El-Bakary MA, Ali AM. Variable
wavelength microinterferometry applied for irregular fibers. J Opt A:
Pure Appl Opt 2002;4:371–6.
[15] Hamza AA, Sokkar TZN, El-Bakary MA, Ali AM. Interferometric
determination of regular and/or irregular transverse sectional shape
of homogeneous fibers. Meas Sci Technol 2002;13:1931–6.
[16] Tolansky S. Multiple-beam interferometry. Oxford: Clarendon Press;
1948.
[17] Frolov VI, et al. Area of an irregular fibre cross section. Zavod Lab
1972;11:1382–4.
[18] Selivanova LF, Polatovskaya RA, Fikhman VD. Area of an irregular
fibre cross section. Khim Volokna 1977;2:50–1.
[19] Pluta M. Double refracting interference microscope with continu-
ously variable amount and direction of wavefront shear. Opt Acta
1971;18:661–75.
[20] Pluta M. Interference microscopy of polymer fibres. J Microsc
1972;96:309–32.


![REFRACTIVE INDICES DETERMINATION OF A NEW … · extraordinary refractive index, ... [1-3], the hollow prism technique [4,5] ... Refractive indices determination of a new nematic](https://img.dokumen.tips/doc/110x75/5ac1302a7f8b9a433f8c8ea2/refractive-indices-determination-of-a-new-refractive-index-1-3-the-hollow.jpg)