Embed Size (px)
Citation preview

ORIGINAL PAPER
Automated quantification of carotid artery stenosison contrast-enhanced MRA data using a deformablevascular tube model
Avan Suinesiaputra • Patrick J. H. de Koning •
Elena Zudilova-Seinstra • Johan H. C. Reiber •
Rob J. van der Geest
Received: 19 April 2011 / Accepted: 24 November 2011 / Published online: 9 December 2011
� The Author(s) 2011. This article is published with open access at Springerlink.com
Abstract The purpose of this study was to develop
and validate a method for automated segmentation of
the carotid artery lumen from volumetric MR Angio-
graphic (MRA) images using a deformable tubular 3D
Non-Uniform Rational B-Splines (NURBS) model. A
flexible 3D tubular NURBS model was designed to
delineate the carotid arterial lumen. User interaction was
allowed to guide the model by placement of forbidden
areas. Contrast-enhanced MRA (CE-MRA) from 21
patients with carotid atherosclerotic disease were
included in this study. The validation was performed
against expert drawn contours on multi-planar refor-
matted image slices perpendicular to the artery. Excel-
lent linear correlations were found on cross-sectional
area measurement (r = 0.98, P \ 0.05) and on luminal
diameter (r = 0.98, P \ 0.05). Strong match in terms of
the Dice similarity indices were achieved: 0.95 ± 0.02
(common carotid artery), 0.90 ± 0.07 (internal carotid
artery), 0.87 ± 0.07 (external carotid artery), 0.88 ±
0.09 (carotid bifurcation) and 0.75 ± 0.20 (stenosed
segments). Slight overestimation of stenosis grading
by the automated method was observed. The mean
differences was 7.20% (SD = 21.00%) and 5.2%
(SD = 21.96%) when validated against two observers.
Reproducibility in stenosis grade calculation by the
automated method was high; the mean difference
between two repeated analyses was 1.9 ± 7.3%. In
conclusion, the automated method shows high potential
for clinical application in the analysis of CE-MRA of
carotid arteries.
Keywords Carotid artery � Stenosis quantification �Magnetic resonance angiography �Image segmentation
Introduction
MR Angiography (MRA) is a non-invasive imaging
modality which is routinely used for assessment of
carotid artery (CA) stenosis. Accurate quantification
of CA stenosis is clinically relevant as the decision for
the type of proper treatment for the patient is highly
dependent on the degree of stenosis. The current
clinical guidelines have been established based on the
results of clinical trials such as NASCET [1] and
ECST [2]. Although carotid MRA provides 3D
volumetric data, CA stenosis grading is generally
This work was carried out under the NWO (Netherlands
Organization for Scientific research) Multivis project
(N643.100.602), which is part of the NWO VIEW program.
A. Suinesiaputra � P. J. H. de Koning �J. H. C. Reiber � R. J. van der Geest (&)
Division of Image Processing, Department of Radiology,
Leiden University Medical Center, Albinusdreef 2,
2333 ZA Leiden, The Netherlands
e-mail: [email protected]
E. Zudilova-Seinstra
Section of Computational Science, University
of Amsterdam, Amsterdam, The Netherlands
123
Int J Cardiovasc Imaging (2012) 28:1513–1524
DOI 10.1007/s10554-011-9988-x

evaluated on 2D Maximum Intensity Projections
(MIP) followed by visual caliper measurement. Such
measurements are highly subjective and potentially
inaccurate since MIP projections suffer from loss of
3D anatomical information, including vessel fore-
shortening over projection and loss of signal to noise.
However, 3D quantification of vessel dimensions
based on manual delineation of the vessel lumen is
a tedious task and prone to subjectivity due to the
complex vessel structures, narrowing segments, sig-
nificant intensity signal losses and irregularities. An
automated quantitative measurement is therefore
desirable to improve and to support CA assessment
from MRA images.
Different approaches have been proposed for
automated arterial lumen segmentation. A common
approach to segment a complete vasculature is by
applying a curve evolution method, better known as
the level set method or the active contour model.
Lorigo et al. [3] evolved a curve in 3D space, but the
calculations consumed a lot of time and the segmen-
tation results often included artifacts around the
vessel. Li and Yezzi [4] applied a 4D curve evolution
(the fourth dimension is the varying radii) to generate a
lumen surface, which resulted in a 3D sphere fitting
along a vessel. Consequently, the segmentation results
became too restricted for irregular vessel structures,
such as stenoses or aneurysms. Frangi et al. [5] used a
B-spline model to define a tubular geometry. A center
vessel axis was first determined after enhancing vessel
structures with the ‘vesselness’ filter and the fitting
was performed to the direction of full-width half or
10% maximum intensity between the surface and the
center vessel axis. The vesselness filter, however,
often produces false responses. A more extensive and
recent survey of other vessel segmentation techniques
is available in Lesage et al. [7].
We developed a deformable tubular model based on
Non-Uniform Rational B-Splines (NURBS) surface
modeling to segment vascular structures. To avoid
non-vessel artifacts and background noise, the tubular
model was initially positioned inside a lumen, cen-
tered at a pathline that was automatically detected by
using a front propagation method [6]. A gradient-
based energy minimization iteration scheme was
applied to deform the tubular model towards the
lumen. Since the surface was constructed with a
tubular shape model, the segmentation result was
constrained to the shape of a vessel. Several pilot
studies [8–10] have indicated promising results with
this approach. We also allowed a minimum but
intuitive user intervention particularly on difficult
cases by marking forbidden areas for selecting the
vessel of interest. We applied our method to delineate
carotid arteries from MRA images from patients
suffering severe atherosclerotic disease. Clinical find-
ings in terms of the degree of stenosis and correlation
analyses of cross-sectional areas and luminal diameter
validated with expert observers are presented.
Methods
Pathline definition
The automated detection of a trajectory curve inside a
vessel was developed based on the fast level marching
set method [11]. A minimum of two seed points
(proximal and distal) are required to define the vessel
of interest. These seed points are manually placed on
one of the three orthogonal MIP images. A depth
buffer is created to track the position of a point in 3D
space.
Using image as a medium, a front propagation was
performed starting from the proximal point to all
directions. The method computes the arrival time ta of
the front at each image element, i.e.,
taðx1Þ ¼ taðx2Þ þdðx1; x2Þf ðx1; x2Þ
; ð1Þ
where x1; x2 2 <3 are two adjacent points, d : <3 �<3 ! <þ is an Euclidean distance function and
f : <3 � <3 ! <$ is a speed function. For MRA, we
used a sigmoid speed function (see details in de
Koning et al. [6]), which depends on the maximum,
minimum and background intensities, calculated from
the histogram of the whole MRA data.
As soon as the front reaches the distal point, the
front propagation process is terminated. The result is a
set of accepted points, i.e. points that the front has
propagated through. The arrival times on each
accepted point are stored in an image (the T-surface
image). The pathline is then extracted by finding the
fastest route from the distal to the proximal points
using a backtracking algorithm. By using the steepest-
descent approach, the fastest route is given by a curve
C : < � ½0; 1� ! <3 that satisfies
1514 Int J Cardiovasc Imaging (2012) 28:1513–1524
123

oC
ox¼ �rT; x 2 ½0; 1� ð2Þ
where T is the T-surface image, C(0) is the distal point,
and C(1) is the proximal point. The computed pathline
does not follow the center of the vessel since it is a
minimal path. A vessel path refinement step is used to
move the pathline to the center of the vessel (see
details in de Koning et al. [6]). This refinement uses a
distance image created from the accepted points and
moves the points of the path along the gradient of the
distance image until the points reaches the maximum
distance.
Intermediate points and forbidden planes
The front propagation method has been previously
applied to the extraction of vessel pathlines in non-
carotid arteries, e.g., in coronary arteries [12, 13], in
peripheral arteries [6] and in cerebral arteries [14].
Although the front propagation method has shown
good consistent results irrespective of varied positions
of proximal and distal points, there are some draw-
backs when applying it in carotid arteries. The distance
between vessels in the neck area can be very small.
They can be intertwined and sometimes they seem to
touch each other due to the image resolution, which
can create an easy pass to jump from one vessel to the
other (Fig. 1a). To solve this problem, we introduced
optional intermediate points that are placed manually
by the user upon seeing this mistake; a similar approach
was introduced by Benmansour et al. [26] The front
should propagate through all intermediate points
before terminating at the distal point (Fig. 1b).
In the presence of a severe stenosis, adding inter-
mediate points does not always solve the problem
(Fig. 2b), because the lumen intensity values at the
stenosed segment drop significantly almost to the same
level as the background. In this case, we introduced
another type of user intervention to block the front
propagation. Initially, the user selects the best view-
ing angle of the stenosis in the maximum intensity
projection (MIP) image. Subsequently, a curve is
drawn on the MIP image to mark a forbidden pathway
(Fig. 2c in the right panel). The curve defines a curved
plane parallel to the viewing angle. The speed function
values on this curved plane are modified to a constant
zero, which consequently block the front passing
through the plane (see the left panel of the application
in Fig. 2c).
Vascular tube model
The initial tube model is constructed by using a Non-
Uniform Rational B-Spline (NURBS) model. A
NURBS surface is defined by
Sðu; vÞ ¼Xn
i¼0
Xm
j¼0Ri;jðu; vÞ Pi;j ð3Þ
where 0 B u, v [ R \ 1 and Pi,j [ R3 is a set of control
points. The function Ri,j (u, v) is the piecewise rational
basis function
Fig. 1 Failed pathline detection case (a) and the correct pathline through one intermediate point (green marker) (b)
Int J Cardiovasc Imaging (2012) 28:1513–1524 1515
123

Ri;jðu; vÞ ¼Ni;pðuÞ Nj;qðvÞ wi;jPn
k¼0
Pml¼0 Nk;pðuÞ Nl;qðvÞ wk;l
ð4Þ
where Ni,p (u) is the ith B-spline basis function of
p-degree and {wk,l} are the weights.
NURBS can model any type of 3D surfaces and
it has properties that are suitable for segmenting
vascular structures. The NURBS surface is smooth
and derivable, allowing non-rigid deformation of
the model that keeps the smoothness of the surface.
Another important property is the local support of
the model in which Ri,j (u, v) is non-zero only
within [ui, ui?p-1] and [v, vj?q-1] interval. This
means that changing the position of one control
point Pi,j only affects the local surface S(u, v) on
that particular interval. Consequently, it allows local
adjustment of the surface to fit onto an irregular
vasculature.
To construct a tube model, a sweep surface
technique is performed. A number of circular rings
are positioned along the pathline. The u and v compo-
nents in Eq. 3 are directions along ring circumferential
and centerline longitudinal, respectively. The initial
diameter of the tube can be set as a constant (Fig. 3a)
or automatically estimated from the front propagation
method (Fig. 3b). For the automated estimation, the
skeletonization process is applied on the accepted
points. By using the estimated diameter, the initial
tube surface is already in the proximity of the lumen,
allowing faster convergence of the fitting iteration
process.
Tube fitting
The surface fitting process is a deformation of the
NURBS surface Sðu; vÞ : <2 ! <3 by a set of forces
Fig. 2 Failed pathline
detection in a stenotic case
(a) and even after an
intermediate point (greenmarker) was added to help
the pathline detection (b).
Allowing user to draw a
freehand curve on the
projection image (the redcurve in the right panel at
figure c), a forbidden plane
(white dots) does not allow
the front propagation to pass
through, resulting in the
correct pathline inside the
stenosis
1516 Int J Cardiovasc Imaging (2012) 28:1513–1524
123

acting on the control points to reach the dynamic
force equilibrium. The energy function to deform the
NURBS surface is defined as
Eðu; vÞ ¼Z
FðSðu; vÞÞdudv; ð5Þ
where the potential surface F : <3 ! < is given by
Fðx; y; zÞ ¼ � rIðx; y; zÞj j: ð6ÞAn intuitive way is to imagine the NURBS surface
living on the potential surface F(x, y, z) determined by
the opposite direction of the gradient of the image
function I(x, y, z).
Let pðtÞ 2 <3 be a vector on a control point that
depends on the time t. Minimizing the energy function
E(u, v) along time is performed by applying the
following Euler–Lagrange differential equation
cdp
dtþ oE
op¼ c
dp
dtþXL
i¼0
oF
ox
oSx
opþ oF
oy
oSy
opþ oF
oz
oSz
op
� �
¼ 0 ð7Þ
where L is the number of surface tessellations, c is a
weighting factor and Sx, Sy and Sz are the derivatives of
Eq. 3 with respect to x, y and z. Note that qE/qp is the
image force that applies to the surface nodes. Solving
Eq. 7 will define a set of vectors (image force vectors)
that act on each control point.
Image acquisition
All MR images were acquired by a 1.5T MRI scanner
equipped with a gradient overdrive (Magnetom Vision,
Siemens Medical System, Erlangen, Germany). Spoiled
3D FLASH (fast low-angle shot) MR angiography was
performed using a 4 9 2 circularly polarized phased-
array neck coil. The sequence was performed with
32–36 coronal partitions. The typical image slice param-
eters were 1.94–2.5 mm thickness, 2.84–3.15 ms repe-
tition time, 1.03–1.11 ms echo time, 35–40� flip angle,
70 9 140 9 280 mm3 field of view and a scan time
of 9–9.5 s. The typical image slice resolution was
256 9 256 pixels with 1.09 9 1.09 mm pixel spacing.
Four consecutive 3D images were taken, starting at
approximately 3 s after the administration of 0.1
mmoL/kg gadolinium (Omniscan, Hafslun Nycomed,
Oslo, Norway). Digital subtraction MR images were
generated in several cases to improve vessel-to-back-
ground contrast.
Patient study
Contrast-enhanced MRA studies from 21 patients
suffering carotid atherosclerotic disease were included
for this study. Vessel segments of interest were defined
from proximal common artery to the distal either
internal or external arteries, depending on the stenosis
location. For assessing the reproducibility of the
automated method, two groups of pathlines were
generated: (1) starting from the common artery
proximal to the main bifurcation to both internal and
external arteries, and (2) using a reversed direction
from internal/external artery to the common carotid.
Although the two groups of pathlines were similar,
they were different in terms of the estimated initial
radius.
Fig. 3 Two examples of initial tube models prior fitting: a constant radii, and b waveprop estimated radii
Int J Cardiovasc Imaging (2012) 28:1513–1524 1517
123

Image analysis
The detected pathline was used to create curved
multiplanar reformatted (CMPR) images for manual
luminal contour tracing by an independent expert.
CMPR image slices were generated every 1.0 mm
(non-stenosed segments) and 0.5 mm (stenosed seg-
ments) with the typical size of 64 9 64 pixels of
0.5 9 0.5 mm pixel spacing. An expert drew luminal
contours on these images to define the reference by
using a dedicated quantitative Vessel Wall MR
Analytical Software (VesselMASS, Leiden University
Medical Center, the Netherlands) [15].
To maintain the objectiveness and consistency of
manual contouring, full-width half-maximum criteria
was applied to improve the vessel boundary visuali-
zation [16]. Let Imax and Iout be the maximum intensity
response at the center of the lumen and the background
intensity, respectively. The 50% threshold value was
set as follows
T ¼ 1
2Imax � Ioutð Þ: ð8Þ
The thresholded binary image was used as a soft
guideline to delineate the lumen. Comparisons were
made with the adjacent slice planes if there were some
doubts about the shape of the lumen boundary.
Stenosis grading
Stenoses were graded based on NASCET criteria [1]:
G ¼ 1� dr
ds
� �� 100% ð9Þ
where dr is the narrowest diameter of the residual
lumen and ds is the luminal diameter of the distal
vessel, i.e., the segment of the same artery that is
located well beyond the stenosed bulb [17]. The
luminal diameter was defined as the minimum diam-
eter of a circle that can still be fitted inside the lumen
cross-section.
Statistical analys
Statistical analysis was performed by using R statis-
tical computing environment [18]. Linear regression
was applied to analyze correlation of cross-sectional
area and luminal diameter measurements derived from
the automated method and the expert. Pearson corre-
lation coefficient (r) was used to indicate the degree of
linear relationship between the two methods. The
statistical significance level was set at P \ 0.05 with
confidence interval of 95%. The correlation analysis
was performed on different vessel segment categories:
common carotid arteries (CCA), internal carotid
arteries (ICA), external carotid arteries (ECA), bifur-
cation slices (BA) and stenosed slices (SA).
To measure the degree of similarity between two
contours, Dice similarity index was applied [19], i.e.,
DðC1;C2Þ ¼2 AðC1 [ C2Þ
AðC1Þ þ AðC2Þð10Þ
where C1, C2 are two different contours and A(C) is the
area defined by contour C. The same vessel group
division was applied for this measurement.
Bland–Altman analysis was performed to study the
agreement of stenosis grading between the automated
method and the observer [20]. The same analysis was
also applied for measuring reproducibility of the
method for two repeated trials. Only SA group was
included in both analyses.
Results
The automated method was performed on a PC Intel
Quad Core Q6600 2.40 GHz 2.00 GB RAM worksta-
tion running Microsoft Windows XP in a single thread
mode. The maximum number of iterations was set to
200 and the iteration was terminated earlier when the
average size of image forces was less than or equal to
10-5. The distance between control point rings was
fixed to 3 mm with 7 control points per ring and 5
mesh patches between rings.
The average iteration time was 15.0 ± 7.0 s or
0.14 ± 0.05 s/mm with the average pathline length of
100.8 ± 21.7 mm. Four cases reached the maximum
number of iteration. Examples of four segmentation
results on CA stenoses are shown in Fig. 4.
Correlation analysis
The automated method demonstrated excellent linear
correlation with expert contours for both cross-sectional
area and luminal diameter measurements (Fig. 5).
Pearson correlation coefficients for measuring the
1518 Int J Cardiovasc Imaging (2012) 28:1513–1524
123

cross-sectional area and the luminal diameter, which
were calculated from the automated and expert-drawn
contours, were both r = 0.98 (P \ 0.05).
Excellent linear correlation was also achieved in
each vessel type. Table 1 shows correlation coeffi-
cients for each vessel type. Strong correlations for both
cross-sectional area and luminal diameter measure-
ments were found for CCA, ICA, ECA and BA. For
stenosed areas (SA), moderate correlation was found.
The correlation coefficient to measure area and luminal
diameter for SA were r = 0.70 (P \ 0.05) and
r = 0.58 (P \ 0.05), respectively. The mean luminal
diameter for SA slices was 8.8 mm (range: 0.75 mm
to 23.3 mm) compared to expert mean diameter of
9.05 mm (range: 2.34 mm to 23.23 mm). Figure 6
shows the comparison of measuring area and luminal
diameter between the automated method and the expert
in a graphical form of standard error bars.
Fig. 4 Some segmentation results. Left: volume rendering, middle: maximum intensity projection, right: the segmentation mesh result
(blue surface)
0 200 400 600
010
020
030
040
050
060
0
Cross−sectional Area
Expert−drawn contour (mm2)
Aut
omat
ed m
etho
d (m
m2 )
y = 0.97x − 4.7 (p<2e−16)
Bifurcation slices
5 10 15 20
05
1015
20
Luminal Diameter
Expert−drawn contour (mm)
Aut
omat
ed m
etho
d (m
m)
y = 1.09x − 1.1 (p<2e−16)
(a) (b)
Fig. 5 Linear regression analysis for cross-sectional areas (a) and luminal diameter calculations (b) comparing automatically derived
with manually traced contours
Table 1 Pearson correlation coefficients for individual cate-
gorical slices measuring cross-sectional areas and luminal
diameter between the automated method and the expert
Cross-sectional Area luminal [r(P)] Diameter [r(P)]
CCA 0.99 (\0.05) 0.98 (\0.05)
ICA 0.96 (\0.05) 0.93 (\0.05)
ECA 0.92 (\0.05) 0.89 (\0.05)
BA 0.91 (\0.05) 0.97 (\0.05)
SA 0.70 (\0.05) 0.58 (\0.05)
CCA common carotid artery, ICA internal carotid artery, ECAexternal carotid artery, BA bifurcartion, SA stenosed slices
Int J Cardiovasc Imaging (2012) 28:1513–1524 1519
123
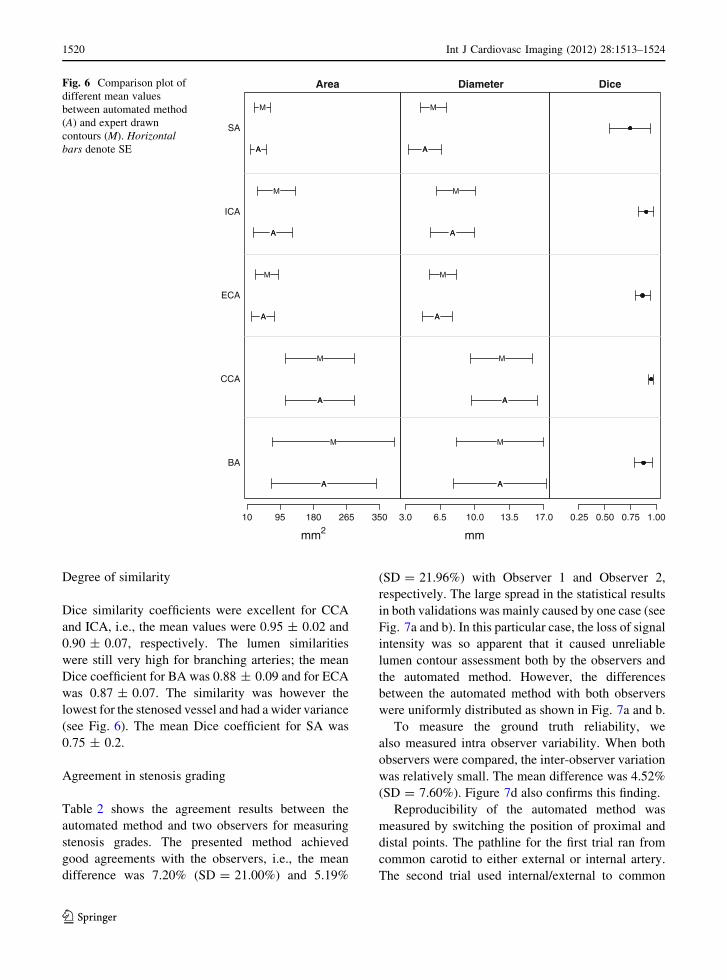
Degree of similarity
Dice similarity coefficients were excellent for CCA
and ICA, i.e., the mean values were 0.95 ± 0.02 and
0.90 ± 0.07, respectively. The lumen similarities
were still very high for branching arteries; the mean
Dice coefficient for BA was 0.88 ± 0.09 and for ECA
was 0.87 ± 0.07. The similarity was however the
lowest for the stenosed vessel and had a wider variance
(see Fig. 6). The mean Dice coefficient for SA was
0.75 ± 0.2.
Agreement in stenosis grading
Table 2 shows the agreement results between the
automated method and two observers for measuring
stenosis grades. The presented method achieved
good agreements with the observers, i.e., the mean
difference was 7.20% (SD = 21.00%) and 5.19%
(SD = 21.96%) with Observer 1 and Observer 2,
respectively. The large spread in the statistical results
in both validations was mainly caused by one case (see
Fig. 7a and b). In this particular case, the loss of signal
intensity was so apparent that it caused unreliable
lumen contour assessment both by the observers and
the automated method. However, the differences
between the automated method with both observers
were uniformly distributed as shown in Fig. 7a and b.
To measure the ground truth reliability, we
also measured intra observer variability. When both
observers were compared, the inter-observer variation
was relatively small. The mean difference was 4.52%
(SD = 7.60%). Figure 7d also confirms this finding.
Reproducibility of the automated method was
measured by switching the position of proximal and
distal points. The pathline for the first trial ran from
common carotid to either external or internal artery.
The second trial used internal/external to common
A
A
A
A
A
A
A
A
A
A
M
M
M
M
M
10 95 180 265 350
BA
CCA
ECA
ICA
SA
Area
mm2
A
A
A
A
A
A
A
A
A
A
M
M
M
M
M
3.0 6.5 10.0 13.5 17.0
Diameter
mm
0.25 0.50 0.75 1.00
DiceFig. 6 Comparison plot of
different mean values
between automated method
(A) and expert drawn
contours (M). Horizontalbars denote SE
1520 Int J Cardiovasc Imaging (2012) 28:1513–1524
123

artery pathlines. Given different seed point positions,
the automated method generated consistent results.
The mean difference was 1.89% (SD = 7.34%). There
was no systematic error found as shown in Fig. 7c.
Discussion
We have presented an automated lumen segmentation
method for carotid arteries based on a deformable
NURBS model. The method showed good agreement
with the expert in terms of lumen diameter, cross-
sectional area measurement and stenosis grading. This
result suggests high potential for clinical applicability
of the automated method in the analysis of CE-MRA
of carotid arteries. To apply the automated lumen
detection method, limited user-interaction is required
for indicating the start and end position of the vessel
segment of interest. In particular complex cases, such
as cases with highly curved vessel segments or cases
where different vessels run very close to each other,
some additional interaction was needed to obtain a
valid lumen pathline. The high reproducibility of the
method indicates that these manual initialization steps
have negligible influence on the obtained diameter
measurements.
We compared our method with a similar study
performed by Guzman et al. [21], which segmented
Table 2 Stenosis grading
assessment results between
the automated method and
two observers
Mean
difference (%)
Min
difference (%)
Max
difference (%)
SD (%)
Auto versus Obs1 7.20 -14.44 60.52 21.00
Auto versus Obs2 5.19 -21.91 59.24 21.96
Obs1 versus Obs2 -4.52 -21.34 4.36 7.60
Auto1 versus Auto2 -1.89 -22.51 10.13 7.34
30 40 50 60 70
−40
−20
Auto 1 vs Observer 1
Average of stenosis grading (%)
mean=7.2%
+2SD
−2SD
(a)
30 40 50 60
−40
−20
Auto 1 vs Observer 2
Average of stenosis grading (%)
mean=5.19%
+2SD
−2SD
(b)
30 40 50 60 70 80
−40
−20
020
400
2040
Auto 1 vs Auto 2
Average stenosis grading (%)
mean=−1.89%
+2SD
−2SD
(c)
20 30 40 50 60
−40
−20
020
400
2040
Observer 1 vs Observer 2
Average stenosis grading (%)
mean=−4.52%
+2SD
−2SD
(d)
Diff
eren
ce o
f ste
nosi
s gr
adin
g (A
uto1
− O
bs1)
Diff
. of s
teno
sis
grad
ing
(Aut
o1 −
Aut
o2)
Diff
eren
ce o
f ste
nosi
s gr
adin
g (A
uto1
− O
bs2)
Diff
. tw
o ob
serv
ers
(Obs
1 −
Obs
2)
Fig. 7 Stenosis grading
assessments: a automated
method (Auto1) versus
Observer 1, b automated
method (Auto1) versus
Observer 2, c between two
repeated automated methods
with different pathlines
(Auto1 vs. Auto2), and
d Observer 1 versus
Observer 2
Int J Cardiovasc Imaging (2012) 28:1513–1524 1521
123

carotid arteries by applying the 2D cross-sectional
threshold mechanism during the fitting process [6].
Guzman study measured the diameter of common
carotid artery (CCA) and internal carotid artery (ICA)
with two measurements: caliper and digital subtracted
angiography (DSA). Table 3 compares the cross
correlation coefficient of the luminal diameter
between our method, the Guzman study with caliper
and the Guzman study with DSA measurement. In
both cases, our method shows better correlation
coefficients compared to the Guzman study.
In terms of the stenosis grading, the method
achieved good reproducibility. There was one partic-
ular case that both observers disagreed with the
automated method (one of which the segmentation
result is shown in Fig. 4d). The tube model shrank
substantially because of significant intensity drop-out
in the signal intensity at the stenosed area. The
presence of signal intensity drop-out at the stenosis
and distal intensity reduction have been associated
with severe (C70%) stenosis [22]. This caused an
overestimation of the stenosis grading compared to the
observers. This limits the automated method, because
the fitting process relies heavily on the image gradient.
When the contrast between lumen and the background
becomes so low, the image forces cannot stop the
iteration process at the correct edge and subsequently
the mesh keeps shrinking (Fig. 8).
Similarly due to the low tissue contrast, it is difficult
to delineate the lumen at the stenosed area, because
the lumen is hardly visible (Fig. 9). The only objective
guidance for the manual contouring is by taking the
full-width half-maximum criteria into account. Accu-
rate stenosis grading therefore highly depends on the
quality and spatial resolution of the imaging technique.
The use of high-field and parallel imaging MR systems
might solve this problem in the future [23–25].
Underestimation of luminal area segmentations
was present mostly at the bifurcation areas (circle
marks in Fig. 5a). Bifurcations are still problematic in
the current implementation, because the tube model is
still designed to fit onto a single vessel segment. The
tube model followed straight to one artery branch
inside the main bifurcation, while the observer drew
luminal contours of the whole main bifurcation area
(see an illustration in Fig. 8). For assessing the degree
of stenosis, this limitation might become a problem if
the stenosis occurs in the bifurcation area. In this case,
the deformable mesh model should be extended to fit
onto bifurcation area.
Conclusions
An automated method for quantification of carotid
artery stenosis from MRA data based on a deformable
mesh model has been presented. The method achieved
excellent correlation on area and luminal diameter
measurements. The processing time was reasonably
fast to segment the vessel of interest. Prior to
segmentation, some user interventions were needed
in the presence of stenosis but the interaction mech-
anism was designed to be as easy and as intuitive
as possible. When image quality is fairly good, the
Table 3 Luminal diameter measurement comparisons
This
study
(r)
Guzman et al. [19]
with caliper
measurement (r)
Guzman et al. [19]
with DSA
measurement (r)
CCA
diameter
0.98 0.75 0.81
ICA
diameter
0.93 0.81 0.78
Fig. 8 An example of vessel segmentation on carotid bifurca-
tion area showing disagreement (pointed by black arrows)
between the automated method with expert drawn contours. The
left Figure shows the expert drawn contours (green curves),
while the right Figure shows the contours generated by the
automated method (cyan curves). Volumetric rendering of the
vessel structure is shown in the background
1522 Int J Cardiovasc Imaging (2012) 28:1513–1524
123

presented automated MRA analysis method provides
very accurate and reproducible quantitative assess-
ment of vessel dimensions and the degree of stenosis.
Acknowledgments This work was carried out under the
NWO (Netherlands Organization for Scientific research)
Multivis project (N 643.100.602), which is part of the NWO
VIEW program.
Conflict of interest None.
Open Access This article is distributed under the terms of the
Creative Commons Attribution Noncommercial License which
permits any noncommercial use, distribution, and reproduction
in any medium, provided the original author(s) and source are
credited.
References
1. North American Symptomatic Carotid Endarterectomy
Trial (1991) Methods, patient characteristics, and progress.
Stroke 22(6):711–720
2. European Carotid Surgery Trialists’ Collaborative Group
(1991) MRC European Carotid Surgery Trial: interim results
for symptomatic patients with severe (70–99%) or with mild
(0–29%) carotid stenosis. Lancet 337(8752):1235–1243
3. Lorigo LM, Faugeras OD, Grimson WE, Keriven R, Kikinis
R, Nabavi A, Westin CF (2001) CURVES: curve evolution
for vessel segmentation. Med Image Anal 5(3):195–206
4. Li H, Yezzi A (2007) Vessels as 4-D curves: global minimal
4-D paths to extract 3-D tubular surfaces and centerlines.
IEEE Trans Med Imaging 26:1213–1223
5. Frangi AF, Niessen WJ, Nederkoorn PJ, Bakker J, Mali WP,
Viergever MA (2001) Quantitative analysis of vascular
morphology from 3D MR angiograms: In vitro and in vivo
results. Magn Reson Med 45(2):311–322
6. de Koning PJH, Schaap JA, Janssen JP, Westenberg JJM, van
der Geest RJ, Reiber JHC (2003) Automated segmentation
and analysis of vascular structures in magnetic resonance
angiographic images. Magn Reson Med 50(6):1189–1198
7. Lesage D, Angelini ED, Bloch I,Funka-Lea G (2009)A review
of 3D vessel lumen segmentation techniques: models, features
and extraction schemes. Med Image Anal 13(6):819–845
8. Makowski P, de Koning P, Angelie E, Westenberg J, van der
Geest R, Reiber J (2006) 3D cylindrical B-Spline segmen-
tation of carotid arteries from MRI images. Biomedical
Simulation 4072:188–196
9. Suinesiaputra A, de Koning PJH, Zudilova-Seinstra E, Re-
iber JHC, van der Geest RJ (2009) A 3D MRA segmentation
method based on tubular NURBS model. In 17th Intl. Soc.
for Magnetic Resonance in Medicine (ISMRM) 3149
10. Suinesiaputra A, de Koning PJH, Zudilova-Seinstra E, Re-
iber JHC, van der Geest RJ (2009) In vivo validations of 3D
tubular NURBS fitting model applied on severe stenotic and
high curvature MRA of carotid arteries. Magn Reson Mater
Phys Biol Med 22(Suppl. 1):191–192
11. Sethian JA (1996) A fast marching level set method for
monotonically advancing fronts. Proc Natl Acad Sci USA
93(4):1591–1595
12. Jandt U, Schafer D, Grass M, Rasche V (2009) Automatic
generation of 3D coronary artery centerlines using rota-
tional X-ray angiography. Med Image Anal 13(6):846–858
(a) (b) (c) (d) (e) (f) (g) (h)
Fig. 9 Low contrast and signal intensity drop problem when
assessing severe stenosis. CMPR image slices show low contrast
of the stenosed lumen, making it difficult for an observer to draw
the luminal area. The signal intensity drop also causes the
automated method to segment less reliably in the stenosed area
Int J Cardiovasc Imaging (2012) 28:1513–1524 1523
123

13. Marquering HA, Dijkstra J, de Koning PJH, Stoel BC, Re-
iber JHC (2005) Towards quantitative analysis of coronary
CTA. Int J Cardiovasc Imaging 21(1):73–84
14. Quek FK, Kirbas C (2001) Vessel extraction in medical
images by wave-propagation and traceback. IEEE Trans
Med Imaging 20(2):117–131
15. Adame IM, de Koning PJH, Lelieveldt BPF, Wasserman
BA, Reiber JHC, van der Geest RJ (2006) An integrated
automated analysis method for quantifying vessel stenosis
and plaque burden from carotid MRI images: combined
postprocessing of MRA and vessel wall MR. Stroke 37(8):
2162–2164
16. Westenberg JJ, van der Geest RJ, Wasser MN, van der
Linden EL, van Walsum T, van Assen HC, de Roos A,
Vanderschoot J, Reiber JH (2000) Vessel diameter mea-
surements in gadolinium contrast-enhanced three-dimen-
sional MRA of peripheral arteries. Magn Reson Med 18(1):
13–22
17. Fox AJ (1993) How to measure carotid stenosis. Radiology
186(2):316–318
18. R Development Core Team (2008) R: a language and
environment for statistical computing. R Foundation for
Statistical Computing, Vienna
19. Dice LR (1945) Measures of the amount of ecologic asso-
ciation between species. Ecology 26(3):297–302
20. Bland JM, Altman DG (1986) Statistical methods for
assessing agreement between two methods of clinical
measurement. Lancet 1(8476):307–310
21. Guzman R, Lovblad KO, Altrichter S, Remonda L, de
Koning P, Andres RH, El-Koussy M, Kelly ME, Reiber
JHC, Schroth G, Oswald H, Barth A (2008) Clinical vali-
dation of an automated vessel-segmentation software of the
extracranial-carotid arteries based on 3D-MRA: a prospec-
tive study. J Neuroradiol 35(5):278–285
22. Babiarz LS, Romero JM, Murphy EK, Brobeck B, Schaefer
PW, Gonzalez RG, Lev MH (2009) Contrast-enhanced MR
angiography is not more accurate than unenhanced 2D time-
of-flight MR angiography for determining C 70% internal
carotid artery stenosis. AJNR Am J Neuroradiol 30(4):
761–768
23. Bachmann R, Nassenstein I, Kooijman H, Dittrich R, Kugel
H, Niederstadt T, Kuhlenbaumer G, Ringelstein EB, Kra-
mer S, Heindel W (2006) Spontaneous acute dissection of
the internal carotid artery: high-resolution magnetic reso-
nance imaging at 3.0 tesla with a dedicated surface coil.
Invest Radiol 41(2):105–111
24. Nael K, Fenchel M, Krishnam M, Laub G, Finn JP, Ruehm SG
(2007) High-spatial-resolution wholebody MR angiography
with high-acceleration parallel acquisition and 32-channel
3.0-T unit: initial experience. Radiology 242(3):865–872
25. Kramer U, Wiskirchen J, Fenchel MC, Seeger A, Laub G,
Tepe G, Finn JP, Claussen CD, Miller S (2008) Isotropic
high-spatial-resolution contrast-enhanced 3.0-T MR angi-
ography in patients suspected of having renal artery steno-
sis. Radiology 247(1):228–240
26. Benmansour F, Cohen LD (2009) Fast object segmentation
by growing minimal paths from a single point on 2D or 3D
images. J Math Imaging Vis 33(2):209–221
1524 Int J Cardiovasc Imaging (2012) 28:1513–1524
123