Embed Size (px)
Citation preview

Analytical Cellular Pathology 34 (2011) 279–300DOI 10.3233/ACP-2011-0046IOS Press
279
Review Article: Modern Trends in Imaging IV
Automated image interpretation andcomputer-assisted diagnostics
David J. Forana,∗, Wenjin Chen and Lin Yangb
aCenter for Biomedical Imaging & Informatics, Department of Pathology and Laboratory Medicine,University of Medicine and Dentistry of New Jersey, NJ, USAbDivision of Biomedical Informatics, Department of Biostatistics, University of Kentucky, KY, USA
1. Introduction
The field of computer-assisted diagnostics is a disci-pline which has emerged as a result of sustained effortsthroughout the clinical and scientific communities todevise systematic procedures and protocols to sup-port physicians in rendering more informed diagnosticdecisions. One of the most active and exciting branchesof this research focuses on the automated interpreta-tion of medical images. While most of the emphasisfor these activities has been directed towards radio-logical imaging modalities including X-ray, MRI, andultrasound, new advances in digital microscopy nowmake it possible for the fields of diagnostic and inves-tigative pathology to follow a similar experimental anddevelopmental path.
1.1. Overview of computer-assisted diagnostics(CAD) in radiology and pathology
The incentive for undertaking many of the earli-est CAD studies grew out of efforts to identify ameans for reducing the level of fatigue experiencedby physicians while increasing the reliability andobjectivity with which medical images are evaluated.Prior to the 1990’s the primary emphasis was directedtowards developing stand-alone “expert systems” that
∗Corresponding author: E-mail: [email protected].
could review a given set of medical findings, includ-ing images, in order to deduce a reliable differentialdiagnosis using simple statistical methods. Althoughseveral of these early projects helped advance thefield, most of these efforts presented so many con-tributing factors that standard modeling strategies wererendered grossly inadequate [1–3]. Experience gainedby investigators during the course of these pioneeringstudies led to a shift away from attempting to automati-cally provide a definitive diagnosis towards developingmethods that could provide objective, reliable clinicaldecision support for physicians. This new emphasisled to the term, computer -assisted diagnostics (CAD),which is commonly used to describe these activitiestoday. To the extent that CAD is currently used inmedical imaging applications, the majority of stud-ies are directed towards: 1) pre-screening specimensto flag suspicious findings; 2) detecting and segment-ing image regions that are likely to be diseased; 3)accurately measuring and quantifying image featuresthat are known to be relevant to a given clinical deci-sion; and 4) testing new image features and algorithmswhich could potentially provide more accurate clinicaldecisions.
Radiologists were among the first physicians to uti-lize CAD in conjunction with rigorous computationalmethods to support diagnostic decisions with muchof their incentive driven by the need to discriminateamong subtle changes in the size, shape, and texture
2210-7177/11/$27.50 © 2011 – IOS Press and the authors. All rights reserved

280 D.J. Foran et al. / Automated image interpretation and computer-assisted diagnostics
3000
2500
2000
1500
1000
500
0-50 0 50 100 150 200 250 300
Fig. 1. Example of image processing of an imaged histologic section of breast tissue prepared with hematoxlyin & eosin stain.
of imaged organs and lesions. These tasks demandedaccurate mathematical descriptions which could beincorporated into standardized techniques and proto-cols. In the 1960’s Lusted published work that formallyintroduced the use of receiver operator curves (ROC)to measure performance and he promoted the use ofmodern statistical methods, including Bayesian statis-tics and likelihood ratios to support more accuratediagnoses and prognoses [4, 5]. CAD techniques havebeen successfully utilized in number of applicationsranging from the characterization of lung nodules tothe classification of dermatologic conditions [6] andthe detection of colonic polyps from CT colonoscopy[7, 8]. One of the most publicized advances that havebeen achieved using CAD, however, has been in thedetection of breast cancer [9–12]. Since that time, sev-eral commercial CAD systems have been developedand approved by the FDA for clinical use. Today, thesetechnologies are used routinely as part of modern clin-ical practice [13].
Although the idea of using CAD in diagnosticpathology has taken a much longer time for accep-tance, the advent of new digital imaging technologiesincluding high-throughput whole slide scanners (vir-tual microscopes) are making a very compelling caseas part of the clinical workflow. For example, thePAPNET system [14–16] along with specialized thin-prep processing, were designed to optimally prepareand image cervical smear specimens prior to neuralnetwork-based screening. PAPNET is yet another FDAapproved CAD system that has been introduced intothe clinical workflow as a reliable means for detectingand flagging suspicious cases which require follow-upbefore a definitive classification can be rendered.
The next sections of this chapter provide a high-level overview of the fields of image processing,pattern recognition and computer vision followed by adescription of how these disciplines relate to the morecomprehensive field of computer-assisted diagnostics.Throughout the remainder of the chapter we have sup-plied multiple illustrative examples demonstrating howrecent advances and innovations in each of these areashave impacted clinical and research activities through-out pathology and radiology.
1.2. Image processing
The term image processing refers to the approaches,methods and technologies that are used to manipu-late images from one form to another with the intentof rendering them more useful. During the courseof these operations images may be enhanced, noisesuppressed and blurring eliminated, but the results ofthese processes still require further assessment and/orinterpretation. Figure 1 shows a representative imagedbreast tissue histologic section along with the resul-tant edge detection map and corresponding intensityhistogram.
1.3. Pattern recognition
Pattern recognition refers to the methods and pro-cesses that make it possible to perceive structure indata. The range of domains that benefit from the useof pattern recognition spans a wide number of appli-cations including the interpretation of speech, analysisof seismic data and prediction of economic trends. For

D.J. Foran et al. / Automated image interpretation and computer-assisted diagnostics 281
Fig. 2. A multivariate clustering algorithm in action.
the purposes of this chapter, however, the term will beused to refer to the algorithms, methods and proce-dures that enable computer-based systems to arrive atconclusions which are consistent with what an expertpathologist or radiologist might observe if they wereto evaluate the images using traditional approachesand practices. Figure 2 shows a multivariate clusteringalgorithm in the process of systematically interrogatingand detecting the salient peaks and basins of attractionwithin a representative data set.
1.4. Computer vision
Several of the fundamental principles of the field ofcomputer vision have grown out of attempts to mimicthe human visual system. One of the most strikingarchitectural features of the human visual system is theunderlying structure which enables it to operate on theprinciple of convergence wherein there is an increasedcapacity for abstraction at ascending levels of process-ing and analysis. Figure 3 shows the histology of retinawhich initiates the hierarchical structure of the humanvisual system as an input signal ascends from the sim-ple to the complex and hyper-complex cell. It is thisaspect of the visual system that machine vision scien-tists have tried to exploit and incorporate into moderncomputer-based designs.
Over the course of more than 15 years our researchteam has designed, developed and implemented a hostof new and innovative computer vision algorithms inprojects addressing challenging clinical problems indiagnostic and investigative pathology and radiology.While it would exceed the scope of a single book chap-
Fig. 3. Histology of retina.
ter to provide a detailed description of any one ofthose efforts, we will provide a summary of severalkey efforts that our team has undertaken over the past5–10 years along with a set of citations which refer tothe most relevant efforts of other investigators through-out the field whose work demonstrates the tremendousimpact that new and emerging technologies in imagingand high-performance computing are having through-out the clinical and research communities.
2. Image guided decision support
A significant driving force for advances in the fieldof computer-assisted diagnostics has been the growingemphasis throughout the clinical and research com-munities on personalized healthcare. As such, it hasbecome increasingly important to improve the reliabil-ity and accuracy with which subclasses of disease aredistinguished in order to facilitate drug discovery andidentify subpopulations of patients who would mostlikely benefit most from a specific drug regimen ortherapy.
Developing strategies that can reliably transformsuch complex concepts into well-defined algorithmicprocedures is an active area of research with severalmajor projects focusing on diagnostic pathology. Theseinclude the Pathex framework and the Pathex/Redsystem [17], developed at Ohio State University toassist pathologists in the assessment of laboratory data;ECLIPS [18] which was developed at the University ofIllinois Urbana; and the PathFinder project from Uni-versity of Southern California and Stanford which wasdirected towards the development of an expert systemthat provides a differential diagnosis based on the histo-

282 D.J. Foran et al. / Automated image interpretation and computer-assisted diagnostics
logical feature(s) observed by pathologists. PathFindersuggests any additional features that are most likely tonarrow the range of possible diagnoses, thus helpingto screen for observations which are inconsistent witha given disease [19].
2.1. Content-based image retrieval
At approximately the same time that the concept ofpersonalized medicine was becoming popular, therewas a growing, concurrent excitement at the oppositeside of research spectrum among computer scientistsand engineers who were investigating the feasibilityof developing data mining approaches which couldreliably locate and retrieve images and graphicalinformation based upon their underlying visualcontent rather than based upon the alphanumericlabels that were traditionally used to name them.As the field evolved, the idea of querying such data,based on image-based characteristics became knownas Content-Based Image Retrieval (CBIR). Whilethe mechanisms for accessing alphanumeric datahave been studied extensively, content-based accessof medical images, especially imaged pathologyspecimens, still remains largely unexplored.
The technologies that capture, describe, and indexthe visual essence of multimedia information relyon the methods and principles of image analysis,pattern recognition, and database theory. The individ-ual strategies and approaches used to perform theseanalyses differ according to the degree of generality(general purpose versus domain specific), the levelof feature abstraction (primitive features versus log-ical features), overall dissimilarity measure used inretrieval ranking, database indexing procedure, level ofuser intervention (with or without relevance feedback),and by the methods used to evaluate their perfor-mance.
There have been several general purpose content-based image retrieval (CBIR) systems that have beenreported over the years such as the IBM QBIC System[20], the Photobook System [21], the WBIIS System[22], the Blobworld System [23] and the SIMPLIcitySystem [24].
More recently, however, there has been increasedinterest and efforts applied to utilizing CBIR in medicalapplications. Wang from Pennsylvania State Univer-sity emphasizes the use of wavelet technology andIntegrated Region Matching (IRM) distances for char-
acterizing pathology images [25]. The system indexedsegments of images at different scales by partition-ing the original image into smaller overlapping blocks.A CBIR engine was then interfaced with a serverwhich allowed users to browse portions of the orig-inal matched image at different scales. During thesame period of time, the Pittsburgh Supercomput-ing Center developed a system which utilized globalcharacteristics of images to provide a measure ofGleason grade of prostate tumors [26]. The sameteam later reported a prototype system which enabledphysicians to utilize standard desktops to accesssupercomputers resulting in decisions which exhib-ited a strong correspondence between the similaritydistances generated by the computer algorithm andthe pathological significance as judged by certifiedanatomic pathologists [27]. Based on advances madein this early work there have been a range of suc-cessful CBIR applications that have been reported[28–35].
2.2. CBIR for discriminating among malignantlymphomas and leukemia
In 1998, our team first began to undertake thechallenge of developing an image-guided decisionsupport system to discriminate among lymphoprolif-erative disorders that can sometimes by confused withone another when assessed during routine microscopicevaluation because of similarities in their morpho-logic profiles and visual appearance. The motivationfor undertaking this project grew out of a pilot study-ing involving a relatively new entity, called MantleCell Lymphoma (MCL). One of the interesting aspectsof this disorder is the fact that it exhibits a pheno-type which closely resembles the morphologic profileexhibited by several other disorders including a widespectrum of benign cells. Unfortunately, Mantle CellLymphoma runs a significantly more aggressive clini-cal course [36–41] than the other entities with which itis often confused. This problem presented a significantclinical problem with a large number of technical chal-lenges. Another factor that made this project attractivewas the fact that the diagnosis of each of the enti-ties could be evaluated using immunophenotypingtechniques which made it possible to build a “gold-standard” image archive and database of cases forwhich there was independent confirmation of the dif-ferential diagnosis of each specimen.

D.J. Foran et al. / Automated image interpretation and computer-assisted diagnostics 283
Command Display Query Image Speech Mouse Voice TextImagesVideo
Clinical
TTLRecognition
ROIImageObject
Move
Control
Interface
Segmentation
Internet Query Data Retrieval Data
FeatureExtraction Display Browse
CLIENT PROCESSOR
I/OI/O
CLIENT PRESENTERM. CLIENT
SERVERINDEXING
SERVER RETRIEVAL
VIDEOLIBRARY
FeatureMatching
DatabaseLogical Info
ImagesClinical Data
M. SERVER
Commands Feedback
Fig. 4. Logical blocks and workflow through modular framework. (Figure courtesy of IEEE Transactions on Information Technology inBiomedicine. 4(4):265–273, 2000)
2.3. Overview of system framework
Figure 4 shows a prototype platform that was devel-oped to enable us to conduct iterative development andoptimization experiments. The proposed frameworkwas developed using modular design to maximize itsflexibility with each of the major modules designedto operate independently or in conjunction with oneanother.
Using this platform, once a query image entered thesystem, the client processor automatically performedsegmentation and feature extraction. After which, sta-tistical pattern recognition techniques allowed quick,reliable content-based image retrieval and compar-ison of the unclassified case with a gold-standarddatabase of cases for which independent confirmationof the diagnoses had already been conducted usingimmunophenotyping [42, 43].
2.4. Automated segmentation module
An important component of the client softwarewhich is central to it functionality is the segmenta-
tion module which has been shown to automatically,reliably and reproducibly delineate the nuclear andcytoplasmic components of cells of interest. Xu andPrince [44] advanced the strategies used to segmentimages significantly when they reported the develop-ment of an algorithm based on active contours and agradient vector flow (GVF) model which could sup-port large capture regions while reliably navigate inand out of boundary concavities. Unfortunately, theGVF snake that they developed was not appropriate forcolor images. Several early experiments showed thatsimply transforming chromatic images into gray-levelimages and then applying the GVF segmentation algo-rithm was not a viable solution for many applications.This fact became even more problematic when usedin diagnostic and investigative pathology applicationswhere even subtle differences in color often providedessential cues for performing reliable analysis.
Several investigators attempted to address this chal-lenge by calculating the color gradients through asimple summation of the response across the RGBchannels of the image. This strategy was, in gen-eral, heuristic and had no theoretical basis. In ourwork, we developed a definition of gradients based
284 D.J. Foran et al. / Automated image interpretation and computer-assisted diagnostics
upon classical Riemannian results. This approach wasbased on a solid theoretical background and constituteda logical extension of the gray-level image gradientcomputation. Our team investigated and reported thedevelopment and implementation of a new robust colorGVF snake based upon a weighted chromatic gradientoperator which achieved superb performance utilizingLUV color space and robust estimation. Please see [43,45] for a detailed description of the approach.
2.5. Shape signature module
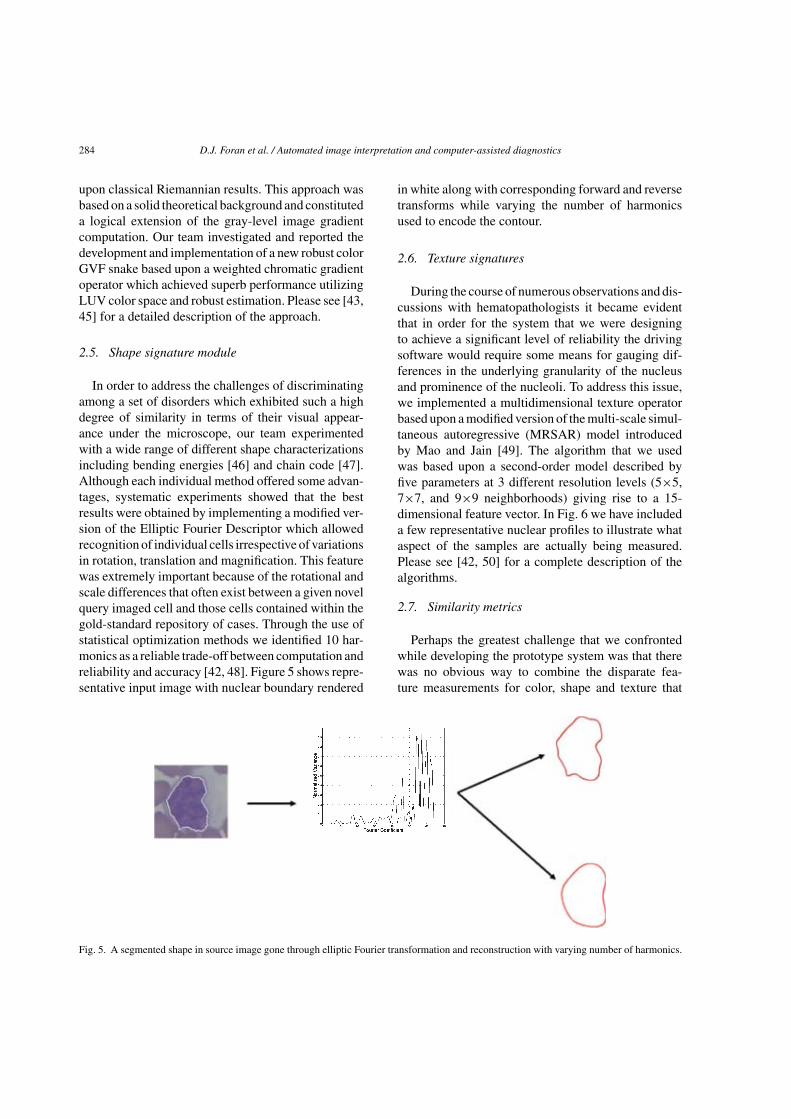
In order to address the challenges of discriminatingamong a set of disorders which exhibited such a highdegree of similarity in terms of their visual appear-ance under the microscope, our team experimentedwith a wide range of different shape characterizationsincluding bending energies [46] and chain code [47].Although each individual method offered some advan-tages, systematic experiments showed that the bestresults were obtained by implementing a modified ver-sion of the Elliptic Fourier Descriptor which allowedrecognition of individual cells irrespective of variationsin rotation, translation and magnification. This featurewas extremely important because of the rotational andscale differences that often exist between a given novelquery imaged cell and those cells contained within thegold-standard repository of cases. Through the use ofstatistical optimization methods we identified 10 har-monics as a reliable trade-off between computation andreliability and accuracy [42, 48]. Figure 5 shows repre-sentative input image with nuclear boundary rendered
in white along with corresponding forward and reversetransforms while varying the number of harmonicsused to encode the contour.
2.6. Texture signatures
During the course of numerous observations and dis-cussions with hematopathologists it became evidentthat in order for the system that we were designingto achieve a significant level of reliability the drivingsoftware would require some means for gauging dif-ferences in the underlying granularity of the nucleusand prominence of the nucleoli. To address this issue,we implemented a multidimensional texture operatorbased upon a modified version of the multi-scale simul-taneous autoregressive (MRSAR) model introducedby Mao and Jain [49]. The algorithm that we usedwas based upon a second-order model described byfive parameters at 3 different resolution levels (5×5,7×7, and 9×9 neighborhoods) giving rise to a 15-dimensional feature vector. In Fig. 6 we have includeda few representative nuclear profiles to illustrate whataspect of the samples are actually being measured.Please see [42, 50] for a complete description of thealgorithms.
2.7. Similarity metrics
Perhaps the greatest challenge that we confrontedwhile developing the prototype system was that therewas no obvious way to combine the disparate fea-ture measurements for color, shape and texture that
Fig. 5. A segmented shape in source image gone through elliptic Fourier transformation and reconstruction with varying number of harmonics.

D.J. Foran et al. / Automated image interpretation and computer-assisted diagnostics 285
Fig. 6. Ensemble of representative nuclear texture profiles.
were generated so as to allow one to reliably judgethe level of similarity of the spatial and spectral signa-tures exhibited by the query cells and “ground-truth”database of cases.
In the first generation prototype we utilized adownhill simplex approach to determine the optimalweighting factors for each of the feature mea-sures for a test ensemble of imaged specimens. Aninteresting finding from these early studies was thatit appeared that the most informative aspects of thephenotype related to the underlying granularity orchromatin patterns of individual nuclei [42].
There are quite a few similarity metrics can be usedto judge the similarity of the spatial and spectral sig-natures. These include Lp distance, such as L1 or L2distance, the χ2 distance, Kullback-Leibler (KL) diver-gence, Jensen-Shannon divergence [51] and the EarthMover’s distance [52].
The L2 distance is just simple Euclidean distancewhich is generally applied to measure the distancebetween two vectors on Euclidean space. L1 norm isthe absolute value of the difference between two vec-tors and it is more robust than L2 norm although itmight be more difficult for optimization. The χ2 dis-tance is defined as the sum of the squared differencebetween two feature vectors over the sum of the twofeature vectors. It has proved to be an effective dis-tance function for texture similarity measurement. KLdivergence is a non-symmetric similarity measurementof the difference between two signatures or probabilitydistribution. JS divergence is based on KL divergenceand its square root results in to a real metric. It isactually a smoothed and symmetric version of the KLdivergence. The Earth Mover distance is a cross-bin
distance function which does not require the two fea-ture vectors to be aligned.
2.8. Algorithm robustness
Due to complex nature of image features, high-dimensionality is an important factor to consider whenevaluating a content-based image retrieval system. Asdata dimensionality increases, the amount of test dataneeded to generate a statistically sound system can beprohibitively high. Leave-one-out and cross validationare among the most used methods in such situations.More advanced methods such as bootstrapping are alsouseful for some applications [53]. When having a verysmall sample set is available, leave-one-out methodwill exclude one sample from the data during classi-fier training and then use the “unseen” data for testing,while repeating this strategy through the dataset toassess system stability. Similarly, an n-fold cross val-idation method will divide the data randomly into ngroups, withholding one group as test set in each testwhile assessing the average performance of n tests. Itshould be noted that even when such mechanisms areproperly implemented the classifier may fail to gen-eralize to discriminate data collected under conditionswhich vary only slightly from training data.
The average five-class classification accuracy usinga mixed set of 3,691 benign, chronic lymphocyticleukemia (CLL), mantle cell lymphoma (MCL), follic-ular center cell lymphoma (FCC), and acute leukemiaacute lymphocytic leukemia (ALL) and acute myel-ogenous leukemia (AML) samples was 93.18% basedon ten-fold cross validation in this closed dataset.

286 D.J. Foran et al. / Automated image interpretation and computer-assisted diagnostics
After repeated refinements to the system it was clearthat using a maximal margin classifier, support vectormachine (SVM), was the optimal approach for classi-fying the cells. Throughout the course of those studiesthe largest source of errors was caused by ambiguitybetween MCL and CLL. Please see [43] for a detailedtreatment of the algorithmic development and compar-ative performance studies.
3. Tissue microarray analysis
As the number of new techniques and technologiesused in medical applications continues to increase ourefforts have been redirected from the specific problemsassociated with developing an image guided decisionsupport system for assessing hematologic malignan-cies and towards the development of a generalizableset of automated imaging, computational and datamanagement tools for assessing large-scale cohortsof tissue samples. For example, tissue microarray(TMA) technology was recently developed to enableinvestigators to extract small cylinders of tissue fromhistological sections and arrange them in a matrixconfiguration on a recipient paraffin block such thathundreds can be analyzed simultaneously [54–56].Over the years, TMA technology has been validatedfor use in cancer research by investigators who sys-tematically compared interpretations using TMAs withthose rendered using whole tissue sections or throughvalidation with cDNA microarray findings. Together,these studies encompassed a broad range of cancertypes including breast cancer [57–63]; prostate can-cer [64–67]; gastric cancer [68]; colorectal cancer[69–71]; lymphomas [72–76], multiple myeloma [77];soft tissue sarcoma [78]; renal cell carcinoma [79];bladder tumor [80]; glioma [81, 82]; melanoma [83];and lung tumor [84, 85]. Some of the protocols usedin array preparation have since been refined to accom-modate specific types of specimens, e.g., cell lines andto improve the reliability of the method [86–92].
Quantitatively assessing biomarker expression andstaining characteristics of tissue microarrays typicallyinvolves some degree of manual or semi-quantitativeevaluation of the specimens while they are subjec-tively scored [67, 92]. Unfortunately, such approachesare prone to inter- and intra-observer error. Toaddress this issue, several investigators have begun todevelop improved methods for performing the quanti-tative evaluation of TMA’s [93–95]. For example, the
AQUA (Automated Quantitative Analysis) system wasdesigned to utilize molecular based methods to assessprotein expression while reducing the variability ofpathologist-based evaluations of samples [96]. Unfor-tunately, in spite of the significant progress achievedin this area thus far most of the systems that have beendeveloped are limited by the fact that tissue they areclosed and proprietary; do not exploit the potential ofadvanced computer vision techniques; and/or do notconform with emerging data standards.
Capitalizing on the experience that our team gainedwhile developing the image guided decision support(IGDS) system (described in Section 2), we begandesigning, developing and evaluating a deployablesystem for performing automated analysis of tissuemicroarrays (TMA) in collaborative, multi-user envi-ronments. Through competitive extramural fundingfrom National Institutes of Health we have modi-fied and optimized many of the governing algorithmsthat had been developed to perform image analysisof imaged hematopathology specimens so that theycould reliably distinguish among the cellular compo-nents and tissue types within imaged tissue microarrays[97, 98].
3.1. Artifact compensation and colordecomposition
Figure 7 shows a representative tissue microarrayexhibiting bowing of rows and columns and missing(detached) tissue discs. Unfortunately, such artifactsare not uncommon because of the tremendous amountof care and skill that is required to assemble and con-struct tissue microarrays. To address this issue softwarewas developed to correct for such aberrations throughthe use of a modified Hough transform which automat-ically locates, delineates and indexes each individualdisc while inserting blank place holders in the databasefor detached discs [99–102].
Fig. 7. TMA mechanical distortion.

D.J. Foran et al. / Automated image interpretation and computer-assisted diagnostics 287
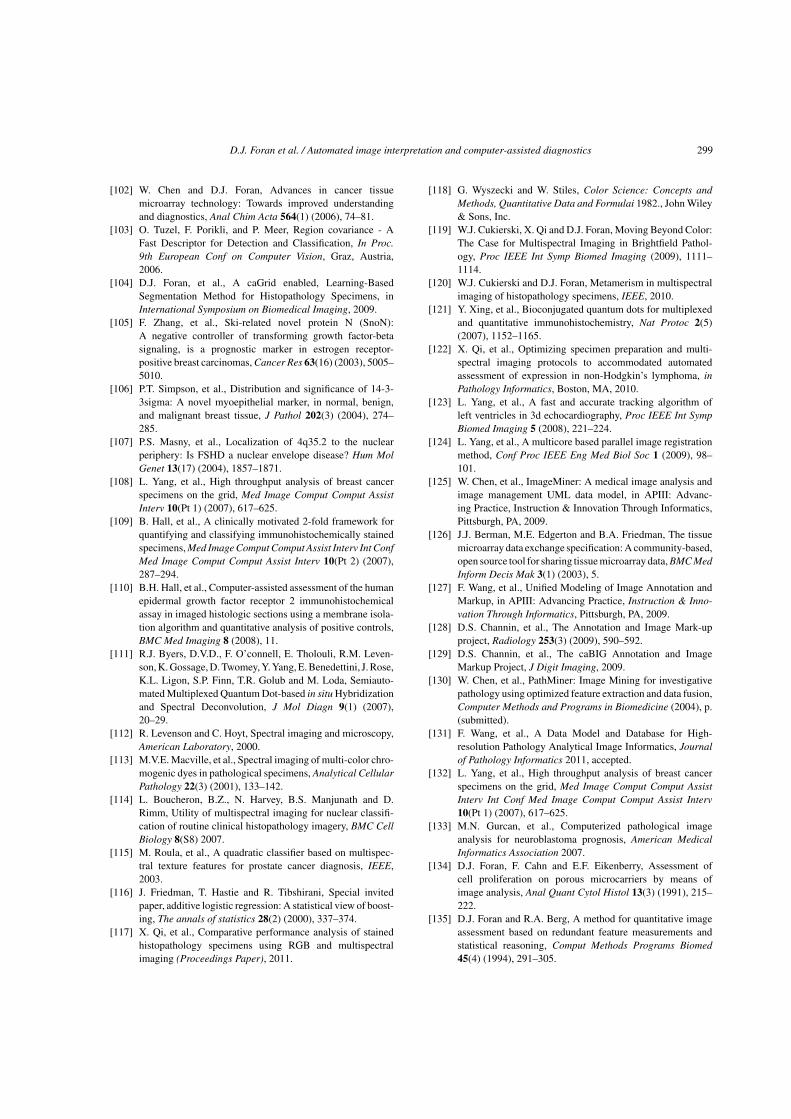
Fig. 8. Example original image of breast cancer specimen (shown left) is color decomposed into its constituent staining maps for DAB (middle)and hematoxylin (right). The DAB map revealed cytoplasmic stain of keratin 18 in the tumor region, while the nuclear counter stain was capturedby hematoxylin.
An even greater challenge that our team confrontedwhile developing the TMA analysis system was causedby the fact that tissue arrays are often prepared usingtwo or more different histological stains simultane-ously, which complicates the attempts to automatequantification of the staining characteristics of thesespecimens. To address this issue, we developed arobust color decomposition module to perform reliablepolar transformations and peak detection in multi-dimensional color spaces. The resulting color decom-position algorithm was subsequently tested usingbreast cancer tissue arrays which had been stained withanti-Smad antibodies and a range of other imaged spec-imens [100, 101]. The algorithm was later modified toautomatically drive the robotic stage of a microscopewhile randomly sampling the color at over 500,000pixel locations to provide input to the decompositionmodule. Results from application of the methods areshown for a representative specimen in Fig. 8.
3.2. Delineation of tumor boundaries at thetissue-level
One of the greatest obstacles for automated quan-titative analysis of TMA specimens stems from thefact that each individual disc (histospot) within a giventissue microarray is a complex heterogeneous tissuesample. Since many assays are designed to assess theconcentration of target molecules within a specific tis-sue type, a proper evaluation of imaged TMA’s mustnot only reflect the total amount of signal within eachtissue disc (histospot) but must also describe the spatialdistribution of the signal within the tissue of interest.
Towards that end, our team investigated and reportedthe use of texton distributions as a means for perform-ing tissue-level segmentation of imaged specimens.
The algorithm was designed to sample specimens atmultiple scales while generating texton histograms forregions of interest. Because of the high dimensionalityof the distribution space and non-separable nature ofthe data our team devised a fast, new strategy for com-puting regional histograms using an integral histogramtechnique which is only linearly dependent upon thesize of the histogram and independent of the regionsize. As an extension of this work we developed a newregion covariance descriptor which provided superiorperformance for texture classification while providinga natural way of fusing features [103]. The results ofusing texton-based segmentation to delineate epithe-lial/tumor regions within imaged breast cancer tissuediscs are shown in Fig. 9.
When the segmentation results were compared withthose which had been hand-drawn by a board-certifiedanatomic pathologist for 300 cancer tissue discs theaverage false positive rate was 4.13% and the averagefalse negative rate was 2.15% [104].
3.3. Characterizing expression signatures at themultiple levels of granularity
It is now largely accepted that staining and expres-sion signatures can provide valuable prognostic andclinical insight regarding therapy planning and forpredicting response to treatment for certain patientpopulations [105–107]. As an extension of some of theearly work in the field, our team has been investigatingthe use of texton signatures as a means for classifyingcancer and disease progression in imaged cancer tissuearrays.
Utilizing an ensemble of 3,744 breast cancer sam-ples we performed a series of experiments to determinethe preferred filter banks and optimal number of modes

288 D.J. Foran et al. / Automated image interpretation and computer-assisted diagnostics
Fig. 9. Segmentation results for representative breast cancer tissue discs showing segmentation probabilistic maps. Darker region representshigher probability of epithelial tissue. The algorithm uses texton-based texture descriptor based on region covariance.
that were necessary for differentiating among theexpression patterns of 3 different types of breast can-cer. Systematic studies showed that the discriminatorypower of the texton signatures was highly dependentupon the choice of filter banks utilized to generate thehistograms and the statistical approach used to renderclassifications. Gentle Boosting using an eight-nodeCART decision tree as the weak learner provided anoverall accuracy of 86.02% using only 30% of the spec-imens as the training set [108]. One interesting, butunexpected outcome from these studies was that bystoring the raw filter responses of the staining maps theresulting reference library is not spatially constrainedand can be used to conduct analysis at multiple levelsof granularity, i.e., at the whole disc, tumor, individualtissue, cell or sub-cellular level [97].
Figure 10 shows the results from studies in whichthe analysis concentrated on three different sub-regionswithin the imaged breast cancer specimens (tumorregion alone; whole tissue sample; and non-tumorregion alone). To obtain these results the tumor andnon-tumorous regions were automatically delineatedusing the segmentation algorithms described in Section3.2. Comparative performance analysis was carried outusing three different algorithms: K nearest neighbors(K = 5), soft margin support vector machines (SVM)and boosting. It was clear that the maximal marginclassifiers, such as boosting and SVM, performed sig-nificantly better than simple classifiers such as KNN.In addition these experiments showed that using the
Fig. 10. Classification accuracy using expression signatures corre-sponding to different regions of interest.
tumor region mask provided appreciable improve-ments in classification accuracy of the specimens.
In a set of parallel experiments our team investi-gated the use of the color decomposition and textonanalysis for assessing human epidermal growth factorreceptor 2 immunohistochemical assays [109, 110]. Inthose studies it was shown that the algorithms wereable to reliably characterize the underlying expres-sion patterns of immunostained specimens. Figure 11shows some representative examples in which thecomputer-based analysis was used to identify speci-mens exhibiting similar staining characteristics.
4. Multi-spectral imaging
Although the majority of clinical and research sci-entists still utilize traditional microscopes and imaging

D.J. Foran et al. / Automated image interpretation and computer-assisted diagnostics 289
Fig. 11. Ensemble of imaged specimens showing those specimens which have been classified as exhibiting the most similar staining signatures.(Figure courtesy of Med Image Comput Comput Assist Interv. 10(Pt 2):287–94, 2007)
devices to conduct their experiments, new technolo-gies such as virtual microscopes and multispectralimaging cameras continue to gain wider acceptance.Towards that end our team has begun to explore theutility of multispectral imaging (MSI) technologyusing “off-the-shelf” devices which can be configuredfor bright-field or fluorescence microscopy in the visi-ble wavelength range of 420–720 nm and up to 950 nmfor fluorescence-only systems. Figure 12 shows a com-posite RGB image of single histospot from a breasttissue microarray and the corresponding multispectralimages corresponding to the most salient wavelengths.
4.1. MSI in bright-field analysis
Multi-spectral imaging devices are capable of cap-turing data across a range of frequencies within theelectromagnetic spectrum. Although several uses havebeen identified and reported in pathology [111–113],it is generally difficult to determine, a priori, which
applications would benefit most significantly from thisrelatively new technology. In a recent study, Boucheronet al. found minimal (<1%) performance improve-ment using multispectral imaging over a standard RGBimaging for pixel-level nuclear classification of routineH&E images [114]. In a separate study, Roula et al.reported improved classification capacity using MSIfor H&E slides of radical prostatectomies [115]. Thelack of clear consensus over the utility of multi-spectralimaging in bright-field microscopy prompted our teamto take a closer look at the underlying principles.
As a first step we conducted comparative per-formance studies to determine, empirically, whetheror not there exists a significant benefit to utiliz-ing multi-spectral imaging technology to characterizehematoxylin stained breast tissue acquired usingbright-field microscopy. During those experimentsbreast TMA’s were imaged using a Nuance VIS-FLEX MSI camera at 20X (Cri Inc., Woburn, MA01801 USA). Each resulting image “cube” has a spa-tial resolution of 1392×1040, sampled at 31 spectral

290 D.J. Foran et al. / Automated image interpretation and computer-assisted diagnostics
Fig. 12. Multispectral imaging technology captures microscopicimages at a series of small wave length intervals. The resulted λ-data cube can be composited into RGB image according to the CIEstandard observer color-matching functions.
bands across the wavelength interval 420–720 nm. Theprototype software that was used to conduct the exper-iments has three modules. The first extracts a regionof interest, using adaptive thresholding to removebackground noise and morphological processing tosmooth the region. The second performs texture fea-ture extraction using a local binary pattern to extractrotation-invariant, uniform patterns for each specimenat each of the 31 spectral channels. The third moduleperforms feature selection and classification. For eachspectral band, exhaustive feature selection was used tosearch for the combination of channels that yielded thebest classification accuracy. AdaBoost [116] using alinear perceptron least-square classifier as weak learnerwas applied as a strong classifier to select the set ofrepresentative color channels. The selected color chan-nels (spectral bands) carry the greatest discriminatorypower and are used to produce a majority vote in thefinal classification.
During those studies 92 breast TMA discs wereused to evaluate performance. A sensitivity of 0.91and specificity of 0.89 were achieved when multi-spectral data was used whereas a sensitivity of 0.83
and specificity of 0.85 was achieved using RGB data.See Qi X, et al. for a full description of the tech-nique [117]. Encouraged by these results our team iscurrently testing and optimizing the underlying MSIanalysis algorithms for a wider range of specimens andstains.
4.2. Metamers
As an extension of these experiments our team isdeveloping a metamer-based metric which can be usedto determine, a priori, which applications would benefitmost from the use of muli-spectral imaging technology.Metamers are considered as different spectral powerdistributions which induce the same CIE XYZ tri-stimulus value under a given illuminant. There are aninfinite number of spectral distributions which give riseto each color [118]. For two pixels from a cube to beconsidered metamers, the spectrum of each pixel, sub-tracted in a pair-wise fashion and multiplied by theappropriate color-matching coefficient [113], must fallwithin a small range around zero. In a recent set ofexperiments our team utilized the fundamentals of col-orimetry in an attempt to narrow the uncertainty ofknowing when a multi-spectral image captured poten-tially discriminatory information which was absent inthe standard RGB image counterpart and we applieda standard condition for detecting metamerism. In thiswork, we used a linear algebra framework to investi-gate the relationship between the spectral image andits standard-image counterpart. Figure 13 (data cour-tesy of [113]) shows the plots for some routine stains.Our preliminary feasibility studies indicate that thosestains which absorb heavily in regions where the color-matching coefficients are small are most likely tobenefit from MSI technology, however, this line ofthought warrants closer examination [119, 120]. Inthe next phase of our experiments we will investigatethe use of metamers for objectively determining thoseapplications for which MSI would be most appropriateand test and optimize those metrics for the full rangeof specimens and stains under study.
4.3. Quantum dot antigen-antibody conjugates
In a parallel set of experiments, our team hasbegun to investigate the use of quantum dots (QD’s)technologies to accentuate visible differences amongtagged biomarkers. Quantum dots (QD’s) are smalllight-emitting particles that have excellent proper-

D.J. Foran et al. / Automated image interpretation and computer-assisted diagnostics 291
Fig. 13. Spectra of several standard stains.
ties for fluorescent labeling of biologic moleculesand exhibit superior signal brightness, resistance tophoto-bleaching, and narrow, well defined emis-sion spectra. Antibody-conjugated quantum dots havealready been used for quantitative molecular profilingof protein expression in formalin-fixed, paraffin-embedded (FFPE) sections [121]. A similar approachusing QD-labeled oligonucleotide probes for multi-plexed fluorescent in situ hybridization(FISH) has beenreported and shown to be a reproducible measure-ment of RNA levels in clinical samples [111]. Oneadvantage this approach offers over other techniques,such as quantitative RT-PCR, is that it preserves spatialinformation allowing one to determine which cell pop-ulations are expressing the molecule of interest. A highsignal for an mRNA using RT-PCR of a FFPE samplecannot distinguish whether it is being expressed by thetumor cells or the stromal cells in the specimen.
Our team has been working on the development ofa reliable clustering algorithm which can be used topreprocess multispectral datasets of the imaged speci-men immediately after acquisition for the purposes ofquickly and automatically detecting the most informa-tive wavelengths. To investigate the feasibility of usingthese tools we have devised a set of well-defined exper-iments which focused on a clinically salient applicationinvolving the evaluation of non-Hodgkin’s lymphomahistology specimens. The aim of these experiments wasto determine the staining and expression patterns ofFDC markers CD21, CD23, CD32, CD35 using FISHor QD or combination of those two imaging techniques.
First FISH slides were blocked in PBS and washed.Primary antibody was added and washed. Secondaryantibody with QD was added; incubated for 1 hour,then washed. DAPI was added and slides cover-slipped.
Multispectral images were acquired, after auto-matic removal of auto-fluorescence, at resolution of1392 × 1042 × 31, where the 31 spectral bands coverwavelengths 420–720 nm. Composite images of eachpure FISH and QD signals were created and the expres-sion pattern of each biomarker was digitized andstored.
In a second set of experiments we evaluated the MSIsetup using frozen sections of tonsil which were stainedfor chromosomes 11 and 14. The multiple myelomacell line MM1.S was stained with FISH probes spe-cific for chromosomes 11 and 14. The FISH labeledcells were stained for the surface expression of CD20.This setup allowed simultaneous detection of chromo-somes 11 and 14 in the nucleus and surface expressionof CD20. Slides were evaluated for the surface expres-sion of either CD21 or CAN. Similar to the resultsof MM1.S experiments, both the chromosome FISHprobes and the surface expression of CD21 and CNAcould be detected demonstrating the utility of theseprotocols with MSI [122].
5. Automated co-registration of consecutiveimaged histologic sections
During the course of our interactions with end-user oncologists and pathologists, it has becomeapparent that the capacity to perform quick, reliable co-registration of digitized, histologic cross-sections hasa wide range of useful applications including generat-ing 3D image stacks for visualizing micro-structures;performing 3D modeling of tumor environment; cor-relating image features and localization of biomarkersacross adjacent sections; and matching sections whichhave been prepared using complementary immunos-tains.
Driven by these incentives our team recentlyreported a new method for performing fast, robustimage co-registration, which combines landmark andregion-based strategies [123, 124]. Most existing meth-ods are highly sensitive to variations in image quality,degree of deformation, and require fine-tuning ofparameter settings. The algorithm that our team devel-oped is computationally efficient and operates in acompletely unsupervised fashion. Due to the rela-tively small number of landmarks needed to drive thealgorithm, it runs faster than several popular nonlin-ear registration algorithms reported in the literature,including the finite element method (FEM), BSplinefitting and Daemon’s algorithm.
292 D.J. Foran et al. / Automated image interpretation and computer-assisted diagnostics
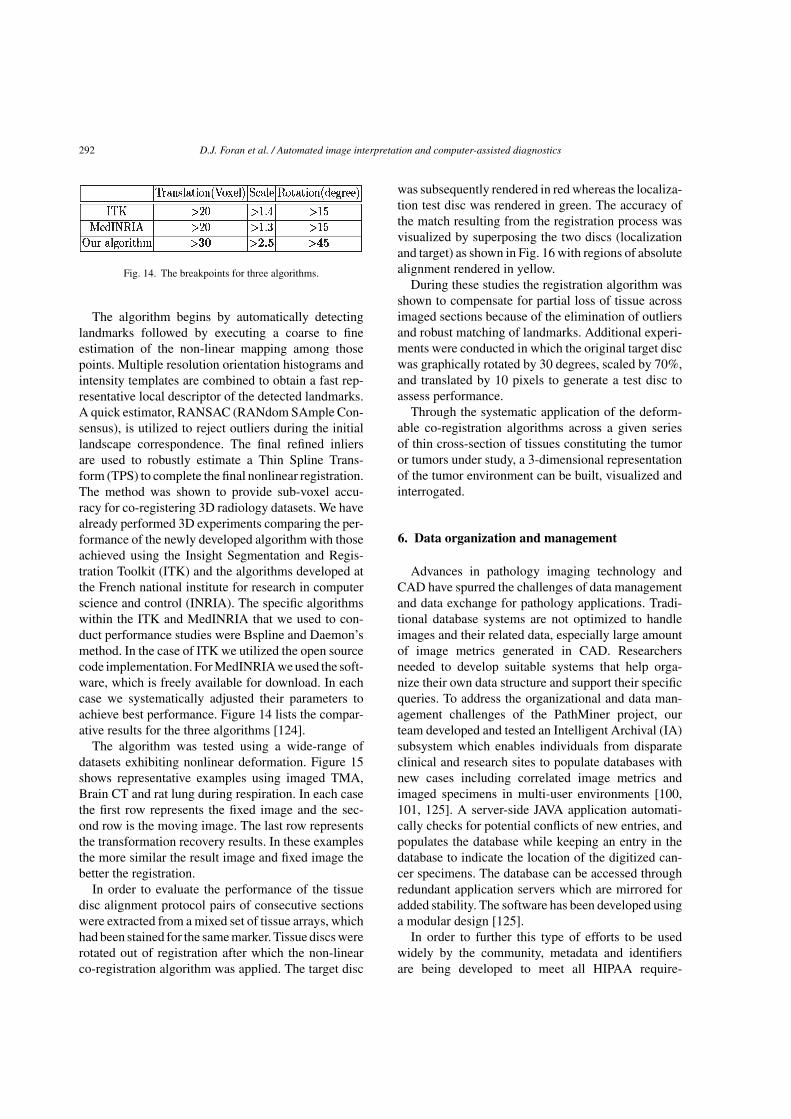
Fig. 14. The breakpoints for three algorithms.
The algorithm begins by automatically detectinglandmarks followed by executing a coarse to fineestimation of the non-linear mapping among thosepoints. Multiple resolution orientation histograms andintensity templates are combined to obtain a fast rep-resentative local descriptor of the detected landmarks.A quick estimator, RANSAC (RANdom SAmple Con-sensus), is utilized to reject outliers during the initiallandscape correspondence. The final refined inliersare used to robustly estimate a Thin Spline Trans-form (TPS) to complete the final nonlinear registration.The method was shown to provide sub-voxel accu-racy for co-registering 3D radiology datasets. We havealready performed 3D experiments comparing the per-formance of the newly developed algorithm with thoseachieved using the Insight Segmentation and Regis-tration Toolkit (ITK) and the algorithms developed atthe French national institute for research in computerscience and control (INRIA). The specific algorithmswithin the ITK and MedINRIA that we used to con-duct performance studies were Bspline and Daemon’smethod. In the case of ITK we utilized the open sourcecode implementation. For MedINRIA we used the soft-ware, which is freely available for download. In eachcase we systematically adjusted their parameters toachieve best performance. Figure 14 lists the compar-ative results for the three algorithms [124].
The algorithm was tested using a wide-range ofdatasets exhibiting nonlinear deformation. Figure 15shows representative examples using imaged TMA,Brain CT and rat lung during respiration. In each casethe first row represents the fixed image and the sec-ond row is the moving image. The last row representsthe transformation recovery results. In these examplesthe more similar the result image and fixed image thebetter the registration.
In order to evaluate the performance of the tissuedisc alignment protocol pairs of consecutive sectionswere extracted from a mixed set of tissue arrays, whichhad been stained for the same marker. Tissue discs wererotated out of registration after which the non-linearco-registration algorithm was applied. The target disc
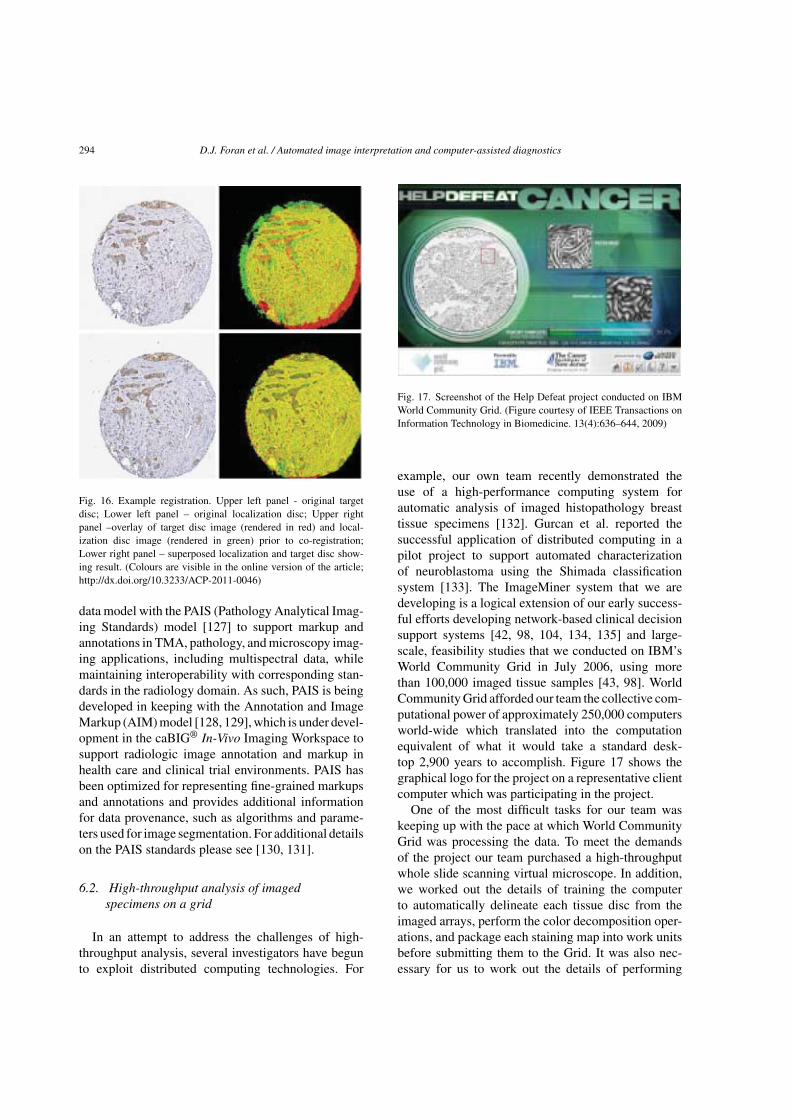
was subsequently rendered in red whereas the localiza-tion test disc was rendered in green. The accuracy ofthe match resulting from the registration process wasvisualized by superposing the two discs (localizationand target) as shown in Fig. 16 with regions of absolutealignment rendered in yellow.
During these studies the registration algorithm wasshown to compensate for partial loss of tissue acrossimaged sections because of the elimination of outliersand robust matching of landmarks. Additional experi-ments were conducted in which the original target discwas graphically rotated by 30 degrees, scaled by 70%,and translated by 10 pixels to generate a test disc toassess performance.
Through the systematic application of the deform-able co-registration algorithms across a given seriesof thin cross-section of tissues constituting the tumoror tumors under study, a 3-dimensional representationof the tumor environment can be built, visualized andinterrogated.
6. Data organization and management
Advances in pathology imaging technology andCAD have spurred the challenges of data managementand data exchange for pathology applications. Tradi-tional database systems are not optimized to handleimages and their related data, especially large amountof image metrics generated in CAD. Researchersneeded to develop suitable systems that help orga-nize their own data structure and support their specificqueries. To address the organizational and data man-agement challenges of the PathMiner project, ourteam developed and tested an Intelligent Archival (IA)subsystem which enables individuals from disparateclinical and research sites to populate databases withnew cases including correlated image metrics andimaged specimens in multi-user environments [100,101, 125]. A server-side JAVA application automati-cally checks for potential conflicts of new entries, andpopulates the database while keeping an entry in thedatabase to indicate the location of the digitized can-cer specimens. The database can be accessed throughredundant application servers which are mirrored foradded stability. The software has been developed usinga modular design [125].
In order to further this type of efforts to be usedwidely by the community, metadata and identifiersare being developed to meet all HIPAA require-

D.J. Foran et al. / Automated image interpretation and computer-assisted diagnostics 293
Fig. 15. Image transformation recovery examples. (a) tissue microarray; (b) brain CT; (c) rat lung.
ments for sharing data anonymized for research [126].The constituent entities of the Tissue MicroarrayRepository subsystem are being designed in keepingwith emerging guidelines from the caBIG initiativeand the Association for Pathology Informatics. Theoverarching idea is to keep the definitions general-izable and to provide the underlying structure whichcan support a broader range of imaging applica-tions.
6.1. The ImageMiner data model and pathologyanalytical imaging standards (PAIS) model
The data model underlying the ImageMinerdatabase [125] was developed based upon direc-
tion providing by a panel of consulting oncologistsand pathologists [100]. The data model is designedto house both quantitative and qualitative informa-tion derived from the physical and digital specimens,including clinical data and research data. Version1.0 of the data model consists of 58 classes and262 data elements (attributes). It has undergonereview by the NCI Enterprise Vocabulary Servicesprogram to ensure compliance with caBIG® stan-dards and has been loaded into the Cancer DataStandards Repository (caDSR). The model can beviewed and retrieved via caBIG CDE Browser(https://cdebrowser.nci.nih.gov/CDEBrowser/).
Our team is currently working to extend and harmo-nize the analysis results component of the ImageMiner
294 D.J. Foran et al. / Automated image interpretation and computer-assisted diagnostics
Fig. 16. Example registration. Upper left panel - original targetdisc; Lower left panel – original localization disc; Upper rightpanel –overlay of target disc image (rendered in red) and local-ization disc image (rendered in green) prior to co-registration;Lower right panel – superposed localization and target disc show-ing result. (Colours are visible in the online version of the article;http://dx.doi.org/10.3233/ACP-2011-0046)
data model with the PAIS (Pathology Analytical Imag-ing Standards) model [127] to support markup andannotations in TMA, pathology, and microscopy imag-ing applications, including multispectral data, whilemaintaining interoperability with corresponding stan-dards in the radiology domain. As such, PAIS is beingdeveloped in keeping with the Annotation and ImageMarkup (AIM) model [128, 129], which is under devel-opment in the caBIG® In-Vivo Imaging Workspace tosupport radiologic image annotation and markup inhealth care and clinical trial environments. PAIS hasbeen optimized for representing fine-grained markupsand annotations and provides additional informationfor data provenance, such as algorithms and parame-ters used for image segmentation. For additional detailson the PAIS standards please see [130, 131].
6.2. High-throughput analysis of imagedspecimens on a grid
In an attempt to address the challenges of high-throughput analysis, several investigators have begunto exploit distributed computing technologies. For
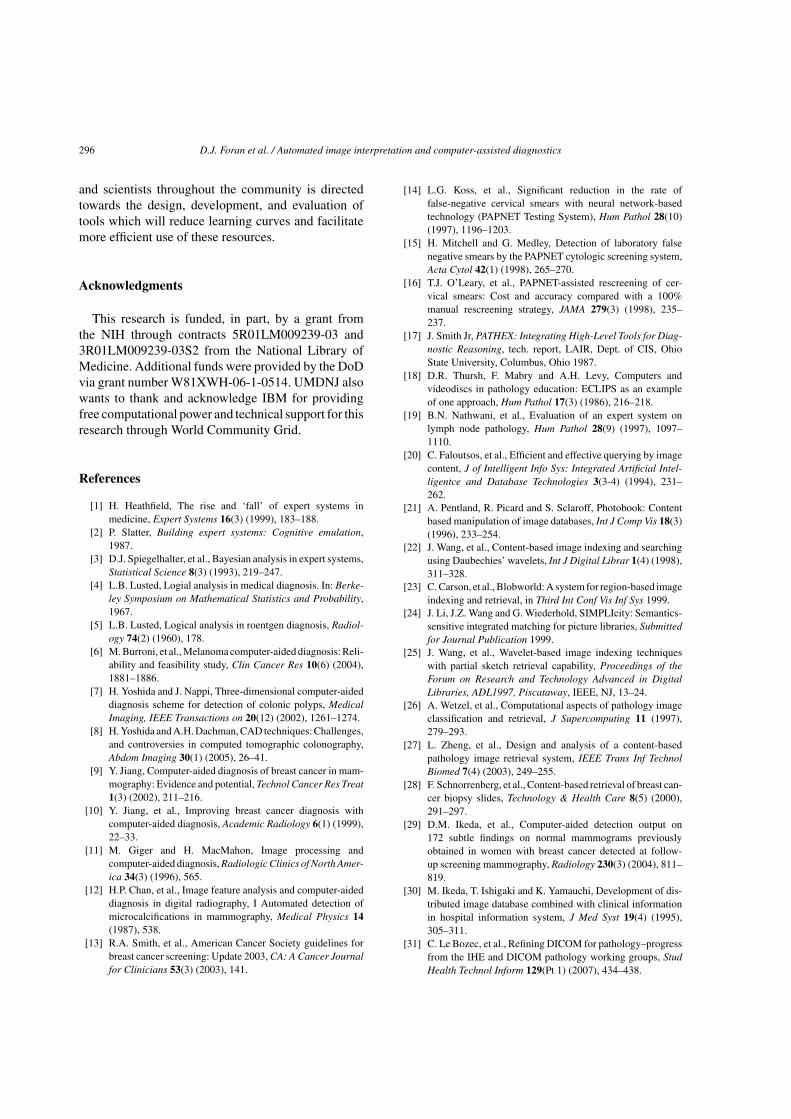
Fig. 17. Screenshot of the Help Defeat project conducted on IBMWorld Community Grid. (Figure courtesy of IEEE Transactions onInformation Technology in Biomedicine. 13(4):636–644, 2009)
example, our own team recently demonstrated theuse of a high-performance computing system forautomatic analysis of imaged histopathology breasttissue specimens [132]. Gurcan et al. reported thesuccessful application of distributed computing in apilot project to support automated characterizationof neuroblastoma using the Shimada classificationsystem [133]. The ImageMiner system that we aredeveloping is a logical extension of our early success-ful efforts developing network-based clinical decisionsupport systems [42, 98, 104, 134, 135] and large-scale, feasibility studies that we conducted on IBM’sWorld Community Grid in July 2006, using morethan 100,000 imaged tissue samples [43, 98]. WorldCommunity Grid afforded our team the collective com-putational power of approximately 250,000 computersworld-wide which translated into the computationequivalent of what it would take a standard desk-top 2,900 years to accomplish. Figure 17 shows thegraphical logo for the project on a representative clientcomputer which was participating in the project.
One of the most difficult tasks for our team waskeeping up with the pace at which World CommunityGrid was processing the data. To meet the demandsof the project our team purchased a high-throughputwhole slide scanning virtual microscope. In addition,we worked out the details of training the computerto automatically delineate each tissue disc from theimaged arrays, perform the color decomposition oper-ations, and package each staining map into work unitsbefore submitting them to the Grid. It was also nec-essary for us to work out the details of performing

D.J. Foran et al. / Automated image interpretation and computer-assisted diagnostics 295
Array registration
Color analysis
Work unit packaging
Job distributionFiltering with filter
banks
Participant ComputersWorld Community GridUMDNJ
Classification usingbinary/multi-class
gentle boostingResult collection
Fig. 18. Help Defeat Cancer project work flow.
quality control on the results that were returned toour laboratory and correlating those results with theircorresponding clinical profiles. Figure 18 shows theworkflow of data throughout the “Help Defeat Cancer”project.
WCG enabled our team to conduct large-scale feasi-bility studies demonstrating the use of texton histogramsignatures for characterizing and classifying stain-ing and expression signatures in image cancer tissuemicroarrays which resulted in the generation of a ref-erence library of expression signatures for more than100,000 tissue samples.
7. Man-machine studies and practical uses
Over the course of the past 12 months, the TMAcomputational and imaging tools have been migrated tothe Histopathology & Imaging Shared Core Resourcesat The Cancer Institute of New Jersey. They havebeen successfully used to analyze microarrays con-sisting of cancers of the breast, head & neck, andprostate. As part of a recent study the automated soft-ware was used to quantify Beclin1 expression whichwas shown to be predictive of autophagy [136]. Ourteam has also conducted a series of man-machineperformance studies. In the first experiments we uti-lized the TMA analysis tools to evaluate IHC stainingintensity on imaged breast cancer TMA specimenscomprised of 1407 tissue cores. The results showedthat the computer software algorithms achieved sim-ilar interpretations to those provided by a panel
of 3 board-certified pathologists and was consistentwith inter-pathologist concordance. These results werepresented at the 2010 Annual Conference of the UnitedStates and Canadian Academy of Pathology [137]. Inthe next phase of the project our team plans to con-duct a much more comprehensive set of performanceexperiments. To facilitate those studies we have alreadydeployed a suite of grid-enabled TMA analysis toolsto Emory University and Ohio State University and arein the process of installing and testing the software atstrategic sites at University of Pennsylvania, and Uni-versity of Pittsburgh Medical Center each of whomhave agreed to participate in the performance studiesand serve as adopter sites for the project going forward.
Future directions
Advances in digital imaging have made it possiblefor pathologist to generate high-resolution image dataas part of their routine investigative and diagnosticactivities. While the resulting data sets offer unparal-leled opportunities for visualization there still remainsa lack of satisfactory imaging and computational toolswhich allow for automated high-throughput analysisof specimens. Future advances in pathology will relyon the availability of reliable methods and algorithmsthat can keep pace with emerging technologies such asvirtual microscopy and multi-spectral cameras whichcurrently overwhelm a traditional outfitted clinicalor research department. Our work and the collectedefforts of a growing number of engineers, physicians
296 D.J. Foran et al. / Automated image interpretation and computer-assisted diagnostics
and scientists throughout the community is directedtowards the design, development, and evaluation oftools which will reduce learning curves and facilitatemore efficient use of these resources.
Acknowledgments
This research is funded, in part, by a grant fromthe NIH through contracts 5R01LM009239-03 and3R01LM009239-03S2 from the National Library ofMedicine. Additional funds were provided by the DoDvia grant number W81XWH-06-1-0514. UMDNJ alsowants to thank and acknowledge IBM for providingfree computational power and technical support for thisresearch through World Community Grid.
References
[1] H. Heathfield, The rise and ‘fall’ of expert systems inmedicine, Expert Systems 16(3) (1999), 183–188.
[2] P. Slatter, Building expert systems: Cognitive emulation,1987.
[3] D.J. Spiegelhalter, et al., Bayesian analysis in expert systems,Statistical Science 8(3) (1993), 219–247.
[4] L.B. Lusted, Logial analysis in medical diagnosis. In: Berke-ley Symposium on Mathematical Statistics and Probability,1967.
[5] L.B. Lusted, Logical analysis in roentgen diagnosis, Radiol-ogy 74(2) (1960), 178.
[6] M. Burroni, et al., Melanoma computer-aided diagnosis: Reli-ability and feasibility study, Clin Cancer Res 10(6) (2004),1881–1886.
[7] H. Yoshida and J. Nappi, Three-dimensional computer-aideddiagnosis scheme for detection of colonic polyps, MedicalImaging, IEEE Transactions on 20(12) (2002), 1261–1274.
[8] H. Yoshida and A.H. Dachman, CAD techniques: Challenges,and controversies in computed tomographic colonography,Abdom Imaging 30(1) (2005), 26–41.
[9] Y. Jiang, Computer-aided diagnosis of breast cancer in mam-mography: Evidence and potential, Technol Cancer Res Treat1(3) (2002), 211–216.
[10] Y. Jiang, et al., Improving breast cancer diagnosis withcomputer-aided diagnosis, Academic Radiology 6(1) (1999),22–33.
[11] M. Giger and H. MacMahon, Image processing andcomputer-aided diagnosis, Radiologic Clinics of North Amer-ica 34(3) (1996), 565.
[12] H.P. Chan, et al., Image feature analysis and computer-aideddiagnosis in digital radiography, I Automated detection ofmicrocalcifications in mammography, Medical Physics 14(1987), 538.
[13] R.A. Smith, et al., American Cancer Society guidelines forbreast cancer screening: Update 2003, CA: A Cancer Journalfor Clinicians 53(3) (2003), 141.
[14] L.G. Koss, et al., Significant reduction in the rate offalse-negative cervical smears with neural network-basedtechnology (PAPNET Testing System), Hum Pathol 28(10)(1997), 1196–1203.
[15] H. Mitchell and G. Medley, Detection of laboratory falsenegative smears by the PAPNET cytologic screening system,Acta Cytol 42(1) (1998), 265–270.
[16] T.J. O’Leary, et al., PAPNET-assisted rescreening of cer-vical smears: Cost and accuracy compared with a 100%manual rescreening strategy, JAMA 279(3) (1998), 235–237.
[17] J. Smith Jr, PATHEX: Integrating High-Level Tools for Diag-nostic Reasoning, tech. report, LAIR, Dept. of CIS, OhioState University, Columbus, Ohio 1987.
[18] D.R. Thursh, F. Mabry and A.H. Levy, Computers andvideodiscs in pathology education: ECLIPS as an exampleof one approach, Hum Pathol 17(3) (1986), 216–218.
[19] B.N. Nathwani, et al., Evaluation of an expert system onlymph node pathology, Hum Pathol 28(9) (1997), 1097–1110.
[20] C. Faloutsos, et al., Efficient and effective querying by imagecontent, J of Intelligent Info Sys: Integrated Artificial Intel-ligentce and Database Technologies 3(3-4) (1994), 231–262.
[21] A. Pentland, R. Picard and S. Sclaroff, Photobook: Contentbased manipulation of image databases, Int J Comp Vis 18(3)(1996), 233–254.
[22] J. Wang, et al., Content-based image indexing and searchingusing Daubechies’ wavelets, Int J Digital Librar 1(4) (1998),311–328.
[23] C. Carson, et al., Blobworld: A system for region-based imageindexing and retrieval, in Third Int Conf Vis Inf Sys 1999.
[24] J. Li, J.Z. Wang and G. Wiederhold, SIMPLIcity: Semantics-sensitive integrated matching for picture libraries, Submittedfor Journal Publication 1999.
[25] J. Wang, et al., Wavelet-based image indexing techniqueswith partial sketch retrieval capability, Proceedings of theForum on Research and Technology Advanced in DigitalLibraries, ADL1997, Piscataway, IEEE, NJ, 13–24.
[26] A. Wetzel, et al., Computational aspects of pathology imageclassification and retrieval, J Supercomputing 11 (1997),279–293.
[27] L. Zheng, et al., Design and analysis of a content-basedpathology image retrieval system, IEEE Trans Inf TechnolBiomed 7(4) (2003), 249–255.
[28] F. Schnorrenberg, et al., Content-based retrieval of breast can-cer biopsy slides, Technology & Health Care 8(5) (2000),291–297.
[29] D.M. Ikeda, et al., Computer-aided detection output on172 subtle findings on normal mammograms previouslyobtained in women with breast cancer detected at follow-up screening mammography, Radiology 230(3) (2004), 811–819.
[30] M. Ikeda, T. Ishigaki and K. Yamauchi, Development of dis-tributed image database combined with clinical informationin hospital information system, J Med Syst 19(4) (1995),305–311.
[31] C. Le Bozec, et al., Refining DICOM for pathology–progressfrom the IHE and DICOM pathology working groups, StudHealth Technol Inform 129(Pt 1) (2007), 434–438.

D.J. Foran et al. / Automated image interpretation and computer-assisted diagnostics 297
[32] M. Jaulent, et al., A customizable similarity measure betwenhistological cases, Proceedings/AMIA Annual Symposium(2002), 350–354.
[33] E.D. Lehmann, The freeware AIDA interactive educationaldiabetes simulator–http://www.2aida.org–/(1), A downloadsurvey for AIDA v4.0. Med Sci Monit 7(3) (2001), 504–515.
[34] M.O. Guld, et al., A generic concept for the implementation ofmedical image retrieval systems, Stud Health Technol Inform116 (2005), 459–464.
[35] Y.H. Chen and S.N. Yu, Comparison of different waveletsubband features in the classification of ECG beats usingprobabilistic neural network, Conf Proc IEEE Eng Med BiolSoc 1 (2006), 1398–1401.
[36] J. Garcia-Conde and F. Cabanillas, Mantle cell lymphoma: Alymphoproliferative disorder associated with aberrant func-tion of the cell cycle, Leukemia 10(Suppl 2) (1996), s78–s83.
[37] D.J. Medina, et al., Adenovirus infection and cytotoxicity ofprimary mantle cell lymphoma cells, Exp Hematol 33(11)(2005), 1337–1347.
[38] M.N. Kilo and D.M. Dorfman, The utility of flow cytomet-ric immunophenotypic analysis in the distinction of smalllymphocytic lymphoma/chronic lymphocytic leukemia frommantle cell lymphoma, Am J Clin Pathol 105(4) (1996),451–457.
[39] R.K. Strair, et al., Adenovirus infection of primary malignantlymphoid cells, Leuk Lymphoma 43(1) (2002), 37–49.
[40] G. Vadlamudi, et al., Leukemic phase of mantle cell lym-phoma two case reports and review of the literature, ArchPathol Lab Med 120(1) (1996), 35–40.
[41] Y. Yatabe, et al., Clinicopathologic study of PRAD1/cyclinD1 overexpressing lymphoma with special reference to man-tle cell lymphoma, A distinct molecular pathologic entity, AmJ Surg Pathol 20(9) (1996), 1110–1122.
[42] D.J. Foran, et al., Computer-assisted discrimination amongmalignant lymphomas and leukemia using immunopheno-typing: Intelligent image repositories, and telemicroscopy,IEEE Trans Inf Technol Biomed 4(4) (2000), 265–273.
[43] L. Yang, et al., PathMiner: A Web-based tool for computer-assisted diagnostics in pathology, IEEE Trans Inf TechnolBiomed 13(3) (2009), 291–299.
[44] C. Xu and J.L. Prince, Snakes, Shapes, and Gradient VectorFlow, IEEE Trans on Image Processing 7 (1998), 359–369.
[45] L. Yang, P. Meer and D.J. Foran, Unsupervised segmentationbased on robust estimation and color active contour models,IEEE Trans Inf Technol Biomed 9(3) (2005), 475–486.
[46] P.B. Canham, The minimum energy of bending as a pos-sible explanation of the biconcave shape of the human redblood cell*, Journal of Theoretical Biology 26(1) (1970), 61–81.
[47] T. Kaneko and M. Okudaira, Encoding of arbitrary curvesbased on the chain code representation, Communications,IEEE Transactions on 33(7) (1985), 697–707.
[48] D. Comaniciu, P. Meer and D.J. Foran, Image-guided deci-sion support system for pathology, Machine Vision andApplications 11 (1999), 213–224.
[49] J. Mao and A.K. Jain, Texture classification and segmentationusing multiresolution simultaneous autoregressive models,Pattern recognition 25(2) (1992), 173–188.
[50] D. Comaniciu, et al., Bimodal system for interactive indexingand retrieval of pathology images, 1998.
[51] J. Lin, Divergence measures based on the Shannon entropy,Information Theory, IEEE Transactions on 37(1) (1991),145–151.
[52] Y. Rubner, C. Tomasi and L.J. Guibas, The earth mover’sdistance as a metric for image retrieval, International Journalof Computer Vision 40(2) (2000), 99–121.
[53] K. Fukunaga, Introduction to Statistical Pattern Recognition,Computer Science and Scientific Computing, W. Rheinboldtand D. Siewiorek ed., Academic Press, Inc, New York, 1990.
[54] J. Kononen, et al., Tissue microarrays for high-throughputmolecular profiling of tumor specimens, Nat Med 4(7) (1998),844–847.
[55] D.L. Rimm, et al., Tissue microarray: A new technologyfor amplification of tissue resources, Cancer J 7(1) (2001),24–31.
[56] T. Braunschweig, J.Y. Chung and S.M. Hewitt, Perspectivesin tissue microarrays, Comb Chem High Throughput Screen7(6) (2004), 575–585.
[57] C. Ginestier, et al., Distinct and complementary informa-tion provided by use of tissue and DNA microarrays in thestudy of breast tumor markers, Am J Pathol 161(4) (2002),1223–1233.
[58] J. Torhorst, et al., Tissue microarrays for rapid linking ofmolecular changes to clinical endpoints, Am J Pathol 159(6)(2001), 2249–2256.
[59] G.G. Van den Eynden, et al., Validation of a tissue microar-ray to study differential protein expression in inflammatoryand non-inflammatory breast cancer, Breast Cancer Res Treat85(1) (2004), 13–22.
[60] D. Zhang, et al., Reliability of tissue microarrays in detectingprotein expression and gene amplification in breast cancer,Mod Pathol 16(1) (2003), 79–84.
[61] J.H. Fergenbaum, et al., Loss of antigenicity in stored sec-tions of breast cancer tissue microarrays, Cancer EpidemiolBiomarkers Prev 13(4) (2004), 667–672.
[62] R.L. Camp, L.A. Charette and D.L. Rimm, Validation of tis-sue microarray technology in breast carcinoma, Lab Invest80(12) (2000), 1943–1949.
[63] D. Gancberg, et al., Reliability of the tissue microarray basedFISH for evaluation of the HER-2 oncogene in breast carci-noma, J Clin Pathol 55(4) (2002), 315–317.
[64] A.S. Merseburger, et al., Limitations of tissue microarrays inthe evaluation of focal alterations of bcl-2 and p53 in wholemount derived prostate tissues, Oncol Rep 10(1) (2003),223–228.
[65] S. Varambally, et al., The polycomb group protein EZH2 isinvolved in progression of prostate cancer, Nature 419(6907)(2002), 624–629.
[66] M.A. Rubin, et al., Tissue microarray sampling strategy forprostate cancer biomarker analysis, Am J Surg Pathol 26(3)(2002), 312–319.
[67] N.R. Mucci, et al., Neuroendocrine expression in metastaticprostate cancer: Evaluation of high throughput tissuemicroarrays to detect heterogeneous protein expression, HumPathol 31(4) (2000), 406–414.
[68] C. Gulmann, et al., Biopsy of a biopsy: Validation ofimmunoprofiling in gastric cancer biopsy tissue microarrays,Histopathology 42(1) (2003), 70–76.

298 D.J. Foran et al. / Automated image interpretation and computer-assisted diagnostics
[69] Y. Hendriks, et al., Conventional and tissue microar-ray immunohistochemical expression analysis of mismatchrepair in hereditary colorectal tumors, Am J Pathol 162(2)(2003), 469–477.
[70] F. Jourdan, et al., Tissue microarray technology: Validationin colorectal carcinoma and analysis of p53, hMLH1, andhMSH2 immunohistochemical expression, Virchows Arch443(2) (2003), 115–121.
[71] E. Fernebro, et al., Evaluation of the tissue microarray tech-nique for immunohistochemical analysis in rectal cancer,Arch Pathol Lab Med 126(6) (2002), 702–705.
[72] M.A. Shipp, et al., Diffuse large B-cell lymphoma out-come prediction by gene-expression profiling and supervisedmachine learning, Nat Med 8(1) (2002), 68–74.
[73] A. Tzankov, et al., High-throughput tissue microarray analy-sis of G1-cyclin alterations in classical Hodgkin’s lymphomaindicates overexpression of cyclin E1, J Pathol 199(2) (2003),201–207.
[74] J.F. Garcia, et al., Hodgkin and Reed-Sternberg cells harboralterations in the major tumor suppressor pathways and cell-cycle checkpoints: Analyses using tissue microarrays, Blood101(2) (2003), 681–689.
[75] C.V. Hedvat, et al., Application of tissue microarray technol-ogy to the study of non-Hodgkin’s and Hodgkin’s lymphoma,Hum Pathol 33(10) (2002), 968–974.
[76] G.Z. Rassidakis, et al., Apoptotic rate in peripheral T-celllymphomas, A study using a tissue microarray with valida-tion on full tissue sections, Am J Clin Pathol 118(3) (2002),328–334.
[77] Y. Natkunam, et al., Analysis of MUM1/IRF4 protein expres-sion using tissue microarrays and immunohistochemistry,Mod Pathol 14(7) (2001), 686–694.
[78] J. Engellau, et al., Tissue microarray technique in soft tis-sue sarcoma: Immunohistochemical Ki-67 expression inmalignant fibrous histiocytoma, Appl Immunohistochem MolMorphol 9(4) (2001), 358–363.
[79] H. Moch, et al., High-throughput tissue microarray analysisto evaluate genes uncovered by cDNA microarray screeningin renal cell carcinoma, Am J Pathol 154(4) (1999), 981–986.
[80] A. Nocito, et al., Microarrays of bladder cancer tissue arehighly representative of proliferation index and histologicalgrade, J Pathol 194(3) (2001), 349–357.
[81] C.E. Fuller, et al., High-throughput molecular profiling ofhigh-grade astrocytomas: The utility of fluorescence in situhybridization on tissue microarrays (TMA-FISH), J Neu-ropathol Exp Neurol 61(12) (2002), 1078–1084.
[82] S.L. Sallinen, et al., Identification of differentially expressedgenes in human gliomas by DNA microarray and tissue chiptechniques, Cancer Res 60(23) (2000), 6617–6622.
[83] M.D. Pacifico, et al., Validation of tissue microarray for theimmunohistochemical profiling of melanoma, Melanoma Res14(1) (2004), 39–42.
[84] D.G. Beer, et al., Gene-expression profiles predict survivalof patients with lung adenocarcinoma, Nat Med 8(8) (2002),816–824.
[85] M.A. Leversha, et al., Expression of p53, pRB, and p16 inlung tumours: A validation study on tissue microarrays, JPathol 200(5) (2003), 610–619.
[86] C.L. Andersen, et al., Improved procedure for fluorescencein situ hybridization on tissue microarrays, Cytometry 45(2)(2001), 83–86.
[87] G.G. Chung, E.P. Kielhorn and D.L. Rimm, Subjectivedifferences in outcome are seen as a function of the immuno-histochemical method used on a colorectal cancer tissuemicroarray, Clin Colorectal Cancer 1(4) (2002), 237–242.
[88] H.L. Dan, et al., A novel method for preparation of tis-sue microarray, World J Gastroenterol 10(4) (2004), 579–582.
[89] K.A. DiVito, et al., Long-term preservation of antigenic-ity on tissue microarrays, Lab Invest 84(8) (2004), 1071–1078.
[90] M.S. Fejzo and D.J. Slamon, Frozen tumor tissue microarraytechnology for analysis of tumor RNA: DNA, and proteins,Am J Pathol 159(5) (2001), 1645–1650.
[91] M. Kylaniemi, et al., A novel frozen brain tissue arraytechnique: Immunohistochemical detection of neuronal para-neoplastic autoantibodies, Neuropathol Appl Neurobiol 30(1)(2004), 39–45.
[92] B.E. Matysiak, et al., Simple: Inexpensive method forautomating tissue microarray production provides enhancedmicroarray reproducibility, Appl Immunohistochem MolMorphol 11(3) (2003), 269–273.
[93] G. Ayala, et al., The prolyl isomerase Pin1 is a novel prog-nostic marker in human prostate cancer, Cancer Res 63(19)(2003), 6244–6251.
[94] R.L. Camp, G.G. Chung and D.L. Rimm, Automatedsubcellular localization and quantification of protein expres-sion in tissue microarrays, Nat Med 8(11) (2002), 1323–1327.
[95] R.L. Camp, et al., Quantitative analysis of breast cancer tissuemicroarrays shows that both high and normal levels of HER2expression are associated with poor outcome, Cancer Res63(7) (2003), 1445–1448.
[96] M.A. Rubin, et al., Quantitative determination of expressionof the prostate cancer protein alpha-methylacyl-CoA race-mase using automated quantitative analysis (AQUA): A novelparadigm for automated and continuous biomarker measure-ments, Am J Pathol 164(3) (2004), 831–840.
[97] L. Yang, et al., Virtual microscopy and grid-enabled deci-sion support for large-scale analysis of imaged pathologyspecimens, IEEE Trans Inf Technol Biomed 13(4) (2009),636–644.
[98] D.J. Foran, et al., ImageMiner: A software system forcomparative analysis of tissue microarrays using content-based image retrieval, high-performance computing, and gridtechnology, Journal of the American Medical InformaticsAssociation 2011, accepted.
[99] W. Chen, D.J. Foran and M. Reiss, Unsupervised imaging,registration and archiving of tissue microarrays, Proc AMIASymp (2002), 136–139.
[100] W. Chen, M. Reiss and D.J. Foran, A prototype for unsu-pervised analysis of tissue microarrays for cancer researchand diagnostics, IEEE Trans Inf Technol Biomed 8(2) (2004),89–96.
[101] W. Chen, et al., Decentralized data sharing of tissue microar-rays for investigative research in oncology, Cancer Inform 2(2006), 373–388.
D.J. Foran et al. / Automated image interpretation and computer-assisted diagnostics 299
[102] W. Chen and D.J. Foran, Advances in cancer tissuemicroarray technology: Towards improved understandingand diagnostics, Anal Chim Acta 564(1) (2006), 74–81.
[103] O. Tuzel, F. Porikli, and P. Meer, Region covariance - AFast Descriptor for Detection and Classification, In Proc.9th European Conf on Computer Vision, Graz, Austria,2006.
[104] D.J. Foran, et al., A caGrid enabled, Learning-BasedSegmentation Method for Histopathology Specimens, inInternational Symposium on Biomedical Imaging, 2009.
[105] F. Zhang, et al., Ski-related novel protein N (SnoN):A negative controller of transforming growth factor-betasignaling, is a prognostic marker in estrogen receptor-positive breast carcinomas, Cancer Res 63(16) (2003), 5005–5010.
[106] P.T. Simpson, et al., Distribution and significance of 14-3-3sigma: A novel myoepithelial marker, in normal, benign,and malignant breast tissue, J Pathol 202(3) (2004), 274–285.
[107] P.S. Masny, et al., Localization of 4q35.2 to the nuclearperiphery: Is FSHD a nuclear envelope disease? Hum MolGenet 13(17) (2004), 1857–1871.
[108] L. Yang, et al., High throughput analysis of breast cancerspecimens on the grid, Med Image Comput Comput AssistInterv 10(Pt 1) (2007), 617–625.
[109] B. Hall, et al., A clinically motivated 2-fold framework forquantifying and classifying immunohistochemically stainedspecimens, Med Image Comput Comput Assist Interv Int ConfMed Image Comput Comput Assist Interv 10(Pt 2) (2007),287–294.
[110] B.H. Hall, et al., Computer-assisted assessment of the humanepidermal growth factor receptor 2 immunohistochemicalassay in imaged histologic sections using a membrane isola-tion algorithm and quantitative analysis of positive controls,BMC Med Imaging 8 (2008), 11.
[111] R.J. Byers, D.V.D., F. O’connell, E. Tholouli, R.M. Leven-son, K. Gossage, D. Twomey, Y. Yang, E. Benedettini, J. Rose,K.L. Ligon, S.P. Finn, T.R. Golub and M. Loda, Semiauto-mated Multiplexed Quantum Dot-based in situ Hybridizationand Spectral Deconvolution, J Mol Diagn 9(1) (2007),20–29.
[112] R. Levenson and C. Hoyt, Spectral imaging and microscopy,American Laboratory, 2000.
[113] M.V.E. Macville, et al., Spectral imaging of multi-color chro-mogenic dyes in pathological specimens, Analytical CellularPathology 22(3) (2001), 133–142.
[114] L. Boucheron, B.Z., N. Harvey, B.S. Manjunath and D.Rimm, Utility of multispectral imaging for nuclear classifi-cation of routine clinical histopathology imagery, BMC CellBiology 8(S8) 2007.
[115] M. Roula, et al., A quadratic classifier based on multispec-tral texture features for prostate cancer diagnosis, IEEE,2003.
[116] J. Friedman, T. Hastie and R. Tibshirani, Special invitedpaper, additive logistic regression: A statistical view of boost-ing, The annals of statistics 28(2) (2000), 337–374.
[117] X. Qi, et al., Comparative performance analysis of stainedhistopathology specimens using RGB and multispectralimaging (Proceedings Paper), 2011.
[118] G. Wyszecki and W. Stiles, Color Science: Concepts andMethods, Quantitative Data and Formulai 1982., John Wiley& Sons, Inc.
[119] W.J. Cukierski, X. Qi and D.J. Foran, Moving Beyond Color:The Case for Multispectral Imaging in Brightfield Pathol-ogy, Proc IEEE Int Symp Biomed Imaging (2009), 1111–1114.
[120] W.J. Cukierski and D.J. Foran, Metamerism in multispectralimaging of histopathology specimens, IEEE, 2010.
[121] Y. Xing, et al., Bioconjugated quantum dots for multiplexedand quantitative immunohistochemistry, Nat Protoc 2(5)(2007), 1152–1165.
[122] X. Qi, et al., Optimizing specimen preparation and multi-spectral imaging protocols to accommodated automatedassessment of expression in non-Hodgkin’s lymphoma, inPathology Informatics, Boston, MA, 2010.
[123] L. Yang, et al., A fast and accurate tracking algorithm ofleft ventricles in 3d echocardiography, Proc IEEE Int SympBiomed Imaging 5 (2008), 221–224.
[124] L. Yang, et al., A multicore based parallel image registrationmethod, Conf Proc IEEE Eng Med Biol Soc 1 (2009), 98–101.
[125] W. Chen, et al., ImageMiner: A medical image analysis andimage management UML data model, in APIII: Advanc-ing Practice, Instruction & Innovation Through Informatics,Pittsburgh, PA, 2009.
[126] J.J. Berman, M.E. Edgerton and B.A. Friedman, The tissuemicroarray data exchange specification: A community-based,open source tool for sharing tissue microarray data, BMC MedInform Decis Mak 3(1) (2003), 5.
[127] F. Wang, et al., Unified Modeling of Image Annotation andMarkup, in APIII: Advancing Practice, Instruction & Inno-vation Through Informatics, Pittsburgh, PA, 2009.
[128] D.S. Channin, et al., The Annotation and Image Mark-upproject, Radiology 253(3) (2009), 590–592.
[129] D.S. Channin, et al., The caBIG Annotation and ImageMarkup Project, J Digit Imaging, 2009.
[130] W. Chen, et al., PathMiner: Image Mining for investigativepathology using optimized feature extraction and data fusion,Computer Methods and Programs in Biomedicine (2004), p.(submitted).
[131] F. Wang, et al., A Data Model and Database for High-resolution Pathology Analytical Image Informatics, Journalof Pathology Informatics 2011, accepted.
[132] L. Yang, et al., High throughput analysis of breast cancerspecimens on the grid, Med Image Comput Comput AssistInterv Int Conf Med Image Comput Comput Assist Interv10(Pt 1) (2007), 617–625.
[133] M.N. Gurcan, et al., Computerized pathological imageanalysis for neuroblastoma prognosis, American MedicalInformatics Association 2007.
[134] D.J. Foran, F. Cahn and E.F. Eikenberry, Assessment ofcell proliferation on porous microcarriers by means ofimage analysis, Anal Quant Cytol Histol 13(3) (1991), 215–222.
[135] D.J. Foran and R.A. Berg, A method for quantitative imageassessment based on redundant feature measurements andstatistical reasoning, Comput Methods Programs Biomed45(4) (1994), 291–305.

300 D.J. Foran et al. / Automated image interpretation and computer-assisted diagnostics
[136] R.S. DiPaola, et al., Therapeutic starvation and autophagyin prostate cancer: A new paradigm for targeting meta-bolism in cancer therapy, Prostate 68(16) (2008), 1743–1752.
[137] L. Goodell, et al., Use of computer assisted analysis tofacilitate tissue microarray interpretation, in United Statesand Canadian Academy of Pathology 2010 Annual Meeting,Washington, DC, 2010.