Embed Size (px)
Citation preview

Techniques
Automated Identification of Northern Leaf Blight-Infected Maize Plantsfrom Field Imagery Using Deep Learning
Chad DeChant,† Tyr Wiesner-Hanks, Siyuan Chen, Ethan L. Stewart, Jason Yosinski, Michael A. Gore, Rebecca J. Nelson,and Hod Lipson
First author: Department of Computer Science, Columbia University in the City of New York, 10027; second, fourth, and sixth authors: PlantBreeding and Genetics Section, School of Integrative Plant Science, Cornell University, Ithaca, NY 14853; third author: Department ofMechanical Engineering, Columbia University; fifth author: Uber AI Labs, San Francisco 94103; seventh author: Plant Pathology and Plant-Microbe Biology Section, School of Integrative Plant Science, Cornell University; and eighth author: Department of Mechanical Engineeringand Institute of Data Science, Columbia University.
Accepted for publication 22 June 2017.
ABSTRACT
Northern leaf blight (NLB) can cause severe yield loss in maize;however, scouting large areas to accurately diagnose the disease is timeconsuming and difficult. We demonstrate a system capable of automat-ically identifying NLB lesions in field-acquired images of maize plantswith high reliability. This approach uses a computational pipeline ofconvolutional neural networks (CNNs) that addresses the challenges oflimited data and the myriad irregularities that appear in images of field-grown plants. Several CNNs were trained to classify small regions of
images as containing NLB lesions or not; their predictions were combinedinto separate heat maps, then fed into a final CNN trained to classify theentire image as containing diseased plants or not. The system achieved96.7% accuracy on test set images not used in training. We suggest thatsuch systems mounted on aerial- or ground-based vehicles can help inautomated high-throughput plant phenotyping, precision breeding fordisease resistance, and reduced pesticide use through targeted applicationacross a variety of plant and disease categories.
An estimated 13%of global potential crop yield is lost to diseaseseach year (Oerke and Dehne 2004), with much higher lossesoccurring under epidemic conditions. To evaluate resistance ofplant germplasm and breed for improved resistance, conventionalvisual assessments of disease incidence or severity are widely used.However, such assessments are prone to error through inter- andintrarater variation, which can reduce precision and accuracy ofgenetic inferences (Bock et al. 2009; Poland and Nelson 2011;Sherwood et al. 1983). Accurate automated high-throughput pheno-typing of plant diseases has the potential to aid crop management,speed upbreeding, and contribute to fundamental and applied researchefforts (Pauli et al. 2016).Northern leaf blight (NLB), also called northern corn leaf blight
or turcicum blight, is a fungal foliar disease of maize caused bySetosphaeria turcica (anamorph: Exserohilum turcicum). In theUnited States andOntario, NLB has been growing especially severein recent years, with estimated yield losses rising steadily from 1.9million metric tons in 2012 to 14 million metric tons in 2015(Mueller et al. 2016). This estimated yield loss fromNLBaccountedfor one-fourth of all estimated yield losses from disease in 2015,causing an estimated economic loss of $1.9 billion. In controlledyield trials, high levels of infection can cause yield losses of 18 to62% (Perkins and Pedersen 1987; Raymundo and Hooker 1981;Shankara and Gowda 2011), as well as a decrease in silage qualityand digestibility (Wang et al. 2010). Incubation period (the numberof days after inoculation at which NLB lesions are present on 50%of plants in a plot) is an important component ofNLB resistance thatcan be evaluated before the plant flowers, making it particularlyuseful for resistance breeding (Brewster et al. 1992; Welz and
Geiger 2000). However, scoring this by eye is very time consumingand often not feasible for large field trials (Poland and Nelson 2011).An ideal disease phenotyping solution would be rapid, accurate,
and precise. Image-based phenotyping meets these criteria. Numer-ous image-based plant disease phenotyping methods have beendeveloped in recent years that show greater accuracy, precision, andrepeatability than visual assessments (Bock et al. 2008; Stewart andMcDonald 2014; Xie et al. 2012). However, these methods typicallyrequire destructive sampling or consistent standardized conditions inwhich to take the images,which is time consuming anddoesnot allowdisease progression to be tracked over time. Therefore, a system thatwould allow disease phenotyping using images taken under naturalfield conditions is desirable.The large size of NLB lesions makes this disease an attractive
candidate for image-based phenotyping. NLB causes gray-brownnecrotic lesions, which can grow and coalesce over the course of aseason.Within several weeks of lesion formation, they are typicallyat least 1 cm wide and 5 cm long. Detecting these large lesions infield photographs, which might be limited in quality or resolution,will likely be more feasible than detection of diseases that chieflycause streaking (e.g., maize dwarf mosaic virus) or smaller lesionsor pustules (e.g., common rust or northern corn leaf spot).Machine learning techniques have been used to detect, classify,
and quantify a wide variety of diseases on many crops (ArnalBarbedo 2013; Singh et al. 2016). In general, prior work on diseasedetection in plants has focused on analysis of individual leavesphotographed under controlled, standardized conditions. Althoughthis represents a notable achievement, the range of potential uses forsuch techniques is limited by the focus on single leaves and theuniform settings inwhich they have been photographed. It would beuseful to be able to also detect disease in photographs taken in thefield, which may feature many plants with highly variable perspec-tives and lighting conditions.Improvements in convolutional neural networks (CNNs) in recent
years have made them the state of the art among machine learningapproaches for addressing computer vision problems, particularly
†Corresponding author: C. DeChant; E-mail: [email protected]
*The e-Xtra logo stands for “electronic extra” and indicates that two supplementarytables are published online.
© 2017 The American Phytopathological Society
1426 PHYTOPATHOLOGY
Phytopathology • 2017 • 107:1426-1432 • https://doi.org/10.1094/PHYTO-11-16-0417-R
image classification (LeCunet al. 2015).Computer visionapproachesto classification tasks have traditionally required manual selectionof features that were thought to be useful in making classificationdecisions. By contrast, CNNs learnwhich features aremost important.Neural networks are composed of multiple layers of linear transfor-mations (multiplications by a “weight” matrix), each followed by anonlinear function. The linear transformations are learned duringtraining by making small changes to the weight matrices thatprogressively make the transformations more helpful to the finalclassification task.The learned multilayer processing of visual input that occurs in a
CNN is thought to be analogous to how the primate visual systemprocesses information; early stages of the networks respond to basicvisual elements such as lines while higher levels of the networksrespond to more complicated or abstract visual concepts such asobject category (Cadieu et al. 2014). Convolutional layers allow anetwork to efficiently learn features that are invariant to an exactlocation in an image by applying the same learned transformation tosubsections of an entire image.In an example of prior work in this area, Mohanty et al. (2016)
trained a CNN to classify leaves as belonging to 1 of 14 species and todeterminewhether theyhad1of26diseases.They reportedanaccuracyof 99.4% when classifying both species and disease on held-out data.However, on images not collected under controlled conditions, theirmodel had accuracies of 31.4 to 31.7% when classifying both speciesand disease and 41.1 to 54.5%when classifying disease in images of aprespecified species. In images collected from natural settings, manynuisance factors contribute to make the task difficult for a networktrained on artificially controlled images, including lighting variations,shadows, and exposed soil.Reliably distinguishing between NLB lesions and other forms of
damaged or senescent leaf tissue is the first step toward estimatingNLB incidence from field images. Therefore, we set out to create asystem that could detect NLB lesions in diverse field images on parwith human experts. To this end, we collected images of maizeplants in the field that contained varying levels of NLB infection aswell as differing amounts of nontarget features such as soil and sky.A three-stage image analysis pipeline based around CNNs wasdeveloped that was able to accurately detect the presence of NLBlesions in the images.
MATERIALS AND METHODS
Theexperiments consistedof two separateplantingsof theGenomesto Fields Initiative’s GxE Trial (http://www.genomes2fields.org),both grown on the Musgrave Research Farm in Aurora, NY duringthe 2015 growing season. Each planting consisted of two replicates,with each replicate containing 250 maize hybrids, including 5hybrid checks adapted to New York State. One planting wasinoculated with NLB as described below while the other plantingreceived no treatment.In the inoculated planting, each plant was inoculated using both
a liquid suspension of S. turcica conidia and sorghum grains thatwere infested with S. turcica in a modified version of the protocolfrom Chung et al. (2010). Cultures of S. turcica for liquid sus-pension were grown on lactose casein hydrolysate agar for 2 to3 weeks on a cycle of 16 h of light and 8 h of darkness at roomtemperature. Colonies were scraped from the plates using glass rodsand sterile H2O. Spore concentration was adjusted to 4,000 spores/ml with a hemacytometer and the final suspension was adjusted to0.02% Tween 20. For solid inoculum, 1,000 ml of sorghum grainsand 600ml of deionizedH2Owere soaked overnight in autoclavablespawn bags, sealed at the topwith three seals to form an S-bend, andautoclaved for 70 min. Sterilized bags were cut open, inoculatedwith 1 ml of uncalibrated spore suspension scraped from 2- to 3-week-old cultures of S. turcica grown as described above, andresealed. Bags were massaged daily for 3 weeks to disperse fungaltissue and break up clumps. At 38 days after planting (roughly the
V5 to V6 stage), plants were inoculated by pipetting 0.5ml of liquidspore suspension and dropping one-quarter teaspoon (approxi-mately 1.25 ml) of colonized sorghum grains into the upper plantwhorl.Images of NLB-infected and noninfected leaves were taken with a
Canon EOS Rebel or Sony a6000 camera by hand on dates rangingfrom 28 to 78 days postinoculation (DPI). Altogether, 1,834 imageswere taken over eight dates. In total, 38 images were excluded due topoor quality. The images were first classified by presence or absenceof any visible lesions in the image. Following this, all visible lesionswere marked with a line down the main axis of the lesion using theannotation features of the Bisque image-processing platform hostedonCyVerse (formerly iPlant) (Goff et al. 2011) (Fig. 1). Full details ofhowmany imageswere takenon eachdate, alongwith thedistributionof those images in the training, validation, and test sets, can be foundin Supplementary Table S2.Images of infected leaves were predominantly taken in the inoc-
ulated trial. The noninoculated trial exhibited low levels of naturalinfection. Therefore, images of noninfected leaves were predomi-nantly taken in the noninoculated trial. To avoid spurious associationsbetween the presence of lesions and trial-wide differences in plantmaturity, field condition, or background objects, infected leaveswerephotographed in the noninoculated trial and noninfected leaves in theinoculated trial whenever possible.The 1,028 images of infected leaves and 768 images of
noninfected leaves were randomly divided such that 70% of theimages were used for training (i.e., to fit the models), 15% forvalidation (i.e., to estimate prediction error for model and hyper-parameter selection), and 15% for testing (i.e., to assess error of thefinal chosenmodel). All choices involving network architecture andall training were done without consideration of the test set, whichwas only used at the end to assess the performance of the final, fullsystem.We developed a three-stage process to analyze the images to
determine whether they contained infected leaves. In stage 1, wetrained several CNNs to detect the presence of lesions in smallpatches of the images. Those CNNswere used in the second stage toproduce heat maps indicating the probability of infection of eachregion of the images. The third stage used those heat maps toclassify the full images.In stage 1, the images were broken up into small segments of 224
by 224 pixels. Individual lesionswere almost always larger than 224by 224 pixels, allowing for many image segments to be producedfrom each lesion. Image segments were generated by moving downthe length of the lesion 10 pixels at a time and centering the targetsegment in a randomly chosen location ±15 pixels from the majoraxis of the lesion. A random rotation was then applied to the imagebefore the final segmentation, which allowed six slightly differentimages to be produced from the same area. Nonlesion segmentswere produced from the noninfected images in a similar fashionfrom randomly rotated segments drawn from the entire image.After training one network on the smaller image patches, that
network was used to select images to augment the data set, atechnique called hard negative mining. Images of noninfectedplants were broken up into regions of 224 by 224 pixels using aslidingwindowapproachwith a step size of 55. Because the originaltraining imageswere randomly rotated and nudged up or down, onlya small fraction (fewer than 0.1%) of these newly generated seg-ments could have been identical with the first training set. Theseimage segments were fed into the trained neural network. Imagesegments that were incorrectly classified as containing lesions werethen added to the training set. Versions of these images were alsoadded to the training set after they were flipped horizontally andvertically.Five CNNs were then trained on the newly augmented data
set with variations in the architecture and hyperparameters of thenetworks, the balance of lesion versus nonlesion, and the balance oforiginal nonlesion versus negative mined nonlesion images. Three
Vol. 107, No. 11, 2017 1427

of these (classifiersA,B, andC)wereused in the final system.Stage1classifier A was trained on a roughly equal balance of nonlesionversus lesion images, using only the hard negative mined images forthe nonlesion class. Classifiers B and C were trained on both theoriginal nonlesion images and the negatively mined ones. Becauseearly networks produced significantly more false positives than falsenegatives, classifiers B and C were trained on a mix of lesion versusnonlesion images in which the proportion of nonlesion images wassignificantly increased; the proportion of nonlesion to lesion imageswas roughly 6:1.The five CNNs trained in stage 1 were selected to create heat
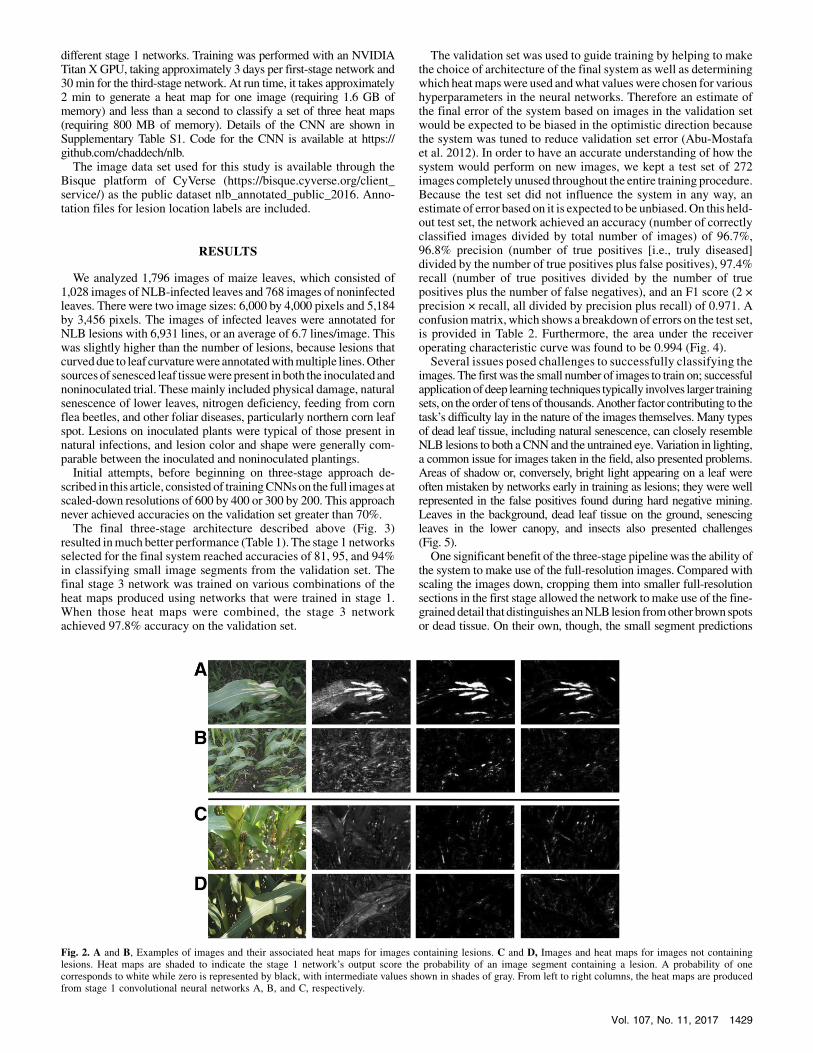
maps of the full images in stage 2. One set of heat maps wasproduced from each CNN trained to classify small patches of theimages in stage 1. Using a sliding window approach with a step sizeof 30, sections of the larger images were fed through each of theneural networks. The output was recorded for each location in theimages, which can be interpreted as the probability that each sectioncontains a lesion. Each probability was assembled into a matrix inits appropriate place so as to represent the output of a network foreach area of the image (Fig. 2).The third stage trainedCNNs to use the heatmaps from the previous
stage to classify each entire image as containing or not containinginfected leaves. Neural networks were trained on various combina-tions of the heat maps produced in stage 1. The heat maps were“stacked” on top of each other, each occupying a different channel ofthe input. Input from three heat maps of the same underlying image,
for example,wouldoccupy three channels just as a color imagewouldbe composed of three channels (red, green, and blue). They wereflipped horizontally and vertically and rotated during training toaugment their number. Various combinations of the heat map setswereused for training and a selectionof three heatmap sets (A,B, andC) was made based on validation set performance.Both stages involved the use of CNNs trained using the open-source
software packages Keras (Chollet 2015) and Theano (Theano Devel-opment Team et al. 2016). Theano performs automatic differentiationto allow network parameters to be learned using backpropagation;Keras is a front-end library for using Theano. We randomly initializedthe weights of the neural networks following the guidance of He et al.(2015) for layers composed of rectified linear units and Glorot andBengio (2010) for the final logistic unit layer. A rectified linear unit isequivalent to y = x for x > 0 and y = 0 for x < 0. Hyperparameters weretuned byhand followingvalidation set results. The convolutional layersin stage 3 have a relatively small number of filters per layer (n = 8)because, with anymore filters, the network quickly overfit the trainingdata. We used batch normalization (Ioffe and Szegedy 2015) in allnetworks and as a first stage in the stage 1 classifiers. We applied maxpooling at several layers of the network; the max pooling operationtakes a set of inputs, in this case a two-by-two matrix of numbers, andreturns the largest number. We used the Adam optimization algorithm(Kingma and Ba 2014) in stage 1 network A and C and the stage 3network; RMSprop (Tieleman and Hinton 2012) was used instead innetwork B in order to add diversity to the training methods used in the
Fig. 1. Images used to train the convolutional neural networks to detect the presence of northern leaf blight (NLB) disease symptoms. A and B, Typical leafsymptoms of NLB-infected maize plants; lesions marked during training are circled in red. C and D, Typical images of noninfected plants. Images represent therange of disease symptoms, background, and lighting conditions present.
1428 PHYTOPATHOLOGY
different stage 1 networks. Training was performed with an NVIDIATitan XGPU, taking approximately 3 days per first-stage network and30min for the third-stage network. At run time, it takes approximately2 min to generate a heat map for one image (requiring 1.6 GB ofmemory) and less than a second to classify a set of three heat maps(requiring 800 MB of memory). Details of the CNN are shown inSupplementary Table S1. Code for the CNN is available at https://github.com/chaddech/nlb.The image data set used for this study is available through the
Bisque platform of CyVerse (https://bisque.cyverse.org/client_service/) as the public dataset nlb_annotated_public_2016. Anno-tation files for lesion location labels are included.
RESULTS
We analyzed 1,796 images of maize leaves, which consisted of1,028 images of NLB-infected leaves and 768 images of noninfectedleaves. There were two image sizes: 6,000 by 4,000 pixels and 5,184by 3,456 pixels. The images of infected leaves were annotated forNLB lesions with 6,931 lines, or an average of 6.7 lines/image. Thiswas slightly higher than the number of lesions, because lesions thatcurveddue to leaf curvaturewereannotatedwithmultiple lines.Othersources of senesced leaf tissuewerepresent inboth the inoculated andnoninoculated trial. These mainly included physical damage, naturalsenescence of lower leaves, nitrogen deficiency, feeding from cornflea beetles, and other foliar diseases, particularly northern corn leafspot. Lesions on inoculated plants were typical of those present innatural infections, and lesion color and shape were generally com-parable between the inoculated and noninoculated plantings.Initial attempts, before beginning on three-stage approach de-
scribed in this article, consisted of trainingCNNson the full images atscaled-down resolutions of 600 by 400 or 300 by 200. This approachnever achieved accuracies on the validation set greater than 70%.The final three-stage architecture described above (Fig. 3)
resulted inmuch better performance (Table 1). The stage 1 networksselected for the final system reached accuracies of 81, 95, and 94%in classifying small image segments from the validation set. Thefinal stage 3 network was trained on various combinations of theheat maps produced using networks that were trained in stage 1.When those heat maps were combined, the stage 3 networkachieved 97.8% accuracy on the validation set.
The validation set was used to guide training by helping to makethe choice of architecture of the final system as well as determiningwhich heatmapswere used andwhat valueswere chosen for varioushyperparameters in the neural networks. Therefore an estimate ofthe final error of the system based on images in the validation setwould be expected to be biased in the optimistic direction becausethe system was tuned to reduce validation set error (Abu-Mostafaet al. 2012). In order to have an accurate understanding of how thesystem would perform on new images, we kept a test set of 272images completely unused throughout the entire training procedure.Because the test set did not influence the system in any way, anestimate of error based on it is expected to be unbiased.On this held-out test set, the network achieved an accuracy (number of correctlyclassified images divided by total number of images) of 96.7%,96.8% precision (number of true positives [i.e., truly diseased]divided by the number of true positives plus false positives), 97.4%recall (number of true positives divided by the number of truepositives plus the number of false negatives), and an F1 score (2 ×precision × recall, all divided by precision plus recall) of 0.971. Aconfusionmatrix, which shows a breakdown of errors on the test set,is provided in Table 2. Furthermore, the area under the receiveroperating characteristic curve was found to be 0.994 (Fig. 4).Several issues posed challenges to successfully classifying the
images. The first was the small number of images to train on; successfulapplicationofdeep learning techniques typically involves larger trainingsets, on the order of tens of thousands.Another factor contributing to thetask’s difficulty lay in the nature of the images themselves. Many typesof dead leaf tissue, including natural senescence, can closely resembleNLB lesions to both a CNNand the untrained eye. Variation in lighting,a common issue for images taken in the field, also presented problems.Areas of shadow or, conversely, bright light appearing on a leaf wereoften mistaken by networks early in training as lesions; they were wellrepresented in the false positives found during hard negative mining.Leaves in the background, dead leaf tissue on the ground, senescingleaves in the lower canopy, and insects also presented challenges(Fig. 5).One significant benefit of the three-stage pipelinewas the ability of
the system to make use of the full-resolution images. Compared withscaling the images down, cropping them into smaller full-resolutionsections in the first stage allowed the network tomake use of the fine-graineddetail that distinguishes anNLBlesion fromother brown spotsor dead tissue. On their own, though, the small segment predictions
Fig. 2. A and B, Examples of images and their associated heat maps for images containing lesions. C and D, Images and heat maps for images not containinglesions. Heat maps are shaded to indicate the stage 1 network’s output score the probability of an image segment containing a lesion. A probability of onecorresponds to white while zero is represented by black, with intermediate values shown in shades of gray. From left to right columns, the heat maps are producedfrom stage 1 convolutional neural networks A, B, and C, respectively.
Vol. 107, No. 11, 2017 1429
actually presented a problem because of their sheer number. Becausethe heat maps (matrices of 126 by 193 values) contained scores for24,318 such segments, even a highly accurate classifier would havemany errors in its scores for an entire image. The best stage 1 networkachieved an accuracy of 94%; thus, we would expect over 1,000incorrectly classified segments in every one of the heat maps. This iswhy the stage 3 classifier was necessary; it learned how to combine allof the local segment scores, including inaccurate ones, into a globalclassification, achieving 96.7% accuracy on whole images.
DISCUSSION
Ensemblemethods that combine the output of different classifiersoften show improved performance over a single classifier. Weachieved the best result with a combination of three of the stage 1networks, so that the system benefited from this effect. However,even when we used only one network’s heat maps in the third stage,we still observed significant improvement over the initial, baselinenetwork, which took as input scaled-down versions of the fullimages. Therefore, the three-stage system’s improved performancewas primarily due to other factors. Neural network performance isgreatly affected by the amount of data available for training.Because we trained the first stage on small sections of the imagesinstead of the full image, the training set size was effectivelyincreased, at least for the networks in stage 1. One lesion might bebroken up into many small regions, for example.The need to break up the images and process them in stages arose,
in part, because of memory constraints; we cannot feed reasonablysized batches of full-resolution images into a CNNwith a reasonablenumber of convolutional filters per layer. If we could,making end-to-end training of the entire pipeline feasible from full-resolution imageto final classification, it is possible that performance could beimproved. It also possible, though, that the production of heat mapsindependent of the final classifier introduced a kind of regularizationand that an end-to-end system could more easily overfit the trainingset. This would be a particular danger for training sets as small as thisone. Future work would benefit from additional data.On-site diagnosis will require the ability to detect the presence of
disease symptoms in images that are not ideal and contain manypotentially confounding factors. Because machine learning tech-niques typically do not perform aswell on data that are significantlydifferent from that on which they were trained, it is likely thatclassifiers will have to be trained on images taken in similar con-ditions in the field.A significant drawback of the current method is the time needed
to manually classify images required to train the CNN. However,
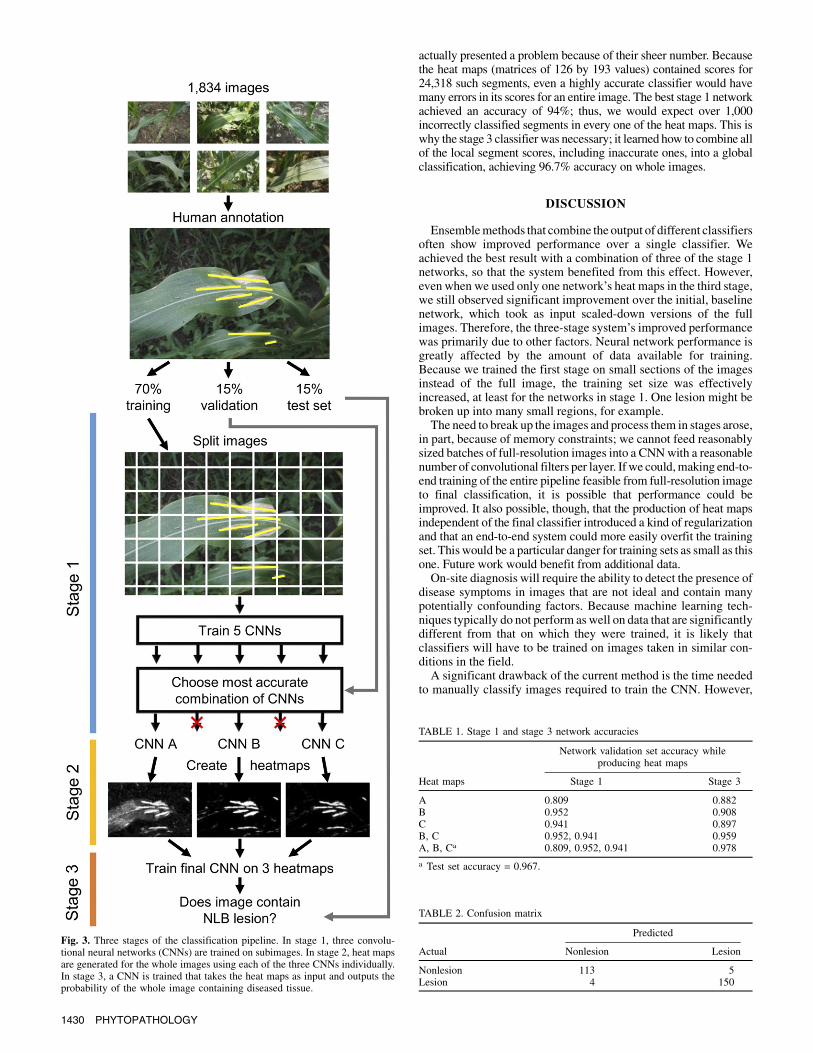
TABLE 1. Stage 1 and stage 3 network accuracies
Network validation set accuracy whileproducing heat maps
Heat maps Stage 1 Stage 3
A 0.809 0.882B 0.952 0.908C 0.941 0.897B, C 0.952, 0.941 0.959A, B, Ca 0.809, 0.952, 0.941 0.978
a Test set accuracy = 0.967.
TABLE 2. Confusion matrix
Predicted
Actual Nonlesion Lesion
Nonlesion 113 5Lesion 4 150
Fig. 3. Three stages of the classification pipeline. In stage 1, three convolu-tional neural networks (CNNs) are trained on subimages. In stage 2, heat mapsare generated for the whole images using each of the three CNNs individually.In stage 3, a CNN is trained that takes the heat maps as input and outputs theprobability of the whole image containing diseased tissue.
1430 PHYTOPATHOLOGY

this is a one-time investment; once theCNN is trained, it can be usedon new images taken in similar conditions without further training.It does not need specialized hardware to run; thus, the network andthe expertise it represents can be shared freely among different usersof the technology.The current systemcan detect the presence or absence of a disease
in an image, information most readily used for estimating diseaseincidence. This may be useful for growers looking for early detec-tion or breeders evaluating incubation period for a given disease.However, for most applications, both growers and breeders willadditionally need to quantify disease severity. This informationcould be extracted from the heat maps used for detection but thereliability of this method remains to be seen. Factors such asdistance from the camera, leaf angle, and the amount of nonplantfeatures within the image present challenges for calculating theproportion of diseased versus healthy plant tissue within an image.Further experiments have been planned to test the replicability andaccuracy of quantification, in the same way that detection has beentested here.
We believe that this approach can be applied to other plantdiseases with visible symptoms that can be recognized by humanexperts. As shown byMohanty et al. (2016), when using images thatwere of single leaves taken on a homogenous background, CNNscould be trained to recognize many different diseases on diverseplant hosts with high accuracy.We have shown that highly accurateCNNscanbe trainedon field imageswith highly variable backgrounds,angles, fields of view, and lighting.This approach requiresmorehumantime investment to generate training data, because labeling individuallesions is more time consuming than classifying whole images ascontaining or not containing lesions. However, it requires less timeinvestment during the field season, because infected leaves can bephotographed from any angle without the need to place them on ahomogenous background.Training CNNs on field images of more diseases is the first step
toward being able to confidently distinguish these diseases or damagein the fieldwith an automated system. Plant breeding trials or geneticexperiments that are artificially inoculated may be highly infectedwith only a single disease, as ours were, making misclassification ofother diseases a relatively rare occurrence. For most other cases,however, accurately classifying multiple diseases will be necessary.The images used are representative of those that could be
captured from a ground vehicle as it moves through a field trial.Several ground-based phenotyping vehicles equipped with a rangeof different sensors have previously been developed (Andrade-Sanchez et al. 2014; Deery et al. 2014). Due to the high payloadcapacity of most of these vehicles, the addition of a further systemtrained to recognize disease is highly feasible. A further applicationwould be tomount the system on an aerial vehicle. Small unmannedaircraft systems (sUAS) technology has progressed dramaticallyin recent years and shows great potential as a crop monitoringsystem (Chapman et al. 2014; Sankaran et al. 2015). Coupled withautonomous or semiautonomous navigation, sUAS platforms couldprovide measures of disease in the field with greater accuracy andthe same or less human input than current visual diseasemonitoring.We are currently working on training CNNs to recognize NLB andother plant phenotypes from sUAS imagery. Such a system hasthe potential to speed up genetic improvement of disease resis-tance traits in plant breeding programs by allowing more linesto be screened more accurately in less time and, therefore, morefrequently.In a production setting, this system could be coupled with real-
timevariable-rate fungicide applicators. Such applicators feedmea-sured crop parameters into a decision support system to gauge therequired fungicide dosage. This limits fungicide application ratesin areas where it is less needed, with the dual benefit of reducingfungicide usage and runoff and saving money for growers. Systemsthat adjust fungicide application systems to the level of canopycoverage have been developed and tested by Dammer et al. (2009)and Tackenberg et al. (2016). Both groups noted that real-timedisease detection would provide the ideal data for estimating optimalapplication rates but that this was not yet feasible.The application of deep learning to plant disease phenotyping has
the potential to overcome the shortcomings of existing image-basedphenotyping techniques while increasing the accuracy of conven-tional visual disease assessment. Integrating such technology intoresearch and breeding programs has the capability to speed upfundamental research and development of plant varieties withimproved disease resistance. Ultimately, deployment of the tech-nology on autonomous vehicles could help address the currentchallenge placed on food production by plant diseases.
ACKNOWLEDGMENTS
Thisworkwas supportedby theU.S.NationalScienceFoundationNationalRobotics Initiative grant number 1527232 (M. A. Gore, R. J. Nelson, and H.Lipson). J. Yosinski was supported by a NASA Space Technology ResearchFellowship. We thank NVIDIA Corporation for providing a TITAN X GPU
Fig. 5. Examples of image subsections that were mistakenly classified ascontaining lesions by the initial stage 1 classifier; these images were added tothe data set along with other false positives before training the stage 1 clas-sifiers in the final system.
Fig. 4. Receiver operating characteristic (ROC) curve shows the relationshipbetween the percentage of true positives (lesion images classified as con-taining lesions) and false positives (nonlesion images classified as containinglesions) when varying the classifier’s threshold for the lesion/nonlesion de-cision on test set images.
Vol. 107, No. 11, 2017 1431

for this research. The image data set used for this study is available throughthe Bisque platform of CyVerse (https://bisque.cyverse.org/client_service/)as the public data set ‘nlb_annotated_public_2016’. This data set includes1,017 annotated images with lesions and 768 files with no lesions.
LITERATURE CITED
Abu-Mostafa, Y. S., Magdon-Ismail, M., and Lin, H.-T. 2012. Learning from
Data USA. Online publication AMLBook. http://amlbook.com/support.htmlAndrade-Sanchez, P., Gore, M. A., Heun, J. T., Thorp, K. R., Carmo-Silva,
A. E., French, A. N., Salvucci, M. E., and White, J. W. 2014. Developmentand evaluation of a field-based high-throughput phenotyping platform.Funct. Plant Biol. 41:68-79.
Arnal Barbedo, J. G. 2013. Digital image processing techniques for detecting,quantifying and classifying plant diseases. Springerplus 2:660.
Bock, C. H., Parker, P. E., Cook, A. Z., and Gottwald, T. R. 2008. Visual ratingand the use of image analysis for assessing different symptoms of citruscanker on grapefruit leaves. Plant Dis. 92:530-541.
Bock, C. H., Parker, P. E., Cook, A. Z., Riley, T., and Gottwald, T. R. 2009.Comparison of assessment of citrus canker foliar symptoms by experiencedand inexperienced raters. Plant Dis. 93:412-424.
Brewster, V. A., Carson, M. L., and Wicks, Z. W. 1992. Mapping componentsof partial resistance to northern leaf blight of maize using reciprocaltranslocation. Phytopathology 82:225-229.
Cadieu, C. F., Hong, H., Yamins, D. L., Pinto, N., Ardila, D., Solomon, E. A.,Majaj, N. J., and DiCarlo, J. J. 2014. Deep neural networks rival the rep-resentation of primate IT cortex for core visual object recognition. PLOSComput. Biol. 10:e1003963.
Chapman, S. C., Merz, T., Chan, A., Jackway, P., Hrabar, S., Dreccer, M. F.,Holland, E., Zheng, B., Ling, T. J., and Jimenez-Berni, J. 2014. Pheno-Copter: A low-altitude, autonomous remote-sensing robotic helicopter forhigh-throughput field-based phenotyping. Agronomy (Basel) 4:279-301.
Chollet, F. 2015. Keras. Online publication. https://github.com/fchollet/kerasChung, C.-L., Longfellow, J. M., Walsh, E. K., Kerdieh, Z., Van Esbroeck, G.,
Balint-Kurti, P., and Nelson, R. J. 2010. Resistance loci affecting distinctstages of fungal pathogenesis: Use of introgression lines for QTL mappingand characterization in the maize-Setosphaeria turcica pathosystem. BMCPlant Biol. 10:103.
Dammer, K.-H., Thole, H., Volk, T., and Hau, B. 2009. Variable-rate fungicidespraying in real time by combining a plant cover sensor and a decisionsupport system. Precis. Agric. 10:431-442.
Deery, D., Jimenez-Berni, J., Jones, H., Sirault, X., and Furbank, R. 2014.Proximal remote sensing buggies and potential applications for field-basedphenotyping. Agronomy (Basel) 4:349-379.
Glorot, X., and Bengio, Y. 2010. Understanding the difficulty of training deepfeedforward neural networks. Pages 249-256 in: Proc. 13th AISTATS.
Goff, S. A., Vaughn, M., McKay, S., Lyons, E., Stapleton, A. E., Gessler, D.,Matasci, N., Wang, L., Hanlon, M., Lenards, A., Muir, A., Merchant, N.,Lowry, S., Mock, S., Helmke, M., Kubach, A., Narro, M., Hopkins, N.,Micklos, D., Hilgert, U., Gonzales, M., Jordan, C., Skidmore, E., Dooley,R., Cazes, J., McLay, R., Lu, Z., Pasternak, S., Koesterke, L., Piel, W.,Grene, R., Noutsos, C., Gendler, K., Feng, X., Tang, C., Lent, M., Kim,S.-J., Kvilekval, K., Manjunath, B. S., Tannen, V., Stamatakis, A.,Sanderson, M., Welch, S., Cranston, K., Soltis, P., Soltis, D., O’Meara, B.,Ane, C., Brutnell, T., Kleibenstein, D. J., White, J. W., Leebens-Mack, J.,Donoghue, M. J., Spalding, E. P., Vision, T. J., Myers, C. R., Lowenthal, D.,Enquist, B. J., Boyle, B., Akoglu, A., Andrews, G., Ram, S., Ware, D.,Stein, L., and Stanzione, D. 2011. The iPlant Collaborative: Cyberinfras-tructure for plant biology. Front. Plant Sci. 2:34.
He, K., Xhang, X., Ren, S., and Sun, J. 2015. Delving deep into rectifiers:Surpassing human-level performance on ImageNet classification. Onlinepublication. arXiv:1502.01852. https://arxiv.org/abs/1502.01852
Ioffe, S., and Szegedy, C. 2015. Batch normalization: Accelerating deep net-work training by reducing internal covariate shift. In: Int. Conf. MachineLearning.
Kingma, D., and Ba, J. 2014. Adam: A method for stochastic optimization.Online publication. arXiv:1412.6980. https://arxiv.org/abs/1412.6980
LeCun, Y., Bengio, Y., and Hinton, G. 2015. Deep learning. Nature 521:436-444.
Mohanty, S. P., Hughes, D., and Salathe, M. 2016. Inference of plant diseasesfrom leaf images through deep learning. Front. Plant Sci. 7:1419.
Mueller, D. S., Wise, K. A., Sisson, A. J., Allen, T. W., Bergstrom, G. C.,Bosley, D. B., Bradley, C. A., Broders, K. D., Byamukama, E., Chilvers,M. I., Collins, A., Faske, T. R., Friskop, A. J., Heiniger, R. W., Hollier,C. A., Hooker, D. C., Isakeit, T., Jackson-Ziems, T. A., Jardine, D. J., Kelly,H. M., Kinzer, K., Koenning, S. R., Malvick, D. K., McMullen, M., Meyer,R. F., Paul, P. A., Robertson, A. E., Roth, G. W., Smith, D. L., Tande, C. A.,Tenuta, A. U., Vincelli, P., and Warner, F. 2016. Corn yield loss estimatesdue to diseases in the United States and Ontario, Canada from 2012 to 2015.Plant Health Prog. 17:211-222.
Oerke, E.-C., and Dehne, H.-W. 2004. Safeguarding production-losses inmajor crops and the role of crop protection. Crop Prot. 23:275-285.
Pauli, D., Chapman, S. C., Bart, R., Topp, C. N., Lawrence-Dill, C. J., Poland,J., and Gore, M. A. 2016. The quest for understanding phenotypic variationvia integrated approaches in the field environment. Plant Physiol. 172:622-634.
Perkins, J., and Pedersen, W. 1987. Disease development and yield lossesassociated with northern leaf blight on corn. Plant Dis. 71:940-943.
Poland, J. A., and Nelson, R. J. 2011. In the eye of the beholder: The effect ofrater variability and different rating scales on QTL mapping. Phytopa-thology 101:290-298.
Raymundo, A., and Hooker, A. 1981. Measuring the relationship betweennorthern corn leaf blight and yield losses. Plant Dis. 65:325-327.
Sankaran, S., Khot, L. R., Espinoza, C. Z., Jarolmasjed, S., Sathuvalli, V. R.,Vandemark, G. J., Miklas, P. N., Carter, A. H., Pumphrey, M. O., Knowles,N. R., and Pavek, M. J. 2015. Low-altitude, high-resolution aerial imagingsystems for row and field crop phenotyping: A review. Eur. J. Agron. 70:112-123.
Shankara, K., and Gowda, K. 2011. Assessment of yield loss due to turcicumleaf blight of maize caused by Exserohilum turcicum. Mysore J. Agric. Sci.45:691-692.
Sherwood, R. T., Berg, C. C., Hoover, M. R., and Zeiders, K. E. 1983. Illusionsin visual assessment of Stagonospora leaf spot of orchardgrass. Phytopa-thology 73:173-177.
Singh, A., Ganapathysubramanian, B., Singh, A. K., and Sarkar, S. 2016.Machine learning for high-throughput stress phenotyping in plants. TrendsPlant Sci. 21:110-124.
Stewart, E. L., and McDonald, B. A. 2014. Measuring quantitative virulence inthe wheat pathogen Zymoseptoria tritici using high-throughput automatedimage analysis. Phytopathology 104:985-992.
Tackenberg, M., Volkmar, C., and Dammer, K.-H. 2016. Sensor-basedvariable-rate fungicide application in winter wheat. Pest Manage. Sci. 72:1888-1896.
Theano Development Team, Al-Rfou, R., Alain, G., Almahairi, A.,Angemueller,C., Bahdanau, D., Ballas, N., Bastien, F., Bayer, J., Belikov, A., Belopolsky,A., Bengio, Y., Bergeron, A., Bergstra, J., Bisson, V., Bleecher Snyder, J.,Bouchard, N., Boulanger-Lewandowsky, N., Bouthillier, X., de Brebisson, A.,Breuleux, O., Carrier, P.-L., Cho, K., Chorowski, J., Christiano, P., Cooijmans,T., Cote, M.-A., Cote, M., Courville, A., Dauphin, Y. N., Delalleau, O.,Demouth, J., Desjardins, G., Dieleman, S., Dinh, L., Ducoffe, M., Dumoulin,V., Ebrahimi Kahou, S. Erhan, D., Fan, Z., Firat, O., Germain, M., Glorot, X.Theano Development Team, and 70 additional authors. 2016. Theano: APython framework for fast computation of mathematical expressions. Onlinepublication. arXiv:1605.02688. https://arxiv.org/abs/1605.02688
Tieleman, T., and Hinton, G. 2012. RMSProp: Divide the gradient by a run-ning average of its recent magnitude. Online publication. Coursera: NeuralNetworks for Machine Learning, Lecture 6.5. https://www.coursera.org/learn/neural-networks/lecture/YQHki/rmsprop-divide-the-gradient-by-a-running-average-of-its-recent-magnitude
Wang, P., Souma, K., Kobayashi, Y., Iwabuchi, K., Sato, C., and Masuko, T.2010. Influences of northern leaf blight on corn silage fermentation quality,nutritive value and feed intake by sheep. Anim. Sci. J. 81:487-493.
Welz, H. G., and Geiger, H. H. 2000. Genes for resistance to northern corn leafblight in diverse maize populations. Plant Breed. 119:1-14.
Xie, W., Yu, K., Pauls, K. P., and Navabi, A. 2012. Application of imageanalysis in studies of quantitative disease resistance, exemplified usingcommon bacterial blight-common bean pathosystem. Phytopathology 102:434-442.
1432 PHYTOPATHOLOGY