Embed Size (px)
Citation preview

Auto Finance Summit 2021:
Economic Outlook for the Automotive & Auto Finance Industries
Edgar J. Faler
Senior Industry Analyst, Center for Automotive Research
28 October, 2021

CENTER FOR AUTOMOTIVE RESEARCH
The Current Situation:
What is “Normal” anymore??

3CENTER FOR AUTOMOTIVE RESEARCH
Current Situation
What is “Normal” anymore??
• Lingering affects of global COVID-19 pandemic… light vehicle market recovery stalled by microchip shortage (the headlines)
• Supply chain and logistics issues impacting light vehicle deliveries –it’s NOT all about the chips shortage or COVID-19 anymore
• Vehicle demand outpaces supply, for now…

CENTER FOR AUTOMOTIVE RESEARCH
GDP and Vehicle Sales

5CENTER FOR AUTOMOTIVE RESEARCH
Historic sales rebound following last year’s COVID-19 pandemic lockdowns… stalled
-30
-20
-10
0
10
20
30
40
50
-4
-2
0
2
4
6
8
10
12
1956 1961 1966 1971 1976 1981 1986 1991 1996 2001 2006 2011 2016 2021
Veh
icle
Sal
es
Gro
wth
Rat
e
GD
P G
row
th R
ate
Sales Growth GDP Growth
Source: Bureau of Economic Analysis, University of Michigan RSQE 3Q-4Q 2021 estimates
U.S. GDP Growth Rate and Vehicle Sales Correlation1956 – 2Q 2021; Forecasted 3Q-4Q 2021

6CENTER FOR AUTOMOTIVE RESEARCH
Sales growth from last year sees dramatic increase – until the global chip shortage
-50
-40
-30
-20
-10
0
10
20
30
40
50
60
-40
-30
-20
-10
0
10
20
30
40
1Q 2
000
3Q 2
000
1Q 2
001
3Q 2
001
1Q 2
002
3Q 2
002
1Q 2
003
3Q 2
003
1Q 2
004
3Q 2
004
1Q 2
005
3Q 2
005
1Q 2
006
3Q 2
006
1Q 2
007
3Q 2
00
7
1Q 2
008
3Q 2
008
1Q 2
009
3Q 2
009
1Q 2
010
3Q 2
010
1Q 2
011
3Q 2
011
1Q 2
012
3Q 2
012
1Q 2
013
3Q 2
013
1Q 2
014
3Q 2
014
1Q 2
015
3Q 2
015
1Q 2
016
3Q 2
016
1Q 2
017
3Q 2
017
1Q 2
018
3Q 2
018
1Q 2
019
3Q 2
019
1Q 2
020
3Q 2
02
0
1Q 2
021
3Q 2
021
Veh
icle
Sale
sG
row
thR
ate
GD
P G
row
th R
ate
GDP Vehicle Sales
Sources: BEA (Actual 1Q 2000 – 2Q 2021), University of Michigan RSQE (GDP forecast 3Q-4Q 2021), Center for Automotive Research (U.S. vehicle sales forecast 3Q-4Q 2021)
GDP and U.S. Vehicle Sales Growth Quarterly1Q 2000 – 2Q 2021 Actual; 3Q-4Q 2021 Forecast

CENTER FOR AUTOMOTIVE RESEARCH
Vehicle Price and Sales

8CENTER FOR AUTOMOTIVE RESEARCH
Light vehicle sales fall as prices are on the rise
150
152
154
156
158
160
162
164
8 9 10 11 12 13 14 15 16 17 18 19 20 21 22
New
Veh
icle
Pri
ce In
dex
(1
98
2=
10
0)
Light Vehicle Sales SAAR
2015-16 2017-2018 2019-2020 2021
March 2020
June 2021
COVID-19 VEHICLE ASSEMBLY PLANT CLOSURES
Light Vehicle Sales SAAR & New Vehicle Price IndexJanuary 2015 – September 2021
Source: BEA, BLS, CAR analysis
April 2020
May 2020 June 2020
Sept 2021 Aug 2021July 2021

9CENTER FOR AUTOMOTIVE RESEARCH
Changes from Jan ‘07: CPI – New Vehicle and CPI-Used Vehicle
-20%
-10%
0%
10%
20%
30%
40%
50%
New Vehicle ('82-84 = 100) Used Vehicle ('82-'84 = 100)
Source: BLS
Changes from Jan ‘07: CPI – New Vehicle and CPI-Used VehicleJanuary 2007 – September 2021
10CENTER FOR AUTOMOTIVE RESEARCH
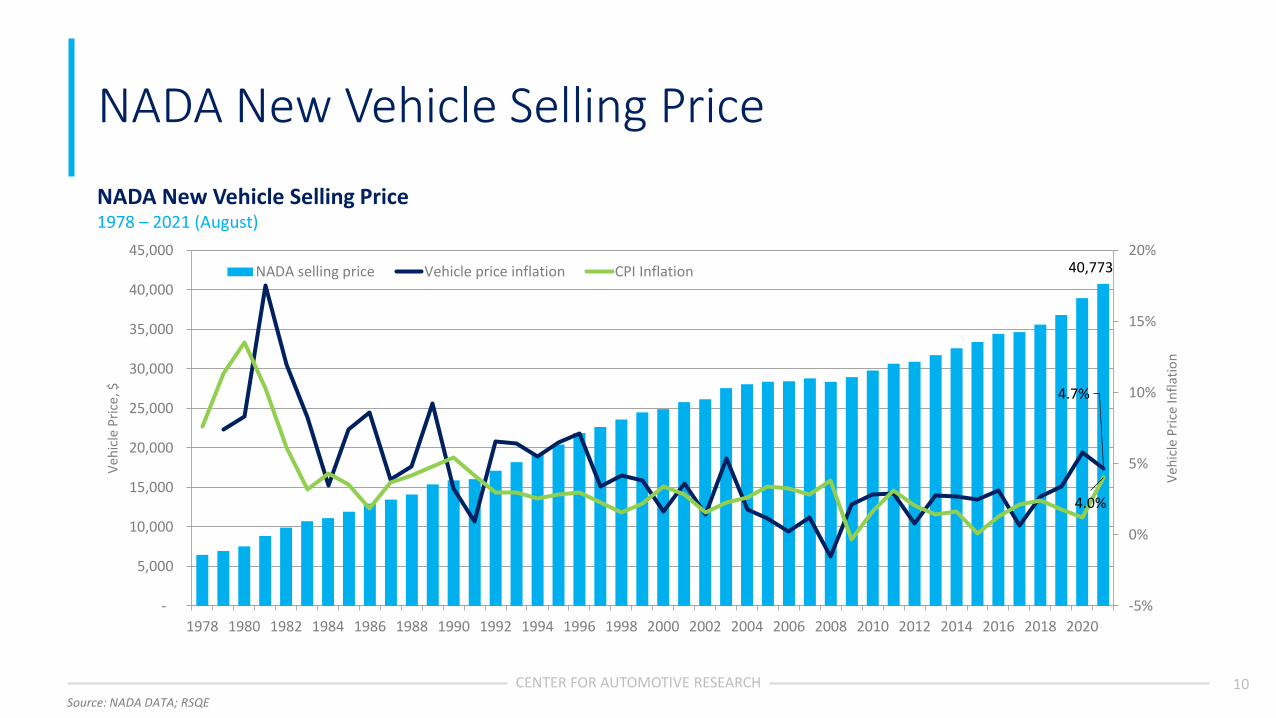
NADA New Vehicle Selling Price
40,773
4.7%
4.0%
-5%
0%
5%
10%
15%
20%
-
5,000
10,000
15,000
20,000
25,000
30,000
35,000
40,000
45,000
1978 1980 1982 1984 1986 1988 1990 1992 1994 1996 1998 2000 2002 2004 2006 2008 2010 2012 2014 2016 2018 2020
Veh
icle
Pri
ce In
flat
ion
Ve
hic
le P
rice
, $
NADA selling price Vehicle price inflation CPI Inflation
Source: NADA DATA; RSQE
NADA New Vehicle Selling Price1978 – 2021 (August)
11CENTER FOR AUTOMOTIVE RESEARCH
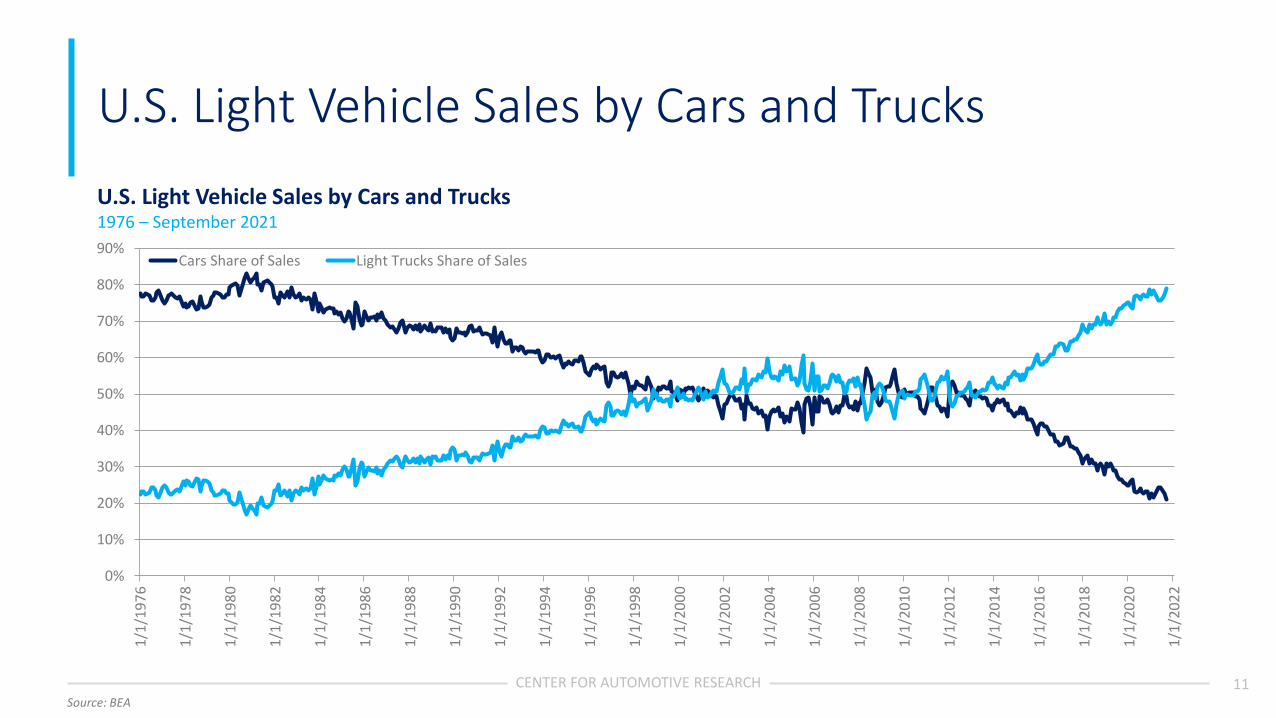
U.S. Light Vehicle Sales by Cars and Trucks
0%
10%
20%
30%
40%
50%
60%
70%
80%
90%
1/1
/19
76
1/1
/19
78
1/1
/19
80
1/1
/19
82
1/1
/19
84
1/1
/19
86
1/1
/19
88
1/1
/19
90
1/1
/19
92
1/1
/19
94
1/1
/19
96
1/1
/19
98
1/1
/20
00
1/1
/20
02
1/1
/20
04
1/1
/20
06
1/1
/20
08
1/1
/20
10
1/1
/20
12
1/1
/20
14
1/1
/20
16
1/1
/20
18
1/1
/20
20
1/1
/20
22
Cars Share of Sales Light Trucks Share of Sales
Source: BEA
U.S. Light Vehicle Sales by Cars and Trucks1976 – September 2021

CENTER FOR AUTOMOTIVE RESEARCH
Commodity Prices, Interest Rates, and Inflation

13CENTER FOR AUTOMOTIVE RESEARCH
Inflation is projected to increase
2.8%
3.8%
-0.4%
3.2%
2.2%
1.5%
4.3%
2.1%
-1%
0%
1%
2%
3%
4%
5%
2007 2008 2009 2010 2011 2012 2013 2014 2015 2016 2017 2018 2019 2020 2021 2022 2023 2024
Source: RSQE August 2021, FOMC September 2021
Inflation by Percentage2007-2020, projections for 2021-2024
14CENTER FOR AUTOMOTIVE RESEARCH
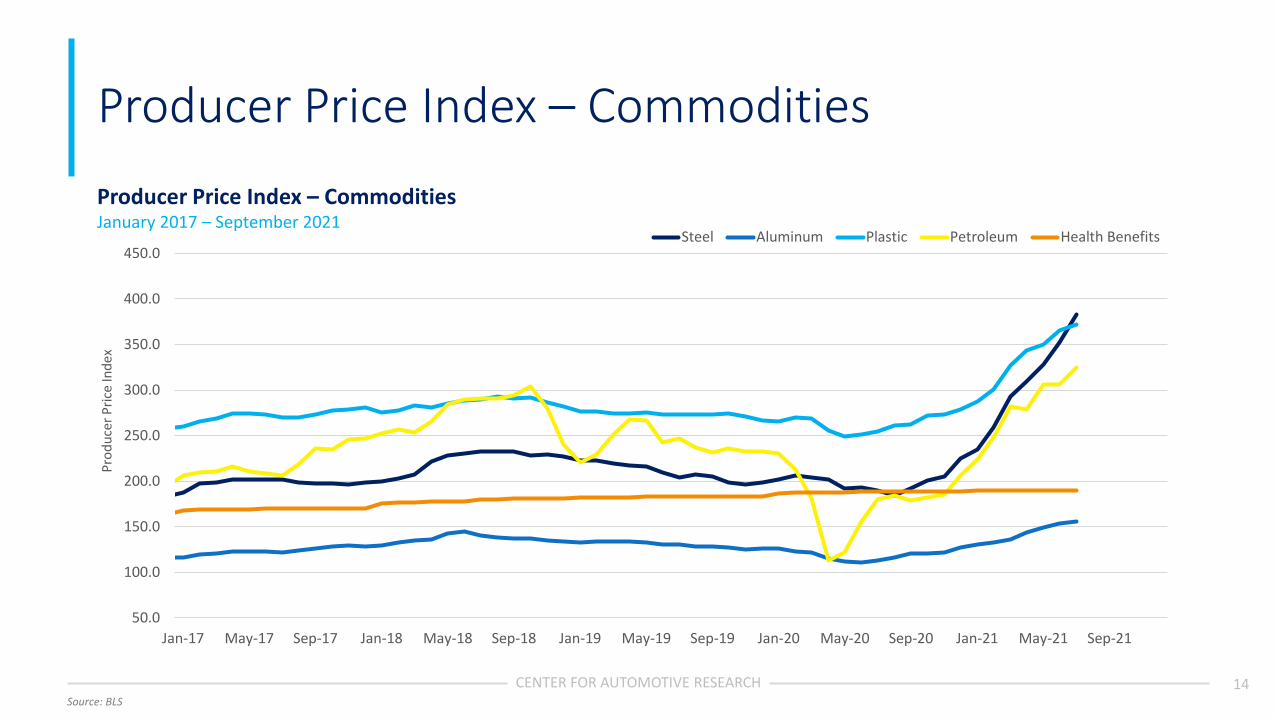
Producer Price Index – Commodities
50.0
100.0
150.0
200.0
250.0
300.0
350.0
400.0
450.0
Jan-17 May-17 Sep-17 Jan-18 May-18 Sep-18 Jan-19 May-19 Sep-19 Jan-20 May-20 Sep-20 Jan-21 May-21 Sep-21
Pro
du
cer
Pri
ce In
dex
Steel Aluminum Plastic Petroleum Health Benefits
Source: BLS
Producer Price Index – CommoditiesJanuary 2017 – September 2021

15CENTER FOR AUTOMOTIVE RESEARCH
Changes in PPI – Commodities January 2017 – September 2021
90
140
190
240
Jan
-17
May
-17
Sep
-17
Jan
-18
May
-18
Sep
-18
Jan
-19
May
-19
Sep
-19
Jan
-20
May
-20
Sep
-20
Jan
-21
May
-21
Sep
-21
Steel
90
110
130
150
170
Jan
-17
May
-17
Sep
-17
Jan
-18
May
-18
Sep
-18
Jan
-19
May
-19
Sep
-19
Jan
-20
May
-20
Sep
-20
Jan
-21
May
-21
Sep
-21
Aluminum
90
100
110
120
130
140
150
Jan
-17
May
-17
Sep
-17
Jan
-18
May
-18
Sep
-18
Jan
-19
May
-19
Sep
-19
Jan
-20
May
-20
Sep
-20
Jan
-21
May
-21
Sep
-21
Plastic
50
70
90
110
130
150
170
190
Jan
-17
May
-17
Sep
-17
Jan
-18
May
-18
Sep
-18
Jan
-19
May
-19
Sep
-19
Jan
-20
May
-20
Sep
-20
Jan
-21
May
-21
Sep
-21
Petroleum
90
95
100
105
110
115
120
Jan
-17
May
-17
Sep
-17
Jan
-18
May
-18
Sep
-18
Jan
-19
May
-19
Sep
-19
Jan
-20
May
-20
Sep
-20
Jan
-21
May
-21
Sep
-21
Health Benefits
90
95
100
105
110
115
120
Jan
-17
May
-17
Sep
-17
Jan
-18
May
-18
Sep
-18
Jan
-19
May
-19
Sep
-19
Jan
-20
May
-20
Sep
-20
Jan
-21
May
-21
Sep
-21
Auto Parts
Source: BLS

16CENTER FOR AUTOMOTIVE RESEARCH
1-year and 10-year treasury yields and recessions
0.00
2.00
4.00
6.00
8.00
10.00
12.00
14.00
16.00
18.00
1976 1979 1982 1985 1988 1991 1994 1997 2000 2003 2006 2009 2012 2015 2018 2021
Bo
nd
Yie
ld R
ate,
%
recession 10-year 1-year
Source: Federal Reserve Economic Research
1-year and 10-year Treasury Yields and Recessions1976 – 2021 YTD

CENTER FOR AUTOMOTIVE RESEARCH
Housing and Credit

18CENTER FOR AUTOMOTIVE RESEARCH
U.S. Housing Starts and Auto Sales
0.0
5.0
10.0
15.0
20.0
25.0
0
500
1,000
1,500
2,000
2,500
Ligh
t V
ehic
le S
ale
s (M
illio
ns
SAA
R)
New
Pri
vate
ly O
wn
ed H
ou
sin
g U
nit
s St
arts
(Th
ou
san
ds
SAA
R)
Housing Starts Auto Sales
Source: U.S. Census Bureau and U.S. Department of Housing and Urban Development, New Privately-Owned Housing Units Started: Total Units
U.S. Housing Starts and Auto SalesJuly 2001 – September 2021

19CENTER FOR AUTOMOTIVE RESEARCH
Consumer Credit and Light Vehicle SAAR
-25.00
-20.00
-15.00
-10.00
-5.00
0.00
5.00
10.00
15.00
20.00
25.00
0
5
10
15
20
25
Jan
-01
Au
g-0
1
Mar
-02
Oct
-02
May
-03
Dec
-03
Jul-
04
Feb
-05
Sep
-05
Ap
r-0
6
No
v-0
6
Jun
-07
Jan
-08
Au
g-0
8
Mar
-09
Oct
-09
May
-10
Dec
-10
Jul-
11
Feb
-12
Sep
-12
Ap
r-1
3
No
v-1
3
Jun
-14
Jan
-15
Au
g-1
5
Mar
-16
Oct
-16
May
-17
Dec
-17
Jul-
18
Feb
-19
Sep
-19
Ap
r-2
0
No
v-2
0
Jun
-21
% C
hg.
Of
Co
nsu
me
r C
red
it
Ligh
t V
ehic
le S
ales
Light Vehicle Sales SAAR Percent Change of Consumer Credit
Source: Federal Reserve Statistical Release, G.19, Consumer Credit; Automotive News SAAR
Consumer Credit and Light Vehicle SAARJanuary 2001 – September 2021

CENTER FOR AUTOMOTIVE RESEARCH
Gasoline Price and Market Share

21CENTER FOR AUTOMOTIVE RESEARCH
U.S. Market Shares of Passenger Cars and CUVs/SUVs and Real Gasoline Price
Cars: 80.5%
Cars: 23.0%CUVs/SUVs: 1.4%
CUVs/SUVs: 54.7%
0.00
1.00
2.00
3.00
4.00
5.00
6.00
0
10
20
30
40
50
60
70
80
90
19
80
19
81
19
82
19
83
19
84
19
85
19
86
19
87
19
88
19
89
19
90
19
91
19
92
19
93
19
94
19
95
19
96
19
97
19
98
19
99
20
00
20
01
20
02
20
03
20
04
20
05
20
06
20
07
20
08
20
09
20
10
20
11
20
12
20
13
20
14
20
15
20
16
20
17
20
18
20
19
20
20
20
21
YTD
Rea
l Gas
olin
e P
rice
Mar
ket
Shar
e in
Per
cen
tage
Real Gasoline Price Passenger Cars SUVs/CUVs
Source: Wards Intelligence
U.S. Market Shares of Passenger Cars and CUVs/SUVs and Real Gasoline Price1980 – 2021 YTD

22CENTER FOR AUTOMOTIVE RESEARCH
U.S. Market Shares of Passenger Cars, CUVs/SUVs, and Pickups
Cars: 80.5%
Cars: 21.2%SUVs: 1.4%
SUVs: 54.0%
Pickups: 17.8%0
10
20
30
40
50
60
70
80
90
19
80
19
81
19
82
19
83
19
84
19
85
19
86
19
87
19
88
19
89
19
90
19
91
19
92
19
93
19
94
19
95
19
96
19
97
19
98
19
99
20
00
20
01
20
02
20
03
20
04
20
05
20
06
20
07
20
08
20
09
20
10
20
11
20
12
20
13
20
14
20
15
20
16
20
17
20
18
20
19
20
20
20
21
YTD
Mar
ket
Shar
e in
Per
cen
tage
Passenger Cars SUVs/CUVs Pickups
Source: Wards Intelligence
U.S. Market Shares of Passenger Cars, CUVs/SUVs, and Pickups1980 – 2021 YTD
CENTER FOR AUTOMOTIVE RESEARCH
Consumer Confidence

24CENTER FOR AUTOMOTIVE RESEARCH
Household Net Worth and Vehicle Sales
0
2
4
6
8
10
12
14
16
18
20
1975 1980 1985 1990 1995 2000 2005 2010 2015 2020
0
20
40
60
80
100
120
140
160
Ligh
t V
ehic
le S
ales
Ho
use
ho
ld N
et W
ort
h in
Tri
llio
ns
Light Vehicle Sales Household Net Worth
Source: Federal Reserve Statistical Release , Z.1, Flow of Funds Accounts of the United States
Household Net Worth and Vehicle Sales1978 – Q2 2021

25CENTER FOR AUTOMOTIVE RESEARCH
Consumer Confidence & Sentiment
0
20
40
60
80
100
120
140
160
Jan
-07
May
-07
Sep
-07
Jan
-08
May
-08
Sep
-08
Jan
-09
May
-09
Sep
-09
Jan
-10
May
-10
Sep
-10
Jan
-11
May
-11
Sep
-11
Jan
-12
May
-12
Sep
-12
Jan
-13
May
-13
Sep
-13
Jan
-14
May
-14
Sep
-14
Jan
-15
May
-15
Sep
-15
Jan
-16
May
-16
Sep
-16
Jan
-17
May
-17
Sep
-17
Jan
-18
May
-18
Sep
-18
Jan
-19
May
-19
Sep
-19
Jan
-20
May
-20
Sep
-20
Jan
-21
May
-21
Sep
-21
Consumer Confidence Index UofM Consumer Sentiment Index
Source: The Consumer Confidence Survey, conducted for the Conference Board; Federal Reserve Economic Data
Consumer Confidence & SentimentJanuary 2007 – September 2021

CENTER FOR AUTOMOTIVE RESEARCH
Business Cycles and Industry Trend

27CENTER FOR AUTOMOTIVE RESEARCH
US Business Cycles Months of Expansion Since 1945
3745
39
24
106
36
58
12
92
120
73
128
0
20
40
60
80
100
120
140
Oct 1945 -Nov 1948
Oct 1949 -July 1953
May 1954 -Aug 1957
Apr 1958 -Apr 1960
Feb 1961 -Dec 1969
Nov 1970 -Nov 1973
Mar 1975 -Jan 1980
Jul 1980 - Jul1981
Nov 1982 - Jul1990
Mar 1991 -Mar 2001
Nov 2001 -Dec 2007
Jun 2009 -Feb 2020
Mo
nth
s o
f Ex
pan
sio
n
Average Duration of Expansion: 64 Months
Source: National Bureau of Economic Research
US Business Cycles Months of Expansion Since 1945Quarterly, 1945-2021
28CENTER FOR AUTOMOTIVE RESEARCH
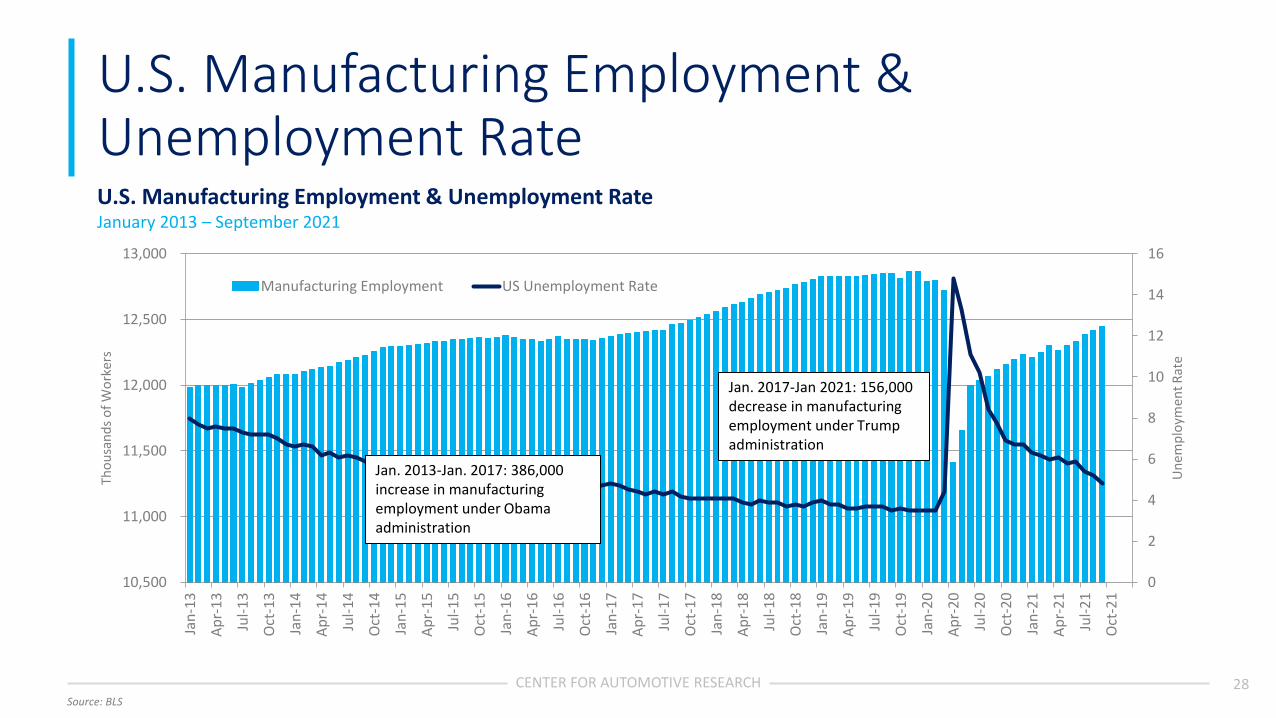
U.S. Manufacturing Employment & Unemployment Rate
0
2
4
6
8
10
12
14
16
10,500
11,000
11,500
12,000
12,500
13,000
Jan
-13
Ap
r-1
3
Jul-
13
Oct
-13
Jan
-14
Ap
r-1
4
Jul-
14
Oct
-14
Jan
-15
Ap
r-1
5
Jul-
15
Oct
-15
Jan
-16
Ap
r-1
6
Jul-
16
Oct
-16
Jan
-17
Ap
r-1
7
Jul-
17
Oct
-17
Jan
-18
Ap
r-1
8
Jul-
18
Oct
-18
Jan
-19
Ap
r-1
9
Jul-
19
Oct
-19
Jan
-20
Ap
r-2
0
Jul-
20
Oct
-20
Jan
-21
Ap
r-2
1
Jul-
21
Oct
-21
Un
em
plo
yme
nt
Rat
e
Tho
usa
nd
s o
f W
ork
ers
Manufacturing Employment US Unemployment Rate
Jan. 2013-Jan. 2017: 386,000 increase in manufacturing employment under Obama administration
Jan. 2017-Jan 2021: 156,000 decrease in manufacturing employment under Trump administration
Source: BLS
U.S. Manufacturing Employment & Unemployment RateJanuary 2013 – September 2021

CENTER FOR AUTOMOTIVE RESEARCH
Auto Finance and Debt

30CENTER FOR AUTOMOTIVE RESEARCH
Weighted Average New Car Loans Maturity
30
35
40
45
50
55
60
65
70
75
30
35
40
45
50
55
60
65
70
75
2Q
19
71
4Q
19
72
2Q
19
74
4Q
19
75
2Q
19
77
4Q
19
78
2Q
19
80
4Q
19
81
2Q
19
83
4Q
19
84
2Q
19
86
4Q
19
87
2Q
19
89
4Q
19
90
2Q
19
92
4Q
19
93
2Q
19
95
4Q
19
96
2Q
19
98
4Q
19
99
2Q
20
01
4Q
20
02
2Q
20
04
4Q
20
05
2Q
20
07
4Q
20
08
2Q
20
10
4Q
20
11
2Q
20
13
4Q
20
14
2Q
20
16
4Q
20
17
2Q
20
19
4Q
20
20
Mo
nth
s
Maturity of New Car Loans at Auto Finance Companies Maturity of New Car Loans at Finance Companies
Source: Federal Reserve Economic Research and Data, G.19 Consumer Credit
Weighted Average New Car Loans Maturity1971 – Q2 2021

31CENTER FOR AUTOMOTIVE RESEARCH
Finance Rate at Auto Finance Companies and Commercial Banks
0
2
4
6
8
10
12
14
16
18
20
1Q
19
78
1Q
19
79
1Q
19
80
1Q
19
81
1Q
19
82
1Q
19
83
1Q
19
84
1Q
19
85
1Q
19
86
1Q
19
87
1Q
19
88
1Q
19
89
1Q
19
90
1Q
19
91
1Q
19
92
1Q
19
93
1Q
19
94
1Q
19
95
1Q
19
96
1Q
19
97
1Q
19
98
1Q
19
99
1Q
20
00
1Q
20
01
1Q
20
02
1Q
20
03
1Q
20
04
1Q
20
05
1Q
20
06
1Q
20
07
1Q
20
08
1Q
20
09
1Q
20
10
1Q
20
11
1Q
20
12
1Q
20
13
1Q
20
14
1Q
20
15
1Q
20
16
1Q
20
17
1Q
20
18
1Q
20
19
1Q
20
20
1Q
20
21
Auto Finance Companies Commercial Banks
Finance Rate at Auto Finance Companies and Commercial Banks1978 – Q2 2021
Source: Federal Reserve Economic Research and Data, G.19 Consumer Credit

32CENTER FOR AUTOMOTIVE RESEARCH
Households are Carrying More Debt
-
500
1,000
1,500
2,000
2,500
3,000
3,500
4,000
4,500
-
200
400
600
800
1,000
1,200
1,400
1,600
1Q
20
03
1Q
20
04
1Q
20
05
1Q
20
06
1Q
20
07
1Q
20
08
1Q
20
09
1Q
20
10
1Q
20
11
1Q
20
12
1Q
20
13
1Q
20
14
1Q
20
15
1Q
20
16
1Q
20
17
1Q
20
18
1Q
20
19
1Q
20
20
1Q
20
21
Tota
l in
Bill
ion
$
Deb
t in
Bill
ion
$
Student Loans Auto Loans Credit Card Other Total
Source: FRBNY Consumer Credit Panel/Equifax
*Excludes mortgage and home equity line of credit
Household Non-Housing Debt Q1 2003 – Q2 2021

33CENTER FOR AUTOMOTIVE RESEARCH
Household Mortgage and Home Equity Debt
-
2,000
4,000
6,000
8,000
10,000
12,000
1Q
20
03
1Q
20
04
1Q
20
05
1Q
20
06
1Q
20
07
1Q
20
08
1Q
20
09
1Q
20
10
1Q
20
11
1Q
20
12
1Q
20
13
1Q
20
14
1Q
20
15
1Q
20
16
1Q
20
17
1Q
20
18
1Q
20
19
1Q
20
20
1Q
20
21
De
bt
in B
illio
n $
Mortgage Home Equity Loans
Source: FRBNY Consumer Credit Panel/Equifax
Household Mortgage and Home Equity DebtQ1 2003 – Q2 2021

CENTER FOR AUTOMOTIVE RESEARCH
Vehicle Sales Outlook

35CENTER FOR AUTOMOTIVE RESEARCH
2021 U.S. Sales Forecasts:Units in Millions
15.8 (9/21)
15.5 (10/21)
15.7 (9/21)
15.6 (9/21)
15.0 (9/21)
15.2 (10/21)
15.5 (10/21)
CENTER FOR AUTOMOTIVE RESEARCH
Concluding Remarks:
What is “Normal” anymore??

37CENTER FOR AUTOMOTIVE RESEARCH
Concluding Remarks
What is “Normal” anymore??
• CY21 SAAR outlook = 15.47m consensus (subject to downward revision)
• Supply chain and logistics issues to remain into 2022
• U.S. consumer outlook improves, although vehicle sales recovery skewed