Embed Size (px)
Citation preview
Received: 4 September 2018 Revised: 8 March 2019 Accepted: 6 April 2019
DOI: 10.1111/exsy.12418
S P E C I A L I S S U E P A P E R
Authoring tools for creating 360 multisensoryvideos—Evaluation of different interfaces
Hugo Coelho1 Miguel Melo1 Luís Barbosa1,2 José Martins1,2
Mário Sérgio Teixeira2 Maximino Bessa1,2
1INESC TEC, Porto, Portugal2University of Trás-os-Montes and Alto
Douro, Vila Real, Portugal
Correspondence
Hugo Coelho, INESC TEC MASSIVE VR
Laboratory, ECT Polo I, UTAD, Quinta de
Prados, Vila Real, 5000-801 Portugal.
Email: [email protected]
Funding information
European Regional Development Fund,
Grant/Award Number:
NORTE-01-0145-FEDER-000014
Abstract
Authoring 360 multisensory videos is a true challenge as the authoring tools available are
scarce and restrictive. In this paper, we propose an authoring tool with three different authoring
interfaces (desktop, immersive, and tangible interface) for creating multisensory 360 videos with
the advantage of having a live preview of the multisensory content that is being produced. An
evaluation of the three authoring tools having into account gender, system usability, presence,
satisfaction, and effectiveness (time to accomplish tasks, number of errors, and number of help
requests) is presented. The sample consisted of 48 participants (24 males and 24 females) evenly
distributed between the different interfaces (8 males and 8 females for each interface).
The results revealed that gender does not have any impact in the studied interfaces regarding
all the dependent variables; immersive and tangible interfaces have higher levels of satisfaction
than desktop interface as it allows more interaction freedom, and desktop interface have the
lowest time to accomplish the tasks because people are more familiar with keyboard and mouse.
KEYWORDS
authoring tools, multisensory content, tangible interfaces, virtual reality, 360 video
1 INTRODUCTION
Nowadays, virtual reality (VR) is growing significantly and is becoming more popular, and one of the main reasons for this to happen is because
it allows the user to be the main actor in another environment (Fuchs, Moreau, & Guitton, 2011) and develop the feeling of being there as they
interact with the virtual environment (VE; Schubert, Friedmann, & Regenbrecht, 2001). There are studies that show us VR is used in different
areas including medicine (Seymour et al., 2002), first responders (Wilkerson, Avstreih, Gruppen, Beier, & Woolliscroft, 2008), or even tourism
(Guttentag, 2010), bringing some advantages such as reducing cost to train people to do a specific task, safely training people for hazardous
environments (de Visser, Watson, Salvado, & Passenger, 2011), or simply transporting people to another environment for recreation purposes
(Manghisi et al., 2017).
Even though there are a lot of areas where VR is adopted, the majority of VR applications rely only on the visual and audio stimuli. If we want
to make the users feel like they are in the real world, we need to increase the number of stimuli present in a VR application (Knill & Richards,
1996). Knill and Richards (1996) said that in increasing the number of stimuli given, the user starts to react in the same way as they would react in
a real environment and starts to believe that the VE is real. This approach of adding multisensory content to VR applications is not cost-effective
as most of the time, it takes more than one iteration to make it credible (Coelho et al., 2018), meaning that there are no authoring tools for VR
that are mature enough to be adopted.
The development of authoring tools for VR that allow the users to be more productive and help them in the authoring process is important
because it allows the content creators to focus on the primary objectives of the VR application such as user interaction and experience.
An important aspect is that such a tool should not have usability failures and should be intuitive and easy to interact with. Using usability
questionnaires helps developers to assess the developed tools to find failure points and correct the same. Usability questionnaires measure the
Expert Systems. 2019;e12418. wileyonlinelibrary.com/journal/exsy © 2019 John Wiley & Sons, Ltd. 1 of 10https://doi.org/10.1111/exsy.12418

2 of 10 COELHO ET AL.
effectiveness (accuracy and completeness by which the users can achieve the objectives), efficiency (resources used to achieve the goals), and
satisfaction (comfort and acceptability of the system used to achieve the goals; Melo, Rocha, Barbosa, & Bessa, 2016).
In this paper, we extend previous work by Coelho et al. (2018) and propose an authoring tool for multisensory VR applications that
contemplates three different interfaces to create multisensory content: desktop interface, immersive interface, and immersive interface
with a tangible interface. We evaluated each one of them considering gender and having as metrics usability, presence, satisfaction, and
efficiency.
This paper is structured as follows: Section 2 is about the main concepts and some of the products already developed. Section 3 will present
the proposal of the authoring tools, Section 4 will present the methodology and procedures used in the evaluation, and Section 5 is the statistical
reports of the results obtained. Section 6 consists of the discussion of the authoring tools proposed having into account the results obtained and
the state-of-the-art and our work. Lastly, Section 7 presents the conclusions of the present study.
2 STATE-OF-THE-ART
VR aims towards having the user feel and react as if they were in the real world, which brings us to two important concepts: immersion and
presence. Immersion is related to the equipment used to provide stimuli to the user; this equipment should be able to give the sensation of
the stimuli depicted in the VR scene as if it was in the real world. Presence is the feeling of being part of the VE as if you were in the real
environment (Fuchs et al., 2011). The sense of presence can be influenced by different variables such as sociodemographic factors (e.g., gender,
age, and previous experience; Coluccia & Louse, 2004; Linn & Petersen, 1985; Schuemie, Van Der Straaten, Krijn, & Van Der Mast; 2001) or
technology (e.g., devices used; Bowman & McMahan, 2007). Both concepts may differ depending on the gender because females have a more
natural response when they experience computer-generated content, whereas males have a more natural response to captured content (Coluccia
& Louse, 2004; Linn & Petersen, 1985).
Mujber, Szecsi, and Hashmi (2004) categorized VR into three categories based on the setup features: nonimmersive, semi-immersive, and fully
immersive. The first category refers to mice, keyboards, or joysticks. The semi-immersive category includes setups based on large displays with
space balls or data gloves as input devices. The third category uses cave automatic virtual environments or head-mounted displays (HMDs) to
present the content to the user and uses specific controllers or voice commands as input to the system.
To allow fully immersive applications to interact with the VE, new ways to interact emerged such as controllers; these are also called tangible
interfaces. These interfaces can be divided into four categories: tangible interfaces for augmented reality, interaction with a tangible desk,
environment visualization, and incorporated interfaces (Shaer & Hornecker, 2009). Tangible interfaces for augmented reality use real objects with
markers so that the system can recognize the object. Studies are saying that if cognition and perception are closely interlinked, the learnability
might change the way they perceive an object (Marshall, 2007). Tangible desks use touch to interact with the VE giving haptic feedback to the
user, as in the case of ReactTable used by music producers (Kaltenbrunner, Jorda, Geiger, & Alonso, 2006). Environment visualization uses the
systems called cave automatic virtual environment to display the VE in the walls without requiring HMDs (Greenberg & Fitchett, 2001). The last
concept, incorporated interfaces, is used in everyday activities to facilitate task accomplishments (Cafaro, Lyons, Radinsky, & Roberts, 2010).
These interfaces use real objects to interact with VE, bringing the advantages of the feedback is given right when the user touches the object and
allowing interaction between multiple users at the same time (Sylla, Branco, Coutinho, & Coquet, 2009). This approach can bring some difficulties
such as the following: how big the object needs to be, what to do when losing track of the object, and how the data will be represented in the
object (Shaer & Hornecker, 2009). Desktop versus VR comparison was already performed in a navigational task, such as in Sousa Santos et al.
(2009), which reported that people had high values of satisfaction in VE that on the desktop.
Regarding tools for authoring 360 videos or multisensory applications, there is the THETA+, the Adobe tool included in the Creative Cloud, and
the Autopano from Kolor. THETA+1 is an application developed by Theta360 targeting mobile devices (Android and iOS) that allows its user to edit
360 videos, namely, to apply filters, do some image correction, apply different views (mirror ball, little planet, and flat or straight), and crop videos.
The Adobe company has adapted their products in the pack Creative Cloud2 so that they support VR. In those applications, some plugins allow
the user to create transitions, add text to the video, and even put on an HMD and see what the project looks like in VR; one limitation is that it
only allows the user to see the project and does not allow him to change the project in VR.
Another company that already adapted their products to use VR is Kolor.3 This company has applications, such as Autopano, that allow the
user to merge videos from multiple cameras to make one 360 videos, and now it allows to see the stitching in real time and adjust accordingly to
the user preference, but it has the same limitation as Adobe Creative Cloud—it does not allow to make changes in VR.
When making a new software proposal, usability is one key metric to evaluate if the system is usable by the final user. Usability questionnaires
are an option to assess the efficacy (precision of which the user can perform their goals), effectiveness (number of errors, help requests, and
time to finish tasks), and satisfaction of the user and can give an insight of what to improve on that tool. Several questionnaires can assess the
1 https://theta360.com/en/about/application/edit.html2 https://www.adobe.com/creativecloud/video/360- vr- video- tools.html3 http://www.kolor.com/gopro- vr- player/
COELHO ET AL. 3 of 10
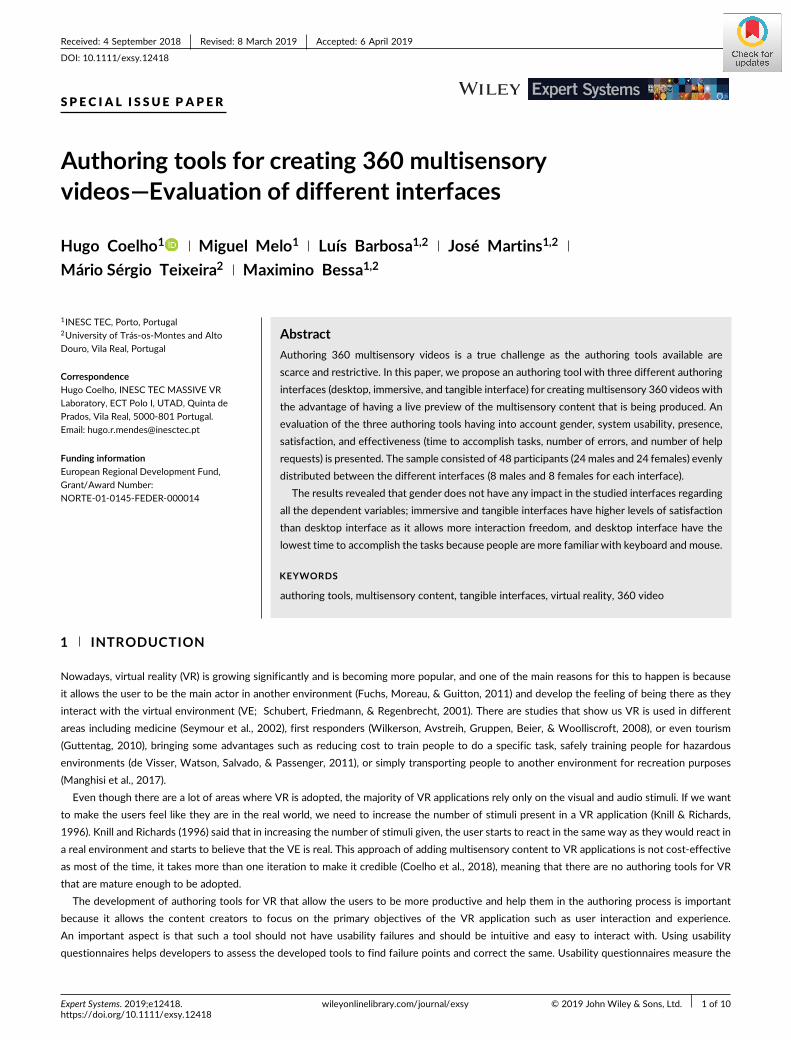
FIGURE 1 Experimental apparatus: (a) wind nozzles; (b) smell nozzles; (c) visual and audio; and (d) transducer (adapted from Coelho et al., 2018)
usability of an application such as System Usability Scale (SUS; Brooke, 1996), Software Usability Measurement Inventor (Kirakowski & Corbett,
1993), and Questionnaire for User Interaction Satisfaction (Harper & Norman, 1993). The most common one is the SUS questionnaire because it
allows evaluating if the application has problems regarding usability. The score of this questionnaire goes from 0 to 100 and is divided into three
percentiles: F percentile, C percentile, and A percentile (Brooke, 1996). The application is in the F percentile if it gets a score below 51, meaning
that the application has problems that need to be solved; above 68 is the C percentile, and 68 is the minimum score so that the application is
considered as satisfactory. An application is classified as A percentile if the score is above 80.3; with this score, it is more likely that the users
recommend that application to other users. The problem with the SUS questionnaire is that it does not measure the satisfaction of the user. Thus,
one should complement the evaluation with satisfaction questionnaires such as the After-Scenario Questionnaire (ASQ; Lewis, 1990), which
evaluates the satisfaction of the user after finishing the software usage.
To the best of our knowledge, there are only two applications that allow the creation of a project with several stimuli, which are the work of
Freitas, Meira, Melo, Barbosa, and Bessa (2015) and Coelho et al. (2018). The first paper presents a new way to add the different stimuli in a
project without coding and an application to play the project created evaluating the ease of use and learnability. One major limitation of this
approach is that the user creating the project cannot adjust the intensity of the stimulus in real time and cannot play the project and see the
result in real time. The second one performs a usability evaluation to a desktop application that allows the user to create multisensory content
and to play the project on demand.
Using as reference the work of Coelho et al. (2018), which consisted of a desktop authoring tool to create and edit immersive multisensory
360 video experiences using a conventional keyboard and mouse interface, one extends their proposal and puts forward two novel interfaces for
authoring multisensory experiences tool with the goal of contributing for the improvement of the authoring process of such applications.
3 PROPOSAL OF AUTHORING TOOLS
The present work has as reference the work done by Coelho et al. (2018) and proposes two novel interfaces for the authoring of multisensory
experiences: immersive and tangible interfaces. The interface used as the reference is the desktop application with two main views: the main
view and the stimuli view. The main view is the starting point where the user can select the video, play, pause, or stop it and select if he or she
wants to add/edit/remove a stimulus. He or she can also see the timeline of all stimuli already created as well as a small preview of the 360 video
in the current frame. In the stimuli view, the user can select which type of stimulus he or she wants to add and all variables of the given stimulus
with the possibility of testing it, as seen in Figure 1.
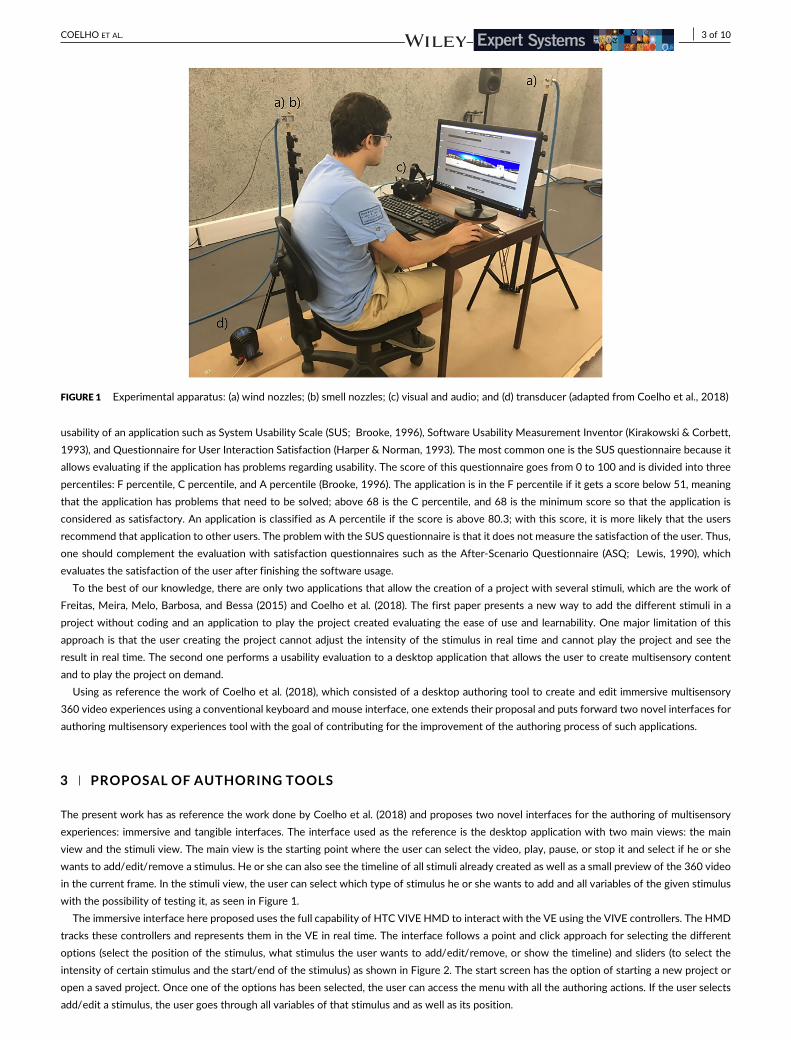
The immersive interface here proposed uses the full capability of HTC VIVE HMD to interact with the VE using the VIVE controllers. The HMD
tracks these controllers and represents them in the VE in real time. The interface follows a point and click approach for selecting the different
options (select the position of the stimulus, what stimulus the user wants to add/edit/remove, or show the timeline) and sliders (to select the
intensity of certain stimulus and the start/end of the stimulus) as shown in Figure 2. The start screen has the option of starting a new project or
open a saved project. Once one of the options has been selected, the user can access the menu with all the authoring actions. If the user selects
add/edit a stimulus, the user goes through all variables of that stimulus and as well as its position.
4 of 10 COELHO ET AL.
FIGURE 2 Screenshot of a user using the immersive interface
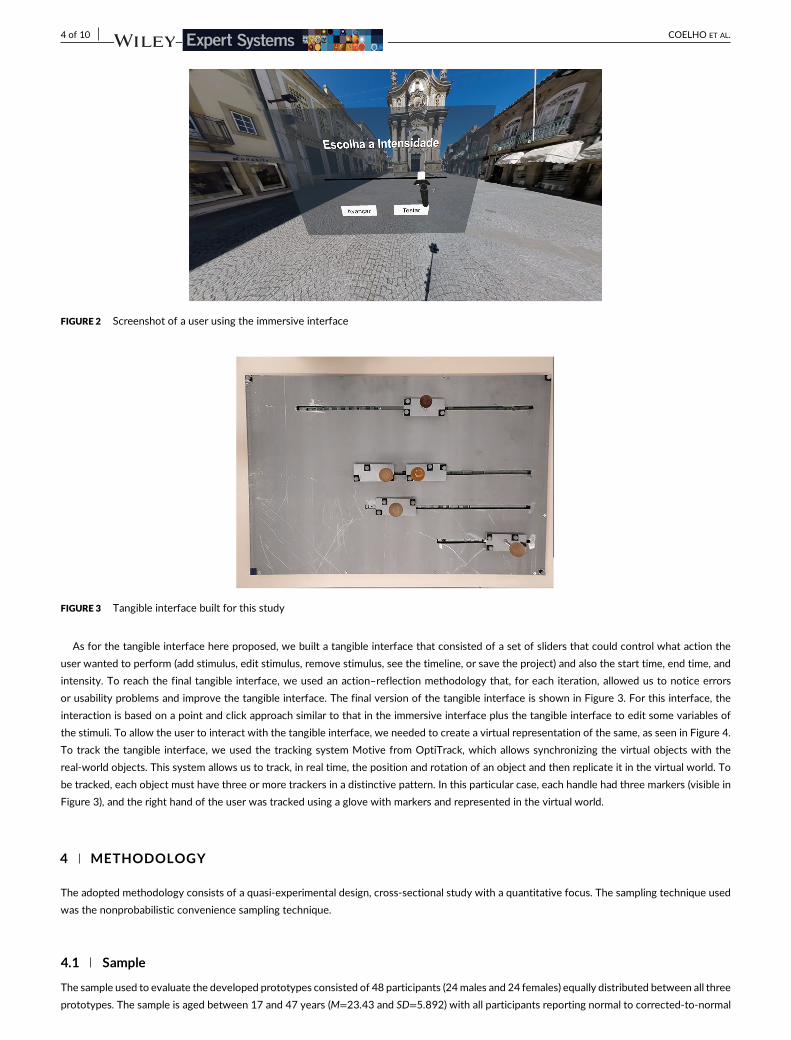
FIGURE 3 Tangible interface built for this study
As for the tangible interface here proposed, we built a tangible interface that consisted of a set of sliders that could control what action the
user wanted to perform (add stimulus, edit stimulus, remove stimulus, see the timeline, or save the project) and also the start time, end time, and
intensity. To reach the final tangible interface, we used an action–reflection methodology that, for each iteration, allowed us to notice errors
or usability problems and improve the tangible interface. The final version of the tangible interface is shown in Figure 3. For this interface, the
interaction is based on a point and click approach similar to that in the immersive interface plus the tangible interface to edit some variables of
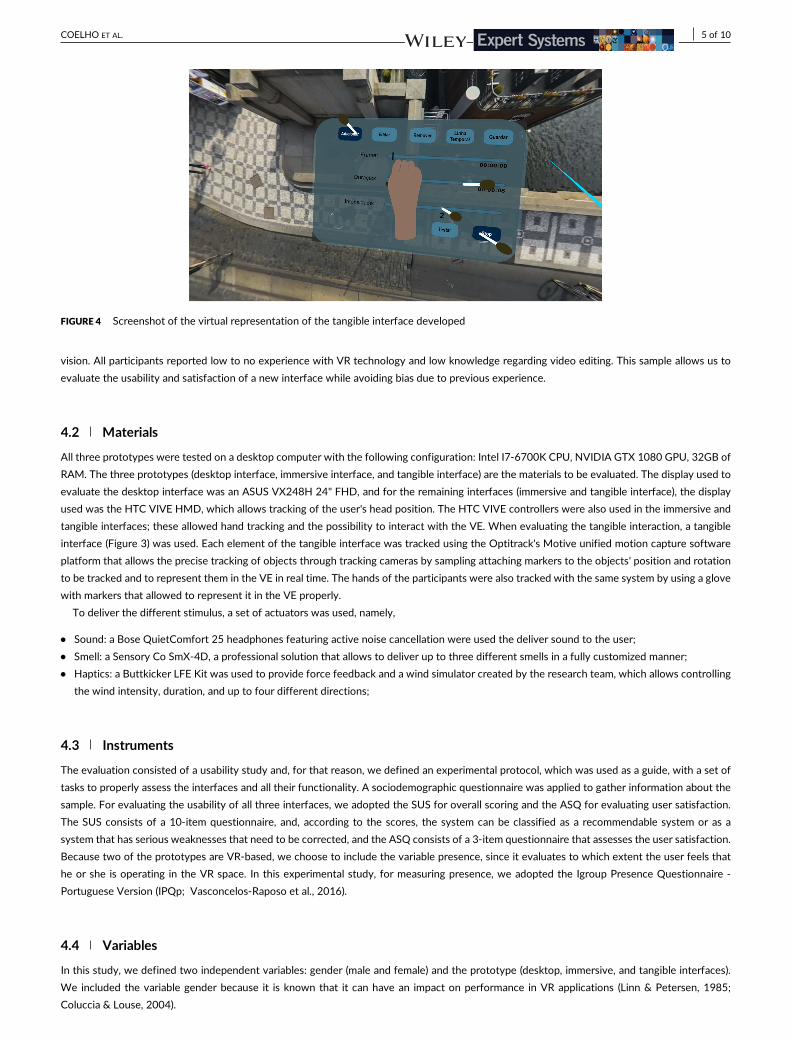
the stimuli. To allow the user to interact with the tangible interface, we needed to create a virtual representation of the same, as seen in Figure 4.
To track the tangible interface, we used the tracking system Motive from OptiTrack, which allows synchronizing the virtual objects with the
real-world objects. This system allows us to track, in real time, the position and rotation of an object and then replicate it in the virtual world. To
be tracked, each object must have three or more trackers in a distinctive pattern. In this particular case, each handle had three markers (visible in
Figure 3), and the right hand of the user was tracked using a glove with markers and represented in the virtual world.
4 METHODOLOGY
The adopted methodology consists of a quasi-experimental design, cross-sectional study with a quantitative focus. The sampling technique used
was the nonprobabilistic convenience sampling technique.
4.1 Sample
The sample used to evaluate the developed prototypes consisted of 48 participants (24 males and 24 females) equally distributed between all three
prototypes. The sample is aged between 17 and 47 years (M=23.43 and SD=5.892) with all participants reporting normal to corrected-to-normal
COELHO ET AL. 5 of 10
FIGURE 4 Screenshot of the virtual representation of the tangible interface developed
vision. All participants reported low to no experience with VR technology and low knowledge regarding video editing. This sample allows us to
evaluate the usability and satisfaction of a new interface while avoiding bias due to previous experience.
4.2 Materials
All three prototypes were tested on a desktop computer with the following configuration: Intel I7-6700K CPU, NVIDIA GTX 1080 GPU, 32GB of
RAM. The three prototypes (desktop interface, immersive interface, and tangible interface) are the materials to be evaluated. The display used to
evaluate the desktop interface was an ASUS VX248H 24" FHD, and for the remaining interfaces (immersive and tangible interface), the display
used was the HTC VIVE HMD, which allows tracking of the user's head position. The HTC VIVE controllers were also used in the immersive and
tangible interfaces; these allowed hand tracking and the possibility to interact with the VE. When evaluating the tangible interaction, a tangible
interface (Figure 3) was used. Each element of the tangible interface was tracked using the Optitrack's Motive unified motion capture software
platform that allows the precise tracking of objects through tracking cameras by sampling attaching markers to the objects' position and rotation
to be tracked and to represent them in the VE in real time. The hands of the participants were also tracked with the same system by using a glove
with markers that allowed to represent it in the VE properly.
To deliver the different stimulus, a set of actuators was used, namely,
• Sound: a Bose QuietComfort 25 headphones featuring active noise cancellation were used the deliver sound to the user;
• Smell: a Sensory Co SmX-4D, a professional solution that allows to deliver up to three different smells in a fully customized manner;
• Haptics: a Buttkicker LFE Kit was used to provide force feedback and a wind simulator created by the research team, which allows controlling
the wind intensity, duration, and up to four different directions;
4.3 Instruments
The evaluation consisted of a usability study and, for that reason, we defined an experimental protocol, which was used as a guide, with a set of
tasks to properly assess the interfaces and all their functionality. A sociodemographic questionnaire was applied to gather information about the
sample. For evaluating the usability of all three interfaces, we adopted the SUS for overall scoring and the ASQ for evaluating user satisfaction.
The SUS consists of a 10-item questionnaire, and, according to the scores, the system can be classified as a recommendable system or as a
system that has serious weaknesses that need to be corrected, and the ASQ consists of a 3-item questionnaire that assesses the user satisfaction.
Because two of the prototypes are VR-based, we choose to include the variable presence, since it evaluates to which extent the user feels that
he or she is operating in the VR space. In this experimental study, for measuring presence, we adopted the Igroup Presence Questionnaire -
Portuguese Version (IPQp; Vasconcelos-Raposo et al., 2016).
4.4 Variables
In this study, we defined two independent variables: gender (male and female) and the prototype (desktop, immersive, and tangible interfaces).
We included the variable gender because it is known that it can have an impact on performance in VR applications (Linn & Petersen, 1985;
Coluccia & Louse, 2004).
6 of 10 COELHO ET AL.
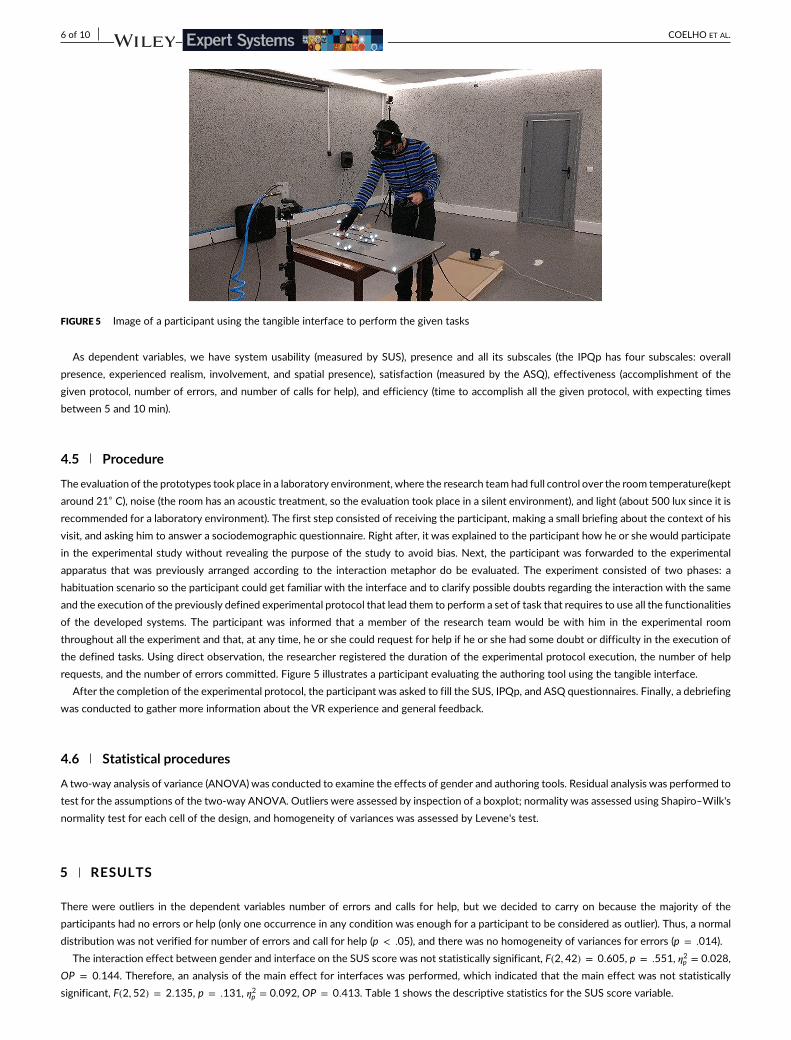
FIGURE 5 Image of a participant using the tangible interface to perform the given tasks
As dependent variables, we have system usability (measured by SUS), presence and all its subscales (the IPQp has four subscales: overall
presence, experienced realism, involvement, and spatial presence), satisfaction (measured by the ASQ), effectiveness (accomplishment of the
given protocol, number of errors, and number of calls for help), and efficiency (time to accomplish all the given protocol, with expecting times
between 5 and 10 min).
4.5 Procedure
The evaluation of the prototypes took place in a laboratory environment, where the research team had full control over the room temperature(kept
around 21◦ C), noise (the room has an acoustic treatment, so the evaluation took place in a silent environment), and light (about 500 lux since it is
recommended for a laboratory environment). The first step consisted of receiving the participant, making a small briefing about the context of his
visit, and asking him to answer a sociodemographic questionnaire. Right after, it was explained to the participant how he or she would participate
in the experimental study without revealing the purpose of the study to avoid bias. Next, the participant was forwarded to the experimental
apparatus that was previously arranged according to the interaction metaphor do be evaluated. The experiment consisted of two phases: a
habituation scenario so the participant could get familiar with the interface and to clarify possible doubts regarding the interaction with the same
and the execution of the previously defined experimental protocol that lead them to perform a set of task that requires to use all the functionalities
of the developed systems. The participant was informed that a member of the research team would be with him in the experimental room
throughout all the experiment and that, at any time, he or she could request for help if he or she had some doubt or difficulty in the execution of
the defined tasks. Using direct observation, the researcher registered the duration of the experimental protocol execution, the number of help
requests, and the number of errors committed. Figure 5 illustrates a participant evaluating the authoring tool using the tangible interface.
After the completion of the experimental protocol, the participant was asked to fill the SUS, IPQp, and ASQ questionnaires. Finally, a debriefing
was conducted to gather more information about the VR experience and general feedback.
4.6 Statistical procedures
A two-way analysis of variance (ANOVA) was conducted to examine the effects of gender and authoring tools. Residual analysis was performed to
test for the assumptions of the two-way ANOVA. Outliers were assessed by inspection of a boxplot; normality was assessed using Shapiro–Wilk's
normality test for each cell of the design, and homogeneity of variances was assessed by Levene's test.
5 RESULTS
There were outliers in the dependent variables number of errors and calls for help, but we decided to carry on because the majority of the
participants had no errors or help (only one occurrence in any condition was enough for a participant to be considered as outlier). Thus, a normal
distribution was not verified for number of errors and call for help (p < .05), and there was no homogeneity of variances for errors (p = .014).
The interaction effect between gender and interface on the SUS score was not statistically significant, F(2,42) = 0.605, p = .551, 𝜂2p = 0.028,
OP = 0.144. Therefore, an analysis of the main effect for interfaces was performed, which indicated that the main effect was not statistically
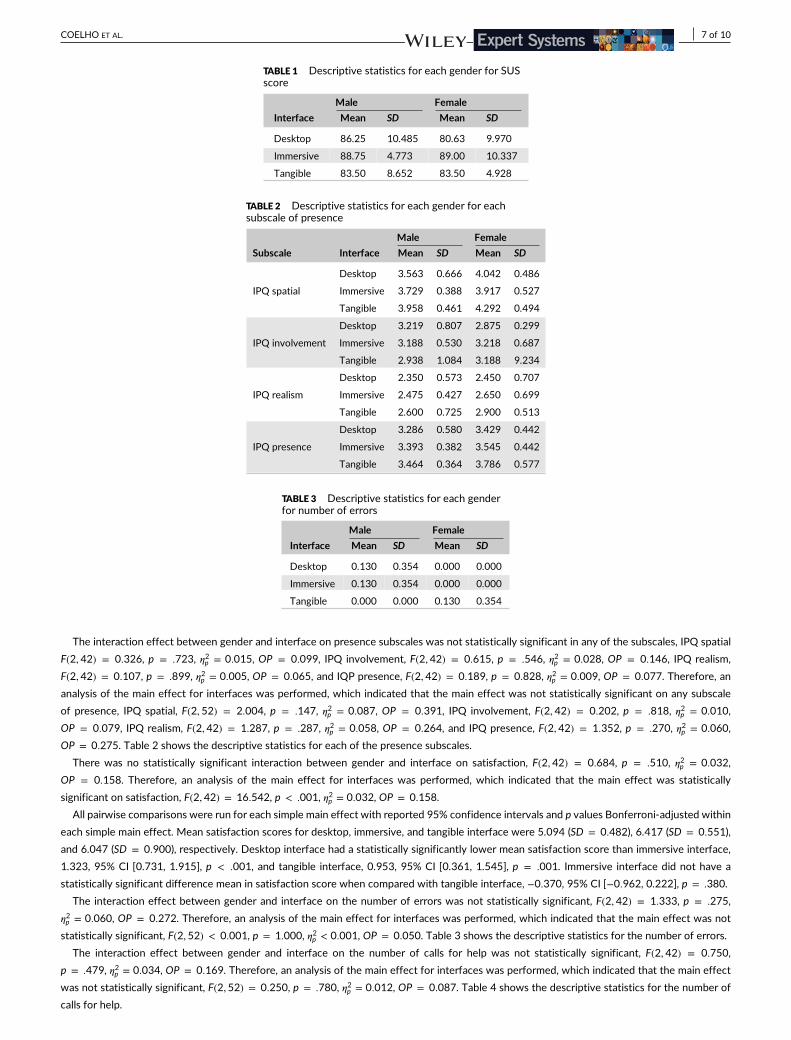
significant, F(2,52) = 2.135, p = .131, 𝜂2p = 0.092, OP = 0.413. Table 1 shows the descriptive statistics for the SUS score variable.
COELHO ET AL. 7 of 10
TABLE 1 Descriptive statistics for each gender for SUSscore
Male Female
Interface Mean SD Mean SD
Desktop 86.25 10.485 80.63 9.970
Immersive 88.75 4.773 89.00 10.337
Tangible 83.50 8.652 83.50 4.928
TABLE 2 Descriptive statistics for each gender for eachsubscale of presence
Male Female
Subscale Interface Mean SD Mean SD
Desktop 3.563 0.666 4.042 0.486
IPQ spatial Immersive 3.729 0.388 3.917 0.527
Tangible 3.958 0.461 4.292 0.494
Desktop 3.219 0.807 2.875 0.299
IPQ involvement Immersive 3.188 0.530 3.218 0.687
Tangible 2.938 1.084 3.188 9.234
Desktop 2.350 0.573 2.450 0.707
IPQ realism Immersive 2.475 0.427 2.650 0.699
Tangible 2.600 0.725 2.900 0.513
Desktop 3.286 0.580 3.429 0.442
IPQ presence Immersive 3.393 0.382 3.545 0.442
Tangible 3.464 0.364 3.786 0.577
TABLE 3 Descriptive statistics for each genderfor number of errors
Male Female
Interface Mean SD Mean SD
Desktop 0.130 0.354 0.000 0.000
Immersive 0.130 0.354 0.000 0.000
Tangible 0.000 0.000 0.130 0.354
The interaction effect between gender and interface on presence subscales was not statistically significant in any of the subscales, IPQ spatial
F(2,42) = 0.326, p = .723, 𝜂2p = 0.015, OP = 0.099, IPQ involvement, F(2,42) = 0.615, p = .546, 𝜂2
p = 0.028, OP = 0.146, IPQ realism,
F(2,42) = 0.107, p = .899, 𝜂2p = 0.005, OP = 0.065, and IQP presence, F(2,42) = 0.189, p = 0.828, 𝜂2
p = 0.009, OP = 0.077. Therefore, an
analysis of the main effect for interfaces was performed, which indicated that the main effect was not statistically significant on any subscale
of presence, IPQ spatial, F(2,52) = 2.004, p = .147, 𝜂2p = 0.087, OP = 0.391, IPQ involvement, F(2,42) = 0.202, p = .818, 𝜂2
p = 0.010,
OP = 0.079, IPQ realism, F(2,42) = 1.287, p = .287, 𝜂2p = 0.058, OP = 0.264, and IPQ presence, F(2,42) = 1.352, p = .270, 𝜂2
p = 0.060,
OP = 0.275. Table 2 shows the descriptive statistics for each of the presence subscales.
There was no statistically significant interaction between gender and interface on satisfaction, F(2,42) = 0.684, p = .510, 𝜂2p = 0.032,
OP = 0.158. Therefore, an analysis of the main effect for interfaces was performed, which indicated that the main effect was statistically
significant on satisfaction, F(2,42) = 16.542, p < .001, 𝜂2p = 0.032, OP = 0.158.
All pairwise comparisons were run for each simple main effect with reported 95% confidence intervals and p values Bonferroni-adjusted within
each simple main effect. Mean satisfaction scores for desktop, immersive, and tangible interface were 5.094 (SD = 0.482), 6.417 (SD = 0.551),
and 6.047 (SD = 0.900), respectively. Desktop interface had a statistically significantly lower mean satisfaction score than immersive interface,
1.323, 95% CI [0.731, 1.915], p < .001, and tangible interface, 0.953, 95% CI [0.361, 1.545], p = .001. Immersive interface did not have a
statistically significant difference mean in satisfaction score when compared with tangible interface, −0.370, 95% CI [−0.962, 0.222], p = .380.
The interaction effect between gender and interface on the number of errors was not statistically significant, F(2,42) = 1.333, p = .275,
𝜂2p = 0.060, OP = 0.272. Therefore, an analysis of the main effect for interfaces was performed, which indicated that the main effect was not
statistically significant, F(2,52) < 0.001, p = 1.000, 𝜂2p < 0.001, OP = 0.050. Table 3 shows the descriptive statistics for the number of errors.
The interaction effect between gender and interface on the number of calls for help was not statistically significant, F(2,42) = 0.750,
p = .479, 𝜂2p = 0.034, OP = 0.169. Therefore, an analysis of the main effect for interfaces was performed, which indicated that the main effect
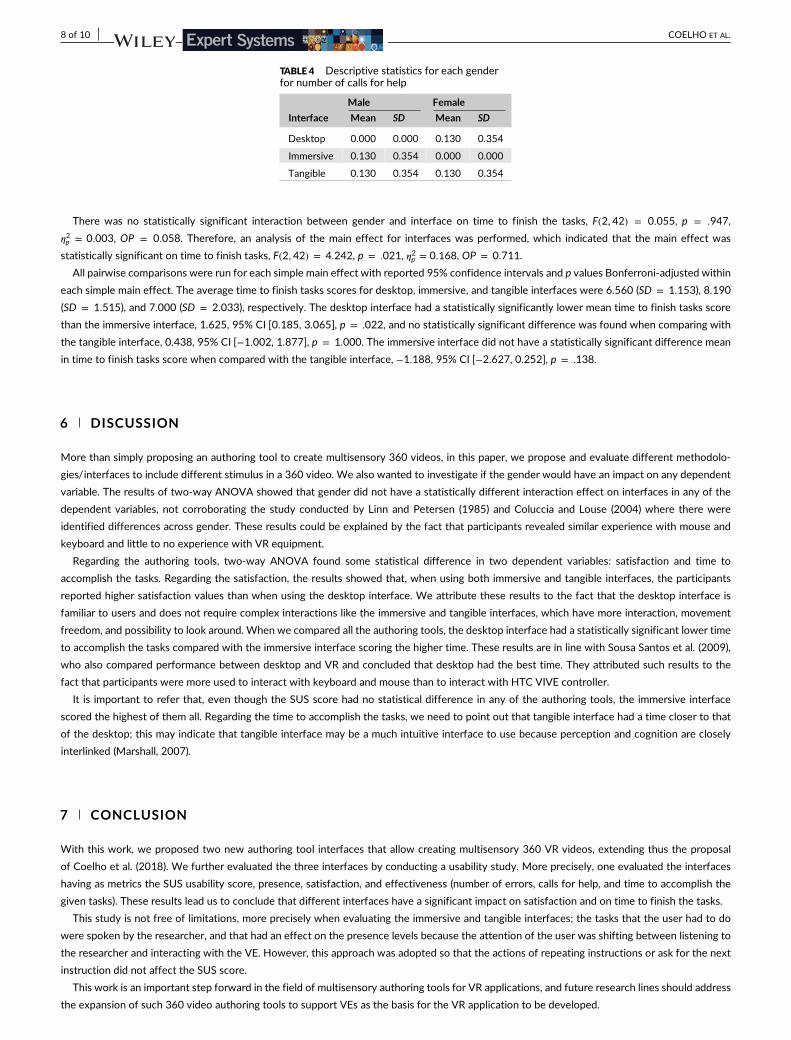
was not statistically significant, F(2,52) = 0.250, p = .780, 𝜂2p = 0.012, OP = 0.087. Table 4 shows the descriptive statistics for the number of
calls for help.
8 of 10 COELHO ET AL.
TABLE 4 Descriptive statistics for each genderfor number of calls for help
Male Female
Interface Mean SD Mean SD
Desktop 0.000 0.000 0.130 0.354
Immersive 0.130 0.354 0.000 0.000
Tangible 0.130 0.354 0.130 0.354
There was no statistically significant interaction between gender and interface on time to finish the tasks, F(2,42) = 0.055, p = .947,
𝜂2p = 0.003, OP = 0.058. Therefore, an analysis of the main effect for interfaces was performed, which indicated that the main effect was
statistically significant on time to finish tasks, F(2,42) = 4.242, p = .021, 𝜂2p = 0.168, OP = 0.711.
All pairwise comparisons were run for each simple main effect with reported 95% confidence intervals and p values Bonferroni-adjusted within
each simple main effect. The average time to finish tasks scores for desktop, immersive, and tangible interfaces were 6.560 (SD = 1.153), 8.190
(SD = 1.515), and 7.000 (SD = 2.033), respectively. The desktop interface had a statistically significantly lower mean time to finish tasks score
than the immersive interface, 1.625, 95% CI [0.185, 3.065], p = .022, and no statistically significant difference was found when comparing with
the tangible interface, 0.438, 95% CI [−1.002, 1.877], p = 1.000. The immersive interface did not have a statistically significant difference mean
in time to finish tasks score when compared with the tangible interface, −1.188, 95% CI [−2.627, 0.252], p = .138.
6 DISCUSSION
More than simply proposing an authoring tool to create multisensory 360 videos, in this paper, we propose and evaluate different methodolo-
gies/interfaces to include different stimulus in a 360 video. We also wanted to investigate if the gender would have an impact on any dependent
variable. The results of two-way ANOVA showed that gender did not have a statistically different interaction effect on interfaces in any of the
dependent variables, not corroborating the study conducted by Linn and Petersen (1985) and Coluccia and Louse (2004) where there were
identified differences across gender. These results could be explained by the fact that participants revealed similar experience with mouse and
keyboard and little to no experience with VR equipment.
Regarding the authoring tools, two-way ANOVA found some statistical difference in two dependent variables: satisfaction and time to
accomplish the tasks. Regarding the satisfaction, the results showed that, when using both immersive and tangible interfaces, the participants
reported higher satisfaction values than when using the desktop interface. We attribute these results to the fact that the desktop interface is
familiar to users and does not require complex interactions like the immersive and tangible interfaces, which have more interaction, movement
freedom, and possibility to look around. When we compared all the authoring tools, the desktop interface had a statistically significant lower time
to accomplish the tasks compared with the immersive interface scoring the higher time. These results are in line with Sousa Santos et al. (2009),
who also compared performance between desktop and VR and concluded that desktop had the best time. They attributed such results to the
fact that participants were more used to interact with keyboard and mouse than to interact with HTC VIVE controller.
It is important to refer that, even though the SUS score had no statistical difference in any of the authoring tools, the immersive interface
scored the highest of them all. Regarding the time to accomplish the tasks, we need to point out that tangible interface had a time closer to that
of the desktop; this may indicate that tangible interface may be a much intuitive interface to use because perception and cognition are closely
interlinked (Marshall, 2007).
7 CONCLUSION
With this work, we proposed two new authoring tool interfaces that allow creating multisensory 360 VR videos, extending thus the proposal
of Coelho et al. (2018). We further evaluated the three interfaces by conducting a usability study. More precisely, one evaluated the interfaces
having as metrics the SUS usability score, presence, satisfaction, and effectiveness (number of errors, calls for help, and time to accomplish the
given tasks). These results lead us to conclude that different interfaces have a significant impact on satisfaction and on time to finish the tasks.
This study is not free of limitations, more precisely when evaluating the immersive and tangible interfaces; the tasks that the user had to do
were spoken by the researcher, and that had an effect on the presence levels because the attention of the user was shifting between listening to
the researcher and interacting with the VE. However, this approach was adopted so that the actions of repeating instructions or ask for the next
instruction did not affect the SUS score.
This work is an important step forward in the field of multisensory authoring tools for VR applications, and future research lines should address
the expansion of such 360 video authoring tools to support VEs as the basis for the VR application to be developed.
COELHO ET AL. 9 of 10
ACKNOWLEDGEMENTS
This work was also partially supported by the project ‘‘DOUROTUR, Turismo e Inovação Tecnológica no Douro/NORTE-01-0145-FEDER-000014’’
financed by the North Portugal Regional Operational Programme (NORTE 2020), under the PORTUGAL 2020 Partnership Agreement, and
through the European Regional Development Fund (ERDF). All the works were conducted at INESCTEC's MASSIVE VR Laboratory.
CONFLICT OF INTEREST
The authors declare that there is no conflict of interest regarding the publication of this paper.
ORCID
Hugo Coelho https://orcid.org/0000-0003-4227-6198
REFERENCES
Bowman, D. A., & McMahan, R. P. (2007). Virtual reality: How much immersion is enough? Computer, 40(7), 36–43. https://doi.org/10.1109/MC.2007.257
Brooke, J. (1996). SUS—A quick and dirty usability scale. Usability Evaluation in Industry, 189(194), 4–7. CRC Press. ISBN: 9780748404605.
Cafaro, F., Lyons, L., Radinsky, J., & Roberts, J. (2010). RFID localization for tangible and embodied multi-user interaction with museum exhibits.In Proceedings of the 12th ACMInternational Conference Adjunct Papers on Ubiquitous Computing - UbiComp ′10 ACM Press, ACM, New York, NY, USA,pp. 397–398. https://doi.org/10.1145/1864431.1864455
Coelho, H., Melo, M., Barbosa, L., Martins, J., Sérgio, M., & Bessa, M. (2018). Immersive edition of multisensory 360 videos. In Rocha, Á., Adeli, H., Reis,L. P., & Costanzo, S. (Eds.), Trends and advances in information systems and technologies (Vol. 746, 309–318). Cham: Springer International Publishing.https://doi.org/10.1007/978-3-319-77712-2_30
Coluccia, E., & Louse, G. (2004). Gender differences in spatial orientation: A review. Journal of Environmental Psychology, 24(3), 329–340. https://doi.org/10.1016/j.jenvp.2004.08.006
de Visser, H., Watson, M. O., Salvado, O., & Passenger, J. D. (2011). Progress in virtual reality simulators for surgical training and certification. The MedicalJournal of Australia, 194(4), S38–40.
Freitas, J., Meira, C., Melo, M., Barbosa, L., & Bessa, M. (2015). Information system for the management and visualization of multisensorial contents. In 201510th Iberian Conference on Information Systems and Technologies (CISTI), IEEE, Aveiro, Portugal, pp. 1–7. https://doi.org/10.1109/cisti.2015.7170495
Fuchs, P., Moreau, G., & Guitton, P. (2011). Virtual reality: Concepts and technologies (1st ed.). London, UK: CRC Press.
Greenberg, S., & Fitchett, C. (2001). Phidgets: Easy development of physical interfaces through physical widgets. In Proceedings of the 14th Annual ACMSymposium on User Interface Software and Technology - UIST '01, UIST '01, ACM Press, New York, NY, USA, pp. 209–218. https://doi.org/10.1145/502348.502388
Guttentag, D. A. (2010). Virtual reality: Applications and implications for tourism. Tourism Management, 31(5), 637–651. https://doi.org/10.1016/j.tourman.2009.07.003
Harper, B. D., & Norman, K. L. (1993). Improving user satisfaction: The questionnaire for user interaction satisfaction version 5.5. In Proceedings of the 1stAnnual Mid-Atlantic Human Factors Conference, Virginia Beach, Virginia, USA, pp. 224–228.
Kaltenbrunner, M., Jorda, S., Geiger, G., & Alonso, M. (2006). The reacTable*: A collaborative musical instrument. In 15th IEEE International Workshopson Enabling Technologies: Infrastructure for Collaborative Enterprises (WETICE'06), IEEE, Manchester, UK, pp. 406–411. https://doi.org/10.1109/wetice.2006.68
Kirakowski, J., & Corbett, M. (1993). SUMI: The software usability measurement inventory. British Journal of Educational Technology, 24(3), 210–212.https://doi.org/10.1111/j.1467-8535.1993.tb00076.x
Knill, D. C., & Richards, W. (1996). Perception as Bayesian Inference. Cambridge, London, UK: CAMBRIDGE UNIV PR.
Lewis, J. R. (1990). Psychometric evaluation of an after-scenario questionnaire for computer usability studies. ACM SIGCHI Bulletin, 23(1), 78–81. https://doi.org/10.1145/122672.122692
Linn, M. C., & Petersen, A. C. (1985). Emergence and characterization of sex differences in spatial ability: A meta-analysis. Child Development, 56, 1479–98.
Manghisi, V. M., Fiorentino, M., Gattullo, M., Boccaccio, A., Bevilacqua, V., Cascella, G. L., ... Uva, A. E. (2017). Experiencing the sights, smells, sounds, andclimate of southern Italy in VR. IEEE Computer Graphics and Applications, 37(6), 19–25. https://doi.org/10.1109/MCG.2017.4031064
Marshall, P. (2007). Do tangible interfaces enhance learning? In Proceedings of the 1st International Conference on Tangible and Embedded Interaction - TEI'07, ACM, New York, NY, USA, pp. 163–170. https://doi.org/10.1145/1226969.1227004
Melo, M., Rocha, T., Barbosa, L., & Bessa, M. (2016). The impact of body position on the usability of multisensory virtual environments: Case study ofa virtual bicycle. In Proceedings of the 7th International Conference on Software Development and Technologies for Enhancing Accessibility and FightingInfo-Exclusion - DSAI 2016, DSAI 2016, ACM Press, New York, NY, USA, pp. 20–24. https://doi.org/10.1145/3019943.3019947
Mujber, T. S., Szecsi, T., & Hashmi, M. S. J. (2004). Virtual reality applications in manufacturing process simulation. Journal of Materials Processing Technology,155-156, 1834–1838. Proceedings of the International Conference on Advances in Materials and Processing Technologies: Part 2 https://doi.org/10.1016/j.jmatprotec.2004.04.401
Schubert, T., Friedmann, F., & Regenbrecht, H. (2001). The experience of presence: Factor analytic insights. Presence: Teleoperators and Virtual Environments,10(3), 266–281. https://doi.org/10.1162/105474601300343603
Schuemie, M. J., Van Der Straaten, P., Krijn, M., & Van Der Mast, C. A. (2001). Research on presence in virtual reality: A survey. CyberPsychology & Behavior,4(2), 183–201. https://doi.org/10.1089/109493101300117884
Seymour, N. E., Gallagher, A. G., Roman, S. A., O'Brien, M. K., Bansal, V. K., Andersen, D. K., & Satava, R. M. (2002). Virtual reality training improvesoperating room performance: Results of a randomized, double-blinded study. Annals of Surgery, 236, 458–63; discussion 463–4.

10 of 10 COELHO ET AL.
Shaer, O., & Hornecker, E. (2009). Tangible user interfaces: Past, present, and future directions. Foundations and Trends® in Human–Computer Interaction,3(1-2), 1–137. https://doi.org/10.1561/1100000026
Sousa Santos, B., Dias, P., Pimentel, A., Baggerman, J.-W., Ferreira, C., Silva, S., & Madeira, J. (2009). Head-mounted display versus desktop for 3Dnavigation in virtual reality: A user study. Multimedia Tools and Applications, 41(1), 161–181. https://doi.org/10.1007/s11042-008-0223-2
Sylla, C., Branco, P., Coutinho, C., & Coquet, M. E. (2009). Storytelling through drawings: Evaluating tangible interfaces for children. In Proceedings of the27th International Conference Extended Abstracts on Human Factors in Computing Systems - CHI EA '09, ACM Press, New York, NY, USA, pp. 3461–3466.https://doi.org/10.1145/1520340.1520503
Vasconcelos-Raposo, J., Bessa, M., Melo, M., Barbosa, L., Rodrigues, R., Teixeira, C. M., ... Sousa, A. A. (2016). Adaptation and validation of the igrouppresence questionnaire (IPQ) in a Portuguese sample. Presence: Teleoperators and Virtual Environments, 25(3), 191–203. https://doi.org/10.1162/PRES_a_00261
Wilkerson, W., Avstreih, D., Gruppen, L., Beier, K.-P., & Woolliscroft, J. (2008). Using immersive simulation for training first responders for mass casualtyincidents. Academic Emergency Medicine, 15(11), 1152–1159. https://doi.org/10.1111/j.1553-2712.2008.00223.x
AUTHOR BIOGRAPHIES
Hugo Coelho is an MSc in Computer Science by the University of Trás-os-Montes e Alto Douro (UTAD), Vila Real, Portugal, where he
acquired his bachelor's degree in 2015. His research interests are mainly Multisensory Virtual Reality.
Miguel Melo is a post-doc researcher at INESC TEC, specialized in computer graphics. He is manager of the Multisensory Virtual Reality
Laboratory, and his research interests are computer graphics, HDR, and multisensory virtual reality.
Luís Barbosa is a computer science teacher at the engineering department of the University of Trás-os-Montes e Alto Douro, Portugal.
He obtained his PhD degree in Computer Science from the University of Trás-os-Montes e Alto Douro whose dissertation theme was
‘‘Teaching Support Information Systems - The Case Study of the portal SIDE from UTAD.’’ His area of interest and research are mainly
information systems, multisensory virtual environments, and interaction and has participated in several related research projects.
José Martins is currently at invited assistant professor at the University of Trás-os-Montes and Alto Douro, Invited Assistant at the
Polytechnic Institute of Bragança and Integrated Member of INESC TEC research center. He has published over 50 articles in indexed
journals and event proceedings. Currently, he is supervisor for several masters degree dissertations and PhD thesis. During his research
career, he has participated in several research projects and is currently a member of various research projects aimed at merging information
systems and technologies with other fields of study. During his professional career, José has also worked as an information systems and
technologies senior consultant where he directly participated in several international projects. At the present time, José Martins dedicates
most of his time to his lectures and to his research activities where he tries to understand the variables and (in)direct impacts of ICT
adoption at individual and firm levels.
Mário Sérgio Teixeira is Professor at UTAD — University of Trás-os-Montes e Alto Douro. He received his PhD degree in Management
from the University of Trás-os-Montes e Alto Douro and his MSc and MBA from Lisbon MBA. His main research interests are connected
with marketing, strategic management, and entrepreneurship. His research has been published and presented in a variety of outlets,
including international marketing review, New Medit, RISTI, and Conferences as EMAC, WCIST, and Academy of Marketing.
Maximino Bessa is Assistant Professor, with Habilitation, of the Department of Engineering of the University of Trás-os-Montes and Alto
Douro, Portugal, Senior Researcher of INESC TEC since 2009 and Director of the Multisensory Virtual Reality Laboratory MASSIVE. He
is member of the Eurographics Association since 2003 and vice-president of the Portuguese Computer Graphics Chapter for the period
2016-2018.
How to cite this article: Coelho H, Melo M, Barbosa L, Martins J, Teixeira MS, Bessa M. Authoring tools for creating 360 multisensory
videos—Evaluation of different interfaces. Expert Systems. 2019;e12418. https://doi.org/10.1111/exsy.12418