Embed Size (px)
Citation preview

Australian Cities: Liveable and Sustainable?
Professor Peter NewtonInstitute for Social ResearchSwinburne University of Technology, Melbourne
Presentation to NatStats 2010 ConferenceSydney, 16 September 2010
Session: Sustainable Communities in a Global Context

21st CENTURY ≠ 20th CENTURY:LIVING IN A CROWDED, URBAN WORLD
City Research
InfrastructureThe Urban Age
1900
1.7People(Billion)
% Living in Cities 10%
CitiesGreater than1 Million 16
2007
6.5
50%
450
2050
9.0
75%
600

21st CENTURY SETTLEMENT TREND :THE RISE AND RISE OF THE MEGA-METROPOLITAN REGION
> The nation’s key economic engines generating 75% of national economic activity
(Allen Consulting, 2002)
> Key demographic attractors / absorbers, forecast to accommodate 80% of nation’s additional expected population 2002 – 2011 (Approximately 1.5 out of 1.9 million)
> Key governance challenge

Objectives for Future Australian Cities (COAG, Dec.2009)
“The future strategic planning of cities should ensure that cities are: globally competitive, productive, environmentally sustainable, liveable and socially inclusive and are well placed to meet future challenges and growth”.
COAG Minister’s Meeting, Dec. 2009

A Plethora of City Performance Indicators
City Indicators:
•Productivity
•Sustainability
•Liveability
•Social Inclusion

Measuring Australia’s Progress
Source: ABS (2009)

Model for Delivering Sustainable Urban Development
Source: Newton (2006)

City Liveability Rating (Economist Intelligence Unit)
SOURCE: EIU (2009)
Category 1: Stability (25%) Category 2: Healthcare (20%)
Category 3: Culture & Environment (25%) Category 4: Education (10%)
Category 5: Infrastructure (20%)

Liveability Ratings of Australian Cities 2009
SOURCE: EIU (2009)

Linkages between Liveability and Competitiveness
Source: VCEC (2008)

MEASURING URBAN PERFORMANCE : LIVEABILITY _ SUSTAINABILITY NEXUS
Liveability – Sustainability Nexus ?

Ecological Footprint of Australia’s Capital Cities
City Ecological Footprint(ha per person)
Sydney 6.6
Melbourne 6.4
Brisbane 6.7
Perth 7.4
Adelaide 6.8
Canberra 7.0
Hobart 5.7
Darwin 7.1
Australia 6.5
World 2.2
= 3+ Planet Living
Per Capita Resource Consumption
Source: Turner & Foran (2008)

The Liveability-Sustainability Nexus -- 2010
LiveabilityMean 76.18St.Dev: 17.34
Ecological FootprintMean: 4.39St.Dev: 2.83
Source:Newton(2010)

Liveability – Sustainability Quadrants
Source: Newton (2010)

Liveability – Sustainability Quadrants
Source: Newton (2010)

21st Century Challenge for High Income Societies
Maintain Liveability
AND
Wind Back
Unsustainable Consumption

Pathways to More Sustainable Cities
> 1. Where technological innovation can deliver infrastructure for the sustainable provision of urban resources and services
• (TRANSITIONS, Springer, Dordrecht, 2008)
> 2. Where new planning and design paradigms can underpin a transition to more sustainable urban development
• (TECHNOLOGY, DESIGN & PROCESS INNOVATION IN THE BUILT ENVIRONMENT, Taylor & Francis, London, 2009)
> 3. Where interventions can be identified to trigger behaviour change among individuals and households to modify their patterns of resource consumption
• (LANDSCAPES OF URBAN CONSUMPTION, CSIRO Publishing, 2011)

Technological Innovation

Urban Environmental Domain
H1 H2 H3
Energy Energy efficiencies in housing and industry; house energy rating
Distributed renewable / low emission energy; methane bridge
Renewables-based solar-hydrogen economy
Water Water-smart appliances Sewer mining; water sensitive urban design
Integrated urban water systems (recycled stormwater, wastewater)
Buildings Check box system for green building design (e.g. LEED)
nBL real-time life cycle sustainability performance assessment during design – via 3D CAD and GIS
Ultra-smart buildings and linked infrastructures; embedded intelligence
Waste Product stewardship ;kerbside recycling
Extensive cradle to cradle production – single enterprise
Eco-industrial clusters as new engines for mega-metro economies
Transport &
Communications
Road pricing; telepresence via broadband communications
Hybrid vehicles; smart land use-transport planning ;high speed rail
Intelligent transport systems (ITS); integrated land use and transport; eco-mobility
Source: Newton, (2007)
3 HORIZONS OF URBAN INNOVATION

H2/3 TRANSITION TO RENEWABLE AND DISTRIBUTED ENERGY
Transition to renewable and distributed energy generation in context of national grid
EXISTING CENTRALISED INDUSTRY NEW DISTRIBUTED INDUSTRY

Transition to Renewable Energy
Source: Melbourne Energy Institute (2010)
Wind Turbines Solar Thermal

Built Environment Innovation
Innovation at Building Scale: Hybrid Buildings?

HYBRID BUILDING / PRECINCT
Energy Efficient Building
ShellEnergy Efficient
AppliancesLocal
Energy (Distributed/Embedd
ed) Generatio
nHybrid
Building / Precinct
Link to National Energy
Grid
Source: Newton & Tucker (2009) Hybrid Buildings.

DOES ENERGY EFFICIENT BUILDING DESIGN MATTER ?
Building Shell
> 2.5 to 5.0 Star =56% reduction in annual
energy use for heating
and cooling
> 5.0 to 7.0 Star =18% reduction in annual
energy use
> 2.5 to 7.0 star =74% reduction in annual
energy use (equivalent
to saving of 48,300 MJ/yr
per detached dwelling)

DO ENERGY EFFICIENT APPLIANCES MATTER ?
Built-in and Plug-in Appliances: Potential Savings with Substitution of Technology/Product
> 92% reduction in annual CO2 from hot water heating with substitution of solar thermal gas boosted for electric storage
> 28% reduction in annual CO2 from plug-in appliances (eg. TVs, refrigerators etc) with substitution of ‘best-of-breed’ for average energy efficiency
> 72% reduction in annual CO2 with shift from all electric (cooktop+oven) to all microwave kitchen
> 89% reduction in annual CO2 with shift from all halogen to all compact fluorescent lighting

LOCAL ENERGY GENERATION TECHNOLOGIES
> Photovoltaics (PV)
> Solar gas boosted thermal
> Wind
> Fuel Cell (gas, solar)
> Gas CCHP (combined cooling, heatand power)
> Ground source heat pump

NET CO2-e EMISSIONS FOR SELECTED SCENARIOS IN TRANSITION TO ZERO CARBON DWELLINGS
Net CO2-e for Hybrid buildings scenarios
47.3
9.5
2.9-0.2
-1.3
-10
0
10
20
30
40
50
Worst case 2.5star house
New 5 star house DG enhanced 2.5star house
5 star carbonneutral house
7 star zerocarbon house
CO
2-e
(t/y
r/d
wel
lin
g)
Scenarios
Melbourne average (11.1)

Policy Focus Domain Focus
Building Appliances Energy
Innovation in Technology & Design
7+ energy star rated
Smart, low energy appliances
Local renewable energy generation
Household Behaviour Change
Smaller floor space
Fewer appliances,simpler life
Energy conservation strategies; attitudes to environment, local energy systems etc
POLICY ARENASFOR GREENING THE RESIDENTIAL SECTOR

BEHAVIOUR CHANGE
PROSPECT OF CHANGING ATTITUDES, LIFESTYLES, BEHAVIOUR?

Behaviour Change: Theory and Reality

Barriers to Environmental Action
SOURCE: Living in Melbourne Survey (2009)
Ownership of Problem• Not my responsibility (22.5%)• I rent – its up to my landlord (28.5%)• It won’t help Melbourne’s environment
(19.7%)• No regulation requiring me (27.9%) Information
Shortage/Access• Lack of information (55.4%)• Can’t work out what’s best
(47.9%)Organisational Challenges• Too difficult to organise (54.6%)• Can’t work out what’s best (47.9%)• Difficult to get right trades people
(39.3%)
Time Constraints (Level of Priority)
• Planning to, but haven’t got to it yet (54.4%)
• Lack of time (51.1%)
Financial• Lack of money (68.2%)• Expense not work benefits (52.3%)• I rent – up to the landlord (28.5%)

IN CONCLUSION : DATA NEEDS
WHERE CAN ABS ASSIST ?
• LONGITUDINAL SURVEYS TO SUPPORT EVALUATION OF BEHAVIOUR CHANGE PROGRAMS, PRICING ETC.
•HARMONISING DATA COLLECTIONS FOR STATE OF ENVIRONMENT REPORTING
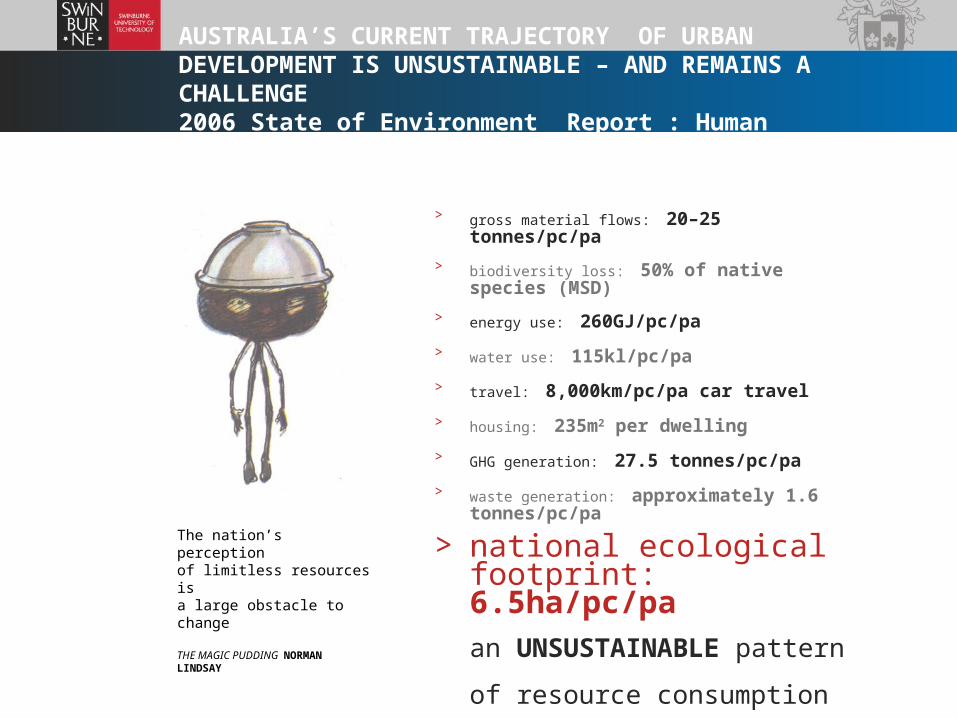
> gross material flows: 20–25 tonnes/pc/pa
> biodiversity loss: 50% of native species (MSD)
> energy use: 260GJ/pc/pa
> water use: 115kl/pc/pa
> travel: 8,000km/pc/pa car travel
> housing: 235m2 per dwelling
> GHG generation: 27.5 tonnes/pc/pa
> waste generation: approximately 1.6 tonnes/pc/pa
> national ecological footprint: 6.5ha/pc/paan UNSUSTAINABLE pattern of resource consumption
AUSTRALIA’S CURRENT TRAJECTORY OF URBAN DEVELOPMENT IS UNSUSTAINABLE – AND REMAINS A CHALLENGE 2006 State of Environment Report : Human Settlements (Newton, 2006)
The nation’s perception of limitless resources is a large obstacle to change
THE MAGIC PUDDING NORMAN LINDSAY

HOW COULD AN AUSTRALIAN STATE OF THE CITIES/STATE OF ENVIRONMENT CAPACITY EMERGE? TOWARDS A COLLABORATIVE NETWORK?
National State of the Cities / SoE ‘Reporting’
State-Level System of Data Assembly/Reporting
Regional-Level System of Data Assembly/Reporting(e.g. Metro region, provincial city region etc.)
Municipal-Level System of Data Collection, Assembly/Reporting

CONTACT Professor Peter W Newton
PHONE + 61 – 3 - 9214 4769
EMAIL [email protected]
WEB www.swinburne.edu.au
THANK YOU