Embed Size (px)
Citation preview
Auditing Incentive Compensation Plans – Risks and Conflicts
FIRMA 21st Annual Training ConferenceMonday, April 16, 2007Donald F. Moore, Jr., CEOBearmoor, LLC(719) 748-6025 [email protected]

Objectives and Goals Overview of Industry Performance Discuss Incentive Compensation
Arrangements Outline Risks and Concerns of Incentive
Compensation Plans Provide Insight into Best Practices Provide Audit Guidelines for Incentive
Compensation Plans

Auditing Compensation Plans Why is there a need to audit compensation plans
beyond base salary? Revenue and Profits – Margins and returns are why we are
in the business (i.e. shareholder value) Fairness – Incentive compensation becoming a larger
percentage of total compensation (Attract and retain talent) Consistency – Deployed and implemented as intended Applicability – Effective to meet business strategy and
goals Confidence and Trust – Among employees, clients, and the
general public Litigation Mitigation – Sales Personnel

Types of Non-Base Salary The Bonus
Position or Grade Dependent Performance Dependent (i.e. sales quota or
revenue goal) Discretionary
The Commission – Revenue for Selling The Stock Option – Incentive to achieve and
maintain
INCENTIVE COMPENSATION

Concerns and Risks Effective Compensation Plans
Department of Labor – Fairness Issues DOL OFCCP Audit
Appropriate Compensation Plans Corporate Strategy – You get what you incent, or do you?
Is there a process for reviewing the results with the desired outcome? Y or N
Incentive Compensation Plans – Major Goals Motivate Employees Make Payroll a Variable Cost
Is there a connection between individual performance and company results? Y or N
Are these expected results effectively communicated? Y or N

Concerns and Risks Fraud and Breach of Employment Contract
Confusion, Damage, and Litigation Loss of Key Performers – Sales Personnel, Relationship
Managers, Administrators, etc. Is management aware of Incentive Compensation issues as
they relate to the loss of key personnel? Y or N Centrally Managed, Controlled, and Communicated Altering Compensation Plan Mid-stream
Undermines Employee Trust If changes are made, are they communicated to all
effective personnel? Y or N Changes in Senior Management
Is the Incentive Compensation Plan reviewed and approved? Y or N

Incentive Compensation Results Does Incentive Compensation produce
measurable results?
Has the industry obtained the desired results?
What other factors can be attributed to the results?

An Example CEO Nardeli – Home Depot
Compensation Package up $210 million Stock price during tenure – down 28%
CEO Skinner – McDonald’s Compensation Package up $8.8 million Stock price during tenure – up 36%
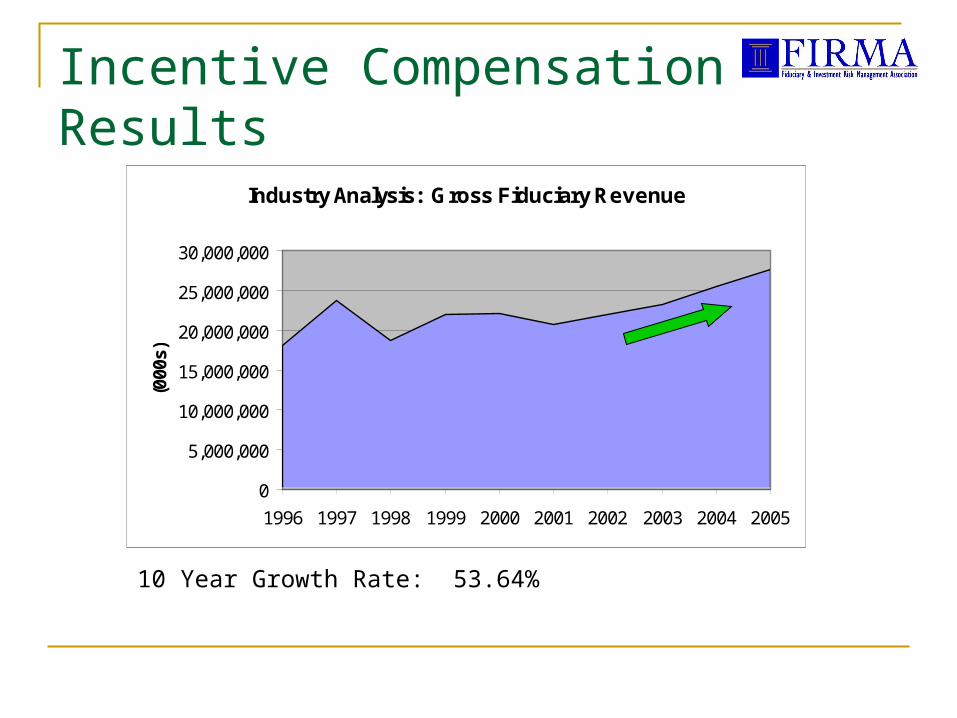
Incentive Compensation Results
Industry Analysis: Gross Fiduciary Revenue
0
5,000,000
10,000,000
15,000,000
20,000,000
25,000,000
30,000,000
1996 1997 1998 1999 2000 2001 2002 2003 2004 2005
(000
s)
10 Year Growth Rate: 53.64%

Incentive Compensation Results
Industry Analysis: Actual Expenses
0
5,000,000
10,000,000
15,000,000
20,000,000
25,000,000
1996 1997 1998 1999 2000 2001 2002 2003 2004 2005
(000
s)
10 Year Growth Rate: 30.19%

Incentive Compensation Results
Industry Analysis: Net Operating Income
01,000,0002,000,0003,000,0004,000,0005,000,0006,000,0007,000,0008,000,0009,000,000
10,000,000
1996 1997 1998 1999 2000 2001 2002 2003 2004 2005
(000
s)
10 Year Growth Rate: 157.32%

Incentive Compensation Results
Industry Analysis: Profit Margin
0.00%
5.00%
10.00%
15.00%
20.00%
25.00%
30.00%
35.00%
1996 1997 1998 1999 2000 2001 2002 2003 2004 2005
10 Year Average: 25.89%5 Year Average: 29.21%

Incentive Compensation Results
Return on Fiduciary Assets
0.00%
0.02%
0.04%
0.06%
0.08%
0.10%
0.12%
0.14%
0.16%
0.18%
0.20%
2001 2002 2003 2004 2005 2006
Decline of 27%

Incentive Compensation Results
Return on Assets Under Administration
0.00%
0.01%
0.02%
0.03%
0.04%
0.05%
0.06%
0.07%
0.08%
2001 2002 2003 2004 2005 2006
Decline of 43%
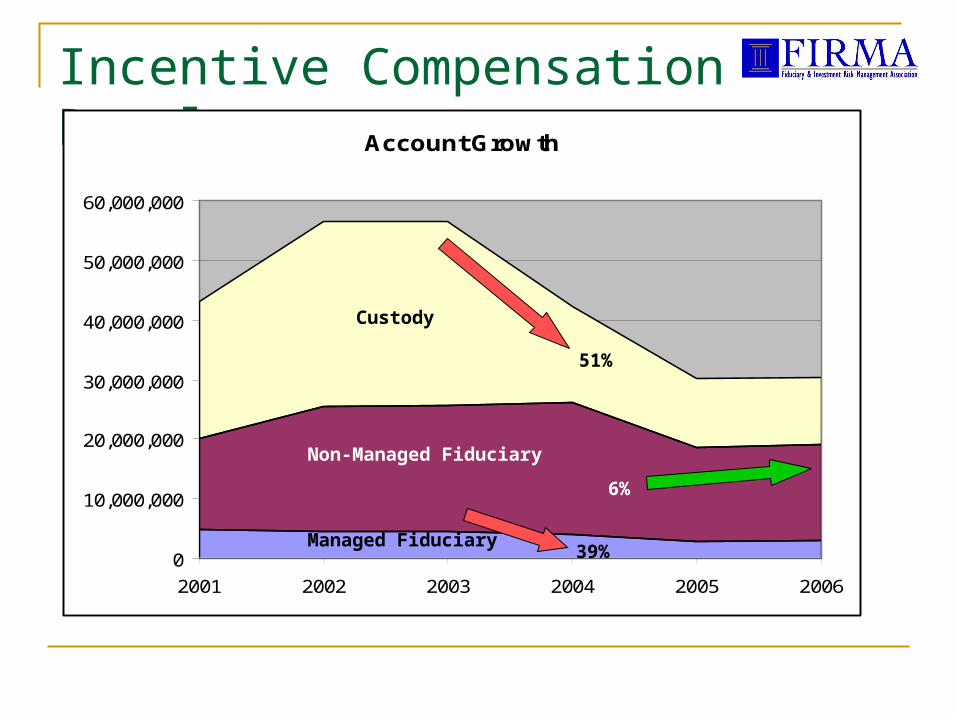
Incentive Compensation ResultsAccount Growth
0
10,000,000
20,000,000
30,000,000
40,000,000
50,000,000
60,000,000
2001 2002 2003 2004 2005 2006
Custody
Non-Managed Fiduciary
Managed Fiduciary
51%
6%
39%

Incentive Compensation ResultsAsset Growth
0
10,000,000,000
20,000,000,000
30,000,000,000
40,000,000,000
50,000,000,000
60,000,000,000
70,000,000,000
80,000,000,000
2001 2002 2003 2004 2005 2006
(000s)
Non-Managed Fiduciary
Custody
Managed Fiduciary
140%
75%
40%

Market Performance
2006 Performance Benchmarks
17.00%
16.29%
13.90%
13.62%
9.52%
5.56%
0.00% 5.00% 10.00% 15.00% 20.00%
Annual Rate of Return
Russell 2000
DJIA
Dow Jones Wilshire 5000
S & P
NASDAQ
Fid. Industry

Top 25 Metropolitan Areas
Percentage of Total U.S. Wealthy
Households*
Number of Wealthy
Households (2006)
Number of Wealthy
Households (2010)
Projected Growth
Rate
1 New York 9.13% 32,419 31,909 -1.57%2 Los Angeles 5.51% 19,543 20,466 4.72%3 Washington/Baltimore 4.20% 14,799 17,068 15.33%4 Chicago 3.70% 13,042 14,021 7.51%5 San Francisco/Bay Area 3.39% 12,034 11,925 -0.91%6 Philadelphia 2.60% 9,245 9,968 7.82%7 Boston 2.60% 9,219 9,853 6.88%8 Miami/Palm Beach 2.13% 7,568 7,875 4.06%9 Dallas/ Ft. Worth 1.95% 6,937 8,904 28.36%
10 Detroit 1.82% 6,444 6,588 2.23%11 Houston 1.70% 6,041 7,766 28.55%12 Atlanta 1.68% 5,972 7,728 29.40%13 Tampa/Sarasota 1.30% 4,616 5,480 18.72%14 Minneapolis/St. Paul 1.28% 4,560 5,397 18.36%15 Seattle-Tacoma 1.25% 4,426 4,739 7.07%16 Phoenix 1.25% 4,424 5,560 25.68%17 San Diego 1.18% 4,175 4,659 11.59%18 St. Louis 0.98% 3,477 3,808 9.52%19 Denver 0.96% 3,361 4,174 24.19%20 Sacramento 0.76% 2,705 3,409 26.03%21 Pittsburgh 0.76% 2,681 2,769 3.28%22 Cleveland 0.74% 2,638 2,578 -2.27%23 Portland, OR 0.72% 2,565 3,112 21.33%24 Cincinnati 0.72% 2,540 2,875 13.19%25 Kansas City 0.67% 2,375 2,886 21.52%
* Defined as having $2 million or more of investable assets.
Competition - Follow the Money

Competition - Follow the MoneyTop 25 Metropolitan Areas - Share of Total U.S.
Wealthy Households
9.13%
5.51%
4.20%
3.70%
3.39%
2.60%
2.60%
2.13%
1.95%
1.82%
1.70%
1.68%
1.30%
1.28%
1.25%
1.25%
1.18%
0.98%
0.96%
0.76%
0.76%
0.74%
0.72%
0.72%
0.67%
0% 2% 4% 6% 8% 10%
New York
Los Angeles
Washington/Baltimore
Chicago
San Francisco/Bay Area
Philadelphia
Boston
Miami/Palm Beach
Dallas/ Ft. Worth
Detroit
Houston
Atlanta
Tampa/Sarasota
Minneapolis/St. Paul
Seattle-Tacoma
Phoenix
San Diego
St. Louis
Denver
Sacramento
Pittsburgh
Cleveland
Portland, OR
Cincinnati
Kansas City

Competition - Follow the Money15. Seattle
23. Portland
20. Sacramento
2. Los Angeles
5. San Francisco/Bay Area
17. San Diego16. Phoenix
19. Denver
14. Minneapolis
4. Chicago
25. Kansas City
9. Dallas/Ft. Worth
11. Houston
18. St. Louis
8. Miami
13. Tampa
12. Atlanta
24. Cincinnati
22. Cleveland
10. Detroit7. Boston
1. New York
6. Philadelphia3. Washington
21. Pittsburgh
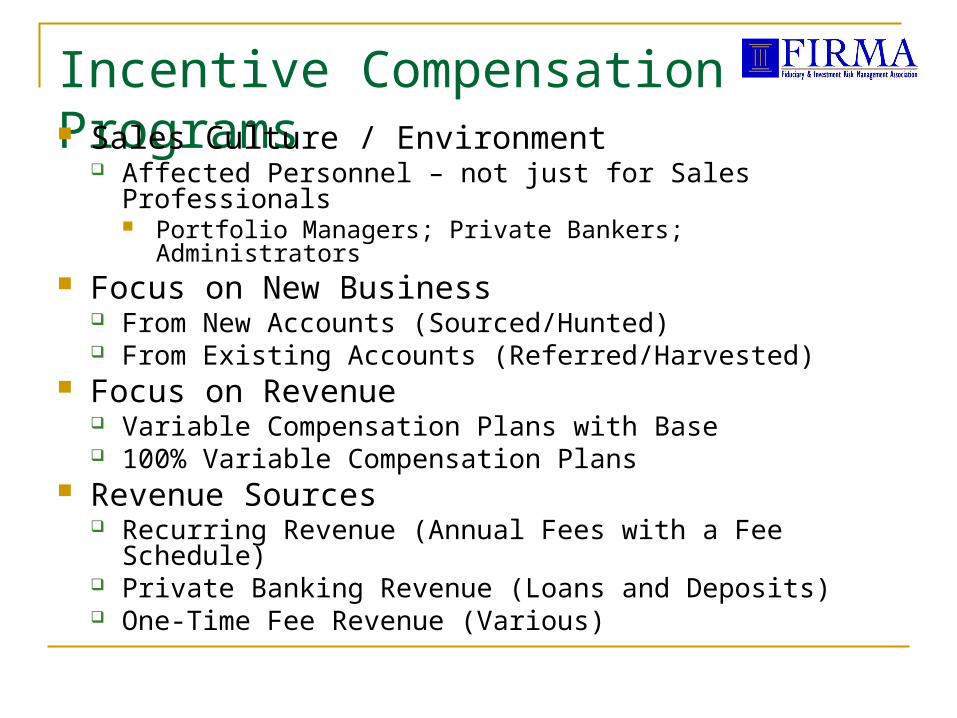
Incentive Compensation Programs Sales Culture / Environment
Affected Personnel – not just for Sales Professionals Portfolio Managers; Private Bankers; Administrators
Focus on New Business From New Accounts (Sourced/Hunted) From Existing Accounts (Referred/Harvested)
Focus on Revenue Variable Compensation Plans with Base 100% Variable Compensation Plans
Revenue Sources Recurring Revenue (Annual Fees with a Fee Schedule) Private Banking Revenue (Loans and Deposits) One-Time Fee Revenue (Various)

Recurring Revenue Assets that produce annual recurring
revenue: Custody Investment Advisory Investment Management Directed Trusteeships Trusteeships
Incentive Compensation Based upon actual revenue produced – predominately %-based Market Value fees Non-Market Value fees

Recurring Revenue New Business that is Self-Sourced (Hunted)
New Account Assets or Additions to Existing Account
Highest Incentive Compensation % Payout graduated over a period of years – with a
fixed percent after a certain number of years.
Recurring Revenue New Business that is Referred (Harvested)
New Account Assets or Additions to Existing Account
Incentive Compensation is decreased from the highest amount based upon the compensation paid to the referring employee.
Payout graduated over a period of years – with a fixed percent after a certain number of years.

Recurring Revenue
Incentive Amount
Cap Clawback Provision
Payment Schedule
Year One
xx% of Annualized Revenue from New Client or Additions to existing Account
No Cap; Dollar Cap; % of Total Compensation
Payment of incentive is reversed if the account closes within xx months of activation or for client withdrawal of assets in excess of xx dollars during the quarter.
Incentive payment will be made within xx days following the end of the quarter of account funding.
Year Two
xx% of annualized Year Two revenue.
No Cap; Dollar Cap; % of Total Compensation
Same as above
Incentive payment will be made within xx days following the end of the quarter of the anniversary of account funding.
Year Three
xx% annualized revenue.
No Cap; Dollar Cap; % of Total Compensation
Not Applicable
Incentive payment will be made within xx days following the end of the quarter of the anniversary of account funding.

Recurring Revenue Does the Plan outline the employees that are
eligible for recurring revenue incentive compensation? Y or N
Does the Plan define recurring revenue and how it will be determined? Y or N
Does the Plan outline whether or not market value increases or decreases caused by economic conditions will be considered in determining the payment of incentive compensation? Y or N

Recurring Revenue Does the Plan consider a reduction in
recurring revenue incentive compensation if non-standard fees, or fee discounts are applied? Y or N
Does the Plan provide for a “splitting” of recurring revenue incentive compensation among eligible employees? Y or N
Does the Plan outline the what documentation and system fields required to be completed before recurring revenue incentive compensation is paid? Y or N

Private Banking Business Incentive Payments for Banking Business
Deposits Loans and Credit Facilities

Private Banking Business Does the Plan provide for incentive compensation
for the generation of Private Banking Business? Y or N
Does the Plan provide incentive compensation on the net interest income for a deposit account? Y or N
If incentive compensation is paid, for what time period?
If incentive compensation is paid, are additional deposits to the account included, or must they be of a certain $ amount? Y or N
Does the Plan provide for incentive compensation on the net interest charged and the fees generated on new loans, and for how long? Y or N

Private Banking Business Does the Plan provide incentive compensation on the
renewal of loans and/or mortgages? Y or N Is there a time frame for determining the dollar
amount of the incentive compensation? Y or N Does the Plan outline that incentive compensation for
Private Banking products be paid at funding or in arrears?
If the payment is made at funding, does the Plan provide for a “clawback” provision? Y or N

One Time Fee Business How is One Time Fee Business Defined?
Financial Planning Tax Planning
Long Term Tax Planning Programs Qualified Intermediary
Capital Markets Special Fiduciary Arrangements
Will Appointments Life Insurance Trusts (Unfunded)
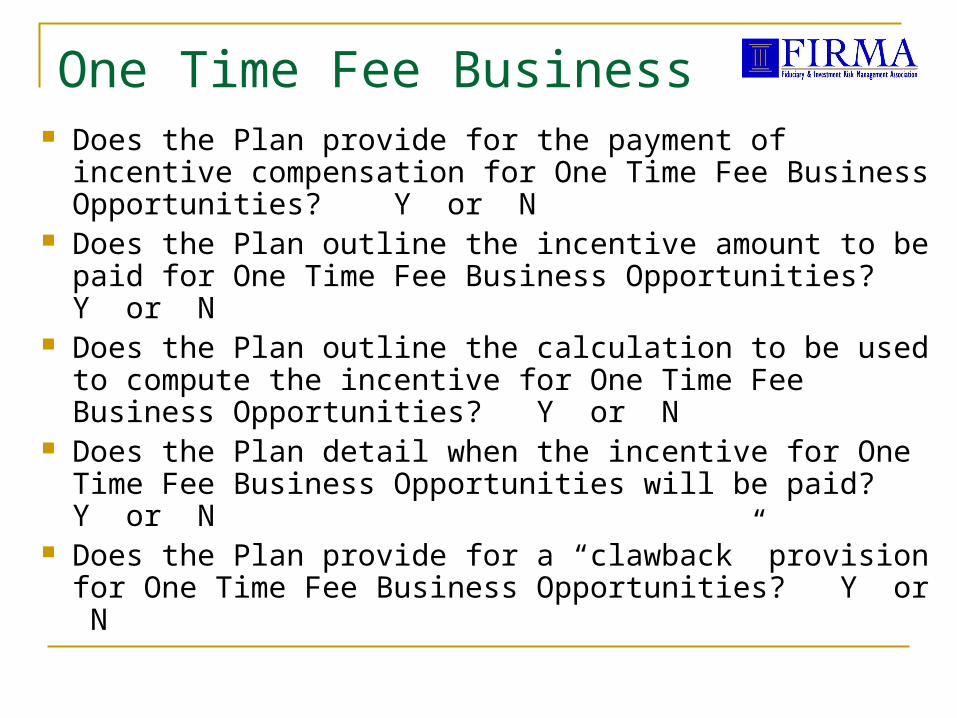
One Time Fee Business Does the Plan provide for the payment of incentive
compensation for One Time Fee Business Opportunities? Y or N
Does the Plan outline the incentive amount to be paid for One Time Fee Business Opportunities? Y or N
Does the Plan outline the calculation to be used to compute the incentive for One Time Fee Business Opportunities? Y or N
Does the Plan detail when the incentive for One Time Fee Business Opportunities will be paid? Y or N
Does the Plan provide for a “clawback” provision for One Time Fee Business Opportunities? Y or N

One Time Fee Business
Three things can happen when you throw a pass, and two of them ain’t good.
Woody Hayes, OSU Football Coach
Perhaps we should apply this same philosophy to a couple of One Time Fee Business examples.

One Time Fee Business Will Appointments
Incentives paid at the time a Will Appointment is obtained create unique risks. Set Dollar Amount ($) Percent of Net Worth (%)
Substantiation of Net Worth Responsible Party Documentation
Asset Breakdown Marketable Non-Marketable
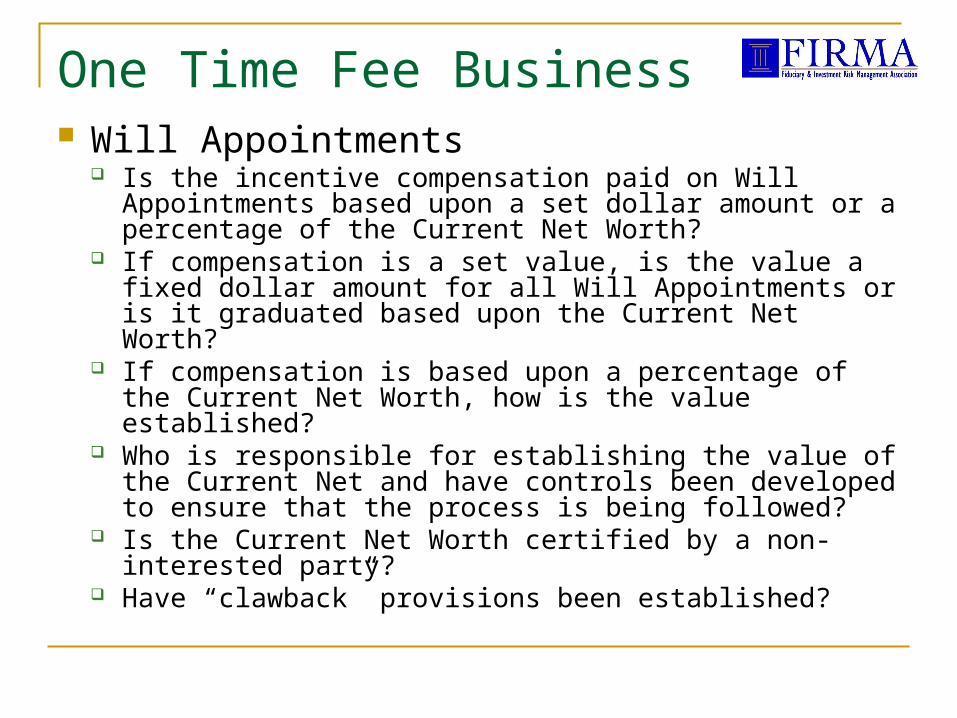
One Time Fee Business Will Appointments
Is the incentive compensation paid on Will Appointments based upon a set dollar amount or a percentage of the Current Net Worth?
If compensation is a set value, is the value a fixed dollar amount for all Will Appointments or is it graduated based upon the Current Net Worth?
If compensation is based upon a percentage of the Current Net Worth, how is the value established?
Who is responsible for establishing the value of the Current Net and have controls been developed to ensure that the process is being followed?
Is the Current Net Worth certified by a non-interested party?
Have “clawback” provisions been established?

One Time Fee Business Life Insurance Trusts
Incentive compensation paid for the Appointment as Trustee in a Life Insurance Trust have complex issues. Set Dollar Amount ($) Percent of Value (%)
Based on Size of the Life Insurance Policy Face Amount Cash Value Amount Potential Secondary Market Amount
Graduated or Fixed
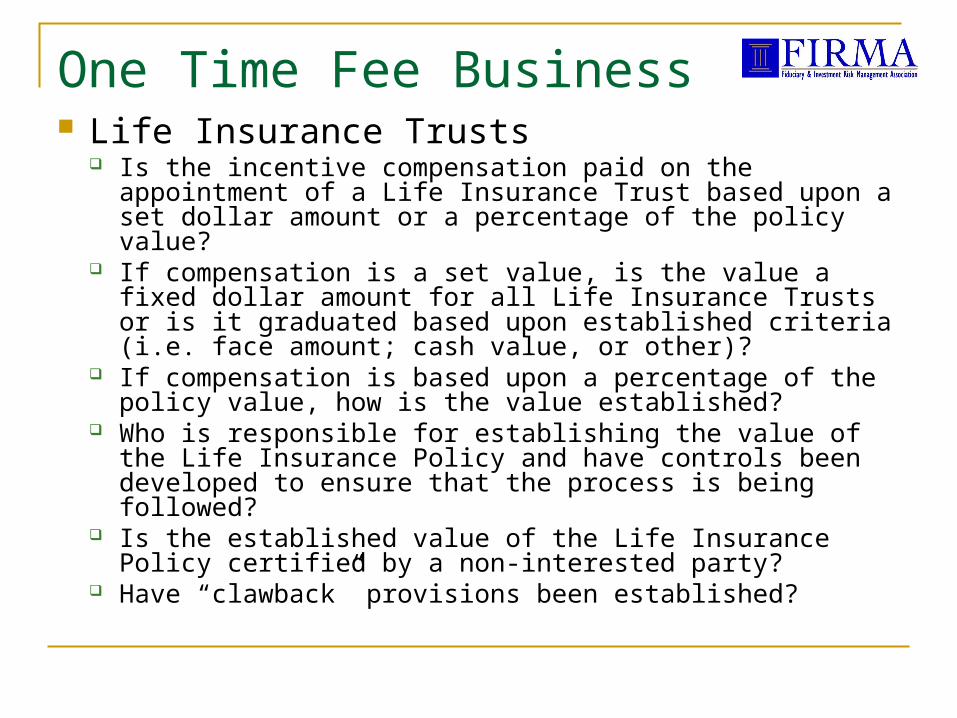
One Time Fee Business Life Insurance Trusts
Is the incentive compensation paid on the appointment of a Life Insurance Trust based upon a set dollar amount or a percentage of the policy value?
If compensation is a set value, is the value a fixed dollar amount for all Life Insurance Trusts or is it graduated based upon established criteria (i.e. face amount; cash value, or other)?
If compensation is based upon a percentage of the policy value, how is the value established?
Who is responsible for establishing the value of the Life Insurance Policy and have controls been developed to ensure that the process is being followed?
Is the established value of the Life Insurance Policy certified by a non-interested party?
Have “clawback” provisions been established?
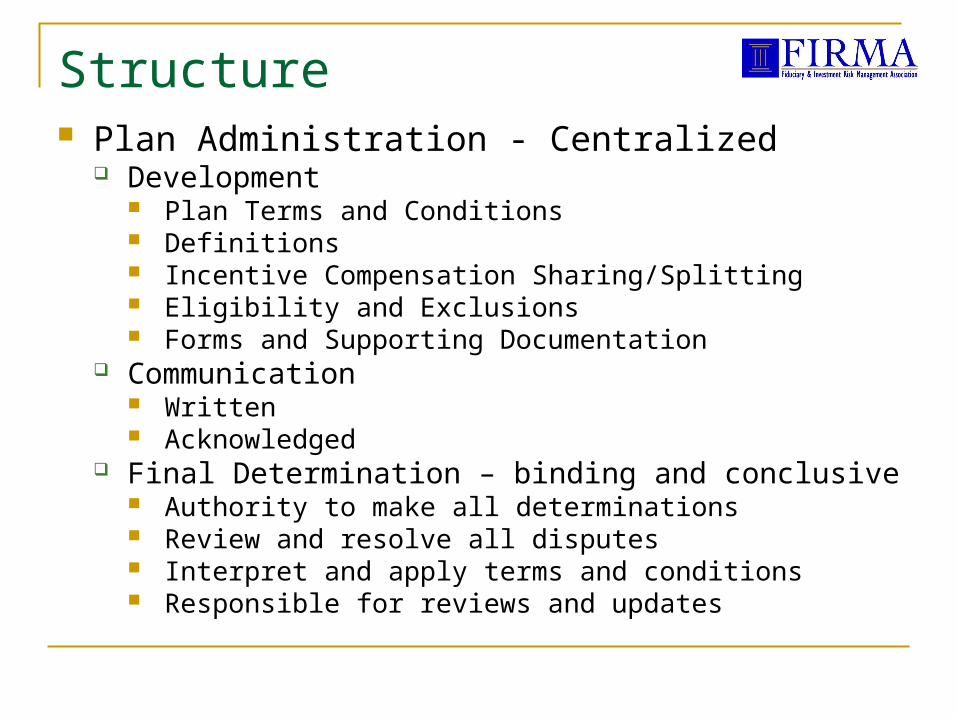
Structure Plan Administration - Centralized
Development Plan Terms and Conditions Definitions Incentive Compensation Sharing/Splitting Eligibility and Exclusions Forms and Supporting Documentation
Communication Written Acknowledged
Final Determination – binding and conclusive Authority to make all determinations Review and resolve all disputes Interpret and apply terms and conditions Responsible for reviews and updates

Structure Plan Deployment
Prospects Current Clients Referral Sources Owner System Identification

Structure Some important language to incorporate into
the Plan.
This Plan shall not be deemed to constitute a contract between the (bank name) and any eligible employee or to be a consideration or inducement for the employment of any eligible employee. Nothing contained in this Plan shall be deemed to give any eligible employee the right to be retained in the service of (bank name) or interfere with the right of (bank name) to discharge any eligible employee at any time. The Plan is subject to review, suspension, amendment and/or termination at any time with or without notice by (bank name).

Incentive Compensation Audit Objectives
Ascertain if the incentive compensation is paid in accordance with the established Plan.
Determine whether incentive compensation is accurately calculated.
Assess the use of incentive compensation benchmarks and reporting processes.
Ensure the level of total incentive compensation is commensurate with intended results and the level of risk established.

Incentive Compensation Audit Information Request
Previous audits, reviews, or self-assessments Current Incentive Compensation Plan –
description and requirements Incentive Compensation documentation and
related forms and material Organizational chart of the Sales function Policies and procedures for recording and
documenting prospects and sales Training material outlining the incentive
compensation program Sales goals and supporting documentation

Incentive Compensation Audit Necessary Activity
Interview key personnel specific to the Incentive Compensation Process
Review Incentive Compensation Plan and relevant documents, including policies and procedures.
Perform testing to determine accuracy and consistency between the Plan, the system, and supporting documentation.
Review internal controls, specifically regarding the separation of duties.
Summarize findings and report findings.
Incentive Compensation Audit Items to Consider
What is the frequency incentive compensation is paid? (monthly, quarterly, etc.) and does it differ for external referral sources?
What department is responsible for processing the payment of incentive compensation?
Do reports exist to track trend data (i.e. product, department, employee, region, as a percent of revenue, etc.) – Examples:
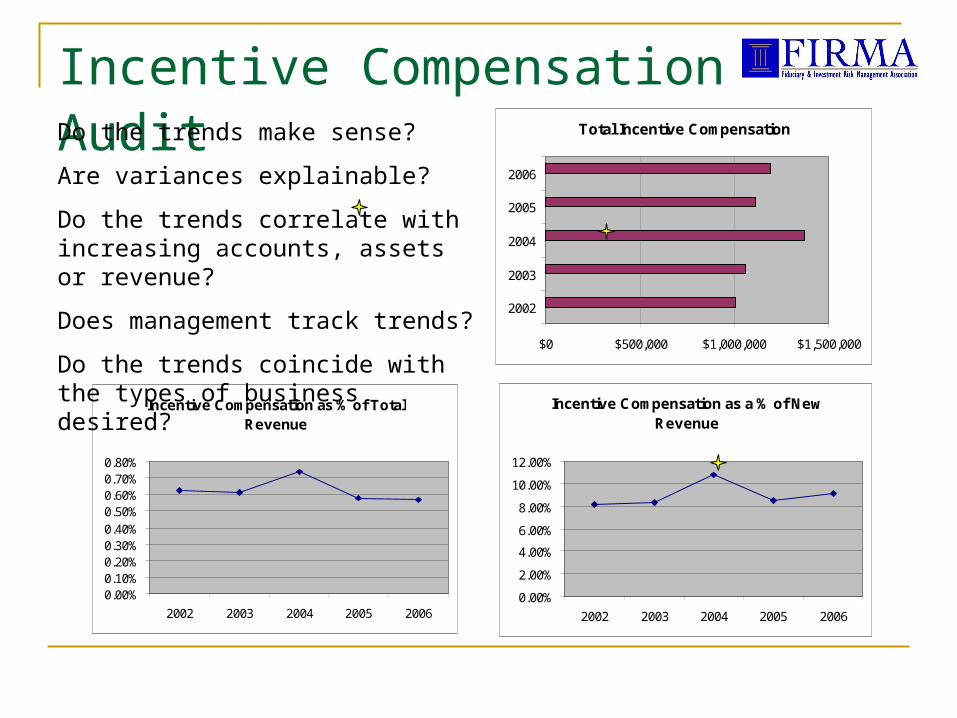
Incentive Compensation Audit Total Incentive Compensation
$0 $500,000 $1,000,000 $1,500,000
2002
2003
2004
2005
2006
Incentive Compensation as % of Total Revenue
0.00%0.10%0.20%0.30%0.40%0.50%0.60%0.70%0.80%
2002 2003 2004 2005 2006
Incentive Compensation as a % of New Revenue
0.00%
2.00%
4.00%
6.00%
8.00%
10.00%
12.00%
2002 2003 2004 2005 2006
Do the trends make sense?
Are variances explainable?
Do the trends correlate with increasing accounts, assets or revenue?
Does management track trends?
Do the trends coincide with the types of business desired?
Incentive Compensation Audit Best Practices Review
Does the Incentive Compensation Plan provide for a stable base with incentive payments linked to performance? Individual Performance Team Performance Division Performance
Does the Incentive Compensation Plan support the strategic goals of the organization? Types of Business Types of Clients Revenue Goals
Incentive Compensation Audit Best Practices Review
Is the Incentive Compensation Plan competitive and equitable? Industry Compensation Surveys / Study Attraction and Retention Revised and Updated
Does a process exist for accurate and effective communication of changes/revisions to the Incentive Compensation Plan? Input from Sales Personnel Documentation on Receipt of Information Training Material

Incentive Compensation Audit Best Practices Review
Does the Incentive Compensation Plan outline goals for key management position? New Revenue Goals New Account Goals (types and size) Profitable Account Retention Goals
Does the Incentive Compensation Plan provide for the creation and development of performance metrics? Incentive Calculations and Payments Cycle Time Measurement against Total Revenue, New Revenue,
Net Revenue Measurement against Account and Asset Growth
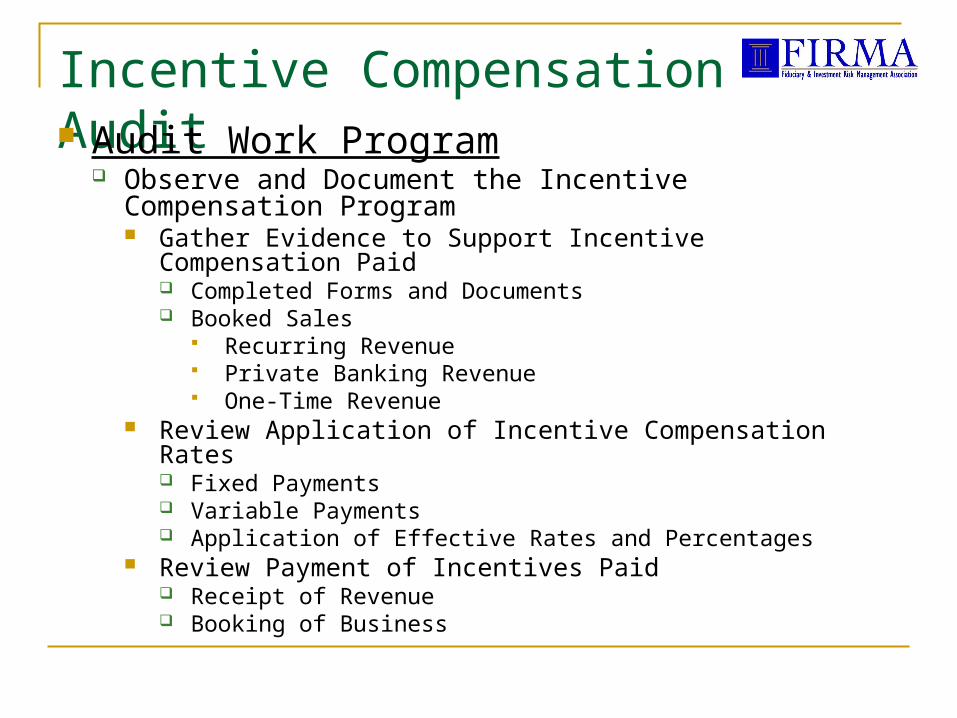
Incentive Compensation Audit Audit Work Program
Observe and Document the Incentive Compensation Program Gather Evidence to Support Incentive Compensation Paid
Completed Forms and Documents Booked Sales
Recurring Revenue Private Banking Revenue One-Time Revenue
Review Application of Incentive Compensation Rates Fixed Payments Variable Payments Application of Effective Rates and Percentages
Review Payment of Incentives Paid Receipt of Revenue Booking of Business

Incentive Compensation Audit Audit Work Program
Observe and Document the Incentive Compensation Program (continued) Review Incentive Compensation Consistency
All eligible personnel Splitting / Sharing Client or Relationship Transfers
Review Overall Plan Administration Segregation of Duties Approval Process Application of Discounts Review of Retention and “clawback” Provisions
Review Referral Source Payment, if applicable

Incentive Compensation Audit Audit Work Program
Map the procedures that are used to administer the Incentive Compensation process – review areas to determine risk of non-compliance Collect information specific to sales activity and the mix
of products and customers Review the system used for recording and documenting
sales and Incentive Compensation credit Review the controls for approving and paying Incentive
Compensation – including the segregation of duties

Incentive Compensation Audit Audit Testing
Discuss the Incentive Compensation Plan with Management and Eligible Employees to confirm understanding of the Plan.
Review payment of Incentive Compensation for: Timeliness Accuracy Clawback
Validate the operation of formal procedures to change Eligible Employee payment: Departed or Relocated Employees Payroll Tax Deductions
Review Incentive Compensation Forms to ensure proper supporting documentation
Review and test segregation of duties Review the process for the handling of gifts TO customers

Incentive Claim Form Key Information
Account Information Client Name Relationship Size Type of New Business Projected Annual Revenue
Business Segment – Information on where the new business will be managed/administered
Products and Services Custody Investment Management Trust Private Banking etc
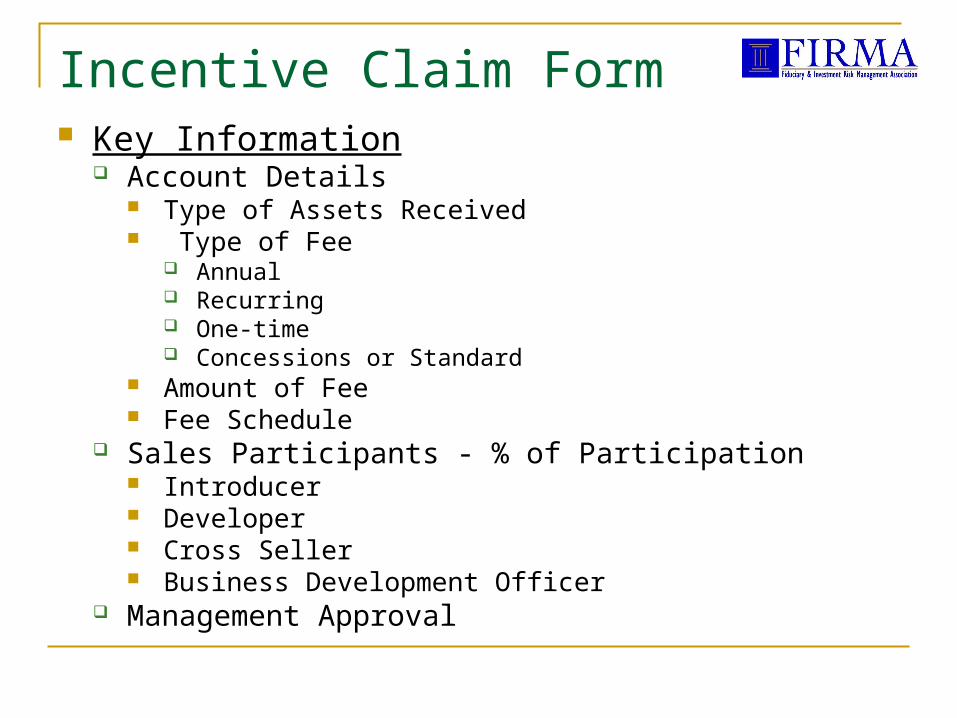
Incentive Claim Form Key Information
Account Details Type of Assets Received Type of Fee
Annual Recurring One-time Concessions or Standard
Amount of Fee Fee Schedule
Sales Participants - % of Participation Introducer Developer Cross Seller Business Development Officer
Management Approval

Auditing Incentive Compensation Plans – Risks and Conflicts
Comments and Questions
![Mitigating Incentive Conflicts in Inter -Firm ... · PDF fileMitigating Incentive Conflicts in Inter -Firm Relationships: Evidence from ... (Akerlof [1970]). Rational ... [1983], Dichev](https://img.dokumen.tips/doc/110x75/5aba2fc17f8b9a684c8ebb31/mitigating-incentive-conflicts-in-inter-firm-incentive-conflicts-in-inter-firm.jpg)