Embed Size (px)
Citation preview
Trinity UniversityDigital Commons @ Trinity
School of Business Faculty Research School of Business
9-2003
Audit Firm Industry Specialization as aDifferentiation Strategy: Evidence from FeesCharged to Firms Going PublicBrian W. Mayhew
Michael S. WilkinsTrinity University, [email protected]
Follow this and additional works at: https://digitalcommons.trinity.edu/busadmin_faculty
Part of the Business Commons
This Article is brought to you for free and open access by the School of Business at Digital Commons @ Trinity. It has been accepted for inclusion inSchool of Business Faculty Research by an authorized administrator of Digital Commons @ Trinity. For more information, please [email protected].
Repository CitationMayhew, B. W., & Wilkins, M.S. (2003). Audit firm industry specialization as a differentiation strategy: Evidence from fees charged tofirms going public. Auditing: A Journal of Practice & Theory, 22(2), 33-52. doi: 10.2308/aud.2003.22.2.33

33
AUDITING: A JOURNAL OF PRACTICE & THEORYVol. 22, No. 2September 2003pp. 33�52
Audit Firm Industry Specialization as aDifferentiation Strategy: Evidence from Fees
Charged to Firms Going PublicBrian W. Mayhew and Michael S. Wilkins
SUMMARY: This paper examines IPO audit fees to assess the use of industry special-ization as a differentiation strategy by audit firms. We extend existing theory on theimpact of industry specialization on audit fees by incorporating Porter�s (1985) theory ofcompetition and differentiation. We suggest that market share enables audit firms togain competitive advantages in terms of cost and service. However, the impact of suchadvantages on fees depends on whether the audit firm has successfully differentiateditself from competitors within client industries. Our results indicate that as audit firmindustry market share increases without a differentiation in market share, the audit feecharged for a given IPO decreases. In the context of Porter (1985), this result suggeststhat the client is able to bargain for a portion of the auditor�s cost savings because theaudit firm has not successfully differentiated itself from competitors. In contrast, weshow that audit firms that possess significantly higher market shares than their industrycompetitors earn fee premiums, suggesting that audit firms that have successfully differ-entiated themselves retain a stronger bargaining position with their clients.
Keywords: industry specialization; economies of scale; strategy; audit fees; initial publicofferings.
Data Availability: All data used in this study can be drawn from publicly availablesources.
INTRODUCTION
This paper uses IPO audit fees to assess the use of industry specialization as a differentiationstrategy among audit firms. Similar to prior research (e.g., Hogan and Jeter 1999) we assumethat industry market shares are associated with industry specialization. We argue that an audit
firm�s market share within client industries potentially differentiates it from audit firms with lowermarket shares by providing two distinct advantages. First, audit firms with large market shares areable to spread industry-specific training costs over more clients, producing economies of scale thatare not easily duplicated by small market share firms. Second, large market share firms are able todevelop more industry-specific knowledge and expertise, thereby enabling them to provide higherquality services than small market share firms.
Brian W. Mayhew is an Assistant Professor at the University of Wisconsin�Madison, and Michael S.Wilkins is an Associate Professor at Texas A&M University.
We thank Holly Ashbaugh, John Eichenseher, James Flagg, Gary Giroux, Audrey Gramling, Chris Hogan, seminar partici-pants at Texas A&M University, participants at the 2002 Midyear Auditing Conference, Bill Messier (the editor), and tworeviewers for many helpful comments and suggestions.
Submitted: August 2002Accepted: March 2003

Auditing: A Journal of Practice & Theory, September 2003
34 Auditing, September 2003
Prior research has found little evidence of fee differentials for industry specialization in the U.S.market and mixed evidence in the Australian market. The lack of support for average fee differen-tials is not surprising. On one hand, the economies of scale achieved through market share gainsshould produce lower fees if the savings are passed along to clients. However, if audit firms withhigher industry market shares provide higher service quality, they should be able to charge a relativefee premium. These competing effects make it difficult to predict how audit fees will be related toindustry specialization (Willenborg 2002).
We use Porter�s (1985) analysis of competitive forces to explain how an industry specialist isable to differentiate itself from competitors through market share. By incorporating Porter�s argu-ments into existing audit fee theory, we generate predictions about the conditions under which theaudit firm will earn fee premiums or offer fee discounts. Specifically, when an audit firm obtains asignificantly higher market share than its competitors�thereby differentiating itself�its bargainingpower increases because clients cannot obtain similar quality services from competing audit firms.Under these circumstances, the audit firm may be able to earn a fee premium for its differentiatedservices. When the audit firm does not differentiate itself significantly from competitors, it losesbargaining power with the client; as a result, competitive pressures will require the audit firm to shareits market share-driven cost savings with the client.1 These two scenarios form the basis for ourempirical tests.
We test our theory by examining fees charged by audit firms to clients selling shares to thepublic for the first time between 1991 and 1997. We use fees charged in the U.S. IPO audit market totest our theory because the data are available for a large number of U.S. firms across multiple yearsand because the IPO market generates a high level of competition among audit firms. (See alsoHogan 1997; Willenborg 1999; Fargher et al. 2000.) This high level of competition enables us toconduct a powerful test of our theory. The use of U.S. data is also important because prior largesample industry specialization research relies solely on Australian data.
We define industry specialization in terms of the audit firm concentration levels in two-digit SICcodes based on both the proportion of square root assets and the number of firms audited (e.g.,Hogan and Jeter 1999; Dunn and Mayhew 2002). We estimate audit fee models that employ controlvariables identified by recent IPO fee researchers (e.g., Fargher et al. 2000; Willenborg 1999). Wemodify these models to capture the dynamics that are likely to influence the bargaining power thatexists between industry-specialized audit firms and their clients.
Our results indicate that as audit firm industry market share increases, the audit fee charged for agiven IPO decreases. This result is consistent with the existence of industry-based economies ofscale. However, we also show that industry-leading audit firms that possess significantly highermarket shares than their competitors earn fee premiums, suggesting that they have successfullydifferentiated themselves in terms of the audit services they provide. Like previous researchers,when we include a single measure of industry market share without a measure of quality differentia-tion, we do not find that industry leadership produces a fee premium. This finding suggests that ourconsideration of the ability of the audit firm to differentiate itself from competitors is critical inunderstanding the impact of industry market share on audit fees.
The remainder of the paper is organized as follows. We present our theory, evidence from priorresearch, and our hypotheses in the next section. The third section describes our data and the fourthsection presents our empirical method and results. The fifth section provides a series of sensitivitytests and the final section provides a brief discussion of our findings.
1 The fact that the client obtains bargaining power does not mean that the audit firm�s specialization strategy will beunprofitable. The audit firm still obtains lower marginal costs through increased market share. However, if the clientpossesses some bargaining power, it is likely to demand a portion of the associated cost savings.

Mayhew and Wilkins 35
Auditing: A Journal of Practice & Theory, September 2003
THEORY, PRIOR LITERATURE, AND HYPOTHESESApplied Theory of Audit Firm Industry Specialization
In this section we outline an applied theory of audit firm industry specialization that builds onthe ideas presented in Porter (1985). In Porter�s context, the goal of an audit firm is to identify waysto set itself apart from competitors in serving client needs such that profitability is maximized. Bydifferentiating on dimensions other than price, the audit firm creates opportunities to meet uniqueclient demands and to earn economic rents.
Porter�s Five Forces model describes five forces that determine the return on investment in anindustry�potential entrants, substitutes, competitors, bargaining power of suppliers, and bargainingpower of customers. Potential entrants and substitutes are not regarded as important issues for themarket for public company audits because the SEC has given CPAs the exclusive right to performpublic company audits. Furthermore, an audit firm�s main supplier is its labor force. The mostsignificant component of the labor force is the partners, who are residual claimants in the audit firm.As a result, we avoid significant discussion of the role of the suppliers in our analysis. The main�forces� relevant to an audit firm, therefore, are the bargaining power of the client and competitionfrom other audit firms.
Why Do Auditors Specialize in Industries?Porter�s (1985) analysis suggests that audit firms have incentives to supply specialized services
that meet client needs in ways that are not replicated easily by competing audit firms. Stateddifferently, audit firms differentiate themselves from competitors to better align their services withtheir clients� unique needs and, as a result, to earn rents on their specialization. Differentiation cantake place on many dimensions of client characteristics and related service demands. These dimen-sions include size, number of segments, industry membership, regulation, sources of capital, andmanagement/audit personnel relationships (Chan et al. 2001).
We argue that client industry membership is an important dimension that audit firms can use toalign themselves with specific client characteristics and service needs.2 Industry specialization isparticularly valuable because it allows the audit firm to use its differentiation strategy to service arelatively large group of clients possessing the same basic characteristics. Articles in the financialpress suggest that the Big 6 (now Big 4) accounting firms have put forth considerable effort inestablishing client industry specializations. For example, the Big 6 firms claim that they havereorganized along industry lines during the last decade to better serve their clients (Berton 1995).Further, empirical research documents that the Big 6 firms with the largest existing industry marketshares have expanded their market shares over the last 20 years (Hogan and Jeter 1999). Wetherefore argue that audit firm industry market share reflects efforts made by auditors to specializeaccording to client industries.
The Impact of Industry SpecializationWe start with the assertion that industry specialization will increase the audit firm�s market
share in the target industry because clients demand the auditor�s specialized services. (See alsoPalmrose 1986; Craswell et al. 1995; Ferguson and Stokes 2002.) The increase in market shareproduces two competitive advantages for the audit firm: (1) the auditor�s cost of performing the auditdecreases, and (2) the service value provided to the client increases. Porter (1985) notes that it isunusual to be able to differentiate based on a cost advantage and product differentiation, but thatit is possible. We outline below how we believe both types of differentiation are related to theauditor�s industry market share.
2 In our empirical tests we also implicitly align on source of capital (public equity markets) and, to some degree, size(large). We essentially claim that Big 6 firms specialize in providing services to relatively large, publicly traded clientsand then further specialize by industry within the large public company market.
Auditing: A Journal of Practice & Theory, September 2003
36 Auditing, September 2003
The auditor�s cost decreases for two distinct reasons. First, the audit firm develops personnelwith industry-specific knowledge and expertise. Because these personnel are often assigned exclu-sively to the industry they serve, they become very adept at identifying and addressing industry-specific audit issues. As a result, the audit firm is able to perform more efficient audits.3 (SeeSolomon et al. (1999), Owhoso et al. (2002), and Taylor (2000) for behavioral evidence consistentwith this assertion.) Second, the auditor is able to spread industry-specific personnel training costsover more client hours. Basic industry training is required for all staff serving a particular industry(AU section 311.07-08, AICPA 1997) and the more clients or client hours the staff covers in thatindustry, the lower the training costs allocated to each client. The converse is also true, in that anauditor serving very few clients in an industry will be forced to allocate a higher portion of trainingcosts to jobs in that industry.
An industry specialist audit firm also provides a differentiated service by providing a greatervalue proposition to its clients. To understand the value proposition, the audit must be viewed as aprocess and not simply as a standardized report. The process view reveals two factors that are oftenignored. First, the audit itself requires the efforts of both the client and auditor. The effort put forthby the client should clearly be part of the client�s cost-benefit analysis in selecting an auditor. Anindustry specialist auditor should reduce the effort required by the client in the audit process becausethe client will be required to spend much less time explaining industry-specific practices and indus-try trends to the auditor. In support of this view, a survey by Behn et al. (1997) suggests that industryspecialization is a key determinant of client satisfaction. Second, the audit process does not simplyproduce the audit opinion; it also produces the audited financial statements. Research providesevidence that auditors have a substantial impact on the audited financial statements (Kinney andMartin 1994; Nelson et al. 2002). It is reasonable to speculate that an industry specialist auditor willhave a positive incremental impact on the underlying financial statements relative to a nonspecialistauditor. Indeed, a number of studies provide evidence consistent with industry specialists (measuredby industry market share) producing higher quality audits (Balsam et al. 2000; Gramling et al. 2000;Carcello and Nagy 2002). There is also evidence that industry specialists are a part of a client�soverall disclosure strategy and are associated with higher analyst evaluations of disclosure quality(Dunn and Mayhew 2002). In total, these studies suggest that both clients and users may benefitwhen firms hire industry specialist auditors.
Limits to the Demand for Industry SpecialistsThe above discussion suggests significant advantages to clients who hire industry specialists.
This begs the question: Why don�t all clients hire industry specialists? First, industry specializationis not the only way in which auditors differentiate themselves from competitors and may not be themost important differentiation mechanism for every client. For example, we know that Big 5 (nowBig 4) firms specialize in serving publicly traded clients as evidenced by the fact that they audit over85 percent of public companies. Another example is client size. Small clients may prefer personal-ized relationships with an audit firm having a small client base, rather than with a firm that offersgeneral industry specialization. This scenario often obtains in the banking industry. KPMG is theclear leader in financial services audits; however, approximately 30 percent of the banks investigatedby Fields et al. (2002)�many of them smaller, publicly traded banks�use smaller, regional auditfirms.
3 Note that an audit firm�s specialized staff cannot easily extract the profit created by their specialized skills, because theircontinued expertise depends on the experiences they gain from working a large number of hours in the same industryeach year. If the specialized staff moved to a nonspecialist firm with fewer clients, it would be more difficult to maintaintheir specialized skills due to the reduction in industry contact time. Nonetheless, it would be very interesting to examinethe salaries of specialized auditors within an audit firm and the rate at which specialists leave for other competing auditfirms.

Mayhew and Wilkins 37
Auditing: A Journal of Practice & Theory, September 2003
In other cases, the threat of information transfer to competitors may induce a client to avoid anauditor who audits its competitors. For example, when Ernst & Whinney and Arthur Young mergedin 1989, the merged firm temporarily became the auditor of both Coca Cola and Pepsi. Both clientsfound this arrangement unacceptable. As a result, Pepsi hired a new auditor (Kwon 1996). Insummary, industry specialization is not the only dimension important to clients. As a result, it isunlikely that a single audit firm will completely dominate an industry.
Hypotheses Based on Implications of Industry Specialization for Audit FeesThe previous sections explain why customers might demand industry specialized services and
how industry market share creates a competitive advantage�lower costs and higher service qual-ity�for an audit firm. Because these two factors impact audit fees in different directions, ouranalysis considers the interaction between competition and client bargaining power.
Our main insight into the fees charged by industry specialists is that fees will depend on thedegree of differentiation from competitors. We argue above that market share provides a competitiveadvantage to an auditor; as a result, fees will depend on the degree of differentiation between auditfirms. An audit firm that successfully differentiates itself will gain bargaining power with clients whodemand the correspondingly higher quality services. Clients simply will not have an alternative ofthe same quality level. An audit firm that cannot separate itself from competitors will gain costadvantages as its market share increases, but clients will be able to bargain for a portion of thecost savings by threatening to utilize another audit firm with a similar market share. That is, auditorswith similar market shares will have similar quality services and will be forced to share their costbenefits with clients due to price competition. Alternatively, when an audit firm is able to differenti-ate itself from competitors by enhancing its relative value proposition, it will be able to retain its costsavings and possibly charge a premium for its services.
Our hypotheses test for the direct effect of audit firm market share on IPO audit fees, and for theincremental effect of market share differentiation on fees. In general our theory implies that asmarket share increases the audit firm�s costs will decrease.4 In cases where the audit firm is not ableto distinguish itself significantly from its competitors, we expect audit firms to pass along these costsavings to clients. However, audit firms that have significantly higher market shares than theircompetitors may be able to earn higher fees than specialists who do not differentiate withintheir industry. These notions form the basis for H1 and H2:
H1: When there is no clear market leader, an audit firm earns lower fees as its industrymarket share increases.
H2: Audit firms that have significantly higher industry market shares than their competi-tors earn higher fees than other audit firms.
Relationship to Prior Studies of Industry SpecializationTwo studies examine industry specialization and audit fees using large samples. Both use
Australian data and appear to document conflicting results. Craswell et al. (1995) document a feepremium based on industry specialization in the 1987 Australian audit market, but find that the
4 An ideal test of our theory would employ audit cost data from all of the major accounting firms providing services in theIPO assurance market. However, such data is not publicly available. We do not think the inability to use cost data is asignificant limitation because prior research using cost data from a major firm suggests that the determinants of costs arevery similar to the determinants of fees (O�Keefe et al. 1994; Stein et al. 1994).

Auditing: A Journal of Practice & Theory, September 2003
38 Auditing, September 2003
premium only applies to the large client segment of the market.5 Ferguson and Stokes (2002)reassess Craswell et al.�s (1995) findings and claim not to document a fee premium for industryspecialization using 1990, 1992, 1994, and 1998 data.6
Our theory based on Porter (1985) reconciles the differences between Craswell et al. (1995) andFerguson and Stokes (2002). The competition between audit firms and clients in Australia changedbetween 1987 (Craswell et al. 1995) and the 1990s (Ferguson and Stokes 2002) due to the consolida-tion of the Big 8 accounting firms into the Big 6 in 1989. The result of this consolidation was anincrease in the number of firms considered to be industry specialists by the second study. Specifi-cally, Ferguson and Stokes (2002) show an increase from an average of 2.2 specialists per industry inwhich a specialist exists in 1987 to 3.5 specialists per industry in 1990 using a 10 percent marketshare cutoff. We believe that the increase in the number of industry specialists resulted in an increasein competition among the specialist firms, thereby decreasing the specialists� bargaining power innegotiating fees. That is, the differentiation between the value offered across auditors was reduced,giving clients more choice and, accordingly, more relative bargaining power. Therefore, Fergusonand Stokes� (2002) failure to find the fee premium previously documented by Craswell et al. (1985)may be due to changes in the competitive nature of the market.
Our paper examines fees using U.S. IPO data. We believe that while basic economic principlesare unlikely to differ between the U.S. and Australian markets, the structure of the audit markets isnotably different between the two countries, making generalizations from one market to the othertenuous. For example, the structure of the two markets differs with respect to auditing public clients.Non-Big 5 auditors audit 35�40 percent of publicly traded Australian companies whereas in the U.S.the non-Big 5 audit less than 15 percent of public companies. Furthermore, the average size (auditfee) of public clients in the U.S. audit market far exceeds that of the average Australian client. Thesedifferences imply a potentially different competitive landscape across the two countries.
Prior evidence with respect to industry specialization and U.S. audit fees in restricted samples ismixed.7 Palmrose (1986) and Pearson and Trompeter (1994) both document a lack of associationbetween industry specialization and audit fees. Pearson and Trompeter (1994) is particularly rel-evant to our study, given our argument that a specialist audit firm loses bargaining power when itdoes not differentiate itself from competitors. Pearson and Trompeter (1994) examine audit feescharged by specialists in the insurance industry. Three audit firms audit the vast majority of compa-nies in the insurance industry and are considered specialists (during the time period they examine).However, all three audit firms have a similar share of the industry; as a result, they are unable todifferentiate themselves from each other. That is, while they may supply services that are superior tothose offered by lower market share auditors, they supply services that are similar to each other. Notsurprisingly, the authors do not find a fee differential for the �specialists� and find some evidence oflower fees for clients switching among the undifferentiated high market share auditors.
5 Table 6 in Craswell et al. (1995) documents a lack of premium for specialization among the bottom half (in terms of size)of the firms in their sample. They argue that audit quality may not be as important from an agency cost perspective forsmaller firms in their sample.
6 Ferguson and Stokes (2002) do not find a premium for industry specialization using a 10 percent market share cut-off todefine specialists. However, Willenborg (2002) notes that the use of the same cutoff as Craswell et al. (1995) whoexamine 1987 data (prior to the Big 8 merger into the Big 6) seems inappropriate. A 15 percent cutoff seems morereasonable, and in Table 5 of Ferguson and Stokes (2002) it appears that the 15 percent cutoff produces a significantpremium in all four years examined.
7 Cullinan (1998, Figure 1) provides an overview of the conflicting predictions on the impact of market share on fees whenthe bargaining power of the firm and client are not considered.
Mayhew and Wilkins 39
Auditing: A Journal of Practice & Theory, September 2003
IPO Audit FeesThe IPO audit market enables us to conduct a powerful test of our theory due to the high level of
competition among audit firms in this market. At the time of the IPO, clients evaluate which auditfirm is optimal in terms of price and value-added service (Hogan 1997). As the IPO firms considertheir alternatives, even incumbent audit firms face pressure to provide competitive fees and services.Prior research (e.g., Johnson and Lys 1990; Shu 2000) suggests a correlation between a change incapital structure (similar to the change caused by an IPO) and a change in audit firm. The relativelyhigh level of information asymmetry between management and investors at the time a firm goespublic requires that the client also consider the credibility supplied by an audit firm (Simunic andStein 1987). In support of the importance of credibility, Beatty (1989) finds that higher reputationaudit firms add value to their clients by reducing underpricing. As a result, such firms earn higheraudit fees. Finally, the IPO setting facilitates a powerful test of our theory because audit fees ofestablished companies may not reflect the same degree of competition due to the transaction costsinvolved in changing audit firms (DeAngelo 1981) and the lack of impending change in corporatestructure.
To gain a better understanding of the types of fees included in the accounting fee disclosure weconsulted professional literature on the topic. According to Coopers & Lybrand�s A Guide to GoingPublic (1997), the accounting fees that IPO firms can be expected to pay to auditors (and that aredisclosed in the registration statement):
will vary depending on such factors as the time the accountants must spend reviewing theregistration statement, the level of requests from the underwriter for �comfort,� the need to reviewquarterly data, and whether there are significant accounting issues to be resolved. Fees for the(accompanying) audits of the financial statements will vary depending on the size of the companyand the number of years audited.
Given this characterization, we believe that the accounting expenses reported in an IPO filing arehighly correlated with �audit fees.� Clearly, the review of quarterly data and the resolution ofaccounting issues fall under the scope of audit procedures. Furthermore, the �comfort� provided tothe underwriters involves, in large part, information that is audit-related. Specifically, the comfortletters seek to assure the underwriters that the accountant is independent of the IPO firm, that theaudited financials comply with the SEC�s accounting requirements, that any unaudited informationcomplies with GAAP, and that there have been no significant negative changes in operating perfor-mance after the most recent unaudited information (that has already been verified to be consistentwith GAAP).
Prior research also suggests that U.S. IPO audit fee data provide insights that are similar to thosegenerated from non-IPO data. Beatty (1993) compares his sample of IPO audit fees to Francis andSimon�s (1987) sample collected via survey from non-IPO firms. The comparison of fee modelsusing the different data sources suggests that inferences based on IPO data are very similar toinferences based on survey data from non-IPO firms. Beatty (1993) notes that the R2s from modelsutilizing IPO fee data are lower than those from fee models based on non-IPO fee data. The lowerR2s in an IPO context likely reflect the greater variation in audit effort needed in preparing a widerange of young firms for the public equity market.8 We acknowledge that while IPO fees and auditfees appear similar based on prior research, our results may not generalize to audit fees charged toestablished companies.
8 Our fee information is based on the accounting fees reported in the prospectuses of IPOs, similar to Beatty (1993),Willenborg (1999), and Fargher et al. (2000). Note that early studies involving IPO fees used all miscellaneous fees,including nonaccounting related fees (Beatty 1989).

Auditing: A Journal of Practice & Theory, September 2003
40 Auditing, September 2003
SAMPLE AND DESCRIPTIVE STATISTICSSample Selection and Summary Data
We used the Securities Data Company (SDC) Worldwide New Issues database to identify allinitial public equity offerings brought to market between 1991 and 1997. Our initial sample of 3,602observations includes firms having nonmissing SDC records for IPO accounting fees and IPOauditor and excludes, consistent with previous research, best-efforts underwritings, unit offerings,closed-end mutual fund offerings, and REIT offerings. We were unable to use 1,150 firms for whichCompustat reported missing data for the variables in our regression analysis. We also eliminatedofferings occurring in industries with ten or fewer Compustat observations, consistent with Hoganand Jeter (1999), and offerings handled by non-Big 6 firms, reducing our sample to 2,301 observa-tions.9 After applying the methods of Belsley et al. (1980) to identify and eliminate excessivelyinfluential observations, our final sample includes 2,294 offerings.10
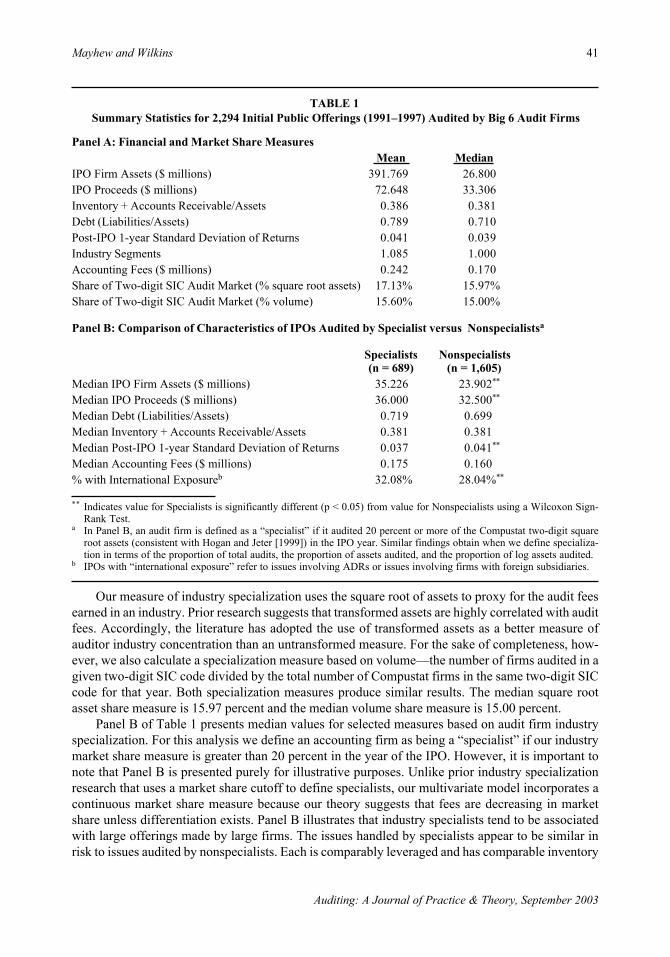
Panel A of Table 1 summarizes various firm-specific characteristics related to our sample ofIPOs. Due to the presence of a few offerings made by very large firms (e.g., Lucent Technologies,Hartford Life, France Telecom), median values are more representative of the sample as a whole andthus will be the focus of our discussion. Median pre-IPO total assets for our sample are roughly $27million and the median IPO issue proceeds are roughly $33 million. The median fee earned byaccounting firms is $170,000. Based on all three metrics the issues we investigate are considerablylarger than those examined by Willenborg (1999) and Lee et al. (2001). This finding is not surpris-ing, however, due to the former�s emphasis on Development Stage Enterprises and the latter�s focuson the Australian IPO market where issues are rather small.
Panel A of Table 1 also presents general information related to audit firm specialization. For themarket specialization measure based on total assets, we use the method of Hogan and Jeter (1999).Specifically, we calculate each accounting firm�s market share, per year, as the sum of the squareroot of assets of all firms it audited in a given two-digit SIC code divided by the sum of thesquare root of assets across all Compustat firms in the same two-digit SIC code.11 The followingequation describes our measure:
where:i = an index of audit firms;j = an index of client firms;k = an index of client industries;Ik = number of audit firms in industry k;
Jik = the number of clients served by audit firm i in industry k;Aiik = total client assets for audit by auditor i of client j in industry k; and
MSik = market share of auditor i in industry k.
9 First, our results are not sensitive to more restrictive cutoffs (20, 30, 40, or 50 firm industry minimums). We use the ten-firm cutoff to maximize the number of retained observations. Second, over 94 percent of the IPOs in our initial samplewere audited by Big 6 firms. Consistent with previous research, we do find a fee premium associated with Big 6 auditors.However, because the relationship between fees and client-specific measures of risk and complexity may depend on auditquality (and because the small number of non-Big 6 auditors precludes effective modeling of such differences), our testsexclude issues handled by non-Big 6 auditors.
10 Our hypothesis tests are not influenced by the retention or removal of outlying observations. However, the model�sexplanatory power is lower if the influential data points are not removed.
11 Hogan and Jeter (1999) sum the three largest market shares into a three-firm industry concentration ratio for the purposesof their study. Because we are investigating industry specialization by individual firms, we use a single-firm measure.
∑∑
∑
==
==ikk
ik
J
jijk
I
i
J
jijk
ik
A
A
MS
11
1
Mayhew and Wilkins 41
Auditing: A Journal of Practice & Theory, September 2003
TABLE 1Summary Statistics for 2,294 Initial Public Offerings (1991�1997) Audited by Big 6 Audit Firms
Panel A: Financial and Market Share MeasuresMean Median
IPO Firm Assets ($ millions) 391.769 26.800IPO Proceeds ($ millions) 72.648 33.306Inventory + Accounts Receivable/Assets 0.386 0.381Debt (Liabilities/Assets) 0.789 0.710Post-IPO 1-year Standard Deviation of Returns 0.041 0.039Industry Segments 1.085 1.000Accounting Fees ($ millions) 0.242 0.170Share of Two-digit SIC Audit Market (% square root assets) 17.13% 15.97%Share of Two-digit SIC Audit Market (% volume) 15.60% 15.00%
Panel B: Comparison of Characteristics of IPOs Audited by Specialist versus Nonspecialistsa
Specialists Nonspecialists(n = 689) (n = 1,605)
Median IPO Firm Assets ($ millions) 35.226 23.902**
Median IPO Proceeds ($ millions) 36.000 32.500**
Median Debt (Liabilities/Assets) 0.719 0.699Median Inventory + Accounts Receivable/Assets 0.381 0.381Median Post-IPO 1-year Standard Deviation of Returns 0.037 0.041**
Median Accounting Fees ($ millions) 0.175 0.160% with International Exposureb 32.08% 28.04%**
** Indicates value for Specialists is significantly different (p < 0.05) from value for Nonspecialists using a Wilcoxon Sign-Rank Test.
a In Panel B, an audit firm is defined as a �specialist� if it audited 20 percent or more of the Compustat two-digit squareroot assets (consistent with Hogan and Jeter [1999]) in the IPO year. Similar findings obtain when we define specializa-tion in terms of the proportion of total audits, the proportion of assets audited, and the proportion of log assets audited.
b IPOs with �international exposure� refer to issues involving ADRs or issues involving firms with foreign subsidiaries.
Our measure of industry specialization uses the square root of assets to proxy for the audit feesearned in an industry. Prior research suggests that transformed assets are highly correlated with auditfees. Accordingly, the literature has adopted the use of transformed assets as a better measure ofauditor industry concentration than an untransformed measure. For the sake of completeness, how-ever, we also calculate a specialization measure based on volume�the number of firms audited in agiven two-digit SIC code divided by the total number of Compustat firms in the same two-digit SICcode for that year. Both specialization measures produce similar results. The median square rootasset share measure is 15.97 percent and the median volume share measure is 15.00 percent.
Panel B of Table 1 presents median values for selected measures based on audit firm industryspecialization. For this analysis we define an accounting firm as being a �specialist� if our industrymarket share measure is greater than 20 percent in the year of the IPO. However, it is important tonote that Panel B is presented purely for illustrative purposes. Unlike prior industry specializationresearch that uses a market share cutoff to define specialists, our multivariate model incorporates acontinuous market share measure because our theory suggests that fees are decreasing in marketshare unless differentiation exists. Panel B illustrates that industry specialists tend to be associatedwith large offerings made by large firms. The issues handled by specialists appear to be similar inrisk to issues audited by nonspecialists. Each is comparably leveraged and has comparable inventory

Auditing: A Journal of Practice & Theory, September 2003
42 Auditing, September 2003
and receivables as a percentage of total assets, but specialist-audited firms have lower returnsvariance after the issue. Finally, Panel B suggests that specialists, on average, do not earn feepremiums relative to nonspecialists. We examine this relationship more fully in our multivariateanalysis.
Industry Specialization and IPO StatisticsIn Table 2 we present audit firm specialization data and industry-specific IPO data. Panel A
shows the distribution of audit specialists over time. For each year between 1991 and 1997 we usedthe Compustat tapes to determine the number of times each Big 6 firm had more than a 20 percentaudit market share (again, based on percent square root of assets) in any two-digit SIC code. Duringthis time period, Arthur Andersen and Ernst &Young were specialists in more industries than any ofthe other firms and Coopers & Lybrand and Price Waterhouse had the smallest degree of specializa-tion. We also find, consistent with Neal and Riley (2001), that the individual industries in whichfirms specialize remain relatively constant over time. Furthermore, the fact that the two firms withthe least degree of industry specialization merged just after the end of our sample period suggeststhat industry specialization may have been a motivating factor in the merger. If all observations forthese two accounting firms were combined�effectively creating the PricewaterhouseCoopers firmfor our sample period�the combined firm would have the largest degree of industry specialization(an average of approximately 39 industries per year).
In Panel B of Table 2 we show the distribution of offerings for all industries having more than50 IPOs between 1991 and 1997. The highest volume IPO industry is two-digit SIC code 73, with442 issues during the sample period. Of these 442 issues, 236 come from the �prepackaged soft-ware� classification (SIC code 7372). The second highest volume industry is two-digit SIC 36,comprising semiconductors, electronic components, communications equipment, and the like. Fiveindustries�two-digit SIC codes of 28, 35, 36, 38, and 73�account for more than 5 percent of thetotal issues individually and over 45 percent of the total issues as a group. Because these are theindustries that are likely to have the greatest growth potential, we control for them explicitly in ourempirical analysis.
Audit Firm DifferentiationIn Table 3 we present a breakdown of audit firm differentiation by industry. For the purposes of
both this table and our multivariate tests, we define an audit firm as �differentiated� if it had thehighest audit market share in the industry (two-digit SIC) during the IPO year and if its market sharewas at least ten percentage points higher than the nearest audit competitor in that industry. Table 3shows that only a few audit firms in our IPO sample are classified as �differentiated� in every sampleyear. However, it is not the case that audit firms drop in and out of this classification at random. Insome cases, the audit firm is the industry leader in every sample year, but does not always have a 10percent lead over its nearest competitor. Ernst & Young, for example, was the industry-leading auditfirm in SIC 14 throughout the sample period. However, they were not classified as differentiated in1997 because their decreasing market share only gave them a five-point lead over their nearestcompetitor. In other cases, the audit firm steadily gains both clients and market share over time untilit is classified as differentiated. For example, Arthur Andersen only audited 5 percent of the marketshare in SIC 17 in the early 1990s, but increased its share to 35 percent (29 percent of the availableclients) by the mid-1990s. As a result, it was the differentiated auditor for this industry for the lasttwo years of our sample period.
Based on our specification, 40 percent of the differentiated auditor IPO observations are associ-ated with Ernst & Young and 23 percent are associated with Arthur Andersen. These findings are notsurprising, given that these two firms are responsible for bringing the most IPOs to market. What is

Mayhew and Wilkins 43
Auditing: A Journal of Practice & Theory, September 2003
most interesting is that 75 percent of the differentiated Ernst & Young observations occur in IPOsinvolving Health Services. The greatest IPO concentration for Andersen is in Lumber and WoodProducts (5 of its 22 differentiated issues) and Electric, Gas, and Sanitary Services (6 of its 22differentiated issues). Although the remaining firms were not differentiated as frequently, there aredistinct concentrations within these observations as well. For example, 14 of the 15 issues for whichDeloitte & Touche was the differentiated auditor involved retail�four in General Merchandise, fourin Food Stores or Eating and Drinking Places, and six in Apparel and Accessory Stores. Similarly,eight of the nine issues in which KPMG Peat Marwick was the differentiated industry auditorinvolved financial institutions, and all four of the differentiated issues associated with Price Waterhouseinvolved Educational Services. In sum, while this information does not answer the question of how
TABLE 2
Audit Firm Specialization Data and Industry IPO Data
Panel A: Number of Compustat Two-Digit Industries (not restricted to IPO firms) in Which Accounting Firm Has > = 20 percent of Square Root of Assets Market Sharea
Accounting Firm 1991 1992 1993 1994 1995 1996 1997Arthur Andersen 22 19 21 19 20 24 25Coopers & Lybrand 4 5 7 9 6 6 8Ernst & Young 29 30 27 27 28 30 30Deloitte & Touche 21 19 16 15 14 14 15KPMG Peat Marwick 19 19 18 17 18 13 17Price Waterhouse 10 10 10 9 9 10 12
Panel B: Industries Having > = 50 Initial Public Offerings between 1991 and 1997
Two-Digit SIC Code 1991 1992 1993 1994 1995 1996 1997 Total28 � Chemicals and Allied Products 13 32 20 6 17 26 21 13535 � Industrial and Commercial Machinery 8 12 29 17 24 19 15 12436 � Electrical Equipment 11 26 42 26 32 35 27 19937 � Transportation Equipment 2 7 13 8 5 7 8 5038 � Measuring/Photographic Equipment 11 29 21 9 14 54 19 15748 � Communications 4 8 22 17 15 32 14 11250 � Durable Goods: Wholesale 5 6 11 9 7 15 12 6559 � Miscellaneous Retail 3 12 10 7 5 12 7 5673 � Business Services 21 36 32 45 76 143 69 42280 � Health Services 22 25 10 10 12 15 9 10387 � Engineering/Accounting Services 7 5 7 8 10 18 14 69Total 107 198 217 162 217 376 215 1492All Other Industries 57 114 170 117 77 151 116 802Total Sample IPOs 164 312 387 279 294 527 331 2294
a We omitted all Compustat industries having fewer than ten observations in any given year, consistent with Hogan andJeter (1999). We tested more restrictive cutoffs for inclusion (20, 30, 40, and 50 firm minimums) with no impact on thesignificance of our treatment variables. There are an average of 61 two-digit industries per year that have more than tenobservations. Each industry can have more than one auditor designated as a specialist (i.e., >20 percent market share).

Auditing: A Journal of Practice & Theory, September 2003
44 Auditing, September 2003
audit firms become industry specialists, it does illustrate that the IPO industries where differentiationtends to be most heavily concentrated�e.g., health care organizations and financial services�require a good deal of very specialized knowledge. We maintain that an audit firm�s ability todistinguish itself as the leader in industries such as these should allow it to charge a premium for itsservices.
TABLE 3Audit Firm Differentiation among IPOs Occurring between 1991 and 1997
Mean AuditAudit Firm Industry SIC # IPOs Market Sharea
Arthur Andersen Electric, Gas and Sanitary Servicesb 49 6 0.354Lumber and Wood Productsb 24 5 0.520Amusements, Recreation 79 4 0.436Hotels, Other Lodging Places 70 3 0.373Special Trade Construction 17 2 0.377Auto Dealers/Gas Stations 55 1 0.295Engineering/Accounting Services 87 1 0.272
Coopers & Lybrand Communications 48 5 0.334Heavy Construction 16 1 0.351Tobacco Products 21 1 0.797Personal Services 72 1 0.382
Ernst & Young Health Servicesb 80 30 0.342Textile Mill Products 22 4 0.359Mining, Quarry Nonmetal Minerals 14 2 0.496Transportation Services 47 2 0.457Motor Freight Warehouses 42 1 0.431
Deloitte & Touche Apparel and Accessory Stores 56 6 0.321General Merchandise Stores 53 4 0.329Food Stores 54 2 0.345Eating and Drinking Places 58 2 0.341Security and Commodity Brokers 62 1 0.338
KPMG Peat Marwick Nondepository Credit Institutions 61 7 0.330Depository Institutions 60 1 0.706Furniture and Fixtures 25 1 0.353
Price Waterhouse Educational Services 82 4 0.414
�Differentiated� audit firms are audit firms having both the highest two-digit SIC audit market share (defined in terms ofsquare root percent of assets) and a market share lead of at least ten percentage points over the closest audit competitor inthe year of the IPO.
a Mean audit market share is calculated as the simple mean of the audit firm�s two-digit SIC audit market share (based onCompustat) across all represented IPO years. For example, Ernst & Young was the differentiated auditor in 30 healthservices IPOs between 1991 and 1997. The mean audit market share of 0.342 reported above is the average Ernst &Young audit market share across all sample years, weighted by the proportion of its total health services IPOs occurring ineach sample year. Ernst & Young�s simple average health services audit market share across the sample period is 0.344.
b Identifies audit firms that are �differentiated� (as defined above) in the given industry in all seven sample years.

Mayhew and Wilkins 45
Auditing: A Journal of Practice & Theory, September 2003
12 Our set of control variables is also directly comparable to those used by Beatty (1993) and Copley and Douthett (2002).The only differences involve the omission of a variable identifying firms with qualified audit opinions (this variable isinsignificant in both previous studies), and our implementation of FOREIGN and SEGMENTS. We use a Compustat-based proxy for FOREIGN and we use SEGMENTS, rather than the number of subsidiaries, as a control for complexity.Our use of these measures, which are valid proxies for both constructs, is based on data availability.
13 The use of STDRET as a risk factor assumes that auditors can estimate future equity risk before the IPO occurs. Thisassumption does not seem to be unreasonable, and is implicit in the use of this and comparable variables�e.g., marketmodel residual variance and market model root mean square error�in other IPO studies (e.g., Copley and Douthett 2002;Fargher et al. 2000; Clarkson and Simunic 1994).
EMPIRICAL METHOD AND RESULTSEmpirical Method
Previous research suggests several determinants of audit fees that are associated with initialpublic offerings. The model presented in this study builds directly from the model estimated byFargher et al. (2000), adding new variables related to growth potential, auditor industry specialization,and the ability of an audit firm to differentiate itself from competitors.12 The form of our model is asfollows:ACCTFEEj = γ1 + γ2 ASSETSj + γ3 PROCEEDSj + γ4 INVRECj + γ5 DEBTj + γ6STDRETj
+ γ7 FOREIGNj + γ8 SEGMENTS j + γ9 SEC20j + γ10 LENDING j+ γ11�γ16 YEAR j + γ17 TOP5 j + γ18 AUDSHR j + γ19DIFFERENTIATED j + εj. (1)
In Equation (1), ACCTFEE is the log of the fees paid to the accounting firm associated with theIPO. We include the log of pre-IPO total assets (ASSETS) to proxy for the effort required in the auditengagement and the log of the issue size (PROCEEDS) to control for the implicit insurance coverageprovided by the audit firm (Willenborg 1999). Both measures also provide a general control for theinfluence of firm size on fees. The next three variables serve as risk proxies. INVREC (DEBT)represents the firm�s inventories and receivables (total liabilities) scaled by total assets in the yearprior to the IPO, and STDRET, calculated as the one-year post-IPO standard deviation of commonstock returns, is a proxy for the market�s perception of IPO firm risk.13 If audit firms charge apremium for clients with greater levels of risk, the coefficients for these variables should be positive.
We include FOREIGN to control for the complexities associated with IPOs involving newlycross-listed companies (i.e., issues involving ADRs) and/or domestic firms with foreign subsidiaries(proxied by the presence of foreign income taxes). FOREIGN is equal to 1 for IPOs having either ofthese characteristics and is equal to 0 otherwise. Similar to Willenborg (1999) and Fargher et al.(2000), we expect the coefficient on FOREIGN to be positive. We also include the number ofCompustat industry segments (SEGMENTS) as a further control for the complexity of the issue.
We include two variables aimed at capturing the relationship between IPO audit fees andcommercial bank underwriting. (See Fargher et al. 2000 for details.) SEC20 is equal to 1 if theunderwriter is a commercial bank Section 20 subsidiary and 0 otherwise, and LENDING is equal to 1(0) if the commercial bank underwriter had (did not have) a lending relationship with the IPO firmprior to the public offering. We expect the coefficient for SEC20 to be positive because commercialbank (i.e., less experienced) underwriters are likely to require more assistance from audit firms inthe IPO process. However, the coefficient for LENDING should be negative if the previous lendingrelationship mitigates the commercial bank underwriter�s need for additional assistance.
We include TOP5 as a control variable to address fee issues that are present in high-growth IPOindustries. TOP5 is an indicator variable that identifies all IPOs in the industries comprising morethan 5 percent of the IPO observations across the sample period (SIC codes of 28, 35, 36, 38, and73�see Table 2 for details). Given that these five industries account for over 45 percent of the totalofferings included in our sample, we believe that these are the areas offering the highest fee growthpotential. In addition, we anticipate that accounting firms have gained considerable IPO-relatedexperience in these industries. As a result, the marginal costs associated with these offerings should

Auditing: A Journal of Practice & Theory, September 2003
46 Auditing, September 2003
be lower, allowing audit firms to maintain profit margins while reducing the absolute level of theiraudit fees. If either or both of these factors (growth potential and/or IPO-related economies of scale)are important in IPO pricing, the coefficient should be negative.
Finally, we expect fees to exhibit general inflationary characteristics. We model these effects byincluding sequential dummy variables (YEAR) to control for time-specific factors occurring acrossthe sample period. We omitted 1991 so that each YEAR coefficient from 1992 through 1997 repre-sents the increase in audit fees relative to the 1991 level.14
The primary variables of interest for our study are AUDSHR and DIFFERENTIATED. We useAUDSHR, defined as the audit firm�s percent square root of assets audited in the client�s industryduring the IPO year, to test H1. We include DIFFERENTIATED in Equation (1) to test H2. Asdiscussed previously, DIFFERENTIATED is equal to 1 if the audit firm had the highest market sharein the industry (two-digit SIC) during the IPO year and if its market share was at least ten percentagepoints higher than the nearest audit competitor in that industry. Practically speaking, the coefficienton DIFFERENTIATED measures the fee premium relative to nondifferentiated auditors that isattributable to the accounting firm being the clear market leader. Because any measure of �differen-tiation� could be viewed as subjective, we investigate alternative specifications of DIFFERENTI-ATED in our sensitivity tests.
We expect the following for AUDSHR and DIFFERENTIATED. We predict that audit fees willbe significantly related to an accounting firm�s market share in an industry. However, as suggestedby H1 and H2, we do not expect a single relationship to hold across all ranges of industry specializa-tion. For example, audit firms operating under significant, industry-related economies of scale maynot have as much of an incentive to discount their fees if they have a clear lead over competing auditfirms. Stated differently, because its market share allows it to offer a quality-differentiated product, adifferentiated audit firm should possess the bargaining power necessary to charge more for itsservices. As a result, while we expect the sign for AUDSHR to be negative, we predict that thecoefficient for DIFFERENTIATED will be positive (i.e., we expect a fee premium when differentia-tion exists).
ResultsTable 4 reveals the same general fee-based relationships documented in prior research.15 Offer-
ings that are larger, riskier, and more complex result in higher audit fees. A fee premium also existswhen a less experienced (i.e., commercial bank) underwriter brings the IPO to market. We find thatfees are lower in the most common IPO industries, suggesting the presence either of economies ofscale attributable to typical IPO-related duties or a discount afforded to firms in the highest-volumeindustries. Our adjusted R2 of 0.263 is smaller than what typically is reported in research dealingwith annual audit fees, but is directly comparable to values associated with other IPO fee models(e.g., Fargher et al. 2000; Willenborg 1999).
With respect to our hypotheses, the coefficient on AUDSHR is negative and significant.16 Thisresult supports H1 and suggests that as industry market share (i.e., specialization) increases, auditfirms pass along to their clients a significant portion of the benefits attributable to economies ofscale. These findings are also consistent with Johnson and Lys (1990) in that the IPO context may
14 We also included a single, continuous measure of YEAR (taking values between 1991 and 1997) in Equation (1) and,alternatively, estimated the pooled model across two and three different subperiods. Our findings are not sensitive to anyof these specifications.
15 Although a number of the independent variables are correlated, no Variance Inflation Factor exceeds 3. When we removesubsets of the most highly correlated independent variables our inferences regarding the remaining coefficients areunchanged.
16 Our model does not show evidence of significant heteroskedasticity. However, inferences regarding our test variables areunchanged when we use standard errors calculated using the method of White (1980).

Mayhew and Wilkins 47
Auditing: A Journal of Practice & Theory, September 2003
TABLE 4Results of Audit Fee Model for 2,294 Initial Public Offerings between 1991 and 1997
ACCTFEEj = γ1 + γ2 ASSETSj + γ3 PROCEEDSj + γ4 INVRECj + γ5 DEBTj + γ6 STDRETj+ γ7 FOREIGNj + γ8 SEGMENTS j + γ9 SEC20j + γ10 LENDING j + γ11�γ16 YEAR j+ γ17 TOP5 j + γ18 AUDSHR j + γ19 DIFFERENTIATED j + εj
Coefficient Predicted Sign Estimate p-valueIntercept + 8.628 0.001ASSETS + 0.031 0.006PROCEEDS + 0.277 0.001INVREC + 0.163 0.001DEBT + 0.045 0.006STDRET + 0.498 0.327FOREIGN + 0.131 0.001SEGMENTS + 0.016 0.294SEC20 + 0.127 0.023LENDING � �0.152 0.133YEAR92 + 0.012 0.424YEAR93 + 0.064 0.140YEAR94 + 0.212 0.001YEAR95 + 0.158 0.005YEAR96 + 0.241 0.001YEAR97 + 0.392 0.001TOP5 � �0.079 0.004AUDSHR � �0.616 0.003DIFFERENTIATED + 0.253 0.001Adj. R2 0.263
Because directional predictions are made, p-values are one-tailed.
ACCTFEE = ln of fees paid to the accounting firm associated with the IPO;ASSETS = ln of pre-IPO total assets;
PROCEEDS = ln of IPO issue proceeds;INVREC = inventory + accounts receivable/assets;
DEBT = total liabilities/total assets;STDRET = 250-day post-IPO standard deviation of returns;
FOREIGN = 1 if ADR or foreign subsidiary present, 0 otherwise;SEGMENTS = number of Compustat industry segments;
SEC20 = 1 if commercial bank Section 20 underwriter, 0 otherwise;LENDING = 1 if previous lending relationship existed, 0 otherwise;
YEAR92�97 = 1 if IPO is 1992�1997 (individually), 0 otherwise;TOP5 = 1 if industry accounts for > 5 percent of total sample IPOs (two-digit SIC of 28, 35, 36, 38,
or 73), 0 otherwise;AUDSHR = percent of two-digit SIC Compustat square root of assets audited for the year; and
DIFFERENTIATED = 1 if the IPO firm�s auditor has the largest audit market share in the IPO firm�s two-digit industryduring the IPO year and if the auditor has a market share lead of at least ten percentage pointsover its closest competitor, 0 otherwise.

Auditing: A Journal of Practice & Theory, September 2003
48 Auditing, September 2003
cause audit firms�even specialists�to provide their most competitive fee, given the pending changein both the client�s economic environment and its corporate governance structure.17
The data also support H2. The coefficient on DIFFERENTIATED is positive and significant,suggesting that differentiated audit firms earn a fee premium relative to other audit firms.18 Equation(1) is linear in logarithms, so the antilog of DIFFERENTIATED�s coefficient minus 1 represents thepercentage effect of a differentiated auditor on audit fees (Willenborg 1999; Halverson and Palmquist1980). The 0.253 coefficient for DIFFERENTIATED (natural log) translates into a 28.79 percentaverage premium for audit firms that successfully differentiate themselves from competitors.19 Thispremium suggests that differentiated audit firms supply services and/or value to their clients thataudit firms with lesser market shares in the same industry cannot readily supply. If there were nodifferences in the services offered in terms of quality or value, differentiated audit firms would beforced to lower their prices to reflect the economies of scale that they certainly possess.
ADDITIONAL ANALYSES AND SENSITIVITY TESTSAlternative Specifications for Differentiation
As an alternative measure of differentiation, we defined as DIFFERENTIATED any audit firmhaving a 15 (as opposed to 10) percentage point lead over its closest audit competitor. We alsodefined as DIFFERENTIATED audit firms having an industry audit market share in the top 5 percentof industry audit market shares across all industry-years covered by our sample period (practicallyspeaking, all auditors with greater than 30.4 percent industry market share). Finally, we defined asDIFFERENTIATED only those IPO observations in which the audit firm was the differentiatedauditor in every sample year (i.e., those marked with asterisks in Table 3). Our findings with all ofthese alternative specifications are virtually identical to the findings presented in Table 4. That is,specialists that dominate their industries are able to charge a significant premium for their services.
We then tried three specifications that broaden the differentiation definition. Our purpose in thisanalysis is to illustrate that a specialist audit firm must be the clear industry leader in order to earn afee premium. First, we defined as DIFFERENTIATED any industry-leading audit firm having amarket share at least 7.5 percentage points (again, rather than 10 percentage points) greater than thatof its closest audit competitor. With this specification the coefficient for DIFFERENTIATED re-mains positive, but is only marginally significant (p < 0.09). This finding suggests that the linedividing differentiated auditors from nondifferentiated auditors begins to blur below a 10 percentmarket share lead.
We then leveled the playing field further by decreasing the required market share lead to fivepercentage points and then, alternatively, defining as DIFFERENTIATED any audit firm simply
17 Higher market share auditors tend to be involved with IPOs that have lower standard deviation in returns (see Table 1); asa result, it is possible that AUDSHR is capturing an omitted risk factor. However, our model captures a variety of otherclient-specific risk factors: firm size, balance sheet risk, and equity risk. Furthermore, standard deviation of returns isinsignificant in the fee model suggesting that it does not play an important role in fees.
18 Relative to a model that does not include AUDSHR and DIFFERENTIATED , the joint inclusion of these two variablesoffers a significant improvement (p < 0.01) in the model�s explanatory power. Also, when we define AUDSHR as a binaryvariable identifying observations where the audit firm had a market share of at least 20 percent during the IPO year, ourresults are qualitatively unchanged�AUDHSR remains negative and significant and DIFFERENTIATED remains posi-tive and significant.
19 For example, if we ignore the effect of the YEAR variable, the TOP5 variable and the variables dealing with Section 20underwriting, a non-DIFFERENTIATED firm having the median value of all other independent variables would have apredicted IPO accounting fee of $141,604. If the same client hired a DIFFERENTIATED audit firm, its predicted IPOaccounting fee would be $182,366. Note that this assumes the same level of market share when comparing a DIFFEREN-TIATED audit firm to a non-DIFFERENTIATED audit firm. Some of the premium would be offset by the impact of theincreased market share when moving to the DIFFERENTIATED position. For example: a firm that moved from 20percent to 30 percent market share and became a DIFFERENTIATED audit firm would have the premium offset by 10percent * .616 = .0616 or about 6.3 percent.
Mayhew and Wilkins 49
Auditing: A Journal of Practice & Theory, September 2003
having the highest market share in its industry (irrespective of competitors, as in Ferguson andStokes [2002]). With both of these specifications the coefficient for DIFFERENTIATED is insignifi-cant. These findings suggest that an audit firm�s market share lead relative to its competitors isextremely important in determining its relative bargaining power. Stated differently, a �small� mar-ket share lead does not equate to significant perceived differentiation; as a result, it is less likely thatfee premiums can be earned.
Large versus Small ClientsCraswell et al. (1995) show that Australian audit specialists earn a fee premium but that the
premium is attributable entirely to large clients. For our sample of U.S. initial public offerings weestimate separate models for small (below median assets) and large (above median assets) clientsand find general support for H1 and H2 in both size segments. Specifically, AUDSHR and DIFFER-ENTIATED are appropriately signed in both models. Furthermore, the p-values are very similar tothose presented in Table 4, with the exception of DIFFERENTIATED in the large firm segment (p< 0.12). Coefficients for the measures of balance sheet risk and complexity are significant in bothmodels.
The weaker results for DIFFERENTIATED in the large firm segment may be related to modelspecification issues. Of the 50 financial institution IPOs in the complete sample, 47 involve largeclients. When these observations are excluded from the analysis (a practice relatively common in thefee literature) the coefficients for AUDSHR and DIFFERENTIATED in the large client model aredirectly comparable to those in the small firm model (p < 0.03 in all cases).20 We retain financialinstitutions in the overall model because their inclusion or exclusion does not affect our results. Analternative explanation is that the weaker finding for DIFFERENTIATED among large clients mayindicate that large clients have more bargaining power with auditors than do small clients.
Industry EffectsTable 3 shows that the health services industry makes up approximately 30 percent of the
differentiated observations. To ensure that DIFFERENTIATED is not simply capturing a fee pre-mium attributable to a particular industry in which a number of nonstandard audit issues likely exist,we included an additional indicator variable (HEALTH) defining firms in this industry. Although thecoefficient for HEALTH is positive and significant (p < 0.02), the coefficients for both AUDSHR andDIFFERENTIATED remain significant as well (p < 0.01). Similar findings obtain when we includean indicator variable defining financial institutions; that is, the relationship between fees and bothaudit market share and differentiation remain statistically significant after accounting for the fixedeffects of these highly specialized industries.
As a more general control for industry effects, we removed TOP5 from Equation (1) and re-estimated the model with indicator variables for each industry represented in the sample.21 BothAUDSHR and DIFFERENTIATED remain appropriately signed and statistically significant (p< 0.01 and p < 0.04, respectively) in this panel data model. Thus, both dynamics are importantdrivers of IPO accounting fees, even after controlling for time- and industry-specific fee factors.
20 Because AUDHSR is based on percent square root assets audited as opposed to percent of total audit fees, it measuresaudit market share with error. To the extent that DIFFERENTIATED is correlated with high levels of AUDSHR , it isconceivable that DIFFERENTIATED is picking up some of the measurement error in AUDSHR. The significance of bothvariables in both the small and large client subsamples, however, leads us to believe that the measurement error inAUDSHR is not a significant empirical issue for our set of IPO firms.
21 Because TOP5 is a linear combination of five industry-specific dummy variables, it cannot be included in a completefixed-effects model.

Auditing: A Journal of Practice & Theory, September 2003
50 Auditing, September 2003
Audit Firm EffectsTo ensure that no single accounting firm is responsible for our findings, we estimated Equation
(1) six times with each individual Big 6 audit firm removed. Our results are not affected by theinclusion or exclusion of any particular firm. Finally, we estimated a reduced form of Equation (1)for specialists only (defined as in Table 2 as audit firms having 20 percent market share or greater) toensure that low market share audit firms are not unduly influencing our findings. In this model, likethat presented in Table 4, audit fees are significantly higher (p < 0.01) when the audit firm is adifferentiated firm.
DISCUSSIONIn this paper, we apply Porter�s (1985) analysis to an audit setting. Specifically, we propose that
audit firms have an incentive to develop industry specializations in order to differentiate themselvesfrom competitors; if successful, we suggest that such differentiation can lead to higher audit firmprofitability. We argue that an audit firm�s industry market share provides a measure of the degree towhich it has succeeded in differentiating itself from other audit firms. We find that, on average,industry specialist audit firms (measured by industry market share) pass along a significant portionof the economy-of-scale-based savings to their clients entering the IPO market. However, when auditfirms differentiate themselves from industry competitors they earn fee premiums.
Consistent with most previous on audit or audit fees, data constraints prevent us from directlyexamining cost advantages and many other important aspects of market differentiation. We alsoacknowledge that our results are based on empirical proxies for audit fees and auditor specialization(i.e., IPO accounting fees and asset-based market share, respectively) rather than on the underlyingmeasures themselves. With respect to this particular limitation, additional survey-based studies inthe spirit of Behn et al. (1997) may be able to address many of the remaining questions regarding thepros and cons of industry specialization for both audit firms and clients.
Our findings do provide insights into how the Big 6 accounting firms use industry specializationas a differentiation strategy. Our results may be helpful to regulators as they consider the costs andbenefits associated with varying levels of audit market concentration. Specifically, the findingspresented in this paper demonstrate that when audit firms are not able to differentiate themselves viamarket share, clients benefit through lower fees. However, market-leading audit firms are able todemand higher fees as compensation for their higher-quality services. Along these same lines, ourresults suggest that researchers need to consider the degree of differentiation between audit firms andthe resulting impact on bargaining power between auditors and clients when conducting audit-fee-based research. As data allow, future researchers may wish to examine more directly the impact ofPorter�s Five Forces on the nature of client-auditor relationships and on the influence of theserelationships on the provision of audit and nonaudit services.
REFERENCESAmerican Institute of Certified Public Accountants (AICPA). 1997. Codification of Statements on Auditing
Standards. New York, NY: AICPA.Balsam, S., J. Krishnan, and J. S. Yang. 2000. Auditor industry specialization and the earnings response
coefficient. Working paper, Temple University.Beatty, R. P. 1989. Auditor reputation and the pricing of initial public offerings. The Accounting Review 64:
693�709.���. 1993. Economic determinants of auditor compensation. Journal of Accounting Research 31: 294�302.Behn, B. K, J. V. Carcello, D. R. Hermanson, and R. H. Hermanson. 1997. The determinants of audit client
satisfaction among clients of Big 6 firms. Accounting Horizons 11: 7�24.Belsley, D. A., E. Kuh, and R. E. Welsch. 1980. Regression Diagnostics: Identifying Influential Data and
Sources of Collinearity. New York, NY: John Wiley.

Mayhew and Wilkins 51
Auditing: A Journal of Practice & Theory, September 2003
Berton, L. 1995. Price Waterhouse managers realign to cover specialized industry lines. Wall Street Journal(June 28): B5.
Carcello, J., and A. Nagy. 2002. Auditor industry specialization and fraudulent financial reporting. Workingpaper, University of Tennessee.
Chan, D. K., A. Ferguson, D. A. Simunic, and D. Stokes. 2001. A spatial analysis and test of oligopolisticcompetition in the market for assurance services. Working paper, University of British Columbia.
Clarkson, P. M., and D. A. Simunic. 1994. The association between audit quality, retained ownership, andfirm-specific risk in U.S. vs. Canadian IPO markets. Journal of Accounting and Economics 17: 207�228.
Coopers & Lybrand. 1997. A Guide to Going Public. Second edition. New York, NY: Coopers & Lybrand.Copley, P. A., and E. B. Douthett. 2002. The association between audit quality, ownership retained, and
earnings disclosure by firms making initial public offerings. Contemporary Accounting Research 19 (1):49�75.
Craswell, A.T., J. R. Francis, and S. L. Taylor. 1995. Auditor brand name reputations and industry specializa-tions. Journal of Accounting and Economics 20: 297�322.
Cullinan, C. P. 1998. Evidence of non-Big 6 market specialization and pricing power in a niche assuranceservice market. Auditing: A Journal of Practice & Theory 17: 47�57.
DeAngelo, E. 1981. Auditor independence, low-balling, and disclosure regulation. Journal of Accounting andEconomics 3: 113�127.
Dunn, K. A., and B. W. Mayhew. 2002. Disclosure quality and auditor choice. Working paper, University ofWisconsin�Madison.
Fargher, N. L., L. P. Fields, and M. S. Wilkins. 2000. The impact on IPO assurance fees of commercial bankentry into the equity underwriting market. Auditing: A Journal of Practice & Theory 19: 23�35.
Ferguson, A., and D. Stokes. 2002. Brand name audit pricing, industry specialization and industry leadershippremiums post Big 8 and Big 6 mergers. Contemporary Accounting Research 19: 77�110.
Fields, L. P., D. Fraser, and M. S. Wilkins. 2002. An investigation of the pricing of risk in bank audits.Working paper, Texas A&M University.
Francis, J. R., and D. T. Simon. 1987. A test of audit pricing in the small-client segment of the U.S. auditmarket. The Accounting Review 62: 145�157
Gramling, A. A., V. E. Johnson, and I. K. Khurana. 2000. The association between audit firm industryexperience and financial reporting quality. Working paper, Georgia State University.
Halversen, R., and R. Palmquist. 1980. The interpretation of dummy variables in semilogarithmic equations.American Economic Review: 474�75.
Hogan, C. 1997. Costs and benefits of audit quality in the IPO market: A self-selection analysis. The Account-ing Review 72: 67�86.
���, and D. C. Jeter. 1999. Industry specialization by auditors. Auditing: A Journal of Practice & Theory18: 1�17.
Johnson, B., and T. Lys. 1990. The market for audit services: Evidence from voluntary auditor changes.Journal of Accounting and Economics 12: 281�308.
Kinney, W. R., and R. D. Martin. 1994. Does auditing reduce bias in financial reporting? A review of audit-related adjustment studies. Auditing: A Journal of Practice & Theory 13: 149�156.
Kwon, S. Y. 1996. The impact of competition within the client�s industry on the auditor selection decision.Auditing: A Journal of Practice & Theory 15: 53�70.
Lee, P., D. Stokes, S. Taylor, and T. Walter. 2001. The association between audit quality, accounting disclo-sures and firm-specific risk: Evidence from the Australian IPO market. Working paper, University ofSydney.
Neal, T. L., and R. R. Riley. 2001. Audit specialist designations: measurement considerations. Working paper,University of Kentucky.
Nelson, M. W., J. A. Elliot, and R. L. Tarpley. 2002. Evidence from auditors about managers� and auditors�earnings-management decisions. The Accounting Review 77 (Supplement): 175�202.
O�Keefe, T., D. Simunic, and M. Stein. 1994. The production of audit services: Evidence from a major publicaccounting firm. Journal of Accounting Research 32: 241�261.

Auditing: A Journal of Practice & Theory, September 2003
52 Auditing, September 2003
Owhoso, V. E., W. F. Messier, and J. Lynch. 2002. Error detection by industry-specialized teams duringsequential audit review. Journal of Accounting Research 40: 883�900.
Palmrose, Z-V. 1986. Audit fees and auditor size: Further evidence. Journal of Accounting Research 24: 97�110.
Pearson, T., and G. Trompeter. 1994. Competition in the market for audit services: The effect of supplierconcentration on audit fees. Contemporary Accounting Research 11: 115�135.
Porter, M. E. 1985. Competitive Advantage: Creating and Sustaining Superior Performance. New York, NY:Free Press.
Shu, S. Z. 2000. Auditor resignations: Clientele effects and legal liability. Journal of Accounting and Econom-ics 29: 173�206.
Simunic, D., and M. Stein. 1987. Product Differentiation in Auditing: Auditor Choice in the Market ofUnseasoned New Issues. Vancouver, BC: Canadian Certified General Accountants� Research Foundation.
Solomon, I., M. Shields, and O. R. Whittington. 1999. What do industry auditors know? Journal of AccountingResearch 37: 191�208.
Stein, M., D. Simunic, and T. O�Keefe. 1994. Industry differences in the production of audit services. Audit-ing: A Journal of Practice & Theory 13: 128�143.
Taylor, M. 2000. Bounded rationality, uncertainty, and competence: The effects of industry specialization onauditors� inherent risk assessments. Contemporary Accounting Research 17: 693�712.
White, H. 1980. A heteroscedasticity-consistent covariance matrix estimator and a direct test for heteroscedasticity.Econometrica 48: 817�838.
Willenborg, M. 1999. Empirical analysis of the economic demand for auditing in the initial public offeringsmarket. Journal of Accounting Research 37: 225�238.
���. 2002. Discussion of brand name audit pricing, industry specialization and industry leadership premi-ums post Big 8 and Big 6 mergers. Contemporary Accounting Research 19: 111�117.