Embed Size (px)
Citation preview
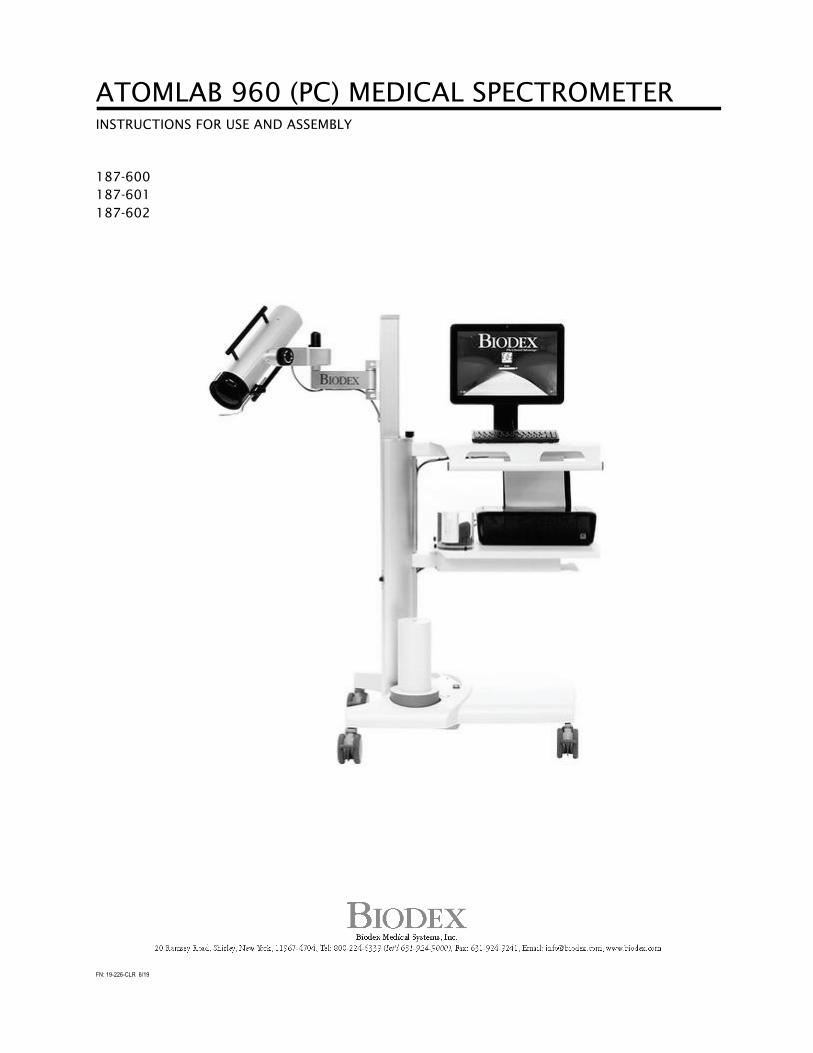
ATOMLAB 960 (PC) MEDICAL SPECTROMETER
INSTRUCTIONS FOR USE AND ASSEMBLY
187-600 187-601187-602
FN: 19-226-CLR 6/19

2
Atomlab 960 (PC) Medical Spectrometer
This instructions for use document covers safe operation of the Atomlab 960 (PC) Medical Spectrometer – 187-600, 187-601, and 187-602.
Additional information and resources are available upon request or directly from the Biodex website, http://www.biodex.com.
If the desired information is not found, please contact a local distributor or Biodex directly at [email protected].
Thank you,
Biodex Medical Systems, Inc.
Contact information
Manufactured by: Biodex Medical Systems, Inc. 20 Ramsey Road, Shirley, New York, 11967-4704 Tel: 800-224-6339 (Int’l 631-924-9000) Fax: 631-924-8355 email: [email protected] www.biodex.com
3
Table of Contents Definition of Symbols ................................................................................................................ 6
Before Proceeding ..................................................................................................................... 7
Biodex Warranty ........................................................................................................... 8
User Capacity ................................................................................................................ 8
Product Certifications and Classifications .................................................................................. 9
Important Safety Information .................................................................................................. 10
Unpacking Instructions ........................................................................................................... 11
1. Introduction ...................................................................................................................... 14
2. Assembly Instructions ....................................................................................................... 15
Relocating the Thyroid Uptake Stand ........................................................................... 17
Thyroid Uptake Stand Operation ................................................................................... 17
Power Up and Self Test ................................................................................................ 18
Changing the Date/Time and Time Zone ...................................................................... 19
International Date/Time/Number Format Settings ........................................................ 23
Date Format Software Settings ..................................................................................... 25
3. Computer Preliminaries ..................................................................................................... 27
Windows Format .......................................................................................................... 27
Touchscreen and Keyboard Operation ......................................................................... 27
The Home Page ........................................................................................................... 27
System-Wide Icons ....................................................................................................... 28
Turning the System Off ................................................................................................ 29
Locking the Panel ........................................................................................................ 29
4. Utilities ............................................................................................................................. 30
The Utilities Menu ........................................................................................................ 30
System Setup ............................................................................................................... 30
General Screen ............................................................................................................ 31
Thyroid Uptake Screen ................................................................................................. 32
Wipe Parameter Screen ................................................................................................ 33
Bioassay Screen ........................................................................................................... 34
Spectrum Graph Screen ............................................................................................... 36
Constancy Screen ........................................................................................................ 37
Detectors ..................................................................................................................... 37

4
Procedures .................................................................................................................. 40
Procedure Management ............................................................................................... 40
Edit a Procedure or Enter Normal Ranges for a Procedure ............................................ 41
Delete a Procedure ...................................................................................................... 41
Staff Members ............................................................................................................. 42
Isotopes ...................................................................................................................... 43
The Isotopes Screen ..................................................................................................... 44
Add a New (User Defined) Isotope ................................................................................ 44
How ROI is Determined ................................................................................................ 45
Efficiency for the Selected Detector and Isotopes ......................................................... 47
Bioassay Isotope Setup ................................................................................................ 50
Wipe Setup .................................................................................................................. 50
Bioassay Setup ............................................................................................................. 53
System Maintenance .................................................................................................... 56
Checkpoint Database ................................................................................................... 58
Backup Database (USB Flash Drive) .............................................................................. 59
Restore Database ......................................................................................................... 60
5. Quality Assurance ............................................................................................................. 62
Quality Assurance Information ..................................................................................... 62
Calibration/Constancy Fixtures .................................................................................... 63
High Voltage Adjustment ............................................................................................. 64
Daily Calibration and Constancy .................................................................................. 66
Perform a Daily Calibration or Constancy ..................................................................... 68
View, Print, or Save a Daily Calibration Report .............................................................. 69
Chi-Square ................................................................................................................... 73
MDA (Minimum Detectable Activity) ............................................................................. 75
6. Thyroid Uptake .................................................................................................................. 78
Performing a Thyroid Uptake ....................................................................................... 79
Thyroid Uptake with Multiplier ..................................................................................... 93
7. Manual Mode ..................................................................................................................... 96
Count in Manual Mode ................................................................................................. 96
8. Wipe Testing ..................................................................................................................... 98
9. Performing a Bioassay ..................................................................................................... 106
10. DICOM (Optional) ............................................................................................................ 114

5
DICOM Setup/Configuration ...................................................................................... 116
Add Patient from Worklist Server and Create a Study .................................................. 120
Send Uptake Report to Storage Server ........................................................................ 123
FAQ ........................................................................................................................... 125
11. Reports ........................................................................................................................... 128
Administrative Reports .............................................................................................. 128
QA Reports ................................................................................................................ 129
Print Isotope List ........................................................................................................ 144
Clinical Reports ......................................................................................................... 145
12. Spectrum Analysis ........................................................................................................... 152
13. Maintenance and Safety Inspection .................................................................................. 154
General Cleaning Instructions .................................................................................... 154
Maintaining the Printer ............................................................................................. 154
Disposal .................................................................................................................... 154
14. Specifications .................................................................................................................. 155

6
Definition of Symbols The following symbols and their associated definitions are used and implied throughout this manual.

7
Before Proceeding
Before getting started with any of the setups described in this manual, there are a few preliminary points to consider that will help ensure safe and smooth operation of the System.
SPECIFIC CAUTIONS
• Allow only qualified, trained personnel to operate or service this product. • If the equipment is used in a manner other than specified in this operation
manual, the protection provided by the equipment may be impaired and results could be compromised. The Thyroid Uptake Program is intended to count the patient’s thyroid and not unrelated organs.
• The touchscreen computer operates on low voltage and the power supply auto ranges from 100 to 240 volts input current. The uptake stand has a low leakage transformer that operates at 120 volt or 230 volt operation. The transformer is tapped at the factory for operation. The Atomlab 960 System is designed for use with specific printers. Contact Biodex for compatible printers.
• The pre-set ROIs (Region of Interest) are hard coded and cannot be changed by the user.
WARNING: All activities and count values on the sample reports in this manual are for illustration purposes only. They do not represent actual study values.
WARNING: The unit contains lead for shielding the detector from background radiation. Additional lead shielding can be used outside the detector to further reduce background or as a counterbalance. The lead should be disposed of in accordance with local and national regulations when disposing of the unit.
CAUTION: A sealed source should be used for calibration or consistency of the system each day the system is used.
CAUTION: The System should not be used if an issue requiring service by Biodex personnel is detected during inspection.
CAUTION: When service is required, the System should only be serviced by personnel authorized by Biodex. Failure to do so will void the warranty and no longer ensures safe operation.

8
CAUTION: Modifications to this product are only permitted by the manufacturer. Unauthorized modification of the product can result in hazards to the operator and patient, and will void the manufacturer’s warranty. Do not modify this equipment without authorization from the manufacturer.
Biodex Warranty
Refer to the warranty card included with the product or contact Biodex Support Services.
For additional technical advice, service or education information, contact:
Biodex Medical Systems, Inc. 20 Ramsey RoadShirley, New York 11967-4704 1-800-224-6339 (Int’l 631-924-9000) [email protected].
User Capacity
This product accommodates patients fitting the following profile:
• Height: up to 78 inches (6 ft, 6 in). • Weight: up to 500 lb
Operating Conditions:
Temperature: 10° C to 30° C (50° F to 86° F). Humidity Range: 30% to 70% (non-condensing).Atmospheric Pressure: 70kpa (10psi) to 106kpa (15psi).
Transport and Storage Conditions:
Temperature: -20° C to 70° C (-4° F to 158° F).Humidity Range: 10% to 100%. Atmospheric Pressure: Sea Level 101kpa (14.7psi) to 10,000 feet, 69 kpa (10.1 psi).
9
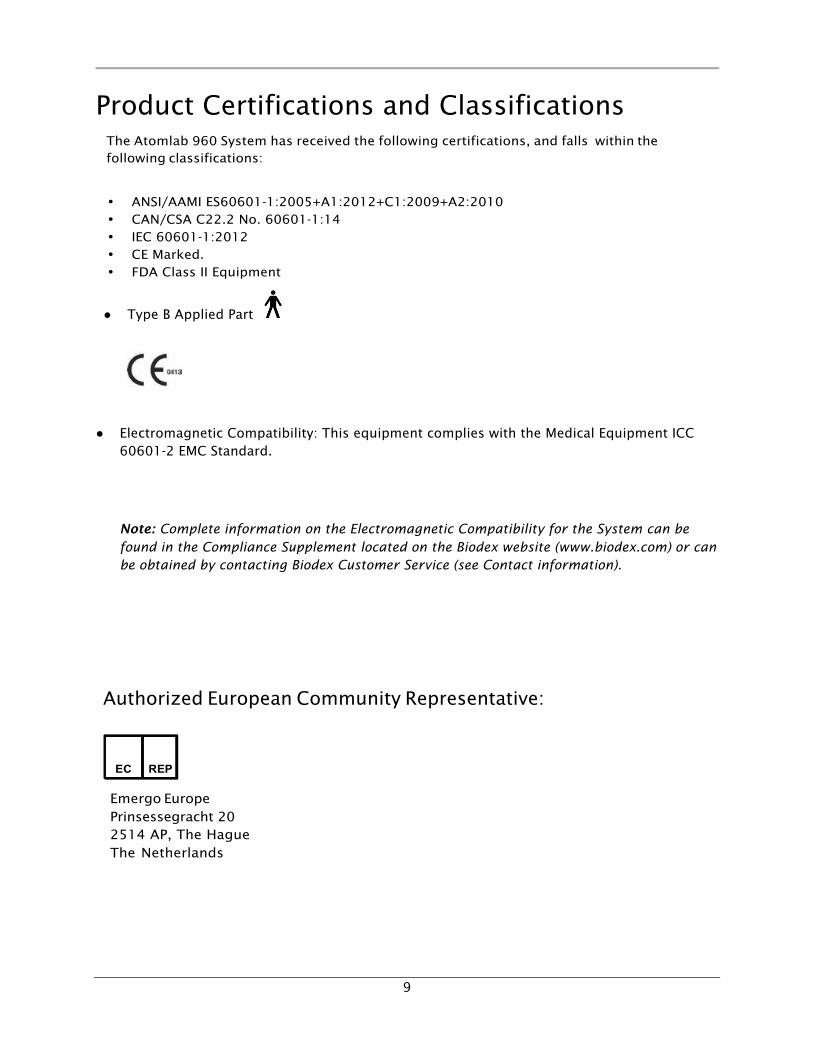
Product Certifications and Classifications The Atomlab 960 System has received the following certifications, and falls within the following classifications:
• ANSI/AAMI ES60601-1:2005+A1:2012+C1:2009+A2:2010 • CAN/CSA C22.2 No. 60601-1:14 • IEC 60601-1:2012 • CE Marked. • FDA Class II Equipment
! Type B Applied Part
! Electromagnetic Compatibility: This equipment complies with the Medical Equipment ICC 60601-2 EMC Standard.
Note: Complete information on the Electromagnetic Compatibility for the System can be found in the Compliance Supplement located on the Biodex website (www.biodex.com) or can be obtained by contacting Biodex Customer Service (see Contact information).
Authorized European Community Representative:
Emergo Europe Prinsessegracht 20 2514 AP, The Hague The Netherlands

10
Important Safety Information
CAUTION: Federal Law restricts this device to sale by, or on the order of a medical practitioner.
Follow the unpacking, assembly and installation instructions document.
Before using this device, read the entire operation manual carefully. Failure to read the manual may result in user error or inaccurate data. Be sure to save all provided documents for future reference.
Make certain to understand all warning and caution labels as explained in the Before Proceeding section of this manual.
This product should be used only as specified in the operation manual.
WARNING: The System is designed for use in a patient environment.
For product specifications, refer to the Table of Contents.
This medical electrical equipment requires special precautions regarding EMC and must be installed and placed into service according to EMC information provided in this manual. For Electromagnetic compliance definition, refer to the Compliance Supplement located on the Biodex website (www.biodex.com).
Reference Cleaning and Maintenance instructions in Table of Contents.
CAUTION: Operation for 187-600: 120 VAC, 60 Hz; 187-601 230 VAC, 50 Hz.
WARNING: Use only approved power supplies.
WARNING: Connecting electrical equipment to a multiple socket outlet (MSO) effectively leads to creating an ME SYSTEM, and can result in a reduced level of safety.
CAUTION: To avoid risk of electric shock, this equipment must only be connected to supply mains with protective earth.
CAUTION: The plug is considered the method of disconnecting the product from main power. Do not place the product in a position where the plug is not easily accessible.

11
Unpacking Instructions
NOTE: Two people are required to remove the system from the shipping pallet.
Required Tools:
• Knife • Medium Phillips Head Screwdriver
The system is shipped in a box on a pallet that contains a ramp as part of the packing material. This ramp is easily assembled to remove the system from the shipping pallet.
1. Cut the straps off the box that secures the system to the pallet. 2. Remove the contents from the box. If necessary, cut the tall box to remove it. 3. The plywood piece on top of the stand is a ramp to roll the stand out of the box. Slide the
2” ! 4” blocks on the end of the ramp under the pallet on the side with the collimator arm.
Figure 1.1. Unpack the ramp and slide it into the slots at the front of the pallet.
4. Remove any boxes that are shipped within the stand carton, which include the printer, touchscreen panel, and any other parts and place the packages aside.
5. Unpack the ramp and slide it into the slots at the front of the pallet. 6. Using a Phillips Head screwdriver, remove the block illustrated in Figure 1.2. Lift the unit
slightly and remove the second block.

12
Figure 1.2. Removing the illustrated blocks.
7. The stand is shipped with the weight supported by the metal frame on the bottom of the stand (no weight rests on the casters during shipment). Push from the side opposite the collimator arm. The wheels on the base under the arm will connect with the ramp system and slide forward. Each person is to grab a handle on the side of the upper shelf.
Figure 1.3 Using two people, grab the handles on the upper rack to remove the unit.
Using a Phillips Head screwdriver, remove this block first.
Lift up slightly and remove this block.

13
Slide the stand to the edge of the pallet and carefully roll the stand down the ramp onto the floor.
Figure 1.4. Using a person on each side, lift the units slightly while rolling towards and down the ramp.
8. Remove the plastic or protective wrappings and foam from around the arm and stand. 9. Refer to the Atomlab 960 Instruction Manual for Assembly and Use Instructions.

14
1. Introduction Intended Use
The Atomlab Thyroid Spectrometer is used by Nuclear Medicine departments as a radiation counter that is intended to count the patient’s thyroid. The device consists of a computer and either a NaI(Tl) detector in a collimated shield and/or a well counter.
Indications for Use
The Thyroid Uptake is typically used in nuclear medicine departments, clinics, and nuclear pharmacies to measure the radioactive level of a sample in counts, or counts per minute (cpm), using a 1024-channel, multi-channel analyzer. The counting spectrum is displayed during counting. It can also be used to perform thyroid uptake studies, manual mode counting, wipe testing, and bioassay measurements.
Each detector is connected to a multi-channel analyzer. The detectors are used to count radiation that hits the detector for the various functions for which they are used. The detector in the probe is used for performing thyroid uptake studies. The thyroid uptake consists of counting a radioactive dose before it is given to the patient and after a period of time, the patient returns and the thyroid is counted in the same geometry in which the dose was counted. Patient background is also counted. The computer system calculates the decayed values for the dose; therefore, a standard dose of the same activity is not counted when the patient thyroid and background are counted. A standard formula is used for calculating the thyroid uptake. Thyroid uptake allows measurement of global function of the thyroid gland as reflected by the quantitative evaluation of radiotracer accumulation by the gland.
The heart of the Atomlab 960 is a microprocessor-controlled, 1024-channel Multi-Channel Analyzer, coupled to a 2" x 2" NaI(Tl) detector with a personal computer interface. The system offers simple, straight-forward operation using 32, pre-programmed isotopes, unlimited user-defined isotopes, and menu-driven prompts to guide the user step by step through each procedure. The pre-programmed isotopes include I-123, I-125, I-131, Co-57, Cr-51, Tc-99m, Tl-201 and Cs-137. The user-defined isotopes also allow for isotope identification while the printer provides hard copy printouts for patient and department record keeping.
The Atomlab 960 has a memory allowing storage of an unlimited number of patients with multiple uptakes on each. Additional features include an automatic self-diagnostic program, automatic calibration mode, choice of manual counting procedures for uptake studies, with automatic isotope decay correction of uptake measurements. These features help make this the most simple and accurate System available today.
Contraindications
The contraindications to thyroid testing: the patient is incapable of swallowing a pill or liquid.

15
2. Assembly Instructions *The Neck Phantom and the Well Counter are optional accessories.
Figure 2.1. The Atomlab 960 MCA Uptake Stand
Required Tools:
• Knife • Medium Phillips screwdriver • Adjustable wrench
Collimator Arm Handle
Collimator Arm Rotation Release
Collimator Handle
Collimator Lock Knob
Collimator Column Release/Lock
Panel PC
Keyboard
Computer Shelf
Printer
Printer Shelf
Base
Caster Lock
Well Counter in Recess (Optional)
Power Switch
Neck Phantom (Optional)
Calibration Fixture
Target LED Handle

16
Assembly Procedure:
1. Remove the uptake stand from its shipping box and place it in an area suitable for assembly and setup. Move the arm of the unit out from under the shelf to allow full access.
2. Ensure that power to the uptake stand remains off for the entire procedure. 3. Take the touchscreen display out of its box and place it face down. 4. Take the adjustable height display stand out of its box and connect it to the back of the
touchscreen display. The connectors go toward the bottom of the display when mounted. 5. Take the monitor stand and mount it into the holes in the top surface of the upper shelf and
fasten securely from under the top shelf with the four nuts provided.
NOTE: The monitor normally is mounted with the uptake arm to the left of the operator.
This puts the stand to the left of the operator. If the stand needs to be to the right of the
operator, the stand needs to be mounted on the opposite side of the upper shelf.
NOTE: If the update arm is mounted to the operator’s right, move the printer wires.
Take a Phillips screwdriver and remove the four screws under the sides of the printer
shelf (middle shelf). The shelf lifts off. Move the two wires from the slot they are in to the
slot on the other side of the shelf support arm. Put the shelf back on and reinstall the
screws. This is necessary to have enough cable length for the printer.
NOTE: The wires that come up through the upper shelf must be moved to come through the holes next to the moved monitor arm.
6. The stand is pre-wired, but the power and detector wires from the display need to be connected to the computer. The connectors for the collimator and the well should be inserted into the USB ports on the rear side of the display.
7. Unpack the keyboard and place it on the upper shelf. 8. Place the printer on the middle shelf and connect to the pre-installed wires for the signal
and power. The other end of the power cable is already connected to the power strip at the bottom of the stand. The power switch is located on the bottom shelf near the upright column.
9. If a well counter was purchased, place it on the side of the stand toward the operator. This will make it easy to place the wipes or samples into the well counter.
10. The collimator is pre-wired for the uptake arm. If using a well counter, connect the power and signal cables to the well counter. The cables are in the column.
The Atomlab 960 is fully set up and ready for operation.
HP Printer Setup (included with system)
To set the HP Printer as the default, view the Windows menu and select the model that is connected to the system as the default. Follow the standard Windows format for setting a device as the default printer.
17
To set the default printer
With the printer connected and the system turned on, press the Windows key at bottom leftof the keyboard. The Windows menu will appear; select “Devices and Printers”. This will open the “Devices and Printers” window; select the appropriate HP Printer model. Highlight printer, press and hold the printer icon. Once circle appears on the printer icon (this may take several seconds), release the icon. Once the menu appears, select “set as default printer”. A green checkmark will appear confirming the selection of the default printer. The printer default process is complete. Close all windows and return to the Atomlab program.
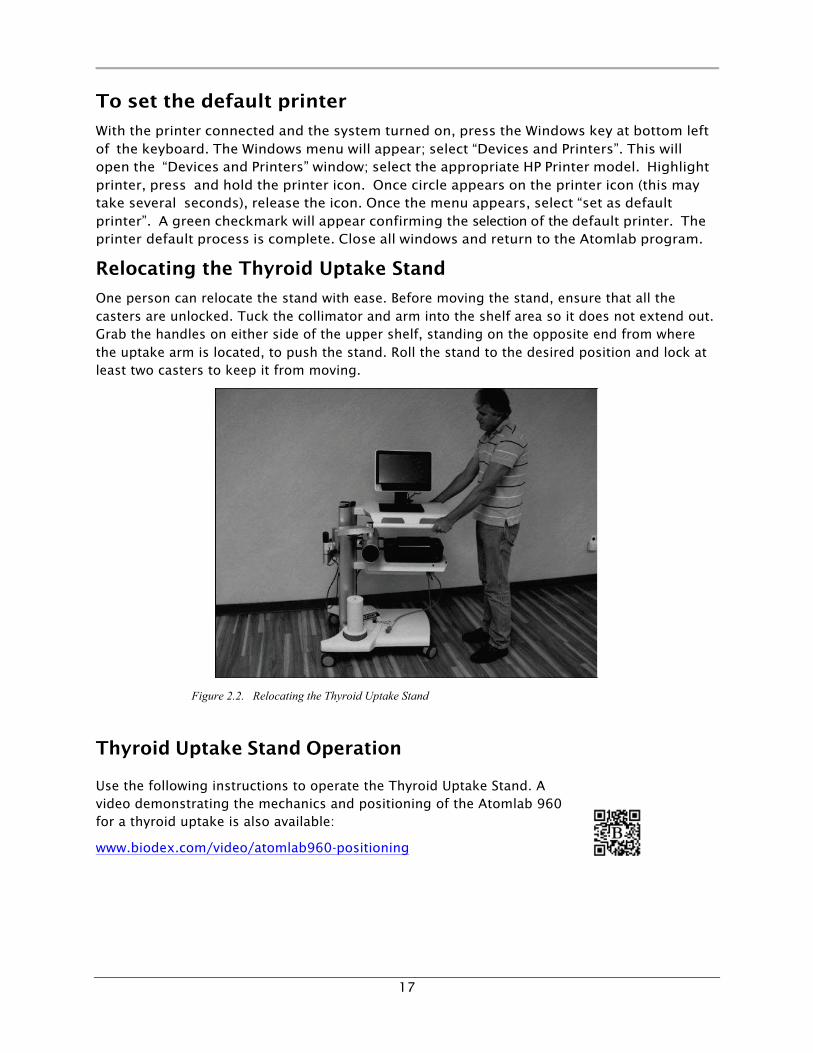
Relocating the Thyroid Uptake Stand
One person can relocate the stand with ease. Before moving the stand, ensure that all the casters are unlocked. Tuck the collimator and arm into the shelf area so it does not extend out. Grab the handles on either side of the upper shelf, standing on the opposite end from where the uptake arm is located, to push the stand. Roll the stand to the desired position and lock at least two casters to keep it from moving.
Figure 2.2. Relocating the Thyroid Uptake Stand
Thyroid Uptake Stand Operation
Use the following instructions to operate the Thyroid Uptake Stand. A video demonstrating the mechanics and positioning of the Atomlab 960 for a thyroid uptake is also available:
www.biodex.com/video/atomlab960-positioning

18
1. The uptake arm is raised and lowered with the aid of gas spring assist. A locking knob
is located on the upright column and once the uptake arm position set, it can be
locked ensuring it can only be raised, not lowered, in the locked position.
CAUTION: Engage collimator arm safety lock to prevent column from lowering.
2. The arm has two pivot points and two rotational points. One pivot point is located on the arm next to the upright column. The other pivot is located at the arm's elbow joint.
3. There is a lock for the pivot that is located on the collimator where it connects to the arm. This keeps the collimator from turning and locks it into position. There are handles on either side of the collimator that make it easy to adjust the collimator and lock it into the desired position.
4. A release that allows the collimator to rotate is located in the knuckle joint between the two arm sections. The collimator can rotate 90 degrees in either direction that allows the collimator to rotate side to side and up or down. This allows the collimator to easily count the patient's neck, and be repositioned for the patient's thigh.
5. The whole arm will pivot and turn allowing the user to place the neck phantom onto the middle shelf and set the collimator up for counting of the capsule in the neck phantom.
6. A red LED light can be flipped out from the rim into the center of the collimator face to help align the thyroid position. Remember to flip the LED back to the retracted position before counting.
WARNING: The same geometry used for counting the sample/capsule or lab background must be used for counting the thyroid and/or patient background. The system calculation assumes the same geometry when comparing counts to counts. The user must also ensure that the collimator is at a right angle to the neck phantom and the thyroid for counting to retain the correct geometry.
The Thyroid Uptake is fully set up and ready for operation.
Power Up and Self Test
Figure 2.3. The Thyroid Uptake Home Page.
19
To Power Up And Run The Self Test:
Turn on all components, including the printer. The system may immediately advance to the Atomlab 960 program. If not, select <Atomlab960> from the system desktop. Once the program is activated, the system immediately performs a self test.
A user name and password must be entered. The factory default user name is Biodex and the password is Biodex. The user name and password are case sensitive. To change the password, contact the Biodex Service/Technical department.
NOTE: A detector must be installed before any counting can be performed.
Once the self test is complete, the system automatically advances to the Atomlab 960 Home
screen. Allow the system some time to warm-up before counting. The system is ready for
use.
Changing the Date/Time and Time Zone
The operating system of this panel is Windows Embedded Standard 7. The following procedure of changing Date/Time is the standard change Date/Time process of any Windows operating system.
Prerequisite:
In order to change the Date/Time or Time Zone, one needs to login with “Biodex” username. (If currently logged in as any other user, log off from that user and relogin to the system as “Biodex”.)
NOTE: When performing this operation, it is recommended that a USB mouse is connected to the panel.
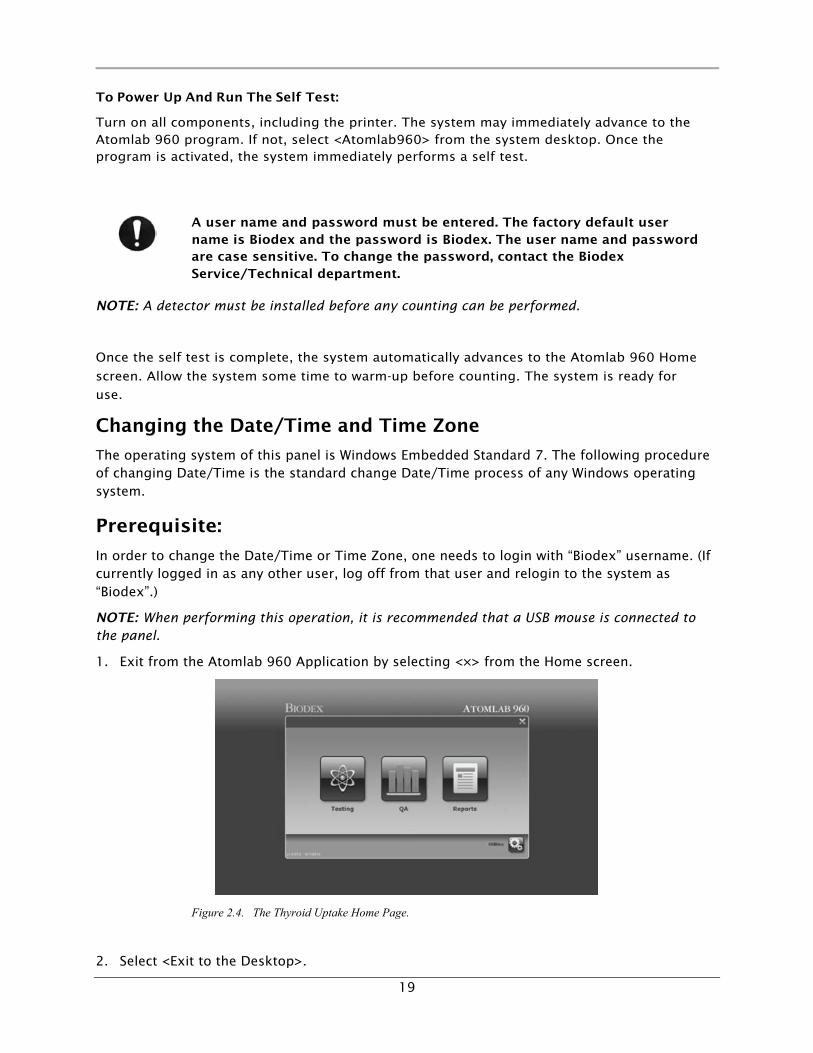
1. Exit from the Atomlab 960 Application by selecting <!> from the Home screen.
Figure 2.4. The Thyroid Uptake Home Page.
2. Select <Exit to the Desktop>.

20
3. Move the cursor to the bottom-right corner of the screen. The hidden taskbar of the window is visible. Select the displayed Date/Time on the taskbar. A small window pops up displaying the clock and current month calendar.
Figure 2.5. Desktop Screen with Analog Clock and Calendar Displayed.
4. Select <Change Date and Time> Settings.
Figure 2.6. Desktop Screen with <Change date and time settings> Highlighted.
21
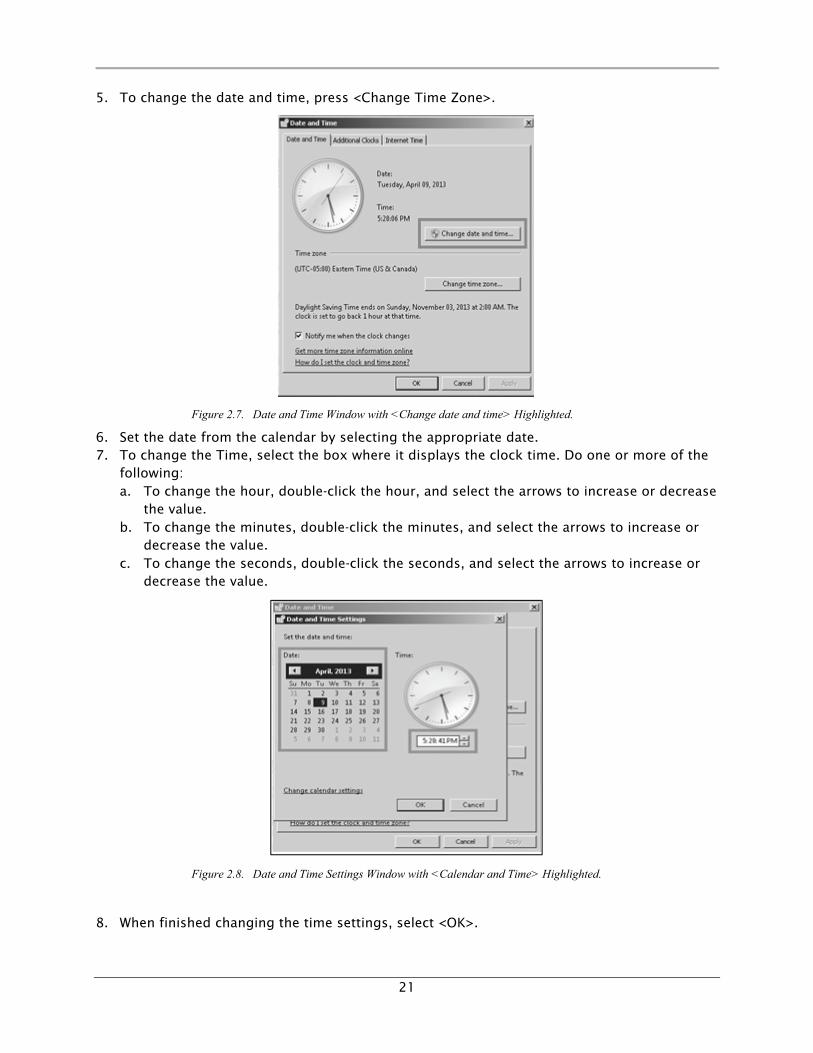
5. To change the date and time, press <Change Time Zone>.
Figure 2.7. Date and Time Window with <Change date and time> Highlighted.
6. Set the date from the calendar by selecting the appropriate date. 7. To change the Time, select the box where it displays the clock time. Do one or more of the
following: a. To change the hour, double-click the hour, and select the arrows to increase or decrease
the value. b. To change the minutes, double-click the minutes, and select the arrows to increase or
decrease the value. c. To change the seconds, double-click the seconds, and select the arrows to increase or
decrease the value.
Figure 2.8. Date and Time Settings Window with <Calendar and Time> Highlighted.
8. When finished changing the time settings, select <OK>.

22
9. To change the time zone, select <Change time zone>.
Figure 2.9. Date and Time Window with <Change time zone…> Highlighted.
10. In the Time Zone Settings dialog box, select the current time zone from the drop-down list, and click OK.
Figure 2.10. Time Zone Settings Dialog Box.
NOTE: If the time zone observes daylight savings time and the computer’s clock is to be adjusted automatically when daylight savings time changes, the <Automatically adjust clock for Daylight Savings Time> must be selected.
11. Select <OK> button at the bottom of the Date and Time screen to return to the desktop.
23
International Date/Time/Number Format Settings
The Atomlab 960 is able to support different Date/Time/Number formats to accommodate customers in various countries around the world. Changing these formats requires adjustments in two main steps:
1. Regional Settings of the Panel – The software runs on a Windows Operating System. The Regional settings on the Panel must be changed in the manner described in this section.
2. Date format settings on software - The Date format on the software must match the Regional Settings.
NOTE: It should be noted that currently the program does not support different languages. Only Date/Time/Number format can be configured.
In the following example the panel operating system and Atomlab 960 software are being configured to be changed from the English Date format to the Swedish Date format.
Regional Settings of the Panel
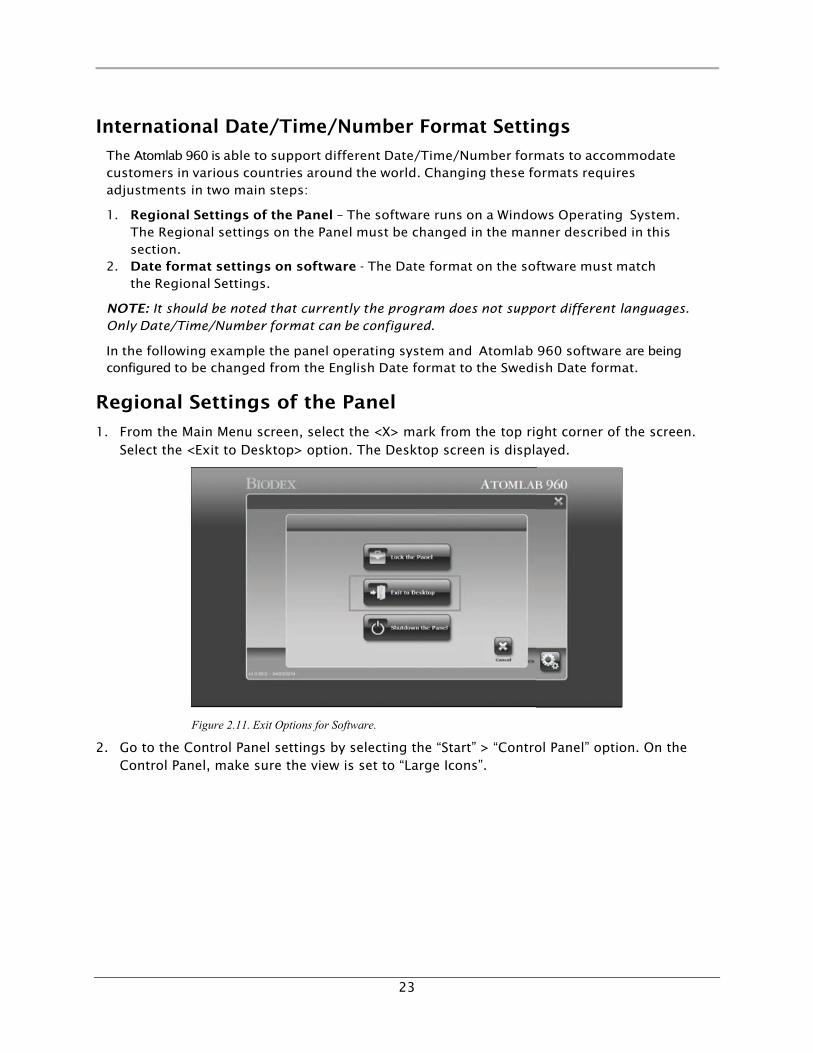
1. From the Main Menu screen, select the <X> mark from the top right corner of the screen. Select the <Exit to Desktop> option. The Desktop screen is displayed.
Figure 2.11. Exit Options for Software.
2. Go to the Control Panel settings by selecting the “Start” > “Control Panel” option. On the Control Panel, make sure the view is set to “Large Icons”.

24
Figure 2.12. Panel Operating System Settings - <Start> – Control Panel.
3. Select Region and Language.
Figure 2.13. Panel Operating System Settings – Control Panel.
4. The current settings of the Panel are displayed. By default it is set to “English” (United States). Make the changes as required for Date and Time (Figure 2.14). Click on “Additional Settings” button for number format on that screen. In this example, we are changing the settings to “Swedish” (Sweden).

25
Figure 2.14. System Default Settings System’s Settings after Necessary Changes
NOTE: Once the change in Regional settings is complete, it is recommended to update/change the time zone of the panel as well, if needed.
5. The Date/Time/Number formatting is set within the Panel. Proceed to the Date format settings to complete these changes.
Date Format Software Settings
1. Start the Thyroid Uptake program. 2. At the Home Page, select <Utilities>. The Utilities screen is displayed. Select <System
Setup>. 3. On the System Setup screen, by default, the General tab information is displayed. Under the
General tab, locate the “Date Format” option. Select the Date format that matches the Regional Settings Date format by selecting the <Up> and <Down> button beside the “Date Format”. Underneath the format textbox, it will display the date format with an example.
For this example, the Date format in Regional Settings was changed to “yyyy-MM-dd”. In the Atomlab 960 software, the same date format was matched and set to (yyyy-MM-dd). The software displays the current date using the specified format.
NOTE: Without matching the date format in the software and the Regional Settings, the system will not display the correct date format in the software.
NOTE: For international settings, make sure the units are set to Becquerels.
26
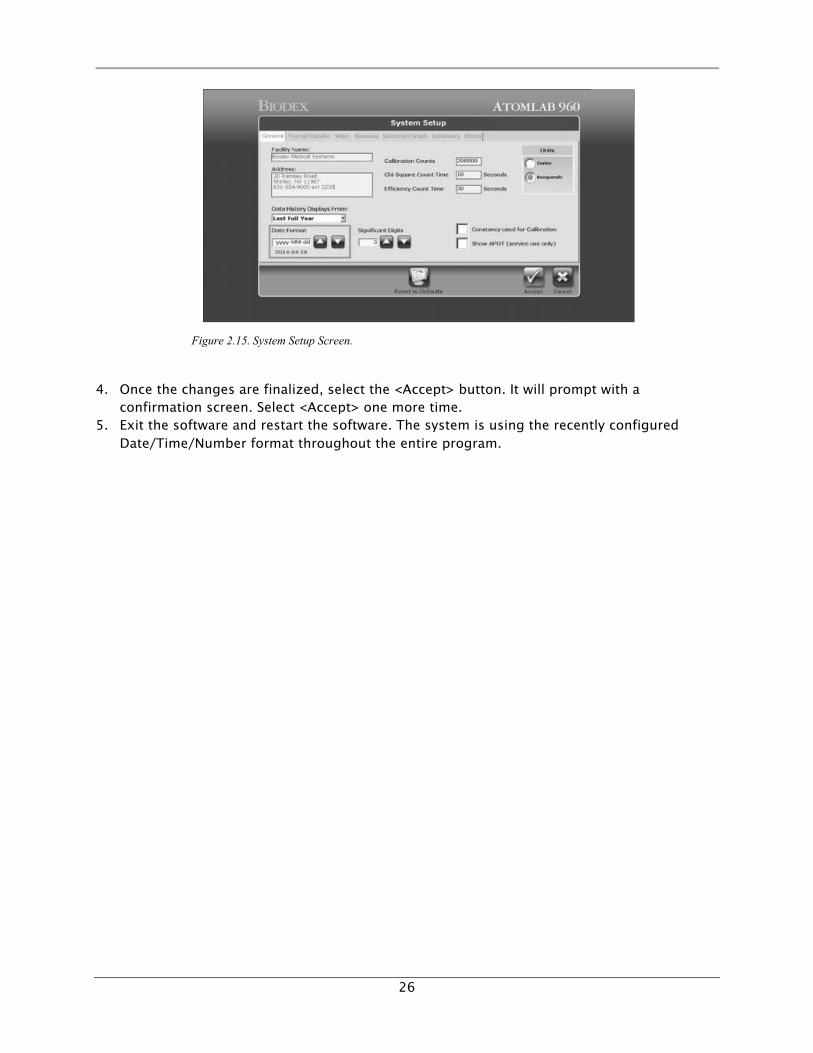
Figure 2.15. System Setup Screen.
4. Once the changes are finalized, select the <Accept> button. It will prompt with a confirmation screen. Select <Accept> one more time.
5. Exit the software and restart the software. The system is using the recently configured Date/Time/Number format throughout the entire program.

27
3. Computer Preliminaries
Figure 3.1. The Thyroid Uptake Allows Users to Select Options Using the Keyboard and the Touchscreen Operation. Data is Generally Entered in Appropriate Fields via the Keyboard.
Windows Format
The Atomlab 960 is a personal computer based system. All menus and screens function in standard Windows fashion. Each screen alerts the user, either through screen prompts or icons, as to all available options. Some options are available from every screen, others are offered only on selected screens and some are specific only to the operation being performed.
Touchscreen and Keyboard Operation
While numeric data is entered into the system by simply typing on the keyboard, options, menus and pages can be selected via the touchscreen display or optional, user supplied mouse. For touchscreen operation, touch the desired icon. For mouse operation, locate the cursor over the desired icon or field and click to select.
The Home Page
From the Windows Desktop page, select the <Atomlab 960> icon to access the Atomlab 960 Home page. Once the Atomlab 960 program is activated, the system immediately performs a self test and displays the Home screen. It is from this screen where access to the individual Atomlab 960 functions begins. Simply select the appropriate icon to advance to the Testing, QA, Reports or Utilities pages. Each page is described in detail in the chapters that follow.

28
System-Wide Icons
Figure 3.2. The System Features a Variety of Icons used Throughout Including <Back>, <Add>, <Edit> and <Delete> as illustrated above.
Several functions used on numerous pages throughout the program are represented by icons located at the bottom of the screens to which they apply. Simply select any of these icons to advance to the function or screen described.
Table 3.1. System-Wide Icons Include: Icon Description
<Home>: Select at any time to return to the Home page.
<Back>: Select back to exit to the previous screen.
<Add>: Allows an item to be added to the current operation. ! For example, on the Isotope page, select this icon to add an ! isotope.
<Edit>: Allows the user to select and edit the item displayed or ! highlighted.
<Save>: Saves any changes or new information entered on ! the current page.
<Delete>: Deletes the information entered or selected. ! For example, if a patient was entered and ! the user is finished with that patient, the patient can be deleted from ! the system memory. (See note below.)
<Accept>: Confirm the data entered or displayed is correct and should be ! stored.
<Abort/Cancel>: Cancels the current operation or entry without saving any changes
<Search>: Use the Search icon for information such as a name or I.D. #.<Close>: Closes any current window.
<Efficiency>: Enters, measures or uses factory defined efficiencies for each isotope associated with wipe.

29
Icon Description
<Reports>: Advance to the available printout options for a selected patient, QA function, etc.
<Spectrum Analysis> After most counting functions select this icon to view a full page display showing the Spectrum Analysis. The user can adjust ROIs, add ROIs and move a cursor to see the energy and counts associated with different energies.
NOTE: The <Delete> function is not an immediate action. The system provides the user the opportunity to cancel the function if selected in error. A prompt is displayed and only after selecting the <Accept> icon is the item/record deleted. Select <Cancel> to exit back to the previous screen without deleting the item/record.
Turning the System Off
To Turn the System Off:
1. Return to the Home screen by selecting the <Home> icon or selecting <Back>. 2. At the Home page, select <X> from the upper right corner to close the program.
Figure 3.3. Select <Exit to Desktop> to Turn off the System.
3. Select <Exit to Desktop>. 4. To turn the computer OFF, select the <Windows> icon in the lower left corner of the screen
and select <Shut Down>. The computer will power down. 5. Another option is to select <Shut Down the Panel> to turn off the computer.
NOTE: Step 4 is a standard Windows Operation.
Locking the Panel
1. From the Home screen select <!> from the upper right corner to close the program. 2. Select <Lock the Panel> to close and lock the panel. The screen will require the user to re-
enter the Password to use the system.
NOTE: Locking the panel does not turn off the computer.

30
4. Utilities
Figure 4.1. The Utilities Menu Provides Access to Functions for Entering, Setting or Defining System-Wide Parameters.
The Utilities Menu
Selecting the <Utilities> icon from the bottom right corner of the Home screen allows access to the Utilities Menu. Utilities Menu options include:
• System Setup • Detectors • Procedures • Staff Members • Isotopes • Wipe Setup • Bioassay Setup • System Maintenance
System Setup
The System Setup function allows the user to enter system-wide information. Information is entered/selected in the appropriate areas of the program by selecting from the tab choices at the top of the screen. These include:
• General • Thyroid Uptake • Wipe • Bioassay
• Spectrum Graph • Constancy • DICOM
NOTE: Default values are provided for some settings on the System Setup screen. To return to the default values after changes have been made, select the <Defaults> icon at the bottom of the screen. Select <Accept> at the “Caution prompt to reset all system settings to their factory defaults.”
31
To Access the System Setup Screen:
1. From the <Home> screen, select the <Utilities> icon. The Utilities Menu is displayed.2. Select <System Setup>. (The screen defaults to the General tab.)
General Screen
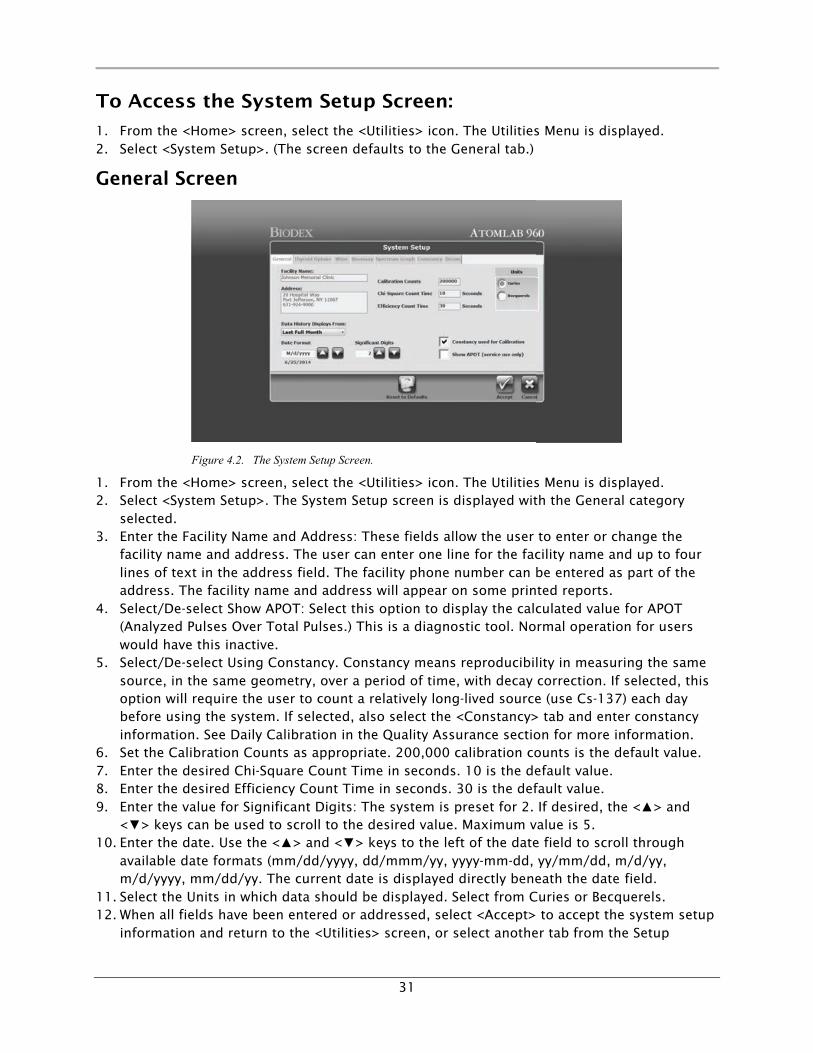
Figure 4.2. The System Setup Screen.
1. From the <Home> screen, select the <Utilities> icon. The Utilities Menu is displayed. 2. Select <System Setup>. The System Setup screen is displayed with the General category
selected. 3. Enter the Facility Name and Address: These fields allow the user to enter or change the
facility name and address. The user can enter one line for the facility name and up to four lines of text in the address field. The facility phone number can be entered as part of the address. The facility name and address will appear on some printed reports.
4. Select/De-select Show APOT: Select this option to display the calculated value for APOT (Analyzed Pulses Over Total Pulses.) This is a diagnostic tool. Normal operation for users would have this inactive.
5. Select/De-select Using Constancy. Constancy means reproducibility in measuring the same source, in the same geometry, over a period of time, with decay correction. If selected, this option will require the user to count a relatively long-lived source (use Cs-137) each day before using the system. If selected, also select the <Constancy> tab and enter constancy information. See Daily Calibration in the Quality Assurance section for more information.
6. Set the Calibration Counts as appropriate. 200,000 calibration counts is the default value. 7. Enter the desired Chi-Square Count Time in seconds. 10 is the default value. 8. Enter the desired Efficiency Count Time in seconds. 30 is the default value. 9. Enter the value for Significant Digits: The system is preset for 2. If desired, the <!> and
<"> keys can be used to scroll to the desired value. Maximum value is 5. 10. Enter the date. Use the <!> and <"> keys to the left of the date field to scroll through
available date formats (mm/dd/yyyy, dd/mmm/yy, yyyy-mm-dd, yy/mm/dd, m/d/yy, m/d/yyyy, mm/dd/yy. The current date is displayed directly beneath the date field.
11. Select the Units in which data should be displayed. Select from Curies or Becquerels.12. When all fields have been entered or addressed, select <Accept> to accept the system setup
information and return to the <Utilities> screen, or select another tab from the Setup

32
System screen to enter more information. Select <Cancel> at any time to return to the Utilities screen without making changes.
NOTE: The user can select <Accept> to save at any time, or continue to enter setup functions information for additional tabs and save all entered parameters at one time by selecting <Accept> when finished.
Thyroid Uptake Screen
Figure 4.3. System Setup Thyroid Uptake Screen.
System Setup – Thyroid Uptake Screen:
1. From the <System Setup> screen select the <Thyroid Uptake> tab. The System Setup Thyroid Uptake screen is displayed.
2. Select <Effective> or <Biological> for Half Life. The default value is Biological Half Life. 3. Select <Rads> or <Gy> for Absorbed Dose Units to display. 4. To be able to edit counts, before saving a thyroid uptake data set, check the <Edit Counts>
field. Normally this would not be checked. 5. If desired, advanced users can change the I-131 MIRD S-value (default value is 0.022) and
can enable editing of counts before saving an uptake study. 6. When finished, select <Accept> to save, or select another tab at the top of the System Setup
screen to enter additional information before selecting <Accept> to save all data. Select 7. <Cancel> to return to the System Setup screen without saving the Thyroid Uptake data
entered.
NOTES: The Effective Half-Life is used to estimate the patient’s radiation dose after administration of a radioactive material. It is the period of time needed for a radionuclide to be decreased by 50% due to the combined effect of the Biological Half-Life and the Physical Half- Life for the radionuclide.
The Biological Half-Life is the time required for half of a radioactive material to be eliminated from the body through excretion in urine, feces, sweat or other routes. The Biological Half-Life varies from patient to patient, because it is affected by metabolism, pathological conditions, age and function of the excretory system.
Both Biological Half-Life and Effective Half-Life are considered to be estimates and not exact values.

33
Wipe Parameter Screen
The wipe information is detailed in Chapter 8. The Wipe Program using the well counter is for performing the wipe tests required for the department.
Well Counter Setup:
The following functions must be set up in the Utilities Program to perform wipe testing for the first time with the well counter:
• adding a well detector if required • setting a wide window isotope efficiency • selecting the isotopes to wipe and putting efficiencies with each of the selected isotopes • creating wipe test areas and locations
1. At the <Home Page>, select <Utilities>. The Utilities screen is displayed. 2. Select <System Setup> and select the <Wipe> tab. The System Setup Wipe screen is
displayed.
Figure 4.4. The System Setup Wipe Screen.
3. Select <Select a Detector> and select the well counter to be used for the wipe test. Select <Accept>.
NOTE: If there is only one well detector available, once it is chosen (Select a Detector), the program will auto select that well.
4. Enter Wipe Background/Count Time in seconds. The Wipe Background Time must be between 30 and 1200 seconds.
5. Enter Wipe Location Count Time in seconds. The Wipe Location Count Time must be between 5 and 1200 seconds.
6. Select the default units for Wipe Test results:
(DPM = Disintegrations per Minute, µCi = Microcuries, Cnts = Counts per Minute)
NOTE: If the system is set to Bequerels, the choice is: DPM, Bqs, Cnts.

34
Figure 4.5. The Wide Window Isotope Setting Screen.
7. Select <Wide Window Isotope/Efficiency Settings>. The Wide Window Isotope Setting window is displayed.
8. Cs-137 is the default isotope for the wide window isotope setting. The lower and upper ROI levels can be changed by selecting them and entering the desired values. This is preset to the most commonly used and recommended wide window setting.
9. The wide window efficiency percentage must be set in order to use the wipe program. Select <Efficiency> and select to measure a standard, use the factor-defined value, or enter efficiency in percent.
NOTE: See Chapter 4 “Efficiency for the Selected Detector for details on selecting detector efficiency.
10. Select <Accept> to apply the wide window settings and return to the Wide Window Isotope Setting screen. Select <Accept> to return to the System Setup Wipe screen. Select <Accept> again to return to the Utilities menu.
Bioassay Screen
This section is used to set the parameters for performing a Bioassay test. Select the detector and set the counting time for both Bioassay Background Counting and Bioassay Staff Count Time.
The units in which the results are displayed must also be selected. The default unit(s) is µCi and the default count time is 60 seconds.

35
Figure 4.6. The System Setup Bioassay Setup Screen.
1. At the <Home Page>, select <Utilities>. The Utilities screen is displayed. 2. Select <System Setup> and select the <Bioassay> tab. The System Bioassay Setup screen is
displayed.3. Select <Select a Detector> and select the probe. Select <Accept>.
NOTE: If there is only one probe detector available, once it is selected, the program will auto select that probe.
4. Enter Bioassay Background Count Time in seconds. The Bioassay Background Time should not be less than 30 seconds. The default is 60 seconds.
5. Enter Bioassay Staff Count Time in seconds. The default is 60 seconds. 6. Select the default units for Bioassay results.
(DPM = Disintegrations per Minute, µCi = Microcuries, Cnts = Counts per Minute)
NOTE: If the system is set to Bequerels, the choice is: DPM, Bqs, Cnts.
NOTE: See Chapter 4 “Efficiency for the Selected Detector for details on selecting detector efficiency.
7. Select <Accept> to apply the Bioassay settings and return to the Utilities Menu.

36
Spectrum Graph Screen
Figure 4.7. System Setup Spectrum Graph Screen.
1. From the <System Setup> screen, select the <Spectrum Graph> tab. The System Setup Spectrum Graph screen is displayed.
2. Select from the colored buttons beneath the graph to customize the various components of the screen display. For example, the ROI color can be changed from yellow to green or the grid background from black to blue.
3. The Color Dialog screen is displayed. From this screen, the user can adjust or add colors in the standard Windows format. Selected colors, new colors and color codes are displayed to the right of the color screen. Select <OK> to confirm the changes or <Cancel> to return to the System Setup Spectrum Graph without making changes.
4. The <Default> button with the color pallet on it will return all colors to the factory default color scheme.
5. When finished customizing the graph elements, select <Accept> to save, or select another tab at the top of the System Setup screen to enter additional information before selecting <Accept> to save all data. Select <Cancel> to return to the System Setup screen without saving the color customizations entered.

37
Constancy Screen
Figure 4.8. System Setup Constancy Screen.
1. From the <System Setup> screen, select the <Constancy> tab. The System Setup Constancy screen is displayed. The user can enter the Acceptance Variance, Calibration Source Activity, Calibration Source Date and Source ID for the selected well and/or probe.
2. Enter data in the appropriate fields and select <Accept> to save, or select another tab at the top of the System Setup screen to enter additional information before selecting <Accept> to save all data. Select <Cancel> to return to the System Setup screen without saving the constancy information entered.
Detectors
Figure 4.9. The Detectors Screen.
1. From the Utilities Menu, select <Detectors>. The Detectors screen is displayed. The detector Name, Type, Port, ID and Location are displayed at the top of the screen for all detectors listed. The Locations field allows the user to specifically label the location of any connected detector. If a detector has already been entered and currently selected, it is highlighted.
38
2. If more than one detector is displayed, highlight or use the <!> and <"> arrows or cursor to highlight the desired choice.
The following Functions can be Performed from this Screen:
• Add a detector • Edit a selected detector • Delete a selected detector and its accompanying information
Add a Detector
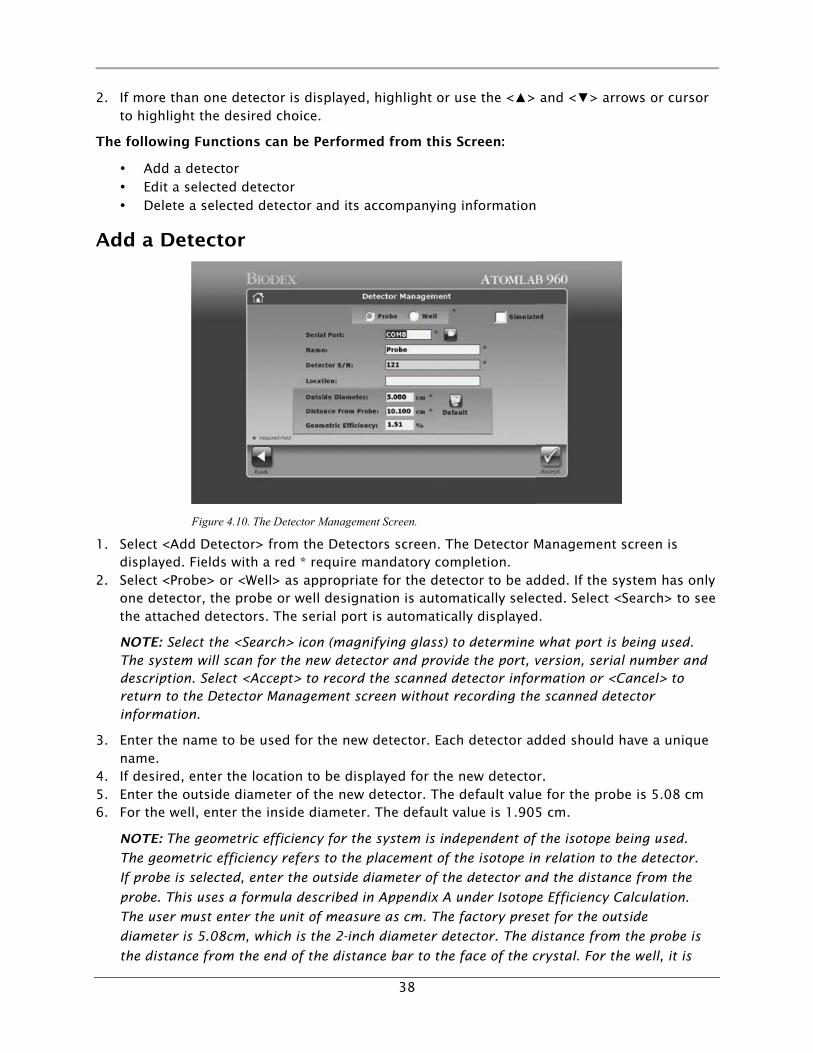
Figure 4.10. The Detector Management Screen.
1. Select <Add Detector> from the Detectors screen. The Detector Management screen is displayed. Fields with a red * require mandatory completion.
2. Select <Probe> or <Well> as appropriate for the detector to be added. If the system has only one detector, the probe or well designation is automatically selected. Select <Search> to see the attached detectors. The serial port is automatically displayed.
NOTE: Select the <Search> icon (magnifying glass) to determine what port is being used. The system will scan for the new detector and provide the port, version, serial number and description. Select <Accept> to record the scanned detector information or <Cancel> to return to the Detector Management screen without recording the scanned detector information.
3. Enter the name to be used for the new detector. Each detector added should have a unique name.
4. If desired, enter the location to be displayed for the new detector. 5. Enter the outside diameter of the new detector. The default value for the probe is 5.08 cm 6. For the well, enter the inside diameter. The default value is 1.905 cm.
NOTE: The geometric efficiency for the system is independent of the isotope being used.
The geometric efficiency refers to the placement of the isotope in relation to the detector.
If probe is selected, enter the outside diameter of the detector and the distance from the
probe. This uses a formula described in Appendix A under Isotope Efficiency Calculation.
The user must enter the unit of measure as cm. The factory preset for the outside
diameter is 5.08cm, which is the 2-inch diameter detector. The distance from the probe is
the distance from the end of the distance bar to the face of the crystal. For the well, it is

39
the inside diameter on the well shipped by Biodex, which is 1.905cm. Factory set well
depth is 2.54cm. This depth in the well would be indicative of many wipes that is the
center of the activity or where the wipe would be located when lowered into the well. This
would be the depth from the top of the crystal (not from the top of the lead of the
collimator) to the center of the activity of the wipe.
7. Enter the distance from the face of the probe detector (the crystal) to the end of the collimator shield. Standard distance is 18.3 cm.
8. For the well, enter the depth in the well for the center of the wipe or sample. The default value for the well is 2.54cm.
9. To perform in simulation mode rather than active mode, select <Simulated>. This simulated detector can be deleted at any time.
NOTE: (SIMULATION MODE) –In simulation mode, the Atomlab 960 will provide mock measuring without the need for actual activity. This allows the user to explore the various screens and modes of the system. The user can select Custom, High, Medium, Low or Background for the count rate used for each reading.
10. Selecting the <Default> button will return values to the factory default values. 11. Once all fields have been completed, select <Accept>. The system returns to the Detectors
screen with the newly added detector and its associated information displayed on the list of detectors. Highlight to select the desired detector.
Edit a Detector
1. From the Detectors screen, highlight the detector in the list to edit. 2. Select <Edit> to advance to the Detector Management screen. Information for the selected
detector is displayed. 3. Highlight and edit any field for which changes are necessary. 4. Select <Accept> to accept any edits made and return to the Detectors screen. The changes
made should be reflected in the appropriate fields. To return to the Detectors screen without making changes, select <Back>.
Delete a Detector
1. From the Detectors screen, highlight the detector to delete. 2. Select <Delete>. A message is displayed warning that the detector is being permanently
removed. Ensure the detector noted is the one to be deleted, select <Accept> to delete the detector, or <Cancel> to return to the Detectors screen without making a deletion. If the detector was selected for deletion, it will no longer be displayed when the Detectors screen is redisplayed.

40
Procedures
Figure 4.11. The Thyroid Uptake Procedure Screen.
The Procedures option allows the user to define facility standard uptake procedures to be used during Thyroid Uptake. From the Thyroid Uptake Procedures screen, users can add a new procedure, edit an established procedure or delete an existing procedure. Use the <!> and <"> keys to scroll to the desired procedure if it is not already displayed on the Thyroid Uptake Procedures screen.
1. From the <Home> screen, select the <Utilities> icon. The Utilities Menu is displayed. 2. Select <Procedures>. The Thyroid Uptake Procedures screen is displayed. The procedure
description, isotope, correction, count type and count time are shown.
Procedure Management
Figure 4.12. The Procedure Management Screen

41
Add a New Procedure
1. Select <Add Procedure>. The Procedure Management Screen is displayed. Fields showing a red * require mandatory completion.
2. Enter a unique procedure name. 3. Enter the Neck/Thigh ratio. Default is 1, it is best to use this value. 4. Enter the desired detector. To do this, select the search icon to the right of the Detector
field, highlight the appropriate detector on the Select Detector list and select <Accept>. 5. Enter the desired isotope. To do this, select the search icon to the right of the Isotope field,
highlight the appropriate isotope on the Select Isotope list and select <Accept>. 6. Select the Procedure Type by toggling between Decay Correct and Recount Standard.
NOTE: "Decay correct" means the system will automatically decay correct the net dose
activity for the elapsed time between counting the dose and counting the patient's
thyroid. Use <Recount Standard> if the user has a standard that is identical to the dose
given to the patient and that standard is used when counting the activity in the
patient's thyroid at a future time.
7. Enter the count time desired in seconds in count time field. Default value is 60 seconds. 8. Select/De-select Use Standard Multiplier.
NOTE: Select <Standard Multiplier> if planning to use therapeutic doses. A therapeutic
dose is too hot to count in front of the collimator. A smaller standard is used when
starting the study. When performing a study using the multiplier, enter the standard as
activity and the activity of the dose being given to the patient. From this information, the
system calculates the multiplier to be used for the count rate of the standard, converting
it to the count rate of the dose.
9. Select <Accept> to save the new procedure and return to the Thyroid Uptake Procedures screen. The new procedure should be listed.
Edit a Procedure or Enter Normal Ranges for a Procedure
1. At the Thyroid Uptake Procedures screen, highlight the procedure to edit and select <Edit>. The Procedure Management Screen is displayed. Fields showing a red * require mandatory completion.
2. Edit any field as appropriate. 3. To display the Normal Range field, select <Normal Range> and enter the Hours, Start Range
% and End Range % to the Add Normal Range field displayed. Select <Accept> to return to the Procedure Management screen with the Normal Values data displayed. To remove Normal Values, select <Remove Normal Values> and the data is hidden. Repeat this procedure if there are multiple range values.
Delete a Procedure
1. At the Thyroid Uptake Procedures screen, highlight the procedure to delete and select 2. <Delete>. A confirmation message warns that the currently selected procedure is about to
be deleted. 3. Select <Accept> to delete the currently selected thyroid uptake procedure and return to the
Thyroid Uptake Procedures screen, or <Cancel> to return to the Thyroid Uptake Procedures screen without making any deletions.

42
Staff Members
The Staff members option allows the user to add, delete, or edit staff member’s information allowing it to be selected for all procedures and reports.
Figure 4.13. Access Staff Members Screen.
To Access the Staff Members Function:
1. From the <Home> Screen, select the <Utilities> icon. The Utilities Menu is displayed. 2. Select <Staff Members>.
Add Staff Members
Figure 4.14. Select or Add a Staff Member Screen.
1. At the Select or Add a Staff Member screen select <Add Staff> 2. At the Add Staff Member screen enter the First name, Last name, Identification number, and
Staff type of the Staff member.

43
3. Select <Accept> to add the staff member and return to the Select or Add Staff Member screen or <Cancel> to return to the Select or Add a Staff Member screen without adding staff.
Edit Staff Members
1. At the Select or Add a Staff Member screen select the Staff member to edit. 2. Select <Edit>, the Edit Staff Member screen is displayed. 3. Edit any field as appropriate. 4. Select <Accept> to save the current info and return to the Select or Add a Staff Member
screen, or <Cancel> to return to the Select or Add a Staff Member screen without making any edits.
Delete Staff Members
1. At the Select or Add a Staff Member screen select the staff member to delete. 2. Select <Delete>, a warning screen is displayed stating that the selected staff is about to be
permanently deleted. 3. Select <Accept> to delete the staff member and return to the Select or Add Staff Member
screen or <Cancel> to return to the Select or Add Staff Member screen without deleting.
Isotopes
Figure 4.15. The Select an Isotope Screen.
This option allows the user to select and view a preset isotope, add a new isotope to the isotope list, edit an existing user-entered isotope, select a factory-defined efficiency, measure and determine an efficiency, or enter an efficiency. The user also selects if a specific isotope can be used for Wipe testing.
The Atomlab 960 isotope list comes with 29 preset isotopes. For these factory isotopes, Lower Level Discriminator (LLD), Upper Level Discriminator (ULD), and Range are factory preset and cannot be changed. The Regulatory Alarm levels and package level can be changed for factory isotopes. For all user entered isotopes, LLD, ULD and Range can be edited. Placing a checkmark in the <Use For> fields at the bottom left of the screen allows the selected isotope to be used

44
for Wipe. If the user does not check the <Use For> fields, the isotope is unavailable for these functions. Once having checked the appropriate function(s), add a detector efficiency as described later in this chapter.
NOTE: The Wipe program and Bioassay program use a fixed KeV Range of 0-750 KeV for all isotopes. The Uptake and Manual Modes use KeV shown in the isotope list.
The Isotopes Screen
1. From the Home Page, select <Utilities>. The Utilities screen is displayed. 2. Select <Isotopes>. The Isotopes screen is displayed. From this screen the user can view,
<Add>, <Edit> or <Delete> isotopes, and set Isotope Efficiency.
Select an Isotope
1. From the <Home> screen, select the <Utilities> icon. The Utilities Menu is displayed. 2. Select <Isotopes>. The Select an Isotope screen is displayed. From this screen the user can
add an isotope, edit an isotope, delete an isotope and add detector efficiency. If a detector has been selected, it is listed on the upper left side of the Select an Isotope list. If the detector is listed as unknown, use the <Search> key to select the desired detector from the Select Detector List.
NOTE: Some isotopes have different ROIs for the probe and well.
Add a New (User Defined) Isotope
Figure 4.16. The Isotope Management Screen.
Add an Isotope
1. Select <Add Isotope>. The Isotope Management screen is displayed. 2. Enter a unique isotope name in the top field. 3. Enter the lower and upper ROI levels. (See Determining ROI later in this chapter.) 4. Enter or select the KeV range. A drop-down box provides preset ranges from which to
select, if desired. 5. Select/De-select Use for Wipe. 6. Enter the half-life of the isotope in the appropriate units: minutes, hours, days or years. 7. Enter the regulatory levels for the restricted and unrestricted Wipe Area in DPM units.

45
8. Enter the regulatory package level. The standard level is 6,600 DPM based on a wipe area of 10cm2.
9. When all fields are completed, select <Accept> to save the data and select the current isotope.
Edit an Isotope
The <Edit> function on the Select an Isotope List allows the user to change information associated with the currently selected isotope. For factory isotopes, the user can adjust only detector efficiency or whether to use it for Bioassay or Wipe. For custom isotopes editing allows for adjustment of area readings, half-life range, ROI settings, as well as the isotope name.
1. At the Select an Isotope screen, highlight the isotope to edit and select <Edit>. The Isotope Management Screen is displayed.
2. Edit any field as appropriate. 3. Select <Accept> to save the edited values and return to the Select an Isotope screen.
NOTE: For factory defined isotopes, some fields cannot be edited.
Delete an Isotope
1. At the Select an Isotope screen, highlight the isotope to delete and select <Delete>. A confirmation message warns that the currently selected isotope is about to be deleted.
NOTE: Only custom isotopes can be deleted from the Isotope Editing screen. Factory set isotopes cannot be deleted.
2. Select <Accept> to delete the currently selected isotope. A warning screen notes that the selected isotope is about to be deleted. Select <Accept> to delete the isotope and return to the Select an Isotope screen, or <Cancel> to return to the Select an Isotope screen with no deletion. If the isotope is deleted, it will no longer appear in the Select an Isotope list.
How ROI is Determined
Most isotopes preset ROI energy window values do not change as the user switches between well or probe, regardless of the mode selected (i.e., Uptake, manual, etc.). The ROI is defined in units of energy (keV) and converted to channel numbers with the keV/channel slope value that is measured during calibration. The channel number for the ROI values can and will change from probe to well if the calibration keV/channel is different between probe and well.
NOTE: Certain isotopes have a separate isotope name listed for the Well for that specific
isotope. The different ROI’s are required because in the Well there may be a second peak,
which is the summation peak.
Example:
Tc-99m has a peak energy of 140 keV according to the radionuclide decay scheme. The Thyroid Uptake uses a default of +/- 15% energy window around the peak energy. These values calculate to be 119 keV to 162 keV and are displayed on the Isotope Editing page. When either the probe or well is selected, the ROI channels are calculated based upon the Cs-137 calibration results for that particular detector. If the calculation of the probe results in a .3775 keV/channel on range 0-375 keV, the TC-99m default range, the channel ROI is 119 keV/.3775 keV channel = channel 315 and 162/.3775 = channel 429. For the well detector, we might have

46
a calibration of .3325 keV/channel. In this case, the ROI channels will calculate channel 358 to 487. Even though the ROI channels are different, the energy windows are the same. This is apparent when the spectrum for each detector is printed.
NOTE: It is not necessary to fix a symmetrical percent around the peak. In fact, some isotopes are multi-peaked, which can cause an asymmetric spectrum. Keep in mind that if a calibration is performed the result must be saved in order for it to be used in ROI calculations.
When an isotope is selected from the Isotope Editing page, the screen will display the isotope name, LLD, ULD and range setting as demonstrated in the following chart:
Table 4.1. Isotope Range Settings. Range: Min KeV Max KeV Half Scale 0 3000 1500 0 1500 750 0 1000 500 0 750 375 0 500 250 0 375 187 0 250 125 0 188 94 0 125 62.5 0 95 47.5 0 64 32 0 45 22.5
A. Lower Level Discriminator (LLD) = 0.85 times the Min keV of interest.
B. Upper Level Discriminator (ULD) = 1.15 times the Max keV of interest.
NOTE: Some isotope ROIs are preset so they are not ±15%. Using an isotope sample the
ROIs were determined for those isotopes.
47
Efficiency for the Selected Detector and Isotopes
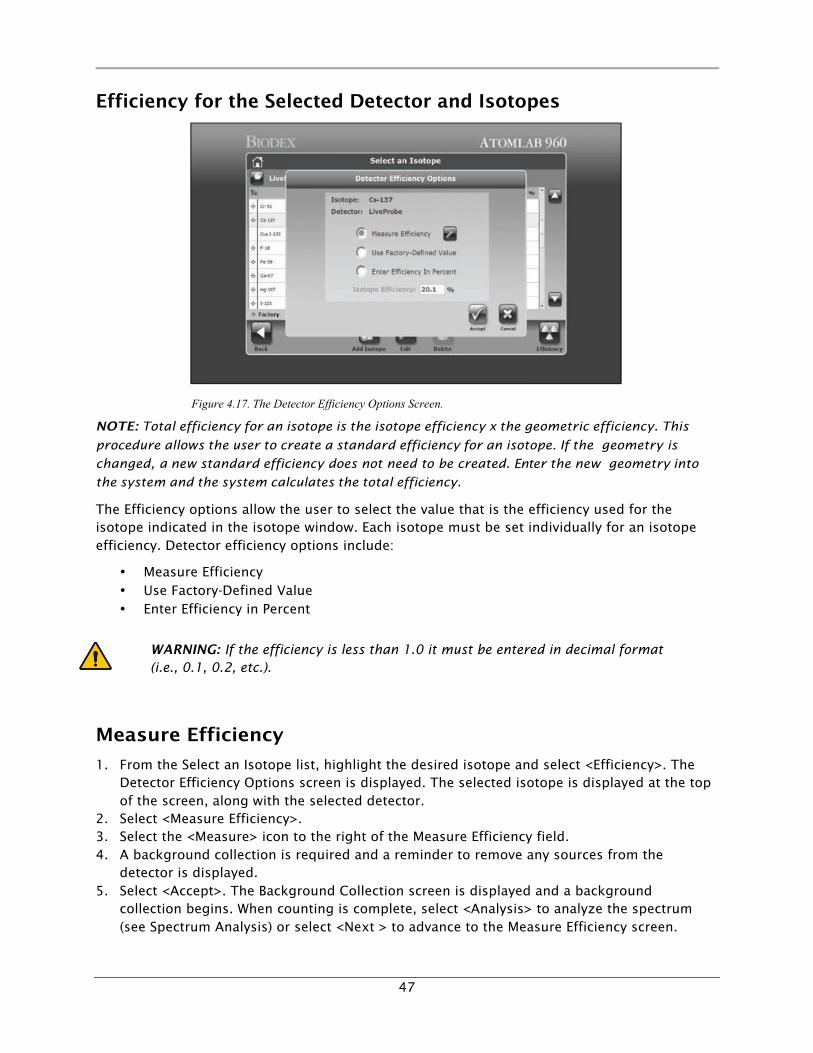
Figure 4.17. The Detector Efficiency Options Screen.
NOTE: Total efficiency for an isotope is the isotope efficiency x the geometric efficiency. This
procedure allows the user to create a standard efficiency for an isotope. If the geometry is
changed, a new standard efficiency does not need to be created. Enter the new geometry into
the system and the system calculates the total efficiency.
The Efficiency options allow the user to select the value that is the efficiency used for the isotope indicated in the isotope window. Each isotope must be set individually for an isotope efficiency. Detector efficiency options include:
• Measure Efficiency • Use Factory-Defined Value • Enter Efficiency in Percent
WARNING: If the efficiency is less than 1.0 it must be entered in decimal format (i.e., 0.1, 0.2, etc.).
Measure Efficiency
1. From the Select an Isotope list, highlight the desired isotope and select <Efficiency>. The Detector Efficiency Options screen is displayed. The selected isotope is displayed at the top of the screen, along with the selected detector.
2. Select <Measure Efficiency>. 3. Select the <Measure> icon to the right of the Measure Efficiency field. 4. A background collection is required and a reminder to remove any sources from the
detector is displayed. 5. Select <Accept>. The Background Collection screen is displayed and a background
collection begins. When counting is complete, select <Analysis> to analyze the spectrum (see Spectrum Analysis) or select <Next > to advance to the Measure Efficiency screen.

48
Figure 4.18. The Measure Efficiency Screen.
6. Enter the source calibration activity and date. Select <Accept> when complete. 7. Select <Calculate> to calculate the current decayed activity for the standard being used. The
set distance at which the standard is counted, along with the geometric efficiency, are also displayed.
8. To change the geometric distance and geometric efficiency, select the <Detector> icon on the left side of the screen. The Detector Measurements screen is displayed.
Figure 4.19. The Detector Measurements Screen.
9. Change the distance from the probe to the correct distance to be used. Select <Accept> to save or <Cancel> to return to the Measure Efficiency screen without saving.
10. Select the <Measure> icon and position the source in the correct geometry. 11. Select <Accept> to measure the standard. The system will start counting the standard
placed in front of the detector. 12. Select <Abort> to abort the count, or <Stop> if the user does not want to finish the count
but still want to accept it. The system shows the elapsed and remaining time. 13. Select <Analysis> to review the spectrum screen if desired, or <Next> to return to the
Measure Efficiency screen. Isotope efficiency is displayed. Select <Accept> or <Cancel>.

49
Figure 4.20. The Measure Efficiency Screen with the Isotope Efficiency Illustrated.
NOTE: Total efficiency for an isotope is the isotope efficiency x the geometric efficiency.
This procedure allows the user to create one standard for an isotope. If the geometry is
changed, a new standard does not have to be created.
Use Factory Defined Value
1. From the Select an Isotope list, highlight the desired isotope and select <Efficiency>. The Detector Efficiency Options screen is displayed. The selected isotope is displayed at the top of the screen, along with the selected detector.
2. Select <Use Factory Defined Value> and <Accept>. The system returns to the Select an Isotope screen with the factory default value selected.
Enter Efficiency in Percent
1. From the Select an Isotope list, highlight the desired isotope and select <Efficiency>. The Detector Efficiency Options screen is displayed. The selected isotope is displayed at the top of the screen, along with the selected detector.
2. Select <Enter Efficiency In Percent>. 3. Enter the desired percent value in the <Isotope Efficiency % field>.4. Select <Accept>. The system returns to the Select an Isotope screen. The percent value just
entered appears in the Efficiency % field of the selected isotope on the Select an Isotope list. 5. Select <Back> to return to the Utilities screen when all of the options available on the Select
an Isotope screen have been selected.
NOTE: It is recommended to check the Cs-137 efficiency at least once per year with the Cs-137 rod source. Use the new efficiency obtained as the Cs-137 efficiency.
50
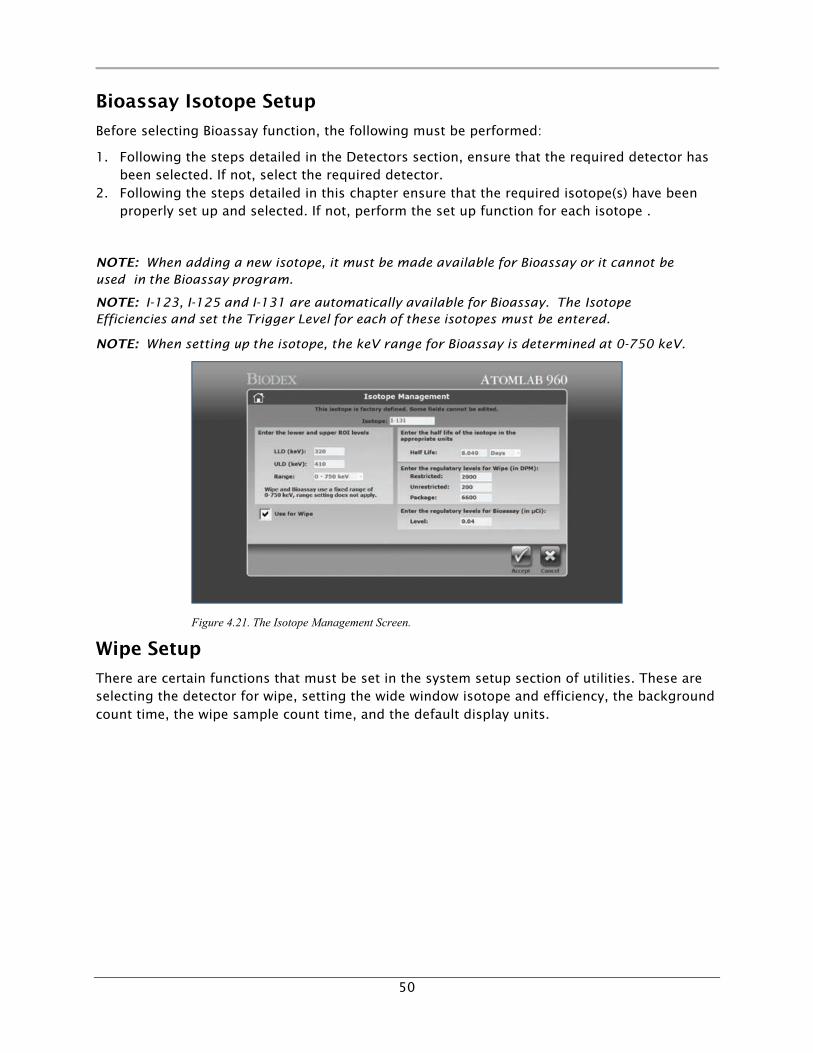
Bioassay Isotope Setup
Before selecting Bioassay function, the following must be performed:
1. Following the steps detailed in the Detectors section, ensure that the required detector has been selected. If not, select the required detector.
2. Following the steps detailed in this chapter ensure that the required isotope(s) have been properly set up and selected. If not, perform the set up function for each isotope .
NOTE: When adding a new isotope, it must be made available for Bioassay or it cannot be used in the Bioassay program.
NOTE: I-123, I-125 and I-131 are automatically available for Bioassay. The Isotope Efficiencies and set the Trigger Level for each of these isotopes must be entered.
NOTE: When setting up the isotope, the keV range for Bioassay is determined at 0-750 keV.
Figure 4.21. The Isotope Management Screen.
Wipe Setup
There are certain functions that must be set in the system setup section of utilities. These are selecting the detector for wipe, setting the wide window isotope and efficiency, the background count time, the wipe sample count time, and the default display units.

51
Figure 4.22. A Sample Wipe Setup Screen.
Create the Wipe Area
1. From the Utilities Window select <Wipe Setup> to advance to the Wipe Setup screen. 2. To add a wipe area, select <Add> under the Areas Section. The Add Wipe Area screen is
displayed. 3. Enter an Area Name and select the area type: Restricted, Unrestricted, Sealed Source or
Packages.
Figure 4.23. Wipe Area Setup Screen.
4. The Trigger Level is preset to 100%. This is a percentage of the regulatory level for each isotope. To change the trigger level, use the drop-down list and select the desired level. Select <Accept> to confirm the new trigger level.
5. Under the Location field, select <Add> to advance to the Wipe Location screen. Enter the desired location name and select <Accept> to select it. Continue to enter all locations needed in this wipe area. Selecting <Accept> adds the currently displayed location to the Locations list.
NOTE: To edit a location, highlight the location to edit, select <Edit> and make the
desired change on the Wipe Location screen displayed. To delete any location, highlight
52
the desired entry in the Location field and select <Delete>. The selected location is
removed from the Location list.
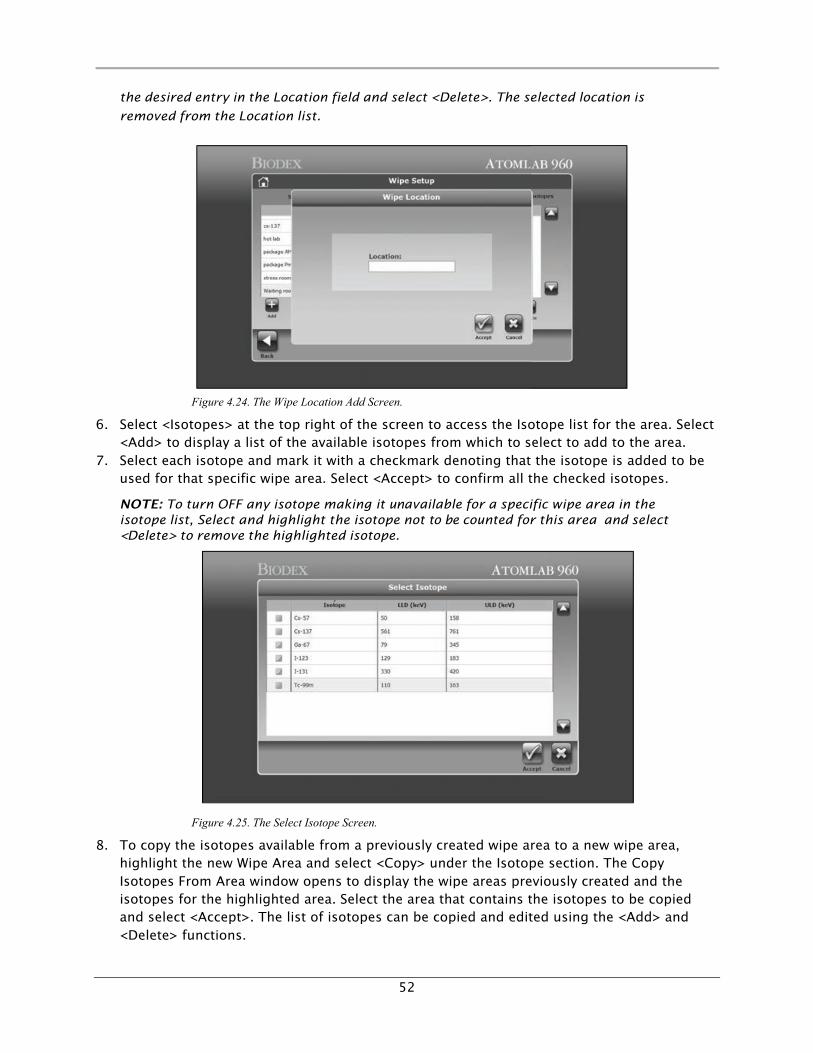
Figure 4.24. The Wipe Location Add Screen.
6. Select <Isotopes> at the top right of the screen to access the Isotope list for the area. Select <Add> to display a list of the available isotopes from which to select to add to the area.
7. Select each isotope and mark it with a checkmark denoting that the isotope is added to be used for that specific wipe area. Select <Accept> to confirm all the checked isotopes.
NOTE: To turn OFF any isotope making it unavailable for a specific wipe area in the isotope list, Select and highlight the isotope not to be counted for this area and select <Delete> to remove the highlighted isotope.
Figure 4.25. The Select Isotope Screen.
8. To copy the isotopes available from a previously created wipe area to a new wipe area, highlight the new Wipe Area and select <Copy> under the Isotope section. The Copy Isotopes From Area window opens to display the wipe areas previously created and the isotopes for the highlighted area. Select the area that contains the isotopes to be copied and select <Accept>. The list of isotopes can be copied and edited using the <Add> and <Delete> functions.

53
Figure 4.26. The Copy Isotopes From Area Screen.
9. When all the wipe locations have been added, select <Back> to return to the Utilities menu. Select <Back> again to return to the Home screen.
NOTE: The Home icon in the upper left corner of the screen can be selected to return to
the Home screen.
Bioassay Setup
The Bioassay Isotope Setup function allows the user to add staff members and to assign one or more isotopes to that staff member for measuring the activity for Bioassay.
Access the Bioassay Setup Screen
1. From the Home page, select <Utilities>. The Utilities screen is displayed. 2. Select <Bioassay Setup>. The Bioassay Setup screen is displayed. This page is used to add
staff for Bioassay and add or delete the isotopes to be assayed for each person.
Figure 4.27. Bioassay Setup Screen.
54
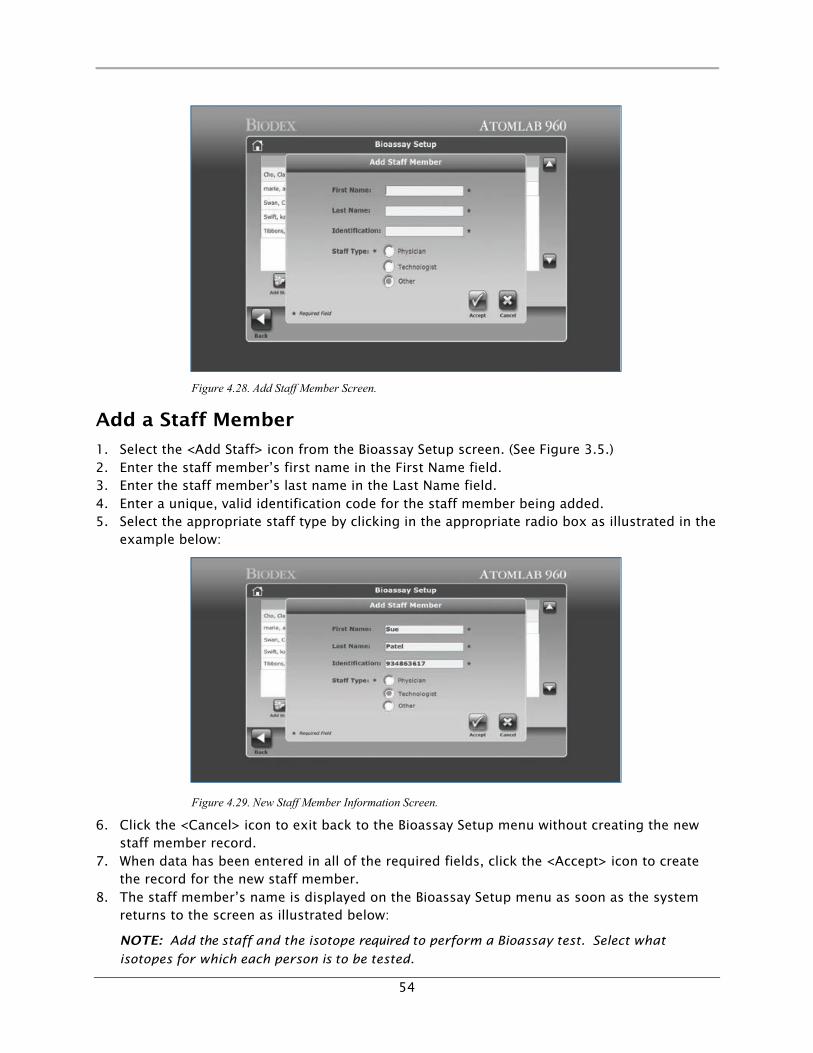
Figure 4.28. Add Staff Member Screen.
Add a Staff Member
1. Select the <Add Staff> icon from the Bioassay Setup screen. (See Figure 3.5.) 2. Enter the staff member’s first name in the First Name field. 3. Enter the staff member’s last name in the Last Name field. 4. Enter a unique, valid identification code for the staff member being added. 5. Select the appropriate staff type by clicking in the appropriate radio box as illustrated in the
example below:
Figure 4.29. New Staff Member Information Screen.
6. Click the <Cancel> icon to exit back to the Bioassay Setup menu without creating the new staff member record.
7. When data has been entered in all of the required fields, click the <Accept> icon to create the record for the new staff member.
8. The staff member’s name is displayed on the Bioassay Setup menu as soon as the system returns to the screen as illustrated below:
NOTE: Add the staff and the isotope required to perform a Bioassay test. Select what
isotopes for which each person is to be tested.

55
Figure 4.30. Isotopes for Bioassay Setup Screen.
Add Isotope for Staff Member
1. Highlight Staff Member’s name. 2. Select the <Add Isotope> icon from the Bioassay Setup screen. (See Figure 4.27.)
NOTE: The isotope list displayed shows only isotopes available for Bioassay.
3. Select the isotopes to be assigned to the staff member by clicking in the appropriate checkboxes to the left of the Isotope name.
NOTE: Each staff member can be setup with different isotopes listed.
NOTE: Multiple isotopes can be highlighted by selecting each isotope individually.
Figure 4.31. Select Isotope Screen Illustrating Available Isotopes for Bioassay.
4. Click the <Accept> icon to assign the selected isotopes to the staff member. 5. Click the <Cancel> icon to exit back to the Bioassay Setup menu without assigning any
isotopes to the staff member. 6. The system returns to the Bioassay Setup screen displaying the selected isotopes that have
been established for the staff member.

56
Figure 4.32. Bioassay Isotope Setup Screen.
Delete an Isotope from Staff Member
1. Highlight the name of the staff member from the list on the left of the screen from whom the isotope is to be deleted.
2. Highlight the isotope from the list on the right side of the screen. 3. Select the <Delete> icon.
NOTE: Delete is an immediate action from this screen. There is no opportunity to cancel the function if <Delete> is selected by mistake.
4. The isotope is deleted from this patient.
System Maintenance
When <System Maintenance> is selected the first time, the user is directed to configure the PIN. Every time thereafter, the user is asked to enter that PIN to access the System Maintenance menu.
Figure 4.33. PIN Number Entry Screen.
1. Enter the Pin Number select <Accept>.

57
2. The first time a PIN Number is entered, the system asks for the PIN number to be re-entered.
The PIN can be changed by selecting the <Change PIN> button on the lower right corner of the System Maintenance main menu.
On the System Maintenance main menu the buttons for the three configurations related to System Maintenance are displayed:
1. Checkpoint Database
2. Backup Database
3. Restore Database
Figure 4.34. System Maintenance Main Screen.
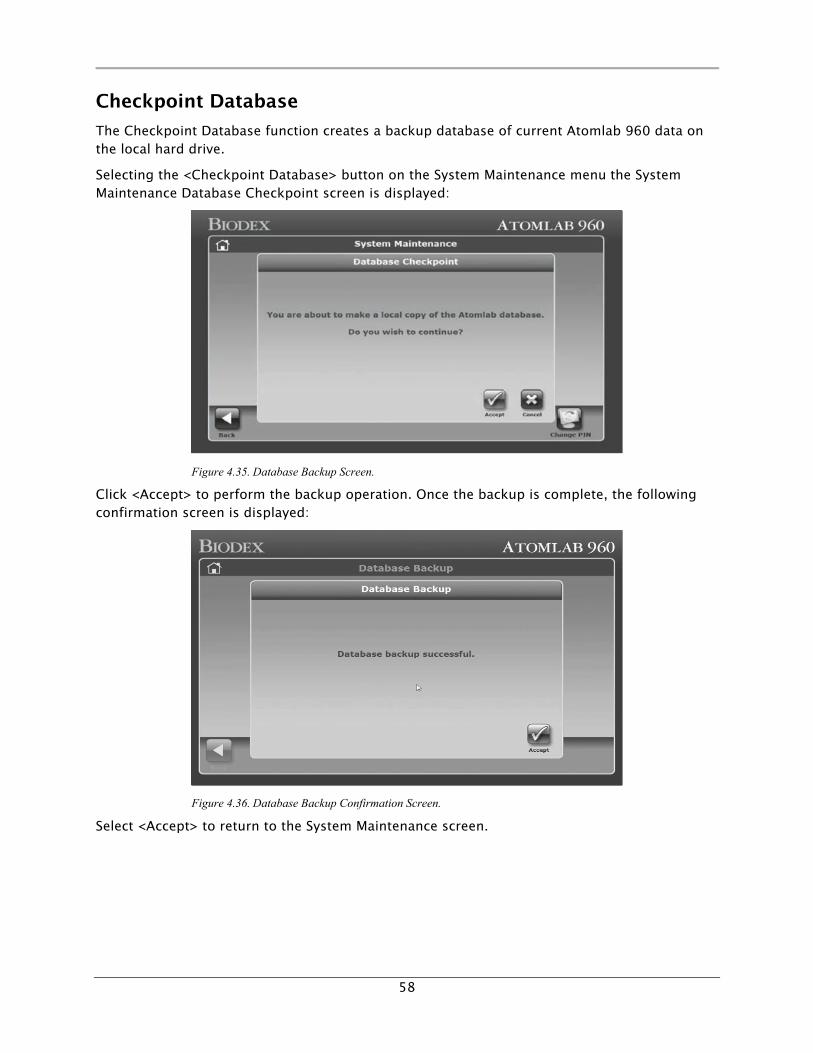
58
Checkpoint Database
The Checkpoint Database function creates a backup database of current Atomlab 960 data on the local hard drive.
Selecting the <Checkpoint Database> button on the System Maintenance menu the System Maintenance Database Checkpoint screen is displayed:
Figure 4.35. Database Backup Screen.
Click <Accept> to perform the backup operation. Once the backup is complete, the following confirmation screen is displayed:
Figure 4.36. Database Backup Confirmation Screen.
Select <Accept> to return to the System Maintenance screen.

59
Backup Database (USB Flash Drive)
The Backup Database function creates a backup database of the current Atomlab 960 data on a USB flash drive. Insert a USB flash drive into the USB port.
Selecting the <Backup Database> button on the System Maintenance menu displays the following screen:
Figure 4.37. Database Backup Screen.
Designate the flash drive location to which the database is backed up by selecting the destination from the drop-down menu.
NOTE: If a flash drive is inserted after this screen appears, select the <Refresh> button (withthe monitor/encircling arrows icon) to refresh the drop-down menu.
Selecting the <Backup Database> button will display the following confirmation screen:
Figure 4.38. Database Backup Confirmation Screen.
Select <Accept> and <Back> to return to the System Maintenance screen.

60
Restore Database
The Restore Database function allows users to restore a previously backed up database to become the Atomlab’s current data set. The restoration can be from the local drive (the backup that is created by the Checkpoint Database function) or from a removable flash drive (created from the Database Backup function).
Selecting <Restore Database> from the System Maintenance menu displays the following screen:
Figure 4.39. Database Restore Screen.
The screen is used to select the type of backed-up database to be restored; either the Local Checkpoint or an External Flash Drive.
In either backup type, there is list of backed up databases that have been created. The most recently backed up database is the top row of the list. Select the database that is to be restored as the Thyroid Uptake’s current data set, and select <Restore Selected Database>.
The resulting screen requests a confirmation of the restore action.
Figure 4.40. Database Restore Accept/Cancel Screen.

61
Selecting <Accept> displays a confirmation screen and informs the user that the application needs to be restarted.
Figure 4.41. Database Restore Confirmation Screen.
NOTE: Later versions of the Atomlab software (v.1.0.93 and higher) produce backup files with the “.biodb” filename extension. Software versions beginning with v1.0.75 produce backup files with the “.bak” filename extension. The v1.0.93(+) software can restore backup files with either the “.biodb” or “.bak” filename extensions.

62
5. Quality Assurance
Figure 5.1. Quality Assurance Menu Screen.
NOTE: When a constancy along with daily calibration is selected in the setup section under Utilities, it is noted on the daily calibration button as illustrated. If a constancy is not selected, only the words "Daily Calibration" will displayed on the button.
Figure 5.2. Quality Assurance Menu for Chi-Square and MDA.
Quality Assurance Information
Before using the Atomlab 960 for counting purposes, it is important to take a few minutes to prepare the system for operation. The following functions are accessed from the Quality Assurance Menu:
• Calibration/Constancy Fixtures • Daily Calibration/Constancy • Calibration History (for Calibration/Constancy History)

63
• High Voltage • High Voltage History
• Background • Background History • Chi-Square • Chi-Square History • MDA • MDA History • Last counted spectrum
Daily Calibration and High Voltage must be performed before counting begins.
NOTE: Before beginning chapter, enter the facility name and address in the Utilities pages, as explained in the section on System Setup. This will allow the system to print the facility name on some printouts. It is also necessary to select or add a detector as explained in the Utilities chapter under the Detectors section.
Calibration/Constancy Fixtures
There is a Black Calibration fixture for the Probe and a smaller White Fixture for the Well. The Probe Fixture is included with the Uptake Stand. The Well Fixture is included with the optional Well Counter. They are used for performing High Voltage, Calibration, Constancy, and Chi- Square.
The Black Probe Calibration/Constancy Fixture is used by sliding the Cs-137 10µCi disc source into the slot in the bottom of the fixture. The Holder is placed into the Probe. This creates repeatable Geometry for each time the function is performed. If the Probe is turned facing upwards, the fixture will always be in the same location. Make sure the source is always placed in the fixture with the source name and activity facing the same direction in the fixture.
The White Well Fixture fits into the top of the Well Counter. The 10µCi Cs-137 disc source fits into the wide top section of the fixture. If a rod source is being used for the well counter, the well fixture helps center the rod source.
There are pins on the printer shelf that hold the fixtures onto the shelf for storage.
Figure 5.4. Wipe Calibration Fixture. Figure 5.3. Probe Calibration Fixture.

64
High Voltage Adjustment
Figure 5.5. The MCA Operation in Progress Screen is Displayed While High Voltage Measurement is being Performed.
High Voltage Adjustment should be performed the very first time the system is used, if the system is to be used in a new environment, or in the instance where a substantial change has been made, i.e., when using a new tube.
NOTE: If a probe and well are both used the high voltage adjustment must be set independently for each detector. The system must be ON and warmed-up prior to setting the high voltage.
Perform a High Voltage Adjustment
NOTE: When a High Voltage Adjustment is performed on a detector, the previous calibration and Chi-Square for that detector are zeroed. The user must perform a new calibration and Chi-Square for a detector following a High Voltage Adjustment. A High Voltage Adjustment can be performed on any detector at any time, but is generally performed quarterly.
1. From the Quality Assurance screen, select <High Voltage>. The Select Detector screen is displayed.
2. Highlight the detector for which the high voltage adjustment is performed and select <Accept>. The Position Source screen is displayed.
3. Place the Cs-137 source in front of the well or probe, or use the constancy fixture. Select <Accept>.
4. The MCA Operation In Progress message displays while the high voltage adjustment is performed. When the high voltage information is gathered, it is displayed on the HV Calibration Information screen. High voltage values range between 950 and 1150 volts.
NOTE: Once a High Voltage Adjustment is started, it will run until it is completed unless <Abort> is selected to stop the count. The system will provide a message that the High Voltage Calibration was aborted by the user and may request that user power cycle the system before continuing. Select <Accept> to return to the Quality Assurance screen.
5. Select <Staff> to advance to the Select Staff Member screen. A list of staff, with last name, first name and identification #, is displayed. Highlight the staff member to be associated with this high voltage adjustment.

65
6. Select <Accept> to accept the staff member and return to the HV Calibration Information screen with the Staff Member selected.
7. Select <Accept> to accept the high voltage adjustment and return to the Quality Assurance screen. The high voltage adjustment accepted is listed for the detector selected on the Select Detector screen.
View a High Voltage History
1. Select <High Voltage History> from the Quality Assurance Page. The High Voltage History is displayed. The most recently completed high voltage is highlighted. To view high voltage adjustments not displayed on the High Voltage History list, use the <!> and <"> arrows to scroll through the list.
Delete a High Voltage History
1. Select <High Voltage History> from the Quality Assurance Page. The High Voltage History is displayed. The most recently completed high voltage is highlighted. To view high voltage adjustments not displayed on the High Voltage History list, use the <!> and <"> arrows to scroll through the list. Highlight the item to be deleted.
2. Select <Delete>. A warning message is displayed stating that the high voltage selected is about to be permanently deleted.
3. Select <Accept> to delete the noted High Voltage Adjustment and return to the High Voltage History, or <Cancel> to return to the High Voltage History without deleting.
4. Select <Back> to return to the <Quality Assurance> page.
Print a High Voltage History
1. Select <High Voltage History> from the Quality Assurance Page. The High Voltage History is displayed. The most recent high voltage is at the top of the screen.
2. Select the printer icon at the top of the screen to open a print range selection screen. The date range to print can be adjusted using the two calendars “from” and “to”.
Figure 5.6. Calendar From and To Screen.

66
Figure 5.7. Date Screen.
3. If the “from” date or “to” date is touched, it will open up a screen to scroll up or down for the month, day and year. When the desired date is selected, select <Accept>. The system returns to and redisplays the date range selection where the ending date (to date) can be selected. Select <Accept> to proceed to the printout viewing screen.
4. Use the +/- buttons to increase or decrease the size of the report being viewed. Select the <printer> icon to proceed to printing the report.
5. Select <Save> to save the High Voltage report as desired. 6. Select <Back> to return to the High Voltage History screen.
Daily Calibration and Constancy
Figure 5.8. The Counting Daily Calibration Screen.
NOTE: The system must be allowed to warm up and stabilize before performing a calibration.
Calibration Information
A daily system calibration must be performed each day the Atomlab 960 is to be used. Separate calibrations are performed for the probe and well. The system keeps an internal listing of its last calibration date and prompts when calibration is needed. The system will not allow measurement procedures to commence until the calibration has been performed.

67
Calibration is performed automatically from the Quality Assurance Daily Calibration screen. The Select Detector screen advises when the last high voltage and calibration were performed for the detectors. It also checks to ensure that the MCA, detector and CPU are connected and communicating with each other. This is noted in the on-line column and is set to display or not in the system setup procedure.
Additionally, the calibration calculates full width half max (FWHM). FWHM is determined by interpolating between two immediate points above and below the 50% value of the spectrum peak on both sides of the peak. The difference between the two interpolated channel numbers are divided by the channel of the peak itself and multiplied by 100% to arrive at FWHM. The peak is simply the maximum value in the spectrum.
It is not required to calibrate both detectors each day unless they are used. If the detector is not calibrated, a message is displayed advising calibration when that detector is selected. It is recommended to perform calibrations in the mornings on a daily basis, therefore, when the system needs to be used, it is ready to go. If desired, additional calibrations may be performed on the same day.
While the daily calibration is counting, the ROI counts and CPM counts are displayed to the right of the counting window, along with the elapsed time and the time remaining. The spectrum increments as the packets with the data are counted and downloaded to the computer from the MCA. The <Abort> icon at the bottom of the screen can be used at any time to stop the system from counting and return to the Quality Assurance screen without completing the calibration.
When the system finishes counting, the Counting Daily Calibration screen displays the spectrum graph. Select <Next> to advance to the Daily Calibration Information screen to view full width half max (FWHM) and the energy in the peak channel. Staff may be selected or changed at this point and a spectrum analysis can be performed. If the daily calibration information is acceptable select <Accept>.
Both daily calibration and Chi-Square tests are performed using a 10 µCi Cs-137 button source. Once calibration is underway, the system's unique differential spectrometer automatically measures the peak height and subtracts the base line making zero adjustment obsolete. It does this for 100,000 pulses and plots a spectrum in internal memory. The peak channel is located and equated to 662 keV, which is the Cs-137 gamma energy entered. This gives the spectrometer the keV per channel that is used to calibrate all of the other isotope ranges. Each clinical isotope has a ROI defined with lower and upper energy limits. These energy limits are converted to channels in the MCA when a particular isotope is counted. Corrections are made for sodium iodide non-linearity. There is no need to view the spectrum of calibration or any other isotope, although this is available on the display and in hard copy by selecting the Spectrum Analysis icon.
The multi-channel analyzer in the Atomlab 960 has several fixed precision ranges and a regulated high voltage supply. The pulse shapes are digitized and processed by a high speed digital signal processor. This processing results in a possible 1024 pulse heights having a zero offset. A spectrum results when a histogram of these pulse heights (channels) is plotted. Calibration of the spectrometer is defined as king the energy equivalence of each channel. This is accomplished by determining the Cs-137 spectrum and calculating the ratio of the 662 keV/peak channel. After calibration, the report should always print a peak value very close to 662 keV (some precision round-off may occur), and the change in calibration is reflected in the keV/channel slope value. The fine range can be thought of as a floating point numerical range.

68
The HV adjust will ultimately determine the maximum energy one can measure on the range selected. It can be calculated by multiplying the keV/channel times 1024.
NOTE: If constancy is performed and not just calibration, go to the Utilities section and select the constancy function on System Setup and add the constancy information for the detector. The constancy information is displayed each time a calibration/constancy is performed.
Perform a Daily Calibration or Constancy
Figure 5.9. Daily Calibration Information Screen.
1. After the system has been turned ON and allowed to warm up and stabilize, select <Daily Calibration> from the Quality Assurance screen.
2. The <Select Detector> screen is displayed. Select the desired detector. 3. Highlight the well or probe to calibrate and select <Accept> to confirm. 4. Position the 10 µCi, Cs-137 source in the source holder (Calibration/Constancy Fixture) and
select <Accept>. 5. The Counting Daily Calibration screen is displayed with the selected isotope and detector
listed above the counting window. Select <Abort> at any time to exit the calibration while counting is in progress. To the right of the screen, ROI Counts (region of interest counts), ROI CPM (ROI counts per minute), Elapsed Time and Time Remaining are displayed in real time.
6. If calibration is successful, a "Counting Complete" message will display on the screen. Select <Next> to advance to the Daily Calibration Information screen.
7. At this screen, the user can select <Analysis>, select and update <Staff> , <Accept> the Calibration Information displayed, or <Cancel> to return to the Select Detector screen without saving the calibration.
8. If the Daily Calibration Information is acceptable, select <Accept> to accept the daily calibration results and return to the Quality Assurance screen.

69
View, Print, or Save a Daily Calibration Report
Figure 5.10. Daily Calibration History Screen.
Figure 5.11. Daily Calibration Constancy History Screen.
1. Select < Calibration History> from the Quality Assurance screen. The Daily Calibration History screen is displayed.
NOTE: If the Constancy function is turned on, it looks like Fig. 5.9. It has an extra column with the Constancy change from the previous time the Calibration/Constancy was performed.
2. To print current Daily Calibration test highlight the desired calibration test and select <Report> to view the specific calibration test with spectrum.
3. Select the <Printer> icon at the top of the screen to access the print screen. 4. Select <OK> to print the Daily Calibration Detail Report or select <Cancel> and <Back> to
return to the Daily Calibration History screen. 5. On the Daily Calibration History screen, select <View Options>. The Daily Calibration History
View Options screen is displayed. This screen allows the user to select a specific <Detector Type>, and the <Date Range> to be displayed for the results of the tests on the Daily Calibration History screen.

70
Figure 5.12. Calibration Printer Information Screen.
6. Highlight the desired calibration test and select <Report> to view the specific calibration test with spectrum.
7. Select the <Printer> icon at the top of the screen to access the print screen.8. Select <OK> to print the Daily Calibration Detail Report, or select <Cancel>, and <Back> to
return to the Daily Calibration History screen.
NOTE: To print a specific calibration spectrum, see steps 5 through 8, above.
9. On the Daily Calibration History screen select <Reports> to view and select the type of Daily Calibration Report to View or Print. Select from <Single Detail>, or <Summary History>.
Icon Purpose
<Single Detail> Allows the user to select a single Daily Calibration Test to view or print the results for that specific Calibration Test.
<Detail History> Allows the user to select the <Detector Type> and <Date Range> and create a Daily Calibration Summary Report. The Daily Calibration Summary Report lists the results along with the overall status of the selected options.
10. Select <Back> twice to return to the Daily Calibration History screen from any of the reports.

71
Figure 5.13. Daily Calibration Details Screen Printout
Figure 5.14. Calibration Information for Probe/Detector Report.

72
Figure 5.15. Calibration Information for Probe/Detector Report.
Delete a Daily Calibration
1. Select <Calibration History> from the Quality Assurance Page. The Calibration History screen is displayed.
2. Select <View Options>, <Probe>, <Well>, or <All> to view the calibration history for the detector desired. Calibrations for the selected detector(s) are displayed.
3. Highlight the calibration report and select <Delete>. The system displays a message that the selected Daily Calibration Report is about to be permanently removed. Select <Accept> to delete the report and return to the Daily Calibration History screen, or <Cancel> to return to the Daily Calibration History screen without making a deletion.

73
Chi-Square
Figure 5.16. Counting Chi-Square Screen.
As is the case with Daily Calibration, Chi-Square is performed using a 10 µCi Cs-137 button source. The Chi-Square Test is independent of the counting time, counting rate, and number of counts performed. For this reason, Chi-Square is a very valuable test for a detector system, which is recording truly random events. For example, if systematic failure occurs at low counting rates but passes at high rates, there is an indication of a non-random event occurring which is comparable to the low counting rates. Since time is precise to within 10 microseconds with a crystal controlled clock, 10-second count times should have very little error due to the timer itself.
The number of counts performed is 10, which determines the number of degrees of freedom (9) for the analysis. The lower limit is 4.168, the upper limit is 14.68. These correspond to a 90% probability for passing the lower limit, and 10% probability for passing the upper limit, respectively. In all, one would expect a 20% failure rate frequency for the Chi-Square test. It is not reasonable to always pass or always fail Chi-Square without raising concerns that there may be a systematic problem in the detector or counter.
NOTE: The system stores the information for multiple Chi-Square tests performed on a detector. Chi-Square can be performed as frequently as desired, but is generally performed quarterly. A daily calibration must be performed before Chi-Square can begin. If a daily calibration has not been performed, the system switches to daily calibration.
Perform Chi-Square
1. After the system has been turned ON and allowed to warm-up and stabilize, select the <right arrow> from the Quality Assurance screen, select <Chi-Square>.
2. Select <Chi-Square>. The <Select Detector> screen is displayed. 3. Highlight the well or probe on which to perform Chi-Square and select <Accept> to confirm.4. Position the 10 µCi, Cs-137 source in the collimator of the appropriate detector and select 5. <Accept>. The Count Rate screen is displayed.

74
6. The Counting Chi-Square screen is displayed with the selected isotope and detector listed above the counting window. The Chi-Square number is displayed beneath the spectrum. This is the sample number currently in progress. The system will automatically increment until all 10 passes or samples have been counted. At the completion of the 10th pass the system will calculate Chi-Square and display the value on the screen, along with a passed or failed note. At this point the result is entered into the system memory. To the right of the screen, ROI Counts, ROI CPM, Elapsed Time and Time Remaining are displayed.
7. When Chi-Square completes, a "Chi-Square Passed" or “Chi-Square Failed” message will display on the screen.
8. The user can select <Staff> to view, select and update the <Staff>, <Accept> the Chi-Square Information displayed, or <Cancel> to return to the Select Detector screen without saving the Chi-Square.
9. If the Chi-Square Information is acceptable, select <Accept> to accept the Chi-Square results and return to the Quality Assurance screen.
Figure 5.17. Chi-Square Counting Screen Stating Chi-Square Passed Test.
Figure 5.18. Chi-Square History Screen.
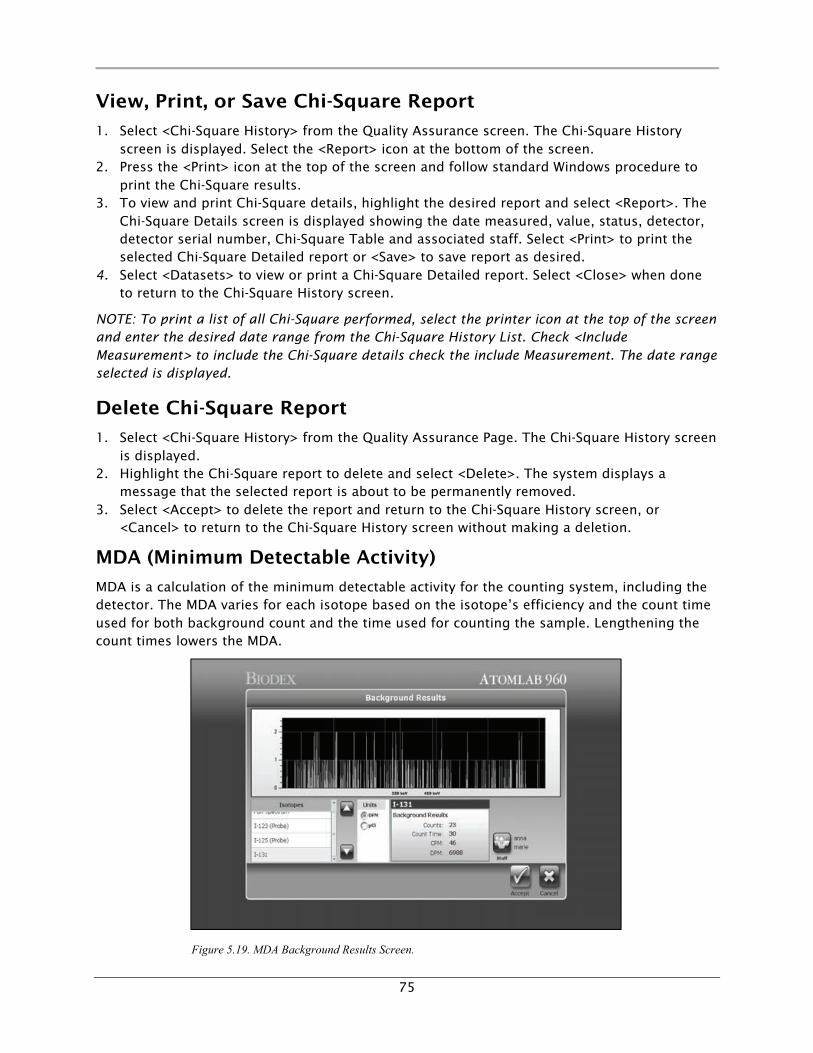
75
View, Print, or Save Chi-Square Report
1. Select <Chi-Square History> from the Quality Assurance screen. The Chi-Square History screen is displayed. Select the <Report> icon at the bottom of the screen.
2. Press the <Print> icon at the top of the screen and follow standard Windows procedure to print the Chi-Square results.
3. To view and print Chi-Square details, highlight the desired report and select <Report>. The Chi-Square Details screen is displayed showing the date measured, value, status, detector, detector serial number, Chi-Square Table and associated staff. Select <Print> to print the selected Chi-Square Detailed report or <Save> to save report as desired.
4. Select <Datasets> to view or print a Chi-Square Detailed report. Select <Close> when done to return to the Chi-Square History screen.
NOTE: To print a list of all Chi-Square performed, select the printer icon at the top of the screen and enter the desired date range from the Chi-Square History List. Check <Include Measurement> to include the Chi-Square details check the include Measurement. The date range selected is displayed.
Delete Chi-Square Report
1. Select <Chi-Square History> from the Quality Assurance Page. The Chi-Square History screen is displayed.
2. Highlight the Chi-Square report to delete and select <Delete>. The system displays a message that the selected report is about to be permanently removed.
3. Select <Accept> to delete the report and return to the Chi-Square History screen, or <Cancel> to return to the Chi-Square History screen without making a deletion.
MDA (Minimum Detectable Activity)
MDA is a calculation of the minimum detectable activity for the counting system, including the detector. The MDA varies for each isotope based on the isotope’s efficiency and the count time used for both background count and the time used for counting the sample. Lengthening the count times lowers the MDA.
Figure 5.19. MDA Background Results Screen.

76
Perform an MDA
1. From the system Home page, select <Quality Assurance>. The Quality Assurance screen is displayed. Press the <right arrow>.
2. Select <MDA>. The Select Detector screen is displayed. Highlight the desired detector and select <Accept>.
3. Select the units the MDA is to display in from the right side of the screen (DPM, µCi/kBq). 4. Select <Background> and the system displays the MDA Background Collection Counting
screen. Ensure there are no sources near the detector and select <Accept>.
NOTE: The only isotopes that is available for use in MDA is isotopes that have Efficiencies that are set in the isotope Efficiency portion of the System Setup for isotopes that are checked for use with Bioassay or Wipe Counting.
NOTE: Isotopes that have an efficiency, but are not checked for Bioassay or for Wipe Counting will not be used when performing MDA calculations.
NOTE: If an isotope has been checked for Wipe or Bioassay and there is no Efficiency associated with that detector and isotope, once the MDA Measurement is started, the system will display “missing Efficiency information” and ask if the user wants to add the Efficiencies. The program will allow the missing Efficiencies for the isotopes to be added. Once added, the MDA Measurement Program screen is redisplayed.
5. The system counts background for the time selected in the System Setup function. When the count is complete, <Analysis> can be selected to analyze the spectrum or select <Next> to continue.
6. After selecting <Next> the system displays the Background Results screen. The user can highlight an isotope and the system displays the detail for that isotope’s Background results.
7. Select the staff member desired from the Select Staff Member screen and select <Accept> to continue. The MDA Verification screen is displayed with the MDA results from the previous Background Count.
Figure 5.20. MDA Verification Screen.
8. Select <Measure> and the system calculates the new MDA values based on the Background just performed.

77
9. If desired, select a unit of measurement at the right side of the screen to change the units in which MDA is displayed.
10. Select <Save> to save the MDA results. A confirmation screen is displayed. Select <Accept> to save or <Cancel> to discard the MDA results.
11. If the MDA results were saved, select <Accept> to return to the MDA verification screen with the new MDA results displayed.
12. Select <History> to display the “MDA History” screen. 13. Highlight an “MDA” and select <Reports> to go to the MDA Reports screen where the user
can select: “Single Detail”, Summary History” or “Detail History”. The “Summary History” and “Detail History” selections display the Date Range screen for the user to set the date range to view and print.
14. Select <Back> to return to the Quality Assurance screen.
NOTE: The MDA Report can be printed from the <Reports> function on the Home screen.

78
6. Thyroid Uptake
Figure 6.1. Thyroid Uptake Screen.
Selecting <Thyroid Uptake> from the Testing Menu allows the user to perform a radioactive uptake study. The system guides the user through a step-by-step procedure that includes counting the following: standard, lab background, patient thyroid, patient background, and finally the computation of the uptake percentage. The uptake percentage, which is calculated from an automatically decay corrected dose count or recounted standard, can be printed in a format designed to provide complete information on the patient study.
The system allows multiple data sets for different times for the patient. Once a patient has been created or selected, the user can come back and perform several uptakes (example: 2 hr, 4 hr, 6 hr or 24 hour.) The system assumes the does will immediately be given to the patient when the dose and lab background has been counted. If the dose is not immediately given to the patient, enter the administered time into the system.
When the patient comes back at the appropriate time to count thyroid, the system calculates the elapsed time between when the dose was counted and when the thyroid is being counted. This is listed in tenths of an hour used for the calculation. With the system performing an automatic decay correction, the patient does not need to be back in exactly six hours. The time could, for example, be 6.2 hours because the system will calculate for the elapsed time. Each of the data sets counted are displayed in the status window on the Thyroid Uptake screen.
NOTE: If the Atomlab 960 has not been calibrated for this day, the system will prompt for a calibration before proceeding with the Thyroid Uptake or any other test procedure selected. High Voltage must also be set before using the system for the first time. Once the calibration and High Voltage have been performed, the user can proceed.
WARNING: Use the same geometry for counting the sample/capsule or lab background as used for counting the thyroid and / patient background. The system calculation assumes the same geometry when comparing counts to counts. Also ensure that the collimator is at a right angle to the neck phantom and the thyroid ensuring it is positioned correctly for counting to retain the correct geometry. Make sure the distance bar and positioning light are not in the counting field.

79
Performing a Thyroid Uptake
Figure 6.2. Select or Add a Patient Screen.
Perform a Thyroid Uptake on a New Patient
Use the following instructions to perform a Thyroid Uptake Stand. A video demonstrating the mechanics and positioning of the Atomlab 960 for a thyroid uptake is also available:
www.biodex.com/video/atomlab960-positioning
1. Select <Testing> from the Atomlab 960 Home Page. The Testing Menu is displayed. 2. Select <Thyroid Uptake>. The Select or Add a Patient screen is displayed. 3. Add a patient for which the thyroid study is performed. 4. Select <Accept>. The Add Study Selection screen is displayed. This screen displays the
patient name and uptake study procedures from which to select. Highlight the uptake procedure method desired and select <Accept>.
Figure 6.3. Select or Add a Patient Screen.

80
Figure 6.4. Thyroid Uptake Screen.
NOTE: Procedures must be added in the Procedures section of the Utilities program.
Figure 6.5. Study Selection Screen.
5. The Study Selection screen is displayed for the selected patient. 6. Highlight the desired study and select <Next>.
Figure 6.6. Add Study Screen.

81
CAUTION: The Thyroid Uptake screen is displayed. Confirm that the correct patient is displayed before proceeding.
7. Select <Count Standard>. The Activity Measurements screen is displayed. 8. Enter the Patient Dose, select <Accept> to continue. A message is displayed instructing the
user to prepare to count the standard. 9. Position the capsule(s) in the thyroid phantom and set up the collimator for use. Set the
distance on the distance bar and move the collimator into position. A red LED light can be flipped out from the rim into the center of the collimator face to help align the thyroid position. Remember to flip the LED back to the retracted position and move the distance bar to the bottom of the collimator out of the field before counting. Move the distance bar to the bottom of the collimator out of the field. The capsule count distance and the thyroid count distance must be the same. When fully prepared to count the standard, select <Accept>. See the Warning on page 77.
10. The Counting Standard screen is displayed. Once counting begins, ROI counts, ROI Elapsed time and Time Remaining are indicated to the right of the counting window. When the system finishes counting, it will stop and complete a final download of the spectrum. The message “Counting Complete” is displayed at the bottom of the screen. Select <Next> to return to the Thyroid Uptake screen.
NOTE: To perform a spectrum analysis, select the <Analysis> icon before selecting <Next>.
Figure 6.7. Counting Standard Screen

82
Figure 6.8. Counting Lab Background Screen.
11. Select <Count Lab Bkg>. The system prompts to position the probe to count background. Count with the neck phantom in front of the collimator without the source in it.
12. Remove the capsule from the neck phantom and position the probe to measure lab background. The distance bar and a red LED light can be flipped out from the rim into the center of the collimator face to help align the thyroid position. Remember to flip the LED back to the retracted position and move the distance bar to the bottom of the collimator out of the field before counting. When the probe has been positioned, select <Accept>. The system begins counting background and will count for the selected time. See the Warning on page 77.
13. When lab background counting is finished, a “Counting Complete” message is displayed at the bottom of the screen. Select <Next> to return to the Thyroid Uptake screen.
NOTE: To perform a spectrum analysis, select the <Analysis> icon before selecting
<Next>.
14. The Thyroid Uptake screen is displayed. Review the results.
NOTE: When the results for the dose or lab background are not to one’s satisfaction, select the item to be recounted and recount the standard or lab background before saving.
Figure 6.9. Verify Standard Count Screen.

83
15. If satisfied with the results select <Save>. The Verify Standard Count screen is displayed. 16. After saving, give the dose to the patient.
NOTE: If the dose is not immediately administered to the patient, the administration time can be corrected by selecting the <Settings> icon on the Thyroid Uptake screen and entering a corrected Dose Administration Time.
Figure 6.10. Thyroid Uptake Settings Screen. Note that the Date Administration Time Area is Read-Only. This Becomes Editable When the Patient Record is Saved.
17. Tell the patient to return at a specific time. 18. Select <Back> to return to the Study Selection screen. 19. Select <Back> to return to the Select or Add a Patient screen to add another patient or if
counting the thyroid of a returning patient.
NOTE: At this point, the system can be used for other functions by returning to the Home screen and making the appropriate selection.
20. When the patient returns at the specified time, select <Testing> and <Thyroid Uptake>. 21. Highlight the patient on the Select or Add a Patient screen and select <Next>.
NOTE: The search options at the top of the screen can be used to find the desired patient by entering the last name and/or ID number and selecting <Search> (magnifying glass).
22. Confirm the patient’s name, ID and study on the Study Selection screen. Select <Next> to advance to the Thyroid Uptake screen.
23. Select <Count Thyroid> and position the patient’s thyroid with the same geometry as used for counting the dose. The distance bar and a red LED light can be flipped out from the rim into the center of the collimator face to help align the thyroid position. Remember to flip the LED back to the retracted position and move the distance bar to the bottom of the collimator out of the field before counting. Select <Accept> to begin counting the patient thyroid. See the Warning on page 77.
24. When the counting is complete, the message “Counting Complete” is displayed at the bottom of the screen. Select <Next> to return to the Thyroid Uptake screen.

84
NOTE: To perform a spectrum analysis, select the <Analysis> icon before selecting
<Next>.
25. Once the thyroid count is complete, position the probe over the patient's thigh. Select <Count Patient Bkg>. The system instructs the user to position the probe to count the patient’s background. The distance bar and a red LED light can be flipped out from the rim into the center of the collimator face to help align the thyroid position. Remember to flip the LED back to the retracted position and move the distance bar to the bottom of the collimator out of the field before counting. Select <Accept> to continue. See the Warning on page 77.
26. The system begins counting the patient's background. When counting is complete, the message "Counting Complete" is displayed at the bottom of the screen. Select <Next>.
27. The Thyroid Uptake Results are displayed.
NOTE: When the results for the uptake study dataset are not to one’s satisfaction, select the item to be recounted and recount the thyroid or patient background before saving.
28. If satisfied with the results select <Save>. The Thyroid Uptake Results screen is displayed. Select <Save> again to save the dataset or select <Cancel> to return to the Thyroid Uptake screen without saving the results.
NOTE: When multiple counts (datasets) are being performed, after saving, tell the patient when to return for the next dataset to be counted.
29. Repeat steps 20 through 28 to count additional datasets.
NOTE: Print the Uptake Report from the Study Selection screen by highlighting the desired study and selecting <Reports>. This will display the report. Select the <Printer> icon to print.
Perform a Thyroid Uptake on a New Patient when Recounting a Standard
1. Select <Testing> from the Atomlab 960 Home Page. The Testing Menu is displayed. 2. Select <Thyroid Uptake>. The Select or Add a Patient screen is displayed. 3. Add a patient for which the thyroid study is performed. 4. Select <Accept>. The Add Study Selection screen is displayed. This screen displays the
patient name and uptake study procedures from which to select. Highlight the procedure method desired and select <Accept>.
NOTE: If the patient selected is already in the system, select <Add Study> to display the
Add Study screen.
NOTE: Procedures must be added in the Procedures section of the Utilities program.
5. The Study Selection screen is displayed for the selected patient. 6. Highlight the desired study and select <Accept>. The Study Selection screen is displayed.
The patient’s name, ID number and the selected procedure are displayed. Select <Next>.
CAUTION: The Thyroid Uptake screen is displayed. Confirm that the correct patient is displayed before proceeding.
7. Select <Count Standard>. The Activity Measurements screen is displayed.

85
8. Enter the Patient Dose activity, select <Accept> to continue. A message is displayed instructing the user to prepare to count the standard.
9. Position the capsule(s) in the thyroid phantom and set up the collimator for use. Set the distance on the distance bar and move the collimator into position. A red LED light can be flipped out from the rim into the center of the collimator face to help align the thyroid position. Remember to flip the LED back to the retracted position and move the distance bar to the bottom of the collimator out of the field before counting. The capsule count distance and the thyroid count distance must be the same. When the user is fully prepared to count the standard, select <Accept>. See the Warning on page 77.
10. The Counting Standard screen is displayed. Once counting begins, ROI counts, ROI CPM, Elapsed time and Time Remaining are indicated to the right of the counting window. When the system finishes counting, it will stop and complete a final download of the spectrum. The message “Counting Complete” is displayed at the bottom of the screen. Select <Next> to return to the Thyroid Uptake screen.
NOTE: NOTE: To perform a spectrum analysis, select the <Analysis> icon before selecting <Next>.
11. Select <Count Lab Bkg>. The system prompts to position the probe to count background. Count with the neck phantom in front of the collimator without the source in it.
12. Remove the capsule from the neck phantom and position the probe to measure lab background. The distance bar and a red LED light can be flipped out from the rim into the center of the collimator face to help align the thyroid position. Remember to flip the LED back to the retracted position and move the distance bar to the bottom of the collimator out of the field before counting. When the probe has been positioned, select <Accept>. The system begins counting background and will count for the selected time. See the Warning on page 77.
13. When lab background counting is finished, a “Counting Complete” message is displayed at the bottom of the screen. Select <Next> to return to the Thyroid Uptake screen.
NOTE: To perform a spectrum analysis, select the <Analysis> icon before selecting
<Next>.
14. The Thyroid Uptake screen is displayed. Review the results.
NOTE: When the results for the dose or lab background are not to one’s satisfaction, select the item to be recounted and recount the standard or lab background before saving.
15. If satisfied with the results select <Save>. The Verify Standard Count screen is displayed. 16. After saving, give the dose to the patient.
NOTE: If the dose is not immediately administered to the patient, the administration time can be corrected by selecting the <Settings> icon on the Thyroid Uptake screen and entering a corrected Dose Administration Time.
17. Tell the patient to return at a specific time. 18. Select <Back> to return to the Study Selection screen. 19. Select <Back> to return to the Select or Add a Patient screen to add another patient or if
counting the thyroid of a returning patient.
NOTE: At this point, the system can be used for other functions by returning to the Home screen and making the appropriate selection.
20. When the patient returns at the specified time, select <Testing> and <Thyroid Uptake>.

86
21. Highlight the patient on the Select or Add a Patient screen and select <Next>.
NOTE: The search options at the top of the screen can be used to find the desired patient by entering the last name and/or ID number and selecting <Search> (magnifying glass).
22. Confirm the patient’s name, ID and study on the Study Selection screen. Select <Next> to advance to the Thyroid Uptake screen.
23. Select <Count Thyroid> and position the patient’s thyroid with the same geometry as used for counting the dose. The distance bar and a red LED light can be flipped out from the rim into the center of the collimator face to help align the thyroid position. Remember to flip the LED back to the retracted position and move the distance bar to the bottom of the collimator out of the field before counting. Select <Accept> to begin counting the patient thyroid. See the Warning on page 77.
24. When the counting is complete, the message “Counting Complete” is displayed at the bottom of the screen. Select <Next> to return to the Thyroid Uptake screen.
NOTE: To perform a spectrum analysis, select the <Analysis> icon before selecting
<Next>.
25. Once the thyroid count is complete, position the probe over the patient's thigh. Select <Count Patient Bkg>. The system instructs the user to position the probe to count the patient’s background. The distance bar and a red LED light can be flipped out from the rim into the center of the collimator face to help align the thyroid position. Remember to flip the LED back to the retracted position and move the distance bar to the bottom of the collimator out of the field before counting. Select <Accept> to continue.
26. The system begins counting the patient's background. When counting is complete, the message "Counting Complete" is displayed at the bottom of the screen. Select <Next>.
27. Place the standard into the neck phantom and count the standard dose using the same geometry as used for the dose and patient’s thyroid. A distance bar and a red LED light can be flipped out from the rim into the center of the collimator face to help align the thyroid position. Remember to flip the LED back to the retracted position and move the distance bar to the bottom of the collimator out of the field before counting.
28. Select <Recount Standard>. The Counting Standard screen is displayed. Select <Accept> to begin the recount of the standard.
29. When the standard has been recounted, a “Counting Complete” message is displayed at the bottom of the screen. Select <Next> to return to the Thyroid Uptake screen.
30. Select <Recount Lab Background>. The system prompts to position the probe to recount the lab background. Count with the neck phantom in front of the collimator without the source in it.
31. Remove the capsule from the neck phantom and position the probe to measure lab background. The distance bar and a red LED light can be flipped out from the rim into the center of the collimator face to help align the thyroid position. Remember to flip the LED back to the retracted position and move the distance bar to the bottom of the collimator out of the field before counting. When the probe has been positioned, select <Accept>. The system begins counting lab background and will count for the selected time.
32. When lab background counting is finished, a “Counting Complete” message is displayed at the bottom of the screen. Select <Next> to return to the Thyroid Uptake screen.

87
Figure 6.11. Thyroid Uptake Results Screen.
33. The Thyroid Uptake Results are displayed.
NOTE: When the results for the recount standard, lab background, thyroid or patient
background are not to one’s satisfaction, select the item to be recounted and recount the thyroid or patient background before saving.
34. When satisfied with the results select <Save>. The Thyroid Uptake Results screen is displayed. Select <Save> again to save the dataset or select <Cancel> to return without saving.
NOTE: When multiple counts (datasets) are being performed, after saving, tell the patient when to return for the next dataset to be counted.
NOTE: Print an Uptake Report by selecting <Reports> on the Study Selection screen.
35. Repeat steps 20 through 34 to count additional datasets.
Perform a New Thyroid Uptake Study on an Existing Patient with a Previous Test or Study
1. When the patient arrives at the specified time, select <Testing> and <Thyroid Uptake>. 2. Highlight the patient on the Select or Add a Patient screen and select <Edit> to confirm the
patient and information is correct. Select <Accept> to return to the Select or Add a Patient screen.
3. Select <Next> to advance to the Study Selection screen. 4. Select <Add Study> to advance to the Add Study screen. 5. Highlight the study to perform and select <Accept>. The Study Selection screen is displayed
illustrating the original test and the test to be performed. Ensure the new test is highlighted and select <Next> to advance to the Thyroid Uptake screen.
NOTE: To view a previous study, highlight the previous test and select the <Report> icon at the bottom of the screen; the results for the previous test are displayed once the report type is selected.
6. Ensure the new test is highlighted and select <Next> to advance to the Thyroid Uptake screen.

88
CAUTION: The Thyroid Uptake screen is displayed. Confirm that the correct patient is displayed before proceeding.
7. Select <Count Standard>. The Activity Measurements screen is displayed. 8. Enter the Patient Dose activity, select <Accept> to continue. A message is displayed
instructing the user to prepare to count the standard. Position the capsule(s) in the thyroid phantom and set up the collimator for use. Set the distance on the distance bar and move the collimator into position. The distance bar and a red LED light can be flipped out from the rim into the center of the collimator face to help align the thyroid position. Remember to flip the LED back to the retracted position and move the distance bar to the bottom of the collimator out of the field before counting.
9. The capsule count distance and the thyroid count distance must be the same. When fully prepared to count the standard, select <Accept>. See the Warning on page 77.
10. The Counting Standard screen is displayed. Once counting begins, ROI counts, ROI CPM, Elapsed time and Time Remaining are indicated to the right of the counting window. When the system finishes counting, it will stop and complete a final download of the spectrum. The message “Counting Complete” is displayed at the bottom of the screen. Select <Next> to return to the Thyroid Uptake screen.
NOTE: To perform a spectrum analysis, select the <Analysis> icon before selecting
<Next>.
11. Select <Count Lab Bkg>. The system prompts to position the probe to count background. Count with the neck phantom in front of the collimator without the source in it.
12. Remove the capsule from the neck phantom and position the probe to measure lab background. The distance bar and a red LED light can be flipped out from the rim into the center of the collimator face to help align the thyroid position. Remember to flip the LED back to the retracted position and move the distance bar to the bottom of the collimator out of the field before counting. When the probe has been positioned, select <Accept>. The system begins counting background and will count for the selected time.
13. When lab background counting is finished, a “Counting Complete” message is displayed at the bottom of the screen. Select <Next> to return to the Thyroid Uptake screen.
NOTE: To perform a spectrum analysis, select the <Analysis> icon before selecting
<Next>.
14. The Thyroid screen is displayed. Review the results.
NOTE: If not satisfied with the results for dose or lab background, select the item to
recount and recount the standard or lab background before saving.
15. If satisfied with the results select <Save>. The Verify Standard Count screen is displayed. 16. After saving, give the dose to the patient
NOTE: If the dose is not immediately administered to the patient, the administration time can be corrected by selecting the <Settings> icon on the Thyroid Uptake screen and entering a corrected Dose Administration Time.
17. Tell the patient to return at a specific time. 18. Select <Back> to return to the Study Selection screen. 19. Select <Back> to return to the Select or Add a Patient screen to add another patient or to
count the thyroid of a returning patient.

89
NOTE: At this point, the system can be used for other functions by returning to the Home screen and making the appropriate selection.
20. When the patient returns at the specified time, select <Testing> and <Thyroid Uptake>. 21. Highlight the patient on the Select or Add a Patient screen and select <Next>.
NOTE: The search options at the top of the screen can be used to find the desired patient by entering the last name and/or ID number and selecting <Search> (magnifying glass).
22. Confirm the patient’s name, ID and study on the Study Selection screen. Select <Next> to advance to the Thyroid Uptake screen.
23. Select <Count Thyroid> and position the patient’s thyroid with the same geometry as used for counting the dose. The distance bar and a red LED light can be flipped out from the rim into the center of the collimator face to help align the thyroid position. Remember to flip the LED back to the retracted position and move the distance bar to the bottom of the collimator out of the field before counting. Select <Accept> to begin counting the patient thyroid.
24. When the counting is complete, the message “Counting Complete” is displayed at the bottom of the screen. Select <Next> to return to the Thyroid Uptake screen.
NOTE: To perform a spectrum analysis, select the <Analysis> icon before selecting
<Next>.
25. Once the thyroid count is complete, position the probe over the patient's thigh. Select <Count Patient Bkg>. The system instructs the user to position the probe to count the patient’s background. The distance bar and a red LED light can be flipped out from the rim into the center of the collimator face to help align the thyroid position. Remember to flip the LED back to the retracted position and move the distance bar to the bottom of the collimator out of the field before counting. Select <Accept> to continue.
26. The system begins counting the patient's background. When counting is complete, the message "Counting Complete" is displayed at the bottom of the screen. Select <Next>.
27. The Thyroid Uptake Results are displayed.
NOTE: If not satisfied with the results for dose or lab background, select the item to recount and recount the thyroid or patient background before saving.
28. If satisfied with the results select <Save>. The Thyroid Uptake Results screen is displayed. Select <Save> again to save the dataset or select <Cancel> to return to the Thyroid Uptake screen without saving the results.
NOTE: If performing multiple counts (datasets) tell the patient when to return for the next dataset to be counted.
29. When the patient returns at the specified time, select <Testing> and <Thyroid Uptake>. 30. Highlight the patient on the Select or Add a Patient screen and select <Next>. 31. Confirm the patient’s name, ID and study on the Study Selection screen. Select <Next> to
advance to the Thyroid Uptake screen. 32. Select <Count Thyroid> and position the patient’s thyroid with the same geometry as used
for the dose. The distance bar and a red LED light can be flipped out from the rim into the center of the collimator face to help align the thyroid position. Remember to flip the LED back to the retracted position and move the distance bar to the bottom of the collimator out of the field before counting. Select <Accept> to begin counting the patient thyroid.

90
33. When the counting is complete, the message “Counting Complete” is displayed at the bottom of the screen. Select <Next> to return to the Thyroid Uptake screen.
NOTE: To perform a spectrum analysis, select the <Analysis> icon before selecting
<Next>.
34. Once the thyroid count is complete, position the probe over the patient's thigh. Select <Count Patient Bkg>. The system instructs the user to position the probe to count the patient’s background. The distance bar and a red LED light can be flipped out from the rim into the center of the collimator face to help align the thyroid position. Remember to flip the LED back to the retracted position and move the distance bar to the bottom of the collimator out of the field before counting. Select <Accept> to continue.
35. The system begins counting the patient's background. When counting is complete, the message "Counting Complete" is displayed at the bottom of the screen. Select <Next>.
36. The Thyroid Uptake Results are displayed.
NOTE: If not satisfied with the results for dose or lab background, select the item to recount and recount the thyroid or patient background before saving.
37. If satisfied with the results select <Save>. The Thyroid Uptake Results screen is displayed. Select <Save> again to save the dataset or select <Cancel> to return to the Thyroid Uptake screen without saving the results.
NOTE: If performing multiple counts (datasets) tell the patient when to return for the next dataset to be counted.
38. Repeat steps 19 through 37 to count additional datasets.
Perform a New Thyroid Uptake Study on an Existing Patient with a Previous Test or Study When Recounting a Standard
1. When the patient arrives at the specified time, select <Testing> and <Thyroid Uptake>. 2. Highlight the patient on the Select or Add a Patient screen and select <Edit> to confirm the
patient and information is correct. Select <Accept> to return to the Select or Add a Patient screen.
NOTE: The search options at the top of the screen can be used to find the desired patient by entering the last name and/or ID number and selecting <Search> (magnifying glass).
3. Select <Next> to advance to the Study Selection screen.4. Select <Add Study> to advance to the Add Study screen. 5. Highlight the study to perform and select <Accept>. The Study Selection screen is displayed
showing the original test and the new test to be performed.
NOTE: To view a previous study, highlight the previous test and select the <Report> icon at the bottom of the screen. The results for the previous test are displayed after the report type is selected.
6. Ensure the new test is highlighted and select <Next>.
CAUTION: The Thyroid Uptake screen is displayed. Confirm that the correct patient is displayed before proceeding.
7. Select <Count Standard>. The Activity Measurements screen is displayed.

91
8. Enter the Patient Dose activity, select <Accept> to continue. A message is displayed instructing the user to prepare to count the standard.
9. Position the capsule(s) in the thyroid phantom and set up the collimator for use. Set the distance on the distance bar and move the collimator into position. The distance bar and a red LED light can be flipped out from the rim into the center of the collimator face to help align the thyroid position. Remember to flip the LED back to the retracted position and move the distance bar to the bottom of the collimator out of the field before counting. The capsule count distance and the thyroid count distance must be the same. When fully prepared to count the standard, select <Accept>. See the Warning on page 77.
10. The Counting Standard screen is displayed. Once counting begins, ROI counts, ROI CPM, Elapsed time and Time Remaining are indicated to the right of the counting window. When the system finishes counting, it will stop and complete a final download of the spectrum. The message “Counting Complete” is displayed at the bottom of the screen. Select <Next> to return to the Thyroid Uptake screen.
NOTE: To perform a spectrum analysis, select the <Analysis> icon before selecting <Next>.
11. Select <Count Lab Bkg>. The system prompts to position the probe to count background. The count should be performed with the neck phantom in front of the collimator without the source in it.
12. Remove the capsule from the neck phantom and position the probe to measure lab background. The distance bar and a red LED light can be flipped out from the rim into the center of the collimator face to help align the thyroid position. Remember to flip the LED back to the retracted position and move the distance bar to the bottom of the collimator out of the field before counting. When the probe has been positioned, select <Accept>. The system begins counting background and will count for the selected time.
13. When lab background counting is finished, a “Counting Complete” message is displayed at the bottom of the screen. Select <Next> to return to the Thyroid Uptake screen.
NOTE: To perform a spectrum analysis, select the <Analysis> icon before selecting <Next>.
14. The Thyroid screen is displayed. Review the results.
NOTE: If not satisfied with the results for dose or lab background, select the item to
recount and recount the standard or lab background before saving.
15. If satisfied with the results select <Save>. The Verify Standard Count screen is displayed. 16. After saving, give the dose to the patient.
NOTE: If the dose is not immediately administered to the patient, the administration time can be corrected by selecting the <Settings> icon on the Thyroid Uptake screen and entering a corrected Dose Administration Time.
17. Tell the patient when to return. 18. Select <Back> to return to the Study Selection screen. 19. Select <Back> to return to the Select or Add a Patient screen to add another patient or are
counting the thyroid of a returning patient.
NOTE: At this point, the system can be used for other functions by returning to the Home screen and making the appropriate selection.
20. When the patient returns, select <Testing> and <Thyroid Uptake>. 21. Highlight the patient on the Select or Add a Patient screen and select <Next>.

92
NOTE: The search options at the top of the screen can be used to find the desired patient by entering the last name and/or ID number and selecting <Search> (magnifying glass).
22. Confirm the patient’s name, ID and study on the Study Selection screen. Select <Next> to advance to the Thyroid Uptake screen.
23. Select <Count Thyroid> and position the patient’s thyroid with the same geometry as used for counting the dose. The distance bar and a red LED light can be flipped out from the rim into the center of the collimator face to help align the thyroid position. Remember to flip the LED back to the retracted position and move the distance bar to the bottom of the collimator out of the field before counting. Select <Accept> to begin counting the patient thyroid.
24. When the counting is complete, the message “Counting Complete” is displayed at the bottom of the screen. Select <Next> to return to the Thyroid Uptake screen.
NOTE: To perform a spectrum analysis, select the <Analysis> icon before selecting <Next>.
25. Once the thyroid count is complete, position the probe over the patient's thigh. Select <Count Patient Bkg>. The system instructs the user to position the probe to count the patient’s background. The distance bar and a red LED light can be flipped out from the rim into the center of the collimator face to help align the thyroid position. Remember to flip the LED back to the retracted position and move the distance bar to the bottom of the collimator out of the field before counting. Select <Accept> to continue.
26. The system begins counting the patient's background. When counting is complete, the message "Counting Complete" is displayed at the bottom of the screen. Select <Next>.
27. Place the standard into the neck phantom and count the standard dose using the same geometry as used for the dose and patient’s thyroid. The distance bar and a red LED light can be flipped out from the rim into the center of the collimator face to help align the thyroid position. Remember to flip the LED back to the retracted position and move the distance bar to the bottom of the collimator out of the field before counting.
28. Select <Recount Standard>. The Counting Standard screen is displayed. Select <Accept> to begin the recount of the standard.
29. When the standard has been recounted, a “Counting Complete” message is displayed at the bottom of the screen. Select <Next> to return to the Thyroid Uptake screen.
NOTE: To perform a spectrum analysis, select the <Analysis> icon before selecting <Next>
30. Select <Recount Lab Background>. The system prompts to position the probe to recount the lab background. Count with the neck phantom in front of the collimator without the source in it.
31. Remove the capsule from the neck phantom and position the probe to measure lab background. The distance bar and a red LED light can be flipped out from the rim into the center of the collimator face to help align the thyroid position. Remember to flip the LED back to the retracted position and move the distance bar to the bottom of the collimator out of the field before counting. When the probe has been positioned, select <Accept>. The system begins counting lab background and will count for the selected time.
NOTE: To perform a spectrum analysis, select the <Analysis> icon before selecting <Next>.
32. When lab background counting is finished, a “Counting Complete” message is displayed at the bottom of the screen. Select <Next> to return to the Thyroid Uptake screen.
33. The Thyroid Uptake Results are displayed.

93
NOTE: If not satisfied with the results for dose or lab background, select the item to recount and recount the standard or lab background before saving.
34. When satisfied with the results select <Save>. The Thyroid Uptake Results screen is displayed. Select <Save> again to save the dataset or select <Cancel> to return without saving.
NOTE: If performing multiple counts (datasets) tell the patient when to return for the next dataset to be counted.
35. Repeat steps 20 through 34 to count additional datasets.
Thyroid Uptake with Multiplier
The thyroid uptake with a multiplier is used when a therapeutic dose is going to be given to a patient. The therapeutic dose rate is too high to count with the uptake probe. To perform this test, a standard is counted that is a fraction of the dose given to the patient. Before starting the study, both the standard and the therapeutic dose must be counted in a dose calibrator. The two activities are entered in the Activity Measurement screen. The system calculates what multiplier to use to compare the standard and the therapeutic dose. The net standard CPM is multiplied times the multiplier for the therapeutic dose rate that is decay corrected as part of the uptake calculation.
Perform a Thyroid Uptake with Multiplier
1. Select <Testing> from the Atomlab 960 Home Page. The Testing Menu is displayed. 2. Select <Thyroid Uptake>. The Select or Add a Patient screen is displayed. 3. Add a patient for which the thyroid study is performed. 4. Select <Accept>. The Add Study Selection screen is displayed. This screen displays the
patient name and uptake study procedures from which to select. Highlight the procedure created that uses the therapeutic dose multiplier and select <Accept>.
NOTE: Procedures must be added in the Procedures section of the Utilities program.
CAUTION: The Thyroid Uptake screen is displayed. Confirm that the correct patient is displayed before proceeding.
Figure 6.12. Entering Therapy, Dose, and the Standard used for the Multiplier on the Activity Measurements Screen.

94
5. Select <Count Standard>. The Activity Measurements screen is displayed showing a blank for the patient dose and standard activities. Enter the patient dose activity and enter the standard activity, select <Accept> to continue. A message is displayed instructing the user to prepare to count the standard.
6. Position the standard capsule(s) in the thyroid phantom and set up the collimator for use. Set the distance on the distance bar and move the collimator into position. The distance bar and a red LED light can be flipped out from the rim into the center of the collimator face to help align the thyroid position. Remember to flip the LED back to the retracted position and move the distance bar to the bottom of the collimator out of the field before counting. The capsule count distance and the thyroid count distance must be the same. When fully prepared to count the standard, select <Accept>. See the Warning on Page 77.
7. The Counting Standard screen is displayed. Once counting begins, ROI counts, ROI CPM, Elapsed time and Time Remaining are indicated to the right of the counting window. When the system finishes counting, it will stop and complete a final download of the spectrum. The message “Counting Complete” is displayed at the bottom of the screen. Select <Next> to return to the Thyroid Uptake screen.
NOTE: To perform a spectrum analysis, select the <Analysis> icon before selecting <Next>.
8. Select <Count Lab Bkg>. The system prompts to position the probe to count background. Count with the neck phantom in front of the collimator without the source in it.
9. Remove the capsule from the neck phantom and position the probe to measure lab background. The distance bar and a red LED light can be flipped out from the rim into the center of the collimator face to help align the thyroid position. Remember to flip the LED back to the retracted position and move the distance bar to the bottom of the collimator out of the field before counting. When the probe has been positioned, select <Accept>. The system begins counting background and will count for the selected time.
10. When lab background counting is finished, a “Counting Complete” message is displayed at the bottom of the screen. Select <Next> to return to the Thyroid Uptake screen.
NOTE: To perform a spectrum analysis, select the <Analysis> icon before selecting <Next>.
11. The Thyroid Uptake screen is displayed.
NOTE: If not satisfied with the results for dose or lab background, select the item to recount and recount the standard or lab background before saving.
12. 12. If satisfied with the results select <Save>. The Verify Standard Count screen is displayed. 13. After saving, give the dose to the patient.
NOTE: If the dose is not immediately administered to the patient, the administration time can be corrected by selecting the <Settings> icon on the Thyroid Uptake screen and entering a corrected Dose Administration Time.
14. Tell the patient to return at a specific time. 15. Select <Back> to return to the Study Selection screen. 16. Select <Back> to return to the Select or Add a Patient screen to add another patient or are
counting the thyroid of a returning patient.
NOTE: At this point, the system can be used for other functions by returning to the Home screen and making the appropriate selection.
17. When the patient returns at the specified time, select <Testing> and <Thyroid Uptake>. 18. Highlight the patient on the Select or Add a Patient screen and select <Next>.

95
NOTE: The search options at the top of the screen can be used to find the desired patient by entering the last name and/or ID number and selecting <Search> (magnifying glass).
19. Confirm the patient’s name, ID and study on the Study Selection screen. Select <Next> to advance to the Thyroid Uptake screen.
20. Select <Count Thyroid> and position the patient’s thyroid with the same geometry as used for counting the dose. The distance bar and a red LED light can be flipped out from the rim into the center of the collimator face to help align the thyroid position. Remember to flip the LED back to the retracted position and move the distance bar to the bottom of the collimator out of the field before counting. Select <Accept> to begin counting the patient thyroid.
21. When the counting is complete, the message “Counting Complete” is displayed at the bottom of the screen. Select <Next> to return to the Thyroid Uptake screen.
NOTE: To perform a spectrum analysis, select the <Analysis> icon before selecting <Next>.
22. Once the thyroid count is complete, position the probe over the patient's thigh. Select <Count Patient Bkg>. The system instructs the user to position the probe to count the patient’s background. The distance bar and a red LED light can be flipped out from the rim into the center of the collimator face to help align the thyroid position. Remember to flip the LED back to the retracted position and move the distance bar to the bottom of the collimator out of the field before counting. Select <Accept> to continue.
23. The system begins counting the patient's background. When counting is complete, the message "Counting Complete" is displayed at the bottom of the screen. Select <Next>.
24. The Thyroid Uptake Results are displayed.
NOTE: If not satisfied with the results for dose or lab background, select the item to recount and recount the standard or lab background before saving.
25. If satisfied with the results select <Save>. The Thyroid Uptake Results screen is displayed. Select <Save> again to save the dataset or select <Cancel> to return to the Thyroid Uptake screen without saving the results.
26. Repeat steps 17 through 25 to count additional datasets.
NOTE: The therapeutic dose multiplier is automatically calculated as part of the uptake result.
NOTE: If performing multiple counts (datasets) tell the patient when to return for the next dataset to be counted.
Perform a Thyroid Uptake with Multiplier when Recounting a Standard
The procedure to perform a thyroid uptake with multiplier when recounting a standard follows the same procedure as used for performing a thyroid uptake with multiplier except it is necessary to add the recounting standard and lab background.
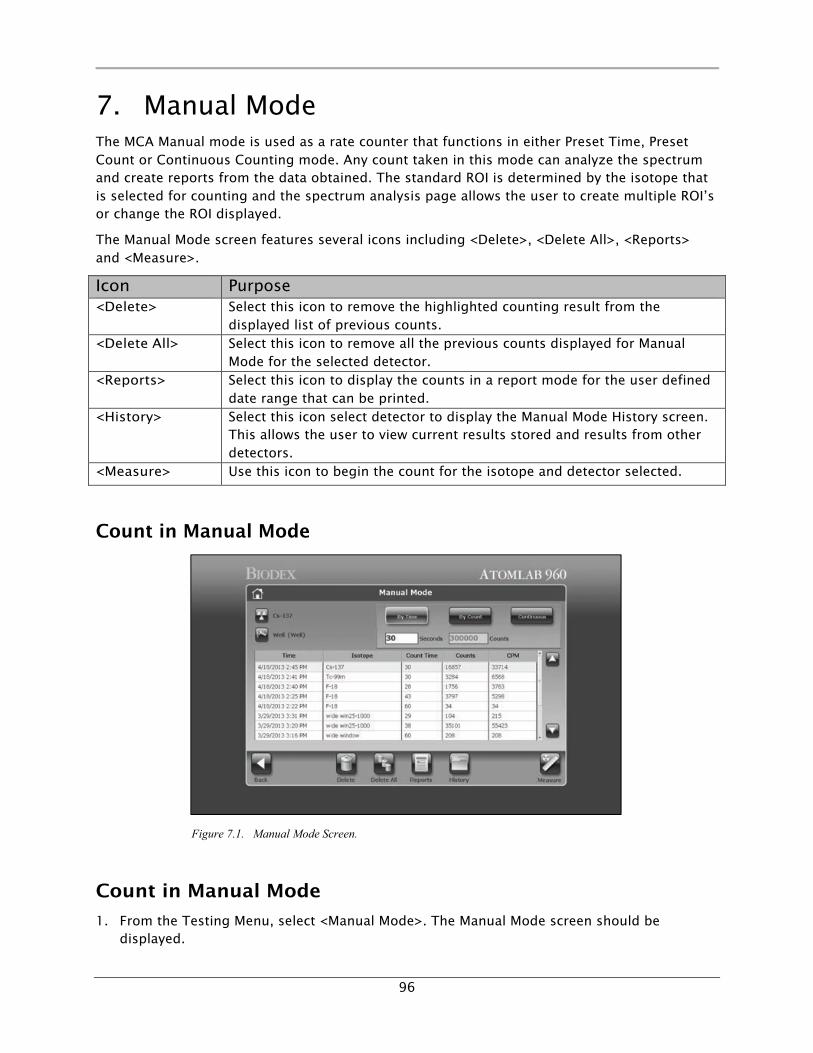
96
7. Manual Mode The MCA Manual mode is used as a rate counter that functions in either Preset Time, Preset Count or Continuous Counting mode. Any count taken in this mode can analyze the spectrum and create reports from the data obtained. The standard ROI is determined by the isotope that is selected for counting and the spectrum analysis page allows the user to create multiple ROI’s or change the ROI displayed.
The Manual Mode screen features several icons including <Delete>, <Delete All>, <Reports> and <Measure>.
Icon Purpose <Delete> Select this icon to remove the highlighted counting result from the
displayed list of previous counts. <Delete All> Select this icon to remove all the previous counts displayed for Manual
Mode for the selected detector. <Reports> Select this icon to display the counts in a report mode for the user defined
date range that can be printed. <History> Select this icon select detector to display the Manual Mode History screen.
This allows the user to view current results stored and results from other detectors.
<Measure> Use this icon to begin the count for the isotope and detector selected.
Count in Manual Mode
Figure 7.1. Manual Mode Screen.
Count in Manual Mode
1. From the Testing Menu, select <Manual Mode>. The Manual Mode screen should be displayed.

97
2. Select the desired <Isotope> and <Detector>. If they are not already displayed in the top left of the screen, select either the <Isotope> icon to display a list of the isotopes from which to select, or select the <Detector> icon to select between the well and probe.
3. Select to highlight the desired method to use for counting: <By Time>, <By Count> or <Continuous> counting.
• <By Time>: When counting by preset time, the system counts for the time interval selected, displayed in seconds. Enter the desired counting time in the box in front of the seconds field.
• <By Count>: The system counts to just beyond the number of ROI counts entered in the box before the “Counts” field.
• <Continuous>: The system will count until <Stop> is selected or the system times out. 4. Select <Measure>. The system displays a message to prepare to count the sample. The
count type is displayed at the top of the screen. Select <Accept>. 5. If a calibration has not been made today, the Counting Standard screen is displayed. Once
counting begins, ROI counts, ROI CPM, Elapsed time and time remaining are indicated to the right of the counting window. When the system finishes counting, it will stop and complete a final download for the spectrum. The message “Counting Complete” is displayed at the bottom of the screen.
NOTE: To perform a spectrum analysis, select the <Analysis> icon before selecting <Next>.
6. Select <Next> to return to the Manual Mode screen to perform a manual mode count. 7. After selecting <Next>, the system will display a message to “Prepare to Count Sample”.
Select <Accept>. 8. The system will count the sample and display the spectrum, ROI Counts and ROI cpm, with
elapsed time and time remaining while counting.
NOTE: To perform a spectrum analysis, select the <Analysis> icon before selecting <Next>. The analysis can be printed for the records.
9. Select <Next> to return to the Manual Mode screen. Another sample can be counted if desired to be added to the list of items previously counted.
10. Additional samples can be measured or the user can delete any items already counted. 11. Select <Reports> to display a date range selection that can be adjusted to the date range
desired for display and print. Enter the date range and select <Accept> to advance to the Manual Mode Report. If the <Printer> icon is selected, the report will print.
12. Select <History> to display “Select Detector”. The user can select a current detector on the system or a previously connected detector. Select <Accept> to display Manual Mode History. Select <Delete> to delete the highlighted count, select <Delete All> to delete all the items in the History or select <Reports> to enter a Data Range and select
13. <Accept> to advance to the Manual Mode Report. Select the <Printer> icon and the report will print.
14. Select <Back> to return to the Manual Mode screen.

98
8. Wipe Testing The shielded well counter uses a 2" x 2" sodium iodide drilled well crystal integral line detector. The detector is housed in a lead shield with 1" of lead shielding. An optional shield is available to add an additional 1" of lead. The well detector has a 1024 channel multi-channel analyzer built into its base. The system is designed to allow users to quickly and simply perform required daily and weekly wipe tests for their department.
The Atomlab 960 Well Counter is designed to use a Cs-137 rod source to perform the daily automatic calibration function. A series of initial setup functions must be performed before the well counter can be used. Once these initial setup functions are completed, operators needs only complete a daily calibration and background count before counting wipes.
The Wipe Program uses a full spectrum energy range of 0 to 750 keV, covering the normal isotopes used in nuclear medicine. One channel is used to accumulate any counts over 750 keV, allowing the user to k if there is a contaminate with a high energy over 750 keV. Manual Mode can be used for energy above 750 keV.
When performing a wipe test, the unit counts and displays a full spectrum count of 0 to 750 keV. From this full spectrum, the Wipe Program displays the user set wide window and calculates the net counts in the wide window along with the net dpm’s in the wide window.
The Wipe Program allows the user the option of looking at just a wide window or the wide window plus the isotopes chosen for that location. The user creates the list of locations to wipe and this list is stored in memory in the display. Each location can be customized to include results for specific isotopes and what type of wipe is performed: restricted area, unrestricted, sealed source or package.
When a wipe is counted, only one count is required for determination of the results for the wide window and any isotopes associated with that location. Each isotope has an associated window and the system checks each isotope’s window and calculates the results for the specific windows from the one wide window count.
If a wipe count registers above the wide window trigger level, the system notifies the operator that the trigger level has been exceeded. The system also shows if any individual isotopes that have been made available for this particular location are over the trigger and what the readings are for each individual isotope listed.
Users have the option to set the displayed results as cpm, dpm, microcuries, or bequerels and different types of wipe tests can be set to show the results in various units of measurement. Each type of location has different trigger levels associated with the allowable level of contamination.
The Wipe Program is designed allowing the wide window energy range used for the basic test results to be set by the user, along with the isotope efficiency to be used for the calculation of the efficiency for the wide window. Typically, a low efficiency isotope is used for the wide window calculation. If an isotope with a low efficiency is used and the wipe passes the test, isotopes that have a higher efficiency automatically pass if they are the contaminates.
For daily operation of the Well Counter, the user first places the Cesium-137 rod into the well or a CS-137 Disc Source into the Well Holder, select <Accept> to automatically perform the calibration.

99
After calibration is completed, the source is removed and a background measurement is performed. Once the background measurement is completed and saved, the unit advances to the wipe test program. The count wipe is selected and the system automatically performs a wide window count if no location is selected. If the user selects one of the locations and presses count wipe, the system counts the wipe and completes all the determinations required for the test. The Wipe Program allows the user to print the test results.
NOTE: The user can setup the system so the Daily Calibration is also a Constancy. Use the same source in the same Geometry every time the Constancy is performed.
Perform a Wipe Test
Figure 8.1. Wipe Test Screen.
NOTE: If some isotope efficiencies have yet to be entered, a Wipe Error message is displayed. Select <Accept> to go to the specific isotope window to enter efficiency for each missing isotope as previously described in the Chapter 4 section titled “Efficiency For The Selected Detector.”
Figure 8.2. The Wipe Error Screen Notifies the User the Wide Window Efficiency Setting is Missing.

100
Figure 8.3. The Wipe Efficiencies Required Screen Notifies the User that Wipe Efficiences for Some Isotopes are Missing.
Figure 8.4. Wipe Selection Screen.
3. Select the wipe area and location for the wipe to be counted. 4. Select <Wipe>. The Wipe Background Required screen is displayed. Select <Accept> to
perform the wipe background or <Cancel> to return to the Wipe Test screen without performing a background.
NOTE: If the daily calibration has not been performed today, the system will force the user to calibrate before performing the background.
5. Before starting the Wipe Background Count, ensure there are no sources near the wipe chamber. Select <Accept> to start the background count. The Wide Window Spectrum is displayed while background is counting.
6. Once the background has been counted, the spectrum is displayed for the Wipe Background Count screen. The display shows the full spectrum counts. Select <Analysis> to perform a spectrum analysis before proceeding or select <Next> to advance to the Background Results screen.
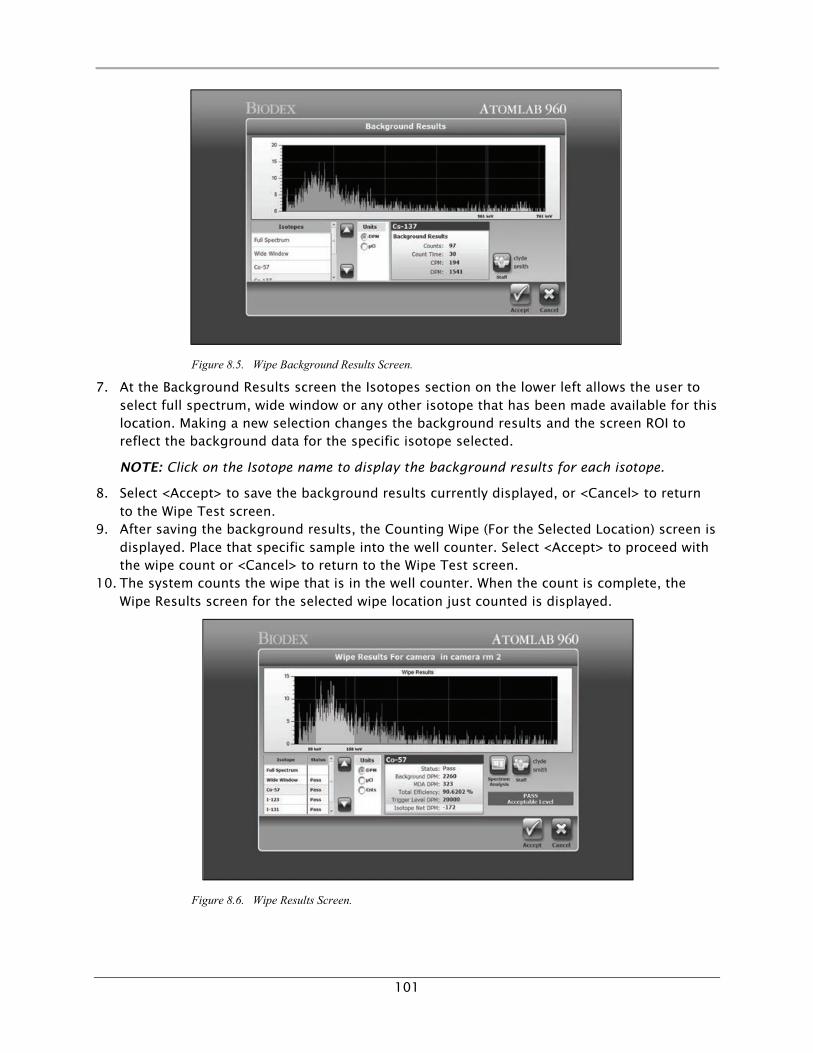
101
Figure 8.5. Wipe Background Results Screen.
7. At the Background Results screen the Isotopes section on the lower left allows the user to select full spectrum, wide window or any other isotope that has been made available for this location. Making a new selection changes the background results and the screen ROI to reflect the background data for the specific isotope selected.
NOTE: Click on the Isotope name to display the background results for each isotope.
8. Select <Accept> to save the background results currently displayed, or <Cancel> to return to the Wipe Test screen.
9. After saving the background results, the Counting Wipe (For the Selected Location) screen is displayed. Place that specific sample into the well counter. Select <Accept> to proceed with the wipe count or <Cancel> to return to the Wipe Test screen.
10. The system counts the wipe that is in the well counter. When the count is complete, the Wipe Results screen for the selected wipe location just counted is displayed.
Figure 8.6. Wipe Results Screen.

102
11. On the Wipe Results screen, the Isotopes section on the lower left allows the user to select full spectrum, wide window or any other isotope that has been made available for this location. Making a new selection changes the results and the screen ROI to reflect the data for the specific isotope selected.
12. The results display what isotopes pass or fail and allow the user to change the results units to dpm, µCi or Cnts. Select <Analysis> if a spectrum analysis is desired. Select <Staff> to change the staff member, or select <Accept> to save this wipe result and return to the Wipe Test screen to select another location and perform the next wipe. Select <Cancel> to return to Wipe Test screen without saving wipe.
NOTE: Full spectrum results will only be displayed in counts. All other isotopes including the wide window can be displayed in dpm, µCi or counts.
Figure 8.7. Wipe History Screen.
13. After all the desired wipe testing is completed select <History> to display the Wipe History screen. Select a specific wipe performed and select <View Data> to show the specific wipe results for the selected wipe location.
Figure 8.8. View Wipe Details Screen.
14. To print wipe results from the Wipe View Details screen, Wipe History screen or Reports, select <Printer> from the top right corner of the screen. The selected Wipe Report is

103
displayed. Select <Printer> again to print the report. Selecting the <+> or <-> icons enlarges or decreases the report on the screen for viewing purposes. To save a copy of the Wipe Report to the computer, <Save> and follow the standard Windows save procedure. Select <Back> to return to the View Wipe Details screen. Select <Back> to return to the Wipe History screen.
NOTE: Wipe results can be printed from the Reports menu on the Home screen.
15. On the Wipe History screen, select <View Options>. The Wipe History View Options screen is displayed. This screen allows the user to select specific “area types”, specific “areas” or “all” areas, and the date range to be displayed as the results of the testing on the Wipe History screen.
Figure 8.9. Wipe History View Options Screen.
16. On the <Wipe History View Options> screen, select <Area Type> to select a type or area, or “all” to be viewed. Select <Area> to display a listing of all the specific areas in the specific area type selected or in all areas. Select <Date Range> to set the date range accordingly. Select <Accept> to record any changes.
NOTE: Selecting <Last Full Month> will prompt the system to display the last full month completed, plus any additional days from the current month. There are a number of choices that can be selected.

104
Figure 8.10. Individual Wipe Test Report Printout
NOTE: The user can set a system wide default for all “Data History Display” from the <Utilities> menu on the <Home> screen. From the <Utilities> select <System Setup> and select the <General> tab.
Johnson Memorial Clinic20HospitalWay
PortJefferson,NY11967
Wipe Test Report
Net Counts : 19,830
Total Net CPM : 39,660.0
Test Time (sec) : 30
Net Counts > 750 keV : 400
Test Date
Area Name
Location
Status
: 4/18/2013 9:50:03 AM
: camera rm 2
: table
Total Efficiency
Background
Net Activity
Net CPM
ROI (KeV)
Trigger Level
: 34.76 %
: 45,637 DPM
: 66,461 DPM
: 23,100.0
: 25 - 750
: 20,000 DPM
Performed By
Detector
: Tom Tibbons
: Well (S/N: 122)
Comments:
Signature: DateSigned:
Wide Window 45,637 DPM 0 DPM 23,100.0 66,461 DPM 20,000 DPM Fail
Co-57 2,666 DPM 350 DPM 4,334.0 4,783 DPM 20,000 DPM Pass
Cs-137 43,031 DPM 3,761 DPM 4,120.0 32,734 DPM 20,000 DPM Fail
F-18 6,053 DPM 933 DPM 6,254.0 21,532 DPM 20,000 DPM Fail
I-123 (Well) 2,734 DPM 430 DPM 2,858.0 4,612 DPM 2,000 DPM Fail
Tc-99m 1,178 DPM 241 DPM 1,704.0 2,095 DPM 20,000 DPM Pass
Location
Status
: table Performed By
Detector
: Tom Tibbons
: Well (S/N: 122)Isotope Background MDA Net CPM Net Activity Trigger Status
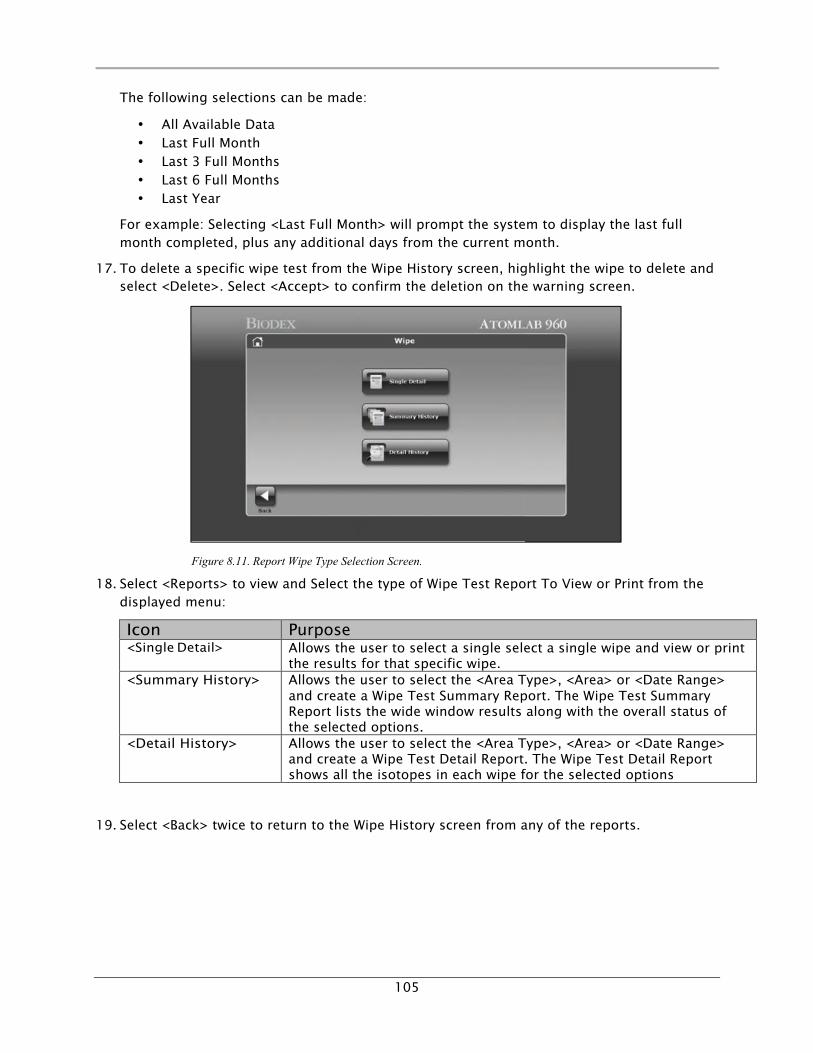
105
The following selections can be made:
• All Available Data • Last Full Month • Last 3 Full Months • Last 6 Full Months • Last Year
For example: Selecting <Last Full Month> will prompt the system to display the last full month completed, plus any additional days from the current month.
17. To delete a specific wipe test from the Wipe History screen, highlight the wipe to delete and select <Delete>. Select <Accept> to confirm the deletion on the warning screen.
Figure 8.11. Report Wipe Type Selection Screen.
18. Select <Reports> to view and Select the type of Wipe Test Report To View or Print from the displayed menu:
Icon Purpose <Single Detail> Allows the user to select a single select a single wipe and view or print
the results for that specific wipe. <Summary History> Allows the user to select the <Area Type>, <Area> or <Date Range>
and create a Wipe Test Summary Report. The Wipe Test Summary Report lists the wide window results along with the overall status of the selected options.
<Detail History> Allows the user to select the <Area Type>, <Area> or <Date Range> and create a Wipe Test Detail Report. The Wipe Test Detail Report shows all the isotopes in each wipe for the selected options
19. Select <Back> twice to return to the Wipe History screen from any of the reports.

106
9. Performing a Bioassay Bioassay uses the probe detector. The user must setup the detectors, isotopes, staff and Bioassay setup in Utilities before performing a Bioassay test (see Chapter 4). Bioassay is a measure of the activity in the staff’s thyroid. The efficiency entered is used to calculate the dpm, µCi’s or Bq’s of activity from the counting rate. The geometry should be set as close to the probe as possible. The geometry is set in the Detector or Isotope Efficiency in the Utilities Mode. It is important to have the correct geometry for the calculation. The system shows the MDA calculation based on the background count rate, background counting time and staff counting time.
NOTE: The MDA must be below the trigger level. A short counting time raises the MDA.
Performing a Bioassay Test
1. From the <Home> page select <Testing>. The Testing screen is displayed. 2. Select <Bioassay>. The Bioassay screen is displayed.
Figure 9.1. Testing Home Screen.
Figure 9.2. Staff Selection Screen.

107
3. If a Bioassay background has not been performed today, select <Background>. Make sure no sources are near the probe and select <Accept> to start the background count.
4. Once the background has been counted, the spectrum is displayed for the Bioassay Background Count. The display shows the full spectrum counts. Select <Analysis> to perform a spectrum analysis before proceeding, or select <Next> to advance to the Background Results screen.
5. At the Background Results screen (See Figure 9.3.) the Isotopes section on the lower left allows the user to select full spectrum, or any other isotope that has been made available. Making a new selection changes the background results and the screen ROI to reflect the background data for the specific isotope selected.
NOTE: The background results for each isotope is displayed by clicking on an isotope name.
6. Select <Accept> to save the background results currently displayed, or <Cancel> to return to the Bioassay Test screen.
7. After saving the background, select the staff member for which the Bioassay is to be performed and select <Measure>
Figure 9.3. Bioassay Background Results Screen.
8. Position the probe for the Bioassay test and select <Accept> to start the Bioassay count.
NOTE: The current distance used for the Bioassay calculation is displayed. The default value is 18.50cm. It is important to use the correct distance (Geometry).
9. Once the counting is finished, the Bioassay Results screen is shown.
Figure 9.4. Bioassay Counting Results screen for Staff Member.

108
10. On the Bioassay Results screen, the Isotopes section on the lower left allows the user to select full spectrum or any other isotope that has been made available for this staff member. Making an isotope selection changes the results and the screen ROI to reflect the data for the specific isotope selected.
11. The results display what Isotopes pass or fail and allow the user to change the results units to dpm, µCI or Cnts. Select <Analysis> if a spectrum analysis is desired. Select <Staff> to change the staff member performing the test, or select <Accept> to save this Bioassay result and return to the Bioassay Test screen to select another person and perform the next Bioassay test. Select <Cancel> to return to Bioassay Test screen without saving.
NOTE: Full spectrum results will only be displayed in counts. All other isotopes can be displayed in dpm, µCi/Bq or counts.
12. Once the desired Bioassay tests are completed, select <History> to display the Bioassay History screen. Select a specific Bioassay performed and select <View Data> to show the specific Bioassay results for the selected Bioassay.
13. From the Bioassay History screen, see Bioassay Facility Summary Report.
Figure 9.5. Bioassay History Screen.
Figure 9.6. Bioassay History Screen Illustrating Bioassay Results for a Selected Bioassay.

109
Figure 9.7. Navigation Sequence for Bioassay Facility Summary Report Screen.
Figure 9.8. Bioassay View Details Screen.
14. To print Bioassay results from the Bioassay View Details screen, Bioassay History screen or Reports, select <Printer> from the top right corner of the screen. The selected Bioassay Report is displayed. Select <Printer> again to print the report. Selecting the <+> or <-> icons enlarges or decreases the report on the screen for viewing purposes. To save a copy of the Bioassay Report to the computer, select <Save> and follow the standard Windows save procedure. Select <Back> to return to the Bioassay View Details screen. Select <Back> to return to the Bioassay History screen.
NOTE: Bioassay results may also be printed from the <Reports> menu on the <Home> screen.
15. On the Bioassay History screen, select <View Options>. The Bioassay History View Options screen is displayed. This screen allows the user to select a specific “Staff Type”, specific “Staff Name” or “All”, and the “Date Range” to be displayed for the results of the testing on the Bioassay History screen.

110
Figure 9.9. Bioassay History View Option Screen.
16. To delete a specific Bioassay test from the Bioassay History screen, highlight the Bioassay to delete and select <Delete>. Select <Accept> to confirm the deletion on the warning screen.
Figure 9.10. Select Type of Bioassay Report to Print.
17. On the Bioassay History screen select <Reports> to view and select the type of Bioassay Test Report to View or Print. Select from <Single Detail>, <Summary History> or <Detail History> as follows:
Icon Purpose <Single Detail> Allows the user to select a single Bioassay and view or print the results
for that specific Bioassay. <Summary History> Allows the user to select the <Staff Type>, <Staff Name> and <Date
Range> and create a Bioassay Test Summary Report. The Bioassay Summary Report lists the results along with the overall status of the selected options.
<Detail History> Allows the user to select the <Staff Type>, <Specific Staff Name> and <Date Range> and create a Bioassay Test Detail Report. The Bioassay Test Detail Report shows all the Bioassay tests for the person in the Date Range selected.
18. Select <Back> twice to return to the Bioassay History screen from any of the reports.

111
Figure 9.11. Single Detail Test Report..

112
Figure 9.12. Individual Detail History Report.

113
Figure 9.13. Bioassay Summary History Report..

114
10. DICOM (Optional) Digital Imaging and Communications in Medicine is the international standard for medical images and related information. It defines the formats for medical images that can be exchanged with the data and quality necessary for clinical use.
Patient information that is created in the DICOM system can be downloaded/ added from DICOM system to the Atomlab 960 software. Once it Is available to the Atomlab 960 software, the thyroid uptake operation can be performed and the test result can be uploaded/sent back to the DICOM system.
The following describes the setup procedure as well as how to use DICOM with Atomlab 960 software.
Prerequisites:
• This Flat Panel PC will have to be connected to a Hospital/Facility Network (preferably wired connection).
• This machine will require an IP address.
Once connection is established and connected to the network, the following steps are required for Atomlab 960 software:
• DICOM Licensing/ Activation • DICOM Setup/ Configuration
DICOM Licensing/Activation:
The user must purchase a software license (Part #187-146) for DICOM from Biodex to activate the DICOM features on Atomlab 960 software. This is a one-time process.
1. From the Thyroid Uptake home screen, click on <Utilities> System Setup. It will display a tab based screen. Go to “DICOM” tab. Initially, there is only one button <Activate DICOM Features>.
Figure 10.1. System Setup
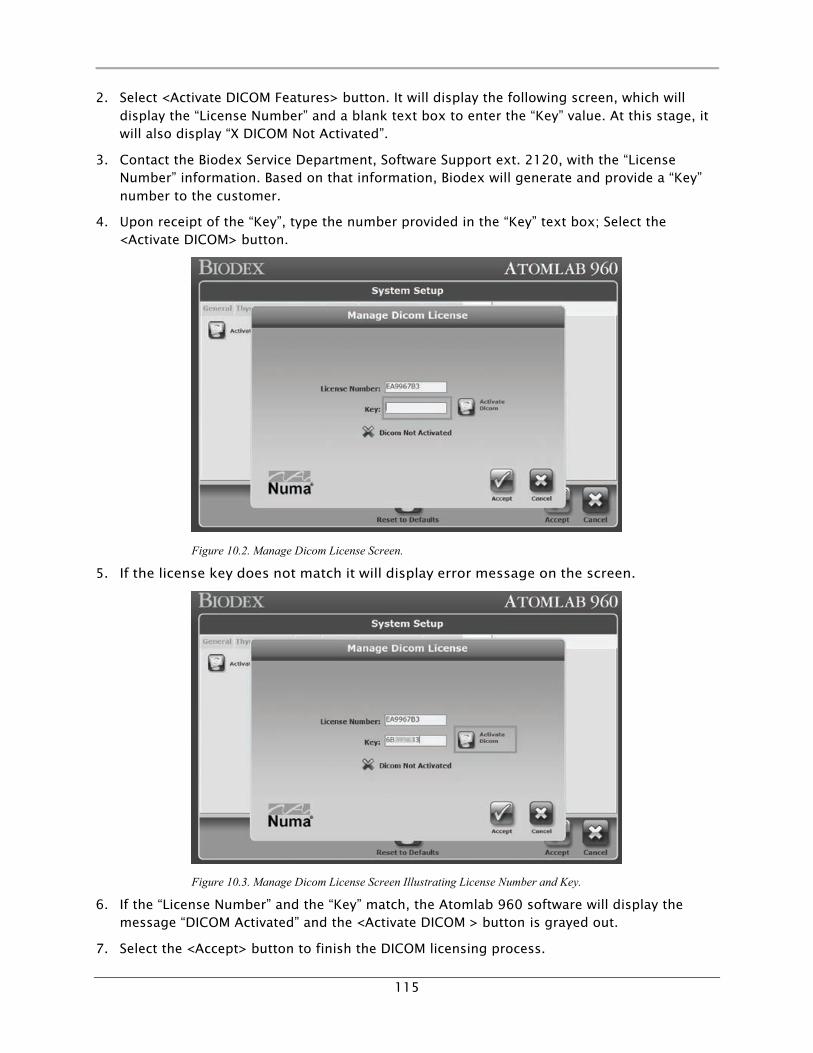
115
2. Select <Activate DICOM Features> button. It will display the following screen, which will display the “License Number” and a blank text box to enter the “Key” value. At this stage, it will also display “X DICOM Not Activated”.
3. Contact the Biodex Service Department, Software Support ext. 2120, with the “License Number” information. Based on that information, Biodex will generate and provide a “Key” number to the customer.
4. Upon receipt of the “Key”, type the number provided in the “Key” text box; Select the <Activate DICOM> button.
Figure 10.2. Manage Dicom License Screen.
5. If the license key does not match it will display error message on the screen.
Figure 10.3. Manage Dicom License Screen Illustrating License Number and Key.
6. If the “License Number” and the “Key” match, the Atomlab 960 software will display the message “DICOM Activated” and the <Activate DICOM > button is grayed out.
7. Select the <Accept> button to finish the DICOM licensing process.

116
Figure 10.4. Manage Dicom License Screen Illustrating Dicom Activated Message.
8. DICOM is licensed, activated and ready for next step- DICOM system setup/ configuration.
DICOM Setup/Configuration
Once the DICOM licensing part is complete, Atomlab 960 software will display more setup options. Follow the steps below to complete the DICOM Setup/ configuration of the servers.
Setup Procedure:
1. Atomlab 960 software will display the following screen. The user must provide the necessary information.
Figure 10.5. System Setup Screen.
2. On the screen displayed in Figure 10.5, enter the following information:

117
• Station AE Title – The value is 'Atomlab960'. Confirm that the same Station AE Title is used on the Hospital/Facility’s (PACs/)DICOM system. This title must be a match or it will not work.
• Invert DICOM Reports – By default, this is checked. When checked, it displays inverted color on the DICOM report with the background black and the text white.
• Modality Filter – Modality Filter is a drop-down menu that includes some predefined modality values. By default, the value NM is selected (abbreviation for nuclear medicine). It filters the patient list from DICOM Worklist server. When set to NM, only patients associated with the NM modality will appear in the list of patients. To view all patients in the list, delete the selected value and leave it blank. Any other value can be typed in the modality filter. Any new value used is saved for later use.
3. Configure the Worklist and Storage Server to the Atomlab 960 software and select the <Add> button.
4. The DICOM Server Management screen is displayed. Enter the following information:
• Server Name – Delete the default value in the text field and enter the server name.
• IP Address – Delete the default value in the text field and enter the IP address for the server. (The system will allow entry of the server machine name/hosting name.)
• Port – Delete the default value in the text field and enter the port for the server.
• AE Title – Delete the default value in the text field and enter the AE title of the server.
• Service List – This is typically displayed with a value of 'ATOMLAB_SCU_Service_List'. Leave as is unless the server setting is different.
• DICOM Features – Select the type of server, e.g., whether it is a C-Store or Worklist Provider.
Figure 10.6. DICOM Server Management Screen with Data.

118
5. The following screen is an example of the DICOM Server Management screen when all of the information has been provided:
Figure 10.7. DICOM Server Management Screen With all Data Entered.
6. Select the <Test Server> button. This will verify that the information provided is correct and that communication with the server (Worklist/C-Store provider) has been established.
Figure 10.8. DICOM Server Management Screen Illustrating Server Test Successful Message.
7. If the server connection is successful, the message displayed in Figure 10.8 is displayed. Select <Accept> to return to the Dicon Server Management screen. Select <Accept> again to save the entered value.
8. When the information has been saved in the database, the System Setup screen is displayed with the summary information for the servers as illustrated in Figure 10.9.

119
Figure 10.9. System Setup Screen with Server Information.
9. Repeat steps 4 – 7 to add the c-store provider and any additional servers. A screen similar to the following is displayed containing multiple servers in the list.
Figure 10.10. System Setup Screen with all Selected Servers Displayed.
10. To make changes to any of the configured servers, select the row from the list, select <Edit>, or select <Delete>.
• <Edit> displays the DICOM Server Management screen allow the user to edit the existing values.
• <Delete> prompts the user with a confirmation message to delete the item.
11. When all changes have been made, select <Accept> to save the information to the database. The following message is displayed:

120
Figure 10.11. System Setup Screen with Update Message Displayed.
Add Patient from Worklist Server and Create a Study
The following procedure details the steps to be taken to access the patient worklist for a thyroid uptake operation.
Procedure to Add Patient from Worklist:
1. Select the <Home> screen from the Atomlab main menu. Select <Testing>. Select <Thyroid Uptake>. The existing list of patients in the Atomlab 960 software is displayed.
2. To add a patient from the worklist, select <Add From Worklist>.
NOTE: Patients added not using the Add from Worklist function cannot be sent to DICOM. Only patients added through DICOM may have the uptake test results sent to DICOM.
Figure 10.12. Select or Add a Patient Screen.

121
3. The Worklist Patient Search screen is displayed. The screen has several filter options. Apply the necessary filter, if required. To search from a worklist, select <Search>. The list of patients is displayed.
• Name – Enter the patient’s name to filter by patient name. • Procedure Date – The user can select either a specific date or any date. By default, the
current system date is selected (i.e., today’s date). • Worklist Provider – The drop-down menu, provides a means to select the worklist
provider. If multiple worklist providers are configured, one can be selected from the drop-down menu.
• Accession Number – All the user to filter the patient list by the Accession number.
NOTE: A specific procedure date or any date and one of the other search options must be selected before selecting <Accept>.
Figure 10.13. Worklist Patient Search Screen.
4. Select the desired patient from the patient list and select <Accept>.
Figure 10.14. Worklist Patient Screen with Patient Selected.

122
5. The system prompts the user to select the study type for the Thyroid Uptake procedure. Select the study type by clicking on the desired procedure to highlight it and select <Accept>.
NOTE: Selecting <Cancel> on the Add Study screen displays the Worklist screen and no patient/study is added to the database. The cycle must be completed (i.e., a patient must be added from the worklist and a study must be added for that patient and procedure) to be added to the database.
Figure 10.15. Add Study Screen.
6. When a study is created, the system will display the message displayed below. Select <Accept> to return to the Select or Add a Patient screen.
Figure 10.16. Worklist Patient Screen Displaying New Study Added Message.
7. At this point, the patient has been downloaded and is ready for the thyroid uptake procedure.
8. Refer to the Atomlab 960 user manual to perform a thyroid uptake procedure.

123
Send Uptake Report to Storage Server
NOTE: Only the test results for patients downloaded from the worklist can be sent back to the DICOM system with the thyroid uptake report. Patient test results created locally cannot be uploaded to the DICOM system.
Procedure:
1. Access the Atomlab 960 Home screen. Select <Testing>. Select <Thyroid Uptake>. A list of the existing patients stored in the database is displayed.
2. Select and highlight the patient from the displayed list. Any patient downloaded from the worklist is marked as 'Yes' in the From DICOM column. This helps to identify the patients that were created locally versus the downloaded from DICOM patients. Select <Next>.
Figure 10.17. Select or Add a Patient Screen with Selected Patient Highlighted.
3. Select and highlight a study to be uploaded to the DICOM system. Select <DICOM Report>.
Figure 10.18. Study Selection Screen with Desired Study Highlighted.

124
4. Select the DICOM Server to which the results are to be loaded. If more than one storage server is configured, select the desired server from the drop-down menu. Select the type of report to be uploaded; a Detail Uptake report or a Time Activity report. Select <Accept>. A preview of the thyroid uptake report is displayed in DICOM format.
Figure 10.19. Study Selection Screen with Thyroid Uptake Report Selected.
5. Confirm the report on the DICOM Report preview. Select <Send to DICOM>.
Figure 10.20. DICOM Report Preview Screen.
6. When uploaded, the system displays a confirmation message. If any error occurs, a message is displayed stating the problem.

125
FAQ
DICOM not Activated:
If <Accept> is pressed before selecting <Activate DICOM> upon entering the key value on the screen, the system will display the following error message:
Figure 10.21. System Setup Screen with Not Activated Message Displayed.
To correct the error, select <Cancel> to close the error message screen. Select <Activate DICOM>. This causes the DICOM Activated to be displayed. Select <Accept> to finish the licensing process.
Figure 10.22. System Setup Screen with Manage DICOM License Information Displayed.

126
Will a New Patient be Created Each Time a Download is Performed from the Worklist?
No. The same patient can be downloaded several times. However, patient information is added only once to the database. Once the information is added, even with multiple downloads from the worklist, it will not create a new entry for the same patient each time.
Deleting a Patient from the System will Delete DICOM Patient?
No. If any patient is deleted from the Atomlab 960 software, it will only delete the information from the Atomlab database and NOT from DICOM system. Once the patient is deleted from the Atomlab 960 software, it will delete all the associated study/test results of that patient in the system.
How to Add Another Study for the Same (Worklist) Patient
If it is needed to add another study for the same patient downloaded from Worklist to Atomlab 960, follow the steps shown below. This is the same procedure used previously to add a patient from the Worklist.
1. From the Home screen, select <Testing>, select <Thyroid Uptake>. 2. Select <Add From Worklist> button. The Worklist Patient Search screen is displayed. 3. From the Worklist Patient Search screen, select <Search> to search the same
patient from the Worklist. 4. Select the Patient and select <Accept>. 5. The system will provide the option for the new study. Select the
appropriate study. Select <Accept>. 6. Once the study is created and saved to the database, a message is displayed to notify
the user. Select <Accept>. 7. The system returns to the Select or Add Patient screen. Select the Patient and
select <Next>. 8. The Study Selection screen is displayed with the new study along with any previous
study.
NOTE: The study that was created to upload to DICOM, can be identified under the column heading “From DICOM” of the patient list. Those study/ studies only can be uploaded/ sent to the DICOM system. Any study created with <Add Study> from the Study Selection screen will not allow sending it to DICOM. To send/ upload to the DICOM system, follow the procedure mentioned in the “Send Uptake Report to Storage Server” section of this document.

127
Figure 10.23. Study Selection Screen.
Nothing is Displayed on the Worklist Patient Search
NOTE: Check the DICOM settings/configuration first.
1. Access <Utilities>, <System Setup>, <DICOM>.
2. Check for all server configurations/connections. The settings can be confirmed by selecting any row, clicking on <Edit> and clicking on <Test Server>. It will inform the user about the connection status.
3. Check the value in the Modality Filter. If it is set to an incorrect value, the patient list is filtered accordingly.
4. Check the Search filter option on the Worklist Patient Search screen. Ensure the name, procedure date, worklist provider, and accession numbers are all set accordingly.

128
11. Reports Both Administrative and Clinical reports can be printed using the Reports Mode. Clinical Reports allow the user to print Thyroid Uptake and Manual Mode Reports.
Administrative Reports
Administrative Reports contain four different reports that consist of the following functions
• QA • Staff List • Wipe (includes wipe test results) • Isotope List (includes the information for each specific isotope by detector)
Figure 11.1. Reports Screen.
Figure 11.2. Administration Reports Screen.

129
QA Reports
QA Reports offer several sub-reports for printing including Daily Calibration/Constancy, High-Voltage, Chi-Square, MDA, and Background.
Figure 11.3. The Q/A Reports Screen.
Print QA Reports Daily Calibration/Constancy
1. Access reports, select Administrative Reports, and select QA. Select <Daily Calibrations/Constancy> within QA Reports.
2. The Date Range screen is displayed. Select the <from> date using the arrows to adjust the date. Select <Accept> to return to the Date Range screen. Select the <to> date using the arrow keys to adjust the ending date to be viewed/printed on the report. When the date range has been selected, touch <Accept>.
3. The report is displayed on the screen. The image size can be adjusted using the <�> or <�> keys. Select <Printer> and <OK> to print the report.
4. Select <Back> to return to the QA Reports screen.
NOTE: The Calibration Spectrum report can be printed from the QA Mode by selecting <Calibration History> or <Cal/Constancy History>.
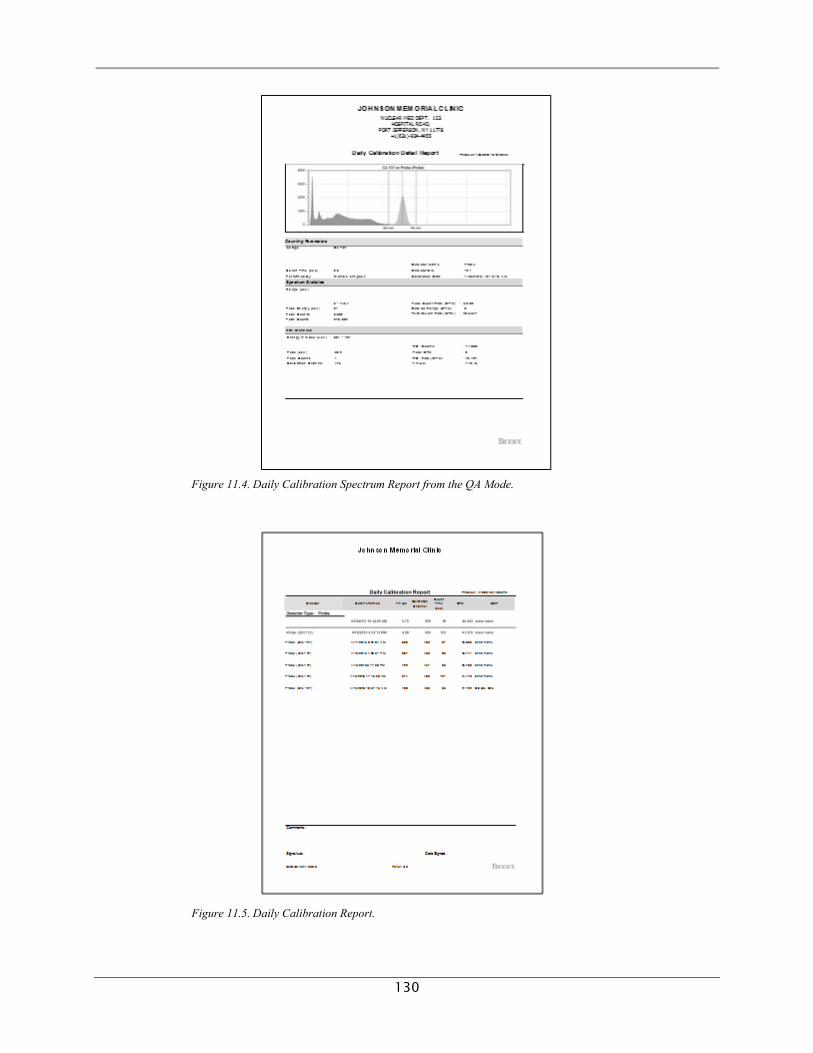
130
Figure 11.4. Daily Calibration Spectrum Report from the QA Mode.
Figure 11.5. Daily Calibration Report.

131
Figure 11.6. Constancy Report.

132
Printing High Voltage Reports
1. Select <Reports> from the Home screen. Select <Administrative>. Select <QA>. Select <High Voltage>. The Date Range screen is displayed.
2. Select <From> to set the starting date for the reports and <To> to select the ending dates for the reports. Use the arrows to adjust the date.
3. When the date range has been selected, touch <Accept> to display the High Voltage Report information.
4. Select <Printer> to print the report.
5. Select <Back> to return and redisplay the QA Reports screen.
NOTE: To print a High Voltage Report, access QA Mode and select <High Voltage History>.
Figure 11.7. High Voltage Report

133
Print Chi-Square Reports
1. Select <Reports> from the Home screen. Select <Administrative>. Select <QA>. Select <Chi-Square>. The Date Range screen is displayed.
2. Select <From> to set the starting date for the reports and <To> to select the ending dates for the reports. Use the arrows to adjust the date. Select <Accept>. To include the measurements illustrating the details for each Chi-Square report, check the <Include Measurements> box.
NOTE: If the <Include Measurements> box is not checked, the report will display only the date and the Chi-Square results. It will not display the individual counts used in the Chi-Square Calculation.
3. When the date range has been selected, touch <Accept> to display the Report.
4. Select <Printer> to print/view the report.
5. Select <Back> to return and redisplay the QA Reports screen.
Figure 11.8. Chi-Square Summary Report.
NOTE: The Chi-Square Summary report and the Chi-Square Detail report can be viewed and printed from the <Chi-Square History> button in the QA Mode.
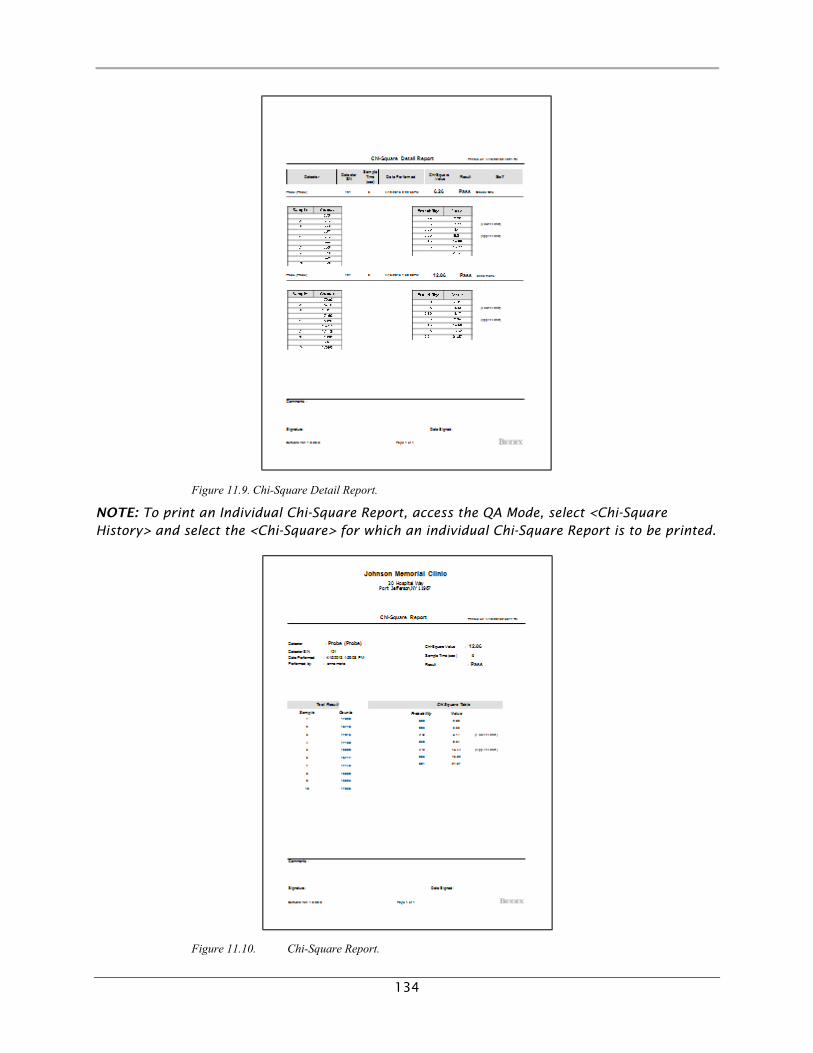
134
Figure 11.9. Chi-Square Detail Report.
NOTE: To print an Individual Chi-Square Report, access the QA Mode, select <Chi-Square History> and select the <Chi-Square> for which an individual Chi-Square Report is to be printed.
Figure 11.10. Chi-Square Report.

135
Print MDA Reports
1. Select <MDA> from the QA Report screen.
2. Select the detector for which the MDA is to be displayed. Select <Accept>.
3. The report is displayed. Select <Printer> to print the report.
Figure 11.11. MDA Report for the Probe.
NOTE: To print an MDA Report, access the QA Mode, select <MDA History>.

136
Figure 11.12. MDA Detail Report
Figure 11.13. MDA Summary Report.

137
Figure 11.14. MDA Report for the Well.

138
Print Spectrum Analysis Reports
While in Spectrum Analysis, a spectrum can be printed with the selected standard ROI or ROIs. The Spectrum displayed is for the last item counted.
NOTE: An analysis is available after any performed count. The spectrum analysis must be performed before selecting <Save>.
Figure 11.15. Spectrum Analysis Report.

139
Print Staff List
1. Select the <printer> icon to print.
2. To print a Staff List from the Home screen, select <Reports>. Select <Administrative>. Select <Staff List>. The list of staff members is displayed.
3. Select the <printer> icon to view the report.
Figure 11.16. Staff Member List.

140
Print Wipe Reports
Three types of reports can be viewed and/or printed from this screen.
Figure 11.17. Report Wipe Type Selection Screen.
1. Select <Reports> to view a report. Select the type of Wipe Test report to be viewed or printed. Select from the following:
Icon Purpose <Single Detail> Allows the user to select a single wipe and view and/or print the
results for that wipe. <Summary History> Allows the user to select the <Area Type> or <Date Range> and create
a Wipe Test Summary Report along with the overall status of the selected options.
<Detail History> Allows the user to select the <Area Type> or <Date Range> and create a Wipe Test Detail Report. The Wipe Test Detail report displays all of the isotopes in each wipe for the selected options.
2. Select <Back> twice to return to the Wipe History screen from any of the reports.

141
Figure 11.18. Single Detail Wipe Report.

142
Figure 11.19. Wipe Test Summary History Report.

143
Figure 11.20. Wipe Test Detail History Report.

144
Print Isotope List
1. Select <Reports> to print the Isotope List from the Home screen. Select <Administrative>. Select <Isotope List>. Select the detector for which the list is to be displayed. Select <a copy>. The list of isotopes is displayed containing the isotope name, gain, ROI (in KeV), half life, efficiency, regulatory level, and if available for use with the specified detector.
2. Select the <Printer> icon to print.
3. Select <Back> to return to the Administrative Reports screen.
Figure 11.21. Isotope List Report.

145
Clinical Reports
Clinical Reports consist of the following functions:
• Thyroid Uptake Reports • Manual Mode
Figure 11.22. Clinical Reports Menu.
Print Thyroid Uptake Reports
1. Select <Reports> from the Home screen. Select <Clinical>. Select <Thyroid Uptake>. The List of Patients is displayed.
2. Highlight the patient for whom the report is to be printed and select <Next>. The Thyroid Studies for the patient is displayed.
3. Highlight the study to be printed. Select <Reports>.
4. Select the type of report to be printed: <Detailed> Uptake report or a <Time Activity> report.
5. Select <Accept>.
6. The report is displayed. To print the report, select <printer>.
7. Select <Back> to return to the Study Selection screen. Select <Back> a second time to return to the Select a Patient screen.
8. Select <Back> to return to the Clinical Reports screen.

146
Figure 11.23. Uptake Report.
Figure 11.24. Uptake Report-Time Activity.
NOTE: The Uptake reports can also be printed from the Thyroid Uptake Mode by selecting the patient for which the report is to be printed and selecting <Next>. Highlight the study for the patient and select <Reports>. Select the type of test and select <Accept>. The report is displayed and can be printed by selecting <Printer>.

147
Print Manual Mode Reports
1. Select <Manual Mode> from the Clinical Reports screen. Select <Manual Mode>. The Date Range screen is displayed.
2. Select <from> to set the starting date for the reports and <to> to select the ending dates for the reports. Use the arrows to adjust the date. Select <Accept>.
3. When the date range has been selected, touch <Accept>. 4. Select <Detector> for which the report is to be viewed/printed. 5. Select <Accept>. 6. The report is displayed Touch <Printer> to print the report 7. Select <Back> to return and redisplay the Clinical Reports screen.
Figure 11.25. Manual Mode Report

148
Print Bioassay Reports
1. Select <Reports> from the Clinical Reports screen. Select <Clinical>. Select <Bioassay>. 2. Select from the following:
Icon Purpose <Single Detail> Allows the user to select a single Bioassay and view and/or print the
results for that Bioassay. <Summary History> Allows the user to select the <Staff Type>, <Staff Name> and <Date
Range> and create a Bioassay Test Summary Report along with the overall status of the selected options.
<Detail History> Allows the user to select the <Staff Type>, <Specific Staff Name>, and <Date Range> and create a Bioassay Test Detail Report. The Bioassay Test Detail report displays all of the Bioassay tests for the person in the selected date range.
3. Select the type of Bioassay report and the parameters by which the report is to be printed.
Select <Accept>. 4. The report is displayed. Select <Printer> to print the report. 5. Select <Back> twice to return to the Bioassay screen. 6. Select <Back> to return to the Clinical Reports screen.

149
Figure 11.26. Single Detail Test Report

150
Figure 11.27. Individual Detail History Report.

151
Figure 11.28. Bioassay Summary History Report.

152
12. Spectrum Analysis Spectrum Analysis is available throughout the system after a measurement is performed. Spectrum Analysis allows the user to analyze the Isotope Spectrum counted by setting various Regions of Interest. The user can determine contaminates in the spectrum by analyzing the spectrum and determining the energy of an unknown peak.
Figure 12.1. The Spectrum Analysis Screen.
1. Spectrum Analysis is available following any measurement performed with the system. Select the <Analysis> icon located on the bottom of the counting screen when the count is complete. This opens the Spectrum Analysis screen.
2. The Spectrum from the count just performed is shown with the spectrum data. The Spectrum Analysis screen shows the Region of Interest (ROI) for the isotope counted under the spectrum. The preset ROI window is displayed along the bottom of the spectrum. The detector and isotope used is displayed above the spectrum. The box at the lower left shows details for the spectrum. The <left> button controls the left ROI cursor. The <right> button controls the right ROI cursor. The <data> cursor is a single channel that can be set or when in the ROI it moves the cursor to the peak within the ROI when the <!> and <"> arrows are touched. These three cursors display the channel number, energy in KeV, and the counts for the specific channel.
3. To move any ROI cursor, select the <left>, <data> or <right> cursor and select the spectrum screen where the cursor is to be placed.
4. Use the left arrow <!!> or right arrow <""> above the cursor names to move the highlighted left, data or right cursor in the appropriate direction. Selecting the double arrow <!!!!> left moves the cursor 16 channels to the left. Using the double arrow right <""""> moves the selected cursor 16 channels to the right. The up <##> arrow will find the peak for the data channel in the ROI. The <data> channel can also be set on any single channel. The counts in the ROI are displayed on the right side of the screen as counts and also displayed as cpm.
5. The center box under the spectrum is used to select an ROI from the preset isotopes. This box contains up <##>, down arrow <$$> and an <isotope> button. The <isotope> button displays the isotope list allowing the user to select an isotope to be used to display the ROI. To save a displayed ROI, press the <save ROI> button. To move up/down one isotope at a
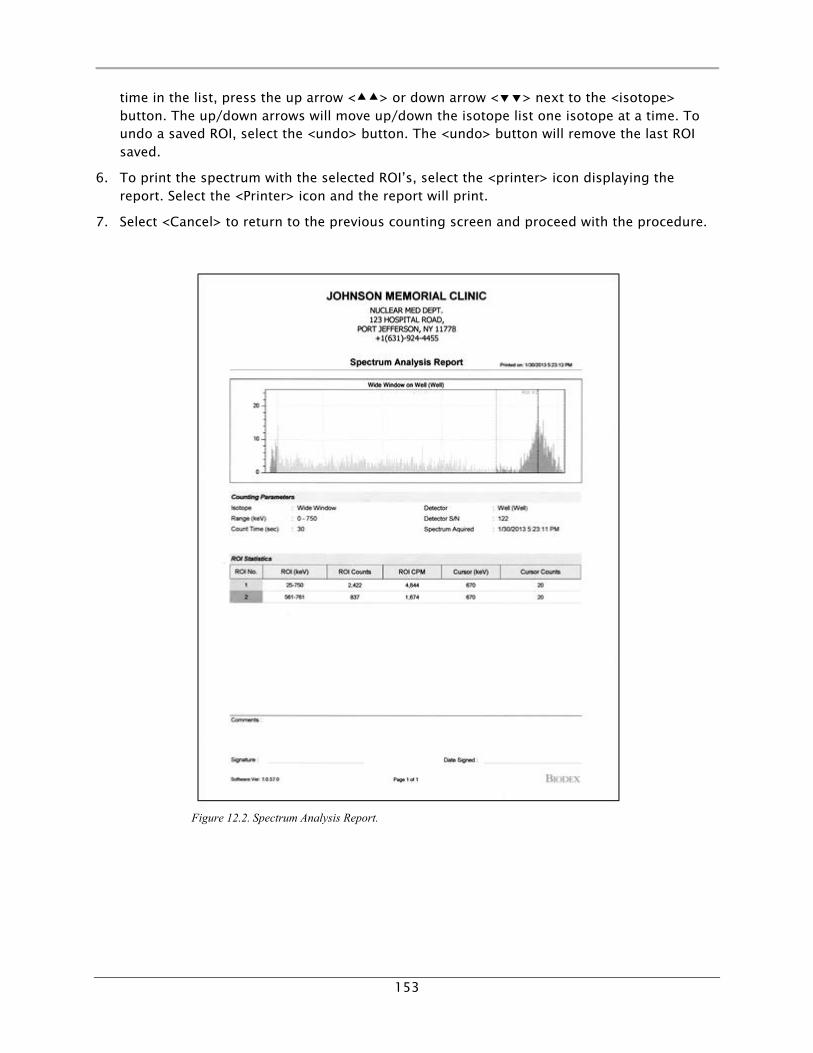
153
time in the list, press the up arrow <��> or down arrow <��> next to the <isotope> button. The up/down arrows will move up/down the isotope list one isotope at a time. To undo a saved ROI, select the <undo> button. The <undo> button will remove the last ROI saved.
6. To print the spectrum with the selected ROI’s, select the <printer> icon displaying the report. Select the <Printer> icon and the report will print.
7. Select <Cancel> to return to the previous counting screen and proceed with the procedure.
Figure 12.2. Spectrum Analysis Report.

154
13. Maintenance and Safety Inspection General Cleaning Instructions
As required, wipe down the exterior of the unit using a soft cloth slightly dampened with alcohol. Use neutral detergent or isopropyl alcohol on a clean soft cloth to clean the panel surface. Do not use any kind of chemical solvent, acidic, or alkali solution.
Maintaining the Printer
Follow the instructions in the printer manual.
If replacement ink cartridges cannot be found, contact either Biodex Support or a Biodex distributor.
Disposal
An appropriate waste disposal company is to be contacted (i.e., the local collection point for waste separation). Properly dispose of the device at the end of its service life:
• The device packaging is disposed of through resource recycling. • The metal parts of the machine go to scrap metal disposal. • Plastic parts are disposed of as hazardous waste.
The disposal of equipment must be in accordance with the respective national regulations.
Wear parts are considered hazardous waste! After being replaced, wear parts must be disposed of according to country-specific waste laws.

155
14. Specifications
MEDICAL SPECTROMETER HARDWARE
Computer:
Flat Panel PC, Windows® 7 Embedded platform, Intel Celeron Processor, 2 GB RAM, 40 GB SSD.
15.6" Color Touchscreen Monitor, HP Printer, Wifi, Ethernet and built-in speakers.
Multi-Channel Analyzer
Channels: 1024
Inputs: Probe and well
Spectral Resolution: FWHM 8%
Count Rate: (Maximum) 150,000 cps for Tc-99m
Count Rate Stability: 99%
Gross Count Rate Linearity: Within 5% up to 150,000 cps
Pulse Height Linearity: Within 2% (independent of detector)
Detector High Voltage Adjustment: Automatic H.V. adjustment for both, probe and
well; uses 10 µCi Cs-137 as the calibration source.
MEDICAL SPECTROMETER SOFTWARE
RADIONUCLIDES:
Factory Programmed: Au-198, Ba-133, Ba-133(well), Co-57, Co-57(w), Co-58 (w), Co-60, Cr-51,
Cs-137, Fe-59, F-18, Ga-67, Hg 197, I-123, I-125, I-131, In-111, Ir-192, K-42, Na-24, Pd-103, Se-
75, Sr-85, Tc-99m, Tc-99m (w), Tc-99m/Tl-201, TI-201, Yb-169, Wide window, Lu-177, and Ra-
223.
User Set: Unlimited user defined isotopes, setting ROI, half life, name, efficiency and range.
OTHER HARDWARE:
Probe: 2" x 2" Nal (Tl) integral line scintillation detector
UPTAKE STAND:
Maximum Height: 60" (152.4 cm)
Maximum Length: Arm Extended: 61" (154.9 cm)
Collimated Shield: Flat field collimator meeting IAEA specifications
Positioning: Distance bar and positioning light
Arm: Counterbalanced, two section arm, moves 24.5" (62.2 cm) vertically and extends 31"
(78.7 cm) horizontally from stand's vertical column.
Casters: 4" Total locking
Weight: 280 lb (127 kg)
Combined weight with Well Counter: 330 lb (150 kg)
Warranty: Two year parts and labor

156
Optional:
187-602 Well Counter:
Detector: 2" x 2" Nal (Tl) integral line scintillation detector with a.75" diameter x 1.44" deep
well (1.9 x 3.7 cm)
Lead Shielding: 1" thick (2.5 cm)
Cover: .125" thick (.32 cm)
Weight: 50 lb (22.7 kg)
187-603 Lead Shield, Well Counter
Lead Shielding: 1" thick (5 cm)
Weight: 69 lb (31.4 kg)
Power: Low voltage transformer with hospital grade power cord and plug.
Line Voltage:
120 VAC, 60 Hz, 2 AMP circuit breaker
230 VAC, 50 Hz, 1 AMP circuit breaker
Certification:
• ANSI/AAMI ES60601-1:2005+A1:2012+C1:2009+A2:2010 • CAN/CSA C22.2 No. 60601-1:14 • IEC 60601-1:2012 • CE Marked. • FDA Class II Equipment
! Type B Applied Part
Atomlab Line Cord:
The line cord for the Atomlab 960 is non-detachable. If it should become damaged, a
qualified service technician should be called to repair or replace it.
The following describes the procedure for replacing the line cord on the AL960.
1. Unplug the Atomlab 960 line cord from the wall receptacle.
2. Remove the transformer cover plate.
3. Remove the earth ground from the chassis ground stud.
4. Remove the line and neutral conductors from the line side of the circuit breaker.
5. Loosen the gland nut on the heyco strain relief located where the line cord enters
the Atomlab 960 cart.
6. Carefully pull the old line cord out of the transformer compartment and through the
heyco in the Atomlab 960 chassis.
7. Reverse the order of these instructions and reassemble with new power cord.