Embed Size (px)
Citation preview

Estimating emissions from Oil and Natural Gas production using
Aircraft Observations NOAA/CIRES
Colm Sweeney , Gaby Pétron, Anna Karion, Lori Bruhwiler, Greg Frost, Michael Trainer, Ben Miller, Steve Montzka, Jon Kofler, Pat Lang, Ed
Dlugokencky, Mike Hardesty, Alan Brewer, Arlyn Andrews, Carolina Siso, Molly Heller, Eric Moglia, Dan Wolfe, Pieter Tans and Russ Schnell
Scientific Aviation Steve Conley
Picarro Eric Crosson, Chris Rella, Tracy Tsai
Aerodyne Scott Herndon, Tara Yacovitch

US Natural Gas Production US Energy Information Administration (EIA)
2005 Started shale gas boom

US Energy Strategy
Climate Air Quality Foreign Policy
Reserves/ Storage Cost
Natural Gas
Oil
Coal
Natural gas is portrayed in the US as a bridge fuel towards a more sustainable energy system
Is natural gas really a benefit to the climate?
Years until climate benefit is achieved Perc
ent n
atur
al g
as le
akag
e
0.0
2.0
4.0
6.0 <1.8% Gasoline Car Heavy-duty vehicle Coal Power plant
<1.0% <3.1%
Alvarez et al. 2013
With only 3.1% leakage from well to power plant we will see immediate benefit of switching to electric power. Time
Leak rate:
CH4 CO2 112
72
25
0 20 100 500
7.1 GW
P

So what are the CH4 emissions from natural gas in the US?
Production Transmission Distribution
EPA Inventory For 2008
0
1
2
3
1 2 3
% C
H4 L
eak
rate
Report
DistributionTransmissionProcessingProduction2013 2011 2010
EPA has changed their methodology for estimating production emissions twice in the last three years
2008 emissions
0
5
10
15
2004 2009
Tg C
H4/
yr
Year
2010 Report 2011 Report 2013 Report

Lower Production emissions? Top down measurement
Katzenstein et al. 2003: Used surface concentrations of CH4 Texas, Oklahoma, and Kansas to suggest that EPA estimates were too low.
Petron et al. 2012: Used the measured atmospheric propane-to-methane enhancement ratios observed at the BAO tall tower and at the surface across the Front Range to evaluate the proportion of flashing and venting emissions.
Bottom-up Emissions Top-Down BAO/ Mobile Lab Emissions

Aircraft Mass Balance Method
∫ ∫+
−
∆=
b
b
z
zairCHCH dxdznXVn
PBL
gnd
44cosθ
Perpendicular wind speed
mixing height (PBL)
Wind
emissions
Wind
Background CH4
Downwind CH4
CH4 flux Molar CH4 enhancement in PB

Not just CH4 in Aircraft
Aircraft: Continuous - CH4 - H2O - Temp - Winds
HRDL: - PBL - Wind profiles
Mobile ground: Continuous - CH4 - CO2 - CO - H2O - Temp - Winds - C-13 - Ethane Flask - 55 species
Mass balance Attribution/History Tower: Continuous - CH4 - CO2 - CO - H2O - Temp - Winds Flask - 55 species
Aircraft: Continuous - CH4 - CO2 - CO - H2O - Temp - Winds - Ethane Flask - 55 species
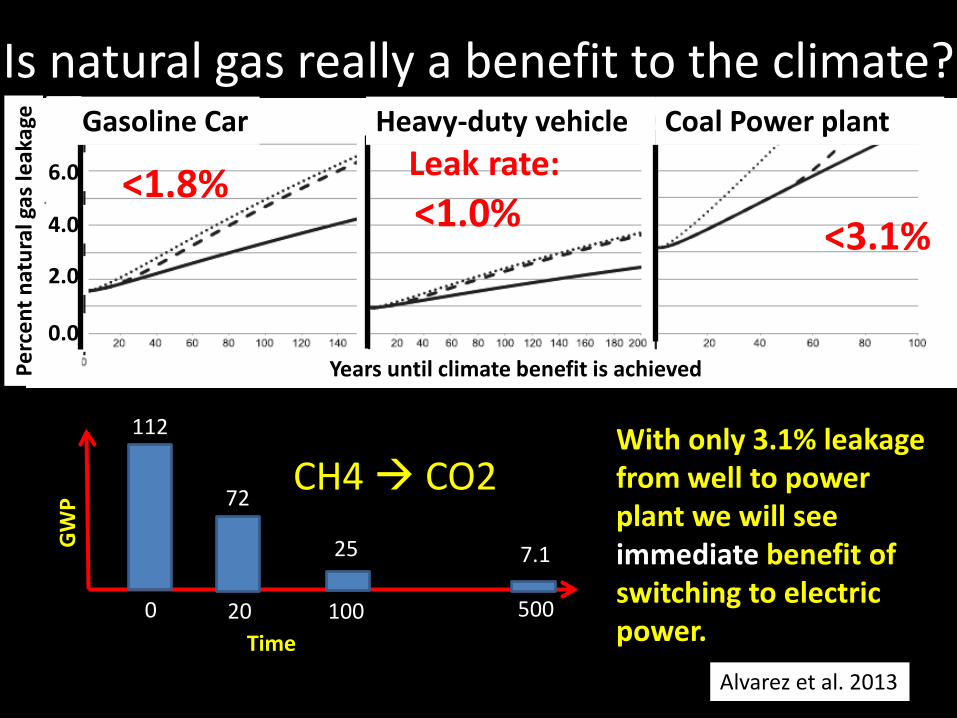
Green River Basin, WY: high winter time surface ozone in natural gas field (Schnell et al., Nature, 2009)
Uinta Basin, UT: Jan/Feb 2012 winter-time study of surface ozone and its precursors - Feb. 2012 - Feb. 2013
Denver Julesberg, CO: Hydrocarbon emissions from oil and gas operations in 2008 in Weld County (Pétron et al., 2012) - May 2012
Past and Ongoing Studies in Western US Oil and Gas Fields
9
Barnett Shale, TX: Second largest shale gas field in the US. - March 2013

Utah, 2012
Distance perpendicular to wind (km) CH
4 (pp
b)
downwind
upwind
Ki
t
l i
Karion et al. in prep
HRDL

Uncertainty
Parameter Mean Value Variability (1σ) Relative Uncertainty
wind speed (V) 5.2 m/s 1.2 m/s 24%
wind direction 55.2° 10.1°
Vcosθ 3.8 m/s 0.7 m/s 24%
∆XCH4 56.3 ppb 5.6 ppb 10%
BL depth 1700 m 125 m 7%
CH4 Flux 56000 kg/hr 15000 kg/hr 28%

Inventory v. Top down
0
2
4
6
8
10
% L
eak
Rate
State InventoryTop down
US EPA 2013
Ground C3H8/CH4
Aircraft Mass Balance
Aircraft Mass Balance

0.3
0.2 2.9
0.3
0.1
0.8
0.3
0.0
0.0
0.0
0.0
0.0
0.0
0.0
11.7
0.3
0.2
0.1
2.1
0.1 0.0 23 wells (CH4 enhancements ppm): No enhancements = 8 Small enhancements = 9 Large enhancements = 5
0.8
23 wells visited in Dish, TX all owned by the same company and built around the same time (by the same engineer) suggest that the inventory method which assumes that these well all have the same emissions will get it wrong.
Data provided by Eric Crosson, Picarro
Can inventories work?
[Activity data] X [emissions factor ] = flux

Conclusions
– Mass balance estimates in UT and CO suggest that inventories underestimate leakage rates.
– Ground measurement suggest that the inventories can not account for variability in emissions that exist in a typical oil and gas field.