Embed Size (px)
Citation preview

arX
iv:1
607.
0023
3v2
[as
tro-
ph.H
E]
2 S
ep 2
016
Draft version September 18, 2018Preprint typeset using LATEX style AASTeX6 v. 1.0
CALET UPPER LIMITS ON X-RAY AND GAMMA-RAY COUNTERPARTS OF GW 151226 a
O. Adriani1,40,41, Y. Akaike2,3, K. Asano4, Y. Asaoka5,6, M.G. Bagliesi7,40, G. Bigongiari7,40, W.R. Binns8,S. Bonechi7,40, M. Bongi1,40,41, P. Brogi7,40, J.H. Buckley8, N. Cannady9, G. Castellini1,40,41, C. Checchia10,
M.L. Cherry9, G. Collazuol10, V. Di Felice11,40, K. Ebisawa12, H. Fuke12, T.G. Guzik9, T. Hams13,3,M. Hareyama14, N. Hasebe6, K. Hibino15, M. Ichimura16, K. Ioka17, W. Ishizaki4, M.H. Israel8, A. Javaid9,K. Kasahara6, J. Kataoka6, R. Kataoka18, Y. Katayose19, C. Kato20, N. Kawanaka21, Y. Kawakubo22,H. Kitamura23, H.S. Krawczynski8, J.F. Krizmanic2,3, S. Kuramata16, T. Lomtadze24, P. Maestro7,40,
P.S. Marrocchesi7,40, A.M. Messineo24, J.W. Mitchell25, S. Miyake26, K. Mizutani27, A.A. Moiseev38,3, K. Mori6,12,M. Mori28, N. Mori1,40,41, H.M. Motz39, K. Munakata20, H. Murakami6, Y.E. Nakagawa12, S. Nakahira5,
J. Nishimura12, S. Okuno15, J.F. Ormes29, S. Ozawa6, L. Pacini1,40,41, F. Palma11,40, P. Papini1,40,41,A.V. Penacchioni7, 37, B.F. Rauch8, S. Ricciarini1,40,41, K. Sakai13,3, T. Sakamoto22, M. Sasaki38,3, Y. Shimizu15,A. Shiomi30, R. Sparvoli11,40, P. Spillantini1,40,41, F. Stolzi7,40, I. Takahashi31, M. Takayanagi12, M. Takita4,
T. Tamura15, N. Tateyama15, T. Terasawa32, H. Tomida12, S. Torii5,6, Y. Tsunesada33, Y. Uchihori23, S. Ueno12,E. Vannuccini1,40,41, J.P. Wefel9, K. Yamaoka34, S. Yanagita35, A. Yoshida22, K. Yoshida36, and T. Yuda4
1University of Florence, Via Sansone, 1 - 50019 Sesto, Fiorentino, Italy2Universities Space Research Association, 7178 Columbia Gateway Drive Columbia, MD 21046, USA.
3CRESST and Astroparticle Physics Laboratory NASA/GSFC, Greenbelt, MD 20771, USA4Institute for Cosmic Ray Research, The University of Tokyo, 5-1-5 Kashiwa-no-Ha, Kashiwa, Chiba 277-8582, Japan
5JEM Mission Operations and Integration Center, Human Spaceflight Technology Directorate, Japan Aerospace Exploration Agency,
2-1-1 Sengen, Tsukuba, Ibaraki 305-8505, Japan6Research Institute for Science and Engineering, Waseda University, 3-4-1 Okubo, Shinjuku, Tokyo 169-8555, Japan
7University of Siena, Rettorato, via Banchi di Sotto 55, 53100 Siena, Italy8Department of Physics,Washington University, One Brookings Drive, St. Louis, MO 63130-4899, USA
9Department of Physics and Astronomy, Louisiana State University, 202 Nicholson Hall, Baton Rouge, LA 70803, USA10Department of Physics and Astronomy, University of Padova, Via Marzolo, 8, 35131 Padova, Italy
11University of Rome Tor Vergata, Via della Ricerca Scientifica 1, 00133 Rome, Italy12Institute of Space and Astronautical Science, Japan Aerospace Exploration Agency, 3-1-1 Yoshinodai, Chuo, Sagamihara, Kanagawa
252-5210, Japan13Department of Physics, University of Maryland, Baltimore County, 1000 Hilltop Circle, Baltimore, MD 21250, USA
14St. Marianna University School of Medicine, 2-16-1, Sugao, Miyamae-ku, Kawasaki, Kanagawa 216-8511, Japan15Kanagawa University, 3-27-1 Rokkakubashi, Kanagawa, Yokohama, Kanagawa 221-8686, Japan
16Faculty of Science and Technology, Graduate School of Science and Technology, Hirosaki University, 3, Bunkyo, Hirosaki, Aomori
036-8561, Japan
17Yukawa Institute for Theoretical Physics, Kyoto University, Kitashirakawa Oiwakecho, Sakyo, Kyoto 606-8502, Japan18National Institute of Polar Research, 10-3, Midori-cho, Tachikawa, Tokyo 190-8518, Japan
19Faculty of Engineering, Division of Intelligent Systems Engineering, Yokohama National University, 79-5 Tokiwadai, Hodogaya,
Yokohama 240-8501, Japan20Faculty of Science, Shinshu University, 3-1-1 Asahi, Matsumoto, Nagano 390-8621, Japan21School of Science, The University of Tokyo, 7-3-1 Hongo, Bunkyo, Tokyo 113-003, Japan
22College of Science and Engineering, Department of Physics and Mathematics, Aoyama Gakuin University, 5-10-1 Fuchinobe, Chuo,
Sagamihara, Kanagawa 252-5258, Japan23National Institute of Radiological Sciences, 4-9-1 Anagawa, Inage, Chiba 263-8555, Japan
24University of Pisa and INFN, Italy25Astroparticle Physics Laboratory, NASA/GSFC, Greenbelt, MD 20771, USA
26Department of Electrical and Electronic Systems Engineering, National Institute of Technology, Ibaraki College, 866 Nakane,
Hitachinaka, Ibaraki 312-8508 Japan27Saitama University, Shimo-Okubo 255, Sakura, Saitama, 338-8570, Japan
28Department of Physical Sciences, College of Science and Engineering, Ritsumeikan University, Shiga 525-8577, Japan29Department of Physics and Astronomy, University of Denver, Physics Building, Room 211, 2112 East Wesley Ave., Denver, CO
80208-6900, USA30College of Industrial Technology, Nihon University, 1-2-1 Izumi, Narashino, Chiba 275-8575, Japan
31Kavli Institute for the Physics and Mathematics of the Universe, The University of Tokyo, 5-1-5 Kashiwanoha, Kashiwa, 277-8583,
Japan32RIKEN, 2-1 Hirosawa, Wako, Saitama 351-0198, Japan
33Division of Mathematics and Physics, Graduate School of Science, Osaka City University, 3-3-138 Sugimoto, Sumiyoshi, Osaka
558-8585, Japan34Nagoya University, Furo, Chikusa, Nagoya 464-8601, Japan
a Corresponding authors: T. Sakamoto, S. Nakahira and Y. Asaoka

2
35Graduate School of Science and Engineering, Ibaraki University, 2-1-1 Bunkyo, Mito, Ibaraki 310-8512, Japan36Department of Electronic Information Systems, Shibaura Institute of Technology, 307 Fukasaku, Minuma, Saitama 337-8570, Japan
37ASI Science Data Center (ASDC), Via del Politecnico snc, 00133 Rome, Italy38Department of Astronomy, University of Maryland, College Park, Maryland 20742, USA
39International Center for Science and Engineering Programs, Waseda University, 3-4-1 Okubo, Shinjuku, Tokyo 169-8555, Japan40National Institute for Nuclear Physics (INFN), Piazza dei Caprettari, 70 - 00186 Rome, Italy
41Institute of Applied Physics (IFAC), National Research Council (CNR), Via Madonna del Piano, 10, 50019 Sesto, Fiorentino, Italy
ABSTRACT
We present upper limits in the hard X-ray and gamma-ray bands at the time of the LIGO gravitational-wave event GW 151226 derived from the CALorimetric Electron Telescope (CALET) observation. The
main instrument of CALET, CALorimeter (CAL), observes gamma-rays from ∼1 GeV up to 10 TeV
with a field of view of ∼2 sr. The CALET gamma-ray burst monitor (CGBM) views ∼3 sr and
∼2π sr of the sky in the 7 keV - 1 MeV and the 40 keV - 20 MeV bands, respectively, by using two
different scintillator-based instruments. The CGBM covered 32.5% and 49.1% of the GW 151226 skylocalization probability in the 7 keV - 1 MeV and 40 keV - 20 MeV bands respectively. We place
a 90% upper limit of 2 × 10⁻⁷ erg cm−2 s−1 in the 1 - 100 GeV band where CAL reaches 15% of
the integrated LIGO probability (∼1.1 sr). The CGBM 7 σ upper limits are 1.0 × 10⁻⁶ erg cm−2
s−1 (7-500 keV) and 1.8 × 10⁻⁶ erg cm−2 s−1 (50-1000 keV) for one second exposure. Those upperlimits correspond to the luminosity of 3-5 ×1049 erg s−1 which is significantly lower than typical short
GRBs.
Keywords: gamma-ray burst: general – gravitational waves
1. INTRODUCTION
The first gravitational-wave detection by the Laser Interferometer Gravitational-Wave Observatory (LIGO) on GW
150914 confirmed the existence not only of gravitational waves from astronomical objects but also of a binary black
hole system with several tens of solar masses (Abbott et al. 2016a). Based solely on the gravitational-wave signalsrecorded by two LIGO detectors, the current hypothesis is that GW 150914 was the result of a merger of two black
holes with initial masses of 36+5−4M⊙ and 29+4
−4M⊙ at the luminosity distance of 410+160−180 Mpc. The Fermi Gamma-ray
Burst Monitor (Fermi-GBM) reported a possible weak gamma-ray transient source above 50 keV at 0.4 s after the GW
150914 trigger (Connaughton et al. 2016). However, the upper limit provided by the INTEGRAL ACS instrumentin a gamma-ray energy band similar to the Fermi-GBM energy band is not consistent with a possible gamma-ray
counterpart of GW 150914 suggested by the Fermi-GBM (Savchenko et al. 2016). No electromagnetic counterpart of
GW 150914 was found in radio, optical, near-infrared, X-ray and high-energy gamma-ray (Abbott et al. 2016b).
GW 151226 (LIGO-Virgo trigger ID: G211117) is the 2nd gravitational-wave candidate identified by both LIGO
Hanford Observatory and LIGO Livingston Observatory with a high significance (the false alarm rate of less thanone per 1000 years by the on-line search) at 3:38:53.647 UT on December 26, 2015 (Abbott et al. 2016c). According
to a Bayesian parameter estimation analysis, the event is very likely a binary black hole merger with initial black
hole masses of 14.2+8.3−3.7M⊙ and 7.5+2.3
−2.3M⊙ , and final black hole mass of 20.8+6.1−1.7M⊙ (Abbott et al. 2016d). The
luminosity distance of the source is estimated as 440+180−190 Mpc which corresponds to a redshift of 0.09+0.03
−0.04. Asfar as the electromagnetic counterpart search of GW 151226 in the gamma-ray regime is concerned, Fermi-GBM
(Burns et al. 2015), Fermi Large Area Telescope (LAT) (Vianello et al. 2016), High-Altitude Water Cherenkov
Observatory (HAWC) (Wood et al. 2016), and Astrosat-CZTI (Bhalerao et al. 2016) reported no detections around
the GW trigger time. According to Racusin et al. (2016), the flux upper limit of Fermi-GBM is from 4.5 × 10⁻⁷ erg
cm−2 s−1 to 9 × 10⁻⁷ erg cm−2 s−1 in the 10-1000 keV band. The Fermi-LAT flux upper limit using the first orbitdata after the LIGO trigger is from 2.6× 10⁻¹⁰ erg cm−2 s−1 to 7.8× 10⁻⁹ erg cm−2 s−1 in the 0.1-1 GeV band.
The CALorimetric Electron Telescope (CALET; Torii et al. (2015); Asaoka et al. (2015)) mission, which was suc-
cessfully launched and emplaced on the Japanese Experiment Module - Exposed Facility (JEM-EF) of the International
Space Station (ISS) in August 2015, was fully operational at the time of GW 151226. CALET consists of two scientificinstruments. The Calorimeter (CAL) is the main instrument which is capable of observing high energy electrons from
∼1 GeV to ∼20 TeV, protons, helium and heavy nuclei from ∼10 GeV to 1000 TeV, and gamma-rays from ∼1 GeV to

3
∼10 TeV. The field of view (FOV) of CAL is ∼45◦ from the zenith direction. Another instrument, CALET Gamma-
ray Burst Monitor (CGBM; Yamaoka et al. (2013)), is a gamma-ray burst (GRB) monitor using two different kind
of scintillators (LaBr3(Ce) and BGO) to achieve a broad energy coverage. The Hard X-ray Monitor (HXM) using
LaBr3(Ce) covers the energy range from 7 keV up to 1 MeV, and two identical modules are equipped in the samedirection in CALET. The Soft Gamma-ray Monitor (SGM) based on BGO covers the energy range from 40 keV to
20 MeV. The FOV of HXM and SGM are ∼60◦ and ∼110◦ from the boresight respectively. The CGBM has been
detecting GRBs at an average rate of 3-4 events per month.
Around the trigger time of GW 151226, CALET was performing regular scientific data collection. Between 3:30 and
3:43 UT, the CAL was operating in the low-energy gamma-ray mode, which is an operation mode with a lower energythreshold of 1 GeV. The high voltages of CGBM were set at the nominal values around 3:20 UT and turned off around
3:40 UT to avoid high background radiation area. There was no CGBM on-board trigger at the trigger time of GW
151226.
2. OBSERVATION
2.1. CGBM Data Analysis and Results
At 3:38 UT, the CGBM was operating in nominal operational mode in which continuous light curve data in 0.125
s time resolution were recorded at eight different energy bands for each instrument. The boresight directions of HXM
and SGM were (R.A., Dec.) (J2000) = (35.6◦, −28.0◦) and (43.5◦, −22.1◦) at the onset of GW 151226. Around theGW 151226 event time, no CGBM on-board trigger occurred. Therefore, the available data to investigate the possible
counterpart are the continuous light curves mentioned above. If there is the on-board trigger, the time-tagged event
data with 62.5 µs resolution will be generated. Figure 1 shows the light curves in the 0.125 s time bins in the time
range between ±10 s from the GW 151226 trigger time. As seen in the figure, no significant excess is seen in the
CGBM data around the trigger time. We calculate the signal-to-noise ratio (SNR) in sliding the time bins of thelight curves by selecting the background interval as 8 s, 16 s, 32 s and 64 s and the foreground interval as 0.125 s,
0.25 s, 0.5 s, 1 s and 4 s. The SNR is calculated as, SNR = {Nfg − (Nbg∆tfg/∆tbg)}/√
Nbg∆tfg/∆tbg, where Nfg is
the counts in the foreground interval, ∆tfg is the integration time of the foreground interval, Nbg is the counts in the
background interval and ∆tbg is the integration time of the background interval. The background interval is alwaysprior to the foreground interval and there is no time gap between the background and the foreground interval. We
searched the light curve data for finding signals of individual instruments (HXM1, HXM2 and SGM) and the sum of
the HXM1 and the HXM2. The searched energy bands are all the combinations of 7-10 keV, 10-25 keV, 25-50 keV,
50-100 keV for the high-gain data and 60-100 keV, 100-170 keV, 170-300 keV and 300-3000 keV for the low-gain data
of the HXM. In the SGM, 40-100 keV, 100-230 keV, 230-450 keV and 450-1000 keV for the high-gain data and 560-840keV, 840-1500 keV, 1.5-2.6 MeV and 2.6-28 MeV for the low-gain data are investigated. The highest SNR between
±10 s window is 4.7 at 7.5 s after the LIGO trigger in the 7-10 keV band of the HXM1 (the 1 s foreground and the 16
s background interval). Using 38,900 trials the false-detection probability at the level of 4.7 σ was evaluated as ∼0.02
which is too high to claim a detection. In the HXM2 data, the SNR of the same time bin in which the highest SNRis found in HXM1 data is −1.76. The highest SNR is still found in the same time bin even if we extend the search
window up to ±60 s. Therefore, we concluded that there are no significant signals in the CGBM data associated with
the gravitational-wave event. Note that, however, our search is limited by the available continuous light curve data in
the 0.125 s time resolution and might not be sensitive to an event with duration shorter than 0.125 s.
The flux upper limits of HXM and SGM are evaluated by using a CGBM Monte-Carlo simulator based on theGEANT4 software package. The simulations are performed by emitting the photons at incident angles from 0◦ to
110◦ in 1◦ steps with respect to the detector. The source spectrum assumes following two cases. The first case is
a typical GRB spectrum for the BATSE short GRBs (s-GRBs). In this case, we use the averaged BATSE s-GRB
spectral parameters in a cutoff power-law model1 reported by Ghirlanda et al. (2009), with a photon index α of−0.58 and Epeak = 355 keV. The second case is the Crab-like spectrum: a power-law with a photon index of −2.1.
The background spectrum is estimated using the real data over three days around the event in count space, normalized
to the actual background level at the trigger time. The background variation was rather stable since the CGBM was
not operated at the high background regions such as a high longitude and the South Atlantic Anomaly. The gain
differences during those three days were less than 3% for both the HXM and the SGM data. The exposure time of theinput and the background spectrum is one second. The source flux is evaluated to be in a range from 10−8 to 10−6 erg
1 f(E) ∼ Eα exp(−E (2 + α)/Epeak)
4
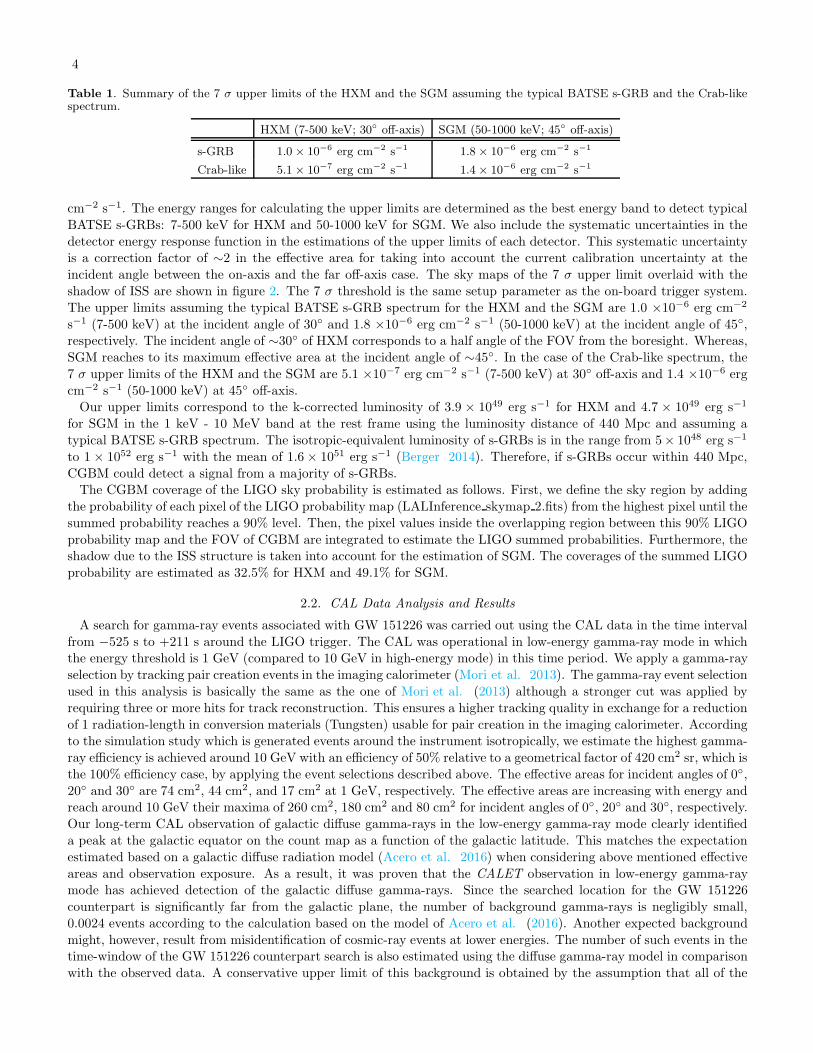
Table 1. Summary of the 7 σ upper limits of the HXM and the SGM assuming the typical BATSE s-GRB and the Crab-likespectrum.
HXM (7-500 keV; 30◦ off-axis) SGM (50-1000 keV; 45◦ off-axis)
s-GRB 1.0× 10⁻⁶ erg cm−2 s−1 1.8× 10⁻⁶ erg cm−2 s−1
Crab-like 5.1× 10⁻⁷ erg cm−2 s−1 1.4× 10⁻⁶ erg cm−2 s−1
cm−2 s−1. The energy ranges for calculating the upper limits are determined as the best energy band to detect typical
BATSE s-GRBs: 7-500 keV for HXM and 50-1000 keV for SGM. We also include the systematic uncertainties in the
detector energy response function in the estimations of the upper limits of each detector. This systematic uncertaintyis a correction factor of ∼2 in the effective area for taking into account the current calibration uncertainty at the
incident angle between the on-axis and the far off-axis case. The sky maps of the 7 σ upper limit overlaid with the
shadow of ISS are shown in figure 2. The 7 σ threshold is the same setup parameter as the on-board trigger system.
The upper limits assuming the typical BATSE s-GRB spectrum for the HXM and the SGM are 1.0 ×10⁻⁶ erg cm−2
s−1 (7-500 keV) at the incident angle of 30◦ and 1.8 ×10⁻⁶ erg cm−2 s−1 (50-1000 keV) at the incident angle of 45◦,respectively. The incident angle of ∼30◦ of HXM corresponds to a half angle of the FOV from the boresight. Whereas,
SGM reaches to its maximum effective area at the incident angle of ∼45◦. In the case of the Crab-like spectrum, the
7 σ upper limits of the HXM and the SGM are 5.1 ×10⁻⁷ erg cm−2 s−1 (7-500 keV) at 30◦ off-axis and 1.4 ×10⁻⁶ erg
cm−2 s−1 (50-1000 keV) at 45◦ off-axis.Our upper limits correspond to the k-corrected luminosity of 3.9 × 1049 erg s−1 for HXM and 4.7 × 1049 erg s−1
for SGM in the 1 keV - 10 MeV band at the rest frame using the luminosity distance of 440 Mpc and assuming a
typical BATSE s-GRB spectrum. The isotropic-equivalent luminosity of s-GRBs is in the range from 5× 1048 erg s−1
to 1 × 1052 erg s−1 with the mean of 1.6× 1051 erg s−1 (Berger 2014). Therefore, if s-GRBs occur within 440 Mpc,
CGBM could detect a signal from a majority of s-GRBs.The CGBM coverage of the LIGO sky probability is estimated as follows. First, we define the sky region by adding
the probability of each pixel of the LIGO probability map (LALInference skymap 2.fits) from the highest pixel until the
summed probability reaches a 90% level. Then, the pixel values inside the overlapping region between this 90% LIGO
probability map and the FOV of CGBM are integrated to estimate the LIGO summed probabilities. Furthermore, theshadow due to the ISS structure is taken into account for the estimation of SGM. The coverages of the summed LIGO
probability are estimated as 32.5% for HXM and 49.1% for SGM.
2.2. CAL Data Analysis and Results
A search for gamma-ray events associated with GW 151226 was carried out using the CAL data in the time interval
from −525 s to +211 s around the LIGO trigger. The CAL was operational in low-energy gamma-ray mode in whichthe energy threshold is 1 GeV (compared to 10 GeV in high-energy mode) in this time period. We apply a gamma-ray
selection by tracking pair creation events in the imaging calorimeter (Mori et al. 2013). The gamma-ray event selection
used in this analysis is basically the same as the one of Mori et al. (2013) although a stronger cut was applied by
requiring three or more hits for track reconstruction. This ensures a higher tracking quality in exchange for a reduction
of 1 radiation-length in conversion materials (Tungsten) usable for pair creation in the imaging calorimeter. Accordingto the simulation study which is generated events around the instrument isotropically, we estimate the highest gamma-
ray efficiency is achieved around 10 GeV with an efficiency of 50% relative to a geometrical factor of 420 cm2 sr, which is
the 100% efficiency case, by applying the event selections described above. The effective areas for incident angles of 0◦,
20◦ and 30◦ are 74 cm2, 44 cm2, and 17 cm2 at 1 GeV, respectively. The effective areas are increasing with energy andreach around 10 GeV their maxima of 260 cm2, 180 cm2 and 80 cm2 for incident angles of 0◦, 20◦ and 30◦, respectively.
Our long-term CAL observation of galactic diffuse gamma-rays in the low-energy gamma-ray mode clearly identified
a peak at the galactic equator on the count map as a function of the galactic latitude. This matches the expectation
estimated based on a galactic diffuse radiation model (Acero et al. 2016) when considering above mentioned effective
areas and observation exposure. As a result, it was proven that the CALET observation in low-energy gamma-raymode has achieved detection of the galactic diffuse gamma-rays. Since the searched location for the GW 151226
counterpart is significantly far from the galactic plane, the number of background gamma-rays is negligibly small,
0.0024 events according to the calculation based on the model of Acero et al. (2016). Another expected background
might, however, result from misidentification of cosmic-ray events at lower energies. The number of such events in thetime-window of the GW 151226 counterpart search is also estimated using the diffuse gamma-ray model in comparison
with the observed data. A conservative upper limit of this background is obtained by the assumption that all of the

5
excess in observed data to the model originates from the background. Then, the possibility of such a misidentification
is confirmed to be less than 0.035 events. Therefore, the CAL observation is virtually background free in such a short
time window. We found no gamma-ray candidate inside this time window with negligible contamination from other
events.The upper limit of the CAL observation in this 736 s long period is estimated as follows. First, we calculated the
effective area and the resultant exposure map in the time window for the 1-100 GeV band. At lower energies, the
effective area gradually decreases below 10 GeV and reaches zero around 500 MeV. Next, we estimated the limiting
flux corresponding to 2.44 events, which is the 90% confidence limit for null observation, assuming a single power-law
model with a photon index of −2 by applying the estimated exposure map. The assumed photon index of −2 is atypical photon index of the Fermi-LAT GRBs in the GeV energy range (Ackermann et al. 2013). Figure 3 shows the
sky map of the flux upper limit at 90% confidence level. The estimated 90% upper limit is 2× 10⁻⁷ erg cm−2 s−1 in
the 1 - 100 GeV band where CAL reaches 15% of the integrated LIGO probability (∼1.1 sr). The CAL upper limit
in luminosity is estimated as 4.6 × 1048 erg s−1 for a source distance of 440 Mpc. The flux upper limit in the sameenergy band as reported by Fermi-LAT of 0.1-1 GeV (Racusin et al. 2016) is calculated to be 1× 10⁻⁷ erg cm−2 s−1
extrapolating a single power-law spectrum with a photon index of −2.
We would like to thank the anonymous referee for comments and suggestions that materially improved the paper.
We gratefully acknowledge JAXA’s contributions for CALET development and operation on ISS. We express oursincere thanks to ASI and NASA for their support to the CALET project. This work is partially supported by JSPS
Grant-in-Aid for Scientific Research (S) Number 26220708 and MEXT-Supported Program for the Strategic Research
Foundation at Private Universities (2011-2015) S1101021 in Waseda University. This work is also supported in part
by MEXT Grant-in-Aid for Scientific Research on Innovative Areas Number 24103002. US CALET work is supported
by NASA under RTOP 14-APRA14-0075 (GSFC) and grants NNX16AC02G (WUSL), NNX16AB99G (LSU), andNNX11AE06G (Denver).
REFERENCES
Abbott, B.P., Abbott, R., Abbott, T.D., et al. 2016a, PhRvL,116, 061102
Abbott, B.P., Abbott, R., Abbott, T.D., et al. 2016b, ApJL inpress
Abbott, B.P., Abbott, R., Abbott, T.D., et al. 2016c, PhRvL,116, 241103
Abbott, B.P., Abbott, R., Abbott, T.D., et al. 2016d,arXiv:1606.04856
Acero, F., Ackermann, M., Ajello, M., et al. 2016, ApJS, 223, 26Ackermann, M., Ajello, M., Asano, K., et al. 2013, ApJS, 209, 11Asaoka, Y., the CALET Collaboration, PoS (ICRC2015) 603Berger, E., 2014, Annual Review of Astronomy and
Astrophysics, 52, 43Bhalerao, V., Bhattacharya, D., Vibhute, A., et al. 2016, GCN
Circ. 19401Burns, E., Blackburn, L., Briggs, M. S., et al. 2015, GCN Circ.
18741
Connaughton, V., Burns, E., Goldstein, A., et al. 2016,arXiv:1602.03920
Ghirlanda, G., Nava, L., Ghisellini, G., Celotti, A., Firmani, C.,2009, A&A, 496, 585
Mori, M., the CALET Collaboration, 33rd International CosmicRay Conference (Rio de Janeiro, Brasil), 2013
Racusin, J.L., Burns, E., Goldstein, A., et al. 2016,arXiv:160604901
Savchenko, V., Ferrigno, C., Mereghetti, S., et al. 2016, ApJ,820, 36
Torii, S., the CALET Collaboration, PoS (ICRC2015) 581Vianello, G., Razzano, M., Omodei, N., et al. 2016, GCN Circ.
18813Wood, J., et al. 2016, GCN Circ. 19156Yamaoka K., Yoshida, A., Sakamoto, T. et al. 2013, 7th
Huntsville Gamma-Ray Burst Symposium, GRB 2013: paper41 in eConf Proceedings C1304143

6
Ra
te [
c/s
]
Time since 2015/12/26 03:38:53.65 [s]
HXM1+2: 7-10 keV
HXM1+2: 10-25 keV
HXM1+2: 25-50 keV
HXM1+2: 50-100 keV
SGM: 40-100 keV
SGM: 100-230 keV
0
100
200
300
0
100
200
300
0
100
200
300
400
100
200
300
200
400
600
200
400
600
800
1000
200
400
600
−10 −5 0 5 100
100
200
300
400
SGM: 230-450 keV
SGM: 450-1000 keV
050100150200250
100
200
300
0
100
200
300
0
100
200
300
050100150200
050100150200
050100150200
−10 −5 0 5 100
100
200
300
Ra
te [
c/s
]
Time since 2015/12/26 03:38:53.65 [s]
HXM1+2: 60-100 keV
HXM1+2: 100-170 keV
HXM1+2: 170-300 keV
HXM1+2: 300-3000 keV
SGM: 560-840 keV
SGM: 840-1500 keV
SGM: 1500-2600 keV
SGM: 2600-28000 keV
Figure 1. The CGBM light curves in 0.125 s time resolution for the high-gain data (left) and the low-gain data (right). Thetime is offset from the LIGO trigger time of GW 151226. The dashed-lines correspond to the 5 σ level from the mean countrate using the data of ±10 s.
10
12
14
16
18
7−sigma upper limit (×10−7 erg s−1cm
−2 )
30
60
-30
-60
RA (J2000)
Dec (J2000)
0 330306090120150 300 270 240 210 180
0
180
18
19
20
21
7−sigma upper limit (×10−7 erg s−1 cm−2 )
30
60
-30
-60
RA (J2000)
Dec (J2000)
0 330306090120150 300 270 240 210 180
0
180
Figure 2. The sky maps of the 7 σ upper limit for HXM (left) and SGM (right). The assumed spectrum for estimating theupper limit is a typical BATSE S-GRBs (see text for details). The energy bands are 7-500 keV for HXM and 50-1000 keV forSGM. The GW 151226 probability map is shown in green contours. The shadow of ISS is shown in black hatches.
0.5
1.0
2.0
10.0
20.0
90%
up
per
lim
it (×
10−7 e
rg
s−1 c
m−2 )
30
60
-30
-60
RA (J2000)
Dec
(J2
00
0)
0 330306090120150 300 270 240 210 180
0
180
Figure 3. The sky map of the 90% upper limit for CAL in the 1-100 GeV band. A power-law model with a photon index of −2is used to calculate the upper limit. The GW 151226 probability map is shown in green contours.