Embed Size (px)
Citation preview

At-home Sleep Apnea Test Using Pulse Oximetry
By
Naheed Baksh
Electrical and Biomedical Engineering Design Project (4BI6)
Department of Electrical and Computer Engineering
McMaster University
Hamilton, Ontario, Canada

At-home Sleep Apnea Test Using Pulse Oximetry
By
Naheed Baksh
Electrical and Biomedical Engineering
Faculty Advisor: Dr. Thomas Doyle
Electrical and Biomedical Engineering Project Report
Submitted in partial fulfillment of the degree of
Bachelor of Engineering
McMaster University
Hamilton, Ontario, Canada
April 16, 2009

ii
Abstract
Many patients who suffer from sleep apnea do not get proper diagnosis due to the
discomfort and complicacy of the current diagnosis systems. The main focus of the
project is to provide a solution for this problem by designing a home sleep apnea test. A
patient‟s blood oxygen saturation level goes down during the apnea attack and this
phenomenon can be detected using a pulse oximeter. Therefore a simple pulse oximeter is
designed to provide data for the software that detects the risk of OSA. The software
designed cannot detect sleep apnea with absolute certainty, but can provide with accurate
risk warning for a patient who might be suffering. The output of the designed system is
given by a software designed using MATLAB. Certain limitations exist in the
development process and those are considered negligible for the scope of the project.
However the solution of the limitations and alternate approach of the assumptions are
discussed in details.
Key Words: Sleep Apnea, OSA, Approximate Entropy, Pulse Oximeter, Sleep Study,
Oxygen Saturation

iii
Acknowledgments
I would like to thank my project coordinator Dr. Thomas Doyle for encouragement,
feedback and guidance throughout the project. I would also like to thank Saba
Mohtashami, teaching assistant for Elec Eng 4BI6, for her remarkable assistance in
different aspects of the development procedure.

iv
Contents
Abstract............................................................................................................................. .. ii
Acknowledgments.............................................................................................................. iii
Contents............................................................................................................................. . iv
List of Tables...................................................................................................................... vi
List of Figures................................................................................................................... vii
Nomenclature..................................................................................................................... ix
1. Introduction 1
1.1 Background....................................................................................................... 1
1.2 Objective........................................................................................................... 3
1.3 Scope of Project................................................................................................ 4
2. Literature Review 5
3. Problem Statement and Solution Methodology 7
3.1 Theory of Pulse Oximetry................................................................................ 7
3.2 Heart Rate Calculation.................................................................................... 10
3.3 Sensor Design.................................................................................................. 11
3.4 Hardware Design............................................................................................ 12
3.5 Software Design..................................................................................... ........ 14
4. Experimental Procedure and Development 16
4.1 Circuit Design and Testing............................................................................. 16
4.2 Sensor Development and Hardware Testing.................................................. 17
4.3 Data Collection and Software Development................................................. 18
4.3.1 Division of Data.............................................................................. 18
4.3.2 Calculating Heart Rate and SaO2.................................................... 22
4.3.3 Approximate Entropy Calculator.................................................... 22
4.4 Challenges During Experiment and Sources of Error.................................... 22

v
5. Results 24
5.1 SaO2 ................................................................................................................ 24
5.2 Sleep Apnea Detector...................................................................................... 25
5.3 Average Heart Rate......................................................................................... 28
6. Future Development 29
6.1 Possible Upgrades........................................................................................... 29
6.2 Additional Features......................................................................................... 30
7. Conclusion 31
Appendix A: Approximate Entropy 32
Appendix B: Design of the LPF and Amplifier 34
Appendix C: Hardware Images 37
Appendix D: List of parts 40
References 41
Vita 44

vi
List of Tables
Table 1: Extinction coefficient table................................................................................. 10
Table 2: Output value of the designed circuit obtained using Multisim........................... 13
Table 3: Output value of the designed circuit obtained using Multisim........................... 16
Table 4: Parts used for the sensor..................................................................................... 17
Table 5: SaO2 time series example .................................................................................. 24
Table 6: Completer parts list............................................................................................. 40

vii
List of Figures
Figure 1: SaO2 pattern for overnight study......................................................................... 3
Figure 2: Approximate Entropy result [5]........................................................................... 6
Figure 3: Project Solution Methodology............................................................................. 7
Figure 4: Absorbance pattern of oxygenated and deoxygenated hemoglobin................... 8
Figure 5: Expected output of the pulse oximeter circuit..................................................... 9
Figure 6: Location of the LEDs with respect to the finger................................................ 11
Figure 7: current to voltage converter of the sensor.......................................................... 11
Figure 8: Final design of the circuit (generated using Multisim)...................................... 12
Figure 9: Plot of amplitudes from the Multisim data........................................................ 13
Figure 10: flow chart of the SaO2 calculator.................................................................... 14
Figure 11: Plot of amplitudes obtained at the laboratory.................................................. 17
Figure 12: Actual Data (Collected from the output of the hardware circuit)................... 19
Figure 13: Revised Data (Only containing complete LED pulses)................................... 20
Figure 14: Red and infrared data separated (not normalized).......................................... 21
Figure 15: Red and infrared data separated and normalized............................................ 21
Figure 16: Example of a signal with motion artifact........................................................ 23
Figure 17: Sleep apnea simulation trial............................................................................ 23
Figure 18: SaO2 time series for a healthy case scenario................................................... 25
Figure 19: ApEn result for a healthy case scenario........................................................... 26
Figure 20: Overall condition of the healthy case scenario................................................ 26
Figure 21: Noisy SaO2 dataset simulating a sleep apnea case scenario........................... 27
Figure 22: ApEn result for an apnea case scenario........................................................... 27
Figure 23: Warning window for an apnea case scenario................................................... 27
Figure 24: Average heart rate window.............................................................................. 28
Figure 25: Initial set up of the sensor................................................................................ 37
Figure 26: Picture of the sensor........................................................................................ 38
Figure 27: Picture of the sensor in use.............................................................................. 38
Figure 28: Picture of circuit.............................................................................................. 38
Figure 29: Red light output in the oscilloscope................................................................ 39

viii
Figure 30: Infrared output in the oscilloscope................................................................... 39
Figure 31: Unity gain low pass filter................................................................................. 34
Figure 32: Non-inverting amplifier................................................................................... 35

ix
Nomenclature
OSA – Obstructive Sleep Apnea
Apnea Episode – pauses in breathing for a OSA positive patient
Apnea Attack – see Apnea Episode
AHI – apnea-hypopnea index
Hb – deoxygenated hemoglobin
HbO2 – oxygenated hemoglobin
ApEn – Approximate Entropy
IR – Infrared
LED – Light Emitting Diode
SaO2 – Arterial Oxygen Saturation

1
1. Introduction
1.1 Background
Obstructive sleep apnea is a breathing disorder that is caused when the tissues or muscles
of the upper airway collapse blocking the inflow of air temporarily during sleep. It can be
caused by various reasons such as obesity, tonsil and adenoid enlargement, natural
narrowing of airway, nasal obstruction, alcohol or sedative use etc. Sometimes the
condition is hereditary. Sleep apnea can be dangerous because a person suffering from
OSA often does not realize the condition because the episodes occur during sleep. The
most common sign of sleep apnea is snoring, which can also be caused by various
reasons. However sleep apnea snoring is different from other forms, as it is often
interrupted by long silent period when the patient does not breath followed by gasping to
restart breathing. Other OSA symptoms include daytime fatigue, inappropriate falling
asleep, memory difficulties, headaches, personality changes, poor concentration, possible
depression, impaired emotional functioning etc. [1]
Besides the aforementioned discomforts sleep apnea can also cause other complications.
Stroke, high blood pressure, heart failure, hallucinations etc are common for an
undiagnosed OSA patient. Moreover, many cases exist where a person with sleep apnea
fell asleep during job or driving causing risky accidents [1]. It is estimated that one in
four middle aged men and one in ten middle aged women suffer from sleep apnea, where
only 10-20% is diagnosed. [4]
AHI is the tool that is currently used to detect sleep apnea. It measures the number of
times of apnea attack occurring per hour during sleep. Two major testing systems exist to
diagnose sleep apnea. One is a nocturnal polysomnography and the other one is an at
home sleep apnea test. The overnight polysomnography monitors ECG, EOG, EMG,
thoracic airflow, pulse oximetry, continuous video monitoring etc. [2]. The at home test is
also similarly extensive and a medical professional is needed to set up the system.

2
As sleep apnea restricts the breathing rate, it causes drop in blood oxygen saturation level.
To understand the theories of blood oxygen saturation and pulse oximetry, it is crucial to
understand how Hemoglobin plays the role of oxygen transporter in the body. One red
blood cell contains approximately 265 molecules of hemoglobin. One hemoglobin
molecule contains four heme and four globin units and each of a heme-globin unit can
carry one oxygen molecule. Therefore one hemoglobin molecule can carry four molecules
of oxygen. [3]
A property of hemoglobin is that it changes color when oxygenated. Oxygenated
hemoglobin is bright red and deoxygenated hemoglobin is dark red, therefore the light
absorbance of oxygenated and deoxygenated hemoglobin is different. Also, the
absorbance is different for light of two different wavelengths (figure 4). These principles
are used to calculate blood oxygen saturation or SaO2 and will be discussed further in
section 3.1.
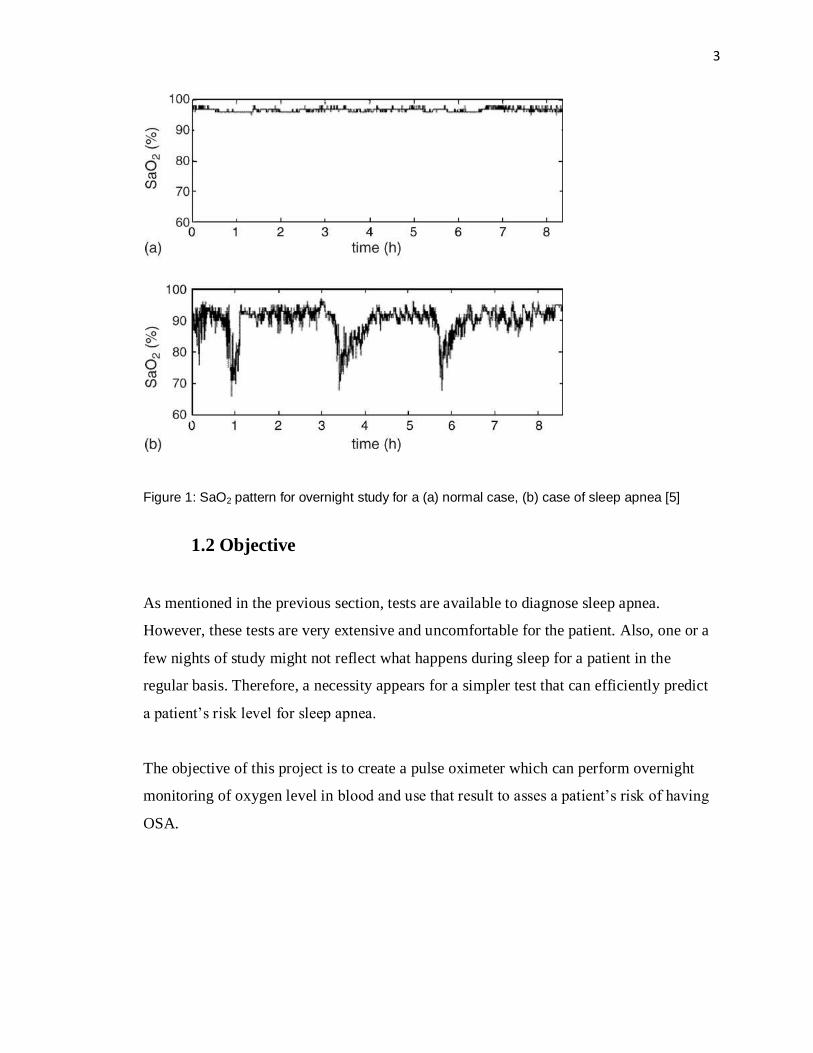
For a healthy human being, blood oxygen saturation or SaO2 should be 90% - 100% [6].
A patient suffering from sleep apnea has overall low SaO2 level. Moreover, studies show
that SaO2 level can drop significantly during an apnea episode. Figure 1 shows the pattern
of the overnight blood oxygen saturation for a healthy case (a) and a case of sleep apnea
(b). Case b exhibits the dips in the time series showing the apnea attacks during the study
period. [5]
3
Figure 1: SaO2 pattern for overnight study for a (a) normal case, (b) case of sleep apnea [5]
1.2 Objective
As mentioned in the previous section, tests are available to diagnose sleep apnea.
However, these tests are very extensive and uncomfortable for the patient. Also, one or a
few nights of study might not reflect what happens during sleep for a patient in the
regular basis. Therefore, a necessity appears for a simpler test that can efficiently predict
a patient‟s risk level for sleep apnea.
The objective of this project is to create a pulse oximeter which can perform overnight
monitoring of oxygen level in blood and use that result to asses a patient‟s risk of having
OSA.

4
1.3 Scope of the project
The device designed for this project has the ability to calculate blood oxygen saturation
and heart rate of the patient. The heart rate is vital information for someone who is prone
to sleep apnea.
The blood oxygen saturation is an indicator of sleep apnea. The software has the
capability of calculating the entropy of the SaO2 which then indicates if the patient is
high risk for sleep apnea.
As this device is only designed as a preliminary prototype it includes a few assumptions
and limitations in both the hardware and software design. These assumptions will be
described in the course of explanation for the design procedure.
The device designed in this project is not a replacement of the existing methods of
detecting sleep apnea, but is designed for individuals who have the symptoms of sleep
apnea or other reasons to be concerned about their blood oxygen saturation. But further
improvement in the accuracy of the designed system can show promising result in sleep
apnea detection.

5
2. Literature Review
The main focus of the literature search of this project was based on the following areas
1. LED selection for finger clip
2. Circuit design for signal manipulation
3. Calculation of SaO2
4. Find connection between SaO2 and sleep apnea
The description for the logic behind the LED selection, the circuit design and the SaO2
calculation procedure is described in section 3, „problem statement and solution
methodology‟.
Research is being done that shows promising results that relates pulse oximetry and sleep
apnea. Poincare analysis [19], standard deviation calculation and entropy analysis [5] are
the most common in the analysis procedure. However, the most promising and clear
indication of sleep apnea can be noticed in the approximate entropy analysis. One of the
studies that had been conducted in this area includes a group of 187 subjects of whom,
111 are diagnosed as sleep apnea positive and 76 diagnosed as sleep apnea negative.
ApEn calculation (appendix A) was then performed for each subject on an overnight
sleep study data of oxygen saturation. Figure 2 shows the result obtained in this study,
and the optimum threshold for OSA positive group was found to be 0.77 [5]. Therefore,
from this study, it can be safely concluded that result above 0.77 shows high risk of sleep
apnea.

6
Figure 2: Approximate entropy result pattern showing that people with higher that 0.8 ApEn is
more likely to have sleep apnea [5]
This result can be used to predict the risk of OSA but cannot detect positive or negative
sleep apnea as a significant number of cases for sleep apnea positive lie beneath the
threshold value and a few OSA negative cases exist above the threshold value.
7
3. Problem Statement and Solution Methodology
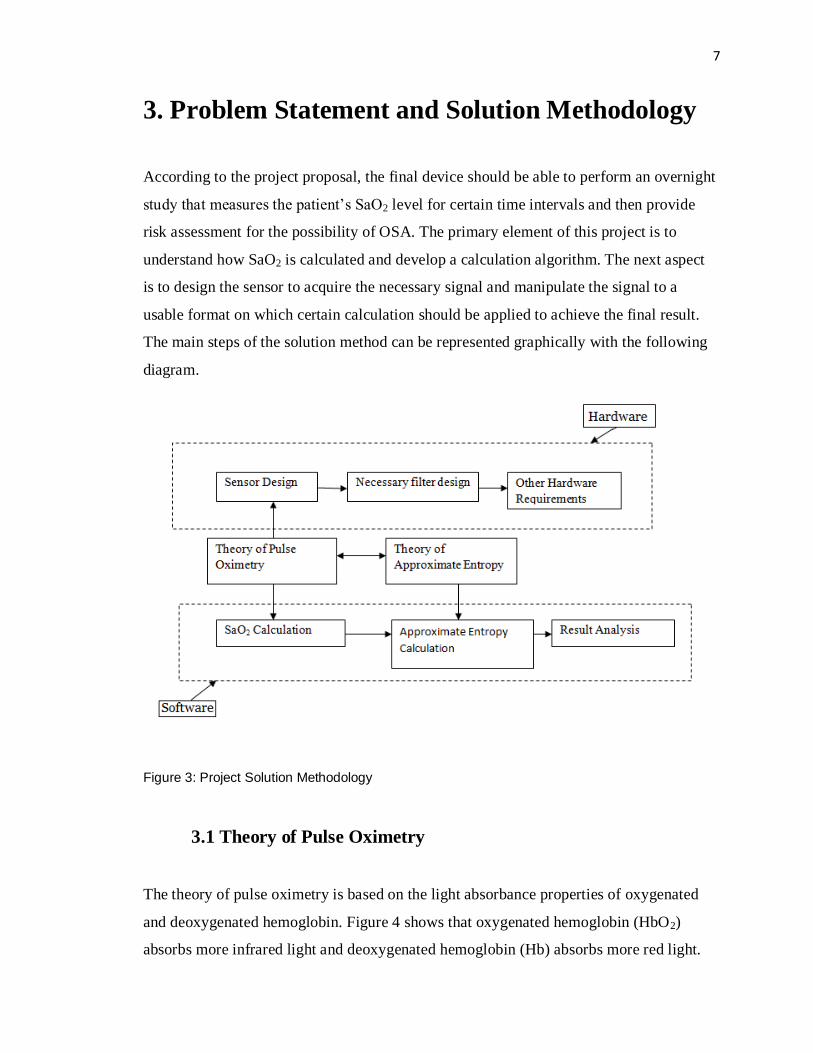
According to the project proposal, the final device should be able to perform an overnight
study that measures the patient‟s SaO2 level for certain time intervals and then provide
risk assessment for the possibility of OSA. The primary element of this project is to
understand how SaO2 is calculated and develop a calculation algorithm. The next aspect
is to design the sensor to acquire the necessary signal and manipulate the signal to a
usable format on which certain calculation should be applied to achieve the final result.
The main steps of the solution method can be represented graphically with the following
diagram.
Figure 3: Project Solution Methodology
3.1 Theory of Pulse Oximetry
The theory of pulse oximetry is based on the light absorbance properties of oxygenated
and deoxygenated hemoglobin. Figure 4 shows that oxygenated hemoglobin (HbO2)
absorbs more infrared light and deoxygenated hemoglobin (Hb) absorbs more red light.

8
Figure 4: absorbance pattern of oxygenated and deoxygenated hemoglobin for different
wavelength (Absorbance vs. Wavelength) [7]
In pulse oximetry, two LEDs are used which are usually a pair of red and infra red lights.
The light from these LEDs are passed through a comparative translucent part of the body
usually earlobe, finger or toe. [7]
Two methods exist to design the sensor that can detect the blood absorption:
transmission/forward scattered model and reflection/ backscattered model. In the forward
scattered model, the LEDs and the photodiode are situated in the different side of the
body and in the backscattered model, the LEDs and the photodiode exist on the same side
of the body. [8]
During systole, the heart pumps out the blood therefore, the arteries contain more blood
than during diastole. This causes existence of more light absorbing components (Hb and
HbO2) to exist in blood during systole. Due to the pulsatile nature of blood, the output of
the photodetector contains an AC component. It also contains a large DC component
caused by constant light absorption of venous blood, tissue, bone etc. Figure 5 shows the
shape of the function expected at the output of the photodetector.

9
Figure 5: Expected output of the pulse oximeter circuit [3]
Using Beer-Lambert`s law and this absorbance properties of blood, the following
equation has been developed to calculate SaO2 [3].
𝑆𝑎O2 = 𝑎𝐻𝑏𝑟 − 𝑎𝐻𝑏𝑖𝑟 𝑅
𝑎𝐻𝑏𝑟 − 𝑎𝐻𝑏𝑜2𝑟 + (𝑎𝐻𝑏𝑜2𝑖𝑟 − 𝑎𝐻𝑏𝑖𝑟 )𝑅 − −− −(1)
Where,
aHbr = Extinction coefficient of Red light in de-oxygenated hemoglobin
aHbir = Extinction coefficient of Infra Red light in de-oxygenated hemoglobin
aHbo2r = Extinction coefficient of Red light in oxygenated hemoglobin
aHbo2ir = Extinction coefficient of Infra Red light in oxygenated hemoglobin
R = ratio of the output intensity (logarithmic)
However, signal manipulation is easier when the output of the photodetector is
transformed to voltage. Therefore the ratio R is calculated in terms of voltage, not
intensity.
10
𝑅 = ln
𝑉𝑚𝑎𝑥𝑅𝑉𝑚𝑖𝑛𝑅
ln(𝑉𝑚𝑎𝑥𝐼𝑅𝑉𝑚𝑖𝑛𝐼𝑅
)−− −−(2)
VmaxR = maximum peak due to red light during voltage as output
VmaxIR = maximum peak due to infra red light during voltage as output
VminR = minimum peak due to red light during voltage as output
VminIR = minimum peak due to infra red light during voltage as output
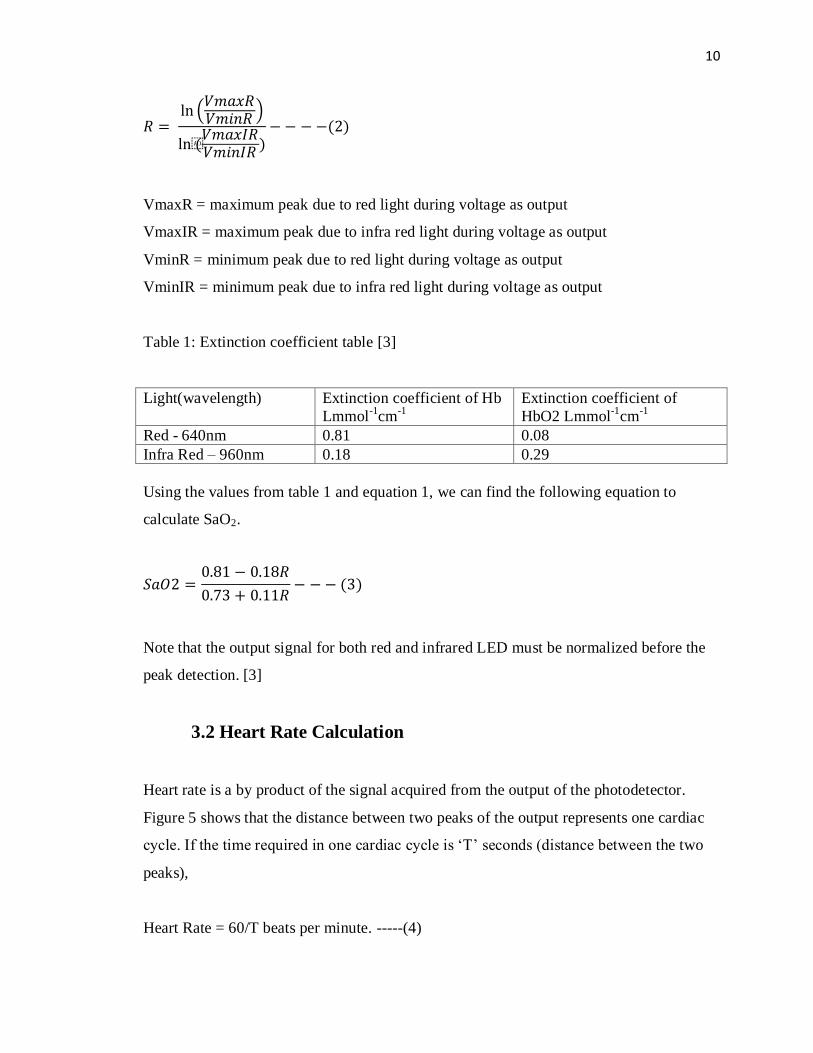
Table 1: Extinction coefficient table [3]
Light(wavelength) Extinction coefficient of Hb
Lmmol-1
cm-1
Extinction coefficient of
HbO2 Lmmol-1
cm-1
Red - 640nm 0.81 0.08
Infra Red – 960nm 0.18 0.29
Using the values from table 1 and equation 1, we can find the following equation to
calculate SaO2.
𝑆𝑎𝑂2 =0.81 − 0.18𝑅
0.73 + 0.11𝑅− − − (3)
Note that the output signal for both red and infrared LED must be normalized before the
peak detection. [3]
3.2 Heart Rate Calculation
Heart rate is a by product of the signal acquired from the output of the photodetector.
Figure 5 shows that the distance between two peaks of the output represents one cardiac
cycle. If the time required in one cardiac cycle is „T‟ seconds (distance between the two
peaks),
Heart Rate = 60/T beats per minute. -----(4)

11
3.3 Sensor Design
A forward scattered pulse oximeter sensor specially made to use on the finger is designed
for the purpose of this project. In this type of design, the infrared and the red led located
on the same side of the finger.
Figure 6: Location of the LEDs with respect to the finger
Photodetector provides output as current proportional to the emitted intensity. A simple
current to voltage converted was designed to provide a voltage input for the filtering
circuitry.
Figure 7: current to voltage converter of the sensor [10]
Infrared and Red LEDs
Finger
Photodetector

12
Figure 7 shows the current to voltage converter mechanism of the sensor. The
photodetector in the circuit provides current as output where the current value reflects the
intensity of the light coming out of the finger. The current passes through the resistor Rf
and Vout = current x Rf.
The resistor Rf converts the current to voltage. As the output current is in the μA range,
therefore a high resistor is being used to get a significant output voltage.
3.4 Hardware Design
The expected output of the sensor is in a function with frequency same as heart rate.
Also, the output is likely to contain high frequency noise from the motion artifact and
ambient light. Therefore a filtering system is required that will pass approximately 0 to 3
Hz frequency signal. To avoid eliminating necessary components from the signal, a low
pass filter is designed for this problem that will pass DC to 10Hz. Appendix B discusses
the design procedure in detail. Moreover, in the hardware design the filtered signal is
passed through an amplifier that has gain of 10 approximately.
Figure 8: Final design of the circuit (generated using Multisim); C1 and C2 are capacitors of
values 4.7μF and 2.2μF respectively and R1, R2, R3,R4 and R5 are resistors of values 2.2kΩ,
6.2 kΩ, 1.2 kΩ, 0.5 kΩ and 5 kΩ.
13
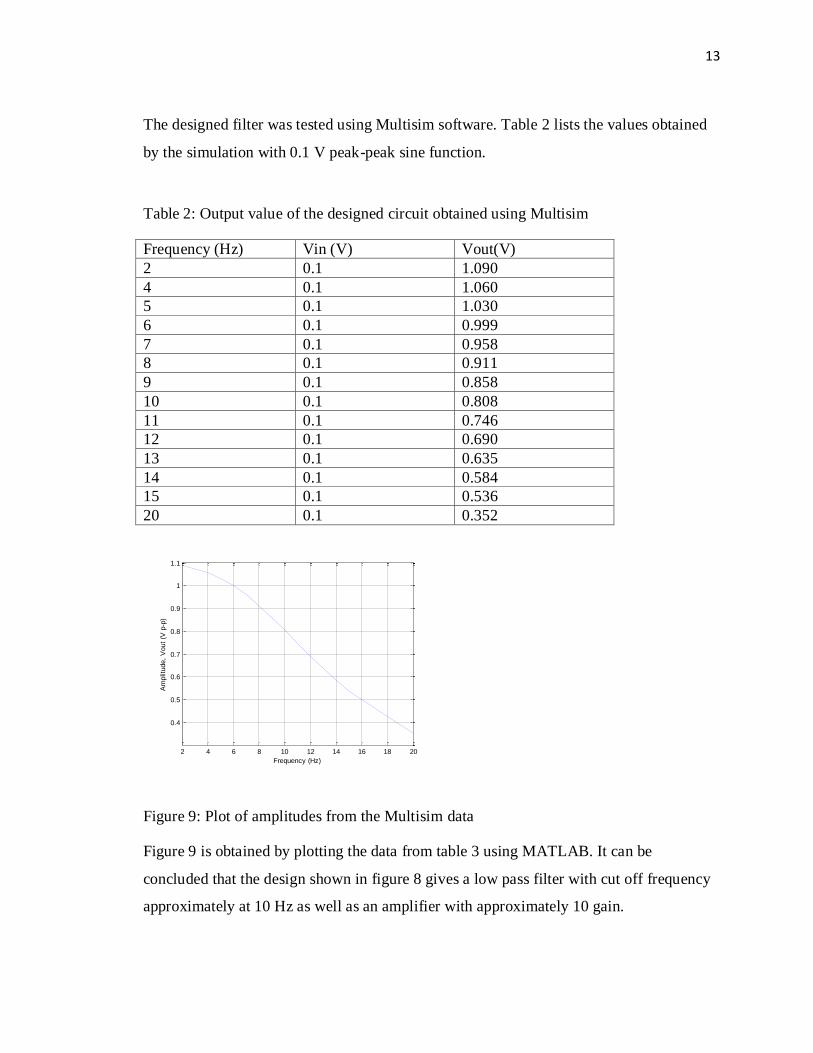
The designed filter was tested using Multisim software. Table 2 lists the values obtained
by the simulation with 0.1 V peak-peak sine function.
Table 2: Output value of the designed circuit obtained using Multisim
Frequency (Hz) Vin (V) Vout(V)
2 0.1 1.090
4 0.1 1.060
5 0.1 1.030
6 0.1 0.999
7 0.1 0.958
8 0.1 0.911
9 0.1 0.858
10 0.1 0.808
11 0.1 0.746
12 0.1 0.690
13 0.1 0.635
14 0.1 0.584
15 0.1 0.536
20 0.1 0.352
Figure 9: Plot of amplitudes from the Multisim data
Figure 9 is obtained by plotting the data from table 3 using MATLAB. It can be
concluded that the design shown in figure 8 gives a low pass filter with cut off frequency
approximately at 10 Hz as well as an amplifier with approximately 10 gain.
2 4 6 8 10 12 14 16 18 20
0.4
0.5
0.6
0.7
0.8
0.9
1
1.1
Frequency (Hz)
Am
plit
ude,
Vout
(V p
-p)
14
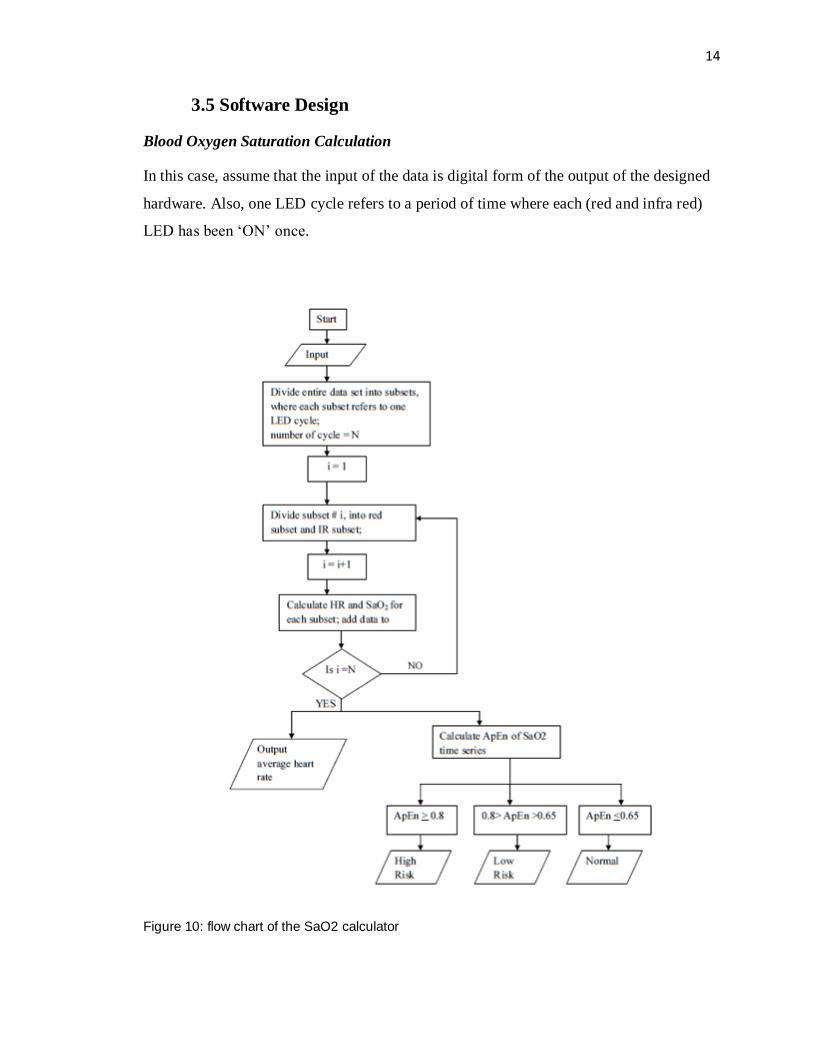
3.5 Software Design
Blood Oxygen Saturation Calculation
In this case, assume that the input of the data is digital form of the output of the designed
hardware. Also, one LED cycle refers to a period of time where each (red and infra red)
LED has been „ON‟ once.
Figure 10: flow chart of the SaO2 calculator

15
Figure 2 shows the ApEn threshold for sleep apnea to be approximately 0.77, but in the
case of this software the high risk threshold has been rounded off to 0.8 and the low risk
threshold was adjusted to be 0.65.

16
4. Experimental Procedure and Development
The designed explained in section 3 was developed for this project. The hardware
development was carried out in a laboratory where there was constant access to a
oscilloscope and function generator as well as a +/-5V power supply.
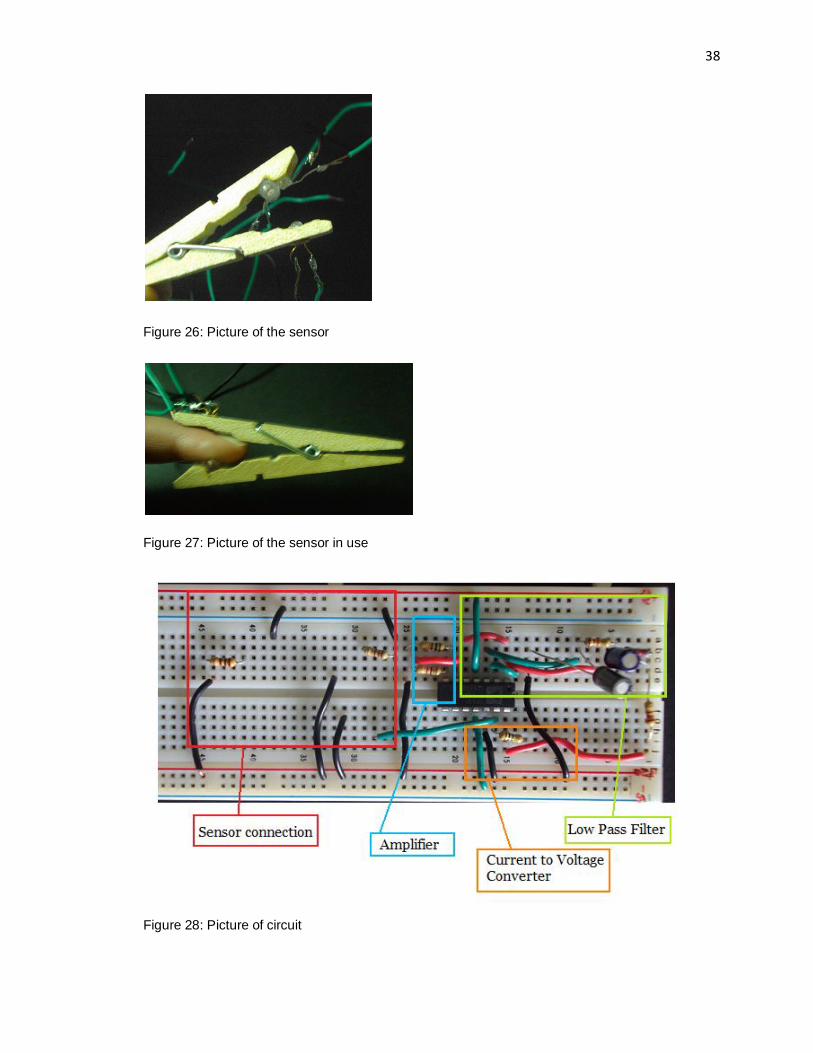
4.1 Circuit Design and Testing
The designed circuit was developed in the lab using 5% resistors and OP491 op-amp [14].
Figure 28 shows the picture of the circuit developed on a breadboard. Table 3 shows the
behaviour of the circuit. Vin represents the peak to peak amplitude of the input sine wave
and Vout represent the same for the output sine wave. The test was performed in the lab
using a function generator to generate the input sine wave and change the frequency to
see the output behaviour.
Table 3: Output value of the designed circuit obtained using Multisim
Frequency (Hz) Vin (V) Vout(V)
2 0.1 1.08
4 0.1 1.12
5 0.1 1.04
6 0.1 1.04
7 0.1 1.00
8 0.1 0.96
9 0.1 0.83
10 0.1 0.80
11 0.1 0.76
12 0.1 0.69
13 0.1 0.64
14 0.1 0.56
15 0.1 0.52
20 0.1 0.36

17
Figure 11: Plot of amplitudes obtained at the laboratory
Figure 11 shows a plot of peak-peak amplitude vs. frequency for data acquired in the lab.
By comparing this plot with the ideal plot in figure 9, it was decided that significant
similarities exist between the two, there. This also shows that approximately half of the
amplitude is diminished when frequency is 10 Hz. Therefore it was decided that this
circuit is appropriate for the development procedure.
4.2 Sensor Development and Hardware Testing
The already developed model to calculate SaO2 assumes the wavelength of red light to be
640 nm and the wavelength of the infrared light to be 960 nm. However, due to
availability, the used values were slightly different. The selected Red LED produced
bright red light with 631 nm wavelength. The infrared LED produced infrared light of
940nm. The assumption in this case was that the small change in the wavelength of the
LEDs will not make a significant difference in the SaO2 calculation procedure.
Table 4: Parts used for the sensor
Part # Part Description
RL5-R5015 Red LED, 631 nm [11]
SIR-320ST3F Infra red LED, 940 nm [12]
BPW24R Silicon PIN Photodetector , 600 – 1050 nm sprectral bandwidth
2 4 6 8 10 12 14 16 18 20
0.4
0.5
0.6
0.7
0.8
0.9
1
1.1
1.2
1.3
Frequency (Hz)
Am
plit
ude,
Vp-p
(V
olts)
18
Initially the sensor was designed so that the LEDs and the photodetector are directly
attached to the breadboard and the finger is placed in between. Figure 25 in appendix C
shows the initial set up of the sensor. However, this method caused a large noise and the
output contained spikes and missing data due to the movement of the finger and LED
components. Moreover, the design was uncomfortable, hampered practicality to a large
extent and did not provide stability for the development process. Therefore, the design
was changed to a finger clip that will hold the photodetector and the LEDs tightly against
the skin.
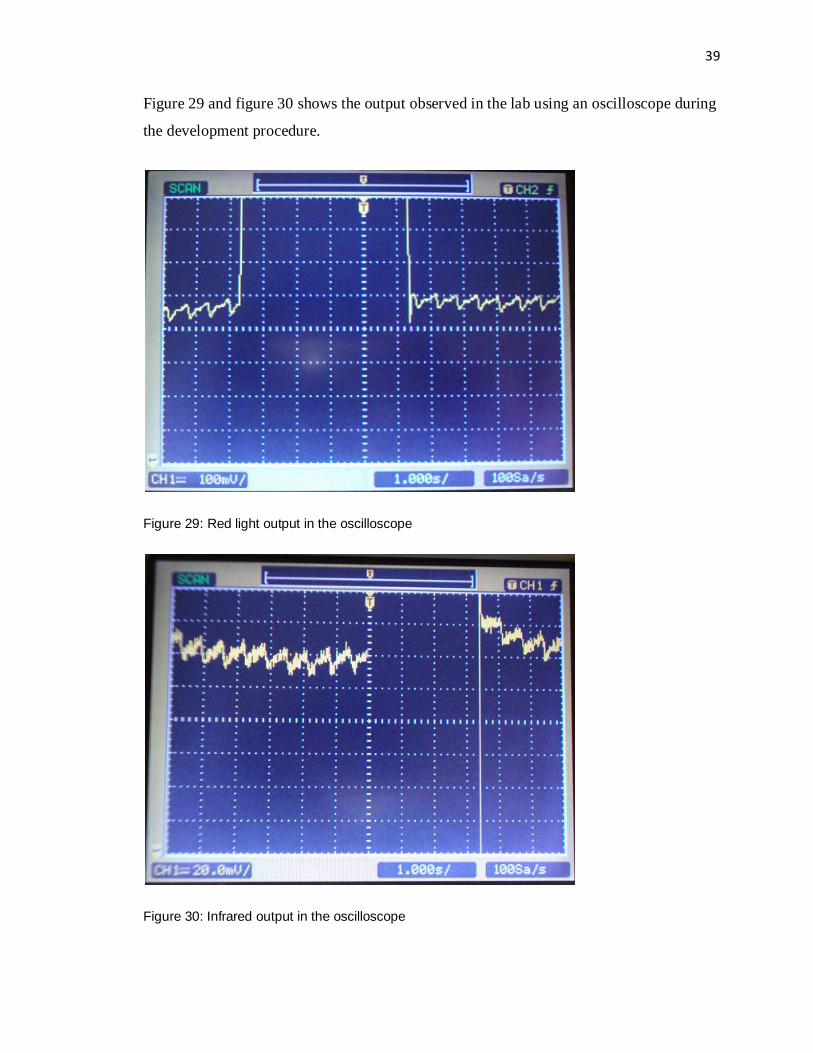
The LED in this circuit was powered using a function generator with square wave of 6V
peak-peak amplitude and 100mHz frequency. Therefore each cycle with the each LED
being „ON‟ once was 10 seconds.
Figure 29 and 30 in appendix C shows the output of the hardware on a oscilloscope
obtained during the development procedure.
4.3 Data Collection and software development
For the software requirement for this project, the data needed was collected using
LabVIEW. The LabVIEW input probe was connected directly to the output of the signal
amplifier. The sampling frequency was set to 1000 samples/s. The data collected was in
the form of a digital time series and was used directly by the designed software.
The data collected by LabVIEW was saved in a text file. This file was used as the input
for the software. The manipulation steps are described below. The following description
is for execution of the software. The software matches the flowchart in figure 10.
4.3.1 Division of Data
The data collected contained several square wave pulses depending on the total test time.
The higher part of the square wave contained information regarding the infrared data and
19
the lower portion contained the red data. The data collection in LabVIEW did not start at
the beginning of a square wave pulse. Therefore, for calculating SaO2 only the complete
pulse sequences were selected starting with the red light sequence. The incomplete cycle
at the end was also eliminated at the revision process.
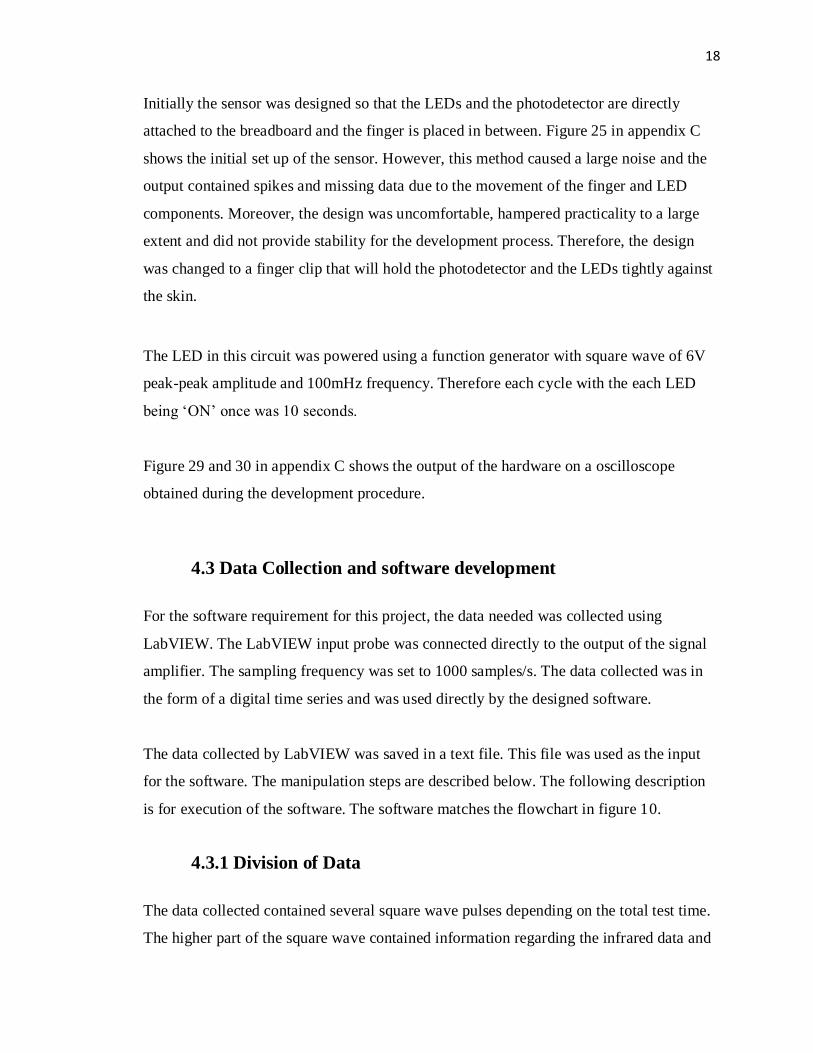
Figure 12 contains data for a test that was approximately 140 seconds long. Figure 13
shows data that had been revised and selected for the calculation. The signal appearing in
figure 13 did not contain any incomplete cycle. The amount of neglected data was less
than 20 seconds in duration regardless of the test constraint as only two incomplete cycles
were eliminated. Note that one cycle is 10 seconds long.
Figure 12: Actual Data (Collected from the output of the hardware circuit)
0 20 40 60 80 100 120 1400.5
1
1.5
2
2.5
3
3.5
4
4.5Data collected from Vout of the circuit
time (s)
Voltage f
rom
Vout,
(V
)
20
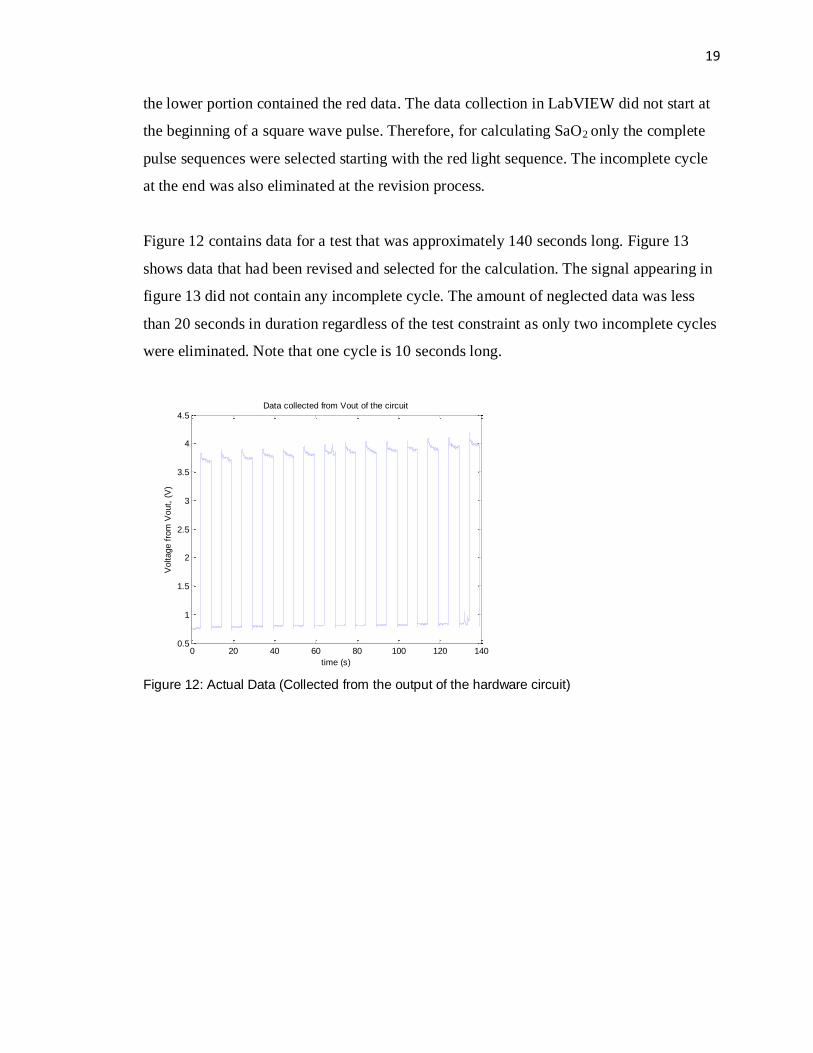
Figure 13: Revised Data (Only containing complete LED pulses)
After the useful data was selected, every pulse sequence was divided into red and infrared
subsets. Before applying equation (2) to the dataset, the infrared and the red signals were
normalized. As the DC offset of the IR signal was higher, the IR signal was the only one
normalized to the level of the red signal.
IRnorm = IR − meanIR − meanR − − − −(5)
Where,
IRnorm = normalized IR signal
IR = Collected infrared signal
meanIR = mean value of the IR signal
meanR = mean value of the Red signal
Equation 5 was used in the normalization process. After the signal was normalized, the
peaks were detected and stored for further calculation.
0 20 40 60 80 100 1200.5
1
1.5
2
2.5
3
3.5
4
4.5Revised Data (only contains complete pulses)
time (s)
Voltage,
(V)

21
Figure 14: Red and infrared data separated (not normalized)
Figure 15: Red and infrared data separated and normalized
Figure 14 shows the data before normalization and Figure 15 shows the data after
normalization. The red and green dots shown are the markers of the detected peaks. These
0 500 1000 1500 2000 2500 3000 3500 4000 45003.8
3.85
3.9
3.95
4
Out
put
Vol
tage
, V
Output Pattern Due to Infra-Red LED
0 500 1000 1500 2000 2500 3000 3500 4000 45000.8
0.81
0.82
0.83
0.84
Time (ms)
Out
put
Vol
tage
, V
Output Pattern Due to Red LED
0 500 1000 1500 2000 2500 3000 3500 4000 45000.75
0.8
0.85
0.9
0.95
Out
put
Vol
tage
, V
Output Pattern Due to Infrared LED
0 500 1000 1500 2000 2500 3000 3500 4000 45000.8
0.81
0.82
0.83
Time (ms)
Out
put
Vol
tage
, V
Output Pattern Due to Red LED

22
peaks provided information regarding the heart rate calculation as well as the variables
for equation 2.
4.3.2 Calculating Heart Rate and SaO2
The peaks from the previous step were used to calculate SaO2 by using equation (2) and
(3). Heart rate was calculated using equation (4). The software was designed so that the
heart rate was averaged for the entire dataset and outputted as a mean result for the total
study period. The SaO2 was outputted as a time series for every pulse and approximate
entropy analysis was done on the stated time series.
4.3.3 Approximate Entropy Calculator
The calculator developed to calculate ApEn followed the algorithm described in appendix
A. A pre-solved example was used to test the validity of the designed software. The time
series that was used for the testing purpose was a periodic time series for which the
duration of each period was 5 seconds. For one period, the time series was x(t) = [ 61, 62,
63, 64, 65] and the duration of the total series was 50 seconds. The approximate entropy
of the time series for m = 5 and r = 2 was given as 0.00189 [9]. The designed MATLAB
software was used to calculate the approximate entropy of the same time series where the
result was 0.0019, thus proving the computational validity.
4.4 Challenges During Experiment and Sources of Error
Several challenges were faced during the experiment and development procedure. Many
of the data sets contained peaks that did not match the expected waveform. Experiments
show that these types of peaks appeared during excessive motion of the finger.
23
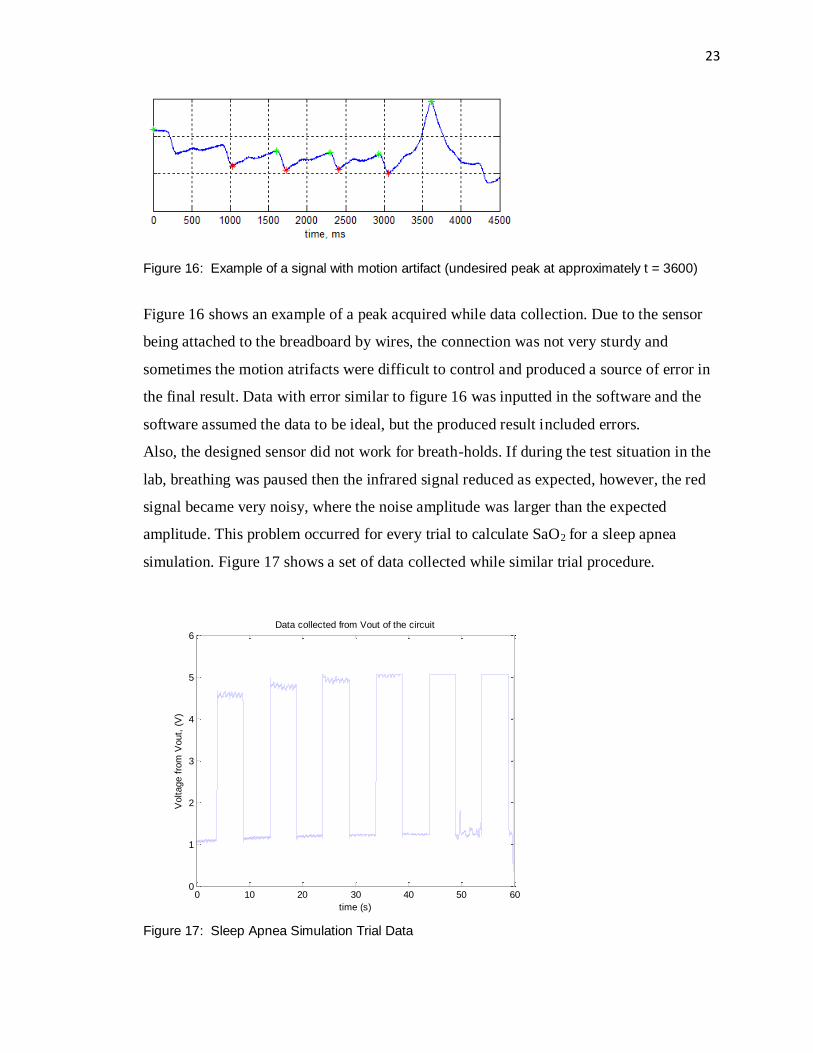
Figure 16: Example of a signal with motion artifact (undesired peak at approximately t = 3600)
Figure 16 shows an example of a peak acquired while data collection. Due to the sensor
being attached to the breadboard by wires, the connection was not very sturdy and
sometimes the motion atrifacts were difficult to control and produced a source of error in
the final result. Data with error similar to figure 16 was inputted in the software and the
software assumed the data to be ideal, but the produced result included errors.
Also, the designed sensor did not work for breath-holds. If during the test situation in the
lab, breathing was paused then the infrared signal reduced as expected, however, the red
signal became very noisy, where the noise amplitude was larger than the expected
amplitude. This problem occurred for every trial to calculate SaO2 for a sleep apnea
simulation. Figure 17 shows a set of data collected while similar trial procedure.
Figure 17: Sleep Apnea Simulation Trial Data
0 10 20 30 40 50 600
1
2
3
4
5
6Data collected from Vout of the circuit
time (s)
Voltage f
rom
Vout,
(V
)

24
5. Results
The result of the developed device can be divided into three sections. The first set is
series of SaO2 for the entire test procedure. This result is not important for the patient‟s
viewing therefore the software does not generate a noticeable output containing SaO2
information. However, this series might be important to a medical professional to assess
the patient‟s situation. The second set of result is the approximate entropy and the risk
warning for a certain dataset. The risk warning is the most important result for a patient
without a medical background. The third result is the heart rate for overnight study.
5.1 SaO2
By using the data from figure 13, the following SaO2 series was found. Note that the
series contains 12 elements. This is due to the fact that the useful signal (Figure 13)
duration was 120 seconds with each pulse being 10 seconds long. Each SaO2 value
corresponds to one cycle of red and infrared light.
Table 5: SaO2 time series example (Data collected from the output of the designed
software)
Cycle # SaO2 (%)
1 99.6092
2 99.8450
3 97.6656
4 97.9422
5 97.5168
6 98.8377
7 98.3776
8 97.7214
9 98.5778
10 99.2596
11 98.3312
12 98.6281
For a normal human being, the blood oxygen saturation is 90% - 100% therefore the
collected data was considered correct.

25
5.2 Sleep Apnea Detector
Due to the limitations in the sensor, the data could not be collected for a long period of
time. For the test dataset, the data was collected for a little over than 2 minutes. This
situation did not depict the actual test situation because a sleep study needs to be
conducted for longer. Therefore to test the sleep apnea detection methodology, the data
was repeated 100 times therefore the SaO2 in the sleep apnea test was for 12000 seconds
or 200 minutes. Figure 18 shows the SaO2 time series that was the same as table 5 but
repeated and was used in the ApEn calculator. The approximate entropy of the data was
calculated to be 0.40546. As discussed earlier, sleep apnea is noted to be positive for
approximate entropy higher than 0.8, therefore this case shows “normal” as a result. The
output of the designed device includes two windows shown in figure 19 and figure 20
showing the summary of the sleep study.
Figure 18: SaO2 time series for a healthy case scenario
0 20 40 60 80 100 120 140 160 180 2000
10
20
30
40
50
60
70
80
90
100
SaO
2 (
%)
time, minutes

26
Figure 19: ApEn result for a healthy case scenario
Figure 20: Overall condition of the healthy case scenario
Figure 1 (b) shows the pattern of SaO2 fluctuation for a sleep apnea positive scenario.
Similar dips in the SaO2 time series were simulated to test the approximate entropy
calculator. Also it can be observed in figure 1 that the overall SaO2 data (other than the
dips during apnea attack) is a little lower and noisier in the sleep apnea case therefore an
overall reduction was introduced in the data where the reduction parameter varied
randomly from 1%- 6% thus creating an extra noise component.
27
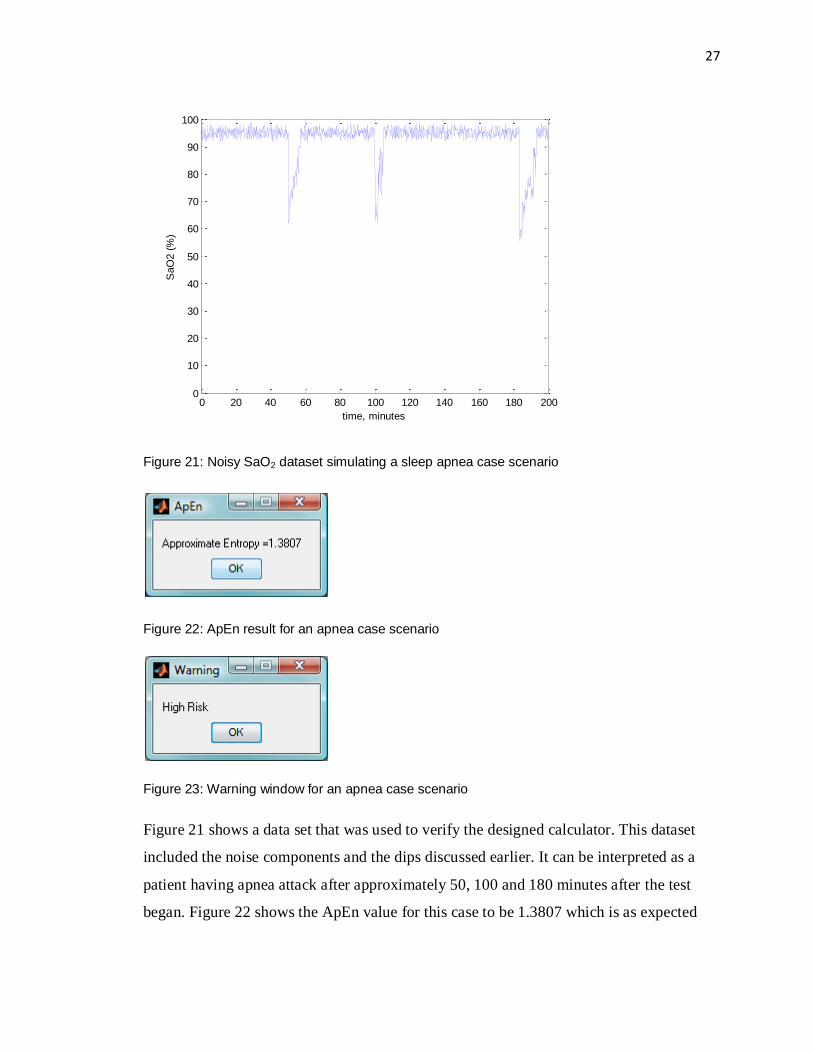
Figure 21: Noisy SaO2 dataset simulating a sleep apnea case scenario
Figure 22: ApEn result for an apnea case scenario
Figure 23: Warning window for an apnea case scenario
Figure 21 shows a data set that was used to verify the designed calculator. This dataset
included the noise components and the dips discussed earlier. It can be interpreted as a
patient having apnea attack after approximately 50, 100 and 180 minutes after the test
began. Figure 22 shows the ApEn value for this case to be 1.3807 which is as expected
0 20 40 60 80 100 120 140 160 180 2000
10
20
30
40
50
60
70
80
90
100
SaO
2 (
%)
time, minutes
28
very high as the simulated apnea attacks are very close to each other. For this type of
results the software generates a „High Risk‟ warning (figure 23).
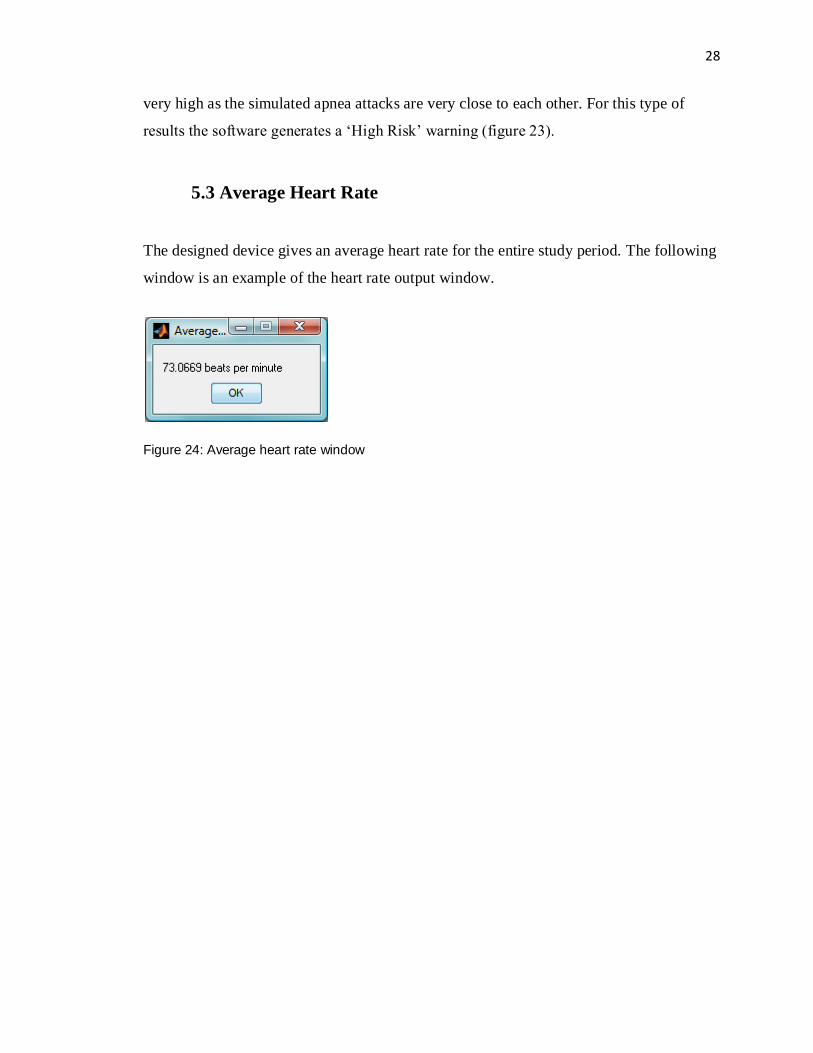
5.3 Average Heart Rate
The designed device gives an average heart rate for the entire study period. The following
window is an example of the heart rate output window.
Figure 24: Average heart rate window
29
6. Future Development
Several upgrades can be made in the obtained device that will increase efficiency. If all
the upgrades are properly installed then a few features can be added to improve the
usability of the device. These features and upgrades are discussed in the following
subsections
6.1 Possible Upgrades
For the scope of this project, the red and infrared LEDs of the sensor were powered using
a function generator. This practise caused addition of one extra equipment and hampered
practicality. Use of a 555 timer chip to generate a similar square wave can eliminate the
use of the function generator and make this device more practical. [15]
LabVIEW was used to transfer data from the output of the circuit to the software. This
procedure is not efficient as the data transfer is happening in real time and a wire
connection is introduced from the test subject to a computer adding constraint and
discomfort. Moreover, LabVIEW is not a common software and for this project, it is only
practical to be used in the development procedure. The data transfer can be done using
wireless or Bluetooth which will reduce the discomfort factor. Nowadays, Bluetooth and
wireless receivers are common in personal computers and cellular phones. This upgrade
might create an easy solution but introduce additional expenses, higher processing power
and the requirement of a special receiver. A more economic solution of this problem is
attaching a memory card to the hardware design that will store the data for further transfer
to a suitable calculating module such as a laptop, PDA or cellular phone.
To reduce cost of this project, a cloth‟s pin was used as the base of the finger clip sensor.
For the scope of the project, this arrangement was sufficient however improvements in
the finger clip must be made to obtain better results. The two major problems with this
design were ambient light interference and motion artifact. The ambient light effect can
be reduced by adding a cover to the finger clip design. The motion factor was mainly
created by the movements of the wires in the breadboard and movement of LEDs due to

30
abrupt motion of the finger. The wire factor can be eliminated by attaching the wires to a
printed circuit board. The finger motion factor is more serious as this type of movement is
common during sleep. This problem can be reduced by either using a finger clip that
holds the finger from all sides or by attaching the sensor system to a glove that will be
worn during the sleep study.
6.2 Additional Features
Given that the previously mentioned upgrades and solutions are applied, the following
features could be added to the device to make it more efficient.
The designed device can be used for monitoring purpose therefore adding a real time
display monitor can prove to be beneficial. Also, people with higher probability of sleep
apnea might want to communicate their results with medical professional. A system can
be developed that will email the overnight study result to the management facility of the
medical records.

31
7. Conclusion
The device developed in this project is a successful prototype that correctly predicts sleep
apnea risk. However, it must be noted that this prototype device is not a replacement for
the current detection methods for sleep apnea. More research needs to be conducted to get
stronger connection between SaO2 and AHI to obtain a more accurate testing system for
OSA. This device can also be used for a few other purpose other than sleep apnea sleep
study. It can also be used for monitoring patients with breathing disorder as well as other
illness that might affect SaO2. It can also include features that will allow it to measure the
progress in sleep apnea treatment.
The primary goal of the project is successfully accomplished but there were assumptions
that were used to bypass a few presented problems. The pulse oximeter designed only
worked for a healthy human being and could not produce results for a sleep apnea case.
The output of this project is very similar to the expectations. The major shortcomings
were mostly caused by simplification in the oximeter design. Given enough resources to
overcome the aforementioned issues, this prototype can be practically used for both
medical and research needs.
Overall, this project provided deeper understanding of various biomedical engineering
concepts such as sensor design, instrumentation procedure as well as challenges faced as
an engineer. It definitely created a profound appreciation for the field and understanding
of a complete project construction.

32
Appendix A
Approximate Entropy [5], [9]
Approximate entropy, ApEn is a statistical tool that quantifies the fluctuation
unpredictability of a time series. Higher ApEn value of a time series means higher
irregularity in the data.
Two important parameters in calculation ApEn of a time series are, tolerance window, „r‟
and run length or pattern length „m‟. To summarize, ApEn measures the possibility of a
run patterns to close within the same tolerance window „r‟.
In the following steps, the calculation of ApEn will be developed assuming a time series x
that has N elements.
Step1: The time series x is divided into N-m+1 subseries using the following equation
𝑋 𝑖 = [𝑥 𝑖 ,𝑥 𝑖 + 1 , … . ,𝑥(𝑖 + 𝑚 − 1),
Where, i =1,2,.....N-m+1 and X represents the constructed subseries
Step 2: A matrix Nm of size [(N-m+1) x 1] is formed where N(i) represents number of
existing subseries X that are similar to X(i). In this case, the parameter „r‟ is used to
determine similarity. Two of the subseries is considered similar, if the difference between
each element of the two subseries is less than or equal to r.
Step 3: Another matrix C is formed where,
𝐶 = 𝑁𝑚
(𝑁 −𝑚 + 1)

33
Step 4: A parameter Φ that represents the mean of the values of the matrix C.
Step 5: Step 1 to 4 is repeated once for m = m+1
Step 6: Approximate entropy is calculated using the following equation
𝐴𝑝𝐸𝑛 =𝛷𝑚
𝛷𝑚+1

34
Appendix B
Design of the LPF and Amplifier [16], [17], [18]
Low Pass filter
The filter used in this case was a 2nd
order low pass Bessel filter using Sallen-Key
topology with 10 Hz cut-off frequency.
Figure 31: Unity gain low pass filter [17]
The condition of selecting C1 and C2 is,
C2 ≥ C1x4b
a2− −−− − (6)
If C1 and C2 are preselected then the resistors can be calculated using,
𝑅1,2 = 𝑎𝐶2 ∓ 𝑎2𝐶2
2 − (4𝑏𝐶1𝐶2)
4𝜋𝑓𝑐𝐶1𝐶2
− −−− − (7)
In this case,
a = 1.3617
b = 0.6180

35
fc = 10 Hz
If C1 and C2 are selected to be 2.2μF and 4.7μF respectively, the condition given by
equation 6 is satisfied. Using equation 7 and the capacitor values, R1 = 1.94kΩ, R2 =
7.9kΩ
However considering availability, the selected resistor values were, R1 = 2.2kΩ, R2 =
7.4kΩ
Non-inverting amplifier
The following non inverting amplifier design was used for the hardware
Figure 32: Non inverting amplifier
Selected gain = 10
The following equation is used to calculate gain of the amplifier.
𝐺𝑎𝑖𝑛 = 1 +𝑅2
𝑅1
R2 was selected as 5kΩ

36
Therefore,
𝑅1 =𝑅2
𝐺 − 1
R1 = 555.56Ω
Due to availability the R1 for the non inverting amplifier is selected to be 500Ω which
changed the gain to 11. This minor mismatch of result does not affect the output.

37
Appendix C
Hardware Images
The following images were captured in the laboratory during the development procedure
Figure 25: Initial set up of the sensor
The figure above shows how the sensor was set up at the beginning of the design process.
The LED was on top of the finger and attached directly to the breadboard and the
photodetector was on the opposite side also attached directly to the breadboard. The
following figure (figure 26) shows the upgraded design of the test sensor. The red and
infrared LED was attached to one side of a cloth‟s pin and the photodetector was attached
on the other side. Also long wires were soldered to the ends of the photodetector and the
LEDs providing a bigger motion space for the finger during a test procedure. Figure 27
shows the how the finger should be connected to the sensor.
38
Figure 26: Picture of the sensor
Figure 27: Picture of the sensor in use
Figure 28: Picture of circuit
39
Figure 29 and figure 30 shows the output observed in the lab using an oscilloscope during
the development procedure.
Figure 29: Red light output in the oscilloscope
Figure 30: Infrared output in the oscilloscope

40
Appendix D
Parts used in the device development procedure
Table 6: Completer parts list
Part Price ($) Available at
Red Led, RL5-R5015 0.24 www.superbrightleds.com
Infrared LED, SIR-320ST3F 1.06 www.digikey.com
Photodetector, BPW24R 3.83 www.digikey.com
OP491 6.98 www.digikey.com
Resistors 5.00 (approx.) Assorted pack
Capacitors 3.00 (approx.) Nutech Electronics
Function Generator N/A Course Laboratory
Oscilloscope N/A Course Laboratory
Breadboard N/A Course Laboratory
LabVIEW data aquisation system N/A Course Laboratory

41
References
[1] “Obstructive Sleep Apnea”. Internet:
http://www.nlm.nih.gov/medlineplus/ency/article/000811.htm, Aug. 21, 2009 [Sept. 28,
2009]
[2] C. Armon, MD, MSc, MHS , A. Roy, MD and W. J. Nowack, MD.
“Polysomnography: Overview and Clinical Application”. Internet:
http://emedicine.medscape.com/article/1188764-overview, Mar 30, 2007 [Oct 2, 2009]
[3] R.F. Mould, C.G. Orton, J.A.E. Spaan, J.G. Webster. Design of Pulse Oximeters.
Taylor & Francis Group, New York, 1997, pp.6-7,13-19, 34-51, 139-143
[4] “Sleep Apnea Often Goes Undiagnosed”. Internet:
http://www.ctv.ca/servlet/ArticleNews/story/CTVNews/20070319/sleep_apnea, Mar. 20,
2009 [Feb. 18, 2009]
[5] R. Hornero, D. Álvarez, D. Abásolo, F. Campo and C. Zamarrón. “Utility of
Approximate Entropy from Overnight Pulse Oximetry Data in the Diagnosis of the
Obstructive Sleep Apnea Syndrome”, IEEE Transactions on Biomedical Engineering,
Vol. 54, No. 1, January 2007, [September 15, 2009]
[6] “Oxygen Saturation Normal Range”. Internet:
http://www.electrical-res.com/oxygen-saturation-normal-range/, June 22, 2009 [Oct 2,
2009]
[7] “Principles of Pulse Oximetry Technology”. Internet:
http://www.oximetry.org/pulseox/principles.htm, [September, 2009]
[8] R.B. Northrop. “Pulse Oximetry” in Noninvasive Instrumentation and Measurement
in Medical Diagnosis. CRC Press, 2002, pp 397-404.

42
[9] G.B.Moody. “Approximate Entrope, ApEn”. Internet:
http://www.physionet.org/physiotools/ApEn/, [Oct.4,2009]
[10] “Photodiode Light Detector”. Internet
http://hyperphysics.phy-astr.gsu.edu/hbase/Electronic/photdet.html, [Oct. 5, 2009]
[11] “5mm LED RL5-R5015 Specifications”. Internet:
http://www.superbrightleds.com/cgi-
bin/store/index.cgi?action=DispPage&Page2Disp=%2Fspecs%2Fr5015_specs.htm,
[Deceember, 2009]
[12] SIR-320ST3F, Infrared Light Emitting Diode, Datasheet.
Internet: http://www.rohm.com/products/databook/s/pdf/sir-320st3f.pdf [November 2009]
[13] Silicon PIN Photodiode, BPW24R, datasheet. Internet:
http://search.digikey.com/scripts/DkSearch/dksus.dll?WT.z_header=search_go&lang=en
&site=us&keywords=BPW24R&x=9&y=24 [November 2009]
[14] Op491 datasheets. Internet:
http://www.analog.com/static/imported-files/Data_Sheets/OP191_291_491.pdf
[15] “555 Timer IC”. Internet: http://en.wikipedia.org/wiki/555_timer_IC, Apr 7, 2010
[Apr 9, 2010]
[16] R.B. Northrop. “Analog Active Filter Applications Using Conventional Op-Amps”
in Introduction to Instrumentation and Measurements. 2nd
ed. CRC Press, 2005, pp 54-65
[17] Active Filter Design Technique.pdf, Texas Instruments. Provided as course material
for Elec Eng 4BD4, Biomedical Instrumentation.

43
[18]Non-inverting Amplifier. Internet:
http://www.freecircuits.net/images/pages/index.22.gif, [November 2009]
[19] D.S. Morillo, J.L.Rojas, L.F.Crespo, A.Leon, N.Gross. “Poincar´e analysis of an
overnight arterial oxygen saturation signal applied to the diagnosis of sleep apnea
hypopnea syndrome”. Physiological Measurements, vol 30. Available at:
http://iopscience.iop.org/0967-3334/30/4/005/, [September, 2009]

44
VITA
NAME: Naheed Baksh
PLACE OF BIRTH: Dhaka, Bangladesh
YEAR OF BIRTH: 1987
HONOURS and AWARDS: Dean‟s Honour List 2005
McMaster University Entrance Scholarship