Embed Size (px)
Citation preview

ASW2: "Integration of Functional and Taxonomic
Diversity."
October 2003St Louis, MO, USA

What is Bio. M. E. R. G. E.?
In a nutshell:Bring together those that study the diversity of our biota with those that study its functioning.
BioticMechanisms ofEcosystemRegulation in theGlobalEnvironment

What is Bio. M. E. R. G. E.?
• 5 year Research Coordinating Network• Funded by NSF• Some co-functions with GCTE and DIVERSITAS• 20 core participants• > 60 general participants• Inclusive: open to all interested parties• Mechanism for interaction: Adaptive Synthesis
Workshops

BioMERGE Mission
• Given just two things:1. An inventory of species2. Geography
• Can one state what the likely significance of biodiversity is to the region’s ecosystem functions?
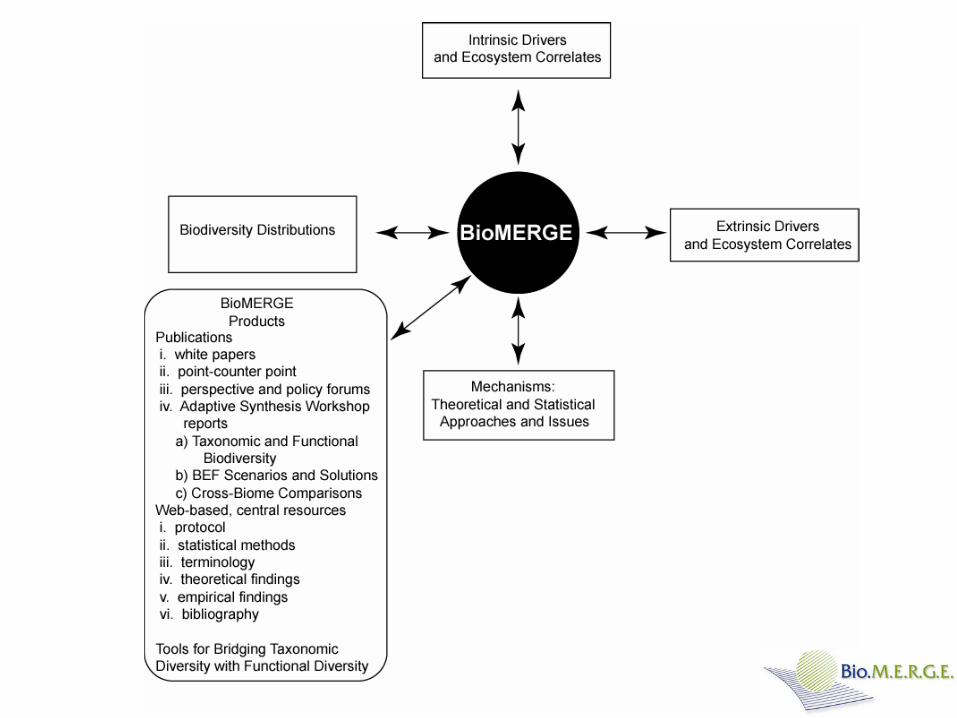
Results from ASW1

• Policy is made even in the absence of scientific information
• We know human accelerated environmental change affects biodiversity
• We know biodiversity affects ecosystem functioning
• How do we effectively synthesize and communicate this knowledge
Sala et al. 2000
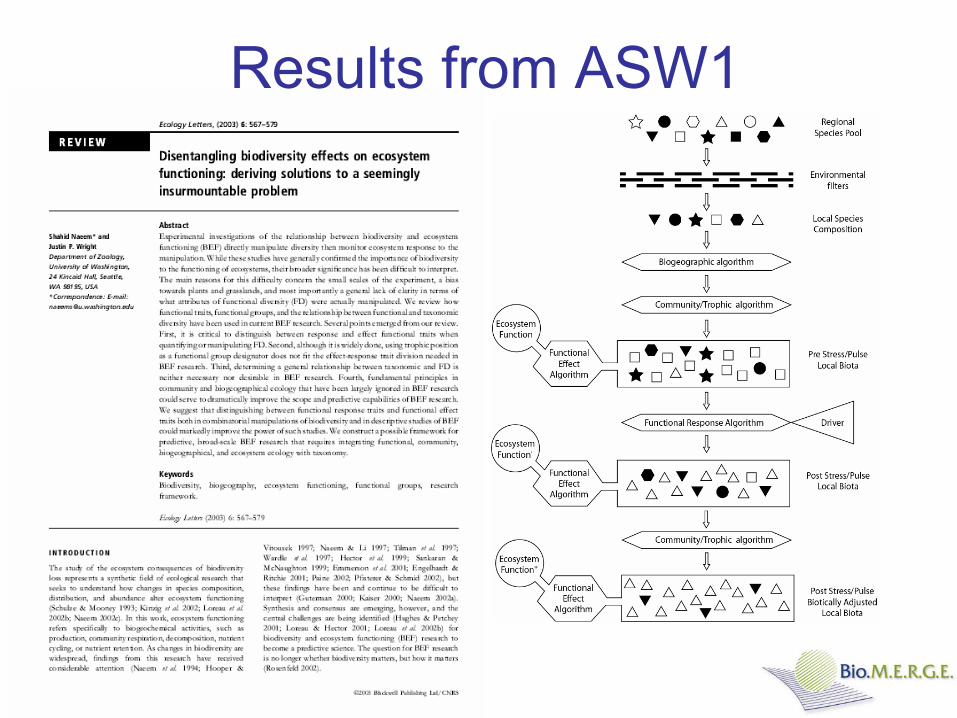
Objective for ASW2
Translate
i.e. Begin process of translating conceptual model into useful output using existing data on species distributions, functional traits and diversity/ecosystem function relationships

Goals for ASW 2• Identify 3-4 data sets where we have data on biota,
their effect and response traits, and measures of ecosystem functioning (may require synthesis of large biotic inventories with trait data)
• Derive effect and response algorithms for these data sets
• Predict new levels of ecosystem function given addition of a driver to the system (how much does biodiversity matter?)
• Critically evaluate of proxies/shortcuts (e.g. FD, functional groups, scaling relationships)
• Identify key gaps in our data/model

Challenges for ASW2
• How far can we get using readily available data?
• What data are necessary to fully implement model?
• Can we get these data?• If not are there ways around this?• Can we produce useful product?

Workshop Structure
Aquatic
Katia Engelhardt
Brad Cardinale
Amy Downing
Martin Solan
Jonathan Chase
Jennifer Ruesink
Diane Srivastava
TropicalJason Bradford
Rob Colwell
Ivette Perfecto
Mahesh Sankaran
Oliver Phillips
Po Garden
Peter Raven
Jim Solomon
GrasslandsAndy Hector
Jason Fridley
Jennie McLaren
Natalia Perez-Harguindeguy
Clarence Lehman
David Hooper
Amy Symstad
Justin Wright
TheoreticalShahid Naeem
Jennifer Hughes
Sandra Lavorel
Sandra Diaz
Claire Jouseau
Peter Morin
Owen Petchey

Aquatic Group: Data• Dataset on benthic
community of Galway Bay, Ireland. 2 sites, many sampling dates
• Functional classification of species based on body size, burrowing depth, reworking mode
• Response: Biotic Mixing Depth (BMD)
Sediment profiles from unpolluted (left) and polluted (right) sites in Galway Bay. Note shallower depth of BMD in polluted site due to lower functional diversity of bioturbators.
Photos and data courtesy of M. Solan

Aquatic Group: Progress• Developed relationship
between community bioturbation potential (BP) and Biological Mixing Depth (BMD)
• Explored effects of biodiversity loss via – Random species loss– Body size model (largest
species first)– Abundance model (rarest
species first)– Pollution model (sensitive
species first)

Aquatic Group: Next Steps
• Allow for compensation within and among functional groups following extinction
• Couple benthic and pelagic food webs
• Increase scale by using same analysis on data from Chesapeake Bay that has greater spatial and temporal extent

Grasslands Group: Data• Data primarily from Cedar Creek
(MN) BioCON experiment
• Measurements of many functional traits on most species in experiment made by Craine et al 2002
• Response: Above-, below-ground productivity, N retention, % transmittance. Can use N and CO2 treatments to examine effects of changing drivers.
http://www.lter.umn.edu/biocon/
Craine et al. 2002. Functional traits, productivity and effects on nitrogen cycling of 33 grassland species. Functional Ecology 16:563-574

Grasslands Group: Progress• Developed 3 models of “Functional Effects Algorithms” (FEAs)
1. Determine EF of each species in monoculture. EF of mix = biomass weighted sum of EFs of constituent species
2. Incorporates species interactions: EF of mix = determined by EF of constituent species in mix rather than in monoculture
3. Incorporates “trait density” measures – i.e. traits where dispersion of values is more important than mean of values (e.g. rooting depth and phenology)
• Traits identified as important in regulating ecosystem function in large-scale studies (e.g. SLA) not significant predictor at local scale
• Hypothesis – environment selects for minimal variation in key traits that are important at broad scale. Other traits are moreimportant at controlling small-scale variability in ecosystem functioning.

Grasslands Group: Next Steps• Clean up data from BioCON experiment and fill in
functional trait “holes”• Develop appropriate “trait density” statistics• Select traits for model based on mechanistic
assumptions• Compare 3 FEA models & success of functional traits
selected based on local analysis vs. large-scale analysis• Potential future papers looking at FEAs when confronted
with altered drivers; look across ecosystems to determine what functional traits are important for determining ecosystem functioning

Tropical Group: Data• RAINFOR data set: 1 ha
plots surveyed 9-23 years – all individuals mapped and measured
• Traits: wood density (taxonomic), pioneer index, cation association, moisture association, N-fixer (taxonomic)
• Response: Changes in distribution/composition & biomass accrual
http://www.geog.leeds.ac.uk/projects/rainfor

Tropical Group: Progress
• Integration of trait data base• Recognition of orthogonal functional traits:
pioneer index (measured by wood density) and size (measured by basal area)
• Used long-term data to estimate how increases in CO2 affect distribution of functional traits – small decrease in median wood density

Tropical Group: Next Steps
• More refined trait measurements (e.g. wood density for all species)
• Estimate standing forest biomass and turnover rates given changes in distribution of functional traits
• Incorporate additional drivers (wood harvesting)• More efficient database design to allow for
further analyses• Incorporate stem data from more recent surveys

Theoretical Group: Principles• A fundamental theoretical BEF framework
founded on basic ecological principles would serve to integrate findings from the case studies (aquatic, grassland, and tropical)
• A theoretical framework needs to integrate principles from
– Community ecology• Eltonian pyramid• Trophic structure/dynamics• Scaling rules• The niche• The biotope
– Ecosystem ecology• Abiotic constraints on ecosystem/biogeochemical
processes• Coupled patterns of material cycling and energy flow
– Biogeography• “Log-normalish” patterns of distribution and
abundance• Gradient effects• Island effects

Theoretical Group: Progress• We developed a theoretical
BEF framework that can be examined by simulation
• We developed an algorithm for constructing the biogeographicmatrix that creates a biota consistent with biogeographical principles
• We developed an algorithm for constructing the response-effect matrix that structures the biota consistent with community and ecosystem principles

Theoretical Group: Next Steps• Conduct simulations and compare
findings with current empirical evidence
• Refine framework and improve precision
• Restructure framework for grasslands, tropical, and estuarine systems
• Simulate four scenarios– Type I. Invasion. New species
are added from other ecosystems.– Type II. Over-exploitation.
Dominant species are over-exploited.
– Type III. Random extinction. No particular driver is considered.
– Type IV. Forced. Increasing eutrophication.
ASW2 Conclusions• Significant progress made in translating measures of
biodiversity and functional traits into ecosystem function in some ecosystems
• Generally, datasets that allow for this are rare• Need more complete measures of functional traits of
species• Need better measurements of role of functional diversity
in controlling ecosystem functioning• Significant progress was made in refining the theoretical
framework for BEF• Need to test framework by model building and simulation