Embed Size (px)
Citation preview
Freshwater fish functional and taxonomic diversityabove and below Niagara Falls
Karl A. Lamothe & Justin A. G. Hubbard &
D. Andrew R. Drake
Received: 29 May 2020 /Accepted: 25 October 2020# Her Majesty the Queen in Right of Canada 2020, corrected publication 2021
Abstract The Niagara River, which connects twoGreatLakes (Erie and Ontario) and forms a border betweenCanada and the United States, has experienced decadesof abiotic and biotic disturbance as well as long-termrestoration efforts. Given the iconic riverscape and im-portance as a binational fisheries resource, a biodiversityassessment of the mainstem Niagara River fish assem-blage is overdue. Here, fish assemblage and habitat datafrom a standardized boat electrofishing program of theNiagara River were combined with species trait datarelated to substrate associations, diet preferences, repro-ductive strategies, and body size to quantify biodiversitypatterns among river sections (sites above and belowNiagara Falls), seasons (spring, summer, fall), and years(2015–2017). Sixty-five species were capturedrepresenting a variety of trait combinations. Significantdifferences in functional dispersion and divergence (i.e.,functional diversity) were observed between river sec-tions, seasons, and (or) years. The fish community cap-tured in the lower river in spring 2015 had both the
highest average functional dispersion (2.08 ± 0.32 SD)and divergence (0.88 ± 0.04 SD) compared to the otherseasonal sampling efforts, but relatively few fishes werecaptured (n = 686). Although non-native fishes repre-sented a small portion of the catch over the 3 years(8.6% of catch), the seasonal presence (spring and fall)of mostly introduced large-bodied salmonids expandedfunctional trait space in the lower river during theseperiods. The importance of rare species on functionaldiversity metrics suggests further insight on local spe-cies detection probabilities is needed to understand ifdifferences in functional diversity reflect ecological pat-terns or are driven by sampling design.
Keywords Biodiversity . Great Lakes . Large rivers .
Non-native species .Multivariate
Introduction
Biodiversity assessments are often used to inform spe-cies conservation and habitat management, but havetraditionally focused on taxonomic metrics of diversitydependent on evolutionary history (e.g., species rich-ness). Although maintaining species richness increasesthe likelihood that ecosystem function will be preservedwhen disturbance occurs (i.e., insurance hypothesis ofbiodiversity; Yachi and Loreau 1999), traditional taxo-nomic metrics do not always correlate with the suite ofecological functions present in a community (Cadotteet al. 2011). As such, functional diversity metrics weredeveloped to help characterize what species do in the
https://doi.org/10.1007/s10641-020-01044-w
Supplementary Information The online version containssupplementary material available at https://doi.org/10.1007/s10641-020-01044-w.
K. A. Lamothe (*) : J. A. G. Hubbard :D. A. R. DrakeGreat Lakes Laboratory for Fisheries and Aquatic Sciences,Fisheries and Oceans Canada, Burlington, Ontario, Canadae-mail: [email protected]
Present Address:J. A. G. HubbardDepartment of Physical & Environmental Sciences, University ofToronto Scarborough, Scarborough, Ontario, Canada
/ Published online: 5 November 2020
Environ Biol Fish (2021) 104:637–649

environment and how species traits contribute to eco-system functioning (Tilman 1999; Mason et al. 2005;Petchey and Gaston 2006; Laliberté et al. 2010).
Quantifying changes in functional diversity overspace and time, and the traits that support these metrics,can reveal the mechanisms underlying changing com-munity and ecosystem dynamics. For example, func-tional diversity metrics have been used to understand themechanisms leading to species extinctions (Cardinaleet al. 2012), to evaluate the success of managementactions and inform environmental protection efforts(Ikin et al. 2019), and to estimate the vulnerability ofecosystems to the effects of future disturbance (Mouillotet al. 2013a). Furthermore, functional diversity metricscan be used to identify species that are functionallyredundant in an ecosystem due to similar feeding, re-productive, and (or) behavioural attributes (Lamotheet al. 2018), or alternatively, species that have dispro-portionately large roles in maintaining ecosystem func-tion due to unique functional attributes (Mouillot et al.2014). However, local increases in functional diversityor redundancy can also be caused by the introduction ofnon-native species (Campbell and Mandrak 2017;Toussaint et al. 2018) that may or may not be detrimen-tal to the persistence of local biota. Combining tradi-tional taxonomic metrics with functional diversity met-rics can therefore provide a more robust understandingof local and regional biodiversity patterns (Cadotte2011).
The Laurentian Great Lakes are among the largestinterconnected freshwater ecosystems on Earth andhave experienced considerable abiotic and biotic chang-es over the last century. Paradigmatic of these changes isthe freshwater fish assemblage, as over 30 non-nativespecies have established in the Great Lakes, at least fivespecies have gone extinct, and almost two dozen havebeen extirpated (Mandrak and Cudmore 2010; Rothet al. 2011). As fish species richness (Roth et al. 2011)and functional diversity (Campbell and Mandrak 2017)have increased in the Great Lakes basin over the lastcentury due to non-native species introductions, theabundance and distribution of many native species with-in individual lakes and their connecting channels (i.e.,Niagara River, Detroit River, St. Clair River) havechanged. In an effort to improve fish community struc-ture and function in the Great Lakes basin, long-termbinational restoration actions in 42 “Areas of Concern(AOC)” were undertaken (Hartig and Thomas 1988;Hartig et al. 2020). Examples of restoration efforts
included remediation of contaminated sediment, habitatenhancement projects, and pollution prevention efforts(Hartig et al. 2020). Given the long-term abiotic andbiotic changes, quantifying present-day freshwater fishfunctional and taxonomic diversity within these AOCsmay offer insight into the lasting effects of local ecosys-tem restoration efforts in combination with the introduc-tion of non-native species.
The Niagara River, which connects lakes Erie andOntario, is an AOC with a long history of fish commu-nity degradation and restoration (Moore 1929; Hartigand Thomas 1988). Despite its importance as a bina-tional fisheries resource, the structural and functionalcomposition of this freshwater fish assemblage havebeen understudied over the last few decades owing tothe challenges of sampling such a large, fast flowingriver with prominent waterfalls (but see Yagi and Blott2012). As such, we sought to characterize the functionaland taxonomic diversity of the Niagara River fish as-semblage at sites upstream and downstream of NiagaraFalls. Specifically, we used data from a standardized,three-year (2015–2017) seasonal fish sampling programto: (i) document present-day species composition andidentify abiotic factors influencing compositional pat-terns; (ii) quantify present-day freshwater fish functionaldiversity; and, (iii) test whether differences in functionaldiversity exist seasonally or between river sections.Overall, this study provides an approach for future fishbiodiversity assessments and the first description of fishfunctional diversity in the Niagara River, one of themost iconic riverscapes on Earth.
Methods
Study site
Fish sampling in the Niagara River was performedduring the day using a dual-boom, 6.4 m Smith Rootelectrofishing boat at 10 sites in the spring, summer, andfall of 2015–2017 (Fig. S1; full sampling details areprovided in Gáspárdy et al. 2020). All surveys wereperformed in Canadian waters (i.e., western shore) withfour sites downstream of Niagara Falls (i.e., lower river)and six upstream of Niagara Falls (i.e., upper river; Fig.S1). The primary goal of sampling was to characterizethe composition of the Niagara River fish assemblagegiven the challenges of sampling such a fast-flowingsystem (maximummeasured water velocity: 0.66ms−1).
638 Environ Biol Fish (2021) 104:637–649

At each site, two 500 m transects were performed withthree passes for each transect. The transects followed a2 m depth contour with fishing occurring with thedirection of flow for approximately 5700 s/site. Poweroutput during sampling was approximately 1800 Wwith adjustments made to account for differences intemperature and conductivity (Edwards et al. 2006).After each pass, captured fishes were identified, count-ed, and stored in holding bins until being released fol-lowing the final pass.
Coarse habitat measurements at each site were takenduring and following fish sampling. Habitat variableswere selected based on their potential influence on fishcommunity structure or composition. These measure-ments included: a visual assessment of the proportion ofthe sampling site covered by submerged aquatic vege-tation; surface water quality measures taken with a YSI7-Port Multi-parameter water quality sonde at the mid-point of the site (conductivity, dissolved oxygen, watertemperature, turbidity; Table 1); a visual assessment ofthe proportion of Wentworth (1922) substrate classesthroughout the site, with a Petite Ponar 6 × 6 in. SSscoop grab sampler used to distinguish small substrateclasses; and, the average of three depth and water ve-locity measurements from the upper, middle, and down-stream portion of each site (Table 1). Physical riverdistance (km) between the site and the confluence withLake Ontario (lower river) and the confluence with LakeErie (upper river) was measured post-sampling usingArcMap10.2.
Taxonomic diversity analysis
For the analyses described in the following sections, fishcapture data were pooled across transects and passes. Aredundancy analysis (RDA) was performed onHellinger-transformed species abundance data with thesite-specific habitat covariates to understand how habi-tat characteristics were associated with the variationobserved in fish community structure (Table 1). AHellinger transformation was used to reduce the influ-ence of abundant species on the analysis (Legendre andGallagher 2001). An automatic stepwise model-selection approach was used to identify significantsite-specific covariates where significance was assessedusing 9999 permutations at α = 0.05. Prior to the anal-ysis, Pearson correlations were calculated to ensure alack of correlation between covariates (Fig. S2), andcontinuous covariates were converted to z-scores. To
supplement the RDA, non-metric multidimensionalscaling (NMDS) was performed on the Hellinger-transformed species abundance data, and the significanthabitat covariates identified in the RDA were fit to theNMDS ordination, similarly using 9999 permutations.Given the similarity in results between the two analyses(NMDS plot: Fig. S3), only the results of the RDA arepresented in the main text.
Fish trait data
Fish trait data were collected from the literature to repre-sent the ecological niche of each fish species. Traits wererelated to components of species’ diet, reproductiveguild, substrate associations, and average adult body size(Frimpong and Angermeier 2009; Holm et al. 2009;Lamothe et al. 2018; Table 1). Diet traits initially includ-ed seven binary variables representing preferred con-sumption of: 1) algae or phytoplankton, including fila-mentous algae; 2) any part of macrophytes and vascularplants; 3) detritus or unidentifiable vegetative matter; 4)aquatic and terrestrial invertebrates including zooplank-ton, insects, microcrustaceans, annelids, and molluscs.This group also included larval fishes; 5) larger fishes(i.e., fry-adult size fishes), crayfishes, crabs, frogs, etc.; 6)blood; and, 7) eggs of fishes and other aquatic organisms.Reproduction traits were based on elements from Balon
Table 1 Mean (minimum - maximum) of aquatic habitat mea-surements in the upper (n = 103 samples) and lower sections (n =72 samples) of the Niagara River
Habitat characteristic Upper Lower
Proportion of submergedvegetation cover
0.47(0.00–0.95)
0.40(0.00–0.95)
Conductivity (μS cm−1) 318.36(189.30–572.70)
329.11(201.20–563.80)
Average site depth (m) 1.66(0.73–3.07)
1.77(0.67–2.47)
Dissolved oxygen (mg L−1) 8.86(2.08–12.00)
10.06(8.26–12.32)
Distance from river mouth(km)
17.54(6.36–25.03)
5.79(2.25–10.27)
Turbidity (ntu) 4.05(0.18–141.20)
2.97(0.84–10.70)
Water temperature (°C) 17.83(7.07–25.45)
18.61(10.07–25.97)
Average water velocity(m s−1)
0.20(0.02–0.66)
0.15(0.01–0.60)
639Environ Biol Fish (2021) 104:637–649

(1975) and included two binary variables based onwhether fishes guard their brood and if fishes hide orcreate nests for their brood. Substrate associations includ-ed nine binary variables indicative of preferences formuck, clay or silt substrates, sand substrate, gravel sub-strate, cobble substrate, boulder substrate, bedrock, veg-etation, large woody debris, and organic debris or detri-tus. Due to a lack of variation, the preference for con-suming aquatic and terrestrial invertebrates and bloodwere not included in the analyses; almost all species inthis study feed on invertebrates or larval fishes, whereasonly one species (Sea Lamprey Petromyzon marinus)feeds on blood. Spearman rank correlations were calcu-lated between each trait variable (Fig. S4). As a result, thepreference for feeding on detritus or unidentifiable veg-etative matter and algae or phytoplankton, includingfilamentous algae, was not included in calculating thefunctional trait space, as well as the preference for mucksubstrate.
Functional diversity analysis
To construct the multidimensional functional trait space,three principal component analyses (PCAs) were per-formed to combine species traits from three trait typecategories (diet, substrate, and reproduction) into re-spective trait dimensions (Lamothe et al. 2018). Thetrait data were Hellinger-transformed prior toperforming each PCA (Legendre and Gallagher 2001).The number of axes to retain was chosen through apermutation approach, where each column of the traitmatrix was permuted, followed by a PCA 9999 times;nontrivial axes were retained if the proportion of vari-ance explained was greater than 95% of the permutedPCAs for that component (Peres-Neto et al. 2003,2005). The nontrivial trait dimensions were then usedto build the functional trait space by performing a prin-cipal coordinates analysis (PCoA) on the three traitdimensions and a scaled and centered (i.e., z-scores)average total length (cm) variable (Laliberté et al.2010). Fish total length, here represented by the Ontarioaverage adult total length for each species (Holm et al.2009), is a variable related to many processes relevant toindividual niches including reproduction (Blueweisset al. 1978), dispersal (Radinger and Wolter 2014),and vulnerability to predation (Alofs and Jackson 2015).
We calculated two functional diversity metricsunaffected by species richness, functional dispersion(Anderson 2006; Laliberté and Legendre 2010) and
functional divergence (Villéger et al. 2008). Func-tional dispersion describes the average distance ofindividual species in functional trait space to thecentroid, weighted by the relative abundance of eachspecies (Anderson 2006; Laliberté and Legendre2010). Lower values of functional dispersion sug-gests species with higher relative abundance havemore traits in common (i.e., lower functional diver-sity). Functional divergence describes the position ofspecies relative to the border of the functional traitspace and provides a relative measure of uniquenessof species traits in a community (Mason et al. 2005;Villéger et al. 2008); higher divergence suggests thatthe abundance distribution of fishes in trait space ismaximizing the full suite of functional niches withinthe community (Mason et al. 2005). Permutationalmultivariate analysis of variance (PERMANOVA;Anderson 2001; McArdle and Anderson 2001) wasused to test for differences in functional dispersionand divergence between years, seasons, and riversections. Significance was assessed at α = 0.05 using9999 permutations. All statistical analyses were per-formed using the R statistical software (R CoreTeam 2020). Code and data are accessible athttps://github.com/KarlLamothe/NiagaraRiver.
Results
Fish sampling results
Over 41,000 fishes representing 65 species, 44 genera,and 21 families were sampled from the Niagara Riverbetween 2015 and 2017 and identified to the specieslevel (Table S1; Gáspárdy et al. 2020). In total, 55species were observed in the lower Niagara River com-pared to 57 in the upper river. Substantially more fisheswere captured in the upper river (n = 32,028 fishes)compared to the lower river (n = 9321). A similar num-ber of fishes were captured in 2015 and 2016 (2015 =15,685 fish; 2016 = 15,694), whereas the sampling in2017 captured 9970 individual fish. White Sucker(Catostomus commersonii) was the most abundant spe-cies sampled (n = 10,949 individuals; 95.5% of sites),followed by Emerald Shiner (Notropis atherinoides;n = 8715; 87.5% of sites) and Yellow Perch (Percaflavescens; n = 5136; 89.8% of sites; Fig. 1). WhiteSucker and Emerald Shiner showed particularly highrelative abundance in the upper river, whereas the CPUE
640 Environ Biol Fish (2021) 104:637–649
distribution was more evenly distributed in the lowerriver (Fig. 1).
Seasonal differences were observed in the number offishes captured, with 19,042, 12,893, and 9414 fishescaptured in the fall, summer, and spring, respectively.The fewest fishes were captured in summer 2015 duringsampling of the lower river (n = 491 fish), whereas 8562fishes were captured in the upper section in fall 2015.Overall, more species were captured in the fall (n = 59species) compared to the spring (n = 53) or the summer(n = 52). Less than 100 individuals were captured for 35species over the 3 years of sampling. Among all thespecies captured, 14 are considered introduced,reintroduced (Atlantic Salmon Salmo salar), probablyintroduced, or reportedly introduced in at least one ofthe Great Lakes (Table S1), comprising a total of 8.6%of the total catch (n = 3568 fish).
The number of individuals captured and total speciesrichness were greatest during fall sampling, when sev-eral species showed particularly high relative abun-dance, including Bluntnose Minnow (Pimephalesnotatus), Brook Silverside (Labidesthes sicculus), CohoSalmon (Oncorhynchus kisutch), Emerald Shiner,Greater Redhorse (Moxostoma valenciennesi), RainbowSmelt (Osmerus mordax), Round Goby (Neogobiusmelanostomus), White Perch (Morone americana),White Sucker, and Yellow Perch. Compared to thelower river, the upper river appeared to be missingseveral large species, whereas 10 mostly small-bodiedspecies were observed in the upper river but not detectedin the lower river (Table 2). The unique species capturedin the upper river made up 0.2% of the catch (n = 72individuals), whereas the unique species captured in thelower river made up 4.5% of the catch (n = 419individuals; Table 2).
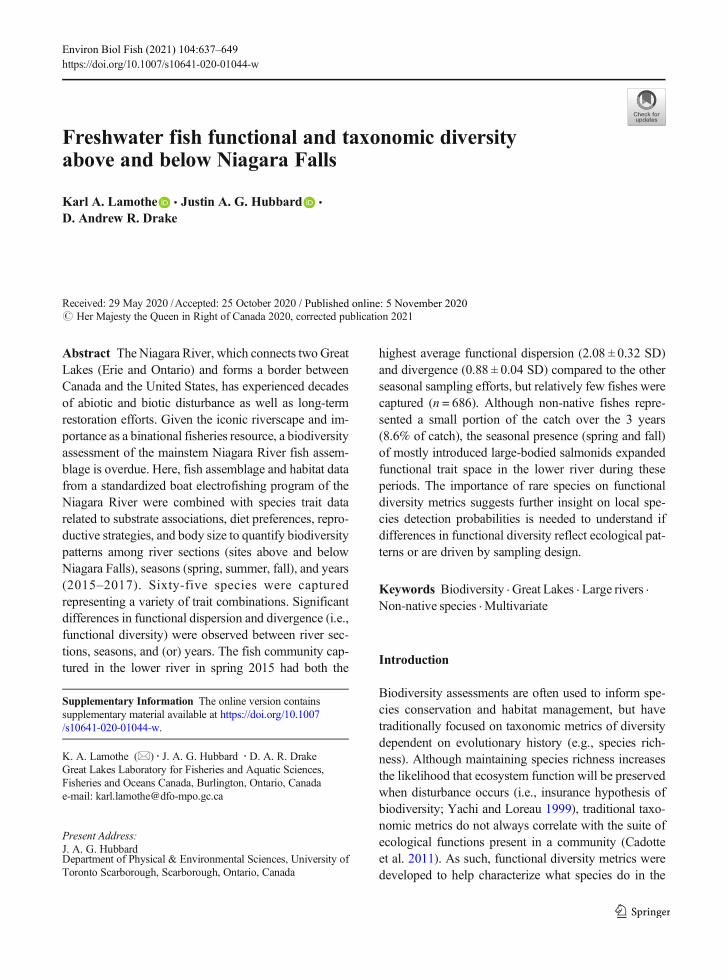
Average depth, distance to the river mouth, propor-tion of submerged aquatic vegetation, and water tem-perature were significant (p < 0.05) predictors of fishspecies abundance in the Niagara River (Fig. 2). Sepa-ration was observed between fish communities of dif-ferent river sections and seasons in the RDA triplot (Fig.2). Gizzard Shad (Dorosoma cepedianum) and YellowPerch abundance were positively correlated with meanriver depth and negatively correlated with the distancefrom river mouth. Rainbow Smelt and Emerald Shinershowed a positive relationship with fall and spring sam-pling and a negative relationship with water temperatureand the proportion of submerged aquatic vegetation at asite, as both species were captured in greater abundance
during the fall and spring in non-vegetated areas. WhiteSucker, the most abundant and prevalent species cap-tured across sites (Fig. 1), showed similar compositionalpatterns to Bluntnose Minnow and Spottail Shiner(Notropis hudsonius; Fig. 2).
Functional diversity
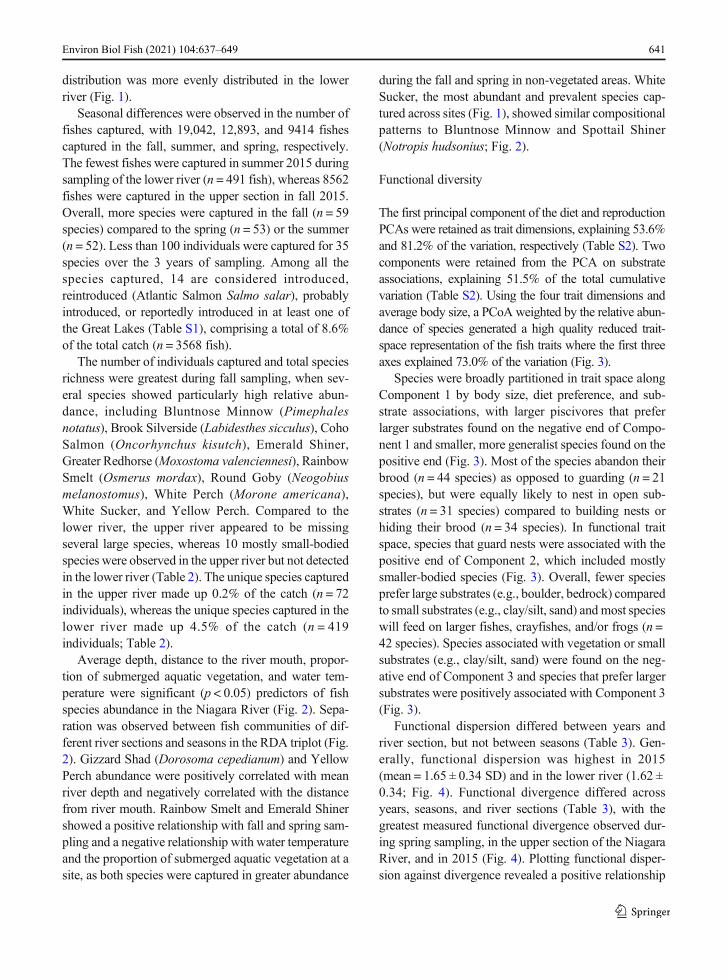
The first principal component of the diet and reproductionPCAs were retained as trait dimensions, explaining 53.6%and 81.2% of the variation, respectively (Table S2). Twocomponents were retained from the PCA on substrateassociations, explaining 51.5% of the total cumulativevariation (Table S2). Using the four trait dimensions andaverage body size, a PCoA weighted by the relative abun-dance of species generated a high quality reduced trait-space representation of the fish traits where the first threeaxes explained 73.0% of the variation (Fig. 3).
Species were broadly partitioned in trait space alongComponent 1 by body size, diet preference, and sub-strate associations, with larger piscivores that preferlarger substrates found on the negative end of Compo-nent 1 and smaller, more generalist species found on thepositive end (Fig. 3). Most of the species abandon theirbrood (n = 44 species) as opposed to guarding (n = 21species), but were equally likely to nest in open sub-strates (n = 31 species) compared to building nests orhiding their brood (n = 34 species). In functional traitspace, species that guard nests were associated with thepositive end of Component 2, which included mostlysmaller-bodied species (Fig. 3). Overall, fewer speciesprefer large substrates (e.g., boulder, bedrock) comparedto small substrates (e.g., clay/silt, sand) and most specieswill feed on larger fishes, crayfishes, and/or frogs (n =42 species). Species associated with vegetation or smallsubstrates (e.g., clay/silt, sand) were found on the neg-ative end of Component 3 and species that prefer largersubstrates were positively associated with Component 3(Fig. 3).
Functional dispersion differed between years andriver section, but not between seasons (Table 3). Gen-erally, functional dispersion was highest in 2015(mean = 1.65 ± 0.34 SD) and in the lower river (1.62 ±0.34; Fig. 4). Functional divergence differed acrossyears, seasons, and river sections (Table 3), with thegreatest measured functional divergence observed dur-ing spring sampling, in the upper section of the NiagaraRiver, and in 2015 (Fig. 4). Plotting functional disper-sion against divergence revealed a positive relationship
641Environ Biol Fish (2021) 104:637–649

in the lower river whereas a negligible relationship wasobserved in the upper river (Fig. 5). High values offunctional dispersion and divergence in the lower riversuggests that the assemblage is composed of a diverseset of ecological niches that are maximizing functionaltrait space. Moderate levels of functional dispersion(~1.6) across moderately high divergence measure-ments (> 0.7) in the upper river suggests that those sitescontain a unique set of ecological niches with abundant
species sharing more traits than fish communities in thelower river.
Summarizing the abundance of unique species cap-tured by river section illustrated why a positive relation-ship was observed between functional divergence anddispersion in the lower river, but not in the upper river(Fig. 6). In the lower river, functional dispersion anddivergence increased with the abundance of the uniquespecies captured, whereas there was no relationshipbetween functional dispersion or divergence with theabundance of unique species captured in the upper river(Fig. 6). Overall, this result suggests that the presenceand abundance of the unique, mostly large-bodied spe-cies captured in the lower river (e.g., Chinook Salmon,Coho Salmon) increased the observed functional nichespace, whereas the unique species captured in the upperriver were seemingly redundant in trait composition toother taxa.
Introduced species in the Niagara River
Due to the prevalence of captured non-native salmonids,most of the introduced, reintroduced, probably intro-duced, or reportedly introduced species were partitionedalong the left side of Component 1 in functional traitspace (Fig. 3), indicating that they are generally largerthan other species in the Niagara River assemblage.Rainbow Smelt was the most abundant introduced spe-cies captured in the 2015–2017 sampling effort (n =
Fig. 1 Number of individualscaptured and mean catch-per-uniteffort (CPUE; catch per electro-fishing second) for species withinthe lower (black) and upper (grey)section of the Niagara River.Species with less than 100 indi-viduals captured are not shown
Table 2 Unique species and number caught (aggregate count) inthe lower and upper Niagara River
Lower river Upper river
Species Count Species Count
American Eel 29 American Brook Lamprey 25
Atlantic Salmon 1 Central Mudminnow 1
Chinook Salmon 227 Channel Catfish 1
Coho Salmon 25 Creek Chub 1
Lake Trout 11 Fantail Darter 3
Longnose Gar 101 Fathead Minnow 1
Sea Lamprey 1 Grass Pickerel 2
Silver Redhorse 24 Rainbow Darter 36
Trout-perch 1
White Crappie 1
642 Environ Biol Fish (2021) 104:637–649
1365 individuals; Fig. 1). Based on linear distancesbetween species in functional trait space, RainbowSmelt trait composition was most similar to White Bass(Morone chrysops - native) and Rainbow Trout
(Oncorhynchus mykiss - introduced; Fig. 3). These threespecies, although morphologically different, are gener-ally carnivorous, will feed at the surface or throughoutthe water column, and do not guard their offspring post-
Fig. 2 Redundancy analysis (RDA) triplot of Niagara River fishspecies abundances across river sections and sampling seasons.Note that only species with high abundances were plotted forvisual purposes, but all species were included in the analysis.Abbreviations: BlBu = Black Bullhead; BlMi = Bluntnose Min-now; CoCa = Common Carp; EmSh = Emerald Shiner; GiSh =
Gizzard Shad; LMB= Largemouth Bass; RaSm =RainbowSmelt;SMB = Smallmouth Bass; SptSh = Spottail Shiner; WhSu =WhiteSucker; YePe = Yellow Perch; Veg = proportion of submergedaquatic vegetation; dMouth = distance to mouth of river; Temp =water temperature
Fig. 3 Functional trait space produced using a principal coordinates analysis. Fish abbreviations are provided in Table S1 andmostly reflectthe first two letters of the common names of the species (e.g., NoPi = Northern Pike)
643Environ Biol Fish (2021) 104:637–649

reproduction. Although functionally similar, far fewerRainbow Trout (n = 111 individuals) and White Bass(n = 41) were caught than Rainbow Smelt (Fig. 1). In-stead, Rainbow Smelt was partitioned closest to Emer-ald Shiner (native) along the first two components of theRDA (Fig. 2). Although similar in substrate preference
and reproductive traits, Emerald Shiner and RainbowSmelt show differences in food preferences and bodysize (i.e., Component 1 in Fig. 3). Rainbow Smeltprimarily feeds on aquatic and terrestrial invertebrates,larval fishes, and (or) larger fishes near the surface orwithin the water column and grow to almost three timesthe length of Emerald Shiner.
Discussion
The Niagara River is one of the most unique freshwaterecosystems in North America with a long history ofdegradation and restoration (Hartig and Thomas 1988;Hartig et al. 2020). Based on several metrics, the Niag-ara River contains a functionally and taxonomicallydiverse fish assemblage that varies in site-specific spe-cies composition, with species that differ in size,
Table 3 Results of the permutational analysis of variance forfunctional dispersion and divergence across seasons, river sec-tions, and years (n = 88 sites)
Functional diversity metric Factor df F R2 p
Functional dispersion Season 2 1.90 0.04 0.15
Section 1 5.36 0.05 0.02
Year 2 3.60 0.07 0.03
Functional divergence Season 2 7.11 0.12 <0.01
Section 1 18.36 0.15 <0.01
Year 2 4.31 0.07 0.02
Fig. 4 Boxplots of functional dispersion and divergence as a function of year, season, and river section. Significant differences in functionalmetrics across year, season, and (or) section indicated by shaded plots
644 Environ Biol Fish (2021) 104:637–649

reproductive tactics, substrate associations, and dietpreferences. Differences in species composition andfunctional diversity were observed between river sec-tions, seasons, and years. More fish and species werecaught in the upper river compared to the lower river,with the greatest number of fish captured during fallsampling. Although appearing to have lower functional
divergence than the upper river community, the rela-tionship between functional dispersion and divergencewas positive in the lower river, whereas this relationshipwas negligible for the upper river fish community.Overall, non-native species consisted of a relativelylow proportion of the catch over the 3 years of sampling,but the seasonal presence (spring and fall) of mostly
Fig. 5 Functional divergenceversus functional dispersion forfreshwater fishes in the lower(square) and upper (circle) Niag-ara River during the spring (darkgrey), summer (light grey), andfall (black), and associated linearregressions (solid lines = lowersection, dashed lines = uppersection)
Fig. 6 Abundance of unique species captured in the lower (grey) and upper (black) sections of the Niagara River against functionaldispersion and functional divergence with fitted linear models. Shaded area = 95% confidence intervals
645Environ Biol Fish (2021) 104:637–649

introduced large-bodied salmonids expanded the overallniche space for freshwater fishes in the lower riverduring these periods.
A difference in the relationship between freshwaterfish functional dispersion and divergence was observedbetween the upper and lower Niagara River, where thelower river showed a positive linear relationship andupper river did not. The positive relationship in thelower river was likely caused by the presence of large-bodied species that seasonally migrate between the lakeand river, including introduced salmonids. Large-bodied species corresponded with the negative end ofthe first component of functional trait space, which ledto increased site-specific estimates of functional diver-sity when these species were present. High estimates offunctional diversity in the lower river fish assemblagecontrasts expectations based on habitat measures alone,as the upper section of the river is generally perceived tohave greater aquatic habitat diversity (e.g., greater veg-etated area, depth variation, access to tributaries).
In theory, the introduction of fishes could have pos-itive, negative, or neutral effects on fish functional di-versity depending on the competitive ability of nativeversus introduced species, the configuration of present-day niche space and how the novel traits interact withthe native community, and the scale of analysis(Mouillot et al. 2013b; Kuebbing et al. 2018). Globally,non-native freshwater fishes have generally increasedriverine functional diversity (Toussaint et al. 2018). Thisincreasing pattern is also present in the Great Lakesproper, which have seen an increase in functional diver-sity over the last 150 years, ultimately due to the intro-duction of novel traits of non-native fishes (Campbelland Mandrak 2017). In support of these larger scalestudies, our results indicated that the introduction ofnon-native salmonids into Lake Ontario and the lowerNiagara River has led to an influx of novel traits leadingto heightened measures of functional diversity.
Our understanding of how the loss of fish species inthe Niagara River has affected functional diversity isless certain. Fifty-seven North American freshwaterfishes went extinct between 1898 and 2006 (Burkhead2012), including several species that could have occu-pied or used the Niagara River at some point during theirlife-history, such as Blue Pike (a.k.a. Blue Walleye;Sander vitreus glaucus - extinct), Harelip Sucker(Lagochila lacera - extinct), Sauger (Sander canadense- extirpated in Lake Ontario), and (or) Spoonhead Scul-pin (Cottus ricei - extirpated in lakes Ontario and Erie;
Roth et al. 2011). If these species were extant, functionaltrait space may have shown few differences given thepresence of taxa with similar trait attributes (e.g., Wall-eye, non-native salmonids, benthic omnivores). If thetrait composition of extirpated species was in fact re-dundant to the present-day fish assemblage, the loss ofthese species may signify a reduction in resilience tofuture disturbance. Nevertheless, a unique catch thatoccurred in October of 2015 at one of the most northernsites in the lower Niagara River was a single AtlanticSalmon. Atlantic Salmon was declared extirpated fromLake Ontario as a result of overharvesting and habitatalteration and destruction in the late 1800s (Parrish et al.1998; Scott et al. 2005) but has experienced continuousreintroduction efforts since the 1980s (OMNRF 2019).The source of the captured Atlantic Salmon specimenduring the Niagara River survey inevitably stems fromreintroduction efforts.
Although differences were observed in functionaldiversity across seasons, years, and river sections, themagnitude of these differences was relatively small,perhaps reflecting the expected level variation giventhe similarity in species composition between riverssections and years, and the amount of sampling effortperformed. Several rare species in the dataset(Central Mudminnow, Channel Catfish, FatheadMinnow, Grass Pickerel, and Trout-perch) were onlycaptured in 2015 at particular sampling sites, whichmay have increased functional diversity measuresrelative to 2016 or 2017. It is unlikely that these rarespecies are no longer occupying the Niagara River.Instead, the lack of detections was more likely causedby a combination of low detection probabilities, lowrelative abundance, poor sampling conditions (i.e.,high water velocity), and (or) relatively low effort ateach site, all of which are causes of zero inflation inecological datasets (Dénes et al. 2015). In the fast-flowing waters of the Niagara River, many small-bodied fishes rely on structures (e.g., boulders, woodydebris) that create areas of reduced flow (RobinGáspárdy personal communication 2019), which areoften more difficult to sample in fast-flowing watersusing boat electrofishing techniques. Quantifying theprobability of detection for each species in the NiagaraRiver was outside the scope of this study, but is criticalto improve future efforts to better understand local spe-cies occupancy, abundance, and overall trait distributionin the Niagara River, and the degree of change in theseattributes over time.
646 Environ Biol Fish (2021) 104:637–649

The use of functional diversity metrics together withthe taxonomic analysis confirmed knowledge of region-al fish community structure and provided a means forbetter understanding patterns in fish community com-position. For example, White Sucker, Emerald Shiner,and Yellow Perch were among the most abundant fishescaptured in the Niagara River, which is consistent withtheir prevalence in the broader region (Lamothe et al.2018), and also expected given their life-history (e.g.,abandoning brood) and the flow dynamics of the sys-tem. Alternatively, Emerald Shiner and Rainbow Smeltshowed similar site-specific abundance patterns basedon the compositional analysis in the Niagara River,generally occupying cooler sites. Evaluating the traitcomposition of these two species revealed, however,that the two species demonstrate unique life-historycharacteristics and behavioural attributes (Holm et al.2009). Similarly, Greater Redhorse and Muskellunge(Esox masquinongy) showed compositional parallels,as nearly every site with Muskellunge contained abun-dant Greater Redhorse, but these two species differ inbody size, feeding characteristics, substrate associations,and thermal preference, and therefore occupy differentecological niches. By omitting the functional diversityanalyses and relying on a traditional compositional eval-uation, these distinctions could be missed, and thereforesuggest a benefit of incorporating trait-based analysiswith traditional bioassessments.
Previous studies have demonstrated the value ofusing functional diversity metrics to assess biodiversitypatterns (Villéger et al. 2010; Cardinale et al. 2012), asfunctional diversity metrics are somewhat less depen-dent on sampling effort and, therefore, should be moreaccessible (Gallardo et al. 2011), particularly with therise of open-access software and packages (e.g., R CoreTeam 2020). However, gaps remain in functional traitdatabases for many taxa and there is a degree of meth-odological complexity when calculating functional di-versity metrics, such as choosing the appropriate func-tional traits and ordination methods (e.g., Poos et al.2009). These limitations may be slowing the inclusionof functional diversity analyses into management con-siderations. Nevertheless, the availability of species-specific trait information for freshwater fishes continuesto improve (e.g., Fishbase: Froese and Pauly 2019;FishTraits: Frimpong and Angermeier 2009) and oppor-tunities exist to use historical capture data to evaluate
changes in functional diversity over time, particularly asit relates to changes in environmental conditions andspecies extirpations. Investigating changes in functionaldiversity over time, however, requires knowledge ofhistorical sampling design, as the lack of detections doesnot necessarily indicate absence from the system, par-ticularly for freshwater fishes with low detection prob-abilities. This is critical, as demonstrated in this study,the presence of relatively rare species can strongly in-fluence measures of functional diversity. Future effortsto characterize changes in freshwater fish functionaldiversity over time would therefore benefit from usingmultiple gears to ensure a complete representation of thefish community. Overall, our study provides a muchneeded exploration of the present-day fish assemblagein the Niagara River and provides an example of howcombining traditional biodiversity metrics with mea-sures of functional diversity can reveal important nu-ances in local species composition.
Acknowledgments This work was made possible by the manyindividuals involved in field sampling. Funding for sampling wasprovided by Environment and Climate Change Canada’s GreatLakes Action Plan program and Fisheries and Oceans Canada.Boat electrofishing was conducted under Animal Use ProtocolAUP 1322-A and Standard Operating Protocol GWACC-111.All sampling was approved by the Environment and ClimateChange Canada and Fisheries and Oceans Canada Animal CareCommittee (operated under the approval of the Canadian Councilon Animal Care). Funding for KAL was provided through aNatural Sciences and Engineering Research Council of CanadaVisiting Fellowship with Fisheries and Oceans Canada and theCanadian Freshwater Species at Risk Research Network.
Funding Funding for sampling was provided by Environmentand Climate Change Canada’s Great Lakes Action Plan programand Fisheries and Oceans Canada. Funding for Karl A. Lamothewas provided through a Natural Sciences and Engineering Re-search Council of Canada Visiting Fellowship with Fisheries andOceans Canada and the Canadian Freshwater Species at RiskResearch Network.Data availabilityData for this study is availableat: https://github.com/KarlLamothe/NiagaraRiver
Compliance with ethical standards
Conflicts of interest/competing interests The authors have noconflicts of interest to declare.
Code availability R code used to perform the analyses for thisstudy is available at: https://github.com/KarlLamothe/NiagaraRiver
647Environ Biol Fish (2021) 104:637–649

Open Access This article is licensed under a Creative CommonsAttribution 4.0 International License, which permits use, sharing,adaptation, distribution and reproduction in anymedium or format,as long as you give appropriate credit to the original author(s) andthe source, provide a link to the Creative Commons licence, andindicate if changes were made. The images or other third partymaterial in this article are included in the article's Creative Com-mons licence, unless indicated otherwise in a credit line to thematerial. If material is not included in the article's Creative Com-mons licence and your intended use is not permitted by statutoryregulation or exceeds the permitted use, you will need to obtainpermission directly from the copyright holder. To view a copy ofthis licence, visit http://creativecommons.org/licenses/by/4.0/.
References
Alofs KM, Jackson DA (2015) The abiotic and biotic factorslimiting establishment of predatory fishes at their expandingnorthern range boundaries in Ontario, Canada. Glob ChangBiol 21:2227–2237. https://doi.org/10.1111/gcb.12853
Anderson MJ (2001) A new method for non-parametric multivar-iate analysis of variance. Aust Ecol 26:32–46. https://doi.org/10.1111/j.1442-9993.2001.01070.pp.x
Anderson MJ (2006) Distance-based tests for homogeneity ofmultivariate dispersion. Biometrics 62:245–253. https://doi.org/10.1111/j.1541-0420.2005.00440.x
Balon EK (1975) Reproductive guilds of fishes: a proposal anddefinition. J Fish Res Board Can 32:821–864. https://doi.org/10.1139/f75-110
Blueweiss L, Fox H, Kudzma V, Nakashima D, Peters R, Sams S(1978) Relationships between body size and some life historyparameters. Oecologia 37:257–272. https://doi.org/10.1007/BF00344996
Burkhead NM (2012) Extinction rates in north American fresh-water fishes, 1900–2010. BioScience 62:798–808.https://doi.org/10.1525/bio.2012.62.9.5
Cadotte MW (2011) The new diversity: management gainsthrough insights into the functional diversity of communities.J Appl Ecol 48:1067–1069. https://doi.org/10.1111/j.1365-2664.2011.02056.x
Cadotte MW, Carscadden K, Mirotchnick N (2011) Beyond spe-cies: functional diversity and the maintenance of ecologicalprocesses and services. J Appl Ecol 48:1079–1087.https://doi.org/10.1111/j.1365-2664.2011.02048.x
Campbell SE, Mandrak NE (2017) Dissecting spatiotemporalpatterns of functional diversity through the lens of Darwin’snaturalization conundrum. Ecol Evol 7:3861–3869.https://doi.org/10.1002/ece3.2933
Cardinale BJ, Duffy JE, Gonzalez A, Hooper DU, Perrings C,Venail P, Narwani A, Mace GM, Tilman D, Wardles DA,Kinzig AP, Daily GC, Loreau M, Grace JB, Larigauderie A,Srivastava DS, Naeem S (2012) Biodiversity loss and itsimpact on humanity. Nature 486:59–67. https://doi.org/10.1038/nature11148
Core Team R (2020) R: a language and environment for statisticalcomputing. R Foundation for Statistical Computing, Vienna
Dénes FV, Silveira LF, Beissinger SR (2015) Estimating abun-dance of unmarked animal populations: accounting for
imperfect detection and other sources of zero inflation.Methods Ecol Evol 6:543–556. https://doi.org/10.1111/2041-210X.12333
Edwards A, Barnucz J, Mandrak NE (2006) Boat electrofishingsurvey of the fish assemblages of the St. Clair River, Ontario.Can Manuscr Rep Fish Aquat Sci 2742:v + 57
Frimpong EA, Angermeier PL (2009) FishTraits: a database ofecological and life-history traits of freshwater fishes of theUnited States. Fisheries 34:487–495. https://doi.org/10.1577/1548-8446-34.10.487
Froese R, Pauly D (2019) FishBase. World wide web electronicpublication. www.fishbase.org, version (12/2019)
Gallardo G, Gascón S, Quintana X, Comín FA (2011) How tochoose a biodiversity indicator – redundancy and comple-mentarity of biodiversity metrics in a freshwater ecosystem.Ecol Indic 11:1177–1185. https://doi.org/10.1016/j.ecolind.2010.12.019
Gáspárdy R, Barnucz J, Drake DAR (2020) Nearshore fish com-munity assessment of the upper and lower Niagara River,2015-2017. Can Dat Rep Fish Aquat Sci 1304:vi + 75
Hartig JH, Thomas RL (1988) Development of plans to restoredegraded areas in the Great Lakes. Environ Manag 12:327–347. https://doi.org/10.1007/BF01867523
Hartig JH, Krantzberg G, Alsip P (2020) Thirty-five years ofrestoring Great Lakes areas of concern: gradual progress,hopeful future. J Great Lakes Res 46:429–442. https://doi.org/10.1016/j.jglr.2020.04.004
Holm E, Mandrak N, Burridge M (2009) The ROM field guide tofreshwater fishes of Ontario. Royal Ontario Museum,Toronto
Ikin K, Barton PS, Blanchard W, Crane M, Stein J, LindenmayerDB (2019) Avian functional responses to landscape recovery.Proc R Soc B 286:20190114. https://doi.org/10.1098/rspb.2019.0114
Kuebbing SE, Maynard DS, Bradford MA (2018) Linking func-tional diversity and ecosystem processes: a framework forusing functional diversity metrics to predict the ecosystemimpact of functionally unique species. J Ecol 106:687–698.https://doi.org/10.1111/1365-2745.12835
Laliberté E, Legendre P (2010) A distance-based framework formeasuring functional diversity from multiple traits. Ecology91:299–305. https://doi.org/10.1890/08-2244.1
Laliberté E, Wells JA, DeClerck F, Metcalfe DJ, Catterall CP,Queiroz C, Aubin I, Bonser SP, Ding Y, Fraterrigo JM,McNamara S, Morgan JW, Merlos DS, Vesk PA, MayfieldMM (2010) Land-use intensification reduces plan functionalredundancy and response diversity in plant communities.Ecol Lett 13:76–86. https://doi.org/10.1111/j.1461-0248.2009.01403.x
Lamothe KA, Alofs KM, Jackson DA, Somers KM (2018)Functional diversity and redundancy of freshwater fish com-munities across biogeographic and environmental gradients.Divers Distrib 24:1612–1626. https://doi.org/10.1111/ddi.12812
Legendre P, Gallagher ED (2001) Ecologically meaningful trans-formations for ordination of species data. Oecologia 129:271–280. https://doi.org/10.1007/s004420100716
Mandrak NE, Cudmore B (2010) The fall of native fishes and therise of non-native fishes in the Great Lakes basin. AquatEcosyst Health Manag 13:255–268. https://doi.org/10.1080/14634988.2010.507150
648 Environ Biol Fish (2021) 104:637–649

Mason NWH, Mouillot D, Lee WG, Wilson JB (2005) Functionalrichness, functional evenness and functional divergence: theprimary components of functional diversity. Oikos 111:112–118. https://doi.org/10.1111/j.0030-1299.2005.13886.x
McArdle BH, Anderson MJ (2001) Fitting multivariate models tocommunity data: a comment on distance-based redundancyanalysis. Ecology 82:290–297. https://doi.org/10.1890/0012-9658(2001)082[0290:FMMTCD]2.0.CO;2
Moore E (1929) A biological survey of the Erie-Niagara system.Supplemental to the eighteenth annual report. State of NewYork. Conservation Department. J.B. Lyon Company,Printers, Albany
Mouillot D, Bellwood DR, Baraloto C, Chave J, Galzin R,Harmelin-Vivien M, Kulbicki M, Lavergne S, Lavorel S,Mouquet N, Paine CET, Renaud J, Thuiller W (2013a)Rare species support vulnerable functions in high-diversityecosystems. PLoS Biol 11:e1001569. https://doi.org/10.1371/journal.pbio.1001569
Mouillot D, Graham NAJ, Villéger S, Mason NWH, BellwoodDR (2013b) A functional approach reveals community re-sponses to disturbances. Trends Ecol Evol 28:167–177.https://doi.org/10.1016/j.tree.2012.10.004
Mouillot D, Villéger S, Parravicini V, KulbickiM,Arias-GonzálezJE, Bender M, Chabanet P, Floeter SR, Friedlander A,Vigliola L, Bellwood DR (2014) Functional over-redundancy and high functional vulnerability in global fishfaunas on tropical reefs. PNAS 111:13757–13762.https://doi.org/10.1073/pnas.1317625111
Ontario Ministry of Natural Resources and Forestry [OMNRF](2019) Lake Ontario Fish Communities and Fisheries: 2018Annual report of the Lake Ontario management unit. OntarioMinistry of Natural Resources and Forestry, Picton, Ontario,Canada
Parrish DL, Behnke RJ, Gephard SR,McCormick SD, Reeves GH(1998) Why aren’t there more Atlantic salmon (Salmosalar)? Can J Fish Aquat Sci 55(Suppl. 1):281–287.https://doi.org/10.1139/d98-012
Peres-Neto PR, Jackson DA, Somers KM (2003) Giving mean-ingful interpretation to ordination axes: assessing loadingsignificance in principal component analysis. Ecology 84:2347–2363. https://doi.org/10.1890/00-0634
Peres-Neto PR, Jackson DA, Somers KM (2005) How manyprincipal components? Stopping rules for determining thenumber of non-trivial axes revisited. Comp Stat Data Anal49:974–997. https://doi.org/10.1016/j.csda.2004.06.015
Petchey OL, GastonKJ (2006) Functional diversity: back to basicsand looking forward. Ecol Lett 9:741–758. https://doi.org/10.1111/j.1461-0248.2006.00924.x
Poos MS, Walker SC, Jackson DA (2009) Functional-diversityindices can be driven by methodological choices and speciesrichness. Ecology 90:341–347. https://doi.org/10.1890/08-1638.1
Radinger J, Wolter C (2014) Patterns and predictors of fish dis-persal in rivers. Fish Fish 15:456–473. https://doi.org/10.1111/faf.12028
Roth BM, Mandrak NE, Hrabik TR, Sass GG, Peters J (2011)Fishes and decapod crustaceans of the Great Lakes basin. In:Taylor WW, Lynch A (eds) Great Lakes policy and manage-ment, 2nd edn. Michigan State University Press, Michigan,pp 105–135
Scott RJ, Judge KA, Ramster K, Noakes DLG, Beamish FWH(2005) Interactions between naturalised exotic salmonids andreintroduced Atlantic salmon in a Lake Ontario tributary.Ecol Freshw Fish 14:402–405. https://doi.org/10.1111/j.1600-0633.2005.00115.x
Tilman D (1999) The ecological consequences of changes inbiodiversity: a search for a general principle. Ecology 90:1455–1474. https://doi.org/10.1890/0012-9658(1999)080[1455:TECOCI]2.0.CO;2
Toussaint A, Charpin N, Beauchard O, Grenouillet G, OberdorffT, Tedesco PA, Brosse S, Villéger S (2018) Non-nativespecies led to marked shifts in functional diversity of theworld freshwater fish faunas. Ecol Lett 21:1649–1659.https://doi.org/10.1111/ele.13141
Villéger S, Mason NWH, Mouillot D (2008) New multidimen-sional functional diversity indices for a multifaceted frame-work in functional ecology. Ecology 89:2290–2301.https://doi.org/10.1890/07-1206.1
Villéger S, Miranda JR, Hernández DF, Mouillot D (2010)Contrasting changes in taxonomic vs. functional diversityof tropical fish communities after habitat degredation. EcolAppl 20:1512–1522. https://doi.org/10.1890/09-1310.1
Wentworth CK (1922) A scale of grade and class terms for clasticsediments. J Geol 30(5):377–392
Yachi S, Loreau M (1999) Biodiversity and ecosystem productiv-ity in a fluctuating environment: the insurance hypothesis.PNAS 96:1463–1468 . h t t ps : / / do i . o rg /10 .1073/pnas.96.4.1463
Yagi AR, Blott C (2012) Niagara River watershed fish communityassessment (1997 to 2011). Ontario Ministry of NaturalResources unpublished report. 168 pp + appendices.Ontario, Canada
Publisher’s note Springer Nature remains neutral with regard tojurisdictional claims in published maps and institutionalaffiliations.
649Environ Biol Fish (2021) 104:637–649