Embed Size (px)
Citation preview

RESEARCH ARTICLE
Astrocytes Inhibit Nitric Oxide-DependentCa21 Dynamics in Activated Microglia:
Involvement of ATP Released ViaPannexin 1 Channels
Juan A. Orellana, Trinidad D. Montero, and Rommy von Bernhardi
Under inflammatory conditions, microglia exhibit increased levels of free intracellular Ca21 and produce high amounts of nitricoxide (NO). However, whether NO, Ca21 dynamics, and gliotransmitter release are reciprocally modulated is not fully under-stood. More importantly, the effect of astrocytes in the potentiation or suppression of such signaling is unknown. Our aimwas to address if astrocytes could regulate NO-dependent Ca21 dynamics and ATP release in LPS-stimulated microglia. Gri-ess assays and Fura-2AM time-lapse fluorescence images of microglia revealed that LPS produced an increased basal [Ca21]ithat depended on the sequential activation of iNOS, COXs, and EP1 receptor. TGFb1 released by astrocytes inhibited theabovementioned responses and also abolished LPS-induced ATP release by microglia. Luciferin/luciferase assays and dyeuptake experiments showed that release of ATP from LPS-stimulated microglia occurred via pannexin 1 (Panx1) channels, butnot connexin 43 hemichannels. Moreover, in LPS-stimulated microglia, exogenous ATP triggered activation of purinergic P2Y1
receptors resulting in Ca21 release from intracellular stores. Interestingly, TGFb1 released by astrocytes inhibited ATP-induced Ca21 response in LPS-stimulated microglia to that observed in control microglia. Finally, COX/EP1 receptor signalingand activation of P2 receptors via ATP released through Panx1 channels were critical for the increased NO production in LPS-stimulated microglia. Thus, Ca21 dynamics depended on the inflammatory profile of microglia and could be modulated byastrocytes. The understanding of mechanisms underlying glial cell regulatory crosstalk could contribute to the developmentof new treatments to reduce inflammatory cytotoxicity in several brain pathologies.
GLIA 2013;61:2023–2037Key words: neuroinflammation, calcium, glia
Introduction
An increased body of evidence shows that the innate
immune response exerts a dichotomous role in the cen-
tral nervous system (CNS). Under physiological conditions,
microglia exhibit a resting phenotype associated with produc-
tion of anti-inflammatory and neurotrophic factors, whereas
in response to a wide variety of insults they shift to an acti-
vated phenotype (Block et al., 2007). In this state, rather
than serving protective functions, microglia activation possibly
becomes a detrimental process leading to further recruitment
of other cells involved in the innate immune response (von
Bernhardi, 2007) that promote disease progression, character-
ized by synaptic dysfunction and even cell death as occur in
chronic neurodegenerative disorders (Block et al., 2007; Ram-
irez et al., 2008). Under these conditions, microglia exhibit
an elevated intracellular Ca21 concentration ([Ca21]i) and
increased production of nitric oxide (NO) and prostaglandins
(Farber and Kettenmann, 2006; Saha and Pahan, 2006),
processes associated with neuronal damage in neuroinflamma-
tory conditions (Anrather et al., 2011; Ha et al., 2008). On
the contrary, most of evidence indicate that astrocytes, the
largest glial cell population of the brain, could support
View this article online at wileyonlinelibrary.com. DOI: 10.1002/glia.22573
Published online October 7, 2013 in Wiley Online Library (wileyonlinelibrary.com). Received Oct 18, 2012, Accepted for publication Aug 19, 2013.
Address correspondence to Juan A. Orellana, Departamento de Neurolog�ıa, Escuela de Medicina, Pontificia Universidad Cat�olica de Chile, Marcoleta 391,
Santiago, Chile. E-mail: [email protected] or Rommy von Bernhardi, Departamento de Neurolog�ıa, Escuela de Medicina, Pontificia Universidad Cat�olica de Chile,
Marcoleta 391, Santiago, Chile. E-mail: [email protected]
From the Departamento de Neurolog�ıa; Escuela de Medicina, Pontificia Universidad Cat�olica de Chile, Santiago, Chile.
Additional Supporting Information may be found in the online version of this article.
VC 2013 Wiley Periodicals, Inc. 2023

neuronal survival during brain inflammation (Escartin and
Bonvento, 2008). Indeed, astrocytes regulate the extracellular
concentration of glutamate, K1 and H1 express a large reper-
toire of neurotransmitter receptors and release several neurotro-
phic factors, functions that make them essential protagonists in
brain processing and memory acquisition (Haydon and
Carmignoto, 2006).
Microglia and astrocytes respond to any injury with a
spatial and temporal distinctive pattern of activation in the
inflamed CNS, their crosstalk appearing to be critical for
neuronal fate (Liu et al., 2011). On the other hand, several
studies show that intracellular Ca21 dynamics plays a critical
role on intercellular communication among glial cells, and
serves as a sensitive system to mediate release of gliotransmit-
ters, cytokines and growth factors, representing the primary
pathway by which glial cells respond to neural activity (Farber
and Kettenmann, 2006; Koizumi, 2010). Although microglia
and astrocytes appear to activate each other, whether the
crosstalk among microglia and astrocytes could modulate
Ca21 dynamics and gliotransmitter release during neuroin-
flammation is not fully understood. Several studies have
shown signaling interactions among astrocytes and microglia,
including the fact that astrocytes inhibit several features of
activated microglia such as release of NO and TNFa (Smits
et al., 2001; Tichauer et al., 2007; von Bernhardi and Euge-
nin 2004). TGFb is recognized as a putative factor released
by astrocytes associated with inhibition of microglial cell
inflammatory activation (Herrera-Molina and von Bernhardi
2005). Supporting this idea, TGFb reduces the expression of
several proteins involved in antigen presentation and produc-
tion of inflammatory cytokines, NO and oxygen free radicals
(Herrera-Molina and von Bernhardi 2005). Nevertheless,
whether NO could modulate Ca21 dynamics and gliotrans-
mitter release in activated microglia is not fully understood.
More importantly, if astrocytes could potentiate or suppress
the abovementioned signaling is unknown. Therefore, our
aim was to address if astrocytes could regulate the
NO-dependent Ca21 dynamics and gliotransmitter release in
activated microglia. Here, we show that lipopolysaccharide
(LPS)-induced [Ca21]i increase and ATP release depends on
NO and the activation of COXs and EP1 receptor in micro-
glia. Moreover, TGFb released by astrocytes inhibited the
responses and abolished the LPS-induced changes in ATP-
dependent intracellular Ca21 dynamics in microglia.
Materials and Methods
Reagents and AntibodiesHorseradish peroxidase (HRP)-conjugated anti-rabbit IgG was pur-
chased from Pierce (Rockford, IL). Gap26 and 10panx1 mimetic
peptides were obtained from NeoMPS, SA. (Strasbourg, France).
HEPES, DMEM, DNAse I, poly-L-lysine, A740003, MRS2179,
BAPTA, polyclonal anti-Cx43 antibody, Brilliant blue G (BBG),
oATP, xestospongin B, ethidium (Etd) bromide, and probenecid
(Prob) were purchased from Sigma-Aldrich (St. Louis, MO). Fetal
bovine serum (FBS) was obtained from Hyclone (Logan, UT). Peni-
cillin, streptomycin, polyclonal anti-Panx1 antibody (PI488000),
goat anti-mouse Alexa Fluor 488 and goat anti-mouse Alexa Fluor
555 were obtained from Invitrogen (Carlsbad, CA). Normal goat
serum (NGS) was purchased from Zymed (San Francisco, CA).
Cx43E2, a Cx43 hemichannel antibody (Orellana et al., 2011) was
generously made available by Dr. Jean X. Jiang (University of Texas
Health Science Center).
Cell Cultures
MICROGLIAL CELL CULTURES. Microglia cultures were pre-
pared from cortex of P2 Sprague-Dowley rats as previously described
(Orellana et al., 2010). Briefly, dissected meninges were carefully
peeled off and cortices were mechanically dissociated. Cells were
seeded into 100-mm-diameter culture dishes at a density of 5x10⁶
cells/dish in DMEM, containing 10% FBS. The medium was
changed at 1 and 3 days in vitro (DIV) and microglia were collected
at 10 DIV by orbital shaking. Microglia were seeded onto 35-mm
dishes (2x10⁶ cells/dish) or onto glass coverslips placed in 24-well
plastic plates (5x10⁵ cells/well) in DMEM containing 10% FBS.
ASTROCYTE CULTURES. These cultures were prepared with the
protocol for microglia mentioned before. Cells were seeded onto 35-
mm plastic dishes (Nunclon) or onto glass coverslips (Gassalem,
Limeil-Brevannes, France) placed in 16-mm 24-well plastic plates
(Nunclon) at the density of 5x10⁵ cells/dish or 1x10⁵ cells/well, respec-
tively, in DMEM, supplemented with penicillin (5 U/mL), streptomy-
cin (5 lg/mL), and 10% FBS. After 8–10 DIV, 1 lM cytosine-
arabinoside was added during 3 days to eliminate proliferating micro-
glia. Medium was changed twice a week and cultures were used after 3
weeks. Cultures contained >95% GFAP (1) and S100b (1) cells.
Cell Treatments and Conditioned MediaCultures of microglia, astrocytes or mixed glial cells (1:4 micro-
glia:astrocytes) were stimulated with 1 lg/mL LPS (E. coli.,
O111:B4, Sigma) for 24–96 h. In addition to LPS stimulation, in
different experiments microglia were co-treated with 1 lM L-N6
(iNOS selective inhibitor), 15 lM indometacine (nonselective COXs
inhibitor), 15 lM sc-560 (inhibitor of COX1), 5 lM ns-398
(COX2 inhibitor), 20 lM sc-19220 (EP1 prostanoid receptor antag-
onist) or 0.1-1 ng/mL TGFb1. To obtain conditioned media (CM)
from astrocytes, cells were seeded (2x10⁶ cells in 35 mm dishes) in
DMEM containing 10% FCS under control condition (non stimu-
lated CM) or stimulated with 1 lg/mL LPS for 96 h. Astrocyte
CMs were collected after 96 h of stimulation, filtered (0.22 lm
pore), and stored at 220�C until use. CM were heated at 80�C for
10 min to activate TGFb1 (Munger et al., 1997; Vincent et al.,
1997). When needed, to neutralize TGFb1, CM were incubated
with a neutralizing antibody specific for TGFb1 (3 lg/mL, R&D)
at room temperature for 4 h, before being added to cell cultures
(Vincent et al., 1997). Accordingly, in some experiments cultured
microglia were stimulated with 1 lg/mL LPS and incubated with
2024 Volume 61, No. 12

CM alone or with 10 lM SIS3 (a specific Smad3 inhibitor). A sum-
mary of all pharmacological agents used in this study and their
actions are included in Table 1.
siRNA TransfectionThree unique 27mer siRNA duplexes against rat Panx1 or Cx43
were predesigned and obtained from Origene (Rockville, MD).
siRNA (10 nM) was transfected with Oligofectamine (Invitrogen)
according to the Origene application guide for Trilencer-27 siRNA.
Negligible cell death was detected after transfection (data not
shown). Sequences for siRNAs against rat Panx1 were: siRNA-
Panx1-A: rArGrArCrUrArArArUrArUrGrGrArArArCrGrArGrUrArA
GT; siRNA-Panx1-B: rGrGrArArArCrCrUrGrArGrUrUrUrArGrAr
UrCrArCrUrGAG; siRN-Panx1-C: rGrGrArCrUrUrCrArArArGrAr
UrUrUrGrGrArCrCrUrGrAGC. Sequences for siRNAs against rat
Cx43 were: siRNA-Cx43-B: rGrGrArArGrArGrArArGrCrUrArArAr
CrArArGrArArArGAA, siRNA-Cx43-C: rArGrArCrUrCrArCrArAr
ArUrArCrArGrArUrUrUrGrArATC.
Determination of NitritesNitrites, a stable downstream product of NO released by cells, was
determined in culture media by the Griess assay. Cultures with
3x10⁴ cells were maintained at control condition, or stimulated with
1 lg/mL LPS. For determination of NO2-, 50 lL of medium was
mixed with 10 ll EDTA:H2O 1:1 (0.5 M, pH 8.0) and 60 lL of
freshly prepared Griess reagent (20 mg N-[1-naphtyl]-ethylenedia-
mine and 0.2 g sulphanilamide dissolved in 20 mL of 5% phos-
phoric acid, w/v). Calibration curves were established with 1–80 lM
NaNO2. Absorbency was measured at 570 nm in a microplate auto
reader (ANTHOS 2010, Anthos Labtec Instrument).
Immunofluorescence and Confocal MicroscopyCells grown on coverslips were fixed with 2% paraformaldehyde at
room temperature for 30 min and then washed three times with PBS.
They were incubated in 0.1 M PBS-glycine, three times for 5 min each
and then in 0.1% PBS-Triton X-100 containing 10% NGS for 30 min.
Fc receptors were masked by incubation in Fc-Block (1:100) solution at
room temperature for 45 min. Microglia and astrocytes were identified
with Iba1 and GFAP, respectively. Cells were incubated at room tem-
perature for 2 h with anti-GFAP monoclonal antibody (IgG1, 1:500)
or anti-Iba1 polyclonal antibody (1:400) diluted in 0.1% PBS-Triton
X-100 with 2% NGS. After three rinses with 0.1% PBS-Triton X-100,
cells were incubated at room temperature for 50 min with goat anti-
mouse IgG Alexa Fluor 355 (1:1,500) and goat anti-rabbit IgG Alexa
Fluor 488 (1:1,500). After several washes, coverslips were mounted in
Fluoromount and examined with a confocal laser-scanning microscope
(Olympus, Fluoview FV1000, Tokyo, Japan).
Western Blot AnalysisCultures were rinsed twice with PBS (pH 7.4) and harvested by
scraping with a rubber policeman in ice-cold PBS containing 5 mM
EDTA, Halt (78440) and M-PER protein extraction cocktail
(78501) according to manufacturer instructions (Pierce, Rockford,
IL). The cellular suspension was sonicated on ice. Proteins were
measured using the Bio-Rad protein assay. Aliquots of cell lysates
(100 lg of protein) were resuspended in Laemli’s sample buffer,
TABLE 1: Pharmacological Agents Used in This Study
Agent Action
SIS3 Specific Smad3 inhibitor
aTGFb1 Neutralizing antibody specific for TGFb1
L-N6 Selective inhibitor of iNOS
Indometacin Nonselective inhibitor of COX 1 and 2
NS-398 Selective COX 2 inhibitor
SC-560 Selective COX 1 inhibitor
SC 19220 EP1 Prostanoid receptor antagonist
BAPTA-AM Intracellular calcium chelator
probenecid Panx1 hemichannel blocker
Gap26 Mimetic peptide against Cx43 hemichannels
Cx43E2 Antibody against Cx43 hemichannels
xestospongin B IP3 receptor inhibitor
MRS2179 Selective P2Y1 inhibitor
A740003 Selective P2X7 inhibitor
BBG Nonselective P2X7 inhibitor
oATP Selective P2X7 inhibitor
Orellana et al: Astrocytes Inhibit Inflammatory Activation of Microglia
December 2013 2025

separated in an 8% sodium dodecyl sulfate polyacrylamide gel elec-
trophoresis and electro-transferred to nitrocellulose sheets. Nonspe-
cific protein binding was blocked by incubation of nitrocellulose
sheets in PBS-BLOTTO (5% nonfat milk in PBS) for 30 min. Blots
were then incubated with primary antibody at room temperature for
1 h or at 4�C overnight, followed by four 15 min washes with PBS.
Blots were incubated with goat anti-rabbit antibody conjugated to
HRP. Immunoreactivity was detected by enhanced chemilumines-
cence (ECL) detection using the SuperSignal kit (Pierce, Rockford,
IL) according to the manufacturer�s instructions.
Intracellular Ca21 ImagingCells plated on glass coverslips were loaded with 5 lM Fura-2-AM
in DMEM without serum at 37�C for 45 min and then washed
three times in Locke’s solution (154 mM NaCl, 5.4 mM KCl,
2.3 mM CaCl2, and 5 mM HEPES, pH 7.4) followed by de-
esterification at 37�C for 15 min. The experimental protocol for
[Ca21]i imaging involved data acquisition every 5 s (emission at 510
nm) at 340- and 380-nm excitation wavelengths using an Olympus
BX 51W1I upright microscope with a 40x water immersion objec-
tive. Changes were monitored using an imaging system equipped
with a Retiga 1300I fast-cooled monochromatic digital camera (12-
bit) (Qimaging, Burnaby, BC, Canada), monochromator for fluoro-
phore excitation, and METAFLUOR software (Universal Imaging,
Downingtown, PA) for image acquisition and analysis. Analysis
involved determination of pixels assigned to each cell. The average
pixel value allocated to each cell was obtained with excitation at each
wavelength and corrected for background. Due to the low excitation
intensity, no bleaching was observed even when cells were illumi-
nated for a few minutes. The ratio was obtained after dividing the
340-nm by the 380-nm fluorescence image on a pixel-by-pixel base
(R5F340 nm/F380 nm). Fura-2AM in situ calibration to obtain the
intracellular Ca21 concentration ([Ca21]i) of a single cell was per-
formed according to the equation of Grynkiewicz and colleagues
(Grynkiewicz et al., 1985): [Ca21]i 5 Kd b(R2Rmin)/(Rmax2R),
where Kd 5 224 nM is the dissociation constant of Fura-2AM and
R is the measured F340/F380 ratio. The Rmin was determined by
using 10 mM EGTA 1 10 lM A23187 in Ca21-free Locke’s solu-
tion and Rmax was obtained by using 5 lM ionomycin and 10 mM
CaCl2. b was calculated as the ratio Fmin/Fmax at 380 nm.
Measurement of Extracellular ATP ConcentrationCells were grown in 6-well plates for 15 days, after which they were
incubated in Locke’s solution at 37�C for 30 min. Cells were then
treated with 10 mM glucose for 10 min, and ATP concentration in
the extracellular solution was measured using a luciferin/luciferase
bioluminescence assay kit (Sigma-Aldrich). Baseline measurements
were performed on separate cultures using standard Locke’s solution.
The amount of ATP in each sample was calculated from standard
curves and normalized for the protein concentration as determined
by the BCA assay (Pierce).
Dye Uptake and Time-Lapse Fluorescence ImagingFor “snapshot” experiments, control and treated cells were exposed
to 5 lM Etd bromide at 37�C for 10 min. Then, cells were washed
with Hank�s balanced salt solution (137 mM NaCl; 5.4 mM KCl;
0.34 mM Na2HPO4; 0.44 mM KH2PO4, 1.2 mM CaCl2, pH 7.4),
fixed at room temperature with 2% paraformaldehyde for 30 min
and washed three times with PBS. Afterwards, they were incubated
in 0.1% PBS-Triton X-100 containing 10% NGS for 30 min and
incubated with isolectin GS-IB4-488 (1:100) for 3 h, followed by
four PBS washes. Coverslips were mounted in Fluoromount and
examined with an upright microscope equipped with epifluorescence.
Images of Etd uptake were analyzed with the image J program (NIH
software). For time-lapse fluorescence imaging, cells plated on glass
coverslips were washed twice in Hank�s balanced salt solution. Then,
cells were exposed to Locke’s solution (154 mM NaCl, 5.4 mM
KCl, 2.3 mM CaCl2, 5 mM HEPES, pH 7.4) with 5 lM Etd. Flu-
orescence intensity was recorded in selected cells (ROIs, regions of
interest). Images were captured every 15 s with a QImaging Retiga
13001 fast-cooled monochromatic digital camera (12-bit) (Qimag-
ing, Burnaby, BC, Canada). Metafluor software (version 6.2R5, Uni-
versal Imaging Co., Downingtown, PA, USA) was used for off-line
image analysis and fluorescence quantification. To test for changes in
slope, regression lines were fitted to points before and after various
treatments using Excel program, and mean values of slopes were
compared using GraphPad Prism software and expressed as AU/min.
Cells were pre-incubated with channel blockers, synthetic mimetic
peptides, Gap26 (200 lM; VCYDKSFPISHVR, first extracellular
loop domain of Cx43) and 10panx1 (200 lM, WRQAAFVDSY,
extracellular loop domain of Panx1), for 15 min before experiments
were performed.
Data Analysis and StatisticsFor each data group, results were expressed as mean 6 standard
error (SEM); n refers to the number of independent experiments.
For statistical analysis, each treatment was compared with its respec-
tive control, and significance was determined using a one-way
ANOVA followed, in case of significance, by a Tukey post-hoc test.
Results
TGFb1 Released by Astrocytes Inhibits LPS-InducedNO Production by MicrogliaUnder inflammatory conditions, microglial cell activation
results among other changes, on increased expression of
inducible nitric oxide synthase (iNOS) and NO release (Fie-
bich et al., 1998; Zielasek et al., 1992). Furthermore, micro-
glia exhibit a long-lasting increase in basal [Ca21]i after
stimulation with LPS (Hoffmann et al., 2003), a well-
characterized and widely accepted agent from Gram negative
bacteria known to induce microglial activation (Kloss et al.,
2001). In order to evaluate whether astrocytes could modulate
the release of NO and [Ca21]i by microglia subjected to
inflammatory conditions; microglia, astrocytes or mixed glial
cell cultures were stimulated with 1 lg/mL LPS (Fig. 1A–F).
After stimulation with LPS, microglia in pure cultures became
round shaped and showed shorter and thicker processes with
an increased cell body size in mixed glial cell cultures and
astrocytes became more fibrillary in appearance (Fig. 1A–F).
2026 Volume 61, No. 12

To assess the release of NO, nitrites, a stable derivative of
NO, were measured as previously reported (Tichauer et al.,
2007). Under control conditions, microglia did not exhibit a
significant variation in nitrite levels (Fig. 1G), whereas after
LPS stimulation for 24 h, they showed a �2-fold increase in
nitrites that increased over time up to ~11-fold after 168 h of
stimulation (Fig. 1G). Interestingly, cultures of mixed glial
cells or astrocytes exhibited a �4-fold increase in nitrites
reaching a plateau at 48 h of LPS stimulation that persisted
for at least 120 h (Fig. 1H,I). These results suggest that astro-
cytes appear to inhibit the increased NO production by
microglia after long periods of LPS stimulation (Fig. 1J).
Supporting this view, the proportion of astrocytes on the
mixed glial cell culture was inversely correlated with the
observed NO production by the culture after LPS stimulation
(Fig. 1K).
To determine whether the inhibitory effect of astrocytes
on LPS-induced NO production occurs directly or by soluble
factors released by them, microglia were incubated with con-
ditioned medium (CM) from LPS-stimulated or nonstimu-
lated astrocytes. Interestingly, CM collected from astrocytes
after 96 h of LPS stimulation, reduced LPS-induced nitrite
production by microglia to levels similar to those observed
under control conditions (Figs. 1G and 2A). These data sug-
gest that in LPS-stimulated mix glial cell cultures, the major
source of NO production were astrocytes, because they appear
to almost fully inhibit NO production by microglia (Fig.
1H). Moreover, CM from nonstimulated astrocytes partially
inhibited LPS-induced NO production by microglia, suggest-
ing that both LPS-stimulated and nonstimulated astrocytes
were able to inhibit NO production by microglia (Fig. 2A).
Astrocyte CM collected at different times of LPS stimulation
(24-168 h) exhibited a similar inhibitory effect (not shown).
It has been previously shown that TGFb1 reduces LPS-
induced NO release by microglia (Vincent et al., 1997).
Accordingly, we investigated whether TGFb1 was the soluble
FIGURE 1: Astrocytes inhibit LPS-induced NO production by microglia. A–F: Representative confocal images depicting Iba1 (green) andGFAP (red) immunolabeling in microglia cultures (A–B), microglia-astrocyte co-cultures (mixed glial cultures; C–D) or astroglial cultures(E–F) subjected to control conditions or stimulated with LPS for 96 h. Calibration bar 5 50 lm. G–I: Nitrite levels in microglia cultures(MG, G) under control conditions (white circles) or after LPS treatment (black circles), mixed glial (MG:AS, 1:4, H) or astrocyte cultures(AS, I). J: Nitrite production under control conditions (white bars) or after 96 h of LPS treatment (black bars) in mixed glial cultures(MG:AS, 1:4), astrocyte (AS) or microglia cultures (MG). K: Nitrite production after LPS treatment of mixed cultures with the followingratios of microglia:astrocytes: 1:4 (white circles), 2:3 (light gray circles), 4:1 (white squares) and 5:0 (black squares). *P < 0.05, LPS com-pared with control; #P < 0.05, MG compared to AS after LPS treatment. Averages were obtained from at least three independentexperiments in triplicate.
Orellana et al: Astrocytes Inhibit Inflammatory Activation of Microglia
December 2013 2027

factor released from astrocytes that inhibited LPS-induced
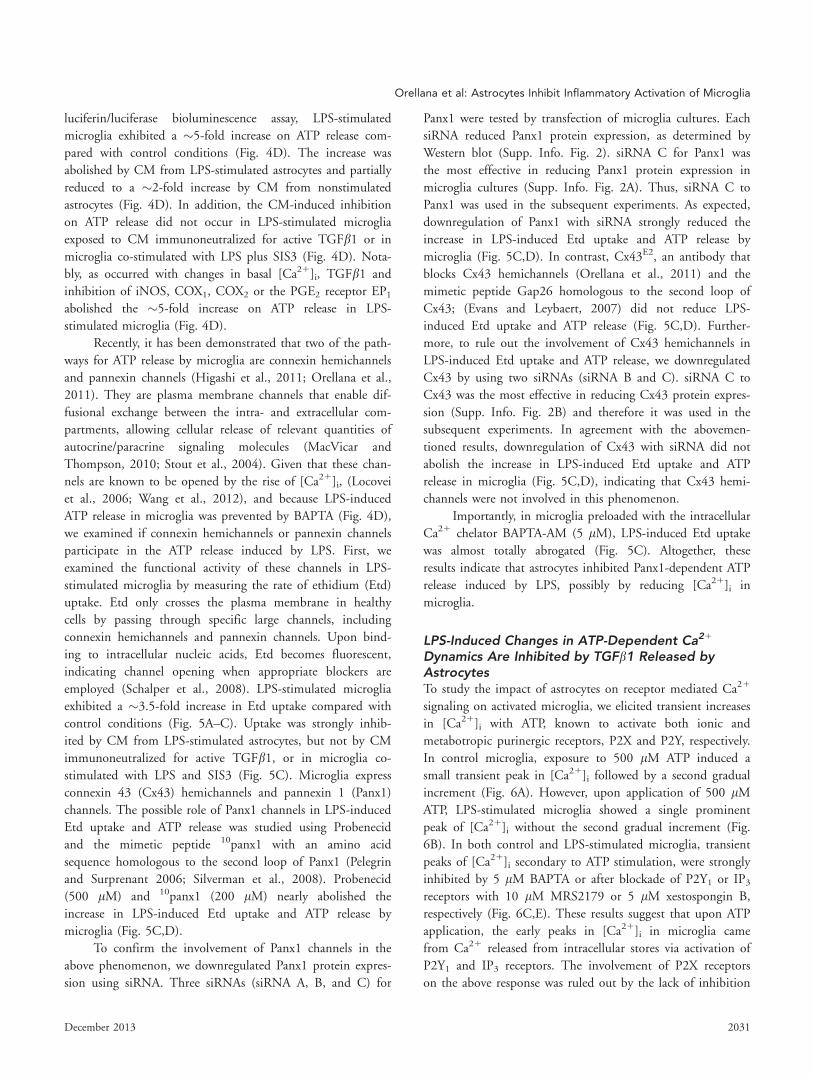
nitrite production by microglia. At 96 h of LPS stimulation,
microglia exhibited a �9-fold increase in nitrites over control
conditions that was conspicuously reduced to �2-fold
increase by CM from LPS-stimulated astrocytes and partially
reduced to �5-fold increase by CM from nonstimulated
astrocytes (Fig. 2B). The CM-induced inhibition on NO pro-
duction by LPS-stimulated microglia did not occur when the
CM was immunoneutralized with an antibody specific for
active TGFb1 (Fig. 2B). Similar results in nitrite levels were
obtained when microglia were co-treated with LPS plus SIS3,
a specific inhibitor of Smad3 (Fig. 2B), a key protein
involved in the intracellular signaling triggered by the activa-
tion of the TGFb receptor. Because these results strongly sug-
gested that TGFb1 was the soluble factor released from
astrocytes in this system, we evaluated if addition of recombi-
nant TGFb1 could mimic the CM-induced inhibition on
NO production. Thus, when microglia were co-treated with
LPS plus 0.1 or 1 ng/ml TGFb1, they exhibited nitrite levels
similar to control microglia (Fig. 2B). These data strongly
indicate that TGFb1 released from astrocytes inhibits NO
release by microglia stimulated with LPS. Accordingly, we
observed that after 96 h of stimulation, LPS-treated astrocytes
exhibited an increased production of TGFb1 compared with
nonstimulated astrocytes (not shown). This result explains
why CM from LPS-treated astrocytes was more effective than
CM from non stimulated astrocytes for reducing LPS-
induced NO production by microglia (Fig. 2B).
Because 1 lM LN-6, a specific iNOS blocker, greatly
reduced the �8-fold increase of nitrites in LPS-stimulated
microglia to control levels (Fig. 2B), we performed a western
blot analysis to determine whether CM-induced inhibition on
nitrite production depended on changes in iNOS protein lev-
els. CM from LPS-stimulated astrocytes completely inhibited
the �3.5-fold increase of iNOS protein level induced by LPS
in microglia, whereas CM from nonstimulated astrocytes did
FIGURE 2: TGFb1 released by astrocytes inhibits LPS-induced nitrite production by microglia. A: NO production by microglial cell cul-tures after increasing periods of LPS treatment alone (96 h, black circles) or in combination with conditioned media (CM) from astrocytesstimulated with LPS (96 h, white diamonds) or CM from nonstimulated astrocytes (gray diamonds). B: NO production by microglia undercontrol conditions or stimulated with LPS (96 h) alone or in combination with CM from nonstimulated or LPS stimulated (96 h) astro-cytes. In addition, NO production by microglia stimulated with LPS (96 h) plus TGFb1 (0.1 and 1 ng/ml) or L-N6 (1 lM) was analyzed.Immunoneutralization of TGFb1 (aTGFb1) or SIS3 treatment abolished the reduction on NO production induced by the CM from LPS-stimulated astrocytes. *P < 0.05, **P < 0.005, for treatments compared with control; ##P < 0.005; compared with LPS stimulation. Aver-ages were obtained from at least four independent experiments in triplicate. C: Protein level of iNOS in microglia cultures under controlcondition (Lane 1), stimulated with LPS for 96 h (Lane 2) alone, or in combination with CM from nonstimulated (Lane 3) or 96 h LPS-stimulated astrocytes (Lane 4). SIS3 treatment (Lane 5) or immunoneutralization of TGFb1 with aTGFb1 (Lane 6) abolished the reductionon iNOS levels induced by CM from LPS-stimulated astrocytes. In addition, protein levels of iNOS in microglia stimulated with LPS plusTGFb1 (0.1 ng/mL, Lane 7) are shown. Protein expression was normalized by the corresponding level of a-tubulin. D: Quantification ofprotein levels of iNOS from three independent experiments. *P < 0.05 for treatments compared with control; #P < 0.05; for treatmentscompared with LPS stimulation.
2028 Volume 61, No. 12

not produce a similar inhibition (Fig. 2C,D). Supporting the
regulatory role of astroglial TGFb1 on iNOS expression,
CM-induced inhibition of iNOS did not occur when LPS-
stimulated microglia were exposed to CM previously immu-
noneutralized for TGFb1, or in microglia co-treated with
LPS plus SIS3 (Fig. 2C,D). These data, along with the fact
that TGFb1 reduced iNOS levels to control values in LPS-
stimulated microglia (Fig. 2C,D), suggest that CM-induced
inhibition of NO release occurs by a TGFb1-dependent inhi-
bition of iNOS expression.
To elucidate whether astroglial modulation of LPS-
induced NO release was correlated with changes in microglial
activation, we used confocal microscopy to evaluate the expres-
sion of CD68 (marker for macrophage function) and major
histocompatibility complex II (MHC II) (marker for antigen
presentation activity). Under control conditions, microglia
exhibited low levels of CD68 or MHC II (Fig. 3A,M),
whereas they shown a robust increase in the expression of
both markers after LPS stimulation for 96 h (Fig. 3E,Q;
Supp. Info. Fig. 1). Importantly, CM from LPS-stimulated
astrocytes changed the LPS-induced increase in CD68 and
MHC II expression to levels similar to those observed under
control conditions (Fig. 3I,U; Supp. Info. Fig. 1). These data
indicate that astrocytes inhibited microglial cell activation
induced by LPS.
Increased Basal Intracellular Ca21 in LPS-StimulatedMicroglia Depends on iNOS/PGE2 Pathway and IsInhibited by TGFb1 Released by AstrocytesAs mentioned, microglia exhibit a long-lasting increase in
basal [Ca21]i after LPS stimulation (Hoffmann et al., 2003).
However, whether astrocytes could modulate this process
remains to be elucidated. We examined the effect of CM
from LPS-stimulated or nonstimulated astrocytes in [Ca21]i
of LPS-stimulated microglia. Measurement of Fura-2AM ratio
(340/380) showed that control microglia exhibited a low
[Ca21]i (Fig. 4A,C). At 96 h of LPS stimulation, microglia
exhibited a �5-fold increase in basal [Ca21]i compared with
the control condition; increase that was abolished by CM
from LPS-stimulated astrocytes and was partially reduced to a
�3-fold increase by CM from nonstimulated astrocytes (Fig.
4B,C). Importantly, the CM-induced inhibition on basal
Ca21 signal did not occur in LPS-stimulated microglia
exposed to CM that was previously immunoneutralized for
FIGURE 3: LPS-induced increase in CD68 and MHCII expression is inhibited by astrocytes. A–L: Representative confocal images depictingIba1 (green) and CD-68 (red) immunolabeling of microglia under control condition (A–D), stimulated with LPS for 96 h alone (E–H) or incombination with CM from LPS stimulated astrocytes (I–L). Insets of representative microglia (*) labeled for Iba1, CD68, or merged arealso shown for Panels A, E, and I. M–X: Representative confocal images depicting Iba1 (green) and MHCII (red) immunolabeling of micro-glia under control condition (M–P), stimulated with LPS for 96 h alone (Q–Y) or in combination with CM from LPS stimulated astrocytes(U-X). The respective insets of representative microglia (*) with staining for Iba1, MHCII or merge are also shown for panels M, Q and U.Scale bar 5 8 lm.
Orellana et al: Astrocytes Inhibit Inflammatory Activation of Microglia
December 2013 2029

TGFb1, or in microglia co-stimulated with LPS and SIS3
(Fig. 4C). As expected, recombinant TGFb1 reduced the
�5-fold increase in basal [Ca21]i in LPS-stimulated microglia
to control values (Fig. 4C), indicating that CM-induced inhi-
bition in basal [Ca21]i depended on the TGFb1 secreted by
astrocytes.
Because both the increase in NO production and the
basal [Ca21]i were inhibited by TGFb1, we examined
whether both responses were linked. It has been previously
shown that NO increases COX2 activity and prostaglandin E2
(PEG2) production by macrophages (Salvemini et al., 1993),
whereas the latter could further increase [Ca21]i via its action
on the G protein-coupled PEG2 receptor 1 (EP1 receptor)
(Woodward et al., 2011). iNOS and COXs inhibition by
L-N6 and indometacin, respectively, reduced the �5-fold
increase on basal [Ca21]i observed in LPS-stimulated micro-
glia to control values (Fig. 4C). To determine which COX
was involved in the response, we employed sc-560 and
ns-398, specific inhibitors for COX1 and COX2, respectively.
Thus, sc-560 reduced to �3-fold the increase of basal [Ca21]i
observed in LPS-stimulated microglia, whereas ns-398 com-
pletely abolished it (Fig. 4C). Importantly, inhibition of EP1
receptor with sc-19220 reduced [Ca21]i to control values in
LPS-stimulated microglia (Fig. 4C). All this evidence indicates
that the increased [Ca21]i found in LPS-stimulated microglia
depended on the activation of the iNOS/COXs pathway and
activation of the PGE2 receptor EP1.
TGFb1 Released by Astrocytes Inhibits LPS-InducedIncrease in ATP Release Via Pannexin1 ChannelsMicroglia exposed to inflammatory conditions, including
exposure to LPS, show an increased release of the gliotransmit-
ter ATP (Ferrari et al., 1997; Fujita et al., 2008; Kim et al.,
2007). We examined whether the increase in [Ca21]i observed
in LPS-stimulated microglia could be associated with increased
release of ATP. As shown by ATP measurement with the
FIGURE 4: TGFb1 released by astrocytes inhibits increased basal intracellular Ca21 and ATP release in LPS-stimulated microglia. A, B:Representative fluorescence micrographs of basal Fura-2AM ratio (pseudo-colored scale) in microglia under control condition (A) orstimulated with LPS by 96 h (B). C, D: Averaged data of [Ca21]i (C) and ATP release (D) by microglia under control conditions or stimu-lated with LPS (96 h) alone or in combination with the following blockers: 1 lM L-N6; 15 lM indometacin (indomet); 1 lM sc-560; 5 lMns-398; 20 lM sc-19220. In addition, basal Fura-2AM ratio and ATP release were analyzed in microglia stimulated with LPS (96 h) in com-bination with CM from astrocytes nonstimulated or stimulated with LPS (96 h). Immunoneutralization of TGFb1 (aTGFb1) or SIS3 treat-ment abolished the reduction on basal [Ca21]i and ATP release induced by CM from LPS-stimulated astrocytes. In addition, basal [Ca21]iand ATP release by microglia stimulated with LPS (96 h) in combination with TGFb1 (0.1 ng/mL) were analyzed. **P < 0.005, treatmentscompared with control; ##P < 0.005, #P < 0.05; treatments compared with LPS stimulation. Averages were obtained from at least fourindependent experiments in triplicate. Scale bar 5 25 lm.
2030 Volume 61, No. 12
luciferin/luciferase bioluminescence assay, LPS-stimulated
microglia exhibited a �5-fold increase on ATP release com-
pared with control conditions (Fig. 4D). The increase was
abolished by CM from LPS-stimulated astrocytes and partially
reduced to a �2-fold increase by CM from nonstimulated
astrocytes (Fig. 4D). In addition, the CM-induced inhibition
on ATP release did not occur in LPS-stimulated microglia
exposed to CM immunoneutralized for active TGFb1 or in
microglia co-stimulated with LPS plus SIS3 (Fig. 4D). Nota-
bly, as occurred with changes in basal [Ca21]i, TGFb1 and
inhibition of iNOS, COX1, COX2 or the PGE2 receptor EP1
abolished the �5-fold increase on ATP release in LPS-
stimulated microglia (Fig. 4D).
Recently, it has been demonstrated that two of the path-
ways for ATP release by microglia are connexin hemichannels
and pannexin channels (Higashi et al., 2011; Orellana et al.,
2011). They are plasma membrane channels that enable dif-
fusional exchange between the intra- and extracellular com-
partments, allowing cellular release of relevant quantities of
autocrine/paracrine signaling molecules (MacVicar and
Thompson, 2010; Stout et al., 2004). Given that these chan-
nels are known to be opened by the rise of [Ca21]i, (Locovei
et al., 2006; Wang et al., 2012), and because LPS-induced
ATP release in microglia was prevented by BAPTA (Fig. 4D),
we examined if connexin hemichannels or pannexin channels
participate in the ATP release induced by LPS. First, we
examined the functional activity of these channels in LPS-
stimulated microglia by measuring the rate of ethidium (Etd)
uptake. Etd only crosses the plasma membrane in healthy
cells by passing through specific large channels, including
connexin hemichannels and pannexin channels. Upon bind-
ing to intracellular nucleic acids, Etd becomes fluorescent,
indicating channel opening when appropriate blockers are
employed (Schalper et al., 2008). LPS-stimulated microglia
exhibited a �3.5-fold increase in Etd uptake compared with
control conditions (Fig. 5A–C). Uptake was strongly inhib-
ited by CM from LPS-stimulated astrocytes, but not by CM
immunoneutralized for active TGFb1, or in microglia co-
stimulated with LPS and SIS3 (Fig. 5C). Microglia express
connexin 43 (Cx43) hemichannels and pannexin 1 (Panx1)
channels. The possible role of Panx1 channels in LPS-induced
Etd uptake and ATP release was studied using Probenecid
and the mimetic peptide 10panx1 with an amino acid
sequence homologous to the second loop of Panx1 (Pelegrin
and Surprenant 2006; Silverman et al., 2008). Probenecid
(500 lM) and 10panx1 (200 lM) nearly abolished the
increase in LPS-induced Etd uptake and ATP release by
microglia (Fig. 5C,D).
To confirm the involvement of Panx1 channels in the
above phenomenon, we downregulated Panx1 protein expres-
sion using siRNA. Three siRNAs (siRNA A, B, and C) for
Panx1 were tested by transfection of microglia cultures. Each
siRNA reduced Panx1 protein expression, as determined by
Western blot (Supp. Info. Fig. 2). siRNA C for Panx1 was
the most effective in reducing Panx1 protein expression in
microglia cultures (Supp. Info. Fig. 2A). Thus, siRNA C to
Panx1 was used in the subsequent experiments. As expected,
downregulation of Panx1 with siRNA strongly reduced the
increase in LPS-induced Etd uptake and ATP release by
microglia (Fig. 5C,D). In contrast, Cx43E2, an antibody that
blocks Cx43 hemichannels (Orellana et al., 2011) and the
mimetic peptide Gap26 homologous to the second loop of
Cx43; (Evans and Leybaert, 2007) did not reduce LPS-
induced Etd uptake and ATP release (Fig. 5C,D). Further-
more, to rule out the involvement of Cx43 hemichannels in
LPS-induced Etd uptake and ATP release, we downregulated
Cx43 by using two siRNAs (siRNA B and C). siRNA C to
Cx43 was the most effective in reducing Cx43 protein expres-
sion (Supp. Info. Fig. 2B) and therefore it was used in the
subsequent experiments. In agreement with the abovemen-
tioned results, downregulation of Cx43 with siRNA did not
abolish the increase in LPS-induced Etd uptake and ATP
release in microglia (Fig. 5C,D), indicating that Cx43 hemi-
channels were not involved in this phenomenon.
Importantly, in microglia preloaded with the intracellular
Ca21 chelator BAPTA-AM (5 lM), LPS-induced Etd uptake
was almost totally abrogated (Fig. 5C). Altogether, these
results indicate that astrocytes inhibited Panx1-dependent ATP
release induced by LPS, possibly by reducing [Ca21]i in
microglia.
LPS-Induced Changes in ATP-Dependent Ca21
Dynamics Are Inhibited by TGFb1 Released byAstrocytesTo study the impact of astrocytes on receptor mediated Ca21
signaling on activated microglia, we elicited transient increases
in [Ca21]i with ATP, known to activate both ionic and
metabotropic purinergic receptors, P2X and P2Y, respectively.
In control microglia, exposure to 500 lM ATP induced a
small transient peak in [Ca21]i followed by a second gradual
increment (Fig. 6A). However, upon application of 500 lM
ATP, LPS-stimulated microglia showed a single prominent
peak of [Ca21]i without the second gradual increment (Fig.
6B). In both control and LPS-stimulated microglia, transient
peaks of [Ca21]i secondary to ATP stimulation, were strongly
inhibited by 5 lM BAPTA or after blockade of P2Y1 or IP3
receptors with 10 lM MRS2179 or 5 lM xestospongin B,
respectively (Fig. 6C,E). These results suggest that upon ATP
application, the early peaks in [Ca21]i in microglia came
from Ca21 released from intracellular stores via activation of
P2Y1 and IP3 receptors. The involvement of P2X receptors
on the above response was ruled out by the lack of inhibition
Orellana et al: Astrocytes Inhibit Inflammatory Activation of Microglia
December 2013 2031

after exposure to 200 lM oATP, a general P2X receptor
blocker, or 10 lM A740003 and 10 lM brilliant blue G
(BBG), both P2X7 receptor blockers (Fig. 6E). In contrast,
the second increase in [Ca21]i observed upon ATP stimula-
tion in control microglia was abolished by 10 lM A740003,
suggesting the involvement of P2X7 receptors on this response
(Fig. 6D).
Interestingly, the ATP-induced peak of [Ca21]i was
almost entirely inhibited in LPS-stimulated microglia when
they were treated with CM from LPS-stimulated astrocytes
(Fig. 7A,B). In those conditions, LPS-stimulated microglia
shown [Ca21]i responses that were similar to those observed
in control microglia. Moreover, CM-induced inhibition on
ATP-induced [Ca21]i did not occur in LPS-stimulated micro-
glia exposed to CM immunoneutralized for active TGFb1, or
in microglia co-stimulated with LPS plus SIS3 (Fig. 7B).
Furthermore, as observed for the changes in basal [Ca21]i and
ATP release, TGFb1 and the inhibition of iNOS, COX1,
COX2 or the PGE2 receptor EP1 turned the ATP-induced
[Ca21]i to control values in LPS-stimulated microglia (Fig. 7B).
LPS-Induced Nitrite Production Depends onActivation of COXs, EP1 Receptors, Panx1Channels, and P2 ReceptorsFinally, we examined whether LPS-induced NO production
by microglia could have a self-perpetuating mechanism,
involving activation of COXs, PGE2 receptor EP1 and further
activation of P2 receptors via ATP released through Panx1
channels. Sc-560 and ns-398, inhibitors of COX1 and COX2,
respectively, as well as inhibition of EP1 receptor with
FIGURE 5: Increased ATP release observed in LPS-stimulated microglia occurs via Panx1 channels. A, B: Representative immunofluores-cence images depicting IB4 (white) labeling and Etd (red) nuclei-staining from dye uptake experiments (10 min exposure to Etd) in micro-glia cultures under control conditions (A) or treated with LPS for 96 h (B). High magnification inserts of microglia stained for IB4 and Etdare also shown. C, D: Averages of Etd uptake rate (C) and ATP release (D) by microglia under control condition or stimulated with LPS(96 h) alone or in combination with the following treatments: 0.1 ng/ml TGFb1; 5 lM BAPTA; 500 lM Probenecid (Prob); 200 lM10panx1; siRNAPanx1; 200 lM Gap26; 1:500 Cx43E2 and siRNACx43. TGFb1 immunoneutralization (aTGFb1) or SIS3 treatment preventedthe reduction on Etd uptake induced by CM from LPS-stimulated astrocytes. *P < 0.05, treatments compared with control; #P < 0.05;treatments compared with LPS stimulation. Averages were obtained from at least four independent experiments in triplicate. Scale bar5 20 lm.
2032 Volume 61, No. 12

sc-19220 and 5 lM BAPTA, partially reduced LPS-induced
NO production by microglia (Fig. 8). These results indicate
that increased levels of [Ca21]i likely associated with activa-
tion of COXs and PGE2 receptor EP1 were necessary to sus-
tain LPS-induced nitrite production by microglia. Moreover,
NO production in LPS-stimulated microglia was strongly
reduced by Probenecid (500 lM), 10panx1 (200 lM) or
siRNA against Panx1 (Fig. 8). In contrast, Gap26, Cx43E2
and siRNA against Cx43 did not reduce NO production
(Fig. 8). In addition, inhibition of P2Y1 and P2X7 receptors
by MRS2179 and A740003, respectively, partially reduced
LPS-induced NO production by microglia. Therefore, this
evidence support the idea that activation of P2 receptors via
ATP released through Panx1 channels appears to be crucial
for preserving high levels of NO production by LPS-
stimulated microglia.
Discussion
Our work demonstrates that astrocytes inhibit the inflamma-
tory profile triggered by LPS in microglia. TGFb1 released by
astrocytes reduced LPS-induced increase of [Ca21]i and ATP
release in microglia. Moreover, LPS-induced increase in [Ca21]i
required the involvement of iNOS, COX1, COX2, and the
PGE2 receptor EP1. The increase in [Ca21]i was related to
ATP release through the opening of Panx1 channels. In addi-
tion, TGFb1 released by astrocytes also abolished LPS-induced
changes in ATP-dependent intracellular Ca21 dynamics in
microglia. Interestingly, intracellular Ca21 linked to COX/EP1
receptor signaling and activation of P2 receptors through ATP
released through Panx1 channels were crucial to preserve the
NO production observed in LPS-stimulated microglia.
Previous studies have demonstrated that LPS increases
expression of iNOS and NO production via NF-kB pathway
FIGURE 6: ATP-dependent Ca21 dynamics in microglia depends on their inflammatory profile. A–D: Plots of relative changes in [Ca21]iover time induced by 500 lM ATP (gray vertical line) on microglia under control condition (A) or stimulated with LPS by 96 h (B). Theeffect of 10 lM MRS2179 and 10 lM A740003 on ATP-triggered Ca21 signal of LPS-stimulated microglia (C) or control microglia (D),respectively. E: Average data of maximal [Ca21]i intensity during the transient peak in control or LPS-stimulated microglia exposed toATP alone or in combination with the following blockers: 5 lM BAPTA; 5 lM xestospongin (XeB); 10 lM MRS2179; 10 lM A740003; 10lM Brilliant blue G (BBG), and 200 lM oxidized ATP (oATP). #P < 0.05, blockers compared with control; *P < 0.05, LPS treatment com-pared with control; &P < 0.05, blockers compared with LPS treatment. Averages were obtained from at least four independent experi-ments in triplicate.
Orellana et al: Astrocytes Inhibit Inflammatory Activation of Microglia
December 2013 2033

in microglia both in vitro and in vivo (Han et al., 2001; Pos-
sel et al., 2000). More importantly, astrocytes are able to
inhibit this LPS-induced response by the release of TGFb(Vincent et al., 1997; Vincent et al., 1996). In agreement
with these studies, we found that as the proportion of astro-
cytes increased on a mixed glial cell culture, NO production
induced by LPS stimulation was progressively reduced. As
indicated also by previous studies (Vincent et al., 1997;
Vincent et al., 1996), by using SIS3 and TGFb1 immuno-
neutralization, we determined that the activation of the
TGFb1 pathway was necessary for the inhibitory effect of
astrocytes on NO production and iNOS expression. However,
our data indicated that this phenomenon was extended to
other properties of activated microglia, including Ca21
dynamics and ATP release, and was closely associated with
them by specific activation pathways. In fact, by using selec-
tive inhibitors of iNOS, COX1, COX2 and PGE2 receptor
EP1, we shown that LPS-induced increase in basal [Ca21]i on
microglia involved the participation of several elements start-
ing with NO production and ending with further activation
of PGE2 receptor EP1 (Fig. 9). Supporting this idea, it is
known that NO activates COXs enzymes (Salvemini et al.,
1993), which further produce prostaglandins and the activation
of prostanoid receptors (Woodward et al., 2011). Relevant to
this point, we found that LPS-induced increase in basal [Ca21]i
on microglia depended on PGE2 receptor EP1, which has been
detected in microglia (Li et al., 2011) and trigger release of
Ca21 from intracellular stores (Woodward et al., 2011).
Currently, ATP is considered to be an essential transmit-
ter in the intercellular communication among glial cells and
neurons, and can be released through membrane channels and
vesicles (Fields and Burnstock 2006). Moreover, ATP has been
implicated in the activation and chemotaxis-related features of
microglia upon inflammatory stimulation (Davalos et al.,
2005; Farber and Kettenmann 2006). Here, we demonstrated
that LPS-induced ATP release by microglia occurred via Panx1
channels and depended on intracellular Ca21 levels, EP1
receptor, COXs and iNOS. Accordingly, the LPS-induced
FIGURE 8: Increased NO production by LPS-stimulated microgliadepends on COXs and Panx1 channel activation. Nitrite levels inmicroglia cultures under control conditions or stimulated withLPS (96 h) alone or in combination with the following blockers: 1lM sc-560; 5 lM ns-398, 20 lM sc-19220, 5 lM BAPTA; 500 lMProbenecid (Prob); 200 lM 10panx1; siRNAPanx1; 200 lM Gap26;1:500 Cx43E2 and siRNACx43. *P < 0.05, **P < 0.005 treatmentscompared with LPS stimulation. Averages were obtained from atleast four independent experiments in triplicate.
FIGURE 7: LPS-induced changes in ATP-dependent Ca21 dynamics are inhibited by astroglial TGFb1. A: Relative changes in ATP-triggered Ca21 signal ([Ca21]i) over time in microglia stimulated with LPS (96 h) in combination with CM collected from astrocytes stimu-lated with LPS (96 h). Photomicrographs of time-lapse images showing changes in Fura-2AM ratio (pseudo-colored scale) are also shown.B: Averaged data of maximal [Ca21]i intensity during the ATP-induced transient peak by microglia under control conditions or stimulatedwith LPS (96 h) alone or in combination with the following blockers: 1 lM L-N6; 15 lM indometacin; 1 lM sc-560; 5 lM ns-398, 20 lMsc-19220. In addition, maximal [Ca21]i intensity during the ATP-induced peak were analyzed in microglia stimulated with LPS (96 h) incombination with CM from non stimulated astrocytes or astrocytes stimulated with LPS (96 h). TGFb1 immunoneutralization (aTGFb1) orSIS3 treatment fully prevented the reduction in maximal [Ca21]i induced by CM from LPS-stimulated astrocytes. The maximal [Ca21]i dur-ing the ATP-induced peak by microglia stimulated with LPS (96 h) in combination with TGFb1 (0.1 ng/mL) is also shown. **P < 0.005,treatments compared with control; #P < 0.05, ##P < 0.005; treatments compared with LPS stimulation. Averages were obtained from atleast four independent experiments in triplicate.
2034 Volume 61, No. 12

increase in ATP release was not detected after Panx1 channel
blockade with probenecid and 10panx1, or in microglia treated
with siRNA for Panx1. In agreement with this interpretation,
an increase in Etd uptake was observed in LPS-stimulated
microglia that was totally inhibited by Panx1 channel blockers
(e.g., probenecid and 10panx1) and downregulation of Panx1.
In contrast, Cx43 hemichannel blockers (e.g., Gap26 and
Cx43E2) or downregulation of Cx43 had no effect on Etd
uptake, indicating that channels composed by Panx1 were the
major contributors to this response. These results are consist-
ent with previous patch clamp and dye uptake experiments
showing that microglia exposed to inflammatory conditions
express functional single plasma membrane channels formed
by Panx1 (Orellana et al., 2011; Takeuchi et al., 2006).
Because LPS-induced Panx1 channel activity was inhibited by
blockers of iNOS, COXs, EP1 receptor and intracellular Ca21
levels, activation of Panx1 channels likely occurred down-
stream on the signaling pathway triggered by LPS (Fig. 9).
Our experiments with BAPTA indicated that intracellular
Ca21 levels were critical for ATP release and channel activity,
which is coherent with previous studies showing that ATP
released via Panx1 channels is mediated by rising [Ca21]i
(Locovei et al., 2006). Remarkably, as already observed for
other LPS-induced responses, astrocytes were able to reduce
the LPS-induced increase of Panx1 channel activity and ATP
release through the inhibitory effect of TGFb1.
As already mentioned, intracellular Ca21 dynamics serve
as a tight sensitive system to mediate intercellular communi-
cation among glial cells through the release of gliotransmit-
ters, cytokines and growth factors (Farber and Kettenmann,
2006; Koizumi, 2010). Because LPS stimulation of microglia
resulted in further release of ATP, we evaluated whether this
transmitter could affect Ca21 dynamics. Microglia express
two families of ATP receptors, G-protein coupled-type P2
receptors (P2Y receptors) and ionotropic P2 receptors (P2X
receptors). Previous studies with microglia revealed that ATP
(500 lM) produce a biphasic [Ca21]i response: the release of
stored Ca21 (first spike) and Ca21 influx from the extracellu-
lar medium (second shoulder) (Ferrari et al., 1996; Moller
et al., 2000; Verderio and Matteoli, 2001). The first spike in
the ATP-induced [Ca21]i response depend on P2Y receptors,
whereas the second shoulder response occurs via P2X7 recep-
tor activation. Accordingly, upon acute ATP stimulation con-
trol microglia exhibited an intracellular Ca21 increase
associated with P2Y1 and P2X7 receptors, whereas LPS-
stimulated microglia exhibited an intracellular Ca21 profile
characterized by activation of only P2Y1 receptors. The latter
acute ATP-induced Ca21 dynamics were inhibited by
FIGURE 9: Astroglial modulation of ATP-induced Ca21 dynamics in LPS-stimulated microglia. A: Under control conditions, extracellularATP and its derivates activate both P2X7 (1) and P2Y1 (2) receptors in resting microglia. Activation of P2Y7 receptors lead to a directincrease of [Ca21]i, whereas activation of P2Y1 receptors trigger the induction of IP3 receptors (3) and further release Ca21 stored in theendoplasmic reticulum (4). B: Upon LPS stimulation, microglia respond with intracellular signal transduction leading to iNOS activation,NO production, COXs activation and further production of PGE2 by an unknown mechanism (1). PGE2 released by microglia binds itsEP1 metabotropic receptors (2) produces the release of Ca21 from intracellular stores (3). The later increases [Ca21]i, a known conditionthat induces opening of Panx1 channels and release of ATP through them (4). ATP released via Panx1 channels and its degradation toADP activate P2Y1 (5) receptors, which induces activation of IP3 receptors (6) and further release of Ca21 stored in the endoplasmicreticulum (7). The later induces an unknown self-perpetuating mechanism (see discussion), in which high levels of [Ca21]i could reactivateiNOS, COXs, EP1 metabotropic receptors, and Panx1 channels (8). Astrocytes stimulated with LPS release TGFb1 (9), which inhibits LPS-induced intracellular signal transduction causing iNOS activation (10). An alternative negative feedback loop is the inhibitory effect thatATP could have on Panx1 channels (11). Finally, paracrine release of ATP from microglia could act on neighboring or distant microglia,resulting in an additional feed-forward mechanism (not depicted).
Orellana et al: Astrocytes Inhibit Inflammatory Activation of Microglia
December 2013 2035

BAPTA, MRS2179, and xestospongin B, but not by P2X
receptor blockers, revealing the involvement of the metabo-
tropic P2Y1 receptors, IP3 receptors and intracellular Ca21
stores. Given that ADP is the major ligand for P2Y1 recep-
tors, and because they participate in microglia Ca21 dynamics
(De Simone et al., 2010), in our system, ADP derived from
ATP degradation likely triggered the P2Y1-dependent changes
in [Ca21]i evoked by acute ATP administration.
Interestingly, the above described Ca21 response associ-
ated to P2Y1 receptors were completely inhibited when LPS-
stimulated microglia were treated with blockers of iNOS,
COXs or EP1 receptors, showing a similar Ca21 dynamic
profile to control microglia. These data indicate that Ca21
dynamics triggered by ATP depended on the inflammatory
profile of microglia. When components of LPS signaling were
inhibited, microglia behavior changed to a control profile. In
agreement with this idea, TGFb1 released by astrocytes
changed the Ca21 dynamic profile of LPS-stimulated micro-
glia to that observed in control microglia. TGFb1 has been
involved as a protective agent in several brain disorders by
reducing microglial activation (Flores and von Bernhardi
2012; Herrera-Molina et al., 2012; Uribe-San Martin et al.,
2009), in agreement with our results. Despite that in our sys-
tem, besides TGFb1 released from astrocytes, participation of
other factors released by astrocytes could not be ruled out.
Little is known about how the crosstalk among astrocytes
and microglia could modulate neuronal fate. Nevertheless,
gliotransmitter release depending on Ca21 dynamics stands up
as a possible mechanism for long-distance communication and
stimulation. Here, we showed that astrocytes could modulate
Ca21 dynamics and ATP release in microglia through the
release of factors that alter intracellular signaling (Fig. 9).
Moreover, our data showed that intracellular Ca21 linked to
COX/EP1 receptor signaling and P2 receptor activation, likely
via ATP released through Panx1 channels, were crucial to pre-
serve the NO production observed in LPS-stimulated micro-
glia. The latter could induce a self-perpetuating mechanism,
in which high levels of [Ca21]i could reactivate COXs, EP1
metabotropic receptors and Panx1 channels (Fig. 9). There-
fore, ATP released from microglia could stimulate distant
microglia in a paracrine manner, resulting in microglia Ca21
responses that could depend on the microglia inflammatory
profile (Fig. 9). If so, the activation of purinergic P2Y recep-
tors could be turned off in part by diffusion of ATP to distal
regions as well as by desensitization of P2Y1 receptors and
degradation of extracellular ATP by exonucleases. In addition,
astrocytes could modulate and suppress this self-perpetuating
mechanism triggered by inflammatory conditions in microglia.
In parallel, an alternative negative feedback loop is the inhibi-
tory effect that could be exerted by ATP on Panx1 channels as
previously described (Qiu and Dahl, 2009).
Future studies will be required to determine whether
astrocytes could inhibit the inflammatory profile of microglia
in vivo, leading to effective neuroprotection in diverse brain
pathologies. Understanding the mechanisms underlying glial
interaction can contribute to the knowledge on neuronal fate
in neurodegenerative conditions and open novel pharmaco-
logical strategies for therapeutic treatment of neurodegenera-
tive diseases.
Acknowledgment
Grant sponsor: CONICYT; Grant number: 79090028.
Grant sponsor: FONDECYT; Grant number: 11121133,
1090353, 1131025.
ReferencesAnrather J, Gallo EF, Kawano T, Orio M, Abe T, Gooden C, Zhou P, IadecolaC. 2011. Purinergic signaling induces cyclooxygenase-1-dependent prosta-noid synthesis in microglia: roles in the outcome of excitotoxic brain injury.PLoS One 6:e25916.
Block ML, Zecca L, Hong JS. 2007. Microglia-mediated neurotoxicity: Uncov-ering the molecular mechanisms. Nat Rev Neurosci 8:57–69.
Davalos D, Grutzendler J, Yang G, Kim JV, Zuo Y, Jung S, Littman DR, DustinML, Gan WB. 2005. ATP mediates rapid microglial response to local braininjury in vivo. Nat Neurosci 8:752–758.
De Simone R, Niturad CE, De Nuccio C, Ajmone-Cat MA, Visentin S, MinghettiL. 2010. TGF-beta and LPS modulate ADP-induced migration of microglial cellsthrough P2Y1 and P2Y12 receptor expression. J Neurochem 115:450–459.
Escartin C, Bonvento G. 2008. Targeted activation of astrocytes: A potentialneuroprotective strategy. Mol Neurobiol 38:231–241.
Evans WH, Leybaert L. 2007. Mimetic peptides as blockers of connexin channel-facilitated intercellular communication. Cell Commun Adhes 14:265–273.
Farber K, Kettenmann H. 2006. Functional role of calcium signals for micro-glial function. Glia 54:656–665.
Ferrari D, Chiozzi P, Falzoni S, Hanau S, Di Virgilio F. 1997. Purinergic modu-lation of interleukin-1 beta release from microglial cells stimulated with bacte-rial endotoxin. J Exp Med 185:579–582.
Ferrari D, Villalba M, Chiozzi P, Falzoni S, Ricciardi-Castagnoli P, Di Virgilio F.1996. Mouse microglial cells express a plasma membrane pore gated byextracellular ATP. J Immunol 156:1531–1539.
Fiebich BL, Butcher RD, Gebicke-Haerter PJ. 1998. Protein kinase C-mediated regulation of inducible nitric oxide synthase expression in culturedmicroglial cells. J Neuroimmunol 92:170–178.
Fields RD, Burnstock G. 2006. Purinergic signalling in neuron-glia interac-tions. Nat Rev Neurosci 7:423–436.
Flores B, von Bernhardi R. 2012. Transforming growth factor beta1 modulatesamyloid beta-induced glial activation through the Smad3-dependent induc-tion of MAPK phosphatase-1. J Alzheimers Dis 32:417–429.
Fujita R, Ma Y, Ueda H. 2008. Lysophosphatidic acid-induced membrane ruf-fling and brain-derived neurotrophic factor gene expression are mediated byATP release in primary microglia. J Neurochem 107:152–160.
Grynkiewicz G, Poenie M, Tsien RY. 1985. A new generation of Ca21 indica-tors with greatly improved fluorescence properties. J Biol Chem 260:3440–3450.
Ha SK, Lee P, Park JA, Oh HR, Lee SY, Park JH, Lee EH, Ryu JH, Lee KR, KimSY. 2008. Apigenin inhibits the production of NO and PGE2 in microglia andinhibits neuronal cell death in a middle cerebral artery occlusion-inducedfocal ischemia mice model. Neurochem Int 52:878–886.
2036 Volume 61, No. 12

Han YJ, Kwon YG, Chung HT, Lee SK, Simmons RL, Billiar TR, Kim YM. 2001.Antioxidant enzymes suppress nitric oxide production through the inhibitionof NF-kappa B activation: role of H(2)O(2) and nitric oxide in inducible nitricoxide synthase expression in macrophages. Nitric Oxide 5:504–513.
Haydon PG, Carmignoto G. 2006. Astrocyte control of synaptic transmissionand neurovascular coupling. Physiol Rev 86:1009–1031.
Herrera-Molina R, Flores B, Orellana JA, von Bernhardi R. 2012. Modulationof interferon-gamma-induced glial cell activation by transforming growth fac-tor beta1: A role for STAT1 and MAPK pathways. J Neurochem 123:113–123.
Herrera-Molina R, von Bernhardi R. 2005. Transforming growth factor-beta 1produced by hippocampal cells modulates microglial reactivity in culture.Neurobiol Dis 19:229–236.
Higashi Y, Segawa S, Matsuo T, Nakamura S, Kikkawa Y, Nishida K,Nagasawa K. 2011. Microglial zinc uptake via zinc transporters induces ATPrelease and the activation of microglia. Glia 59:1933–1945.
Hoffmann A, Kann O, Ohlemeyer C, Hanisch UK, Kettenmann H. 2003. Eleva-tion of basal intracellular calcium as a central element in the activation ofbrain macrophages (microglia): Suppression of receptor-evoked calcium sig-naling and control of release function. J Neurosci 23:4410–9.
Kim SY, Moon JH, Lee HG, Kim SU, Lee YB. 2007. ATP released from beta-amyloid-stimulated microglia induces reactive oxygen species production inan autocrine fashion. Exp Mol Med 39:820–827.
Kloss CU, Bohatschek M, Kreutzberg GW, Raivich G. 2001. Effect of lipopoly-saccharide on the morphology and integrin immunoreactivity of ramifiedmicroglia in the mouse brain and in cell culture. Exp Neurol 168:32–46.
Koizumi S. 2010. Synchronization of Ca21 oscillations: Involvement of ATPrelease in astrocytes. FEBS J 277:286–292.
Li X, Cudaback E, Keene CD, Breyer RM, Montine TJ. 2011. Suppressedmicroglial E prostanoid receptor 1 signaling selectively reduces tumor necro-sis factor alpha and interleukin 6 secretion from toll-like receptor 3 activation.Glia 59:569–576.
Liu W, Tang Y, Feng J. 2011. Cross talk between activation of microglia andastrocytes in pathological conditions in the central nervous system. Life Sci89:141–146.
Locovei S, Wang J, Dahl G. 2006. Activation of pannexin 1 channels by ATPthrough P2Y receptors and by cytoplasmic calcium. FEBS Lett 580:239–244.
MacVicar BA, Thompson RJ. 2010. Non-junction functions of pannexin-1channels. Trends Neurosci 33:93–102.
Moller T, Kann O, Verkhratsky A, Kettenmann H. 2000. Activation of mousemicroglial cells affects P2 receptor signaling. Brain Res 853:49–59.
Munger JS, Harpel JG, Gleizes PE, Mazzieri R, Nunes I, Rifkin DB. 1997.Latent transforming growth factor-beta: Structural features and mechanismsof activation. Kidney Int 51:1376–1382.
Orellana JA, Hernandez DE, Ezan P, Velarde V, Bennett MV, Giaume C, SaezJC. 2010. Hypoxia in high glucose followed by reoxygenation in normal glu-cose reduces the viability of cortical astrocytes through increased permeabil-ity of connexin 43 hemichannels. Glia 58:329–343.
Orellana JA, Shoji KF, Abudara V, Ezan P, Amigou E, Saez PJ, Jiang JX,Naus CC, Saez JC, Giaume C. 2011. Amyloid beta-induced death in neuronsinvolves glial and neuronal hemichannels. J Neurosci 31:4962–4977.
Pelegrin P, Surprenant A. 2006. Pannexin-1 mediates large pore formationand interleukin-1beta release by the ATP-gated P2X7 receptor. EMBO J 25:5071–5082.
Possel H, Noack H, Putzke J, Wolf G, Sies H. 2000. Selective upregulation ofinducible nitric oxide synthase (iNOS) by lipopolysaccharide (LPS) and cyto-kines in microglia: in vitro and in vivo studies. Glia 32:51–59.
Qiu F, Dahl G. 2009. A permeant regulating its permeation pore: Inhibitionof pannexin 1 channels by ATP. Am J Physiol Cell Physiol 296:C250–C255.
Ramirez G, Rey S, von Bernhardi R. 2008. Proinflammatory stimuli are neededfor induction of microglial cell-mediated AbetaPP_{244-C} and Abeta-neurotoxicity in hippocampal cultures. J Alzheimers Dis 15:45–59.
Saha RN, Pahan K. 2006. Regulation of inducible nitric oxide synthase genein glial cells. Antioxid Redox Signal 8:929–947.
Salvemini D, Misko TP, Masferrer JL, Seibert K, Currie MG, Needleman P.1993. Nitric oxide activates cyclooxygenase enzymes. Proc Natl Acad SciUSA 90:7240–7244.
Schalper KA, Palacios-Prado N, Orellana JA, Saez JC. 2008. Currently usedmethods for identification and characterization of hemichannels. Cell Com-mun Adhes 15:207–218.
Silverman W, Locovei S, Dahl GP. 2008. Probenecid, a gout remedy, inhibitspannexin 1 channels. Am J Physiol Cell Physiol 295:C761–C767.
Smits HA, van Beelen AJ, de Vos NM, Rijsmus A, van der Bruggen T,Verhoef J, van Muiswinkel FL, Nottet HS. 2001. Activation of human macro-phages by amyloid-beta is attenuated by astrocytes. J Immunol 166:6869–6876.
Stout C, Goodenough DA, Paul DL. 2004. Connexins: functions without junc-tions. Curr Opin Cell Biol 16:507–512.
Takeuchi H, Jin S, Wang J, Zhang G, Kawanokuchi J, Kuno R, Sonobe Y,Mizuno T, Suzumura A. 2006. Tumor necrosis factor-alpha induces neurotox-icity via glutamate release from hemichannels of activated microglia in anautocrine manner. J Biol Chem 281:21362–21368.
Tichauer J, Saud K, von Bernhardi R. 2007. Modulation by astrocytes ofmicroglial cell-mediated neuroinflammation: Effect on the activation of micro-glial signaling pathways. Neuroimmunomodulation 14:168–174.
Uribe-San Martin R, Herrera-Molina R, Olavarria L, Ramirez G, von BernhardiR. 2009. Reduction of beta-amyloid-induced neurotoxicity on hippocampalcell cultures by moderate acidosis is mediated by transforming growth factorbeta. Neuroscience 158:1338–1347.
Verderio C, Matteoli M. 2001. ATP mediates calcium signaling betweenastrocytes and microglial cells: modulation by IFN-gamma. J Immunol 166:6383–6391.
Vincent VA, Tilders FJ, Van Dam AM. 1997. Inhibition of endotoxin-inducednitric oxide synthase production in microglial cells by the presence of astro-glial cells: A role for transforming growth factor beta. Glia 19:190–198.
Vincent VA, Van Dam AM, Persoons JH, Schotanus K, Steinbusch HW,Schoffelmeer AN, Berkenbosch F. 1996. Gradual inhibition of inducible nitricoxide synthase but not of interleukin-1 beta production in rat microglial cellsof endotoxin-treated mixed glial cell cultures. Glia 17:94–102.
von Bernhardi R. 2007. Glial cell dysregulation: A new perspective on Alzhei-mer disease. Neurotox Res 12:215–232.
von Bernhardi R, Eugenin J. 2004. Microglial reactivity to beta-amyloid ismodulated by astrocytes and proinflammatory factors. Brain Res 1025:186–193.
Wang N, De Bock M, Antoons G, Gadicherla AK, Bol M, Decrock E, EvansWH, Sipido KR, Bukauskas FF, Leybaert L. 2012. Connexin mimetic peptidesinhibit Cx43 hemichannel opening triggered by voltage and intracellularCa21 elevation. Basic Res Cardiol 107:304.
Woodward DF, Jones RL, Narumiya S. 2011. International Union of Basic andClinical Pharmacology. LXXXIII: Classification of prostanoid |receptors,#updating 15 years of progress. Pharmacol Rev 63:471–538.
Zielasek J, Tausch M, Toyka KV, Hartung HP. 1992. Production of nitrite byneonatal rat microglial cells/brain macrophages. Cell Immunol 141:111–120.
Orellana et al: Astrocytes Inhibit Inflammatory Activation of Microglia
December 2013 2037


![Research Paper Sex specific inflammatory profiles of ......cells, activated by microglia and astrocytes [27, 28]. Pro-inflammatory cytokine contributions to the inflammasome associated](https://img.dokumen.tips/doc/110x75/60f96bbd0ba77f202104e786/research-paper-sex-specific-inflammatory-profiles-of-cells-activated-by.jpg)