Embed Size (px)
Citation preview

Association between translation efficiencyand horizontal gene transfer withinmicrobial communitiesTamir Tuller1,2,*, Yana Girshovich3, Yael Sella3, Avi Kreimer3, Shiri Freilich3,4,
Martin Kupiec5, Uri Gophna5 and Eytan Ruppin3,4
1Faculty of Mathematics and Computer Science, 2Department of Molecular Genetics, Weizmann Institute ofScience, Rehovot, 3Blavatnik School of Computer Science, 4School of Medicine, Tel Aviv University,Ramat Aviv 69978 and 5Department of Molecular Microbiology and Biotechnology, Israel
Received November 4, 2010; Revised January 18, 2011; Accepted January 19, 2011
ABSTRACT
Horizontal gene transfer (HGT) is a major force inmicrobial evolution. Previous studies have sug-gested that a variety of factors, including restrictedrecombination and toxicity of foreign geneproducts, may act as barriers to the successful in-tegration of horizontally transferred genes. Thisstudy identifies an additional central barrier toHGT—the lack of co-adaptation between thecodon usage of the transferred gene and the tRNApool of the recipient organism. Analyzing thegenomic sequences of more than 190 microorgan-isms and the HGT events that have occurredbetween them, we show that the number of genesthat were horizontally transferred between organ-isms is positively correlated with the similaritybetween their tRNA pools. Those genes that arebetter adapted to the tRNA pools of the targetgenomes tend to undergo more frequent HGT. Atthe community (or environment) level, organismsthat share a common ecological niche tend tohave similar tRNA pools. These results remain sig-nificant after controlling for diverse ecological andevolutionary parameters. Our analysis demon-strates that there are bi-directional associationsbetween the similarity in the tRNA pools of organ-isms and the number of HGT events occurringbetween them. Similar tRNA pools between adonor and a host tend to increase the probabilitythat a horizontally acquired gene will become fixedin its new genome. Our results also suggest thatfrequent HGT may be a homogenizing force that
increases the similarity in the tRNA pools of organ-isms within the same community.
INTRODUCTION
Horizontal gene transfer (HGT), the passage of geneticmaterial between organisms and lineages, is a majorforce in microbial evolution (1–3). It is estimated that>80% of gene families in prokaryotic genomes underwentHGT at some point of their evolutionary history (1). Onefundamental question in this context is what determinesthe evolutionary success of HGT events and supports thefixation of the transferred genes. Previous studies inthe field have identified several factors that influence thechance of successful HGT, including toxicity of theacquired gene product (2), the ability of the transferredsegment to integrate into the host genome by recombin-ation (4), the number of protein interactions of thetransferred gene product (5) and the function of thegene(s), since genes that confer specific advantagesare more likely to be retained. (6).Recently, Kudla et al. (7) cloned differently encoded
green fluorescent protein (GFP) variants into Escherichiacoli and showed that over-expressing a single gene withincompatible codon usage can be severely deleterious tothe organism. It is therefore perhaps not surprising thatthe codon usage in many viruses is adapted to the tRNApools of their hosts (8). Although looking for genes withatypical codons is a common method for detecting HGT,Medrano-Soto and coworkers demonstrated that manyhorizontally-acquired genes were in fact compatible withthe recipient genome’s codon usage (9). Codon bias,however, is not necessarily driven by translation efficiencyalone, and can sometimes be the product of constraintssuch as GC content, and/or amino acid usage.
*To whom correspondence should be addressed. Tel: +972 8 9344214; Fax: +972 8 934 4122; Email: [email protected]
Nucleic Acids Research, 2011, 1–13doi:10.1093/nar/gkr054
� The Author(s) 2011. Published by Oxford University Press.This is an Open Access article distributed under the terms of the Creative Commons Attribution Non-Commercial License (http://creativecommons.org/licenses/by-nc/2.5), which permits unrestricted non-commercial use, distribution, and reproduction in any medium, provided the original work is properly cited.
Nucleic Acids Research Advance Access published February 22, 2011 at T
el Aviv U
niversity,Brender M
oss libr.for Social S
c.& M
anagement on June 8, 2011
nar.oxfordjournals.orgD
ownloaded from

In this work, we use a direct measure of translationefficiency and show (while controlling for other variables)that there is an association between translation efficiencyand HGT. In the first three sections we show that thisassociation exists at the levels of gene families, pairs oforganisms and communities of organisms. Specifically, inthe first section, we show that genes that have comparabletRNA adaptation values across organisms tend to beexchanged more often. In the second section, we showthat organisms with similar tRNA pools tend to sharegenes more frequently, generating dynamic networks ofincreased gene exchange. In the third section, we showthat pairs of organisms that share a community (andthus usually undergo more frequent HGT) have similartRNA pools.In the two last sections we study the potential forces of
selection underlying the associations described above.Specifically, we suggest that the bi-directional relationbetween translation efficiency and HGTs is related tothe relation between ribosome allocation and translationspeed (7,10). In section four, we explain why the adapta-tion of the codon bias of the transferred gene to the tRNApool of the host is a major determinant of the success ofHGT. In section five we explain how frequent HGTs canhomogenize the tRNA pools of organisms within acommunity.
MATERIALS AND METHODS
Data
Information about gene HGT and gene sharing. Dataabout gene sharing and inferred HGT between ancestraland extant organisms were obtained from Dagan et al. (1).Data about genes that underwent HGT (6) was kindlyprovided by Y. Nakamura. Additional data about genesharing were obtained from (11).
Information about community structure. These data weredownloaded from (12).
Coding sequences. All the coding sequences were down-loaded from the NCBI site (http://www.ncbi.nlm.nih.gov/Ftp/).
tRNA copy numbers. Organismal tRNA copy numberswere downloaded from the Genomic tRNA Database(http://lowelab.ucsc.edu/GtRNAdb/) (13).
Gene expression in E. coli. These data were downloadedfrom (14).
The phylogenetic tree for reconstructing theancestral tRNA pool
The phylogenetic tree was obtained from (15). This treewas reconstructed based on the rRNA operon (16S, 23Sand 5S) from all 190 genomes using the maximum likeli-hood approach. The final phylogenetic tree includes 190organisms. The list of organisms and their taxonomyappears in (1). We used Neyman’s two state model (16),a version of Jukes Cantor (JC) model (17) for inferring the
edge lengths of the tree (the probability of gain/loss of agene family) by maximum likelihood, as implemented inPAML (18). The edge lengths correspond to theprobabilities that a protein family will appear/disappearalong the corresponding lineage.
Reconstruction of ancestral tRNA copy number
Let p�,� denote the probability of gain/loss of a genefamily along the edge tree edge ð�,�Þ. Let Cx denote thecopy number of tRNA C in node (genome or ancestralgenome)x of the evolutionary tree. We inferred the ances-tral tRNA copy number using a generalized maximumparsimony method, whose penalty for a change in thenumber of genes corresponding to a tRNA C along thetree edge ð�,�Þ is � logðp�,�Þ
�jC� � C�j.
Computing tAI and tRs. tAI was computed following thework of dos Reis et al. (19), who defined this index. Thismeasure gauges the availability of tRNAs for each codon.
The similarity in tRNA pools between two organisms,tRs, is defined as the non-parametric Spearman correl-ation between the two vectors (of length 61) of theircodons’ tAI values (denoted by tRs; see alsoSupplementary Note S6). The tAI of a gene is the geomet-ric mean of the tAI of all its codons (additional technicaldetails are provided in Supplementary Note S1).
Connecting evolutionary changes in tRNA copynumbers and HGT
Let (x,y) denote an edge in the evolutionary tree describedabove where x is the node that is closer to the root of thetree.
For each pair of edges, (x1,y1) and (x2,y2), in the evo-lutionary tree we computed the number of HGT along thecorresponding evolutionary interval (x1 to y1 and x2 toy2; i.e. the HGT between x1 and x2 or between y1 and y2)and the change in the tRs along the edge. We correlatedthese values to show that along different paths of the evo-lutionary tree an increased number of HGT correspondsto increase in tRs. This also represents an additionalcontrol for phylogenetic proximity.
Estimating the number of HGTs a gene family hasundergone. We ranked the gene families (COGs) accord-ing to their tendency to undergo HGT in the followingway: first we mapped all the genes to their COGs; nextwe used the data of Nakamura et al. (6) to count thenumber of times (number of organisms) a gene corres-ponding to each COG was detected as a recentlytransferred gene.
Measures for the variability and robustness of the tAI of agene family. We considered two measures for the robust-ness of the tAI of particular gene families:
The first measure, VtAI, is the standard deviation (SD)of the tAI of a COG across organisms. COGs with higherSD of tAI are those whose codon bias and/or the tRNApool that recognizes their codons is more variable betweenorganisms, suggesting different levels of translationefficiency of gene homologs in different organisms.
2 Nucleic Acids Research, 2011
at Tel A
viv University,B
render Moss libr.for S
ocial Sc.&
Managem
ent on June 8, 2011nar.oxfordjournals.org
Dow
nloaded from
The second measure, tRNA robusteness, RtAI, wascomputed as follows: First, we computed for each codonthe SD of the tAI score of that codon across all theanalyzed organisms; let tSTDi denote the SD of the tAIof codon i. Next, we computed for each COG (Ci) in eachorganism Oj the mean SD of the tAI of its codons:
EtstdevðCi,OjÞ ¼
Plci,oj
k¼1
tSDk
lci,oj
Where tSDk is the mean SD of the tAI of the codondefined by the k’th triplet on gene g; and lci,oj is thelength of COG Ci in organism Oj.
The final RtAI score for COG Ci is the meanEtSDðCi,OjÞ over all the organisms in the database.
RtAI ¼
PN
j¼1
EtSDðCi,OjÞ
N
Where N is the number of organisms in the database. ACOG with higher RtAI has a codon bias that is less robustto changes in the tRNA pool (e.g. due to HGT). Tocontrol for the fact that some of the COGs appear onlyin very few organisms we considered only COGs thatappear in at least 85 organisms (i.e. >50% of the organ-isms in the data set; higher cut-offs gave very similarresults). In addition, the number of organisms possessinga COG was always included as one of the covariates in thepartial correlations.
Comparison between the number of HGT events and thevariability of the tAI among COGs
To compare the variability in tAI versus the number ofHGT events that are related to each COG, we counted theHGT predictions that are related to each COG (6), andthe mean VtAI and RtAI corresponding to each COG, andsubsequently correlated these measures.
The RVtAI—a combination of VtAI and RtAI
RVtAI was computed in the following way: first, weranked all the COGs by their VtAI and RtAI. Next, foreach COG we averaged the ranks of these two parameters.Thus, this index is based ‘both’ on the variability of thetAI of a gene among the analyzed organisms (VtAI) andthe robustness of the translation rate of the gene tochanges in the tRNA pools (RtAI) and better reflects therobustness of the gene to changes in the tRNA pool thaneither VtAI or RtAI individually.
Controls for possible covariates
Controls when comparing the tRs of pairs of organism to thenumber of HGTs between them or to communitysimilarity. The following variables were used as covariates(together) in the multivariate analysis of tRs versus thenumber of HGT events/sharing a niche (see more detailsbelow).
GC content. For each organism we computed the G+C(GC) content (the percentage of G+C in its genome). Tocontrol for the possibility that the correlation between tRsand the number of HGT events is related to GC content,we computed for each pair of organisms the absolutevalue of the difference in their GC content.
Amino acid usage. For each organism we computed theamino acid usage (the vector of frequencies of all the 20amino acids in its coding sequences). To control for aminoacid usage, we computed for each pair of organisms thecorrelation between their vectors of amino acid usage,ARs.
Phylogenetic distance. To control for phylogeneticdistance, we computed for each pair of organisms theirdistance in the evolutionary tree based on the inferrededge lengths (see above).
Control for the correlation between codon bias andtranslation efficiency
We computed for each organism the correlation betweenthe codon bias and tAI of codons; next, we computed foreach pair of organisms the absolute value of the differencein their CB-tAI correlations.
Controls for growth rate
The generation times of 214 organisms were downloadedfrom (20). To control for the possibility that the correl-ation between tRs and the number of HGT events isrelated to growth rate, we computed for each pair of or-ganisms the absolute value of the difference in their gen-eration times.
Controls for genome size
We considered two variables: the difference between thenumber of genes in each pair of genomes and the sum ofthe number of genes in each pair of genomes.
Controls for the comparison of COGs. The following vari-ables were used as covariates (together) in the multivariateanalysis of RVtAI and the number of HGT of a COG (seemore details below).
GC content control. We computed for each COG in eachorganism the GC content of the COG in the organism.Next, we computed the SD of the GC of the COG.
Amino acid control. We computed for each amino acid, ineach organism, the expected tAI, EtAI, which is theweighted average of the tAI (taking into account thecodon bias of the organism) of all the codons that codefor this amino acid. The EtAI of a COG in a certainorganism is the geometric mean of the EtAI of all theamino acids in the COG. Next, we computed the SD ofthe EtAI of the COG.
Control for expression levels. It is well know that the ex-pression levels of genes is strongly correlated with theirtAI (10,21,22). Thus, to control for the possibility thatthe correlation between RVtAI and the number of HGT
Nucleic Acids Research, 2011 3
at Tel A
viv University,B
render Moss libr.for S
ocial Sc.&
Managem
ent on June 8, 2011nar.oxfordjournals.org
Dow
nloaded from

may be explained by the expression levels of the COG wefirst ranked the COGs according to their tAI in eachorganism (in each organism we computed the for eachCOG the percentage of COGs whose expression ishigher than the expression level of the COG).Next, we computed for each COG its mean tAI rank
across all the organisms. For example, when we analyzedthe 1594 COGs that appear in more than 50 organisms wefound that the top 100 COGs with the highest mean tAIranks include 16 ribosomal proteins (enrichmentP-value=1.6� 10�7) and the lowest 100 COGs includeno ribosomal proteins. It is known that the expressionlevels of ribosomal proteins are very high [see, forexample, (23)] thus, this fact demonstrates that indeedour measure is a good approximation of expression levels.
Non-parametric multivariate analysis
Let X and Y denote two variables and Z=[Z1, Z2,Z3,. . .] denote a set of variables.The non-parametric multivariate analysis that is
reported in this paper includes partial Spearman correl-ations of the form R(X,Y|Z). Roughly, if such a correl-ation is significant it means that there is a relation betweenX and Y that can not be explained by the variable Z.In the first section of the paper we tried to find distinct
correlation with ‘genes shared among organisms’ (X in ourcase) we considered each of the variables defined above asthe explaining variables (Y, specifically, the tRs); where ineach case the rest of the variables were used as covariates(Z). In the second and the third sections similar analyseswere performed for the number of HGT of a COG (X,second section) and ‘community co-membership’ (X, thirdsection).Finally, note that in our case (as is usually the case when
biological data are analyzed) the data points are not inde-pendent, and this may affect the results (increase ordecrease the correlations).
Statistical tests and correlations. We used the followingnon-parametric tests: Spearman correlation, partialSpearman correlation and KS-test. The statisticalanalysis was performed in MATLAB. We reported bothasymptotical P-values and empirical P-values for theSpearman correlations. The empirical P-values for aSpearman correlation, R(X,Y|Z) were computed byrandomly permuting X and Yn=1000 times andcounting the number of times the correlation of thepermuted vectors was higher or equal to the original cor-relations (let m denote this number). The empiricalP-value is pe=m/n.
A network of connections between pairs of organism withhigh tRs, modularity and significance
This network includes a node for each organism [a total of648 organisms whose tRNA copy number was available(13)]; in this network, two organisms were connected byan edge if their tRs score was >97% of the tRs scores.The modularity score of a network is a number between
0 and 1, where larger numbers correspond to strongersignal of modularity [see details in (24)]. The modularity
score of the original network of tAI similarity was veryhigh: 0.6518. We compared the modularity score of theoriginal network to the score of 100 random networksthat maintain the degree distribution of the originalnetwork; the random networks were generated similarlyto the way such a network was generated in (25). In thecase of the random networks the score was much lower(mean=0.1235, SD=0.0196). These results suggest thatthe modularity score of the network of tAI similarity issignificantly higher than what is expected from randomnetworks with similar properties (empirical P< 0.01).
We also compared the modularity score of the originalnetwork to the score of 20 random networks that weregenerated in a different way: each random network wasgenerated as before but based on a permuted version ofthe tAI values of the codons of each organism. In this casealso, the modularity score of the random networks wassignificantly lower (mean=0.2451, SD=0.0054; empiric-al P< 0.05).
Optimization of the correlation between the tAI andthe expression levels
We computed the tRNA pool that optimizes the correl-ation between the tAI of genes and their mRNA levels[R(tAI, mRNA)] by performing a heuristic, hill climbingprocess. The procedure maintained the total sum of tRNAcopy numbers and the tRNA copy numbers that are equalto zero [as was performed in (26)]. The starting point usedwas the original tRNA pool of the genome.
RESULTS
Gene families with more universally conserved tAI acrossorganisms are exchanged more frequently
Based on the genomic tRNA copy number, a proxy for theexpression levels of tRNAs [(27–30) and SupplementaryNote S1], we computed the tRNA adaptation index (tAI)for 190 prokaryotes that appear in (1). The tAI of a codon[which is equal to its w-value (15); see ‘Materials andMethods’ section and Supplementary Note S1] is ameasure of its translation efficiency (19,22) thatcombines the tRNA gene copy number with the efficiencyof the codon–anticodon binding by the tRNA. Thismeasure is more informative than the copy number ofthe tRNAs that recognize that codon (‘Materials andMethods’ section).
The tAI of a gene is the geometric mean of the tAI of itscodons (19,22) which ranges between 0 (non-efficienttranslation) and 1 (highly efficient translation; see‘Materials and Methods’ section and SupplementaryNote S1). Unlike other measures such as codon bias orthe codon adaptation index (CAI), the tAI is not only agood predictor of protein abundance and translation rate(10,19,21,22), but also measures the co-adaptationbetween codon usage and the tRNA pool directly (31)(Supplementary Table S1 provides the tRNA copynumber and tAI scores of all the codons in all theanalyzed organisms).
If a gene’s tAI is a major determinant of its HGT fre-quency, then one would expect to see that genes with more
4 Nucleic Acids Research, 2011
at Tel A
viv University,B
render Moss libr.for S
ocial Sc.&
Managem
ent on June 8, 2011nar.oxfordjournals.org
Dow
nloaded from

uniform levels of tAI across species tend to have higherlevels of HGT. To test this hypothesis, we used the data ofNakamura et al. (6), who performed a large scale study ofsingle genes that were horizontally transferred fairlyrecently [see also (32) and Supplementary Note S2]. Weanalyzed 4614 COGs (33) across 163 prokaryoticgenomes, counting only the COGs that appear in morethan half of the organisms (i.e. at least in 85 organisms).We considered two measures of tAI variance: the first oneis simply the variance in the gene’s tAI, i.e. to what degreedoes the level of translational efficiency of a gene varyacross taxa (this measure was names VtAI, see‘Materials and Methods’ section for details). Indeed, thecorrelation between the VtAI of a gene and the number oftimes that this gene has been horizontally transferred(controlling for the fact that some genes appear in fewerorganisms; see ‘Materials and Methods’ section) is signifi-cant and negative (r=�0.2958; P< 10�16; pe< 0.001;n=917).
The second measure, RtAI, measures the robustness ofthe translation efficiency (tAI) of each COG to differenttRNA pools (a higher RtAI means less robustness). Thismeasure is based on the fact that some codons are morerobust than others to changes in the tRNA pool across theanalyzed genomes (‘Materials and Methods’ section).When we compared RtAI and the number of HGTevents of each COG (again controlling for the fact thatsome genes appear in fewer organisms; see ‘Materials andMethods’ section) we, once more obtained a highly signifi-cant correlation (r=�0.4125 and P< 10�16, pe< 0.001;n=917). This result suggests that genes whose translationefficiency is less sensitive to changes in the tRNA pool (i.e.to the host where they are expressed) have beentransferred more often.
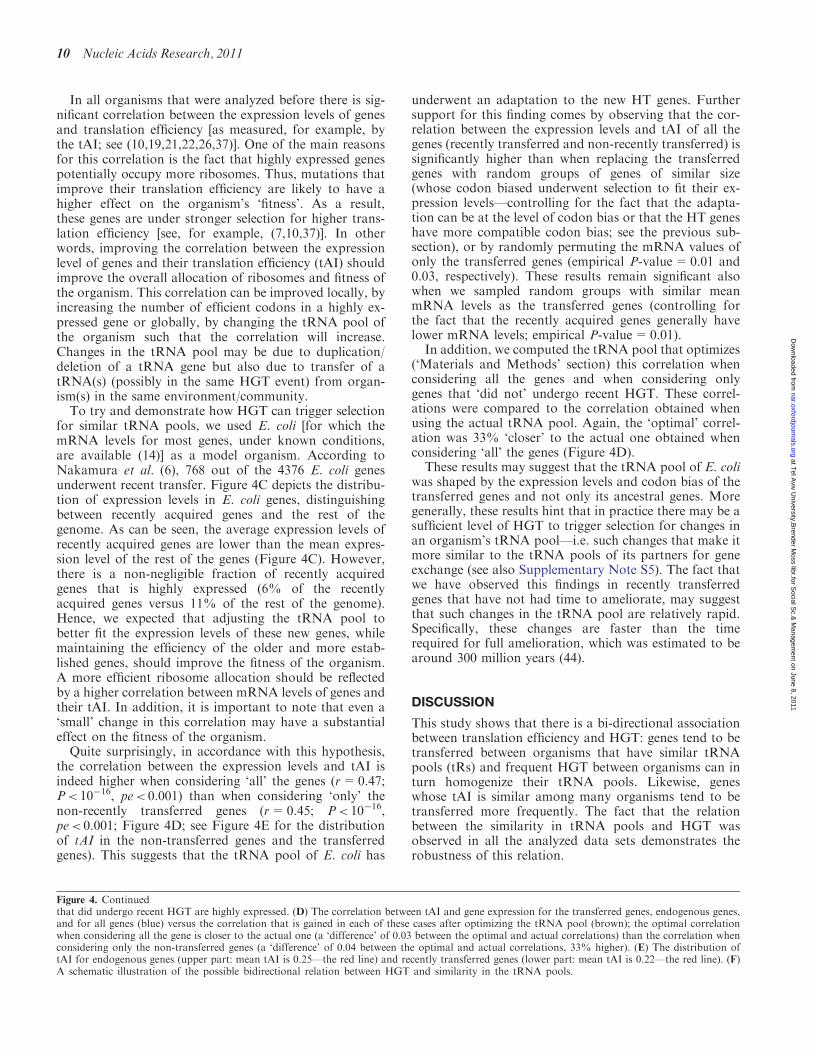
To better understand how different features of a COGexplain the number of times it has been horizontallytransferred, we computed a combined and more robustmeasure of tAI robustness, RVtAI, (a combination ofthe two previous measures, where higher RVtAI meansless robustness to changes in the tRNA pool, see‘Materials and Methods’ section). As can be seen inFigure 1A, the correlation between the RVtAI of a COGand the number of times that COG was horizontallytransferred is very high (r=�0.4340; P< 10�16).Specifically, the 20% of the COGs with the lowestRVtAI scores have been horizontally transferred over7-fold more frequently than the 20% of the COGs withthe top RVtAI (Figure 1A) demonstrating again the strongrelation between robustness to tRNA pools and HGT.
Thus, for example, the type I restriction-modificationenzyme S subunit (COG0732V), known to be frequentlymobile (34) and the thymydilate synthase protein ThyX(COG1351F), shown recently to be transferred multipletimes in evolution (35), both have low RVtAI. Incontrast, several ribosomal proteins (S2, S6, L7/12, L9,L21, L24P, L25, L36) considered to be rarely transferred(36), have high RVtAI values and poor robustness,although they tend to have high tAI values in mostgenomes (COGs with extreme RVtAI appear inSupplementary Table S2).
As before, we considered other COG features that maypotentially explain the correlation above: (i) An estima-tion of the mean expression level of the COG across theanalyzed organisms [based on the tAI, which is often abetter predictor of protein abundance than mRNA levels(21,22), which generally correlate well with tAI; see‘Materials and Methods’ section]. This is pertinent as itis known that highly expressed genes are involved in lessHGT events and are also under stronger selection fortranslation efficiency (7,10,37). (ii) The variation in theGC content of the COG across all organisms. (iii) Thevariation in the amino acid usage across these organisms(as the set of organisms used for computing the RVtAI isidentical in all COGs there is no need here to control forthe genome size or effective population size).As depicted in Figure 1B, the correlation between the
RVtAI of a COG and the number of times a COG washorizontally transferred remains significant even whencontrolling for all the three variables above ‘together’(r=�0.1125; P=6.6� 10�4, pe< 0.001); most of thedecrease in correlation is due to the estimation of expres-sion levels (Figure 1C).
Organisms that are involved in more HGT have moresimilar tRNA pools
The translational efficiency pattern (TEP) of the codons ineach organism (based on the tRNA pool) can be describedby a vector of length 61 (the number of coding triplets),where each entry denotes the tRNA adaptation index(tAI) of the respective codon (which is more informative
Figure 1. (A) The number of HGT events (six) as a function of RVtAIacross five bins of equal size: a Whisker plot with the means markedwith red circles. (B) Correlations with the number of HGT events whencontrolling for all the other factors; P denotes asymptotic P-value, pedenotes empirical P-value (‘Materials and Methods’ section).(C) Correlation given increasing number of factors (A) estimatedmean expression levels, (B) variance in GC content and (C) variancein amino acid bias.
Nucleic Acids Research, 2011 5
at Tel A
viv University,B
render Moss libr.for S
ocial Sc.&
Managem
ent on June 8, 2011nar.oxfordjournals.org
Dow
nloaded from
then just the tRNA copy number, see ‘Materials andMethods’ section).The similarity in the TEP of tRNA pools between any
two organisms is then measured by the Spearman correl-ation between their corresponding TEP vectors, denotedas tRs. Accordingly, two organisms have a higher tRs ifthey have a more similar rank order of codons’ translationefficiency.We used the network of gene sharing from (1), in which
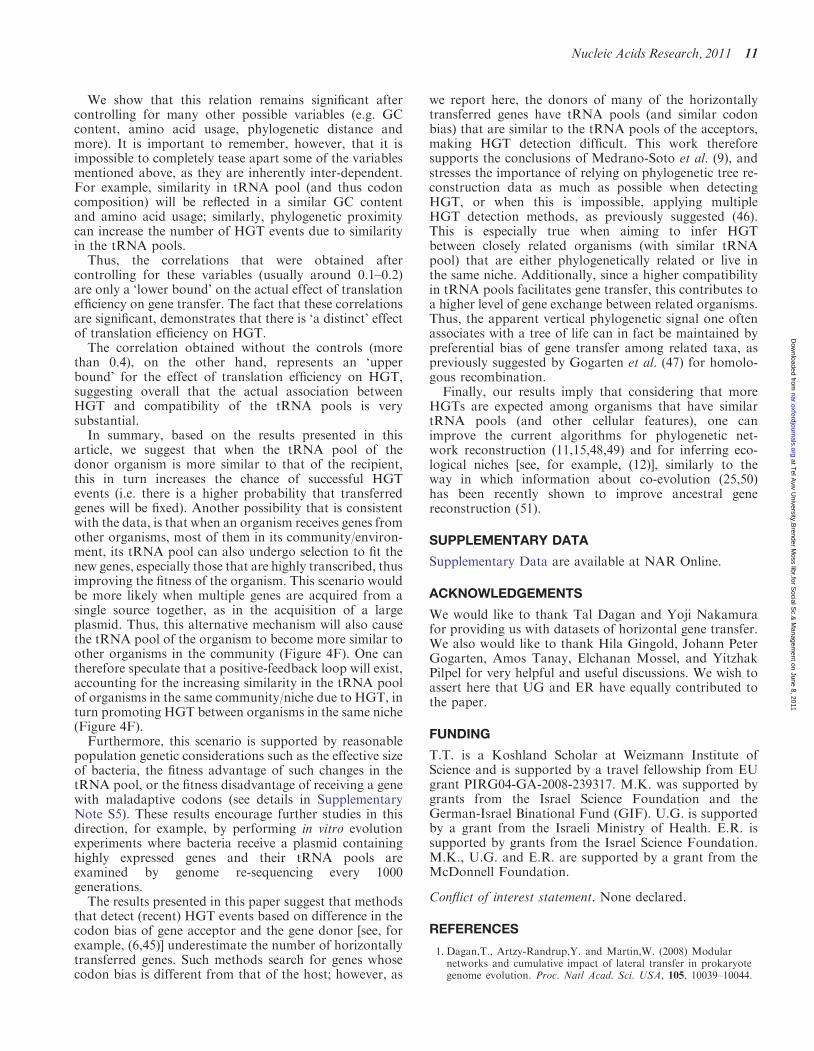
a gene is defined as shared by two organisms if these or-ganisms have relatively similar orthologs of that gene.Gene sharing between a pair of organisms can arisewhen the two are evolutionarily close and the gene wasinherited vertically by both of them, or when a gene wastransferred horizontally between these organisms or theirancestors. It is important to note that this network isprotein-based, i.e. derived from ‘amino acid alignments’,and therefore is independent of codon information.Analyzing this network, we observed that tRs of organ-isms that share more genes tend to be more similar(Figure 2A and B; Spearman correlation above 0.32,P< 10�30, empirical P< 0. 001). Similar findings wereobtained when analyzing the data from Beiko et al.[(11); see Supplementary Note S3].We aimed to distinguish between two possible explan-
ations for this observation that are not necessarilymutually exclusive: (i) organisms that are involved inHGT are part of the same community and thus areunder similar ecological constrains that select for the useof similar amino acids [e.g. see (38)] or a similar GCcontent, similar growth rates, etc. Due to this environmen-tal similarity, the need to optimize the co-adaptationbetween their codon bias and the tRNA pool subsequentlydrives their tRNA pools to become similar. The associ-ation between HGT and tRNA similarity could thereforebe merely a consequence of the shared niches and/or othervariables. (ii) There are more successful HGT eventsbetween organisms with similar tRNA pools, by virtueof their codon compatibility, and this is not merely aby-product of the communities shared.To distinguish between these two hypotheses we
examined the association between tRs and gene sharingwhile controlling for six possible variables that mayexplain this association: (i) genome size (the sum of thegenome sizes for each pair and the differences in genomesize for each pair) which is correlated with population sizeof the corresponding organisms (39); (ii) phylogeneticdistance (i.e. distance on the tree of life, see ‘Materialsand Methods’ section); (iii) similarity in the amino acidusage; (iv) selection for translation efficiency (the correl-ation between codon bias and their translation efficiency);(v) similarity in the GC content; (vi) similarity in theoptimal growth rate (20); and (vii) in addition, wecontrolled for a variable corresponding to the communityassociations of the organisms [a binary variable: 1/0—de-pending on whether or not these organisms have beenshown to reside in the same community (12)].Remarkably, the Spearman correlation between the
number of shared genes and tRs for pairs of organismsremains significant also after controlling for all confound-ing factors defined above ‘together’ (as listed in the
previous subsection). This result shows that both withinand outside a community, HGT occurs more frequentlybetween organisms with higher tRs (r=0.212;P=1.18� 10�8; empirical P-value pe< 0.001 whencontrolling for all the variables above ‘together’).Figure 2C and D details how the different variablesabove contribute to the relation between the number ofHGT events [90% similarity cut-off for gene sharing (1)]and the tRs (similarity in the tRNA pools) of pairs oforganisms. Similar correlations were obtained for lowersimilarity cut-offs definitions of gene sharing (1).
Based on extant species tRNA abundances, tRNApools for ancestral organisms (i.e. ancestral nodes in thephylogenetic tree) can be reconstructed (‘Materials andMethods’ section). When we compared the ancestral)HGT frequencies between pairs of organism and their an-cestral tRs along the analyzed phylogenetic tree(‘Materials and Methods’ section), the correlationobtained was 0.25 (P< 10�16, pe< 0.001); see Figure 2E.Specifically, pairs of organisms whose tRs is high (meantRs=0.82) have been involved in 24 times more HGTevents than organisms with very low tRs (meantRs=0.76; Figure 2E).
In addition, as an additional control for phylogeneticproximity, we computed the correlation between the HGTalong pairs of edges and the change in the tRs along thepairs of edges (see details in the ‘Materials and Methods’section). Indeed, we found a significant correlationbetween these variables showing again that more HGTcorresponds to an increase in tRs (r=0.42; P< 10�16,pe< 0.001). The results reported above can thereforebe extended to longer evolutionary timescales and todifferent periods of the evolution of the analyzedorganisms.
Organisms that live in the same environment have similartRNA pools
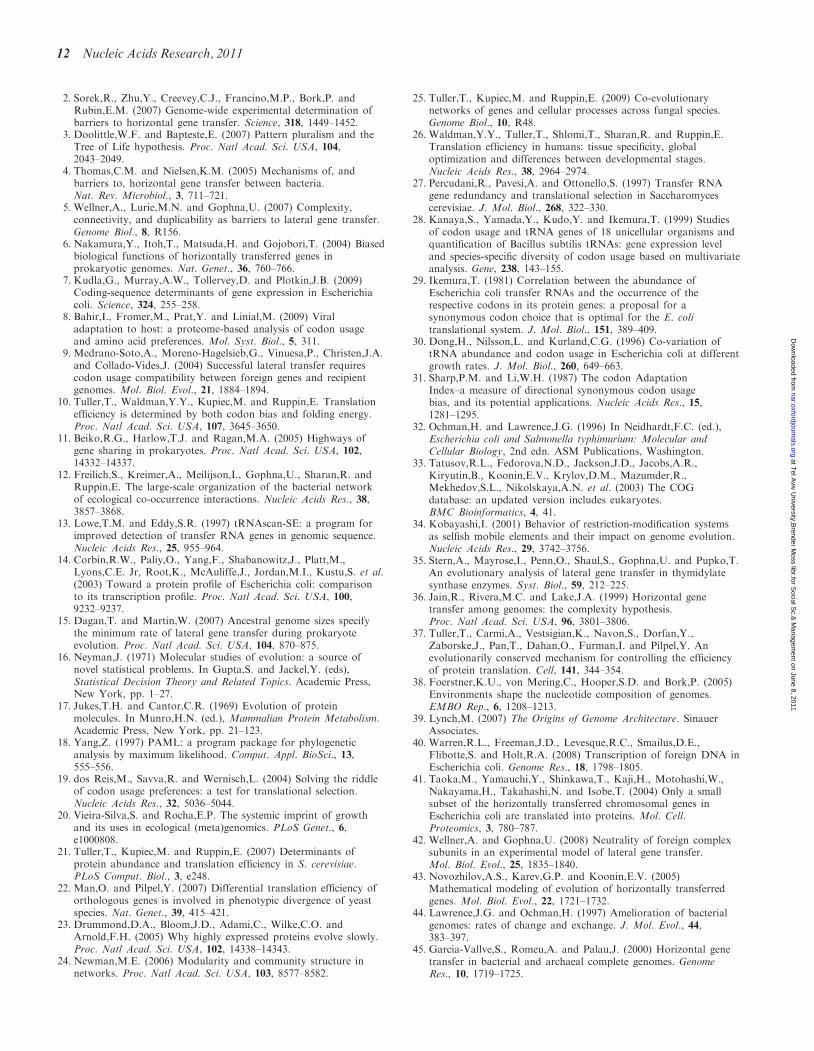
In the previous sections, we showed that there is an asso-ciation between HGT and similarity in tRNA poolmeasured by the tRs. It is known that organisms thatshare the same environment are involved in more HGT(for example, the correlation between communityco-membership and the number of shared genes whencontrolling for all the other variables defined in thepervious section is r=0.23, P=2.4� 10�10, pe< 0.001).Thus, we aimed to compare the similarity in the tRNApools, measured by the tRs, within and betweencommunities, using the environmental partitioning estab-lished by Freilich et al. (12). Indeed, microorganisms thatoccupy similar niches have significantly higher tRs thanthose that live in different ones (P=2� 10�30;Figure 3A).
In the next stage, we aimed to distinguish between thetwo possible explanations for this observation that havealready been discussed before (in the section about therelation between gene sharing and similar tRNA pool).To this end, we considered the variables defined in theprevious section and performed a multivariatenon-parametric analysis to understand how the differentvariables are associated with ‘community co-membership’
6 Nucleic Acids Research, 2011
at Tel A
viv University,B
render Moss libr.for S
ocial Sc.&
Managem
ent on June 8, 2011nar.oxfordjournals.org
Dow
nloaded from
and to study how they affect the relation between ‘com-munity co-membership’ and tRs (‘Materials and Methods’section). Figure 3B depicts the correlations between com-munity co-membership and ‘each of the variables’ whencontrolling for the rest of the variables (i.e. the distinctcorrelation between community co-membership and eachof the variables; ‘Materials and Methods’ section). Asdepicted in Figure 3B, the correlation between the
community co-membership and tRs remains significanteven when controlling for all the variables abovecombined (r=0.076; P=0.001, empirical pe< 0.001;‘Materials and Methods’ section); similarly to theanalysis reported in the previous subsection for HGT,most of the decrease in correlation is due to the contribu-tion of genome sizes, phylogenetic distance and similarityin amino acid usage (Figure 3C). When we added to the
Figure 2. (A and B) The tRs values of organisms that share more genes are more similar. (A) Correlation between number of shared genes and tRsfor different cutoffs of gene sharing (1). (B) Whisker plot (five bins of equal size) of tRs versus number of shared genes (cut-off of 70%; five binsequal size). (C) Spearman correlations of various variables with the number of shared genes when controlling for all the other factors; P denotesasymptotic P-value, pe denotes empirical P-value (‘Materials and Methods’ section). (D) Correlation given an increasing number of factors (A)phylogenetic distance, (B) sum of genome sizes, (C) community co-membership, (D) selection for translation efficiency, (E) similarity in the GCcontent, (F) similarity in the amino acid bias, (G) similarity in the growth rate and (H) difference in genome sizes; most of the decrease in correlationis due to genome sizes, phylogenetic distance and similarity in amino acid bias. (E) Whisker plot of the tRs for pairs of ancestral organisms versus themean number of ancestral HGT between them (x-axis) for five bins of equal size.
Nucleic Acids Research, 2011 7
at Tel A
viv University,B
render Moss libr.for S
ocial Sc.&
Managem
ent on June 8, 2011nar.oxfordjournals.org
Dow
nloaded from

list of covariate variables the number of shared genes(shown to be correlated with tRs in the previoussub-section) the correlation became not statistically sig-nificant(r=0.018; P=0.63; pe=0.3030). This is incontrast to the number of HGT events that was signifi-cantly correlated with tRs even when controlling for com-munity co-membership (see the previous sub-section).Finally, the fact that there is a significant relation
between similarity in tRNA pools and a shared commu-nity, suggests that similarity in tRNA pools (e.g. the tRs)can be used for clustering organisms into theircommunities. Indeed, an initial analysis reported inSupplementary Note S4 supports this conjecture.
The effect of codon (dis)similarity of transferred geneson the recipient organism
Over-expressing a gene with maladapted codons is dele-terious to the organism, because ribosomes would thenspend too much time on its slow translation, leading toinefficient ribosome allocation and delayed growth (31).Accordingly, a significant positive correlation was previ-ously shown between codon optimality of highlytranscribed genes [measured by the CAI (31)] and fitness
(r=0.54; P< 10�13) (7); see Figure 4A for the corres-ponding relation between tAI and fitness (r=0.52;P< 1.7� 10�11, P< 0.001). As a general rule, thefraction of the genes acquired by HGT that is highlytranscribed is much lower than the fraction of highly ex-pressed native genes [see, for example, (40,41)], mostly dueto their foreign promoter regions. However, some hori-zontally acquired genes, especially of phage origin, canbe highly transcribed [(14), see the next section]. Thosegenes can reduce host fitness if their codons are highlymaladapted even if the protein they encode does nothave a functional role in the recipient organism (42,43).In contrast, there are rare examples [Sorek et al. (2)] inwhich a ‘specific’ protein encoded by a foreign gene issomehow deleterious to the recipient organism. In thesespecial cases, having highly compatible codons is likely toresult in higher expression levels (more abundant deleteri-ous proteins) leading to ‘increased damage’ to the host.Analyzing the data of Sorek et al., who identified a rela-tively small number of genes (65 genes) that could not becloned in E. coli due to the ‘toxicity’ of the correspondingproteins (2), we indeed found a significant ‘positive’ cor-relation between the number of genes from other organ-isms that cannot be cloned in E. coli and the similarity inthe tRNA pools of donor organisms and E. coli (r=0.34,P=0.0066); see Figure 4B. Thus, as one would expect, thecloser the tRNA pools are, the functional effects of geneswhose proteins are toxic becomes larger, and hence thenumber of such ‘forbidden’, potentially toxic HGTevents increases.
The results reported in the previous sections (thepositive correlation between similarity the tRs and thenumber of HGTs) suggest that genes that producehighly deleterious proteins in the new host are ‘relativelyrare’. Thus, in general, it appears that beneficial genes andhighly-transcribed neutral genes are frequent enough tocreate a selective pressure for similar tRNA pools in or-ganisms from the same community and/or those that areinvolved in HGT, overcoming the inverse pressure exertedby the few genes whose proteins are ‘deleterious’ to therecipient organism.
HGTs may create a selective pressure for similartRNA pools
In the previous sections we showed that organisms thatshare a community have more similar tRNA pools (i.e.more similar tRs), but how has this similarity evolved?
To try and answer that question we returned to the dataset of Nakamura et al. (6), which contains 214 715 genes inthe organisms analyzed (163 organisms in total) 12 897 ofwhich underwent a relatively recent transfer [i.e. thesegenes have a foreign nucleotide composition and are notfully ameliorated (41)]. On average, in each of the organ-isms analyzed around 6% of the genes are ‘recent’ acqui-sitions. The method of Nakamura et al. (6) is based oncodon bias; therefore, this is probably a ‘lower bound’ onthe actual number of HT genes [see also (3)]. As weexplain below, this ‘non-negligible’ fraction of genes thathas been acquired can trigger changes in the copy numberof some of the tRNA genes.
Figure 3. (A) The tRs of organisms that live in the same community[(12), left] are higher than the tRs of organisms from differentcommunities (right). The y-axis is the mean tRs of the organisms ineach group; we used the Kolmogorov–Smirnov (KS)-test for computingP-values. (B) Non-parametric correlations of several variables withniche-sharing, when controlling for all the other variables. p denotesasymptotic P-value, pe denotes empirical P-value (‘Materials andMethods’ section). (C) Correlation given increasing number of factors(A) sum genome of sizes, (B) phylogenetic distance, (C) similarity in theamino acid usage, (D) selection for translation efficiency, (E) similarityin the GC content, (F) similarity in the growth rates and (G) similarityin genome sizes.
8 Nucleic Acids Research, 2011
at Tel A
viv University,B
render Moss libr.for S
ocial Sc.&
Managem
ent on June 8, 2011nar.oxfordjournals.org
Dow
nloaded from

Figure 4. (A) Correlation between fitness (growth rate in OD) and the tAI, across a set of GFPs with different codon bias that have been expressedin E. coli [based on data from (7)]. (B) HGT events from different source organisms to E. coli: the percent of genes that are non-transferable to E.coli versus the corresponding tRs between the source organism and E. coli [based on data of Sorek et al. (2)]. (C) Gene expression of recentlytransferred genes and endogenous genes. The red lines denote the mean expression level in each group, the purple lines mark a threshold denotinghigh expression level [log(mRNA levels) >2]; 11% of endogenous genes (that did not undergo recent HGT) are highly expressed and 6% of the genes
Nucleic Acids Research, 2011 9
at Tel A
viv University,B
render Moss libr.for S
ocial Sc.&
Managem
ent on June 8, 2011nar.oxfordjournals.org
Dow
nloaded from
In all organisms that were analyzed before there is sig-nificant correlation between the expression levels of genesand translation efficiency [as measured, for example, bythe tAI; see (10,19,21,22,26,37)]. One of the main reasonsfor this correlation is the fact that highly expressed genespotentially occupy more ribosomes. Thus, mutations thatimprove their translation efficiency are likely to have ahigher effect on the organism’s ‘fitness’. As a result,these genes are under stronger selection for higher trans-lation efficiency [see, for example, (7,10,37)]. In otherwords, improving the correlation between the expressionlevel of genes and their translation efficiency (tAI) shouldimprove the overall allocation of ribosomes and fitness ofthe organism. This correlation can be improved locally, byincreasing the number of efficient codons in a highly ex-pressed gene or globally, by changing the tRNA pool ofthe organism such that the correlation will increase.Changes in the tRNA pool may be due to duplication/deletion of a tRNA gene but also due to transfer of atRNA(s) (possibly in the same HGT event) from organ-ism(s) in the same environment/community.To try and demonstrate how HGT can trigger selection
for similar tRNA pools, we used E. coli [for which themRNA levels for most genes, under known conditions,are available (14)] as a model organism. According toNakamura et al. (6), 768 out of the 4376 E. coli genesunderwent recent transfer. Figure 4C depicts the distribu-tion of expression levels in E. coli genes, distinguishingbetween recently acquired genes and the rest of thegenome. As can be seen, the average expression levels ofrecently acquired genes are lower than the mean expres-sion level of the rest of the genes (Figure 4C). However,there is a non-negligible fraction of recently acquiredgenes that is highly expressed (6% of the recentlyacquired genes versus 11% of the rest of the genome).Hence, we expected that adjusting the tRNA pool tobetter fit the expression levels of these new genes, whilemaintaining the efficiency of the older and more estab-lished genes, should improve the fitness of the organism.A more efficient ribosome allocation should be reflectedby a higher correlation between mRNA levels of genes andtheir tAI. In addition, it is important to note that even a‘small’ change in this correlation may have a substantialeffect on the fitness of the organism.Quite surprisingly, in accordance with this hypothesis,
the correlation between the expression levels and tAI isindeed higher when considering ‘all’ the genes (r=0.47;P< 10�16, pe< 0.001) than when considering ‘only’ thenon-recently transferred genes (r=0.45; P< 10�16,pe< 0.001; Figure 4D; see Figure 4E for the distributionof tAI in the non-transferred genes and the transferredgenes). This suggests that the tRNA pool of E. coli has
underwent an adaptation to the new HT genes. Furthersupport for this finding comes by observing that the cor-relation between the expression levels and tAI of all thegenes (recently transferred and non-recently transferred) issignificantly higher than when replacing the transferredgenes with random groups of genes of similar size(whose codon biased underwent selection to fit their ex-pression levels—controlling for the fact that the adapta-tion can be at the level of codon bias or that the HT geneshave more compatible codon bias; see the previous sub-section), or by randomly permuting the mRNA values ofonly the transferred genes (empirical P-value=0.01 and0.03, respectively). These results remain significant alsowhen we sampled random groups with similar meanmRNA levels as the transferred genes (controlling forthe fact that the recently acquired genes generally havelower mRNA levels; empirical P-value=0.01).
In addition, we computed the tRNA pool that optimizes(‘Materials and Methods’ section) this correlation whenconsidering all the genes and when considering onlygenes that ‘did not’ undergo recent HGT. These correl-ations were compared to the correlation obtained whenusing the actual tRNA pool. Again, the ‘optimal’ correl-ation was 33% ‘closer’ to the actual one obtained whenconsidering ‘all’ the genes (Figure 4D).
These results may suggest that the tRNA pool of E. coliwas shaped by the expression levels and codon bias of thetransferred genes and not only its ancestral genes. Moregenerally, these results hint that in practice there may be asufficient level of HGT to trigger selection for changes inan organism’s tRNA pool—i.e. such changes that make itmore similar to the tRNA pools of its partners for geneexchange (see also Supplementary Note S5). The fact thatwe have observed this findings in recently transferredgenes that have not had time to ameliorate, may suggestthat such changes in the tRNA pool are relatively rapid.Specifically, these changes are faster than the timerequired for full amelioration, which was estimated to bearound 300 million years (44).
DISCUSSION
This study shows that there is a bi-directional associationbetween translation efficiency and HGT: genes tend to betransferred between organisms that have similar tRNApools (tRs) and frequent HGT between organisms can inturn homogenize their tRNA pools. Likewise, geneswhose tAI is similar among many organisms tend to betransferred more frequently. The fact that the relationbetween the similarity in tRNA pools and HGT wasobserved in all the analyzed data sets demonstrates therobustness of this relation.
Figure 4. Continuedthat did undergo recent HGT are highly expressed. (D) The correlation between tAI and gene expression for the transferred genes, endogenous genes,and for all genes (blue) versus the correlation that is gained in each of these cases after optimizing the tRNA pool (brown); the optimal correlationwhen considering all the gene is closer to the actual one (a ‘difference’ of 0.03 between the optimal and actual correlations) than the correlation whenconsidering only the non-transferred genes (a ‘difference’ of 0.04 between the optimal and actual correlations, 33% higher). (E) The distribution oftAI for endogenous genes (upper part: mean tAI is 0.25—the red line) and recently transferred genes (lower part: mean tAI is 0.22—the red line). (F)A schematic illustration of the possible bidirectional relation between HGT and similarity in the tRNA pools.
10 Nucleic Acids Research, 2011
at Tel A
viv University,B
render Moss libr.for S
ocial Sc.&
Managem
ent on June 8, 2011nar.oxfordjournals.org
Dow
nloaded from
We show that this relation remains significant aftercontrolling for many other possible variables (e.g. GCcontent, amino acid usage, phylogenetic distance andmore). It is important to remember, however, that it isimpossible to completely tease apart some of the variablesmentioned above, as they are inherently inter-dependent.For example, similarity in tRNA pool (and thus codoncomposition) will be reflected in a similar GC contentand amino acid usage; similarly, phylogenetic proximitycan increase the number of HGT events due to similarityin the tRNA pools.
Thus, the correlations that were obtained aftercontrolling for these variables (usually around 0.1–0.2)are only a ‘lower bound’ on the actual effect of translationefficiency on gene transfer. The fact that these correlationsare significant, demonstrates that there is ‘a distinct’ effectof translation efficiency on HGT.
The correlation obtained without the controls (morethan 0.4), on the other hand, represents an ‘upperbound’ for the effect of translation efficiency on HGT,suggesting overall that the actual association betweenHGT and compatibility of the tRNA pools is verysubstantial.
In summary, based on the results presented in thisarticle, we suggest that when the tRNA pool of thedonor organism is more similar to that of the recipient,this in turn increases the chance of successful HGTevents (i.e. there is a higher probability that transferredgenes will be fixed). Another possibility that is consistentwith the data, is that when an organism receives genes fromother organisms, most of them in its community/environ-ment, its tRNA pool can also undergo selection to fit thenew genes, especially those that are highly transcribed, thusimproving the fitness of the organism. This scenario wouldbe more likely when multiple genes are acquired from asingle source together, as in the acquisition of a largeplasmid. Thus, this alternative mechanism will also causethe tRNA pool of the organism to become more similar toother organisms in the community (Figure 4F). One cantherefore speculate that a positive-feedback loop will exist,accounting for the increasing similarity in the tRNA poolof organisms in the same community/niche due to HGT, inturn promoting HGT between organisms in the same niche(Figure 4F).
Furthermore, this scenario is supported by reasonablepopulation genetic considerations such as the effective sizeof bacteria, the fitness advantage of such changes in thetRNA pool, or the fitness disadvantage of receiving a genewith maladaptive codons (see details in SupplementaryNote S5). These results encourage further studies in thisdirection, for example, by performing in vitro evolutionexperiments where bacteria receive a plasmid containinghighly expressed genes and their tRNA pools areexamined by genome re-sequencing every 1000generations.
The results presented in this paper suggest that methodsthat detect (recent) HGT events based on difference in thecodon bias of gene acceptor and the gene donor [see, forexample, (6,45)] underestimate the number of horizontallytransferred genes. Such methods search for genes whosecodon bias is different from that of the host; however, as
we report here, the donors of many of the horizontallytransferred genes have tRNA pools (and similar codonbias) that are similar to the tRNA pools of the acceptors,making HGT detection difficult. This work thereforesupports the conclusions of Medrano-Soto et al. (9), andstresses the importance of relying on phylogenetic tree re-construction data as much as possible when detectingHGT, or when this is impossible, applying multipleHGT detection methods, as previously suggested (46).This is especially true when aiming to infer HGTbetween closely related organisms (with similar tRNApool) that are either phylogenetically related or live inthe same niche. Additionally, since a higher compatibilityin tRNA pools facilitates gene transfer, this contributes toa higher level of gene exchange between related organisms.Thus, the apparent vertical phylogenetic signal one oftenassociates with a tree of life can in fact be maintained bypreferential bias of gene transfer among related taxa, aspreviously suggested by Gogarten et al. (47) for homolo-gous recombination.Finally, our results imply that considering that more
HGTs are expected among organisms that have similartRNA pools (and other cellular features), one canimprove the current algorithms for phylogenetic net-work reconstruction (11,15,48,49) and for inferring eco-logical niches [see, for example, (12)], similarly to theway in which information about co-evolution (25,50)has been recently shown to improve ancestral genereconstruction (51).
SUPPLEMENTARY DATA
Supplementary Data are available at NAR Online.
ACKNOWLEDGEMENTS
We would like to thank Tal Dagan and Yoji Nakamurafor providing us with datasets of horizontal gene transfer.We also would like to thank Hila Gingold, Johann PeterGogarten, Amos Tanay, Elchanan Mossel, and YitzhakPilpel for very helpful and useful discussions. We wish toassert here that UG and ER have equally contributed tothe paper.
FUNDING
T.T. is a Koshland Scholar at Weizmann Institute ofScience and is supported by a travel fellowship from EUgrant PIRG04-GA-2008-239317. M.K. was supported bygrants from the Israel Science Foundation and theGerman-Israel Binational Fund (GIF). U.G. is supportedby a grant from the Israeli Ministry of Health. E.R. issupported by grants from the Israel Science Foundation.M.K., U.G. and E.R. are supported by a grant from theMcDonnell Foundation.
Conflict of interest statement. None declared.
REFERENCES
1. Dagan,T., Artzy-Randrup,Y. and Martin,W. (2008) Modularnetworks and cumulative impact of lateral transfer in prokaryotegenome evolution. Proc. Natl Acad. Sci. USA, 105, 10039–10044.
Nucleic Acids Research, 2011 11
at Tel A
viv University,B
render Moss libr.for S
ocial Sc.&
Managem
ent on June 8, 2011nar.oxfordjournals.org
Dow
nloaded from
2. Sorek,R., Zhu,Y., Creevey,C.J., Francino,M.P., Bork,P. andRubin,E.M. (2007) Genome-wide experimental determination ofbarriers to horizontal gene transfer. Science, 318, 1449–1452.
3. Doolittle,W.F. and Bapteste,E. (2007) Pattern pluralism and theTree of Life hypothesis. Proc. Natl Acad. Sci. USA, 104,2043–2049.
4. Thomas,C.M. and Nielsen,K.M. (2005) Mechanisms of, andbarriers to, horizontal gene transfer between bacteria.Nat. Rev. Microbiol., 3, 711–721.
5. Wellner,A., Lurie,M.N. and Gophna,U. (2007) Complexity,connectivity, and duplicability as barriers to lateral gene transfer.Genome Biol., 8, R156.
6. Nakamura,Y., Itoh,T., Matsuda,H. and Gojobori,T. (2004) Biasedbiological functions of horizontally transferred genes inprokaryotic genomes. Nat. Genet., 36, 760–766.
7. Kudla,G., Murray,A.W., Tollervey,D. and Plotkin,J.B. (2009)Coding-sequence determinants of gene expression in Escherichiacoli. Science, 324, 255–258.
8. Bahir,I., Fromer,M., Prat,Y. and Linial,M. (2009) Viraladaptation to host: a proteome-based analysis of codon usageand amino acid preferences. Mol. Syst. Biol., 5, 311.
9. Medrano-Soto,A., Moreno-Hagelsieb,G., Vinuesa,P., Christen,J.A.and Collado-Vides,J. (2004) Successful lateral transfer requirescodon usage compatibility between foreign genes and recipientgenomes. Mol. Biol. Evol., 21, 1884–1894.
10. Tuller,T., Waldman,Y.Y., Kupiec,M. and Ruppin,E. Translationefficiency is determined by both codon bias and folding energy.Proc. Natl Acad. Sci. USA, 107, 3645–3650.
11. Beiko,R.G., Harlow,T.J. and Ragan,M.A. (2005) Highways ofgene sharing in prokaryotes. Proc. Natl Acad. Sci. USA, 102,14332–14337.
12. Freilich,S., Kreimer,A., Meilijson,I., Gophna,U., Sharan,R. andRuppin,E. The large-scale organization of the bacterial networkof ecological co-occurrence interactions. Nucleic Acids Res., 38,3857–3868.
13. Lowe,T.M. and Eddy,S.R. (1997) tRNAscan-SE: a program forimproved detection of transfer RNA genes in genomic sequence.Nucleic Acids Res., 25, 955–964.
14. Corbin,R.W., Paliy,O., Yang,F., Shabanowitz,J., Platt,M.,Lyons,C.E. Jr, Root,K., McAuliffe,J., Jordan,M.I., Kustu,S. et al.(2003) Toward a protein profile of Escherichia coli: comparisonto its transcription profile. Proc. Natl Acad. Sci. USA, 100,9232–9237.
15. Dagan,T. and Martin,W. (2007) Ancestral genome sizes specifythe minimum rate of lateral gene transfer during prokaryoteevolution. Proc. Natl Acad. Sci. USA, 104, 870–875.
16. Neyman,J. (1971) Molecular studies of evolution: a source ofnovel statistical problems. In Gupta,S. and Jackel,Y. (eds),Statistical Decision Theory and Related Topics. Academic Press,New York, pp. 1–27.
17. Jukes,T.H. and Cantor,C.R. (1969) Evolution of proteinmolecules. In Munro,H.N. (ed.), Mammalian Protein Metabolism.Academic Press, New York, pp. 21–123.
18. Yang,Z. (1997) PAML: a program package for phylogeneticanalysis by maximum likelihood. Comput. Appl. BioSci., 13,555–556.
19. dos Reis,M., Savva,R. and Wernisch,L. (2004) Solving the riddleof codon usage preferences: a test for translational selection.Nucleic Acids Res., 32, 5036–5044.
20. Vieira-Silva,S. and Rocha,E.P. The systemic imprint of growthand its uses in ecological (meta)genomics. PLoS Genet., 6,e1000808.
21. Tuller,T., Kupiec,M. and Ruppin,E. (2007) Determinants ofprotein abundance and translation efficiency in S. cerevisiae.PLoS Comput. Biol., 3, e248.
22. Man,O. and Pilpel,Y. (2007) Differential translation efficiency oforthologous genes is involved in phenotypic divergence of yeastspecies. Nat. Genet., 39, 415–421.
23. Drummond,D.A., Bloom,J.D., Adami,C., Wilke,C.O. andArnold,F.H. (2005) Why highly expressed proteins evolve slowly.Proc. Natl Acad. Sci. USA, 102, 14338–14343.
24. Newman,M.E. (2006) Modularity and community structure innetworks. Proc. Natl Acad. Sci. USA, 103, 8577–8582.
25. Tuller,T., Kupiec,M. and Ruppin,E. (2009) Co-evolutionarynetworks of genes and cellular processes across fungal species.Genome Biol., 10, R48.
26. Waldman,Y.Y., Tuller,T., Shlomi,T., Sharan,R. and Ruppin,E.Translation efficiency in humans: tissue specificity, globaloptimization and differences between developmental stages.Nucleic Acids Res., 38, 2964–2974.
27. Percudani,R., Pavesi,A. and Ottonello,S. (1997) Transfer RNAgene redundancy and translational selection in Saccharomycescerevisiae. J. Mol. Biol., 268, 322–330.
28. Kanaya,S., Yamada,Y., Kudo,Y. and Ikemura,T. (1999) Studiesof codon usage and tRNA genes of 18 unicellular organisms andquantification of Bacillus subtilis tRNAs: gene expression leveland species-specific diversity of codon usage based on multivariateanalysis. Gene, 238, 143–155.
29. Ikemura,T. (1981) Correlation between the abundance ofEscherichia coli transfer RNAs and the occurrence of therespective codons in its protein genes: a proposal for asynonymous codon choice that is optimal for the E. colitranslational system. J. Mol. Biol., 151, 389–409.
30. Dong,H., Nilsson,L. and Kurland,C.G. (1996) Co-variation oftRNA abundance and codon usage in Escherichia coli at differentgrowth rates. J. Mol. Biol., 260, 649–663.
31. Sharp,P.M. and Li,W.H. (1987) The codon AdaptationIndex–a measure of directional synonymous codon usagebias, and its potential applications. Nucleic Acids Res., 15,1281–1295.
32. Ochman,H. and Lawrence,J.G. (1996) In Neidhardt,F.C. (ed.),Escherichia coli and Salmonella typhimurium: Molecular andCellular Biology, 2nd edn. ASM Publications, Washington.
33. Tatusov,R.L., Fedorova,N.D., Jackson,J.D., Jacobs,A.R.,Kiryutin,B., Koonin,E.V., Krylov,D.M., Mazumder,R.,Mekhedov,S.L., Nikolskaya,A.N. et al. (2003) The COGdatabase: an updated version includes eukaryotes.BMC Bioinformatics, 4, 41.
34. Kobayashi,I. (2001) Behavior of restriction-modification systemsas selfish mobile elements and their impact on genome evolution.Nucleic Acids Res., 29, 3742–3756.
35. Stern,A., Mayrose,I., Penn,O., Shaul,S., Gophna,U. and Pupko,T.An evolutionary analysis of lateral gene transfer in thymidylatesynthase enzymes. Syst. Biol., 59, 212–225.
36. Jain,R., Rivera,M.C. and Lake,J.A. (1999) Horizontal genetransfer among genomes: the complexity hypothesis.Proc. Natl Acad. Sci. USA, 96, 3801–3806.
37. Tuller,T., Carmi,A., Vestsigian,K., Navon,S., Dorfan,Y.,Zaborske,J., Pan,T., Dahan,O., Furman,I. and Pilpel,Y. Anevolutionarily conserved mechanism for controlling the efficiencyof protein translation. Cell, 141, 344–354.
38. Foerstner,K.U., von Mering,C., Hooper,S.D. and Bork,P. (2005)Environments shape the nucleotide composition of genomes.EMBO Rep., 6, 1208–1213.
39. Lynch,M. (2007) The Origins of Genome Architecture. SinauerAssociates.
40. Warren,R.L., Freeman,J.D., Levesque,R.C., Smailus,D.E.,Flibotte,S. and Holt,R.A. (2008) Transcription of foreign DNA inEscherichia coli. Genome Res., 18, 1798–1805.
41. Taoka,M., Yamauchi,Y., Shinkawa,T., Kaji,H., Motohashi,W.,Nakayama,H., Takahashi,N. and Isobe,T. (2004) Only a smallsubset of the horizontally transferred chromosomal genes inEscherichia coli are translated into proteins. Mol. Cell.Proteomics, 3, 780–787.
42. Wellner,A. and Gophna,U. (2008) Neutrality of foreign complexsubunits in an experimental model of lateral gene transfer.Mol. Biol. Evol., 25, 1835–1840.
43. Novozhilov,A.S., Karev,G.P. and Koonin,E.V. (2005)Mathematical modeling of evolution of horizontally transferredgenes. Mol. Biol. Evol., 22, 1721–1732.
44. Lawrence,J.G. and Ochman,H. (1997) Amelioration of bacterialgenomes: rates of change and exchange. J. Mol. Evol., 44,383–397.
45. Garcia-Vallve,S., Romeu,A. and Palau,J. (2000) Horizontal genetransfer in bacterial and archaeal complete genomes. GenomeRes., 10, 1719–1725.
12 Nucleic Acids Research, 2011
at Tel A
viv University,B
render Moss libr.for S
ocial Sc.&
Managem
ent on June 8, 2011nar.oxfordjournals.org
Dow
nloaded from

46. Ragan,M.A., Harlow,T.J. and Beiko,R.G. (2006) Do differentsurrogate methods detect lateral genetic transfer events ofdifferent relative ages? Trends Microbiol., 14, 4–8.
47. Gogarten,J.P., Doolittle,W.F. and Lawrence,J.G. (2002)Prokaryotic evolution in light of gene transfer. Mol. Biol. Evol.,19, 2226–2238.
48. Ball,C.A., Awad,I.A., Demeter,J., Gollub,J., Hebert,J.M.,Hernandez-Boussard,T., Jin,H., Matese,J.C., Nitzberg,M.,Wymore,F. et al. (2005) The Stanford Microarray Databaseaccommodates additional microarray platforms and data formats.Nucleic Acids Res., 33, D580–D582.
49. Birin,H., Gal-Or,Z., Elias,I. and Tuller,T. (2008)Inferring horizontal transfers in the presence ofrearrangements by the minimum evolution criterion.Bioinformatics, 24, 826–832.
50. Barker,D. and Pagel,M. (2005) Predicting functional genelinks from phylogenetic-statistical analyses of whole genomes.PLoS Comput. Biol., 1, e3.
51. Tuller,T., Birin,H., Gophna,U., Kupiec,M. and Ruppin,E. (2009)Reconstructing ancestral gene content by coevolution. GenomeRes., 20, 122–132.
Nucleic Acids Research, 2011 13
at Tel A
viv University,B
render Moss libr.for S
ocial Sc.&
Managem
ent on June 8, 2011nar.oxfordjournals.org
Dow
nloaded from