Embed Size (px)
Citation preview
Polymer-specific enzymebreaker improves completionefficiency in horizontal wellsAlbert Chan, Phillips Petroleum Co., Plano, Texas; Drew Hembling, Phillips Alaska, Inc., Anchorage,Alaska; Brian Beall, BJ Services Co., Tomball, Texas; Mokhtar Elgassier,* BJ Services Co., Bakersfield,Calif.; and J. Jay Garner, BJ Services Co., Anchorage, Alaska
Bottom line. Phillips Alaska Inc. realized a 400-bopd incremental production increase in Well3K-24, a horizontal well with slotted liner, by using polymer-specific enzymes (PSE) to reducepolymer-related, drill-in fluid damage. Respective contributions from lowering of skin andincreased production efficiency of the lateral length were 150 bopd and 250 bopd.
Field description. Kuparuk Field, which is located on the North Slope of Alaska, beganproducing in 1984. The Kuparuk River formation is made up of Upper and Lower Mem-bers separated by a regional unconformity. The wells referenced in this case study arelocated in one fault block in the Lower Member A sands. The five A sands are of LowerCretaceous age.The sands are overlapping, trending from northwest to southeast.Thicknessesof the sands range up to 80 ft, extending along strike up to 40 mi, and down dip up to 15mi. Sand porosity ranges from 0.2 to 30% and permeability ranges from 25 to 50 md. Watersaturation is about 25%.
The formation depth is approximately 7,000 ft. Reservoir temperature is 170°F. Oil inthe fault block has an API gravity of 21.3° and a viscosity of 0.8 to 1.2 cp. Asphaltene con-tent is 8%.
In the A sands, the primary cementing materials are clays supplemented by additionalcementation that results from compaction of authigenic quartz overgrowths on the matrix
� Major reserve inc-rease obtained by de-watering high-water-saturation reservoirs
New Dominion, L.L.C. hastaken a bolder approachto developing major newreserves in exhausted oiland gas fields. see page 4
� Nitrogen huff andpuff process breathesnew life into old field
Using a nitrogen huff andpuff (cyclic) process, Bre-tagne G. P. increased pro-duction from a matureAppalachian basin reservoirfrom 200 bopd to 500 bopdwith no significant increasein water production.see page 6
� Air pulse system for artificial lift reduces costs
In six months of testing atthe Rocky Mountain OilfieldTesting Center (RMOTC), aunique air pulse lifting sys-tem, developed by Petro-leum Asset ManagementCo. (PAMCO), loweredpower consumption for lift-ing fluids in two shallow oilwells by 71%.see page 9
� Company-operated, integrated, E&P wastemanagement facilityreduces costs
An integrated, E&P wastemanagement facility hasreduced Patina Oil & GasCorp.’s costs for process-ing oil-contaminated soilsand fluids, including tankbottoms. see page 11
� Reliable, low costvapor recovery systemsaves money whilehelping the environment
Since 1994, Devon EnergyCorp. has employed theVapor Jet system to cap-ture hydrocarbon vaporsfrom oil and water storagetanks in a West Texaswaterflood operation. see page 12
� Pilot test demon-strates how CO2 injec-tion enhances coalbedmethane recovery
Since 1995, BurlingtonResources has beenconducting a pilot testof enhancing coalbedmethane recoverythrough carbon dioxide(CO2) injection.see page 14
September 2000For Independent Producers � Supplement to World Oil ® Magazine
September 2000 Petroleum Technology Digest 1
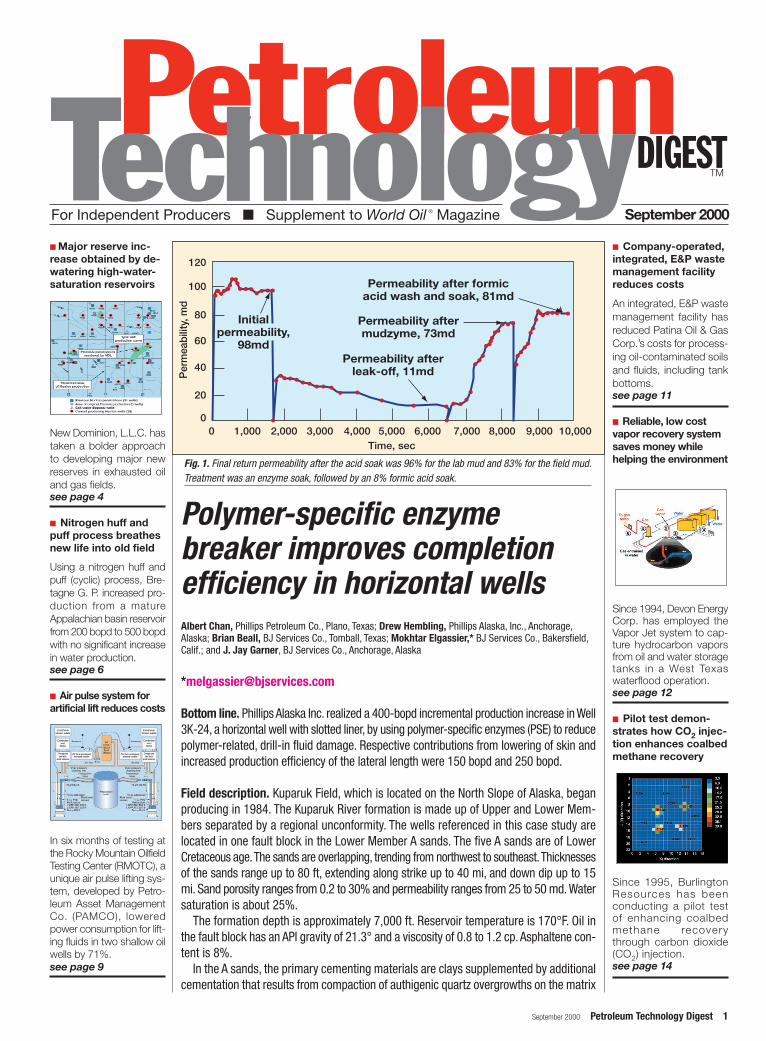
Fig. 1. Final return permeability after the acid soak was 96% for the lab mud and 83% for the field mud.Treatment was an enzyme soak, followed by an 8% formic acid soak.
grains. The intergranular porosity is very good. Permeability is relativelygood, primarily because of abundance of open intergranular pores, goodconductivity and generally low amounts of pore-occluding authigenicmineral precipitates. The illitic clays are grain-coating and poorly-formed/cemented to the matrix grains, which makes the formation sus-ceptible to fines migration. Polymers are required in drill-in fluids to pro-vide a quality completion.
The problem. Polymers in drill-in fluids invade the near wellboreformation and form filter cake around the wellbore. This can sub-stantially reduce well productivity, especially in horizontal andmultilateral wells. Conventional clean-up methods, mainly oxi-dizers and acid treatments, have limited success in removing thedamage caused by polymer residue. These chemical agents—bleach (sodium hypochlorite), lithium hypochlorite, persulfatesand acids—react with polymers regardless of the cleavage sitelocation. Therefore, they may react with any available site on a poly-mer chain or, for that matter, with downhole tools and tubular goods.This significantly reduces the chance of efficient degradation ofthe polymer strand.
Furthermore, these agents react with a maximum of two sites per mol-ecule, which causes the agents to spend quickly, especially at elevateddownhole temperatures.The end result of this is a partially degraded poly-mer fragment.These fragments can clog pore throats and slotted liners.These oxidizers and acids also can be incompatible with formation min-erals, producing undesirable side reactions with reservoir fluids.They alsocan cause corrosion in tubulars.
Polymer-specific enzymes (PSE). Enzymes are large, highly specializedproteins that are produced by living cells. They are present in all bio-logical systems and are derived from all-natural systems. Althoughenzymes are not living organisms themselves, they act as catalysts toaccelerate chemical reactions, therefore, they have the unique abilityto remain unchanged and available to promote other reactions for anessentially indefinite amount of time.
Advancements in biotechnology have led to the isolation, purificationand fermentation of PSE complexes to remove the residual polymer dam-age associated with starch-, xanthan- and cellulose-based polymers usedin the drill-in process. Each PSE system has been optimized to improvehydrolyzation of specific polymeric linkage sites along the targetedpolymer chain. Degradation of polymer molecules occurs as the enzymecleaves the polymer along its binding sites, ideally reducing it to sim-ple sugars.These sugars are of low molecular weight, water soluble andeasily flow through the pore matrix along with produced fluids.
Three horizontal completions. Three wells (3K-22, 3K-23, 3K-24) weredesigned as horizontal completions with slotted liners. The wells tar-geted two vertically separated sands, A2 and A3. Completion details foreach well are listed in Table 1.
Prior lab and pressure transient tests confirmed that permeability dam-age—as a direct result of filter cake deposits on the formation face froma dual-polymer drill-in fluid system—would be a problem. Several con-ventional return permeability tests were run to evaluate filter cakeremoval methods using lab-prepared and actual field samples of thedrill-in fluid in conjunction with Kuparuk field A sand core samples.
Case studies for Independent Producers
Supplement to September 2000 World Oil ®
Welcome to the Petroleum TechnologyDigest, a joint effort by World Oil and the Petro-leum Technology Transfer Council (PTTC) toprovide independent producers with field-proven solutions to their technical problems. Inthis publication, the editors and PTTC staffpresent several recent case studies of explo-ration, drilling and production techniques thathave been tested successfully in oil and gasfields within the U.S.
These case studies have been solicited anddeveloped by the PTTC. No specific applicationof products or services is endorsed by PTTC.Reasonable steps are taken to ensure the relia-bility of sources for information that PTTC dis-seminates; individuals and institutions are solelyresponsible for the consequences of its use.
The not-for-profit Petroleum TechnologyTransfer Council was formed by the U.S. oil andnatural gas industry in 1994 to accelerate thedissemination of technology to independentexploration and producing companies, and tocommunicate industry’s needs to the R&D com-munity. PTTC is funded primarily by the U.S.Department of Energy’s Office of Fossil Energy,through the National Petroleum TechnologyOffice and National Energy Technology Labo-ratory, with additional funding from universi-ties, state geological surveys, several state gov-ernments and industry donations.
Petroleum Technology Transfer Council1101 16th Street, NWSuite 1-CWashington, DC 20036-48031-888-THE-PTTCFax 202-785-2240http://[email protected]
Executive director: Donald F. DuttlingerProject manager: E. Lance ColeProject assistant: Dan LawrencePTTC Regional Resource Centers:
AppalachianDirector: Doug Patchen, AppalachianOil/Natural Gas Research Consortium atWest Virginia University304-293-2867http://karl.nrcce.wvu.edu
Central GulfDirector: Bob Baumann, Louisiana StateUniversity Center for Energy Studies 225-388-1804http://enrg/lsu.edu/pttc_cgr.html
Eastern GulfDirector: Ernest Mancini, University ofAlabama205-348-4319http://egrpttc.geo.ua.edu
MidwestDirector: David Morse, Illinois State Geolog-ical Survey217-244-5527http://pttc.isgs.uiuc.edu
North MidcontinentDirector: Rodney Reynolds, University ofKansas Energy Research Center 785-864-7398http://www.kgs.ukans.edu/ERC/pttcHome.html
Rocky MountainDirector: Sandra Mark, Department of Geol-ogy and Geological Engineering, ColoradoSchool of Mines303-273-3822http://www.mines.edu/research/PTTC
South MidcontinentDirector: Charles Mankin, Oklahoma Geo-logical Survey405-325-3031http://www.ou.edu/special/ogs-pttc/pttchome.htm
SouthwestDirector: Robert Lee, Petroleum RecoveryResearch Center at New Mexico Tech505-835-5408http://octane.nmt.edu/sw-pttc/index.htm
TexasDirector: Scott Tinker, Bureau of EconomicGeology at UT-Austin512-471-1534http://www.energyconnect/pttc
West Coast Director: Iraj Ershaghi, University of South-ern California213-740-8076http://www.usc.edu/dept/peteng/pttc.html
GULF PUBLISHING COMPANYEditorial and Executive Offices3301 Allen Parkway, Houston, Texas, USAMailing Address: PO Box 2608Houston, Texas, USA 77252-2608Phone: (713) 529-4301FAX: (713) 520-4433http://www.gulfpub.com
Case studies sought for future issues ofthis publication. Contact PTTC’s nationaloffice for details.
Petroleum Technology Digest September 2000 3
4 Petroleum Technology Digest September 2000
Cleanup treatments were evaluated on lab and field mud samples.Results using field mud are illustrated in Fig. 1. This treatment was
an enzyme soak, followed by an 8% formic acid soak designed toremove the calcium carbonate bridging material. The final return per-meability after the acid soak was 96% for the lab mud and 83% for thefield mud.
Field results. Well 3K-22 was drilled first using a fresh-water, low-solids,nondispersed mud system. Barite was added to control density. No xan-than-type drill-in fluid was used, since the well was completed with acemented perforated liner. The well was put on production for sixmonths and then converted to an injector.
Wells 3K-23 and 3K-24 were completed as horizontal producerswith slotted-liner completions.The horizontal sections were drilled witha 6% KCl-brine-based, dual-polymer drill-in fluid consisting of starchand xanthan. Sized calcium carbonate was added to help provide addi-tional leak-off control.
For 3K-24, a PSE treatment was designed to remove the majority ofthe drilling fluid filter cake from the horizontal pay-zone sections.The treat-ment was pumped after running the 41⁄2-in. slotted liner to TD.The well-bore clean up was done using an inner wash string to circulate the treat-ment into the 41⁄2-in. slotted liner by openhole annulus.A buffer was usedto avoid drill-in fluid contact with the mudzyme.There were no well con-trol problems after placing the treatment, as it does not act on the cal-cium carbonate bridging agents. The well was then put on production.
Completion efficiency results for the three wells are summarized inTable 2.The 3K-24 completion has the best completion efficiency at 96%.
This increased efficiency is attributed to proper design of the drill-in fluidand the PSE cleanup operation. Completion efficiency represents the well’sproduction relative to the potential rate with a zero-skin completion.Theestimated rate increase associated with the 3K-24 completion programis 400 bopd. Of this, 150 bopd is attributed to lowering skin, while 250bopd is attributed to increased production efficiency of the lateral. Thedaily rates are an average rate over the first three months of production.
ACKNOWLEDGMENTThis case study was summarized from SPE paper 58732 presented at the 2000 SPE Inter-
national Symposium on Formation Damage held in Lafayette, La, 23-24 February 2000. Theauthors and PTTC thank Phillips Alaska, Inc. (formerly ARCO Alaska, Inc.), BP Exploration (Alaska)Inc., the Kuparuk River Unit co-owners and the management of BJ Services Co. for permissionto publish this case study.
THE AUTHORSDr. Albert Chan is a research scientist for Phillips Petroleum Co. (formerly AEPT) in Plano,
Texas. He holds a PhD degree in chemistry from Rice University.Drew Hembling is a staff petroleum engineer with Phillips Alaska, Inc. (formerly Arco
Alaska, Inc.) in Anchorage, Alaska. He holds a BS degree in petroleum engineering from WestVirginia University.
Brian Beall is a Ssenior research engineer with BJ Services (Sand Control/Well Com-pletions) in Tomball, Texas. He holds a BS degree in petroleum engineering from the Uni-versity of Texas at Austin and has authored and co-authored various papers on usingenzymes to clean up drill-in fluid filter cake.
Dr. Mokhtar Elgassier is a technical consultant with BJ Services (reservoir engineer-ing group) in Bakersfield, Calif. He holds BS, MS and PhD degrees in petroleum engineer-ing from the University of Southern California. He is the author and co-author of more than25 scientific papers.
J. Jay Garner is employed by BJ Services Company in Anchorage,Alaska. He has authoredand co-authored numerous industry technical papers focusing on formation damage andwell stimulation. He majored in geology at Colorado State University.
Table 1. Well completion details
Well3K-22 3K-23 3K-24
Type Producer/Injector Producer ProducerCasing size, in. 75⁄8 75⁄8 75⁄8Tubing size, in. 41⁄2 41⁄2 31⁄2 & 41⁄2Liner size, in. 41⁄2 41⁄2 41⁄2Perforated interval, ft 1,800 1,450 2,300Shots per ft 4 4 4Net A3 sand, ft 830 1,135 2,189Net A2 sand, ft 420 1,427 3,023Average net pay 13 31 34thickness, ft
Table 2. Completion efficiency and summary data
Well3K-22 3K-23 3K-24
Length of Horizontal 1,900 1,680 3,400section, ftPay, ft 1,400 1,450 2,300K, md 29 25 60Kv/Kh 0.053 0.092 0.010Leff, % (effective 86 89 100producing lengthfrom net pay withinthe horizontal section)
Skin 1.15 1.3 0.40Completion efficiency,% 77 81 96
Major reserve increaseobtained by dewateringhigh-water-saturationreservoirsDavid Chernicky, New Dominion, L.L.C., Tulsa, Okla.
Bottom line. New Dominion, L.L.C. has taken a bolder approach to devel-oping major new reserves in exhausted oil and gas fields. By applyingtechnology now accepted in coalbed methane production to veryextensive, high-water-saturation oil and gas fields, reserves previ-ously considered uneconomic have become profitable.
Background. From its beginning in 1998, New Dominion, L.L.C. (NDL)has been focused on producing high-water-saturation reservoirs, suchas the Hunton limestone in central Oklahoma. The Hunton is quite het-
erogeneous, producing by partial water drive. Except for selected wellson structural highs, wells encounter thick, but typically high-water-sat-uration zones. Wells in this environment had been conventionally pro-duced and typically abandoned, or bypassed entirely, because of highwater production and the economic factors associated with the same.
However, New Dominion’s experience has proven that systematicdewatering of the entire reservoir, not just individual wells, results insynergistic interaction among wells, leading to decreasing water:oil ratio(WOR) as field development occurs. Development of new reserves inthis environment requires the following six essential components:
• Correct geological assessment of the reservoir• Abundant and economic high-current, three-phase electrical power• A high-volume gas gathering and processing system, which is often
nonexistent in the areas around these types of reservoirs.• An extensive and economic high-volume produced water disposal
system• A large front-end capital investment to assure that enough wells
are drilled in the initial phase to effect the synergistic interactionamong the wells, which causes the producing water:oil ratio (WOR) todecrease markedly as field development continues
September 2000 Petroleum Technology Digest 5
• A well-trained and knowledgeable field staff to safely maintaina highly loaded and challenged mechanical system.
NDL installs all of the electrical, production water, gas and even oil dis-tribution and collection infrastructure in advance of drilling production wells,which can produce up to 6,000 bfpd per well. Once initial production isestablished, NDL begins an intensive and systematic development drillingprogram to systematically dewater and produce the entire reservoir.
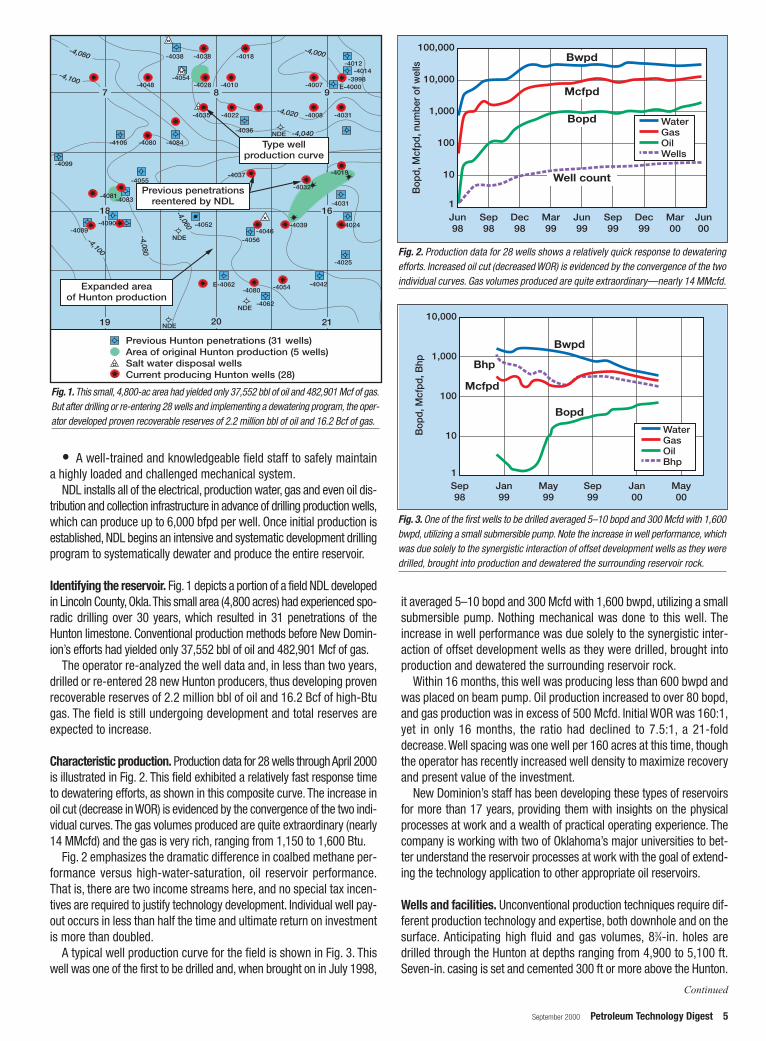
Identifying the reservoir. Fig. 1 depicts a portion of a field NDL developedin Lincoln County,Okla.This small area (4,800 acres) had experienced spo-radic drilling over 30 years, which resulted in 31 penetrations of theHunton limestone. Conventional production methods before New Domin-ion’s efforts had yielded only 37,552 bbl of oil and 482,901 Mcf of gas.
The operator re-analyzed the well data and, in less than two years,drilled or re-entered 28 new Hunton producers, thus developing provenrecoverable reserves of 2.2 million bbl of oil and 16.2 Bcf of high-Btugas. The field is still undergoing development and total reserves areexpected to increase.
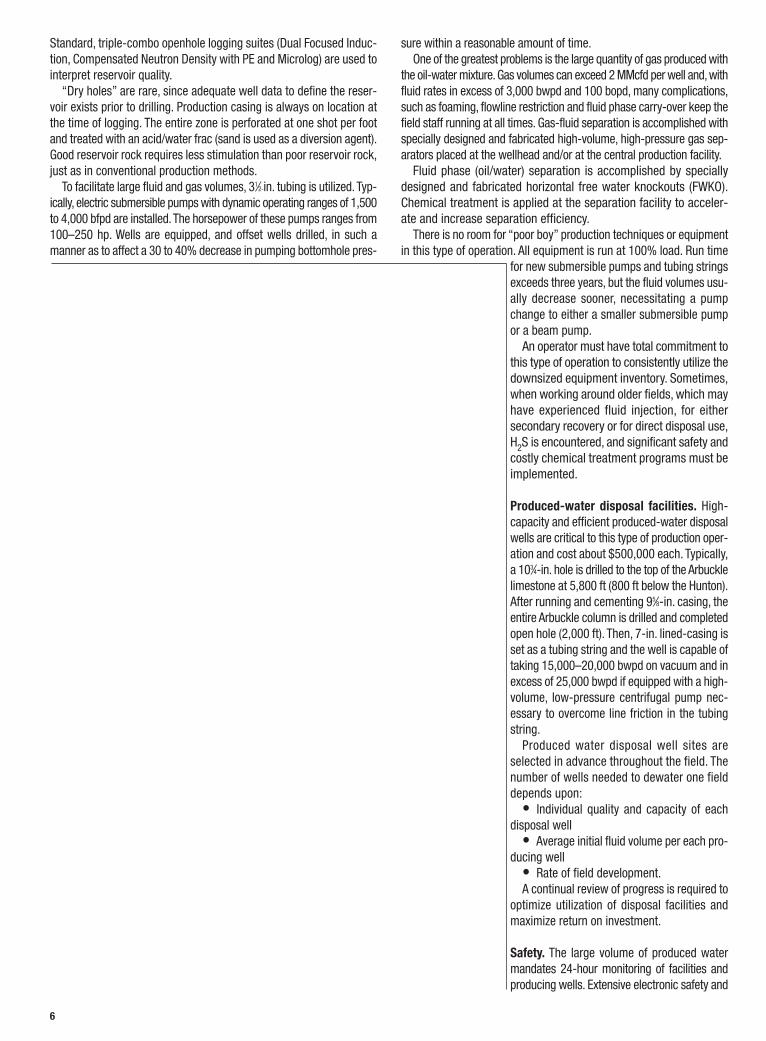
Characteristic production. Production data for 28 wells through April 2000is illustrated in Fig. 2. This field exhibited a relatively fast response timeto dewatering efforts, as shown in this composite curve. The increase inoil cut (decrease in WOR) is evidenced by the convergence of the two indi-vidual curves.The gas volumes produced are quite extraordinary (nearly14 MMcfd) and the gas is very rich, ranging from 1,150 to 1,600 Btu.
Fig. 2 emphasizes the dramatic difference in coalbed methane per-formance versus high-water-saturation, oil reservoir performance.That is, there are two income streams here, and no special tax incen-tives are required to justify technology development. Individual well pay-out occurs in less than half the time and ultimate return on investmentis more than doubled.
A typical well production curve for the field is shown in Fig. 3. Thiswell was one of the first to be drilled and, when brought on in July 1998,
it averaged 5–10 bopd and 300 Mcfd with 1,600 bwpd, utilizing a smallsubmersible pump. Nothing mechanical was done to this well. Theincrease in well performance was due solely to the synergistic inter-action of offset development wells as they were drilled, brought intoproduction and dewatered the surrounding reservoir rock.
Within 16 months, this well was producing less than 600 bwpd andwas placed on beam pump. Oil production increased to over 80 bopd,and gas production was in excess of 500 Mcfd. Initial WOR was 160:1,yet in only 16 months, the ratio had declined to 7.5:1, a 21-folddecrease. Well spacing was one well per 160 acres at this time, thoughthe operator has recently increased well density to maximize recoveryand present value of the investment.
New Dominion’s staff has been developing these types of reservoirsfor more than 17 years, providing them with insights on the physicalprocesses at work and a wealth of practical operating experience. Thecompany is working with two of Oklahoma’s major universities to bet-ter understand the reservoir processes at work with the goal of extend-ing the technology application to other appropriate oil reservoirs.
Wells and facilities. Unconventional production techniques require dif-ferent production technology and expertise, both downhole and on thesurface. Anticipating high fluid and gas volumes, 83⁄4-in. holes aredrilled through the Hunton at depths ranging from 4,900 to 5,100 ft.Seven-in. casing is set and cemented 300 ft or more above the Hunton.
Fig. 3. One of the first wells to be drilled averaged 5–10 bopd and 300 Mcfd with 1,600bwpd, utilizing a small submersible pump. Note the increase in well performance, whichwas due solely to the synergistic interaction of offset development wells as they weredrilled, brought into production and dewatered the surrounding reservoir rock.
20
-4019
Fig. 1. This small, 4,800-ac area had yielded only 37,552 bbl of oil and 482,901 Mcf of gas.But after drilling or re-entering 28 wells and implementing a dewatering program, the oper-ator developed proven recoverable reserves of 2.2 million bbl of oil and 16.2 Bcf of gas.
Fig. 2. Production data for 28 wells shows a relatively quick response to dewateringefforts. Increased oil cut (decreased WOR) is evidenced by the convergence of the twoindividual curves. Gas volumes produced are quite extraordinary—nearly 14 MMcfd.
Continued
6
Standard, triple-combo openhole logging suites (Dual Focused Induc-tion, Compensated Neutron Density with PE and Microlog) are used tointerpret reservoir quality.
“Dry holes” are rare, since adequate well data to define the reser-voir exists prior to drilling. Production casing is always on location atthe time of logging. The entire zone is perforated at one shot per footand treated with an acid/water frac (sand is used as a diversion agent).Good reservoir rock requires less stimulation than poor reservoir rock,just as in conventional production methods.
To facilitate large fluid and gas volumes, 31⁄2-in. tubing is utilized. Typ-ically, electric submersible pumps with dynamic operating ranges of 1,500to 4,000 bfpd are installed.The horsepower of these pumps ranges from100–250 hp. Wells are equipped, and offset wells drilled, in such amanner as to affect a 30 to 40% decrease in pumping bottomhole pres-
sure within a reasonable amount of time.One of the greatest problems is the large quantity of gas produced with
the oil-water mixture. Gas volumes can exceed 2 MMcfd per well and, withfluid rates in excess of 3,000 bwpd and 100 bopd, many complications,such as foaming, flowline restriction and fluid phase carry-over keep thefield staff running at all times. Gas-fluid separation is accomplished withspecially designed and fabricated high-volume, high-pressure gas sep-arators placed at the wellhead and/or at the central production facility.
Fluid phase (oil/water) separation is accomplished by speciallydesigned and fabricated horizontal free water knockouts (FWKO).Chemical treatment is applied at the separation facility to acceler-ate and increase separation efficiency.
There is no room for “poor boy” production techniques or equipmentin this type of operation. All equipment is run at 100% load. Run time
for new submersible pumps and tubing stringsexceeds three years, but the fluid volumes usu-ally decrease sooner, necessitating a pumpchange to either a smaller submersible pumpor a beam pump.
An operator must have total commitment tothis type of operation to consistently utilize thedownsized equipment inventory. Sometimes,when working around older fields, which mayhave experienced fluid injection, for eithersecondary recovery or for direct disposal use,H2S is encountered, and significant safety andcostly chemical treatment programs must beimplemented.
Produced-water disposal facilities. High-capacity and efficient produced-water disposalwells are critical to this type of production oper-ation and cost about $500,000 each. Typically,a 103⁄4-in. hole is drilled to the top of the Arbucklelimestone at 5,800 ft (800 ft below the Hunton).After running and cementing 95⁄8-in. casing, theentire Arbuckle column is drilled and completedopen hole (2,000 ft). Then, 7-in. lined-casing isset as a tubing string and the well is capable oftaking 15,000–20,000 bwpd on vacuum and inexcess of 25,000 bwpd if equipped with a high-volume, low-pressure centrifugal pump nec-essary to overcome line friction in the tubingstring.
Produced water disposal well sites areselected in advance throughout the field. Thenumber of wells needed to dewater one fielddepends upon:
• Individual quality and capacity of eachdisposal well
• Average initial fluid volume per each pro-ducing well
• Rate of field development.A continual review of progress is required to
optimize utilization of disposal facilities andmaximize return on investment.
Safety. The large volume of produced watermandates 24-hour monitoring of facilities andproducing wells. Extensive electronic safety and
September 2000 Petroleum Technology Digest 7
automatic shut down systems are used for back up. New Dominion willbe utilizing real time digital monitoring (SCADA) technology on futureinstallations.
Economic factors. Project economics are heavily influenced by:• Economies of scale in the initial infrastructure investment• Continual and timely drilling, since one must quickly and con-
sistently establish new production to amortize the investment• Minimum downtime to maximize the synergistic increase in oil cut• Tight control of direct operating expense.
In the 28-well Lincoln County project, total infrastructure investmentexceeds $4 million, with 60% dedicated to produced-water facilitiesand the remainder to electrical construction. Completed well costsexceed $300,000 for direct costs, but average $500,000 if infrastruc-ture is prorated to each well. Electricity comprises 60% of the$6,000/month average per-well lease operating expense.
THE AUTHORDavid Chernicky is an owner, director of exploration and manages New Dominion, L.L.C.’s
Tulsa office.A graduate of the University of Oklahoma with a degree in exploration geophysics,he worked with Marathon Oil and Amoco Production in the Rocky Mountain region beforebeginning an independent practice in Oklahoma in 1983.
Nitrogen huff and puffprocess breathes new lifeinto old fieldBernie Miller,* Bretagne G. P., Lexington, Ky., and Robert Gaudin,** Nitrogen OilRecovery Systems LLC, Evansville, Ind.
*[email protected]**[email protected]
Bottom line. Using a nitrogen huff and puff (cyclic) process, BretagneG. P. increased production from a mature Appalachian basin reservoirfrom 200 bopd to 500 bopd with no significant increase in water pro-duction. Cumulative recovery through May 2000 is 115,000 bbl of oilfrom cumulative injection of 342 MMcf of nitrogen. The compositeprojected nitrogen utilization factor for the project is 1.2 Mcf per incre-mental bbl from the initial 163 wells treated.
Huff and puff (cyclic) process. Conventional huff and puff applica-tions have concentrated on using a solvent (such as steam or carbondioxide). Applications often are limited by two factors—economicavailability of the primary injectant and the mechanisms of the huff andpuff process itself. This patent-pending huff and puff (cyclic) processusing nitrogen addresses both concerns.
Compact nitrogen membrane units (Fig. 1), currently used for onshoreand offshore operations and in other industries, can provide nitrogengas to oil fields at economical costs. From a displacement standpoint,this process also takes advantage of nitrogen’s unique characteristics,which allow natural gas to bypass and not be absorbed during the huffphase, and then to take the place of and displace oil and gas duringthe puff phase. The application is especially targeted for dual-poros-ity reservoirs where classic displacement mechanisms are non-com-mercial. From an operations standpoint, nitrogen is user-friendly in thatit is inert, non-corrosive and environmentally friendly
The huff and puff (cyclic) process is a single well process involvingthree basic phases:
• The huff phase—injectant is introduced into the well’s drainage area• Shut-in phase—injectant is allowed to dissipate into reservoir to
an optimum equilibrium• Puff phase—some of the injectant is left in place and hydrocar-
bons are produced.If the process is performed at above fracture pressures or if the injec-
tant reacts with the formation, then stimulation of the reservoir rockcan take place.
During the huff phase—since nitrogen does not dissolve in the reser-voir fluids or dissipate, as is the case with carbon dioxide and steam—the gas is able to penetrate further into the reservoir. In the case of a frac-
tured reservoir, the nitrogen can penetrate easier into the rock matrix.In the classic displacement process, the injectant goes into the
matrix or fault blocks, but is trapped and cannot be easily produced.With depletion, the matrix has voidage that the nitrogen can occupy andthen become trapped. Since nitrogen is a gas, the nitrogen occupiesless space in the huff phase under higher pressure than in the puff phase,where the pressure has been significantly decreased.
These basic processes, along with the relative permeability changesand gas trapping, can result in significant oil recovery. While in mostcases additional oil recovery can be obtained by huff and puff with nitro-gen gas, the efficiency of the recovery process is dependent upon thecomposite of reservoir characteristics and the procedure used.
Big Andy project. Production from the Big Andy project in Lee County,Ky., is from a shallow (1,300-ft) reservoir with an average thicknessof 40 ft. The reservoir is known to be a dual porosity or fractured reser-voir system. Prior to the project, depletion from primary production hadlowered the reservoir pressure to an average of 25 to 50 psi. Produc-tion from the 400-well project was only 200 bopd, averaging about 0.5bopd/well. The low reservoir pressure and presence of natural fracturingfacilitated gas injection during the huff phase. Nitrogen could beinjected easily at 150 psi. At this design pressure, lower-cost polypipeline systems could be used to deliver the nitrogen to the wells.
The initial nitrogen membrane unit was installed and started in July1998 to deliver 350 Mcfd of 5% oxygen and 95% nitrogen. As expe-rience was gained and the treating program expanded, volume wasincreased to 750 Mcfd within the next year. Nitrogen purity, targetedat 95%, can range from 93 to 95%. Adverse effects of lower purity(higher oxygen) nitrogen vary, depending upon the sensitivity of brineand other constituents to higher oxygen levels.
Nitrogen is injected down the annulus of producing wells. Individualwell injection rates vary from 20 to 100 Mcfd, depending upon thestage of injection in the well and the relative permeability to gas, withthe average rate during injection being about 50 Mcfd per well. At theserates, about 15 wells are in the huff phase at any one point in time.
Fig. 1. Compact nitrogen membrane units, used for both onshore and offshore oper-ations, provide nitrogen gas to oil fields at economical costs.
8
To date, most producers are in the first cycle. The typical initialcycle consists of injecting about 1.0 MMcf of nitrogen, a shut-in periodof about 30 days, and then the well is returned to production.
Cycle interval depends upon many factors. The overriding consid-eration is that recovery per cycle will overlap; thus, oil recovery is notbelieved lost by retreating prior to production returning to the base line.Thus, the interval is dependent upon the optimization of the resourcesavailable, including, but not limited to:
• Optimum treatment size per cycle• Optimum shut-in time• Optimum available injection-gas volume and pressure• Treatment cost (including the lost production during huff and
shut-in periods).Production response to two cycles on the Noah Little lease is illustrated
in Fig. 2.The first cycle used 860 Mcf per well, and has a projected incre-mental recovery of 1.7 Mcf per incremental bbl over base production.The
second cycle used 570 Mcf per well and has a projected recovery of 1.4Mcf per incremental bbl over first-cycle projected production.
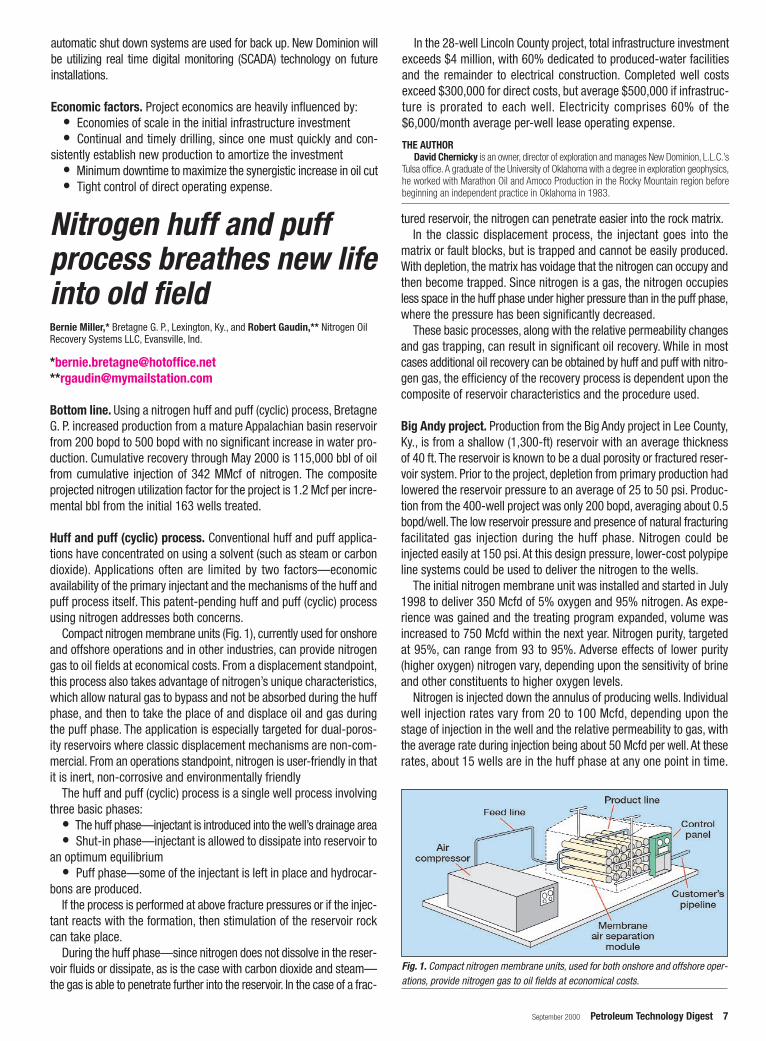
Through May 2000, oil production has increased from 200 bopdwith a 40% decline rate to 500 bopd, and it is still increasing, Fig. 3.Withthe increase in gas production, part of the casing head gas is being gath-ered and compressed for use as fuel, stripped of liquids and recycled.Further gas processing is being evaluated on a stand-alone basis.Expectations are that overall recovery may be increased 10 to 20% byrecovering the liquids in the produced gas.
Cumulative incremental oil recovery through May 2000 is 115,000bbl from cumulative nitrogen injection of 342 MMcf—or a nitrogen uti-lization of about 3 Mcf per incremental bbl. Injection volume includesgas injected into wells currently shut in during injection and in the shut-in period. Cumulative incremental oil does not include future produc-tion from the gas that has been injected. Estimated ultimate nitrogenutilization factor on the first 163 wells is 1.2 Mcf per incremental bbl,ranging from 0.5 to 2.0 Mcf per incremental bbl for individual leases.
Economic data. Nitrogen (95% purity) can be generated using a nitro-gen membrane unit for approximately $1.50/Mcf, depending uponcost of electricity, unit size, cost of capital and maintenance cost.Welltreatment cost depends upon availability of nitrogen transportationto the wells and the cost of well preparation. In the Big Andy case,a pre-existing oil sales line is being used to distribute nitrogenthrough the field to the central tank batteries, and the flowlines arereversed during the huff treatment on a lease basis.
The wells are prepared by shutting down the pumping units, and nitro-gen is diverted into the casing annulus. Under this system, the com-posite cost of the nitrogen is about $2.00 per Mcf. Average payout timeis 150 days at current oil price ($25/bbl), including well shut-in timefor injection and shut-in.
With no increase in water production and no increase in otheroperating costs, the incremental production goes to the bottom line.Of particular significance, the process can be tested in a given reser-voir without a great deal of capital exposure.
ACKNOWLEDGMENT
Case study material has been presented to a local section meeting of SPE in Paintsville,Ky., during February 2000 and an Independent Oil & Gas Association Meeting of New Yorkin June 2000.
THE AUTHORBernie Miller, president of Bretagne G.P in Lexington, Ky., holds a petroleum engineer-
ing degree from West Virginia University and an MBA in finance from Tulane University. Priorto Bretagne, he worked the Gulf Coast area with Gulf Oil Corp. and Omni Exploration, Inc. Dur-ing the last 11 years, he has authored four papers on the huff and puff process.
Robert Gaudin is managing partner of Nitrogen Oil Recovery Systems, L.L.C. in Evansville,Ind. He holds degrees in land management and geology from the State University of New York,Potsdam, NY. He has been managing partner of Mid-Central Land Services, L.L.C. for more than25 years. Prior to Mid-Central, he was a consultant to the New York state attorney general.
Fig. 2. Production response to two huff and puff cycles on the Noah Little lease with sevenwells. The first cycle has a projected incremental recovery of 1.7 Mcf per incrementalbbl over base production; second cycle projected recovery is 1.4 Mcf per incremental bbl.
Fig. 3. By May 2000, Big Andy project oil production had increased from 200 bopdto 500 bopd, and it is still increasing. Overall recovery may be increased 10 to 20%by recovering the liquids in the produced gas.
Circle 93

September 2000 Petroleum Technology Digest 9
Air pulse system for artificial lift reduces costsEd Corlew,* Petroleum Asset Management Co., Madison, Tenn., and Joe Rochelle,U.S. Dept. of Energy, Casper, Wyo.
Bottom line. In six months of testing at the Rocky Mountain Oilfield Test-ing Center (RMOTC), a unique air pulse lifting system, developed byPetroleum Asset Management Co. (PAMCO), lowered power con-sumption for lifting fluids in two shallow oil wells by 71%. Significantly,there was enough excess capacity with the 3-hp air compressor usedduring the test to lift similar wells with little incremental operating cost.Remote monitoring and control via satellite and web-based softwarewere effectively demonstrated, potentially eliminating trips to the field.
Problem addressed. Operators, particularly those of marginal wells,are searching for ways to lower pumping costs and improve produc-tion. Sucker rod pumping systems, although long accepted in theindustry, are not without shortcomings. To maintain operational eco-nomics, proper design and maintenance are essential. Maintenance costscan be high, particularly in deviated wells subject to rod and tubing wear.PAMCO’s system provides an alternative that, when applied in theappropriate environment, will reduce lifting costs, avoid maintenancecosts and, in some cases, actually improve production.The PAMCO sys-tem, with only one moving part downhole, has no sucker rods, sopulling costs are virtually eliminated.
Solution. The PAMCO system consists of a downhole pump chamberwith a one-way ball valve on the bottom, allowing fluid entry, and twolines—one for air/gas inlet and a small return line for producing liq-uid slugs to the surface.The system is computer-operated and senses filling of the downholepump chamber. When the chamber is filled,sensors trigger the release of an air/gas pulse.This pulse, typically supplied by a small aircompressor, displaces fluid in the pump cham-ber and lifts the liquid slug to the surface throughthe return line.
With only one moving part (the inlet ball valve)downhole, maintenance costs are minimal.Operations can be monitored remotely and con-trolled via satellite through Cybersensor.com, Inc.(a strategic partner) and web-based software.The Cybersensor technology can be accessedfrom any computer connected to the Internet(using a password) and also provides control oftank gauges, flow meters and other peripheralequipment.
The system does not fit all situations.The opti-mum application is for wells located relativelyclose together (so that one compressor cansupply air for several wells), depths less than2,000 ft and fluid volumes less than 100 bpd.It can be applied in oil wells or in marginal gaswells where it helps keep water removed.
Installation. Two shallow, 500-ft wells that pro-
duce from the Shannon formation were chosen for the test. Well 72-2 was drilled in 1992 and perforated in the Shannon formation from302–412 ft. Its production had declined to an average of 1 bopd and9 bwpd. Well 72-41 was drilled in 1989 and perforated in the Shan-non formation from 292–402 ft. Its production had declined to anaverage of 1 bopd and 8 bwpd. Produced oil is 36° API with a high paraf-fin content. Produced brine has a high scaling index.
A workover rig pulled the rods and tubing from each well, andPAMCO’s pumping system was installed in each well. In this instance,3⁄4-in. steel tubing was used for the inlet lines and 1-in. PVC for the returnlines. A small, 3-hp compressor supplied air for both wells, Fig. 1.
The two wells were tested from October 1999 to May 2000. In bothwells, production followed established declines, Fig. 2. The wellswere down in March 2000 due to field electrical problems. The sys-tem operated reliably throughout the Wyoming winter. There were nowell pulling costs nor unusual maintenance costs. Paraffin and scalefrom produced fluids did not cause any operational problems through-out the test.
Remote monitoring and control of the wells were accomplishedthrough a built-in satellite link connected to the wellsite. Proprietary web-based software, with access to the wellsite over the Internet, alsowas tested effectively. Remote, near-real-time alarm and messagingwas available at very low cost via Cybersensor.com using an existinglow-earth-orbit satellite system (ORBCOMM).
Economic performance. The single, 3-hp compressor was able to liftthe wells and still run only 25% of the time, indicating that there wassufficient excess capacity to lift additional wells with little incremen-tal cost. Prior to the test, Well 72-41 was produced using an API size25 pumping unit with a 3-hp motor on a 25% time clock.Well 72-2 wasproduced using an API size 57 pumping unit with a 7.5-hp motor on a25% time clock. Electrical power cost averaged $16/month during thetest period, a 71% reduction in power costs, compared to combined
Air line
Fig. 1. After a workover rig pulled rods and tubing from the wells, a PAMCO pumping system was installed in each.Inlet lines are 3⁄4-in. steel tubing; return lines are 1-in. PVC. A 3-hp compressor supplies air for both wells.

September 2000 Petroleum Technology Digest 11
average power cost for the two wells of $56/month.The PAMCO system, including the controller and Cybersensor.com
automation and communications system, would cost about $7,500 fora single-well installation in a typical 1,000-ft deep well. It must be notedthat, as in the RMOTC installation, one compressor may supply enoughair for several wells. Leasing rather than purchasing is also an option.Other benefits, not apparent in this small-scale field test, are that pro-duction often is increased when wells are kept pumped off or clear offluids and well servicing costs are reduced. With automation, fieldlabor costs can be lowered.
THE AUTHORSEd Corlew is president of Petroleum Asset Management Co. in Madison, Tenn. He
holds a BS degree in marketing from Middle Tennessee State University and has been involvedin development of the PAMCO system for more than ten years. He also is president and CEOof Cybersensor.com, Inc.
Joe Rochelle is a project manager with the U.S. Dept. of Energy in Casper,Wyo. He holdsan AS degree in geology from Casper College, plus BS degrees in geology and petroleumengineering and an MBA from the University of Wyoming. Before joining the DOE, he workedfor Terra Resources, Inc., Marathon Oil and Union Pacific.
Fig. 2. Example decline curve for Well 72-2.The air pulse lift system operated reliably through-out the Wyoming winter. There were no well pulling costs nor unusual maintenance costs.
Company-operated,integrated, E&P wastemanagement facilityreduces costsJohn Nussbaumer, Patina Oil & Gas Corp.
Bottom line. An integrated, E&P waste management facility has reducedPatina Oil & Gas Corp.’s costs for processing oil-contaminated soils andfluids, including tank bottoms. Disposal costs have been lowered from$20/yard, with liability attached, to under $4/yard, without the liability.Withreuse of treated soil, cost of the landfarming operation is breakeven.
Background. Patina operates approximately 3,000 wells in the GreaterWattenberg field of the Denver-Julesburg basin.When evaluating E&P wastemanagement options, two factors led to the company’s decision to design,permit, construct and operate its own waste management facility. First,E&P waste disposal at commercial facilities is expensive—about $20/tonof oily solids at a nearby commercial facility.And some facilities would nottake soil with more than 1% hydrocarbons.This contamination level is theclean-up standard under Colorado Oil and Gas Conservation Commission(COGCC) standards applicable to non-sensitive areas.
Liability was another important consideration. Commercial facilitiestend to be under-capitalized and operated “on the cheap.” Whenthings go wrong, as they have at one local facility that has been deter-mined to represent an “imminent and substantial endangerment”under the Resource Conservation & Recovery Act, operators canbecome liable. Under RCRA, EPA has mandated a full investigation andremediation of the example site, and its operator has declared insol-vency. Oil and gas operators may be liable for up to $3 million.
Considering these factors, Gerrity Oil & Gas, a predecessor to Patina,chose to pursue the company-operated E&P waste management facil-ity option. The facility was to allow bioremediation of contaminated soilthrough landfarming, plus provide sludge treatment capability for oilydrilling muds, tank bottoms and other sludges. Incoming sludge wouldbe separated into salable product, clear water and residual solids, which
would be incorporated into the landfarm for bioremediation.Early in the permitting process, Gerrity encountered a dual jurisdictional
problem between COGCC and the Colorado Dept. of Public Health and Envi-ronment (CDPHE). Ultimately, legislation specifying that COGCC had solejurisdiction for “noncommercial” facilities was required. COGCC definesnoncommercial as those accepting only E&P waste from one operator, orfrom a unitized area under a joint operating agreement. Even then, facil-ities must comply with local land use regulations.
Treating process. The processing facility contains two 340- by 105-ftsoil-treatment cells. Soil that is not totally saturated with hydrocarbonsis placed directly into one of the cells. “Dripping wet” saturated soils areplaced into the sloped-bottom cement pit. At the lowest end of this pit,there is a chamber with a baffle to allow separation of oil and water.Tankbottoms or BS&W are pumped into either the open tank for immediateprocessing or into a 300-bbl storage tank for later processing. Mater-ial in the open tank is allowed to set for 24 hours to allow oil and waterto separate. Oil is then pumped off to a tank fitted with an internal heaterand heated to 160°F. The majority of the water is pumped into a linedpit fitted with a sprinkler system for evaporation. In the future, this waterwill be used to irrigate the treatment cells, thus speeding up the biore-mediation process.
Oil from the heated tank is pumped through a heater treater for fur-ther separation. If needed, chemicals are added to assist separation.Separated oil is routed to the sales tank and water to the evaporationpit. To date, about 3,000 bbl of salable oil have been separated, bring-ing revenue that helps defray operational costs. Residual solids areflushed out with water and routed to a sloping cement pit for mixingwith soil, which is then spread in the treatment cells.
Landfarming process. To be degraded, crude oil requires catalysis bymicrobial enzymes and/or environmental modification. Environmentalmodifications can include suitable temperature, moisture, nutrients,pH adjustment, sunlight, oxygen and catalysts that break the hydrocarbonbonds making microbial action easier. In this facility, Patina incorporatessunlight, oxygen, suitable temperature and nutrients.
Soil placement in the cells is limited to depths of 12 to 18 in., sincewith greater depths, mechanical tilling is inadequate and the soil doesnot receive adequate aeration.To accelerate bioremediation, soil is tilledwith a tractor pulling a cultivator twice a week. Initially, Patina tilled the
12 Petroleum Technology Digest September 2000
soil a couple times a month and realized remediated soil (< 1,000 ppm)in nine months to a year. With twice weekly tilling, remediated soil isachieved in less than 90 days.
To preserve temperature during winter months, a road grader windrowsthe soil. Optimum pH range for bioremediation is 6.5 to 9.5; pH of the cellshas ranged from 6.91 to 8.96.To date, Patina has not added moisture. Forbioremediation, optimum moisture content is in the 20–30% range. Nitro-gen and phosphorus nutrients are needed for the bioremediation process.Patina uses turkey manure, which is available locally for transportation costonly. To date, Patina has not had to use a bioremediation catalyst, whichcould reduce treating times to 30–45 days.
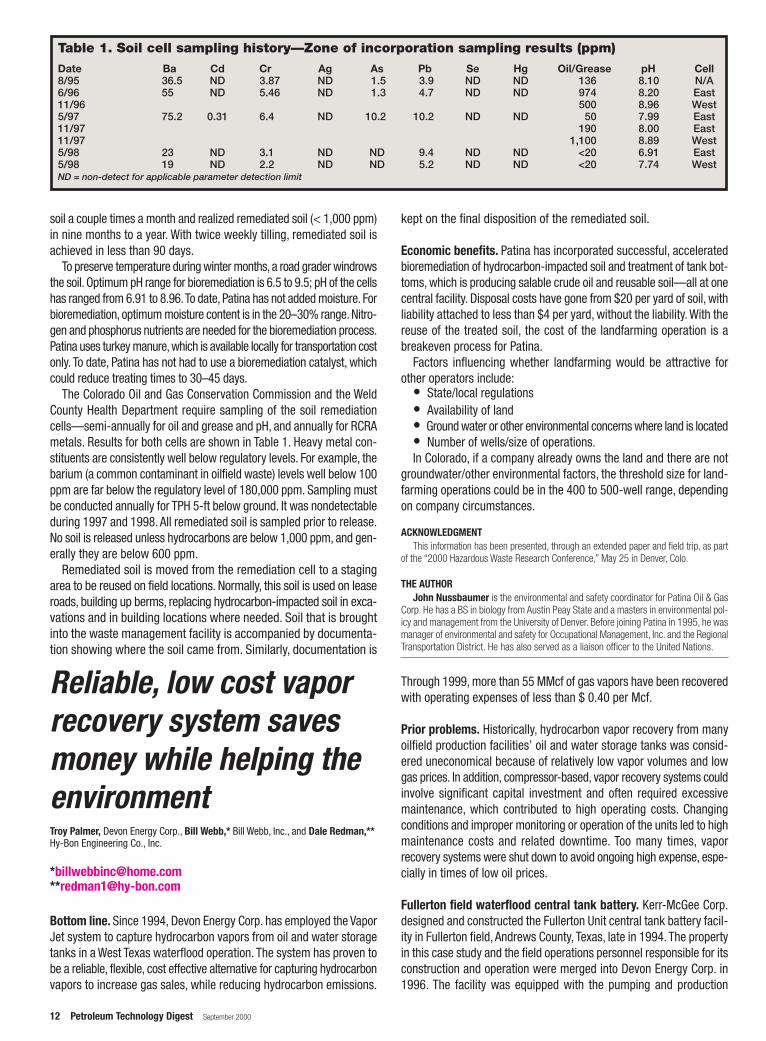
The Colorado Oil and Gas Conservation Commission and the WeldCounty Health Department require sampling of the soil remediationcells—semi-annually for oil and grease and pH, and annually for RCRAmetals. Results for both cells are shown in Table 1. Heavy metal con-stituents are consistently well below regulatory levels. For example, thebarium (a common contaminant in oilfield waste) levels well below 100ppm are far below the regulatory level of 180,000 ppm. Sampling mustbe conducted annually for TPH 5-ft below ground. It was nondetectableduring 1997 and 1998. All remediated soil is sampled prior to release.No soil is released unless hydrocarbons are below 1,000 ppm, and gen-erally they are below 600 ppm.
Remediated soil is moved from the remediation cell to a stagingarea to be reused on field locations. Normally, this soil is used on leaseroads, building up berms, replacing hydrocarbon-impacted soil in exca-vations and in building locations where needed. Soil that is broughtinto the waste management facility is accompanied by documenta-tion showing where the soil came from. Similarly, documentation is
kept on the final disposition of the remediated soil.
Economic benefits. Patina has incorporated successful, acceleratedbioremediation of hydrocarbon-impacted soil and treatment of tank bot-toms, which is producing salable crude oil and reusable soil—all at onecentral facility. Disposal costs have gone from $20 per yard of soil, withliability attached to less than $4 per yard, without the liability. With thereuse of the treated soil, the cost of the landfarming operation is abreakeven process for Patina.
Factors influencing whether landfarming would be attractive forother operators include:
• State/local regulations• Availability of land• Ground water or other environmental concerns where land is located• Number of wells/size of operations.In Colorado, if a company already owns the land and there are not
groundwater/other environmental factors, the threshold size for land-farming operations could be in the 400 to 500-well range, dependingon company circumstances.
ACKNOWLEDGMENTThis information has been presented, through an extended paper and field trip, as part
of the “2000 Hazardous Waste Research Conference,” May 25 in Denver, Colo.
THE AUTHOR John Nussbaumer is the environmental and safety coordinator for Patina Oil & Gas
Corp. He has a BS in biology from Austin Peay State and a masters in environmental pol-icy and management from the University of Denver. Before joining Patina in 1995, he wasmanager of environmental and safety for Occupational Management, Inc. and the RegionalTransportation District. He has also served as a liaison officer to the United Nations.
Table 1. Soil cell sampling history—Zone of incorporation sampling results (ppm)
Date Ba Cd Cr Ag As Pb Se Hg Oil/Grease pH Cell8/95 36.5 ND 3.87 ND 1.5 3.9 ND ND 136 8.10 N/A6/96 55 ND 5.46 ND 1.3 4.7 ND ND 974 8.20 East11/96 500 8.96 West5/97 75.2 0.31 6.4 ND 10.2 10.2 ND ND 50 7.99 East11/97 190 8.00 East11/97 1,100 8.89 West5/98 23 ND 3.1 ND ND 9.4 ND ND <20 6.91 East5/98 19 ND 2.2 ND ND 5.2 ND ND <20 7.74 WestND = non-detect for applicable parameter detection limit
Reliable, low cost vaporrecovery system savesmoney while helping theenvironmentTroy Palmer, Devon Energy Corp., Bill Webb,* Bill Webb, Inc., and Dale Redman,**Hy-Bon Engineering Co., Inc.
*[email protected]**[email protected]
Bottom line. Since 1994, Devon Energy Corp. has employed the VaporJet system to capture hydrocarbon vapors from oil and water storagetanks in a West Texas waterflood operation. The system has proven tobe a reliable, flexible, cost effective alternative for capturing hydrocarbonvapors to increase gas sales, while reducing hydrocarbon emissions.
Through 1999, more than 55 MMcf of gas vapors have been recoveredwith operating expenses of less than $ 0.40 per Mcf.
Prior problems. Historically, hydrocarbon vapor recovery from manyoilfield production facilities’ oil and water storage tanks was consid-ered uneconomical because of relatively low vapor volumes and lowgas prices. In addition, compressor-based, vapor recovery systems couldinvolve significant capital investment and often required excessivemaintenance, which contributed to high operating costs. Changingconditions and improper monitoring or operation of the units led to highmaintenance costs and related downtime. Too many times, vaporrecovery systems were shut down to avoid ongoing high expense, espe-cially in times of low oil prices.
Fullerton field waterflood central tank battery. Kerr-McGee Corp.designed and constructed the Fullerton Unit central tank battery facil-ity in Fullerton field, Andrews County, Texas, late in 1994. The propertyin this case study and the field operations personnel responsible for itsconstruction and operation were merged into Devon Energy Corp. in1996. The facility was equipped with the pumping and production

September 2000 Petroleum Technology Digest 13
equipment necessary to initiate and sustain waterflood operations. Italso was designed to accommodate increased production from aplanned, multi-year infill drilling program.
When designing the central tank battery, Kerr-McGee wanted avapor recovery system that would:
• Be flexible as vapor volumes increased with increasing produc-tion volumes
• Have low operating costs• Have minimal maintenance with its resulting downtime and cost.They selected the patented Vapor Jet vapor recovery system, but
wanted it modified from its normal configuration.
Vapor recovery system. The Vapor Jet system is ideal for facilitieswhere the vapor volumes are on the low end of the range of com-pressor-based vapor recovery systems—sometimes referred to as“environmental units.”
The system uses produced water as the operating medium for a jetpump, Fig. 1. A single-stage, high-head centrifugal pump, driven by anelectrical motor, is used to pressurize the produced water to 200–225psig. The produced water enters the jet pump travelling through a noz-zle, which converts it to a high-velocity stream as it enters the suctionchamber, Fig. 2.
Tank vapors, at near-atmospheric pressure, are piped from thetanks to the suction chamber of the jet pump. The high-velocity waterstream, which has created a vacuum in the suction chamber, entrainsthe vapors. The water stream, with entrained vapors, travels to the dif-fuser section of the jet pump where the kinetic energy of the high veloc-ity stream is converted to potential energy, resulting in a pressure thatis greater than the suction chamber pressure, but significantly less thanthe jet pump entry pressure. The discharge from the jet pump is pipedto the low pressure separation system of the production facility (mustbe less than 40 psig for the jet pump to function with the 225-psig inletpressure). Vapors are separated and sold with other lease gas from thelow-pressure separation system.The produced water used is separatedand returned to the water tanks.
In Kerr McGee’s installation, the operating medium for the jet pumpis fresh water circulated in a closed system, which contains its own sep-arator and water storage tank.The water is continuously circulated, withonly the gas vapors exiting to gas sales.
There are three major system components: pressure controller,centrifugal pump and motor, and jet pump. The pressure controller isthe same type used with compressor-based vapor recovery systems.When pressure in the vapor space of the tanks reaches a predeterminedset point, the pressure controller activates the system by turning on the
centrifugal pump. When sufficient vapor volumes have been removedto reduce the pressure to a predetermined point, the pressure controllerdeactivates the system by turning off the centrifugal pump.
The single-stage centrifugal pump and motor are the only compo-nents having moving parts, and are very durable, even when pumpingproduced water. Although lacking in efficiency, the single-stage cen-trifugal pump’s ability to develop a high head with the producedwater—both reliably and with very little maintenance—more thancompensates for its lower efficiency, when considering the overallcost of vapor recovery.
Jet pump sizing is based on anticipated vapor volumes, and the sizeof the jet pump determines the rate of water to be pumped. Althoughjet pumps will work at different pressures, the vapor jet systems uti-lize an inlet pressure of 200–225 psig. Discharge pressure must be lessthan 40 psig to create the required vacuum in the suction chamber.
The system can be installed for about 75–80% of the cost for com-pressor-based vapor recovery units in sour service and even less forsweet service.The three sizes of jet pumps currently in use, which allowrecovery of up to 77 Mcfd, utilize the same size single-stage centrifu-gal pump. Impeller diameter and size of the motor and motor starterwill vary between applications.This flexibility allows the output of a par-ticular size of installation to be increased with very little additional cap-ital expenditures. Virtually, the only operating expense is the cost of theelectricity to drive the centrifugal pump.
Devon central tank battery installation. At start-up of the facility, 15wells produced about 400 bopd, 300 bwpd and 150 Mcfd total gas.Withthis production volume and facility operating conditions, tank vapor vol-umes were estimated at less than 20 Mcfd, but would be increasingas planned infill drilling proceeded. The Vapor Jet system installed hada single-stage centrifugal pump and motor capable of supplying freshwater to a 21⁄2-in. jet pump at 142-gpm and 200-psig. Under these con-ditions, the system was capable of recovering a maximum of 77 Mcfdof tank vapors when operating continuously.
In 1997, lease production peaked at 1,500 bopd, 1,000 bwpd and230 Mcfd. At this peak production rate, hydrocarbon vapors exceededthe capacity of the 21⁄2-in. jet pump. A second pump and motor, with a2-in. jet pump to operate in tandem with the first, was installed to recoverthe excess vapor volumes. The tandem jet pump, at 200-psig and 82-gpm, would recover up to 45 Mcfd of additional tank vapors.
When vapor volumes began to decline, the tandem pumps operatedin a “lead–lag” mode until vapor volumes were well within the capac-ity of the first larger jet pump. This freed the second pump for use ina stand-by capacity or for use elsewhere. Currently, lease productionis 820 bopd, 850 bwpd and 160 Mcfd from 27 wells, and tank vaporvolumes are well within the capacity of the first 21⁄2-in. jet pump.
From initial installation through 1999, some 55 MMcf of hydrocar-bon tank vapors have been captured and sold. Revenue from this
Fig. 2. Tank vapors enter the suction chamber of the jet pump and a high-velocity waterstream, which has created a vacuum in the suction chamber, entrains the vapors. Thejet pump discharges to the production facility’s low-pressure separation system.
Fig. 1. The Vapor Jet vapor recovery system uses produced water as the operatingmedium for a jet pump to entrain tank vapors and return them to the low-pressureseparation system for separation and sale.
14 Petroleum Technology Digest September 2000
Pilot test demonstrateshow CO2 injectionenhances coalbedmethane recoveryLanny Schoeling,* Kinder Morgan CO2 Co., LP., and Mike McGovern, BurlingtonResources Inc.
Bottom line. Since 1995, Burlington Resources has been conduct-ing a pilot test of enhancing coalbed methane recovery through car-bon dioxide (CO2) injection. The objective of the CO2 injection pilot isto accelerate recovery, displace methane with CO2 and recoverincremental reserves. To date, 4.7 Bcf of CO2 has been injectedwith only limited CO2 breakthrough. Since primary production wasincreasing throughout most of the period due to dewatering, lower-ing of backpressures and well restimulations, reservoir simulation wasan essential tool in analyzing pilot performance. It is estimated thatinjection to date will yield 1.6 Bcf of incremental reserves.
Field history. The Allison pilot is located in the San Juan basin in north-ern New Mexico. The coalseam target at the Allison Unit is the Cre-taceous Fruitland coal formation. Average depth is 3,250 ft, with anaverage net thickness of 35 ft. Initial reservoir pressure was 1,650 psi,
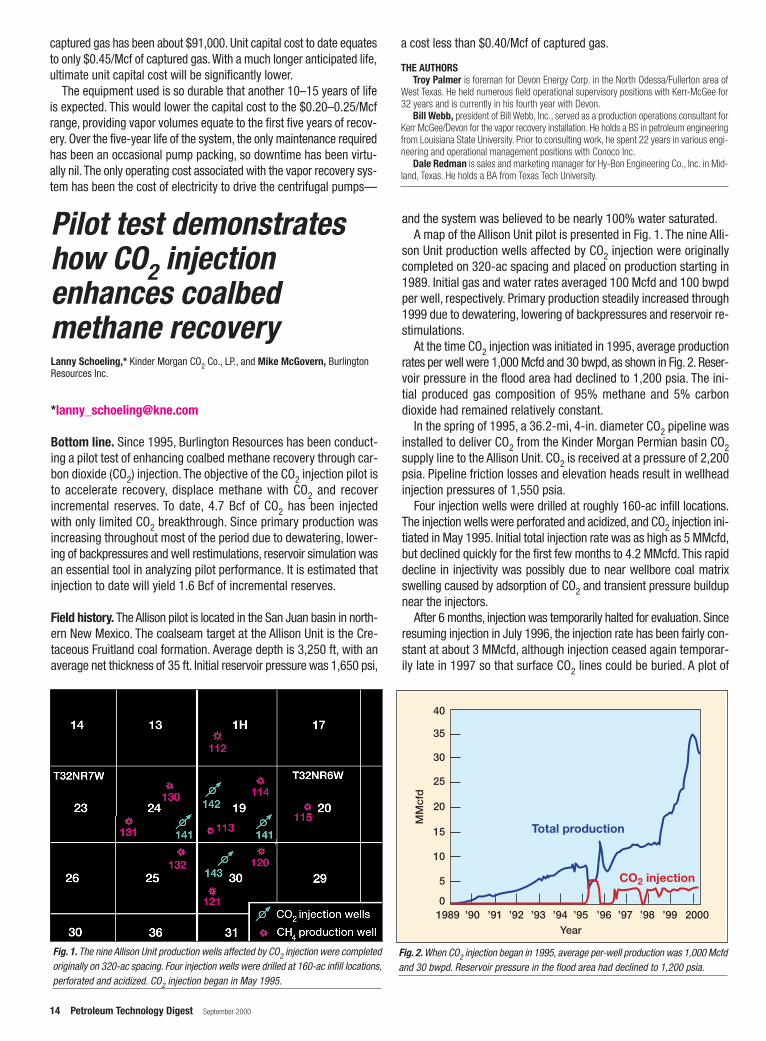
and the system was believed to be nearly 100% water saturated.A map of the Allison Unit pilot is presented in Fig. 1. The nine Alli-
son Unit production wells affected by CO2 injection were originallycompleted on 320-ac spacing and placed on production starting in1989. Initial gas and water rates averaged 100 Mcfd and 100 bwpdper well, respectively. Primary production steadily increased through1999 due to dewatering, lowering of backpressures and reservoir re-stimulations.
At the time CO2 injection was initiated in 1995, average productionrates per well were 1,000 Mcfd and 30 bwpd, as shown in Fig. 2. Reser-voir pressure in the flood area had declined to 1,200 psia. The ini-tial produced gas composition of 95% methane and 5% carbondioxide had remained relatively constant.
In the spring of 1995, a 36.2-mi, 4-in. diameter CO2 pipeline wasinstalled to deliver CO2 from the Kinder Morgan Permian basin CO2supply line to the Allison Unit. CO2 is received at a pressure of 2,200psia. Pipeline friction losses and elevation heads result in wellheadinjection pressures of 1,550 psia.
Four injection wells were drilled at roughly 160-ac infill locations.The injection wells were perforated and acidized, and CO2 injection ini-tiated in May 1995. Initial total injection rate was as high as 5 MMcfd,but declined quickly for the first few months to 4.2 MMcfd. This rapiddecline in injectivity was possibly due to near wellbore coal matrixswelling caused by adsorption of CO2 and transient pressure buildupnear the injectors.
After 6 months, injection was temporarily halted for evaluation. Sinceresuming injection in July 1996, the injection rate has been fairly con-stant at about 3 MMcfd, although injection ceased again temporar-ily late in 1997 so that surface CO2 lines could be buried. A plot of
Fig. 1. The nine Allison Unit production wells affected by CO2 injection were completedoriginally on 320-ac spacing. Four injection wells were drilled at 160-ac infill locations,perforated and acidized. CO2 injection began in May 1995.
captured gas has been about $91,000. Unit capital cost to date equatesto only $0.45/Mcf of captured gas. With a much longer anticipated life,ultimate unit capital cost will be significantly lower.
The equipment used is so durable that another 10–15 years of lifeis expected. This would lower the capital cost to the $0.20–0.25/Mcfrange, providing vapor volumes equate to the first five years of recov-ery. Over the five-year life of the system, the only maintenance requiredhas been an occasional pump packing, so downtime has been virtu-ally nil. The only operating cost associated with the vapor recovery sys-tem has been the cost of electricity to drive the centrifugal pumps—
a cost less than $0.40/Mcf of captured gas.
THE AUTHORSTroy Palmer is foreman for Devon Energy Corp. in the North Odessa/Fullerton area of
West Texas. He held numerous field operational supervisory positions with Kerr-McGee for32 years and is currently in his fourth year with Devon.
Bill Webb, president of Bill Webb, Inc., served as a production operations consultant forKerr McGee/Devon for the vapor recovery installation. He holds a BS in petroleum engineeringfrom Louisiana State University. Prior to consulting work, he spent 22 years in various engi-neering and operational management positions with Conoco Inc.
Dale Redman is sales and marketing manager for Hy-Bon Engineering Co., Inc. in Mid-land, Texas. He holds a BA from Texas Tech University.
30
35
40
25
20
15
10
5
0
MM
cfd
1989 ’90 ’91 ’92 ’93 ’94 ’95 ’96 ’97 ’98 ’99 2000Year
Total production
CO2 injection
Fig. 2. When CO2 injection began in 1995, average per-well production was 1,000 Mcfdand 30 bwpd. Reservoir pressure in the flood area had declined to 1,200 psia.
September 2000 Petroleum Technology Digest 15
production and injection rates is provided in Fig. 2.Five of the production wells were shut in for a 6-mo period at the
start of injection, a step thought to facilitate CO2-methane transferin the reservoir and limit CO2 breakthrough. CO2 breakthrough, a pre-project major concern, has not been a significant problem, occurringonly on a limited basis. CO2-cut in Well 113, the well with the high-est breakthrough, is now 9%, up from 5% prior to CO2 injection.
Reservoir simulation. Quantifying incremental methane productionfrom CO2 injection was difficult due to several factors. The injectedvolume relative to the produced volume is very small (producing 30MMcfd, while only injecting 3.5 MMcfd). Primary production wasincreasing at the start of injection and continued to rise through March2000 due to dewatering, lowering of backpressures and well res-timulations. Since there was not an established decline, reservoir sim-ulation was essential for estimating incremental recovery.
The simulator selected to evaluate the pilot’s incremental perfor-mance is COMET 2—a three-dimensional, two-phase, single, dualor ‘triple’ porosity simulator for modeling gas and water productionfrom coal seams. It has a binary gas sorption feature, which definesthe non-linear relationship between free and adsorbed multi-com-ponent gas mixtures (methane-nitrogen and methane-carbon diox-ide) as a function of methane concentration using extended Lang-muir theory.
The simulator was used to match actual primary and enhanced pro-duction in the Allison Unit and then to estimate the fraction of actual pro-duction attributable to CO2 injection.The following procedure was usedto estimate incremental methane production. First, a history match oftotal performance (including CO2 injection) was completed, driving themodel with actual injection and production rates. Flowing bottomholepressures derived from this history match were used as input to drivea second projection, representing what primary production would havebeen without CO2 injection (assuming the same operating conditions).Subtracting the second case (primary production) from the first case(enhanced production) yields incremental recovery rates.Both cases wereprojected into the future with the same flowing bottomhole pressureassumptions.
The simulation grid size was (18 � 24 � 4). Prior to production,the reservoir was assumed to be 100% water-saturated at an initial
pressure of 1,650 psia. Isotherm curves were taken from lab core stud-ies, and the Langmuir volumes for the methane and CO2 were 33.2and 50.09 Mcf/cf, respectively. Langmuir pressures for methaneand CO2 were 539 and 239 psia, respectively.
Areally, cleat permeability and porosity were estimated from pro-duction data. Once overall material balance calculations matched,the relative permeability was varied to get a reasonable field matchon water production. Individual wells were matched by varyingskin factors on wellbores. Permeability was varied as a function ofreservoir pressure to simulate permeability growth due to matrixshrinkage effects.
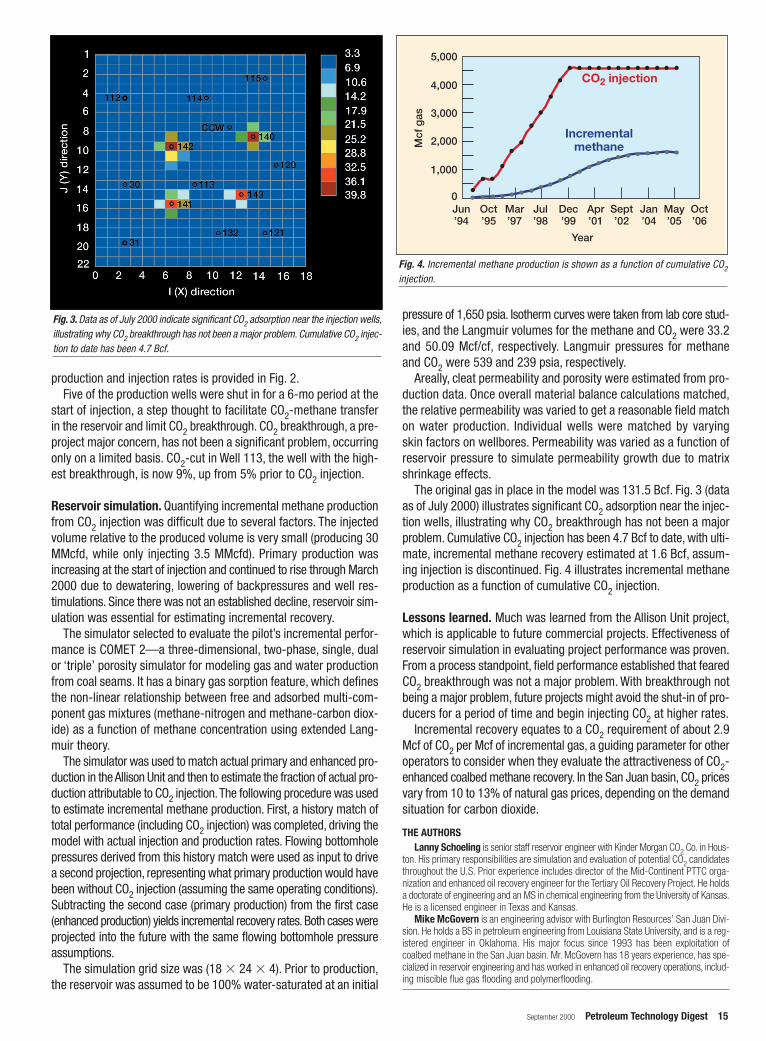
The original gas in place in the model was 131.5 Bcf. Fig. 3 (dataas of July 2000) illustrates significant CO2 adsorption near the injec-tion wells, illustrating why CO2 breakthrough has not been a majorproblem. Cumulative CO2 injection has been 4.7 Bcf to date, with ulti-mate, incremental methane recovery estimated at 1.6 Bcf, assum-ing injection is discontinued. Fig. 4 illustrates incremental methaneproduction as a function of cumulative CO2 injection.
Lessons learned. Much was learned from the Allison Unit project,which is applicable to future commercial projects. Effectiveness ofreservoir simulation in evaluating project performance was proven.From a process standpoint, field performance established that fearedCO2 breakthrough was not a major problem. With breakthrough notbeing a major problem, future projects might avoid the shut-in of pro-ducers for a period of time and begin injecting CO2 at higher rates.
Incremental recovery equates to a CO2 requirement of about 2.9Mcf of CO2 per Mcf of incremental gas, a guiding parameter for otheroperators to consider when they evaluate the attractiveness of CO2-enhanced coalbed methane recovery. In the San Juan basin, CO2 pricesvary from 10 to 13% of natural gas prices, depending on the demandsituation for carbon dioxide.
THE AUTHORSLanny Schoeling is senior staff reservoir engineer with Kinder Morgan CO2 Co. in Hous-
ton. His primary responsibilities are simulation and evaluation of potential CO2 candidatesthroughout the U.S. Prior experience includes director of the Mid-Continent PTTC orga-nization and enhanced oil recovery engineer for the Tertiary Oil Recovery Project. He holdsa doctorate of engineering and an MS in chemical engineering from the University of Kansas.He is a licensed engineer in Texas and Kansas.
Mike McGovern is an engineering advisor with Burlington Resources’ San Juan Divi-sion. He holds a BS in petroleum engineering from Louisiana State University, and is a reg-istered engineer in Oklahoma. His major focus since 1993 has been exploitation ofcoalbed methane in the San Juan basin. Mr. McGovern has 18 years experience, has spe-cialized in reservoir engineering and has worked in enhanced oil recovery operations, includ-ing miscible flue gas flooding and polymerflooding.
Fig. 3. Data as of July 2000 indicate significant CO2 adsorption near the injection wells,illustrating why CO2 breakthrough has not been a major problem. Cumulative CO2 injec-tion to date has been 4.7 Bcf.
3,000
4,000
5,000
2,000
1,000
0
Mcf
gas
Jun’94
Oct’95
Mar’97
Jul’98
Dec’99
Apr’01
Sept’02
Jan’04
May’05
Oct’06
Year
Incrementalmethane
CO2 injection
Fig. 4. Incremental methane production is shown as a function of cumulative CO2
injection.