Embed Size (px)
Citation preview
IJMT Volume 2, Issue 4 ISSN: 2249-1058
__________________________________________________________
A Monthly Double-Blind Peer Reviewed Refereed Open Access International e-Journal - Included in the International Serial Directories Indexed & Listed at: Ulrich's Periodicals Directory ©, U.S.A., Open J-Gage, India as well as in Cabell’s Directories of Publishing Opportunities, U.S.A.
International Journal of Marketing and Technology http://www.ijmra.us
20
April
2012
AN ASSESSMENT - ASSET AND LIABILITY
MANAGEMENT OF SCHEDULED COMMERCIAL BANKS
IN INDIA
Dr.N.Kavitha*
__________________________________________________________
EXECUTIVE SUMMARY:
This paper examines management of asset-liability in banking sector. The main objective of the
study is to present the optimal mix of asset and liability of Scheduled Commercial Banks in
India. The paper mainly discusses on the SBI Group, Nationalised Banks Group and Private
Banks Group selected as the parameter. The increase in the profitability of a bank is always
preceded by the composition of assets and liability. Hence, the following ratios are calculated to
identify the optimal mix of asset and liabilities in relation to profitability, ratio analysis was used
on the sample of 56 banks comprising SBI and its Associate Banks 8, Nationalized Banks group
19 and Private Banks group 29 for the ten years period. The findings suggest that SBI and its
associate bank group were better performers as compared to Private Banks group and
Nationalized banks group.
Key Words: Management, Optimal mix, Commercial Bank, Asset and Liability and Profitability
* Assistant Professor, Department of Management,College of Business and Economics, Mekelle
University, Ethiopia.

IJMT Volume 2, Issue 4 ISSN: 2249-1058
__________________________________________________________
A Monthly Double-Blind Peer Reviewed Refereed Open Access International e-Journal - Included in the International Serial Directories Indexed & Listed at: Ulrich's Periodicals Directory ©, U.S.A., Open J-Gage, India as well as in Cabell’s Directories of Publishing Opportunities, U.S.A.
International Journal of Marketing and Technology http://www.ijmra.us
21
April
2012
INTRODUCTION:
Commercial banks play an important role in the development of a country. A sound, progressive
and dynamic banking system is a fundamental requirement for economic development. As an
important segment of the tertiary sector of an economy, commercial banks act as the backbone of
economic growth and prosperity by acting as a catalyst in the process of development. They
inculcate the habit of saving and mobilize funds from numerous small households and business
firms spread over a wide geographical area. The funds so mobilized are used for productive
purposes in agriculture, industry and trade.
REVIEW OF LITERATURE:
Kanjana.E.N (2007), “Efficiency, Profitability and Growth of Scheduled Commercial Banks in
India” tested (1) whether the establishment expense was a major expense, and (2) out of total
expense which is met by scheduled commercial banks is more due to more number of
employees. In her empirical study, the earning factor and expense factor which are controllable
and non-controllable by the bank.
Ashok Kumar.M (2009) in his study examines how the financial performance of SBI group,
Nationalized banks group, private banks group and foreign banks group has been affected by the
financial deregulation of the economy. The main objective of the empirical study is to assess the
financial performance of Scheduled Commercial Banks through CRAMEL Analysis.
OBJECTIVES OF THE STUDY:
i) To identify the optimal mix of assets and liabilities for the profitability of banks.
ii) To offer suitable suggestions to strengthen the funds position of commercial
banks.
IJMT Volume 2, Issue 4 ISSN: 2249-1058
__________________________________________________________
A Monthly Double-Blind Peer Reviewed Refereed Open Access International e-Journal - Included in the International Serial Directories Indexed & Listed at: Ulrich's Periodicals Directory ©, U.S.A., Open J-Gage, India as well as in Cabell’s Directories of Publishing Opportunities, U.S.A.
International Journal of Marketing and Technology http://www.ijmra.us
22
April
2012
PERIOD OF THE STUDY:
The study period is for ten financial years i.e., the period from 2000-2001 to 2009-2010. The
financial year starts from 1st April of a year and ends on 31
st March of next year.
SCOPE OF THE STUDY:
The scope of the study is wider in nature. It covers all the Indian scheduled commercial banks in
India, which are under the control of the Reserve Bank of India.
CONCEPTS AND DEFINITIONS:
Asset-Liability Management
ALM technique aims to manage the volume, mix, maturity, rate sensitivity, quality and liquidity
of the assets and liabilities as a whole so as to attain a predetermined acceptable risk-reward
ratio.
Profitability
The word profitability is composed of two words „Profit” and “Ability”. “Ability” refers to the
earning capacity or power of an enterprise to earn the profit. So, Profitability may be defined as
the ability of a given investment to earn a return from its use. Profitability of a concern indicates
the financial stability and the greater the possibility of profit-earning the easier it is to attract
capital investment. The height of profitability depends on the ability of the management to deal
intelligently and effectively to tide over risks and uncertainties through shifting them or hedging
benefits, risks involved, policy decision etc.
METHODOLOGY:
The study is based on Census Method. For the purpose of conducting the study, all the
scheduled commercial banks functioning as on 31st March 2007 with the age of minimum of 10
IJMT Volume 2, Issue 4 ISSN: 2249-1058
__________________________________________________________
A Monthly Double-Blind Peer Reviewed Refereed Open Access International e-Journal - Included in the International Serial Directories Indexed & Listed at: Ulrich's Periodicals Directory ©, U.S.A., Open J-Gage, India as well as in Cabell’s Directories of Publishing Opportunities, U.S.A.
International Journal of Marketing and Technology http://www.ijmra.us
23
April
2012
years period were selected and grouped into SBI and its Associate banks, Nationalized Banks
Groups and Private Sector Banks Group. Based on the criterion the researcher has selected 56
banks.
DATA COLLECTION:
The study is based on secondary information, and all the relevant information is collected from
various issues of Statistical Tables Relating to Banks, Report on Currency and Finance published
by the Reserve Bank of India, and Database on Indian Banking published by Indian Banking
Association. In addition to that some information was also collected from different issues of
Economic Survey published by the Government of India and certain important books and
journals.
EMPIRICAL RESULTS:
The increase in the profitability of a bank is always preceded by the composition of assets and
liability. Hence, the following ratios are calculated to identify the optimal mix of banks in
relation to profitability. Debt Equity Ratio, Capital Adequacy Ratio, Ratio of Term Deposits to
Total Deposits, Ratio of Liquid Assets to Assets, Ratio of Provisions and Contingencies to Total
Assets, Cash Deposits Ratio, Ratio of other Assets to Assets, Credit Deposit Ratio, Ratio of
Fixed Assets to Assets, Ratio of Priority Sector Advances to Advances and Ratio of Borrowings
to Total Assets
1. Debt Equity Eatio
Table 1 depicts the Debt Equity Ratio was more consistent in terms of dispersion for Private
Banks group (C.V. 14.50 per cent) followed by Nationalized group (C.V. 8.12 per cent) and less
consistent for SBI group (C.V. 7.18 per cent). An insight into the SBI group reveals that this
ratio fluctuated between 15.16 per cent in 2000-2001 and 15.34 per cent in 2009-2010. The
average of this ratio for this group during the study period stood at 16.69 per cent, the least
IJMT Volume 2, Issue 4 ISSN: 2249-1058
__________________________________________________________
A Monthly Double-Blind Peer Reviewed Refereed Open Access International e-Journal - Included in the International Serial Directories Indexed & Listed at: Ulrich's Periodicals Directory ©, U.S.A., Open J-Gage, India as well as in Cabell’s Directories of Publishing Opportunities, U.S.A.
International Journal of Marketing and Technology http://www.ijmra.us
24
April
2012
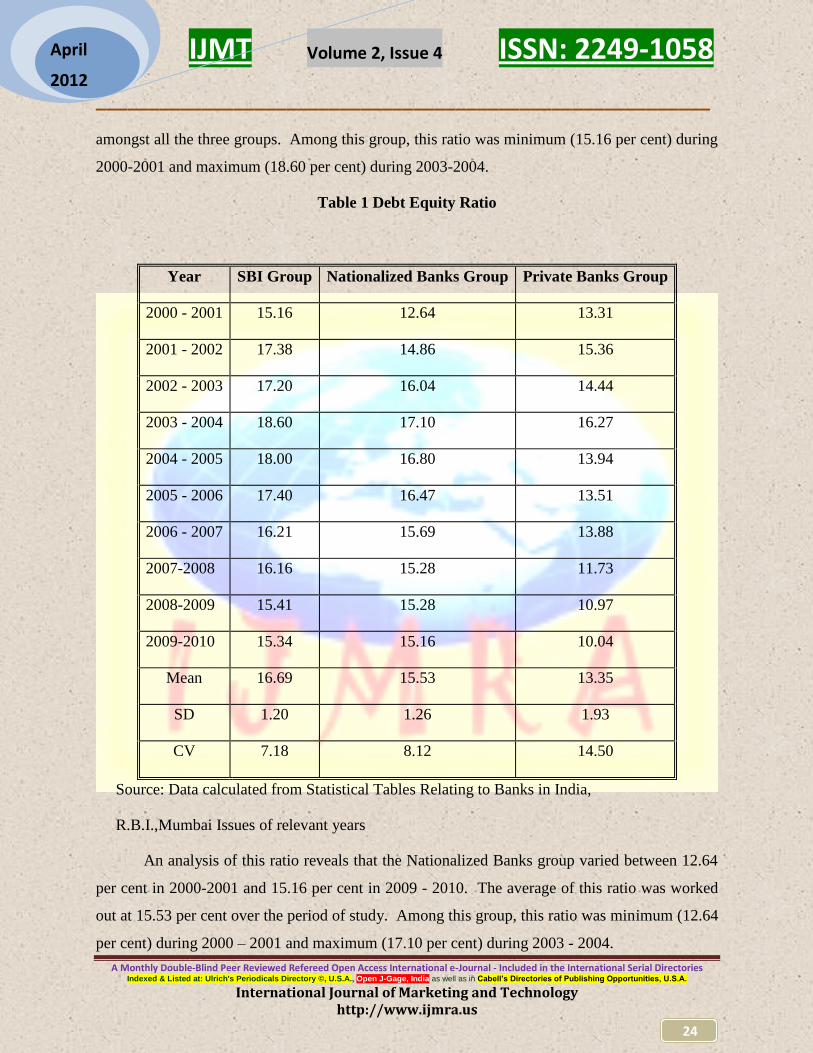
amongst all the three groups. Among this group, this ratio was minimum (15.16 per cent) during
2000-2001 and maximum (18.60 per cent) during 2003-2004.
Table 1 Debt Equity Ratio
Year SBI Group Nationalized Banks Group Private Banks Group
2000 - 2001 15.16 12.64 13.31
2001 - 2002 17.38 14.86 15.36
2002 - 2003 17.20 16.04 14.44
2003 - 2004 18.60 17.10 16.27
2004 - 2005 18.00 16.80 13.94
2005 - 2006 17.40 16.47 13.51
2006 - 2007 16.21 15.69 13.88
2007-2008 16.16 15.28 11.73
2008-2009 15.41 15.28 10.97
2009-2010 15.34 15.16 10.04
Mean 16.69 15.53 13.35
SD 1.20 1.26 1.93
CV 7.18 8.12 14.50
Source: Data calculated from Statistical Tables Relating to Banks in India,
R.B.I.,Mumbai Issues of relevant years
An analysis of this ratio reveals that the Nationalized Banks group varied between 12.64
per cent in 2000-2001 and 15.16 per cent in 2009 - 2010. The average of this ratio was worked
out at 15.53 per cent over the period of study. Among this group, this ratio was minimum (12.64
per cent) during 2000 – 2001 and maximum (17.10 per cent) during 2003 - 2004.

IJMT Volume 2, Issue 4 ISSN: 2249-1058
__________________________________________________________
A Monthly Double-Blind Peer Reviewed Refereed Open Access International e-Journal - Included in the International Serial Directories Indexed & Listed at: Ulrich's Periodicals Directory ©, U.S.A., Open J-Gage, India as well as in Cabell’s Directories of Publishing Opportunities, U.S.A.
International Journal of Marketing and Technology http://www.ijmra.us
25
April
2012
The Private Banks group witnessed an average ratio of 13.35 per cent over the study
period. This ratio varied between 13.31 per cent in 2000 - 2001and 10.04 per cent in 2009 -
2010. Among this group, this ratio was minimum (10.04per cent) during 2009-2010 and
maximum (16.27 per cent) during 2003 - 2004.
Thus, it can be inferred that SBI group, Private Banks group and Nationalised Banks
group in that order have Government securities to assets during the period under study. The
higher profitability is achieved at the optimal level of debt equity ratio for Private banks group
13.88, Nationalised Banks group 15.69 and SBI group 15.16 during the period of study.
2. Capital Adequacy Ratio
Table 2 depicts the Capital Adequacy Ratio was more consistent in terms of dispersion
for Private Banks group (C.V. 12.87 per cent) followed by Nationalized group (C.V. 15.06 per
cent) and less consistent for SBI group (C.V. 19.50 per cent)
An insight into the SBI group reveals that this ratio fluctuated between 12.55 per cent in
2000-2001 and 12.23 per cent in 2009-2010. The average of this ratio for this group during the
study period stood at 12.45 per cent, the least amongst all the three groups. Among this group,
this ratio was minimum (11.89 per cent) during 2001 – 2002 and maximum (13.13 per cent)
during 2006 - 2007.
An analysis of this ratio reveals that the Nationalized Banks group varied in between
10.53 per cent in 2000-2001 and 12.20 per cent in 2009-2010. The average of this ratio was
worked out at 11.71 per cent over the period of study. Among this group, this ratio was
minimum (10.31 per cent) during 2004-2005 and maximum (13.18 per cent) during 2006 – 2007.
Table 2 Capital Adequacy Ratio
Year SBI Group Nationalized Banks Group Private Banks Group
2000 - 2001 12.55 10.53 12.84
2001 - 2002 11.89 11.01 12.70
IJMT Volume 2, Issue 4 ISSN: 2249-1058
__________________________________________________________
A Monthly Double-Blind Peer Reviewed Refereed Open Access International e-Journal - Included in the International Serial Directories Indexed & Listed at: Ulrich's Periodicals Directory ©, U.S.A., Open J-Gage, India as well as in Cabell’s Directories of Publishing Opportunities, U.S.A.
International Journal of Marketing and Technology http://www.ijmra.us
26
April
2012
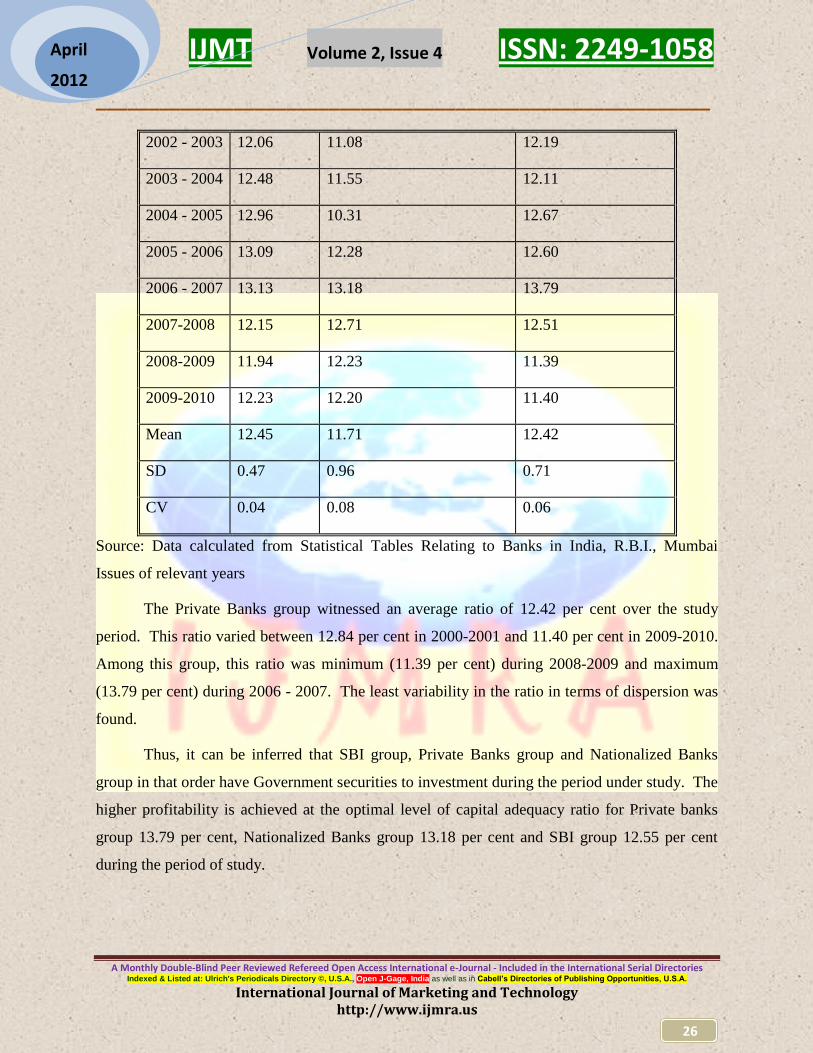
2002 - 2003 12.06 11.08 12.19
2003 - 2004 12.48 11.55 12.11
2004 - 2005 12.96 10.31 12.67
2005 - 2006 13.09 12.28 12.60
2006 - 2007 13.13 13.18 13.79
2007-2008 12.15 12.71 12.51
2008-2009 11.94 12.23 11.39
2009-2010 12.23 12.20 11.40
Mean 12.45 11.71 12.42
SD 0.47 0.96 0.71
CV 0.04 0.08 0.06
Source: Data calculated from Statistical Tables Relating to Banks in India, R.B.I., Mumbai
Issues of relevant years
The Private Banks group witnessed an average ratio of 12.42 per cent over the study
period. This ratio varied between 12.84 per cent in 2000-2001 and 11.40 per cent in 2009-2010.
Among this group, this ratio was minimum (11.39 per cent) during 2008-2009 and maximum
(13.79 per cent) during 2006 - 2007. The least variability in the ratio in terms of dispersion was
found.
Thus, it can be inferred that SBI group, Private Banks group and Nationalized Banks
group in that order have Government securities to investment during the period under study. The
higher profitability is achieved at the optimal level of capital adequacy ratio for Private banks
group 13.79 per cent, Nationalized Banks group 13.18 per cent and SBI group 12.55 per cent
during the period of study.

IJMT Volume 2, Issue 4 ISSN: 2249-1058
__________________________________________________________
A Monthly Double-Blind Peer Reviewed Refereed Open Access International e-Journal - Included in the International Serial Directories Indexed & Listed at: Ulrich's Periodicals Directory ©, U.S.A., Open J-Gage, India as well as in Cabell’s Directories of Publishing Opportunities, U.S.A.
International Journal of Marketing and Technology http://www.ijmra.us
27
April
2012
3. Ratio of Term Deposits to Total Deposits
Table 3 depicts the Ratio of Term Deposits to Total Deposits was more consistent in
terms of dispersion for Private Banks group (C.V. 14.28 per cent) followed by Nationalized
group (C.V. 14.64 per cent) and less consistent for SBI group (C.V. 64.09 per cent)
An insight into the SBI group reveals that this ratio fluctuated between 49.86 per cent in
2000-2001 and 43.82 per cent in 2009 - 2010. The average of this ratio for this group during the
study period stood at 28.93 per cent, the least amongst all the three groups. Among this group,
this ratio was minimum (5.67 per cent) during 2004 - 2005 and maximum (49.86 per cent) during
2000- 2001.
An analysis of this ratio reveals that the Nationalized Banks group varied between 16.77
per cent in 2000-2001 and 11.79 per cent in 2009 - 2010. The average of this ratio was worked
out at 16.82 per cent over the period of study. Among this group, this ratio was minimum (11.79
per cent) during 2009-2010 and maximum (20.01 per cent) during 2006 - 2007.
Table 3 Ratio of Term Deposits to Total Deposits
Year SBI Group Nationalized Group Private Banks Group
2000 - 2001 49.86 16.77 18.25
2001 - 2002 8.64 17.05 18.40
2002 - 2003 13.92 19.14 19.32
2003 - 2004 22.35 18.74 15.33
2004 - 2005 5.67 17.91 14.40
2005 - 2006 9.33 16.98 12.61
2006 - 2007 48.21 20.01 13.26
2007-2008 46.71 15.65 15.74

IJMT Volume 2, Issue 4 ISSN: 2249-1058
__________________________________________________________
A Monthly Double-Blind Peer Reviewed Refereed Open Access International e-Journal - Included in the International Serial Directories Indexed & Listed at: Ulrich's Periodicals Directory ©, U.S.A., Open J-Gage, India as well as in Cabell’s Directories of Publishing Opportunities, U.S.A.
International Journal of Marketing and Technology http://www.ijmra.us
28
April
2012
2008-2009 40.84 14.11 14.52
2009-2010 43.82 11.79 16.02
Mean 28.93 16.82 15.79
SD 18.54 2.46 2.25
CV 64.09 14.64 14.28
Source: Data calculated from Statistical Tables Relating to Banks in India, R.B.I., Mumbai
Issues of relevant years
The Private Banks group witnessed an average ratio of 15.79 per cent over the study period.
This ratio varied between 18.25 per cent in 2000 - 2001 and 16.02 per cent in 2009 - 2010.
Among this group, this ratio was minimum (12.61per cent) during 2005-2006 and maximum
(19.32 per cent) during 2002-2003.
Thus, it can be inferred that SBI group, Private Banks group and Nationalised Banks
group in that order have Approved Securities to Total Assets during the period under study. The
higher profitability is achieved at the optimal level of the ratio of term deposits to total deposits
for Private banks group 13.26 per cent, Nationalised Banks group 20.01 per cent and SBI group
49.86 per cent during the period of study.
4. Ratio of Liquid Assets to Assets
Table 4 depicts the Ratio of Liquid Assets to Assets was more consistent in terms of
dispersion for Private Banks group (C.V. 29.87 per cent) followed by Nationalized group (C.V.
12.78 per cent) and less consistent for SBI group (C.V. 28.01 per cent)
An insight into the SBI group reveals that this ratio fluctuated between 9.24 per cent in
2000-2001 and 5.16 per cent in 2009 - 2010. The average of this ratio for this group during the
study period stood at 6.66 per cent, the least amongst all the three groups. Among this group,
IJMT Volume 2, Issue 4 ISSN: 2249-1058
__________________________________________________________
A Monthly Double-Blind Peer Reviewed Refereed Open Access International e-Journal - Included in the International Serial Directories Indexed & Listed at: Ulrich's Periodicals Directory ©, U.S.A., Open J-Gage, India as well as in Cabell’s Directories of Publishing Opportunities, U.S.A.
International Journal of Marketing and Technology http://www.ijmra.us
29
April
2012
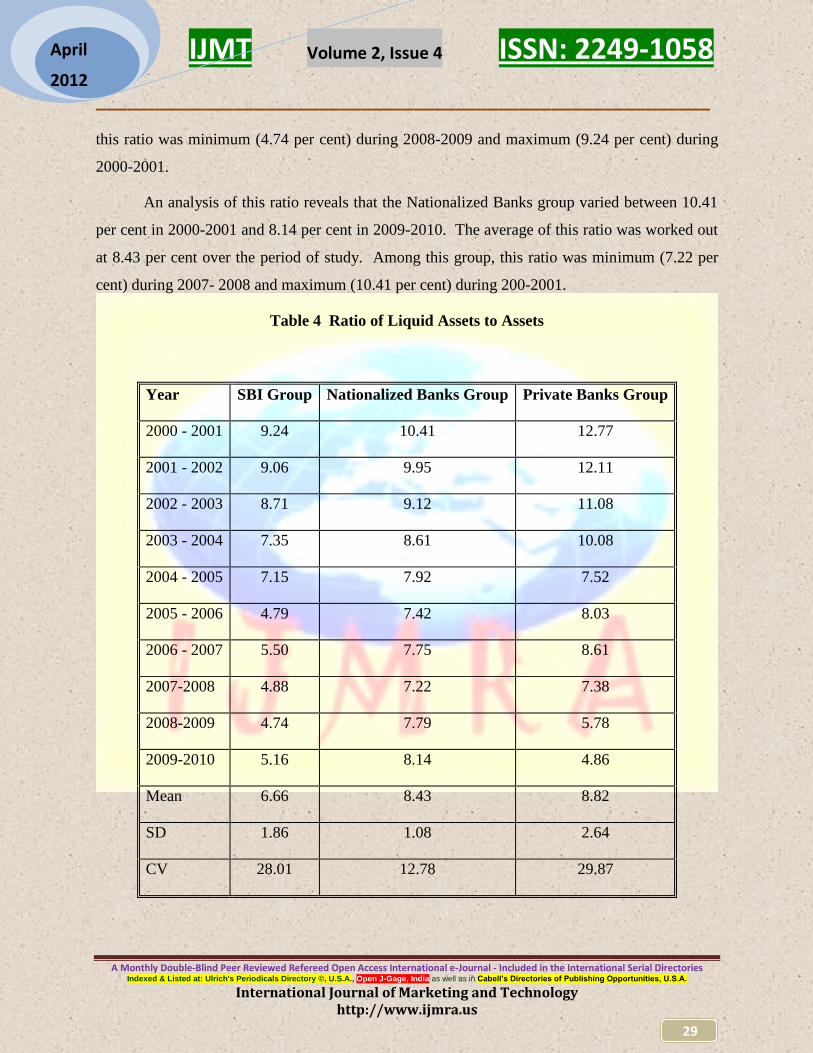
this ratio was minimum (4.74 per cent) during 2008-2009 and maximum (9.24 per cent) during
2000-2001.
An analysis of this ratio reveals that the Nationalized Banks group varied between 10.41
per cent in 2000-2001 and 8.14 per cent in 2009-2010. The average of this ratio was worked out
at 8.43 per cent over the period of study. Among this group, this ratio was minimum (7.22 per
cent) during 2007- 2008 and maximum (10.41 per cent) during 200-2001.
Table 4 Ratio of Liquid Assets to Assets
Year SBI Group Nationalized Banks Group Private Banks Group
2000 - 2001 9.24 10.41 12.77
2001 - 2002 9.06 9.95 12.11
2002 - 2003 8.71 9.12 11.08
2003 - 2004 7.35 8.61 10.08
2004 - 2005 7.15 7.92 7.52
2005 - 2006 4.79 7.42 8.03
2006 - 2007 5.50 7.75 8.61
2007-2008 4.88 7.22 7.38
2008-2009 4.74 7.79 5.78
2009-2010 5.16 8.14 4.86
Mean 6.66 8.43 8.82
SD 1.86 1.08 2.64
CV 28.01 12.78 29.87
IJMT Volume 2, Issue 4 ISSN: 2249-1058
__________________________________________________________
A Monthly Double-Blind Peer Reviewed Refereed Open Access International e-Journal - Included in the International Serial Directories Indexed & Listed at: Ulrich's Periodicals Directory ©, U.S.A., Open J-Gage, India as well as in Cabell’s Directories of Publishing Opportunities, U.S.A.
International Journal of Marketing and Technology http://www.ijmra.us
30
April
2012
Source: Data calculated from Statistical Tables Relating to Banks in India, R.B.I., Mumbai
Issues of relevant years
The Private Banks group witnessed an average ratio of 8.82 per cent over the study
period. This ratio varied between 12.77 per cent in 2000 - 2001 and 4.86 per cent in 2009 -2010.
Among this group, this ratio was minimum (4.86 per cent) during 2009-2010 and maximum
(12.77 per cent) during 2000 - 2001.
Thus, it can be inferred that SBI group, Private Banks group and Nationalised Banks
group in that order have Ratio of Liquid Assets to Assets during the period under study. The
higher profitability is achieved at the optimal level of the ratio of liquid assets to assets for
Private banks group 8.61 per cent, Nationalised Banks group 7.75 per cent and SBI group 9.24
per cent during the period of study.
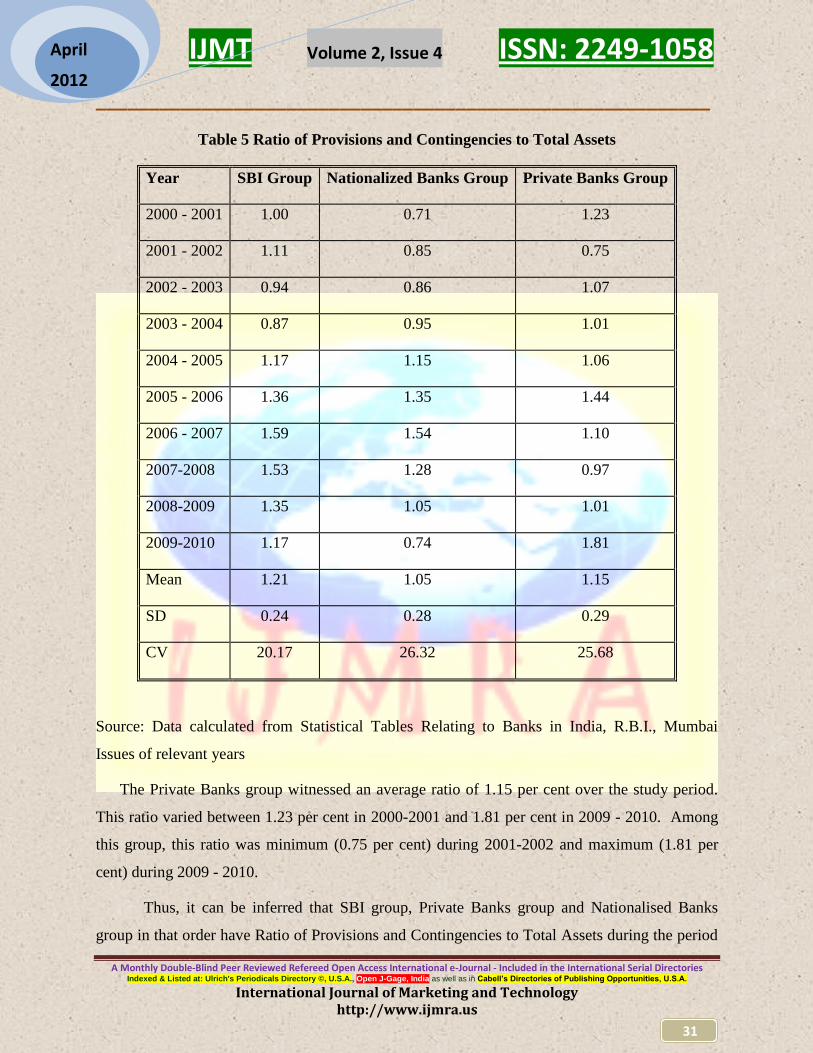
5. Ratio of Provisions and Contingencies to Total Assets
Table 5 depicts the ratio of Provisions and Contingencies to Total Assets was more
consistent in terms of dispersion for Private Banks group (C.V. 17.50 per cent) followed by
Nationalized group (C.V. 26.32 per cent) and less consistent for SBI group (C.V. 20.17 per cent)
An insight into the SBI group reveals that this ratio fluctuated between 1 per cent in 2000-
2001 and 1.17 per cent in 2009-2010. The average of this ratio for this group during the study
period stood at 1.21 per cent, the least amongst all the three groups. Among this group, this ratio
was minimum (0.87 per cent) during 2003 – 2004 and maximum (1.59 per cent) during 2006 -
2007.
An analysis of this ratio reveals that the Nationalized Banks group varied between 0.71 per
cent in 2000-2001 and 0.74 per cent in 2009 - 2010. The average of this ratio was worked out at
1.05 per cent over the period of study. Among this group, this ratio was minimum (0.71 per
cent) during 2000-2001 and maximum (1.54 per cent) during 2006 - 2007.
IJMT Volume 2, Issue 4 ISSN: 2249-1058
__________________________________________________________
A Monthly Double-Blind Peer Reviewed Refereed Open Access International e-Journal - Included in the International Serial Directories Indexed & Listed at: Ulrich's Periodicals Directory ©, U.S.A., Open J-Gage, India as well as in Cabell’s Directories of Publishing Opportunities, U.S.A.
International Journal of Marketing and Technology http://www.ijmra.us
31
April
2012
Table 5 Ratio of Provisions and Contingencies to Total Assets
Year SBI Group Nationalized Banks Group Private Banks Group
2000 - 2001 1.00 0.71 1.23
2001 - 2002 1.11 0.85 0.75
2002 - 2003 0.94 0.86 1.07
2003 - 2004 0.87 0.95 1.01
2004 - 2005 1.17 1.15 1.06
2005 - 2006 1.36 1.35 1.44
2006 - 2007 1.59 1.54 1.10
2007-2008 1.53 1.28 0.97
2008-2009 1.35 1.05 1.01
2009-2010 1.17 0.74 1.81
Mean 1.21 1.05 1.15
SD 0.24 0.28 0.29
CV 20.17 26.32 25.68
Source: Data calculated from Statistical Tables Relating to Banks in India, R.B.I., Mumbai
Issues of relevant years
The Private Banks group witnessed an average ratio of 1.15 per cent over the study period.
This ratio varied between 1.23 per cent in 2000-2001 and 1.81 per cent in 2009 - 2010. Among
this group, this ratio was minimum (0.75 per cent) during 2001-2002 and maximum (1.81 per
cent) during 2009 - 2010.
Thus, it can be inferred that SBI group, Private Banks group and Nationalised Banks
group in that order have Ratio of Provisions and Contingencies to Total Assets during the period

IJMT Volume 2, Issue 4 ISSN: 2249-1058
__________________________________________________________
A Monthly Double-Blind Peer Reviewed Refereed Open Access International e-Journal - Included in the International Serial Directories Indexed & Listed at: Ulrich's Periodicals Directory ©, U.S.A., Open J-Gage, India as well as in Cabell’s Directories of Publishing Opportunities, U.S.A.
International Journal of Marketing and Technology http://www.ijmra.us
32
April
2012
under study. The higher profitability is achieved at the optimal level of the ratio of provisions
and contingencies to total assets for Private banks group 1.10 per cent, Nationalised Banks group
1.54 per cent and SBI group 1.00 per cent during the period of study.
6. Cash Deposits Ratio
Table 6 depicts the Cash Deposits Ratio was more consistent in terms of dispersion for
Private Banks group (C.V. 12.87 per cent) followed by Nationalized group (C.V. 15.06 per cent)
and less consistent for SBI group (C.V. 19.50 per cent)
An insight into the SBI group reveals that this ratio fluctuated between 12.39 per cent in
2000-2001 and 6.63 per cent in 2009-2010. The average of this ratio for this group during the
study period stood at 8.60 per cent, the least amongst all the three groups. Among this group,
this ratio was minimum (6.05 per cent) during 2007 – 2008 and maximum (12.39 per cent)
during 2000-2001.
An analysis of this ratio reveals that the Nationalized Banks group varied between 12.10
per cent in 2000-2001 and 9.61 per cent in 2009-2010. The average of this ratio was worked out
at 9.77 per cent over the period of study. Among this group, this ratio was minimum (8.40 per
cent) during 2007-2008 and maximum (12.10 per cent) during 2000-2001.
Table 6 Cash Deposits Ratio
Year SBI Group Nationalized Banks Group Private Banks Group
2000 - 2001 12.39 12.10 14.90
2001 - 2002 11.81 11.54 14.55
2002 - 2003 11.43 10.51 13.33
2003 - 2004 9.48 9.87 12.07

IJMT Volume 2, Issue 4 ISSN: 2249-1058
__________________________________________________________
A Monthly Double-Blind Peer Reviewed Refereed Open Access International e-Journal - Included in the International Serial Directories Indexed & Listed at: Ulrich's Periodicals Directory ©, U.S.A., Open J-Gage, India as well as in Cabell’s Directories of Publishing Opportunities, U.S.A.
International Journal of Marketing and Technology http://www.ijmra.us
33
April
2012
2004 - 2005 9.15 9.05 11.91
2005 - 2006 6.05 8.53 11.46
2006 - 2007 6.98 9.00 11.79
2007-2008 6.05 8.40 10.03
2008-2009 6.05 9.12 7.70
2009-2010 6.63 9.61 6.12
Mean 8.60 9.77 11.39
SD 2.58 1.25 2.79
CV 29.97 12.82 24.53
Source: Data calculated from Statistical Tables Relating to Banks in India, R.B.I., Mumbai
Issues of relevant years
The Private Banks group witnessed an average ratio of 11.39 per cent over the study
period. This ratio varied between 14.90 per cent in 2000-2001 and 6.12 per cent in 2009 - 2010.
Among this group, this ratio was minimum (6.12 per cent) during 2009-2010 and maximum
(14.90 per cent) during 2000-2001.
Thus, it can be inferred that SBI group, Private Banks group and Nationalized Banks
group in that order have Ratio of Cash Deposits Ratio during the period under study. The higher
profitability is achieved at the optimal level of the ratio of cash to deposits for Private banks
group 11.79 per cent, Nationalized Banks group 9.00 per cent and SBI group 12.39 per cent
during the period of study.
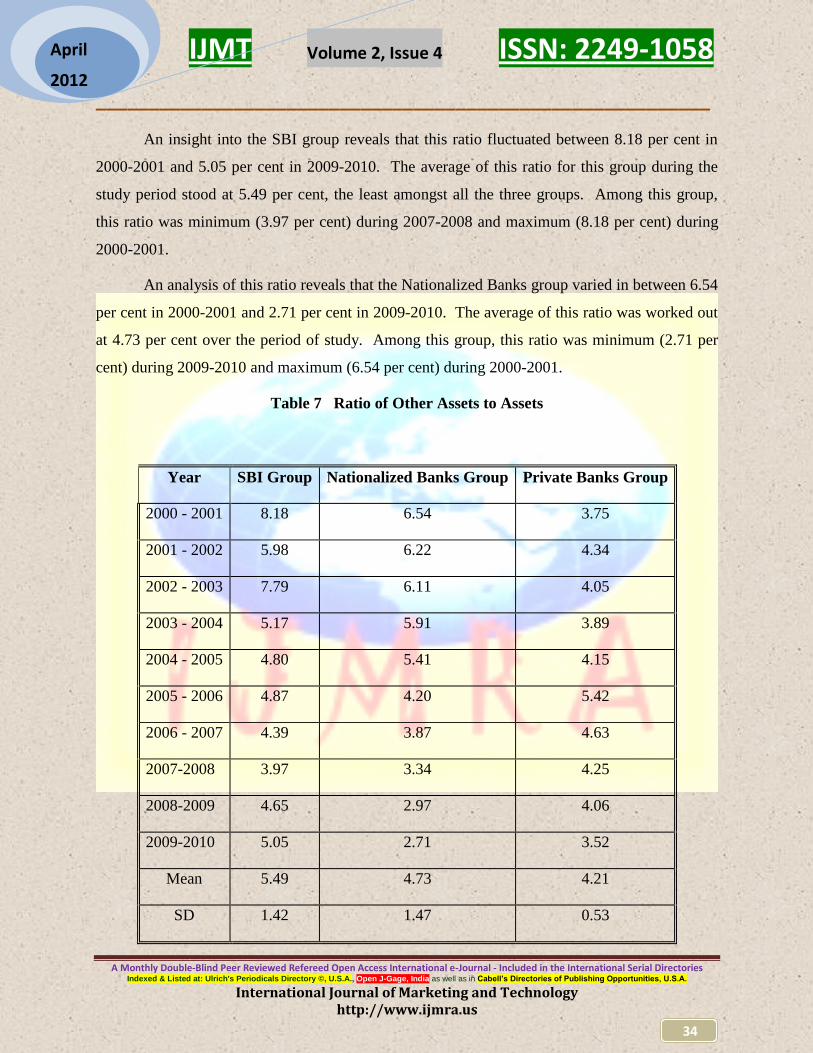
7. Ratio of Other Assets to Assets
Table 7 depicts the ratio of other assets to assets was more consistent in terms of
dispersion for Private Banks group (C.V. 12.54 per cent) followed by Nationalized group (C.V.
31.05 per cent) and less consistent for SBI group (C.V. 25.90 per cent)
IJMT Volume 2, Issue 4 ISSN: 2249-1058
__________________________________________________________
A Monthly Double-Blind Peer Reviewed Refereed Open Access International e-Journal - Included in the International Serial Directories Indexed & Listed at: Ulrich's Periodicals Directory ©, U.S.A., Open J-Gage, India as well as in Cabell’s Directories of Publishing Opportunities, U.S.A.
International Journal of Marketing and Technology http://www.ijmra.us
34
April
2012
An insight into the SBI group reveals that this ratio fluctuated between 8.18 per cent in
2000-2001 and 5.05 per cent in 2009-2010. The average of this ratio for this group during the
study period stood at 5.49 per cent, the least amongst all the three groups. Among this group,
this ratio was minimum (3.97 per cent) during 2007-2008 and maximum (8.18 per cent) during
2000-2001.
An analysis of this ratio reveals that the Nationalized Banks group varied in between 6.54
per cent in 2000-2001 and 2.71 per cent in 2009-2010. The average of this ratio was worked out
at 4.73 per cent over the period of study. Among this group, this ratio was minimum (2.71 per
cent) during 2009-2010 and maximum (6.54 per cent) during 2000-2001.
Table 7 Ratio of Other Assets to Assets
Year SBI Group Nationalized Banks Group Private Banks Group
2000 - 2001 8.18 6.54 3.75
2001 - 2002 5.98 6.22 4.34
2002 - 2003 7.79 6.11 4.05
2003 - 2004 5.17 5.91 3.89
2004 - 2005 4.80 5.41 4.15
2005 - 2006 4.87 4.20 5.42
2006 - 2007 4.39 3.87 4.63
2007-2008 3.97 3.34 4.25
2008-2009 4.65 2.97 4.06
2009-2010 5.05 2.71 3.52
Mean 5.49 4.73 4.21
SD 1.42 1.47 0.53
IJMT Volume 2, Issue 4 ISSN: 2249-1058
__________________________________________________________
A Monthly Double-Blind Peer Reviewed Refereed Open Access International e-Journal - Included in the International Serial Directories Indexed & Listed at: Ulrich's Periodicals Directory ©, U.S.A., Open J-Gage, India as well as in Cabell’s Directories of Publishing Opportunities, U.S.A.
International Journal of Marketing and Technology http://www.ijmra.us
35
April
2012
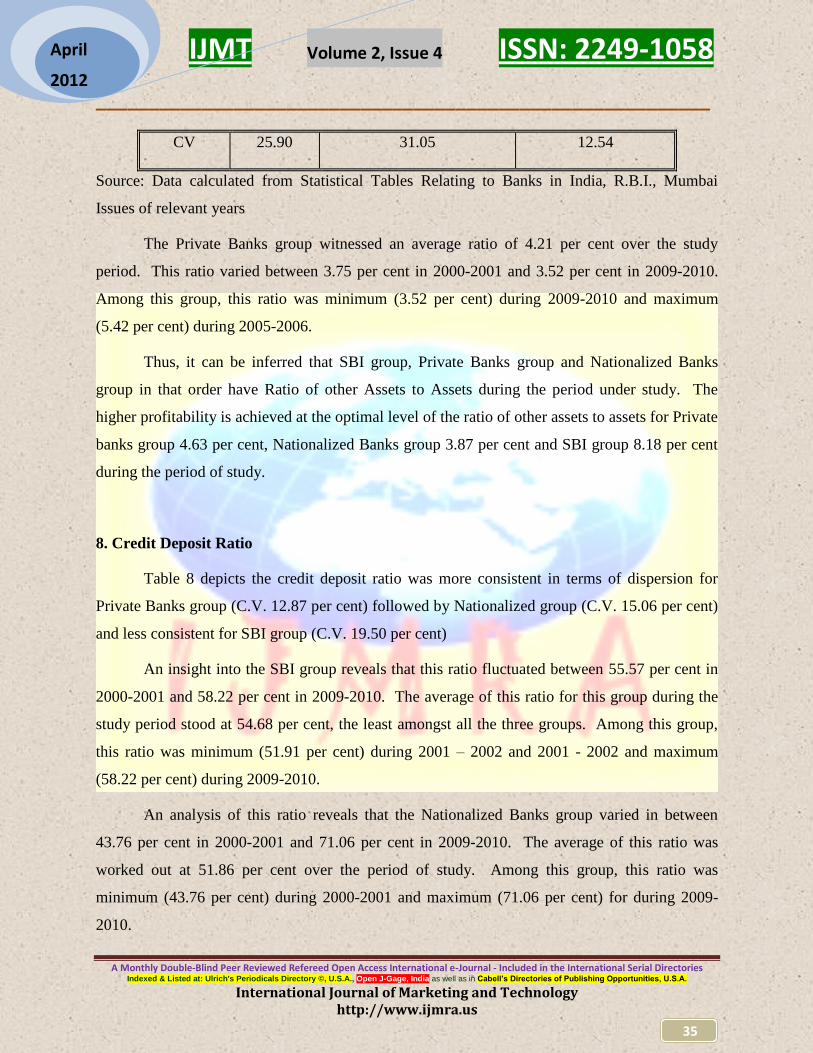
CV 25.90 31.05 12.54
Source: Data calculated from Statistical Tables Relating to Banks in India, R.B.I., Mumbai
Issues of relevant years
The Private Banks group witnessed an average ratio of 4.21 per cent over the study
period. This ratio varied between 3.75 per cent in 2000-2001 and 3.52 per cent in 2009-2010.
Among this group, this ratio was minimum (3.52 per cent) during 2009-2010 and maximum
(5.42 per cent) during 2005-2006.
Thus, it can be inferred that SBI group, Private Banks group and Nationalized Banks
group in that order have Ratio of other Assets to Assets during the period under study. The
higher profitability is achieved at the optimal level of the ratio of other assets to assets for Private
banks group 4.63 per cent, Nationalized Banks group 3.87 per cent and SBI group 8.18 per cent
during the period of study.
8. Credit Deposit Ratio
Table 8 depicts the credit deposit ratio was more consistent in terms of dispersion for
Private Banks group (C.V. 12.87 per cent) followed by Nationalized group (C.V. 15.06 per cent)
and less consistent for SBI group (C.V. 19.50 per cent)
An insight into the SBI group reveals that this ratio fluctuated between 55.57 per cent in
2000-2001 and 58.22 per cent in 2009-2010. The average of this ratio for this group during the
study period stood at 54.68 per cent, the least amongst all the three groups. Among this group,
this ratio was minimum (51.91 per cent) during 2001 – 2002 and 2001 - 2002 and maximum
(58.22 per cent) during 2009-2010.
An analysis of this ratio reveals that the Nationalized Banks group varied in between
43.76 per cent in 2000-2001 and 71.06 per cent in 2009-2010. The average of this ratio was
worked out at 51.86 per cent over the period of study. Among this group, this ratio was
minimum (43.76 per cent) during 2000-2001 and maximum (71.06 per cent) for during 2009-
2010.

IJMT Volume 2, Issue 4 ISSN: 2249-1058
__________________________________________________________
A Monthly Double-Blind Peer Reviewed Refereed Open Access International e-Journal - Included in the International Serial Directories Indexed & Listed at: Ulrich's Periodicals Directory ©, U.S.A., Open J-Gage, India as well as in Cabell’s Directories of Publishing Opportunities, U.S.A.
International Journal of Marketing and Technology http://www.ijmra.us
36
April
2012
Table 8 Credit Deposit Ratio
Year SBI Group Nationalized Banks Group Private Banks Group
2000 - 2001 55.57 43.76 50.90
2001 - 2002 51.91 44.01 50.13
2002 - 2003 52.24 45.24 50.40
2003 - 2004 52.62 46.73 50.31
2004 - 2005 53.41 49.54 50.04
2005 - 2006 53.54 50.50 51.88
2006 - 2007 54.67 50.82 52.78
2007-2008 56.98 53.43 58.97
2008-2009 57.65 63.48 63.27
2009-2010 58.22 71.06 71.60
Mean 54.68 51.86 55.03
SD 2.31 8.89 7.33
CV 0.04 0.17 0.13
Source: Data calculated from Statistical Tables Relating to Banks in India, R.B.I., Mumbai
Issues of relevant years
The Private Banks group witnessed an average ratio of 55.03 per cent over the study
period. This ratio varied between 50.90 per cent in 2000-2001 and 70.60 per cent in 2009-2010.
Among this group, this ratio was minimum (50.04 per cent) during 2004-2005 and maximum
(71.60 per cent) during 2009-2010.

IJMT Volume 2, Issue 4 ISSN: 2249-1058
__________________________________________________________
A Monthly Double-Blind Peer Reviewed Refereed Open Access International e-Journal - Included in the International Serial Directories Indexed & Listed at: Ulrich's Periodicals Directory ©, U.S.A., Open J-Gage, India as well as in Cabell’s Directories of Publishing Opportunities, U.S.A.
International Journal of Marketing and Technology http://www.ijmra.us
37
April
2012
Thus, it can be inferred that SBI group, Private Banks group and Nationalized Banks
group in that order have credit deposit ratio during the period under study. The higher
profitability is achieved at the optimal level of the credit to deposits for Private banks group
52.78 per cent, Nationalized Banks group 50.82 per cent and SBI group 55.57 per cent during the
period of study.
9. Ratio of Fixed Assets to Assets
Table 9 depicts the ratio of fixed assets to assets was more consistent in terms of dispersion for
Private Banks group (C.V. 30.02 per cent) followed by Nationalized group (C.V. 24.70 per cent)
and less consistent for SBI group (C.V. 18.20 per cent)
An insight into the SBI group reveals that this ratio fluctuated between 0.78 per cent in 2000-
2001 and 0.63 per cent in 2009-2010. The average of this ratio for this group during the study
period stood at 0.69 per cent, the least amongst all the three groups. Among this group, this ratio
was minimum (0.55 per cent) during 2007-2008 and maximum (0.91 per cent) during 2001-
2002.
An analysis of this ratio reveals that the Nationalized Banks group varied between 1.54 per cent
in 2000-2001 and 0.79 per cent in 2009-2010. The average of this ratio was worked out at 1.08
per cent over the period of study. Among this group, this ratio was minimum (0.79 per cent)
during 2009-2010 and maximum (1.54 per cent) during 2000-2001.
Table 9 Ratio of Fixed Assets to Assets
Year SBI Group Nationalized Banks Group Private Banks Group
2000 - 2001 0.78 1.54 2.86
2001 - 2002 0.91 1.41 2.66
2002 - 2003 0.86 1.28 2.27

IJMT Volume 2, Issue 4 ISSN: 2249-1058
__________________________________________________________
A Monthly Double-Blind Peer Reviewed Refereed Open Access International e-Journal - Included in the International Serial Directories Indexed & Listed at: Ulrich's Periodicals Directory ©, U.S.A., Open J-Gage, India as well as in Cabell’s Directories of Publishing Opportunities, U.S.A.
International Journal of Marketing and Technology http://www.ijmra.us
38
April
2012
2003 - 2004 0.76 1.18 2.14
2004 - 2005 0.64 1.07 2.77
2005 - 2006 0.59 0.97 2.51
2006 - 2007 0.61 0.89 2.17
2007-2008 0.55 0.85 1.81
2008-2009 0.57 0.80 1.40
2009-2010 0.63 0.79 0.83
Mean 0.69 1.08 2.14
SD 0.13 0.27 0.64
CV 18.20 24.70 30.02
Source: Data calculated from Statistical Tables Relating to Banks in India, R.B.I., Mumbai
Issues of relevant years
The Private Banks group witnessed an average ratio of 2.14 per cent over the study
period. This ratio varied between 2.86 per cent in 2000-2001 and 0.83 per cent in 2009-2010.
Among this group, this ratio was minimum (0.83 per cent) during 2009-2010 and maximum
(2.86 per cent) during 2001-2002.
Thus, it can be inferred that SBI group, Private Banks group and Nationalized Banks
group in that order have Ratio of Fixed Assets to Assets during the period under study. The
higher profitability is achieved at the optimal level of the ratio of fixed assets to assets for Private
banks group 2.17 per cent, Nationalized Banks group 0.89 per cent and SBI group 0.78 per cent
during the period of study.

IJMT Volume 2, Issue 4 ISSN: 2249-1058
__________________________________________________________
A Monthly Double-Blind Peer Reviewed Refereed Open Access International e-Journal - Included in the International Serial Directories Indexed & Listed at: Ulrich's Periodicals Directory ©, U.S.A., Open J-Gage, India as well as in Cabell’s Directories of Publishing Opportunities, U.S.A.
International Journal of Marketing and Technology http://www.ijmra.us
39
April
2012
10. Ratio of Priority Sector Advances to Advances
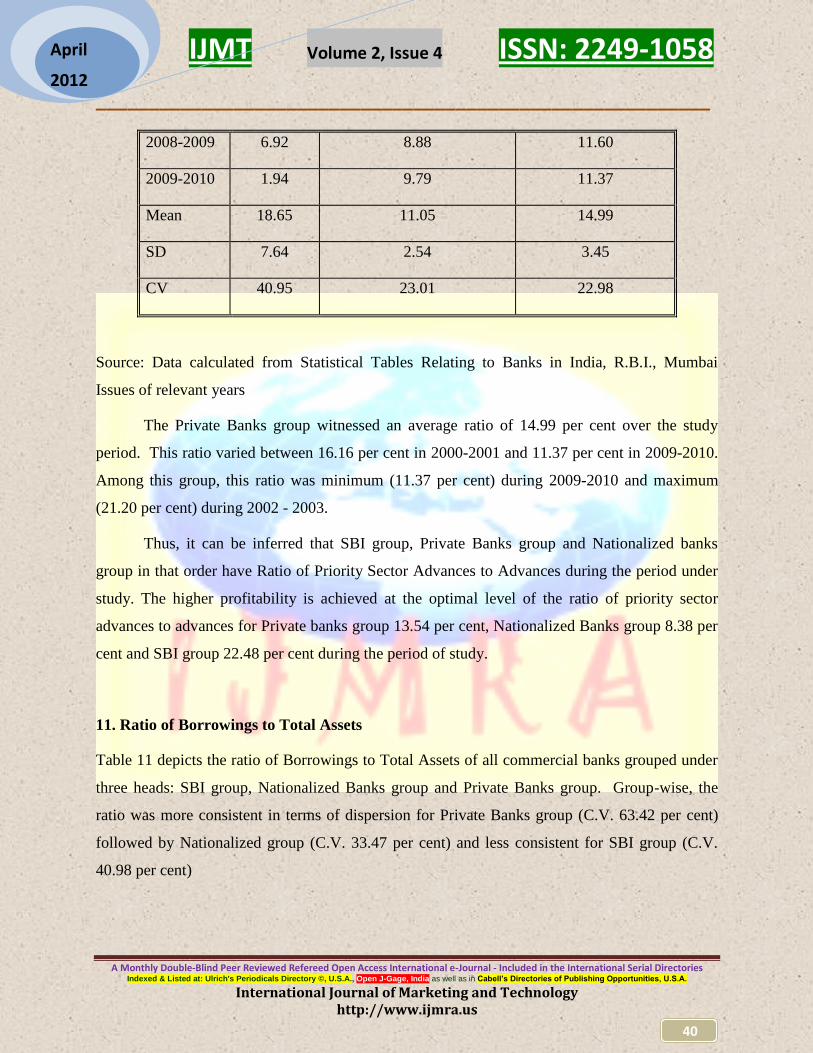
Table 10 depicts the ratio of Priority Sector Advances to Advances was more consistent
in terms of dispersion for Private Banks group (C.V. 14.99 per cent) followed by Nationalized
group (C.V. 23.01 per cent) and less consistent for SBI group (C.V. 40.95 per cent)
An insight into the SBI group reveals that this ratio fluctuated between 22.48 per cent in
2000-2001 and 1.94 per cent in 2009-2010. The average of this ratio for this group during the
study period stood at 18.65 per cent, the least amongst all the three groups. Among this group,
this ratio was minimum (1.94 per cent) during 2009-2010 and maximum (23.87 per cent) during
2001-2002.
An analysis of this ratio reveals that the Nationalized Banks group varied between 13.34
per cent in 2000-2001 and 9.79 per cent in 2009-2010. The average of this ratio was worked out
at 11.05 per cent over the period of study. Among this group, this ratio was minimum (8.35 per
cent) during 2074-2008 and maximum (15.15 per cent) during 2002-2003.
Table 10 Ratio of Priority Sector Advances to Advances
Year SBI Group Nationalized Banks Group Private Banks Group
2000 - 2001 22.48 13.34 16.16
2001 - 2002 23.87 13.21 16.76
2002 - 2003 22.25 15.15 21.20
2003 - 2004 21.91 12.72 19.79
2004 - 2005 23.30 12.17 14.32
2005 - 2006 21.18 8.47 13.64
2006 - 2007 20.84 8.38 13.54
2007-2008 21.79 8.35 11.56
IJMT Volume 2, Issue 4 ISSN: 2249-1058
__________________________________________________________
A Monthly Double-Blind Peer Reviewed Refereed Open Access International e-Journal - Included in the International Serial Directories Indexed & Listed at: Ulrich's Periodicals Directory ©, U.S.A., Open J-Gage, India as well as in Cabell’s Directories of Publishing Opportunities, U.S.A.
International Journal of Marketing and Technology http://www.ijmra.us
40
April
2012
2008-2009 6.92 8.88 11.60
2009-2010 1.94 9.79 11.37
Mean 18.65 11.05 14.99
SD 7.64 2.54 3.45
CV 40.95 23.01 22.98
Source: Data calculated from Statistical Tables Relating to Banks in India, R.B.I., Mumbai
Issues of relevant years
The Private Banks group witnessed an average ratio of 14.99 per cent over the study
period. This ratio varied between 16.16 per cent in 2000-2001 and 11.37 per cent in 2009-2010.
Among this group, this ratio was minimum (11.37 per cent) during 2009-2010 and maximum
(21.20 per cent) during 2002 - 2003.
Thus, it can be inferred that SBI group, Private Banks group and Nationalized banks
group in that order have Ratio of Priority Sector Advances to Advances during the period under
study. The higher profitability is achieved at the optimal level of the ratio of priority sector
advances to advances for Private banks group 13.54 per cent, Nationalized Banks group 8.38 per
cent and SBI group 22.48 per cent during the period of study.
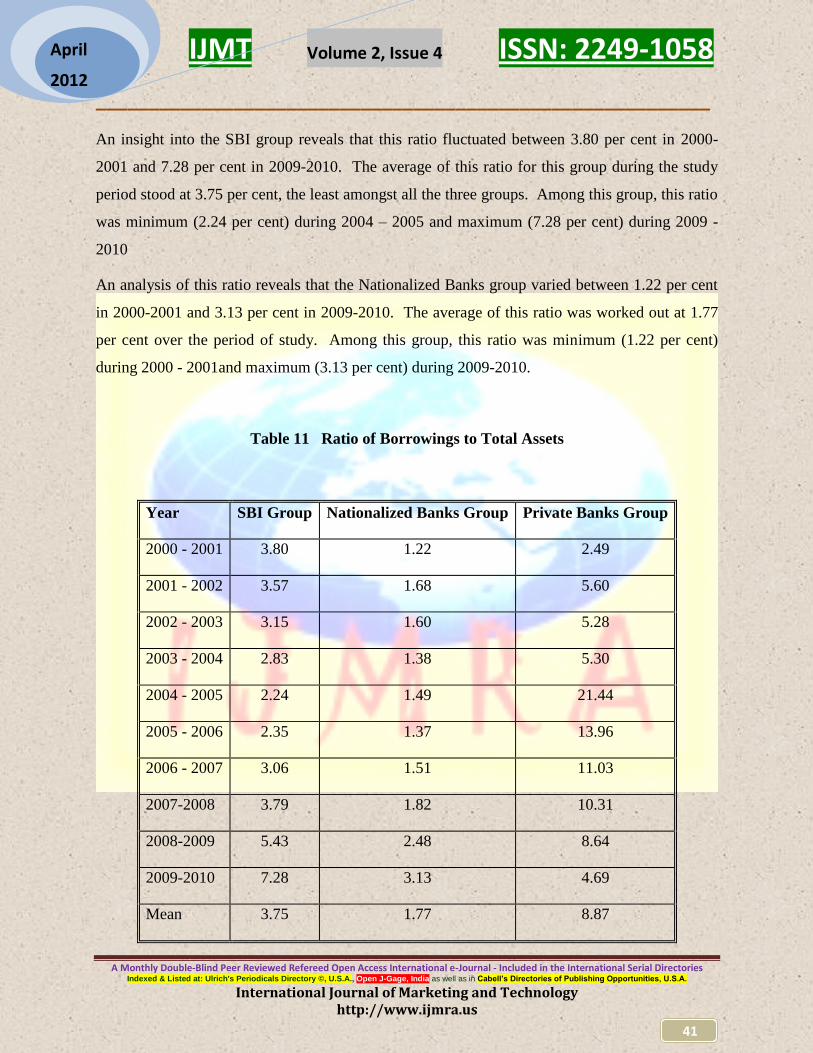
11. Ratio of Borrowings to Total Assets
Table 11 depicts the ratio of Borrowings to Total Assets of all commercial banks grouped under
three heads: SBI group, Nationalized Banks group and Private Banks group. Group-wise, the
ratio was more consistent in terms of dispersion for Private Banks group (C.V. 63.42 per cent)
followed by Nationalized group (C.V. 33.47 per cent) and less consistent for SBI group (C.V.
40.98 per cent)
IJMT Volume 2, Issue 4 ISSN: 2249-1058
__________________________________________________________
A Monthly Double-Blind Peer Reviewed Refereed Open Access International e-Journal - Included in the International Serial Directories Indexed & Listed at: Ulrich's Periodicals Directory ©, U.S.A., Open J-Gage, India as well as in Cabell’s Directories of Publishing Opportunities, U.S.A.
International Journal of Marketing and Technology http://www.ijmra.us
41
April
2012
An insight into the SBI group reveals that this ratio fluctuated between 3.80 per cent in 2000-
2001 and 7.28 per cent in 2009-2010. The average of this ratio for this group during the study
period stood at 3.75 per cent, the least amongst all the three groups. Among this group, this ratio
was minimum (2.24 per cent) during 2004 – 2005 and maximum (7.28 per cent) during 2009 -
2010
An analysis of this ratio reveals that the Nationalized Banks group varied between 1.22 per cent
in 2000-2001 and 3.13 per cent in 2009-2010. The average of this ratio was worked out at 1.77
per cent over the period of study. Among this group, this ratio was minimum (1.22 per cent)
during 2000 - 2001and maximum (3.13 per cent) during 2009-2010.
Table 11 Ratio of Borrowings to Total Assets
Year SBI Group Nationalized Banks Group Private Banks Group
2000 - 2001 3.80 1.22 2.49
2001 - 2002 3.57 1.68 5.60
2002 - 2003 3.15 1.60 5.28
2003 - 2004 2.83 1.38 5.30
2004 - 2005 2.24 1.49 21.44
2005 - 2006 2.35 1.37 13.96
2006 - 2007 3.06 1.51 11.03
2007-2008 3.79 1.82 10.31
2008-2009 5.43 2.48 8.64
2009-2010 7.28 3.13 4.69
Mean 3.75 1.77 8.87
IJMT Volume 2, Issue 4 ISSN: 2249-1058
__________________________________________________________
A Monthly Double-Blind Peer Reviewed Refereed Open Access International e-Journal - Included in the International Serial Directories Indexed & Listed at: Ulrich's Periodicals Directory ©, U.S.A., Open J-Gage, India as well as in Cabell’s Directories of Publishing Opportunities, U.S.A.
International Journal of Marketing and Technology http://www.ijmra.us
42
April
2012
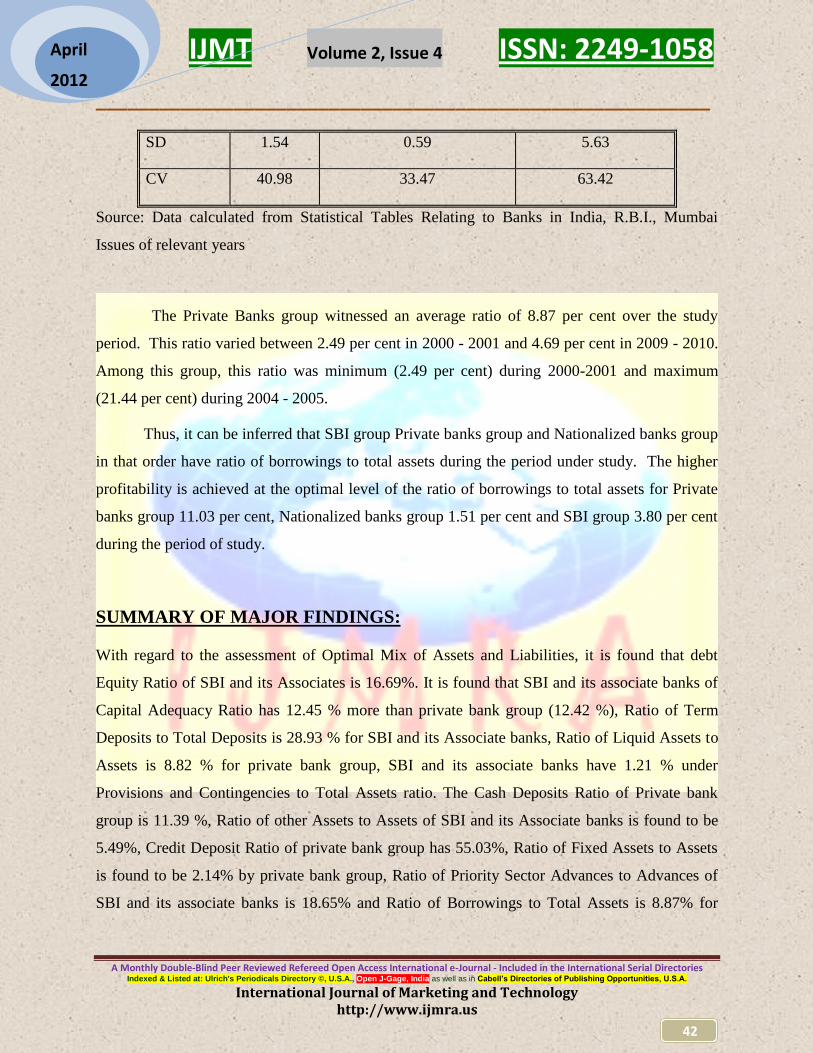
SD 1.54 0.59 5.63
CV 40.98 33.47 63.42
Source: Data calculated from Statistical Tables Relating to Banks in India, R.B.I., Mumbai
Issues of relevant years
The Private Banks group witnessed an average ratio of 8.87 per cent over the study
period. This ratio varied between 2.49 per cent in 2000 - 2001 and 4.69 per cent in 2009 - 2010.
Among this group, this ratio was minimum (2.49 per cent) during 2000-2001 and maximum
(21.44 per cent) during 2004 - 2005.
Thus, it can be inferred that SBI group Private banks group and Nationalized banks group
in that order have ratio of borrowings to total assets during the period under study. The higher
profitability is achieved at the optimal level of the ratio of borrowings to total assets for Private
banks group 11.03 per cent, Nationalized banks group 1.51 per cent and SBI group 3.80 per cent
during the period of study.
SUMMARY OF MAJOR FINDINGS:
With regard to the assessment of Optimal Mix of Assets and Liabilities, it is found that debt
Equity Ratio of SBI and its Associates is 16.69%. It is found that SBI and its associate banks of
Capital Adequacy Ratio has 12.45 % more than private bank group (12.42 %), Ratio of Term
Deposits to Total Deposits is 28.93 % for SBI and its Associate banks, Ratio of Liquid Assets to
Assets is 8.82 % for private bank group, SBI and its associate banks have 1.21 % under
Provisions and Contingencies to Total Assets ratio. The Cash Deposits Ratio of Private bank
group is 11.39 %, Ratio of other Assets to Assets of SBI and its Associate banks is found to be
5.49%, Credit Deposit Ratio of private bank group has 55.03%, Ratio of Fixed Assets to Assets
is found to be 2.14% by private bank group, Ratio of Priority Sector Advances to Advances of
SBI and its associate banks is 18.65% and Ratio of Borrowings to Total Assets is 8.87% for
IJMT Volume 2, Issue 4 ISSN: 2249-1058
__________________________________________________________
A Monthly Double-Blind Peer Reviewed Refereed Open Access International e-Journal - Included in the International Serial Directories Indexed & Listed at: Ulrich's Periodicals Directory ©, U.S.A., Open J-Gage, India as well as in Cabell’s Directories of Publishing Opportunities, U.S.A.
International Journal of Marketing and Technology http://www.ijmra.us
43
April
2012
private bank groups. When the overall position is judged, it is found that SBI and its associate
bank group has secured the first place and private bank group got the second place.
SUGGESTIONS:
In this new millennium the functional efficiency in respect of profitability of a bank can be
determined on stability of professional management. Profits are to be generated by way of
high volume of business coupled with better services. However while marching towards this,
the bank has to come across various risks such as Credit risk, capital risk, liquidity risk,
market risk etc.
The manufacturing sector has been hit in the recent years due to limitations of the banks in
their lending pattern. Studies on credit deposit ratio of private banks group (47.99 %) and
nationalized bank group (45.82%) which are in operation a couple of years only. Because of
these limitations, there are sectors like handicrafts, hospitality, construction and tourism
industry making profit, though are not exploited. For self employment projects which there
will be more entrepreneurs who will be more job generators rather than job seekers.
CONCLUSION:
The researcher has applied the ratios relating to the assessment of optimum asset liability mix. It
is clear from the table that Capital adequacy point of view SBI group and private bank groups are
performing better than the nationalized banks group. Liquidity position of the bank groups
revealed that the nationalized banks group stands first followed by private banks group and SBI
group. It is witnessed that borrowings of private banks group have the least variability in terms
of dispersion. The research has concluded that banking sector has to take greatest care on the
variables which relate to Asset Liability Management. All the banking groups have to take
necessary steps to improve the over all performance of the banking sector.
IJMT Volume 2, Issue 4 ISSN: 2249-1058
__________________________________________________________
A Monthly Double-Blind Peer Reviewed Refereed Open Access International e-Journal - Included in the International Serial Directories Indexed & Listed at: Ulrich's Periodicals Directory ©, U.S.A., Open J-Gage, India as well as in Cabell’s Directories of Publishing Opportunities, U.S.A.
International Journal of Marketing and Technology http://www.ijmra.us
44
April
2012
REFERENCES:
Ashok Kumar.M, “Financial Performance of Scheduled Commercial Banks in India –
CRAMEL Analysis” Ph.D Thesis, Bharathiar University, Coimbatore, 2009.
Amandeep, “Profits and Profitability in Commercial Banks”, Deep and Deep Publications,
New Delhi, 1993.
Brinds Jagirdar and Amlendu K Dubey, “Performance of Public Sector Banks”, The Indian
Banker, Vol II No 12, December 2007
Frey, Thomas Lee, Optimal Asset and Liability Decisions for a Rural Bank: An Application
of Multi-period Linear Programming, Ph.D. Thesis, Urban Champaign University of Illinois,
1970.
Ganesan, “Determinants of Profits and Profitability of Public Sector Banks In India: A Profit
function Approach”, Journal of Financial Management and Analysis,, 14 (1) : 27-37, 2001.
Kanjana.E.N , Efficiency, Profitability and Growth of Scheduled Commercial Banks in India.
Ph.D Thesis, Bharathiar University, Coimbatore, 2007.
Kothari C R “Indian Banking: Social Banking and Profitability”, Arihant Publishers, Jaipur,
1991.
Mishra, M.N., „Analysis of Profitability of Commercial Banks‟, Indian Journal of Banking
and Finance, Vol. 5, 1992.
Ramachandran.A, “Profits, Profitability and Growth of Commercial Banks, Thesis submitted
to Bharathiar University, Coimbatore, 2002.
Shilpa Baid, What drives Profitability of Indian Commercial Banks?, Asian Economic
Review (Journal of the Indian Institute of Economics), Vol. 48, No.3, 2006.