Embed Size (px)
Citation preview

ASSESSMENT OF WESTERN ROCK LOBSTER
STRATEGIC MANAGEMENT OPTIONS (4 volumes)
AN OVERVIEW OF BIO-ECONOMIC,
SOCIOLOGICAL AND COMPARATIVE ANALYSES
Volume 1
FISHERIES MANAGEMENT PAPER NO. 209
Department of Fisheries 168 St Georges Terrace
Perth WA 6000
January 2006
ISSN 0819-4327

Fisheries Management Paper No.209
Assessment of Western Rock Lobster Strategic Management Options
Volume 1
An Overview of Bio-Economic, Sociological and Comparative Analyses
January 2006
Fisheries Management Paper No. 209
ISSN 0819-4327

ADDENDUM
Addendum for report entitled ‘An Overview of Bio-Economic, Sociological and Comparative Analyses’ replacing Figure 9 on page 78.
-1.0
-5.0
1.0
1.0
-3.0
-3.0
-5.0
6.0
8.0
17.0
15.0
5.0
7.0
-4.0
12.0
-4.0
-10.0 -5.0 0.0 5.0 10.0 15.0 20.0
Kalbarri
Geraldton
Dongara
Leeman
Green Head
Jurien Bay
Cervantes
Lancelin
Ledge Point
Tw o Rocks
Yanchep
Fremantle
Mandurah
Bunbury
Busselton
Augusta
Community
Number of
Persons Engaged
Augusta 7 Busselton 3 Bunbury 12 Mandurah 48 Fremantle 154 Yanchep 6 Two Rocks 90 Ledge Point 55 Lancelin 124 Cervantes 92 Jurien Bay 78 Green Head 31 Leeman 96 Dongara 140 Geraldton 211 Kalbarri 29
Figure showing Overall Community Resilience Scores and Table showing number of persons engaged in the WRL fishery in December 2004

CORRECTION
BOAT NUMBERS (Figures as of 6 February 2006)
2003-04 549
2004-05 535
2005-06 500 49 boats have left the fishery in the past 24 months. 35 boats have left the fishery in the past 12 months – the largest reduction in a single year.

Fisheries Management Paper No.209
An Overview of Bio-Economic,
Sociological and Comparative Analyses
Department of Fisheries Western Australia
January 2006
1

Fisheries Management Paper No.209
OVERVIEW AND EXECUTIVE SUMMARY ........................................................6 KEY ISSUES.................................................................................................................7
Accuracy of the bio-economic model.....................................................................8 Modelling fleet efficiency/economic gains...........................................................10 Pot reductions and economic efficiency gains.....................................................10 Uncertainty around the economic benefits of ITQs .............................................11 Processing and Marketing ...................................................................................12 Values of unit (pot) entitlements and ITQs ..........................................................12 Time required to realise the benefits of ITQs ......................................................13 Risks associated with constant (fixed), variable and competitive quotas............13 Initial quota allocation ........................................................................................14 Zone quotas..........................................................................................................14 Quota legislation..................................................................................................14 Quota enforcement - risks and costs....................................................................14 Who will own the quota and will wealth distribution change?............................14 Lifestyle, social and retirement issues .................................................................15 Social ramifications of quotas and reductions in fishing effort ...........................16 Summary of bio-economic model results - annual $ benefits ..............................16 Planned timetable of review and decision making process .................................18
DEFINITIONS OF TERMS AND ABBREVIATIONS.........................................................19
INTRODUCTION......................................................................................................19
STATE GOVERNMENT’S ROCK LOBSTER MANAGEMENT REVIEW INITIATIVE ...........19 QUOTA ALLOCATION ................................................................................................20 THE MANAGEMENT REVIEW PROCESS......................................................................21
Objectives.............................................................................................................21 Proposed review timetable and consultative process ..........................................22 Phase 1 – Objective analysis of management options .........................................22 Phase 2 – Communicate analysis of management scenarios with stakeholders .22 Phase 3 – RLIAC prepares advice for government .............................................23 Phase 4 – Government’s decision and implementation.......................................23
WESTERN ROCK LOBSTER FISHERY – BACKGROUND ...............................................23 HISTORY OF REGULATION OF THE WESTERN ROCK LOBSTER FISHERY...................23 CATCH, EFFORT AND BOAT HISTORY .......................................................................25 CATCH PREDICTIONS ................................................................................................26 NUMBER OF BOATS IN THE FISHERY........................................................................27 ECONOMIC ISSUES AFFECTING FISHERS – COST-PRICE SQUEEZE..............................27 ACCOMPANYING REPORTS AND PREVIOUS REVIEWS AND STUDIES ..........................28
OBJECTIVE OF FISHING EFFORT AND QUOTA MANAGEMENT ............29
COMPARING EFFORT AND QUOTA MANAGEMENT OPTIONS – KEY ISSUES AND BENEFITS .........................................................................................30
MANAGEMENT SYSTEMS ASSESSED..........................................................................30
THE CURRENT ROCK LOBSTER EFFORT MANAGEMENT SYSTEM (ITE) ............................................................................................................................31
KEY ISSUES...............................................................................................................31 Reaching consensus regarding management action............................................31 Risk to the breeding stock and ecology................................................................32
2

Fisheries Management Paper No.209
Competition between fishers – fishing “harder” and “smarter”........................32 The need to reduce fishing effort .........................................................................33 Competition leads to over capitalisation and increased fishing costs.................34
BENEFITS OF THE CURRENT MANAGEMENT SYSTEM ................................................35 It’s a familiar management system ......................................................................35 Research...............................................................................................................35 Enforcement .........................................................................................................35 Effort control systems “reward” more competitive fishers .................................36
IMPLEMENTATION AND COSTS ..................................................................................37 MODELLING THE CURRENT EFFORT CONTROL SYSTEM............................................37 COULD THE CURRENT EFFORT CONTROL SYSTEM DELIVER SIMILAR BENEFITS COMPARED TO ITQS? ...............................................................................................38
Increasing the catching efficiency of pots............................................................38 Extending the fishing season................................................................................38 Closures during low catch periods ......................................................................38 Pot reductions ......................................................................................................39 Possible consequences of staying with the current management system.............39
MODELLING A 20 PER CENT POT REDUCTION ...........................................................39
A MODIFIED, MORE FLEXIBLE EFFORT CONTROL SYSTEM .................40 HOW A FLEXIBLE ITE SYSTEM WOULD WORK.........................................................40
A hypothetical example of a flexible ITE system .................................................41 KEY ISSUES...............................................................................................................41 BENEFITS ..................................................................................................................41 IMPLEMENTATION AND COSTS ..................................................................................42
Assumptions and limitations of the modelling .....................................................42
A CATCH QUOTA SYSTEM (ITQS).....................................................................42 KEY ISSUES...............................................................................................................43
Risks associated with constant (fixed), variable and competitive quotas............43 Quota allocation ..................................................................................................43 Maintaining biological controls to ensure sustainability ....................................44 Maintaining effort (pot number) controls ............................................................44 Exploitation..........................................................................................................45 Competition Between Fishers ..............................................................................45 Impact of ITQ allocation on a fisher’s catch and behaviour...............................46 Impact of ITQs on the peak catching periods ......................................................47 Effects on new entrants and potential new business approaches ........................47 Cheating on quota................................................................................................48 Compliance ..........................................................................................................48 Research...............................................................................................................49
LEGAL FRAMEWORK AND PROCEDURES REQUIRED FOR ITQS..................................49 Legal framework ..................................................................................................49 Quota setting procedure ......................................................................................50
THE BASIS OF QUOTA SETTING.................................................................................50 Conservative quota setting...................................................................................50 Quota management issues....................................................................................51
ZONE QUOTAS ..........................................................................................................51 WHITES AND REDS QUOTAS .....................................................................................52 POTENTIAL BENEFITS OF ITQS .................................................................................52
3

Fisheries Management Paper No.209
ITQS WITH EFFORT CONTROLS.......................................................................53 HOW AN EFFORT CONTROLLED ITQ SYSTEM WOULD WORK ..................................53
Quota allocation ..................................................................................................53 Quota/pot transfers and pot usage.......................................................................53
ITQS WITHOUT EFFORT CONTROLS ..............................................................54 HOW AN ITQ SYSTEM WITHOUT EFFORT CONTROLS COULD WORK........................54
Quota allocation ..................................................................................................55 Quota transfers and pot usage.............................................................................55
COMPARISONS BETWEEN EFFORT AND QUOTA MANAGEMENT SYSTEMS – RESULTS OF BIO-ECONOMIC MODELLING ...........................55
KEY ISSUES AND ASSUMPTIONS OF THE BIO-ECONOMIC MODEL.............................56 Accuracy of the model..........................................................................................56 Modelling fleet efficiency/economic gains...........................................................58 ITEs and pot reductions .......................................................................................58 Uncertainty around the economic benefits of ITQs .............................................59 Time required to realise the benefits of ITQs ......................................................60
MODELLING RESULTS – THE DIFFERENT MANAGEMENT OPTIONS ...........................60 Profit Optimising Behaviour................................................................................60 Processing and marketing....................................................................................61 Summary of the bio-economic model results of the annual $ benefits for the Western Rock Lobster Fishery .............................................................................61 Management options modelled ............................................................................62
A DETAILED EXAMINATION OF FOUR MANAGEMENT OPTIONS................................64 The current management system (Scenario 1).....................................................64 The current management system with a 20 per cent pot reduction (Scenario 1c)..............................................................................................................................64 A variable ITQ system with the current effort (pot numbers) controls (Scenario 3d) ........................................................................................................................65 A variable ITQ system with reduced effort (pot number) controls (Scenario 4d)65 Presentation of the Modelling Results .................................................................65 Breeding stock levels............................................................................................66 Annual Average Catch .........................................................................................67 Boats ....................................................................................................................68 Annual Pot Lifts ...................................................................................................69 Average Annual Net Benefits ...............................................................................70 Sensitivity of $ benefits to increases in price/kg ..................................................72
COMPLIANCE – ILLEGAL FISHING AND SELLING OF LOBSTERS .................................74 Effort control system............................................................................................74 Quota system........................................................................................................75
MODELLING DIFFERENT VARIATIONS OF EFFORT AND QUOTA SYSTEMS .................75
SOCIAL ISSUES .......................................................................................................76 BOATS NUMBERS AND EMPLOYMENT .......................................................................80 FLOW ON EMPLOYMENT CONSEQUENCES .................................................................82
Lifestyle choices ...................................................................................................84 WHO WILL OWN THE QUOTA AND WILL WEALTH DISTRIBUTION CHANGES? ..............84
QUOTA EXPERIENCE IN OTHER ROCK LOBSTER FISHERIES................85
4

Fisheries Management Paper No.209
FINDINGS ..................................................................................................................85 FISHERIES MANAGEMENT..........................................................................................86 INDUSTRY DYNAMICS AND FISHING PATTERNS..........................................................87 GENERAL OBSERVATIONS.........................................................................................88
CONCLUSIONS ........................................................................................................89
ATTACHMENTS ......................................................................................................91 DEFINITION OF TERMS AND ABBREVIATIONS...........................................................91
SCOPE OF THE REVIEW OF MANAGEMENT OPTIONS FOR THE ROCK LOBSTER FISHERY................................................................................................93
OBJECTIVES OF THE REVIEW....................................................................................93 TIMETABLE OF REVIEW ............................................................................................93 PHASE 1 – OBJECTIVE ANALYSIS OF MANAGEMENT SCENARIOS..............................94 PHASE 2 – COMMUNICATE ANALYSIS OF MANAGEMENT SCENARIOS WITH STAKEHOLDERS ........................................................................................................94 PHASE 3 – RLIAC PREPARE ADVICE FOR GOVERNMENT .........................................95 PHASE 4 – GOVERNMENT’S DECISION AND IMPLEMENTATION .................................95
ECONOMIC ISSUES IMPACTING ON THE WESTERN ROCK LOBSTER INDUSTRY.................................................................................................................96
INTRODUCTION .........................................................................................................96 THE COST-PRICE SQUEEZE........................................................................................96 ROCK LOBSTER PRICES.............................................................................................97 CATCH HISTORY AND OUTLOOK...............................................................................98 INPUT COSTS.............................................................................................................99 FUEL .........................................................................................................................99 LABOUR ..................................................................................................................101 FIXED COSTS...........................................................................................................103 VALUE OF POT ENTITLEMENTS ...............................................................................103 FLEET SIZE AND COMPOSITION ...............................................................................104 PROFITABILITY OF INDUSTRY..................................................................................105 PREVIOUS REVIEWS AND STUDIES ..........................................................................108
Alternative Management Options for the Western Rock Lobster Fishery .........109 Management controls.........................................................................................109 Current ITE........................................................................................................109 Modified ITE ......................................................................................................109 ITQ – effort controlled .......................................................................................109 ITQ .....................................................................................................................109
QUOTA AND POT TRANSFERS UNDER AN EFFORT CONTROLLED ITQ SYSTEM .......118 No quota transfers within season.......................................................................118 Transferring quota within season – Example 1 .................................................118 Transferring quota within season – Example 2 .................................................118
5

Overview and Executive Summary The State Government initiated the review of the west coast rock lobster management system in March 2002. The purpose of this review paper is to present the options for managing the fishery and to compare the current fishing effort control system to a more flexible one and to two types of individually transferable quota (ITQ) management systems, one with the current effort controls and the other without or with reduced1 effort controls. The State Government does not have a preconceived idea as to what is the best management system, rather it has an expectation that the review process will identify the best long-term and strategic approach for managing the fishery to produce the best socio-economic outcomes for the State, within an ecologically sustainable development framework. This report also includes an overview of the major findings of three specialist reports prepared for the review that should be read in conjunction with it. The specialist reports provide important detailed information on different aspects of the management review:
• Bio-Economic Modelling – Compares the economic benefits that can be realised under different fishing effort and quota management systems. The paper is titled A Bio-Economic Evaluation of Management Options for the West Coast Rock Lobster Fishery, by Economic Research Associates, 2005.
• Social Research – Presents the initial findings of research on the possible social impacts of fishing effort and quota management systems, particularly on small coastal communities. The paper is titled A Social Assessment of Coastal Communities Hosting the Western Rock Lobster Fishing Fleet, by the Institute for Regional Development, University of Western Australia, 2005.2
• Quota Experience in Other Rock Lobster Fisheries – Describes the rock lobster quota management experience in South Australia, Tasmania and New Zealand. The paper is titled How do Quota Management Systems Work in Rock Lobster Fisheries? The Experience in New Zealand, Tasmania and South Australia, by Tim Bray, Steven Gill and Ron Edwards, Department of Fisheries, 2005.
[This paper and the three associated reports listed above are available on the Department of Fisheries’ web site at www.fish.wa.gov.au or the Western Rock Lobster Council’s web site at www.rocklobsterwa.com and hard copies are available by contacting the Department on (08) 9482 7267.] Because of the very large amount of information that has been provided as background for the management review, this overview has been included to help
1 The ITQ system without effort controls that was modelled for this review does not have uncontrolled effort. It has been limited to a 20 per cent increase in the number of pots fishers can use because experience in other ITQ lobster fisheries has shown that fishers do not use excessive numbers of pots, when controls on pot numbers are removed. 2 This is a three-year project funded by the Fisheries Research and Development Corporation.
6

focus readers’ attention on some of the most important issues that are discussed in more detail in this report and the three accompanying specialist reports. The rock lobster fishery has had a long history of fishing effort controls dating back to 1963 when the fishery became limited entry. Many regulations were introduced in the 20 years after 1963 to try to control and slow the continual growth in fishing effort that scientists feared would eventually lead to overfishing and a collapse of the lobster breeding stock. As the fishing effort controls became more numerous and complex, they began to impinge on the flexibility of fishing operations and significant economic inefficiencies began to emerge. The industry pushed hard for management reforms to alleviate these problems and over the next 20 years some of the very tight effort control rules, particularly the strict boat replacement policy, were relaxed (see section headed History of Regulation of the Western Rock Lobster Fishery for further details). Unfortunately, while relaxing some of the effort control rules has given fishers greater flexibility, it has also allowed effective fishing effort to increase at a faster rate than it would have otherwise, and pot reduction programs have had to be implemented to counteract it, i.e. 10 per cent in 1986, 18 per cent in 1993 and 10 per cent for part of the season in Zone A and B in 2005. The Western Rock Lobster Fishery is currently ecologically sustainable and profitable, however, it is facing unprecedented economic challenges both in the short- and long-term due to rising costs (e.g. fuel, bait, labour) and reduced prices for the catch (a decline of about 20 per cent in real terms over the last 10 years). The current economic conditions and the recent management process to decide on the fishing effort reduction package for 2005-06 has raised considerable interest among fishers with regard to how the current effort control management system would compare to other management systems, particularly individual transferable quotas (ITQs). Some people believe the rock lobster industry is at a “management crossroads” – should it stay with the current effort control system, or move to an ITQ system? These people are of the view that despite some uncertainty and issues surrounding ITQs, they have the potential to deliver significantly different economic and social benefits compared to the current management system. Others would argue that the current system has served the fishery well for more than 40 years and “if it ain’t broke, don’t fix it”. Detailed economic modelling and social and fisheries management research has identified a number of major issues that readers need to be aware of while reading the detail of this review.
Key Issues Rules to protect the breeding stock No matter what management system is used, the breeding stock must be maintained at levels above those of the late 1970s to ensure the sustainability of the fishery. It will be necessary to retain the current breeding stock decision rules framework, with its trigger points for management action.
7

Accuracy of the bio-economic model Economic Research Associates (ERA), the consultants who have undertaken the economic modelling of the Western Rock Lobster Fishery have obtained their information from a survey of fishers (postal questionnaire – 21 fishers responded), detailed discussions with focus groups of fishers, processors, research scientists and managers, scientific publications, Department of Fisheries’ databases, and the Australian Bureau of Statistics. The information has been collected in order to develop the assumptions that underpin the model. ERA have tested the model outputs against the historical fishery information (e.g. catch and fishing effort, catch rate (kg/pot lift), distribution of catch by month, boat and pot numbers, and beach prices) and the fits are good. Therefore, ERA believe the model is behaving in a realistic and reliable way and that the model outputs provide robust estimates of what would happen to the fishery under the different management options, based on the assumptions used. It is impossible to model the behaviour of each individual boat/business in the fishery. Therefore, by necessity, the model used what is called an “average” or “representative” boat/business for Zones A, B and C. The behaviour of the representative boat/business is modelled under the different assumptions (e.g. price and efficiency increases) for each management option and the results are then applied to the entire fleet in each zone. In reality, individual businesses will have different capital and cost structures. However, the model provides a good indication of what would happen on a total fleet basis. For example, under the ITQ system without controls on pot numbers,3 the model predicts that fishers (the representative boat/business) would make changes to their normal fishing patterns to maximise their profits. For instance, such a change might involve catching some of their quota in July-August when the price is higher and the increase in pot efficiency could allow them to work two- and three-day pulls very economically. The model shows that the normal catch peaks in the whites and the reds are still present but are reduced a little, which allows more rock lobsters to be available at traditionally low catch rate periods and during the extended season, when prices are higher. The model appears to be realistic in that it does not allow fishers (the representative boat/business) to concentrate their entire quota in periods of high price, because catchability in those periods is low and only a modest portion of the quota could be taken at that time. To give an indication of how “realistic” the model outputs are, the average number of pot lifts and the average catch (kg) per month for Zone C are shown below as examples of what the model estimates for some of the different management options. Note that graphs 3c and 3d and 4c and 4d overlay each other, so it is difficult to distinguish between them.
3 Under this option pot usage was allowed to increase by 20 per cent, the fishing season was extended to 31 August, there was an increase in the beach price in certain months of the season (particularly July-August) and the catching efficiency of the pots was increased.
8

0
100,000
200,000
300,000
400,000
500,000
600,000
700,000
800,000
900,000
November December January February March April May June July August September October
Ave
rage
nos
. pot
lifts
per
mon
th
Sc1 Sc1c Sc3c Sc3d Sc4c Sc4d
Zone C: Pot lifts by month
[Note: Sc = Scenario; Scenario 1 = the current management system; Scenario 1c = the current management system with a 20 per cent pot reduction; Scenario 3c and 3d = variable ITQ with the current effort (pot number) controls and price increases of $2.00/kg and $1.00/kg respectively; Scenario 4c and 4d = variable ITQ without the current effort (pot number) controls, i.e. pot numbers are increased by 20 per cent, and price increases of $2.50/kg and $1.25/kg respectively. Graphs 3c and 3d and 4c and 4d overlay each other, so it is difficult to distinguish between them.]
0
200,000
400,000
600,000
800,000
1,000,000
1,200,000
1,400,000
1,600,000
1,800,000
2,000,000
November December January February March April May June July August September October
Ave
rage
cat
ch p
er m
onth
(Kg.
)
Sc1 Sc1c Sc3c Sc3d Sc4c Sc4d
Zone C: Catch by month
[Note: Sc = Scenario; Scenario 1 = the current management system; Scenario 1c = the current management system with a 20 per cent pot reduction; Scenario 3c and 3d = variable ITQ with the
9

current effort (pot number) controls and price increases of $2.00/kg and $1.00/kg respectively; Scenario 4c and 4d = variable ITQ without the current effort (pot number) controls, i.e. pot numbers are increased by 20 per cent, and price increases of $2.50/kg and $1.25/kg respectively. Graphs 3c and 3d and 4c and 4d overlay each other, so it is difficult to distinguish between them.] One factor that has not been modelled, which would be likely to have a significant impact on fishers’ behaviour and the potential $ benefits that could be gained by moving to an ITQ system, is the start time for the quota season. For instance, if the quota season started in February or May, fishers would use different fishing strategies to what they would use for a traditional November start.
Modelling fleet efficiency/economic gains An important aspect of the bio-economic modelling was to determine if any of the management options offered additional gains in fleet efficiency, that is, greater annual net economic benefits ($ profits) compared to the current system. In the model, the fleet efficiency gains were calculated using the assumptions around the increases in pot efficiency (obtained by changes in pot design) and the optimisation of fleet size, while taking into account the costs of fishing. These gains were expressed as reductions in boat numbers. That is, economic theory implies (and the model assumes) that fewer boats in the fleet means more catch per boat = lower costs/kg of lobsters caught. This, in turn, means a more efficient fleet overall and greater net profits. However, increasing fleet efficiency and net profits does not necessarily just involve boats leaving the fishery. Fleet efficiency and net profits can also be increased, particularly under an ITQ system, if fishers reduce their individual operating costs, e.g. use smaller, less costly and more economic boats and implement strategies to save on fuel, bait, labour costs and so on. Therefore, the significant economic gains ($), due to fleet efficiency increases (the significant reduction in boat numbers), that the model has predicted for the ITQ system without effort controls are, in practice, more than likely to be made up of a combination of reduced operating costs and fewer boats, rather than just fewer boats in the fleet.4 It is possible that the bio-economic model overestimates boat reductions for ITQs without effort (pot number) controls (Option 4).
Pot reductions and economic efficiency gains Bio-economic modelling shows that under the current effort control management system, a pot reduction (e.g. 20 per cent, at two per cent per year over 10 years) would drive fleet rationalisation (i.e. reduce the number of boats) faster than the current system with no pot reduction, but not to the same extent as an ITQ without controls on effort (pots numbers). A 20 per cent pot reduction would also result in slightly greater fleet efficiency/economic ($) benefits than the current system, but it would not yield the same $ benefits as ITQs. This is due to the competitive nature of fishing under the current system and with a 20 per cent pot reduction, which provides less opportunity for fishers to reduce operating costs. Therefore, the efficiency gains estimated by the
4 The current bio-economic model cannot provide separate estimates of the economic gains that can be attributed to reductions in boat numbers compared to reductions in individual boat operating costs.
10

model for the current system and the 20% pot reduction option are significantly lower than for ITQs, and the majority of the gains would come through a reduction in the number of boats, i.e. the fleet could comprise fewer boats with larger numbers of pots.
Uncertainty around the economic benefits of ITQs The potential benefits of ITQs predicted from the bio-economic modelling are derived from hypothetical price increases and efficiency gains that industry representatives considered reasonable. There are risks that these gains may not be fully realised, however, the model has to make assumptions on how the fleet could behave under different conditions associated with the various management options. Hypothetical price increase of up to $5.50/kg for the whole season The price increases are based on the best judgements of processors and marketers against the background of the uncertainties of international market conditions. The price increases apply to the total catch over a year and are composed of:
• $2/kg due to the longer season of supply – November to August (this applies to the more flexible effort control and the ITQ options that were modelled);
• $1.50 to $3.00/kg if quotas result in a more stable supply of product from season to season; and
• $0.50/kg if quotas result in a more stable supply of product within a season, i.e. catch is spread a little more evenly throughout the season (lower catch peaks in the whites and reds).
If these hypothetical price increases did not materialise as an additional benefit on top of the normal price fluctuations caused by changes in exchange rate or economic conditions, then the potential economic benefits of an ITQ system with or without effort controls would be reduced. This would considerably reduce the economic incentive to change the current management system. To allow for this uncertainty, the model used a conservative $1.00/kg increase in price for one of the ITQ options. The sensitivity of the model’s estimates of average annual $ benefits to increases in price is discussed under Sensitivity of $ benefits to increases in price/kg in the section titled Comparisons Between Effort And Quota Management Systems – Results Of Bio-economic Modelling. Hypothetical efficiency gains from changes in pot design It is estimated that changes in pot design (e.g. larger pots with side entrances, parlour pots that stop escapement, etc) could yield catching efficiency increases of between 15 per cent and 40 per cent. This would mean that a fisher could use more efficient pots to reduce overall operating costs by reducing the number of pots used. This could result in the purchase of a smaller, more economic boat and lower fuel, bait, labour costs and so on. The model shows that there are significant economic benefits to be gained by increasing the catching efficiency of pots.
11

Modelled efficiency gains from boat reductions The modelling results for ITQs showed the potential for significant increases in fleet efficiency (hence annual $ benefits) that could flow from a large reduction in the number of boats in the fishery. This was particularly so for the ITQ system without (reduced) fishing effort controls (i.e. fishers could use up to 20 per cent more pots than they currently use and the pots could be up to 40 per cent more efficient at catching), where the number of boats declined from 549 to 256. In practice, the $ gains from increases in fleet efficiency may not be as great as predicted by the model because:
o the reduction in boat numbers could be less than predicted; o efficiency gains assumed for a significantly smaller fleet size may not be as
large as anticipated; and o the decline in boat numbers may occur over a long period of time.
If the efficiency gains were not as great as predicted and/or were slow to materialise, the benefits of ITQ systems (particularly with reduced effort controls) could be lower than the model estimates.
Processing and Marketing At present, it appears that the processing sector is competitive and most of the value of the catch flows to fishers. Fishers do little or no product promotion themselves and the current small margins on processing mean that in general processors have limited funds to invest in marketing, for example doing large promotions or advertising, developing and promoting specific brands, developing a larger product range, etc. This could change if there was a shift to ITQs and processors could gain extra benefits in the market place. Under ITQs processors would be able to signal to fishers the best time to take their quota to maximise the $ return in the market place. Some of the additional $ benefits obtained could be used to do more market promotion to try and develop a premium price for western rock lobster, compared to other lobsters. In addition, processors could also secure control over quantities of quota, which could provide them with greater $ returns, some of which could be directed back into market promotion.
Values of unit (pot) entitlements and ITQs In this review no attempt was made to model (predict) the possible changes in the value of unit (pot) entitlements or ITQs that may occur under the different management options. This is because it is difficult to fully understand the factors that drive prices; they appear to be a mixture of economic forces and fisher and investor sentiments5. In addition, fishers and investors have alternative investment opportunities that they take into consideration and the market for entitlements is small, which means scarcity can also affect prices. The prime focus of the review is
5 For example after the 18 per cent pot reduction in 1993 some fishers wanted to buy pots to get back to their original number for economic reasons, while others just wanted to have the same number of pots they had previously.
12

on the net economic benefits that can be derived from the different management options.
Time required to realise the benefits of ITQs If the fishery moved to ITQs, it may take as long as one generation of fishers to realise the full potential economic benefits. The time would depend largely on two factors:
• how quickly the management system could be deregulated under ITQs to allow fishers to design more efficient pots and to use more pots (e.g. up to 20 per cent more) to catch their quota. Deregulation could only proceed if it did not impact adversely on the sustainability of the stock and the integrity of the management and enforcement system (particularly the control of the black market for illegal catch); and
• how rapidly the industry (fishers, processors and marketers) would adjust to the new ITQ system and deliver the price increases (processors would need to play a lead role) and efficiency gains (fishers would have to reduce their operating costs and boats would have to retire from the fishery).
Risks associated with constant (fixed), variable and competitive quotas If it was decided to move an ITQ system there are two ways of setting the quota:
• a constant quota which does not vary from year to year (i.e. it could be set for 5, 10 or more years at a time), or
• a variable quota based on catch predictions, which could vary each year. Modelling has shown that the annual $ benefits of a constant quota are greater than for a variable quota system. However, there is a far greater risk of depleting the breeding stock under a constant quota (particularly during poor recruitment years), unless it is set at a very conservative level6, which then significantly reduces the $ benefits. Therefore from a sustainability and economic perspective the use of a constant quota from year to year would be difficult to justify. So while a constant quota has been modelled and reported on as part of this review it is not considered very highly as a viable or practicable management option. Therefore, variable quotas would be the basis of any ITQ system for the Western Rock Lobster Fishery. The use of a competitive Total Allowable Commercial Catch quota (TACC), i.e. where a total quota is set for the fishery and fishers compete for their share of the catch (with either limited or unlimited pots), was not considered a viable alternative management option. Experience around the world has shown that competitive quotas combine the worst aspects of both quota and effort control systems and they are the most unpredictable regarding their impact on long-term sustainability (breeding stock levels). Therefore, this review has focused on ITQs.
6 Possibly 9,000 to 9,500 tonnes/year
13

Initial quota allocation If it were decided to move to an ITQ system, there would be significant changes in some fisher’s catches because quota allocation would be based on the number of units (pots) a person owned and not on their catch history. Fishers who would normally catch below the average would be raised up to the average, and fishers who caught above the average would be reduced down to the average. To increase catch, a fisher would have to buy (or lease) additional quota. See the example of how quota would be allocated in the Introduction under the heading Quota Allocation.
Zone quotas Separate quotas would be set for each Zone (A, B and C). A and B fishers would have one quota for the period 15 November to 14 March and another for the remainder of the season (i.e. separate coastal and Abrolhos quotas). Consideration may also need to be given to quotas on the peaks of the whites and the reds if fishers concentrated too much on these high catch rate periods and exacerbated the current peak supply issues.
Quota legislation New legislation would be required to implement the initial quota allocation procedure and the annual quota setting process. To ensure complete transparency of determining and recommending quota levels to the Minister for Fisheries, a quota setting advisory committee with a clear set of business rules, would have to be established. The committee would be composed of all relevant stakeholders and it would need a scientific advisory group to help it determine sustainable annual quota levels.
Quota enforcement - risks and costs ITQ enforcement risks and costs around a black market for illegal lobsters would be major considerations in moving to an ITQ system and any increase in the uncertainty around the level of economic benefit that may be realised from ITQs would further raise the importance of these issues. The enforcement system would need to keep the illegal lobster catch at very low levels, because even a five per cent leakage (about 500 tonnes) to the black market would cost the industry in the vicinity of $12 million annually. That is, every fisher’s quota would have to be reduced by about 900 kg ($22,000 per year at current market value) to take account of it. It would be difficult to justify a move to ITQs if there was significant potential for a 10 per cent illegal catch/blackmarket ($24 million annually) to develop. The consequences of large scale quota avoidance by the industry has not been included in the modelling results. The risks around quota enforcement need to be judged against the current background of unlicensed lobster sales (currently believed to be in the order of 200 tonnes), which will remain problematic under any system of management.
Who will own the quota and will wealth distribution change? The marketplace may view ITQs as a more secure and reliable share of the catch than pots. Therefore, if the fishery were to move to an ITQ system investors and
14
processors may show more interest in owning or leasing quota than they currently do in owning or leasing pots. However, for investors in particular, there is still a similar level of security around “quota rights” in the same way as there is around unit (pot) and boat licences, in that the Minister for Fisheries will have the authority to vary, suspend and cancel quota in a similar way as currently applies to unit (pot) and boat licences. Investors and processors would make their investment decisions based on the $ return they could receive on their ITQ compared to other investment opportunities (e.g. real estate, shares, etc). Processors may also want to hold quota to ensure a continuity of supply at particular times of the year. In other fisheries around the world, there have been mixed experiences with changes in quota ownership. Some ITQ fisheries, particularly those with large volumes and high processing/catching infrastructure costs, appear more prone to purchase by processors/corporations than other low volume high value fisheries, which appear more likely to stay in the hands of family fishing businesses. A trend towards a change in the composition of ownership of rock lobster entitlements is already apparent under the current system (investors buy unit (pot) entitlements and lease them out) and it is likely to continue. This trend may accelerate under an ITQ system for the reasons discussed. The experience in some ITQ fisheries where there has been a significant shift in the ownership of quota entitlements to investors/processors and hence in the wealth distribution, is that it has resulted in a reduced sense of stewardship towards the resource, i.e. industry takes less ownership and responsibility for sustainability of the resource.
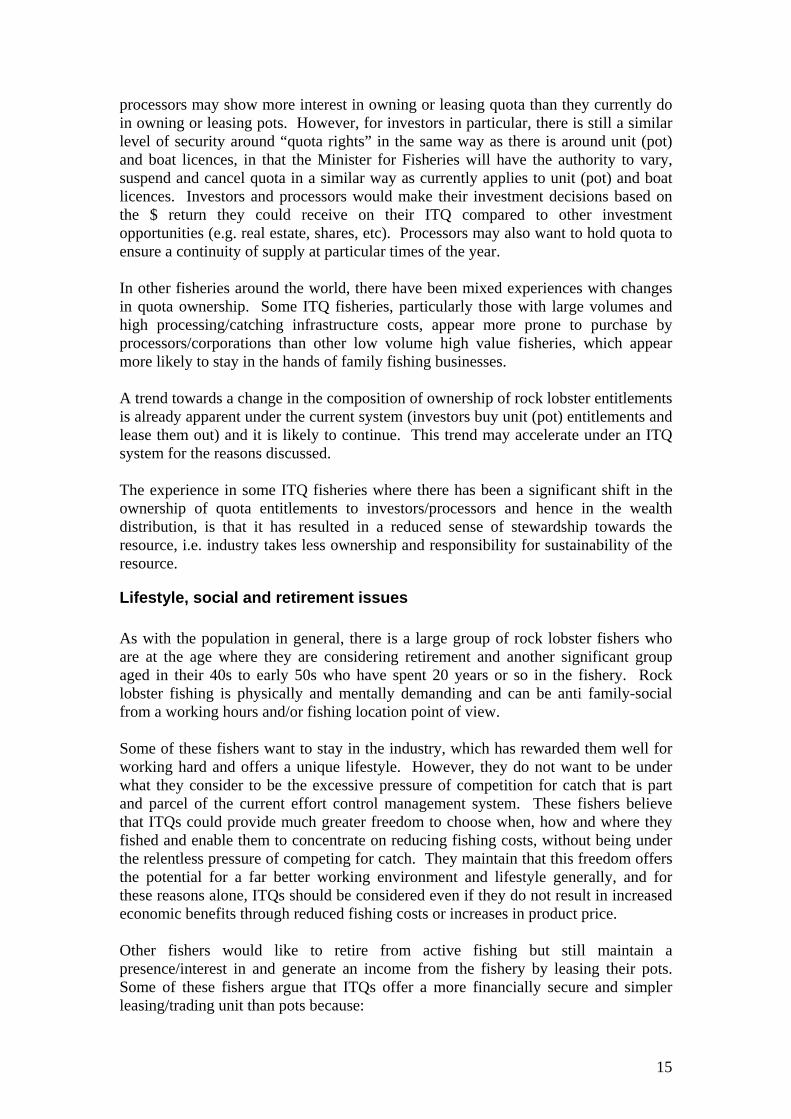
Lifestyle, social and retirement issues As with the population in general, there is a large group of rock lobster fishers who are at the age where they are considering retirement and another significant group aged in their 40s to early 50s who have spent 20 years or so in the fishery. Rock lobster fishing is physically and mentally demanding and can be anti family-social from a working hours and/or fishing location point of view. Some of these fishers want to stay in the industry, which has rewarded them well for working hard and offers a unique lifestyle. However, they do not want to be under what they consider to be the excessive pressure of competition for catch that is part and parcel of the current effort control management system. These fishers believe that ITQs could provide much greater freedom to choose when, how and where they fished and enable them to concentrate on reducing fishing costs, without being under the relentless pressure of competing for catch. They maintain that this freedom offers the potential for a far better working environment and lifestyle generally, and for these reasons alone, ITQs should be considered even if they do not result in increased economic benefits through reduced fishing costs or increases in product price. Other fishers would like to retire from active fishing but still maintain a presence/interest in and generate an income from the fishery by leasing their pots. Some of these fishers argue that ITQs offer a more financially secure and simpler leasing/trading unit than pots because:
15

o the current unit (pot) trading system is a cumbersome and indirect way of “allocating” catch;
o the catch from pots under the current system is “unpredictable”, in that it can vary significantly depending on many factors, including a fisher’s ability, competition from other fishers in his fishing location, fluctuations in recruitment, etc;
o because of the uncertainty in what a fisher’s annual catch might be (which is further exacerbated by any fluctuations in price), it is far more difficult for potential pot leasers or purchasers to undertake sound financial planning to reduce the possibility that they will overcommit themselves.
Another group of fishers has a counter view in that they believe that an important part of rock lobster fishing is the competition to be a good catcher. They also argue that competition for catch encourages and rewards young fishers/new entrants for working hard and smart to catch well, which helps them to pay off their investment loans.
Social ramifications of quotas and reductions in fishing effort The bio-economic model results and social research predicts that the implementation of ITQ systems or reductions in fishing effort (particularly by reducing pots) would cause boat numbers to decline even faster than they currently are. This could impact on:
o employment within the industry, e.g. fewer skippers and deckhands and to a lesser extent in support industries (e.g. boat building); and
o coastal communities – it is predicted that only a few of the smaller, more rock lobster dependent coastal communities would be impacted by a reduction in the size of the fleet from the current 495 (as at December 2005) to 250 – 450 as predicted for under some of the management options, particularly ITQs.
Summary of bio-economic model results - annual $ benefits
0.0010.0020.0030.0040.0050.0060.0070.0080.0090.00
100.00
Ave
rage
Ann
ual B
enef
its($
mill
ion)
Scen
ario
1Sc
enar
io1c
Scen
ario
2
Scen
ario
3aSc
enar
io3b
Scen
ario
3cSc
enar
io3d
Scen
ario
4aSc
enar
io4b
Scen
ario
4cSc
enar
io4d
Input controlled Quotas with InputsControlled
Pure ITQ
Zone A/B Zone C
16

The figure above shows the bio-economic modelling results for the average annual benefits in $ millions, for the management options that were modelled for the Western Rock Lobster Fishery. The management options, some of the main model assumptions that underpin them and their $ benefits are summarised below. This report, particularly the section Comparison Between Effort and Quota Management Systems – Results of Bio-Economic Modelling should be read so that the assumptions and limitations of the model are clearly understood.
• Input (effort) controls. The three fishing effort (pot number) control management options (Scenarios) produced the lowest benefits of the options that were modelled:
o 1 – the current system gave an estimated annual net benefit of $15.4
million o 1c – the current system with a 20 per cent pot reduction gave an
estimated annual net benefit of $16.9 million; and o 2 – a flexible effort control system where pots and fishing days could
be adjusted, the season extended to 31 August and a $2/kg increase on the average beach price gave an estimated annual net benefit of $28 million.
• Quotas with input controls. The four ITQ system options (Scenarios) with
the current effort (pot number) controls produced $ benefits that were significantly greater than the effort control options but significantly lower than the comparable “Pure” ITQ options with reduced effort (pot) controls.
o 3a – constant (fixed) ITQ with current pot number controls, a beach
price increase of $5/kg and a 15 per cent increase in the catching efficiency of pots gave an estimated annual net benefit of $61.2 million. However, there are significant sustainability risks with fixed quotas (quotas that do not vary from year to year) as described above under the section Risks associated with constant (fixed) and variable quotas, that make fixed quotas a less attractive management option.
o 3b – variable ITQ with current pot number controls, a beach price increase of $3.50/kg and a 15 per cent increase in the catching efficiency of pots gave an estimated annual net benefit of $51.6 million.
o 3c – variable ITQ with current pot number controls, a beach price increase of $2.00/kg and a 15 per cent increase in the catching efficiency of pots gave an estimated annual net benefit of $43.0 million
o 3d – variable ITQ with current pot number controls, a beach price increase of $1.00/kg and a 15 per cent increase in the catching efficiency of pots gave an estimated annual net benefit of $35.8 million.
• Pure ITQ. The four ITQ system options (Scenarios) without the current
effort (pot number) controls produced $ benefits that were significantly greater than any of the other management options. Under these options effort controls, that is controls on pot numbers, were relaxed and the number of pots was allowed to increase by 20 per cent.
17

o 4a – constant (fixed) ITQ with reduced controls on pot numbers, a beach price increase of $5.50/kg and a 40 per cent increase in the catching efficiency of pots gave an estimated annual net benefit of $87.6 million. However, there are significant sustainability risks with fixed quotas (quotas that do not vary from year to year) as described above under the section Risks associated with constant (fixed) and variable quotas, that make fixed quotas a less attractive management option.
o 4b – variable ITQ with reduced controls on pot numbers, a beach price increase of $4.00/kg and a 40 per cent increase in the catching efficiency of pots gave an estimated annual net benefit of $96.6 million.
o 4c – variable ITQ with reduced controls on pot numbers, a beach price increase of $2.50/kg and a 40 per cent increase in the catching efficiency of pots gave an estimated annual net benefit of $91.4 million.
o 4d – variable ITQ with reduced controls on pot numbers, a beach price increase of $1.25/kg and a 40 per cent increase in the catching efficiency of pots gave an estimated annual net benefit of $82.7 million.
The bio-economic modelling results indicate that overall the ITQ management systems offer greater scope for fishers to be more efficient (i.e. to reduce their costs) and for processors to maximise the value of the catch (and hence the beach price paid to fishers). However, as explained in the report the significant $ benefits that the model estimates for the ITQ options are dependent on fishers maximising the potentially large efficiency gains and processors maximising the potential market opportunities that ITQs may offer.
Planned timetable of review and decision making process A four phase consultation and decision making process will be used to decide which management system is best for the long-term management of the rock lobster industry.
Phase 1 (Jan 04 to Dec 05) Assess and compare a number of fishing effort and quota management systems.
Phase 2 (Jan 06 to Sept 06) Stakeholder discussion on the advantages and disadvantages of fishing effort and quota management systems.
Phase 3 (Oct 06 to Feb 07)
Stakeholder’s views considered and advice prepared for Government. Industry will be polled for their views. It is hoped that fishers will arrive at an industry consensus on which management option they prefer.
Phase 4 (March 07 to September 08)
Government makes its decision on which management system to use and implementation commences with the view to having it in place by 2008/09.
18

Definitions Of Terms And Abbreviations See Attachment 1 for Definitions of Terms and Abbreviations.
Introduction State Government’s Rock Lobster Management Review Initiative
In March 2002, the then Minister for Fisheries Hon. Kim Chance MLC announced, on behalf of the State Government, the response to the review of fisheries legislation in Western Australia as required by the Commonwealth Government’s National Competition Policy. This review of fisheries legislation began late in 1998. From the outset, it was clear that the National Competition Council, the body that administers competition policy at a Commonwealth level, was interested in the West Coast Rock Lobster Fishery and why the fishery was managed under an input system (effort controls), as opposed to an output system (catch controls – quotas) as is the case for other Australian lobster fisheries. Indeed, it is fair to say that the National Competition Council had an expectation that the State Government would announce a timetable under which the fishery would be moved from an input to an output (quota) management system. This was not the State Government’s position. It does not have a preconceived idea as to what is the best management system, rather it stated on the record that:
“The current input based management regime for the Western Rock Lobster Fishery will remain in place until at least December 2006 with the Department of Fisheries and the Rock Lobster Industry Advisory Committee to review and quantify any further efficiency gains from additional changes to the current regulatory regime, including the costs and risks of management failure, over the next 2-3 years”.
The process to decide on the future management system for the rock lobster fishery will not be rushed and is designed to be inclusive, open and transparent. The State Government is investing in a three-year consultation process so that at the end of it stakeholders will have been provided with all the information they need to make up their minds as to what is the best management system for the fishery. It needs to be re-emphasised that the State Government does not share the National Competition Council’s expectation that the rock lobster fishery will move to a quota management system. Rather, the Government has an expectation that the review process will identify the best long-term and strategic approach for managing the fishery within an ecologically sustainable development framework. A case for changing the management system would need to produce convincing arguments that there is a significant quantum of additional benefits7 to be realised, in an ecologically sustainable development context, under a new system of management. It may well be 7 See the Conclusions section for further discussion on this issue.
19

that the review will demonstrate that the current system is the best way to manage the fishery. The National Competition Policy provided the initial need for this review8, and its test of legislation is founded on economic principles alone. However, the pursuit of economic ideals in isolation of ecological and social values and objectives is not an appropriate basis for managing a fishery. If the review of the management system is going to produce results that are truly in the better interests of the Western Australian community, it has to have objectives that are consistent with the principles of ecologically sustainable development, which are entrenched in fisheries resource management policy in Australia. In Australia, ecologically sustainable development is widely recognised as a natural resource management philosophy that seeks to provide balance to the competing ecological, social and economic objectives associated with the utilisation of renewable natural resources such as fish stocks. In meeting the ecological management requirements set by the Commonwealth Government’s Environmental Protection and Biodiversity Conservation Act 1999 and the Marine Stewardship Council, it is reasonable to state that the “ecological leg” of ecologically sustainable development is being satisfied and will continue to be satisfied regardless of the management system employed. This being the case, the review of the management system that is currently underway is treating the need for good ecological management practices (e.g. a safe/sustainable level of breeding stock) as an essential requirement for any management system under consideration. With appropriate wording in the objective, this assumption allows the focus of the assessment to be on the economic and social components of ecologically sustainable development, which is potentially where the greatest room for improvement exists. The two management systems that will be reviewed and compared are effort control management systems, such as the current rock lobster management system and catch quota (ITQ) management systems.
Quota Allocation If the issue of quota allocation were to be left unresolved until after or late in the management review process, there would be a significant risk that the review would be sidetracked by argument and uncertainty regarding the allocation process. Therefore, to help focus the discussions on which management system offers the rock lobster industry and the Western Australian community the best long-term ecological, social and economic outcomes, the State Government has decided how individual
8 It also makes good business sense to review the current management system so that inefficiencies can be highlighted and to determine if other systems (e.g. ITQs) offer substantial additional economic benefits. The cost-price squeeze that the industry has been experiencing over recent years has brought the need for a review into sharper focus.
20
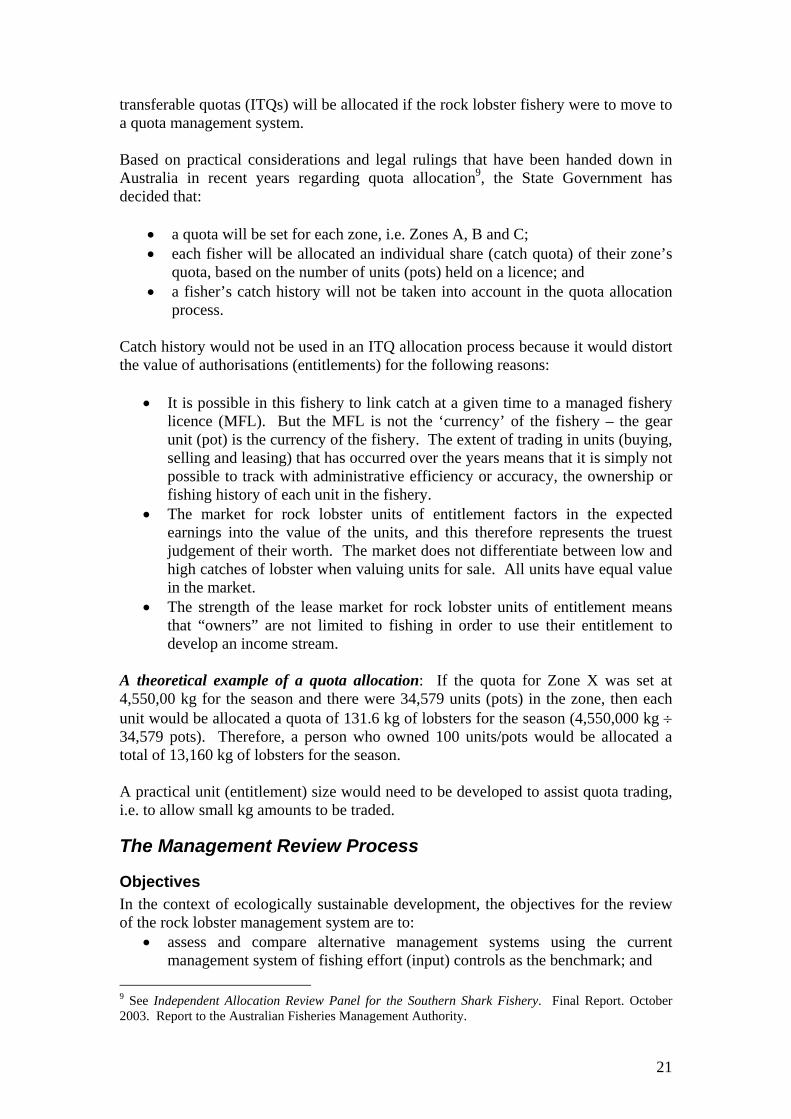
transferable quotas (ITQs) will be allocated if the rock lobster fishery were to move to a quota management system. Based on practical considerations and legal rulings that have been handed down in Australia in recent years regarding quota allocation9, the State Government has decided that:
• a quota will be set for each zone, i.e. Zones A, B and C; • each fisher will be allocated an individual share (catch quota) of their zone’s
quota, based on the number of units (pots) held on a licence; and • a fisher’s catch history will not be taken into account in the quota allocation
process. Catch history would not be used in an ITQ allocation process because it would distort the value of authorisations (entitlements) for the following reasons:
• It is possible in this fishery to link catch at a given time to a managed fishery licence (MFL). But the MFL is not the ‘currency’ of the fishery – the gear unit (pot) is the currency of the fishery. The extent of trading in units (buying, selling and leasing) that has occurred over the years means that it is simply not possible to track with administrative efficiency or accuracy, the ownership or fishing history of each unit in the fishery.
• The market for rock lobster units of entitlement factors in the expected earnings into the value of the units, and this therefore represents the truest judgement of their worth. The market does not differentiate between low and high catches of lobster when valuing units for sale. All units have equal value in the market.
• The strength of the lease market for rock lobster units of entitlement means that “owners” are not limited to fishing in order to use their entitlement to develop an income stream.
A theoretical example of a quota allocation: If the quota for Zone X was set at 4,550,00 kg for the season and there were 34,579 units (pots) in the zone, then each unit would be allocated a quota of 131.6 kg of lobsters for the season (4,550,000 kg ÷ 34,579 pots). Therefore, a person who owned 100 units/pots would be allocated a total of 13,160 kg of lobsters for the season. A practical unit (entitlement) size would need to be developed to assist quota trading, i.e. to allow small kg amounts to be traded.
The Management Review Process
Objectives In the context of ecologically sustainable development, the objectives for the review of the rock lobster management system are to:
• assess and compare alternative management systems using the current management system of fishing effort (input) controls as the benchmark; and
9 See Independent Allocation Review Panel for the Southern Shark Fishery. Final Report. October 2003. Report to the Australian Fisheries Management Authority.
21

• make a decision as to which management system offers the best long-term socio-economic return to the State of Western Australia based on:
o providing the greatest incentives and opportunity for growth in economic terms; and
o encouraging the maintenance and development of regional communities.
See Attachment 2 for further details. It is important to reiterate that the current effort control management system has served the fishery well over the years and will continue to do so in future provided managers and industry reduce fishing effort if overexploitation threatens the breeding stock. However, there is a need to assess if additional benefits (ecological, economic, social and management) can be obtained by moving to an alternative management system, while still ensuring long-term sustainability.
Proposed review timetable and consultative process See Attachment 2 for a summary table and details of the timetable and consultative process of the management review.
Phase 1 – Objective analysis of management options October 2003 to December 2005, a joint departmental and industry Steering Committee has overseen the development of four papers that assessed the relative advantages and disadvantages of the effort control and quota management systems outlined above. The papers produced were:
• Bio-Economic Modelling – Compares the economic benefits that can be realised under different fishing effort and quota management systems. The paper is titled A Bio-Economic Evaluation of Management Options for the West Coast Rock Lobster Fishery by Economic Research Associates, 2005.
• Social Research – Presents the initial findings of research on the possible social impacts of fishing effort and quota management systems, particularly on small coastal communities. The paper is titled A Social Assessment of Coastal Communities Hosting the Western Rock Lobster Fishing Fleet by the Institute for Regional Development, University of Western Australia, 2005.10
• Quota Experience in Other Fisheries – Describes the rock lobster quota management experience in South Australia, Tasmania and New Zealand. The paper is titled How do Quota Management Systems Work in Rock Lobster Fisheries? The Experience in New Zealand, Tasmania and South Australia, by Tim Bray, Steven Gill and Ron Edwards, Department of Fisheries, 2005.
• This paper – provides an overview of the management review process and findings.
Phase 2 – Communicate analysis of management scenarios with stakeholders The purpose of Phase 2 (November 2005 – September 2006) is to communicate to all stakeholders (commercial and recreational fishers, processors, conservation sector, 10 This is a three-year project funded by the Fisheries Research and Development Corporation.
22

local communities and government, etc) the results of the assessment and comparison of the different management options to empower stakeholders to arrive at their own conclusions as to which management system is best. Commencing in early February 2006, an independent facilitator will conduct a series of workshops with professional fishermen’s associations and other interested parties.
Phase 3 – RLIAC prepares advice for government In this phase (October 2006 - February 2007), RLIAC will receive submissions from stakeholders and engage with them to clarify their positions. The Western Rock Lobster Council will conduct a poll of the rock lobster fishing sector to ascertain which management system it prefers. The results will not necessarily determine RLIAC’s advice or the Government’s final position, but will make it clear to Government which management system the majority of fishers support. During RLIAC’s October 2006 coastal tour, the committee’s proposed advice to Government will be communicated to all stakeholders before it is formally presented to the Minister for Fisheries in early 2007.
Phase 4 – Government’s decision and implementation Once the Minister for Fisheries has received RLIAC’s advice he will take his position to Cabinet and a decision on the long-term management of the rock lobster fishery is likely to be made in 2007. If there is a decision to move to a new management system, it is anticipated that it would be implemented for the 2008/09 season.
Western Rock Lobster Fishery – Background This section provides a summary of the history of the regulation of the West Coast Rock Lobster Fishery and its catch and fishing effort, as background information to help readers understand how the fishery has evolved and what its current status is. The catch predictions for the next three seasons (2005/06 to 2007/08) and the main factors responsible for the current “cost-price squeeze” are also provided to give an indication of future trends.
History Of Regulation Of The Western Rock Lobster Fishery The main aims of the regulations that have been introduced in to the Western Rock Lobster Fishery have been two-fold. First and most importantly, they have been used to conserve the rock lobster stocks (particularly the breeding stock) and secondly, the limited entry rules introduced in 1963 also protected fisher’s livelihoods by restricting the number of boats (fishers) that could operate in the fishery.11
11 The fishery’s management arrangements serve a twofold purpose, in that biological and fishing effort constraints ensure sustainability of the stock (now enshrined in the Decision Rules Framework) and limited entry protects fishers’ economic interests.
23

Some of the major regulations and reductions in fishing effort/exploitation were:
• 1887 – Minimum size, initially a weight and then a carapace length. • 1899 – Protection of spawners (egg carrying females). • 1962 – Closed seasons. • 1963 – March 1963, limits on entry, boats and number of pots involving:
o the number of boats (fishers) was restricted to 836, including 45 freezer boats that were licensed to process at sea; and
o the number of pots was restricted to three per foot (0.33 meter) length of boat, with about 76,000 being in the fishery. However, a fisher could still increase his number of pots by building/purchasing a larger boat.
• 1965 – Pot numbers and boat replacement. Pot numbers were set at 76,623 and boat replacements had to match exactly the number of pots held on the licence.
• 1966 – Escape gaps introduced, one x 51 x 304 mm, increased to one x 54 x 304 mm in 1971 and processing factories required a licence.
• 1973 – Multiple necks and parlour pots banned. • 1978 – Season shorten by six weeks to 30 June. • 1979 – Boat replacement policy relaxed to give fishermen greater flexibility
when replacing their boats. It allowed between seven and 10 pots per meter of boat length.
• 1984 – Pot dimensions restricted: o maximum pot volume of 0.257 cubic meters; and o large wire traps and large batten and beehive pots restricted;
• 1986 o 5 per cent pot reduction if a boat were less than six years old when
replaced (rule not revoked until 1995). o Escape gaps increased from one to three/four x 54x304mm. o Temporary 10 per cent pot reduction for one season, from 76,623 to
68,961. • 1987-91 – Permanent 10 per cent pot reduction at two per cent per year over
five years. • 1992 (one year only)
o Summer closure (10 Jan to 9 Feb) in Zone B. o Maximum female size 115 mm. o Setose and tarspot females to be returned to the water between 15
November and 28 February. o 10 per cent pot reduction in Zone B (15 Nov-10 Jan). o Up until April 1993, boats had to nominate landing zones in Zone C.
• 1993 – Sustainability management package to address breeding stock decline. o 18 per cent pot reduction (i.e. pot usage reduced from 68,961 to
56,548). o Maximum sizes for females (105mm northern sector. and 115mm
southern sector). o An increase in the minimum size from 76 to 77mm from 15 November
to 31 January.
24

o Protection of all setose and tar spot females continued.12 • 1997 – Boat replacement rule abolished, i.e. pot numbers no longer linked to
boat length. Maximum pots per boat 150 and minimum 63. • 2003 – Abolition of the 150-pot rule, i.e. the rule that set the maximum
number of pots a boat could use. • 2005 – Sustainability management package to address breeding stock decline
(particularly in Zone B). o Zones A and B – A 26-day summer closure from 15 January to 9
February, and Sunday closures from 15 March to 30 June in Zone B, plus 10 per cent pot reductions in Zone B from 15 November to 10 February and in Zone A from 15 March to 15 April.
o Zone C – A closure from 15 to 24 November and a 3-day moon closure from 1 February to 30 June.
Catch, Effort and Boat History Catch in the Western Rock Lobster Fishery increased steadily until the late 1970s when it appeared that they had reached a maximum sustainable level (Figure 1). Fluctuations in catch over the subsequent period reflect the level of puerulus (young rock lobster) settlement, which determines the catch three to four years later. It is changing environmental conditions, particularly the strength of the Leeuwin Current that controls the level of puerulus settlement and hence catches.13
Fishing effort (the number of pot lifts) increased rapidly during the period up to 1963 as men, vessels and traps entered the open access rock lobster fishery (Figure 1). Effort declined for a few years after 1963 when the fishery became limited entry and a cap was placed on the number of boats and traps. However, it began to increase again, but not as rapidly, up until 1993, when a major sustainability management package (approximately 23 per cent effort reduction, including a 18 per cent pot reduction) was introduced to protect and rebuild the breeding stock, since then the number of pot lifts has stabilised. It must be noted, however, that the measure of fishing effort, the pot lift, does not take into account any increases in fishing efficiency (better boats and pot setting, advances in technology, etc) that have occurred since 1944-45. If increases in fishing efficiency were taken into account, the measure of effective effort would be greater. Catch rate or catch per unit of fishing effort (average weight of rock lobsters caught per pot lift) has decreased steadily from 1944-45 and in the past decade has been reasonably steady at an average of about one kilo per pot lift.14
12 For further details see Fisheries Management Paper No.55 Rock Lobster Industry Advisory Committee, Chairman's report to the Minister for Fisheries on management proposals for 1993-94 and 1994-95 western rock lobster seasons (September 1993). Department of Fisheries publication. 13 It was only in the late 1980s to early 1990s at the Abrolhos Is., that there was evidence that the breeding stock had fallen to a level that had affected the level of puerulus settlement. 14 If increases in fishing efficiency were taking into account in the catch rate calculation, it would that it has continued to decline in real terms.
25

Annual rock lobster catch and nominal fishing effort
0
2
4
6
8
10
12
14
16
44/4
548
/49
52/5
356
/57
60/6
164
/65
68/6
972
/73
76/7
780
/81
84/8
588
/89
92/9
396
/97
00/0
1
Season
Catc
h an
d fis
hing
effo
rt(m
illio
ns o
f kg
and
mill
ions
of p
ot li
fts) Catch
Effort
Figure 1: Western rock lobster catch in millions of kg and nominal fishing effort
in millions of pot lifts (unadjusted for increases in efficiency/technology).
Catch Predictions Table 1 below shows the rock lobster catches that are predicted for Zones A, B and C for the next three seasons, based on the levels of puerulus settlement that occurred three and four year previously and the expected level of fishing effort. Table 1. Catch predictions for Zones A, B and C for the three seasons 2005/06 to 2007/08 and the 10-year average catch 1995-96 to 2004-05 (the predictions do not take into account the 2005-06 management changes).
Catch predictions (tonnes) Season
Zone 2005-06 2006-07 2007-08 10 yr av. 1995-96 to 2004-05
A 1,750 1,800 1,800 1,823 B15 3500 3,600 3,600 3,571 C16 5200 4,400 4,750 6,091
Total Catch A+B+C
10450
9,800
10,150
11,488
15 Includes Big Bank (approx 100 tonnes) 16 Predictions using all puerulus collector sites in Zone C.
26

Number Of Boats In The Fishery
Boats
100
110120
130140
150160170180190
200
1988/89 1991/92 1994/95 1997/98 2000/01 2003/04
A,B
boat
s
260
270280
290300
310320330340350
360
C bo
ats
Zone A Zone B Zone C
Figure 2: Shows the decline in the number of boats taken place in the fishery since 1988.
Boat numbers have declined from 836 in 1963, when limited entry was introduced, to 495 in December 2005. The decline accelerated after the freeing up of the boat replacement rules (1979), pot reductions (1986 and 1993) and for economic reasons (particularly in 2002 and 2005). The removal in 1997 of the rule that limited the number of pots a boat could use (know as the ‘seven and 10 rule’17) and in 2003 of the maximum 150 pot/boat rule, have also played a part in the reduction in boat numbers.
Economic Issues Affecting Fishers – Cost-price Squeeze The profitability of rock lobster fishing is affected by a few key factors and the degree to which these affect profitability is influenced by environmental factors and management constraints. They are:
1 The prices received for rock lobsters • Up to $10/kg variation in price has occurred from one season to the next in
the past decade; and • Up to $15/kg variation within a season (normally $2-$5/kg).
2 Catches The quantity of rock lobsters caught can vary significantly from season to season, e.g. by up to 4,000 tonnes from one season to the next and by almost 100 per cent over a few seasons in Zone C. Catch predictions (Table 1)
17 Boats were allowed between seven and 10 pots per metre of length.
27

indicate that there will be a significant reduction in catch over the next two seasons in Zone C, while Zone A and B are predicted to remain relatively stable.
3 Fishing cost including • increases in fuel costs, which have risen significantly over the past five
years and in particular from January to September 2005, • increases in bait costs, • labour costs have been increasing steadily over the past five years and are
set to increase more rapidly in future due to the boom in Western Australia’s resource sector. Fishers are finding it difficult to attract and keep crew, particularly in the Mid-West region where there is increasing competition for labour from the mining sector.
See Attachment 3 for a more detailed discussion of the economic factors affecting the rock lobster industry’s profitability.
Accompanying Reports and Previous Reviews and Studies Three other reports have been prepared as part of this management review and it is important that they are read in conjunction with this paper.
• Bio-economic modelling A Bio-Economic Evaluation of Management Options for the West Coast Rock Lobster Fishery – compares the economic benefits that can be realised under different fishing effort and quota management systems.
• Social impact study A Social Assessment of Coastal Communities Hosting the Western Rock Lobster Fishing Fleet – presents results of research on the possible social impacts of fishing effort and quota management systems, particularly on small coastal communities.
• Quota experience in other rock lobster fisheries How do Quota Management Systems Work in Rock Lobster Fisheries? The Experience in New Zealand, Tasmania and South Australia – describes the rock lobster quota management experience in South Australia, Tasmania and New Zealand.
Previous rock lobster management reviews and associated studies that are recommended reading are listed in Attachment 4. Of particular interest are the four volumes produced in 1994 that compared fishing effort and quota management systems in relation to the West Coast Rock Lobster Fishery and the Food and Agricultural Organisation’s (FAO) review papers on fishing effort and quota management.
• Bowen, B. 1994, ‘Long-term Management Strategies for the Western Rock Lobster Fishery’, in Volume 1, Fisheries Management Paper No. 67, Fisheries Department of WA.
• Lindner, B. 1994, ‘Economic efficiency of alternative input and output based management systems in the Western Rock Lobster Fishery’, in Volume 2, Fisheries Management Paper No. 68, Dept of Fisheries of WA.
28

• Marec Pty, 1994, ‘Long-term Management Strategies for the Western Rock Lobster Fishery. A Market-based Economic Assessment for the Western Rock Lobster Industry’, in Volume 3, Fisheries Management Paper No.69.
• McLaughlan, N. 1994, ‘Long-term Management Strategies for the Western Rock Lobster Fishery. Law Enforcement Considerations.’ in Volume 4, Fisheries Management Paper No. 70.
• Shotton, R. 2001, Case Studies on the Allocation of Transferable Quota Rights in Fisheries, Food and Agricultural Organisation, Fisheries Technical Report No. 411, p373.
• Shotton, R. 2001, Case Studies on the Effect of Transferable Fishing Fights on Fleet Capacity and Concentration of Quota Ownership, Food and Agricultural Organisation, Fisheries Technical Report No. 412, p246.
NOTE: To aid the current discussion on management options, the documents listed above plus this paper, have been made available on the Department of Fisheries’ web site at www.fish.wa.gov.au and the Western Rock Lobster Council’s web site at www.rocklobsterwa.com and are available in hard copy by phoning the Department of Fisheries on 9482 7267.
Objective of Fishing Effort and Quota Management Catch quota (output control) management systems can appear to be radically different compared to fishing effort (input control) systems, like the rock lobster management system. However, from a stock sustainability point of view they are used to achieve exactly the same result. The objective of both quota and effort management systems is to ensure the long-term sustainability of the rock lobster stock and fishery by taking into account:
• biological (e.g. protecting the breeding stock)18; • economic; and • social factors.
Fishing effort and quota management systems achieve their objective by controlling the level of exploitation19, that is, they limit the catch of rock lobsters that can be taken each season. Moving from fishing effort to quota management does not change the fact that the primary aim of any fishery management system will be to keep the rock lobster stock at a sustainable level by limiting the catch that fishers can take.
18 And also maintaining the ecological stability of the marine environment in which rock lobsters live, in particular by ensuring an appropriate abundance (density) of legal size lobster are present on the fishing grounds (particularly in deeper water). 19 Exploitation, often referred to as exploitation rate, refers to the number or weight (kg) of fish, in this case rock lobsters that are caught each season from what is available on the fishing grounds.
29

Comparing Effort and Quota Management Options – Key Issues and Benefits This section summarises and compares some of the key issues, benefits and costs of the fishing effort and quota management systems that have been assessed in the review of the Western Rock Lobster Fishery. It also includes a discussion on how the different options would be implemented and what type of legislation, enforcement and research would be required to ensure they were managed successfully and sustainably. No matter what management system is used for the rock lobster fishery, it will be necessary to retain the current breeding stock decision rules framework (a working document) that clearly sets out the trigger points for taking management action to ensure a safe level of breeding stock. Attachment 5 provides a summary of the management arrangements and assumptions, such as price premiums and increases in pot efficiency that have been used in the bio-economic modelling and social research that has been undertaken for this review.
Management Systems Assessed Below are the management systems that have been modelled, assessed and compared.
1. Current fishing effort control system – individual transferable effort (ITE) The system we have today is individual transferable effort (ITE). To ascertain if the current system could produce benefits similar to the modified more flexible effort control and quota management systems, a hypothetical effort (pot) reduction scenario of 20 per cent phased in at 2 per cent per year over 10 years was also examined.
2. Modified more flexible individual transferable effort (ITE) system Total fishing time and effort would be set for each zone at the start of the season. Each fisher would be allocated a share or “quota” of the total fishing time and fishing effort for his zone and would have the flexibility to use it when he wanted during the season. A longer season to 31 August would apply.
3. Individual transferable quota (ITQ) system with effort controls A system whereby a catch quota would be set for each zone and each unit (pot) would be allocated a share of the zone quota. Fishing effort (pot numbers) controls would remain and a longer season to 31 August would apply. If it were decided to move to an ITQ system, it would initially retain all the current effort controls, which could gradually be relaxed over time to produce greater benefits as the new system stabilised. Pot catching efficiency was increased by 15 per cent through changes in pot design.
30
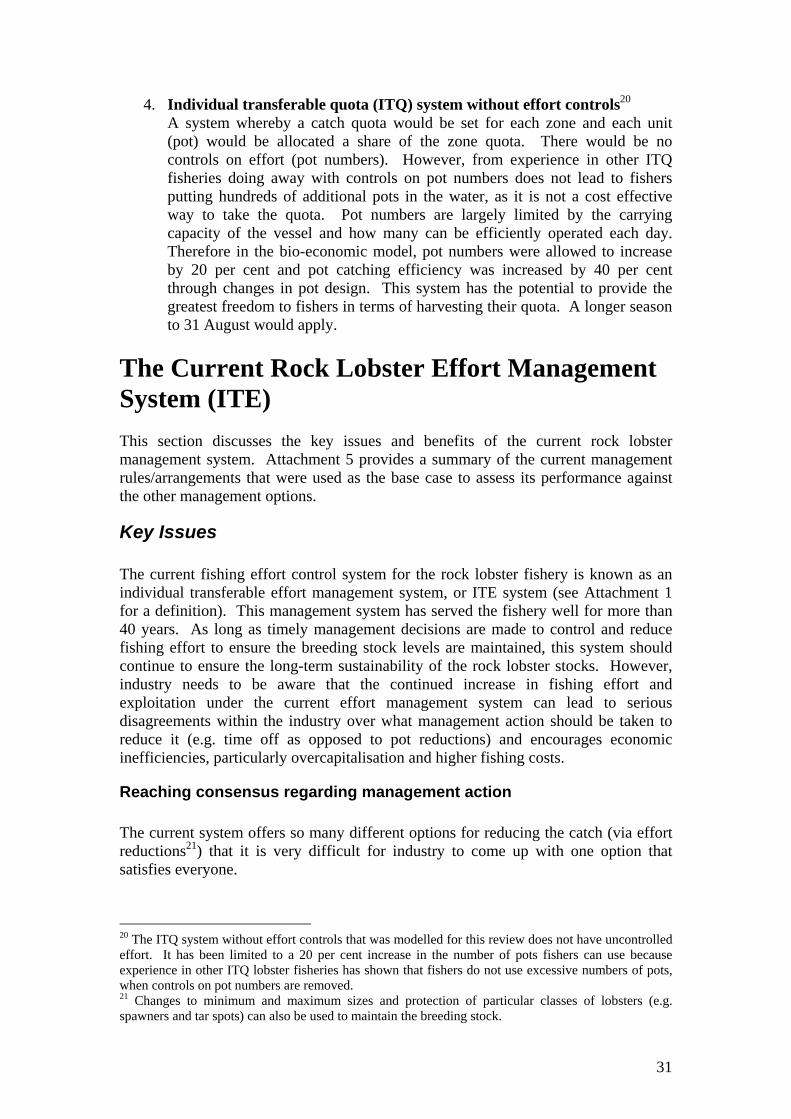
4. Individual transferable quota (ITQ) system without effort controls20 A system whereby a catch quota would be set for each zone and each unit (pot) would be allocated a share of the zone quota. There would be no controls on effort (pot numbers). However, from experience in other ITQ fisheries doing away with controls on pot numbers does not lead to fishers putting hundreds of additional pots in the water, as it is not a cost effective way to take the quota. Pot numbers are largely limited by the carrying capacity of the vessel and how many can be efficiently operated each day. Therefore in the bio-economic model, pot numbers were allowed to increase by 20 per cent and pot catching efficiency was increased by 40 per cent through changes in pot design. This system has the potential to provide the greatest freedom to fishers in terms of harvesting their quota. A longer season to 31 August would apply.
The Current Rock Lobster Effort Management System (ITE) This section discusses the key issues and benefits of the current rock lobster management system. Attachment 5 provides a summary of the current management rules/arrangements that were used as the base case to assess its performance against the other management options.
Key Issues The current fishing effort control system for the rock lobster fishery is known as an individual transferable effort management system, or ITE system (see Attachment 1 for a definition). This management system has served the fishery well for more than 40 years. As long as timely management decisions are made to control and reduce fishing effort to ensure the breeding stock levels are maintained, this system should continue to ensure the long-term sustainability of the rock lobster stocks. However, industry needs to be aware that the continued increase in fishing effort and exploitation under the current effort management system can lead to serious disagreements within the industry over what management action should be taken to reduce it (e.g. time off as opposed to pot reductions) and encourages economic inefficiencies, particularly overcapitalisation and higher fishing costs.
Reaching consensus regarding management action The current system offers so many different options for reducing the catch (via effort reductions21) that it is very difficult for industry to come up with one option that satisfies everyone.
20 The ITQ system without effort controls that was modelled for this review does not have uncontrolled effort. It has been limited to a 20 per cent increase in the number of pots fishers can use because experience in other ITQ lobster fisheries has shown that fishers do not use excessive numbers of pots, when controls on pot numbers are removed. 21 Changes to minimum and maximum sizes and protection of particular classes of lobsters (e.g. spawners and tar spots) can also be used to maintain the breeding stock.
31

There is divergence of opinion within industry because different effort reduction options – for example, time period closures and pot reductions – can potentially have very different impacts on a fisher’s catch. These differences split the industry and make it very difficult for it to present the unified front that is necessary for it to be able to work in a corporate partnership manner with the Government and other stakeholders to resolve sustainability issues. Under a quota management system, this is less of a problem, as the only option that can be used to protect the stock is to reduce the catch, i.e. reduce each fishers’ ITQ. It could be argued that a reduction in individual quotas is more equitable than an effort reduction (for instance, reducing pots or closing a particular time of the season), as each fisher bears the burden of the reduction in direct proportion to the size of the quota. This could avoid the equity arguments that arise with effort reductions, e.g. that they affect small boat/unit holders more than large holders, or shallow water fishers more than deepwater fishers, or Abrolhos boats more than coastal boats. Under ITQs, the debate focuses on the pivotal issue: “How many kilos does the quota need be reduced by to protect the breeding stock?”.
Risk to the breeding stock and ecology Breeding stock Under the current management system, which has a decision rules framework to deal with the issue of breeding stock levels, there is little risk of overfishing the breeding stock to the point where it would affect subsequent puerulus settlement, provided timely fishing effort reduction initiatives were implemented if levels began to decline. Ecology Some fisheries scientists are concerned that the current level of exploitation may have reduced the number or density of legal size lobsters to such low levels that it may begin to have an impact on the general ecology in which the rock lobster lives (i.e. the interactions rock lobsters have with other organisms). This is particularly true for populations of large lobsters in deeper water. It is difficult to evaluate if ITQs would offer a better system to deal with ecological issues than the current system. The most important factor regardless of whether it is an effort or quota management system is the commitment of industry, managers and the State Government to resolve ecological issues if and when they arise.
Competition between fishers – fishing “harder” and “smarter” Under an effort control management system, the exploitation of the stock – the number of lobsters caught each season from what is available on the fishing grounds – gradually increases due to intense competition between fishers (pots) to maximise their share of the catch. High levels of competition are always generated in effort control fisheries and it is referred to as the “rush to fish”. Competition encourages fishers to fish “harder” (e.g. by fishing more days, taking more time or risks to set pots, travelling longer distances to fish the higher catch rate hot spots and “big runs”, using more bait, etc) and “smarter” (e.g. by using technological advances such as larger and faster boats, GPS, colour sounders, computers, etc) and hence the
32
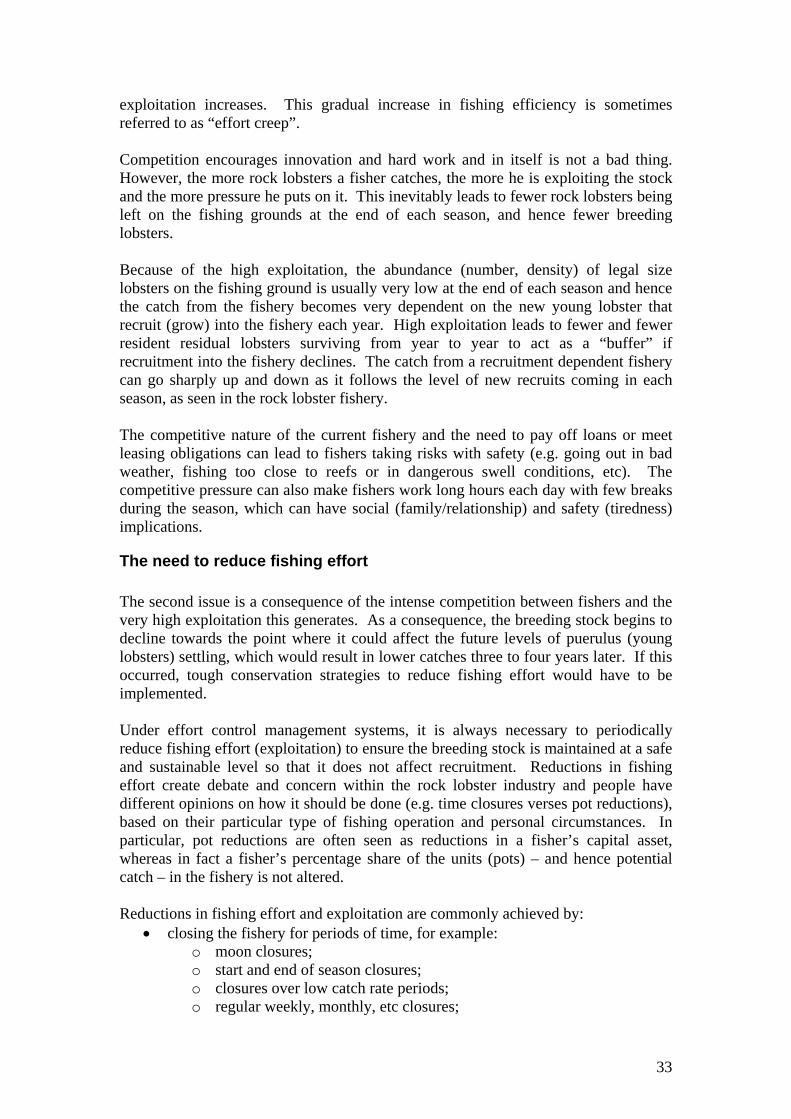
exploitation increases. This gradual increase in fishing efficiency is sometimes referred to as “effort creep”. Competition encourages innovation and hard work and in itself is not a bad thing. However, the more rock lobsters a fisher catches, the more he is exploiting the stock and the more pressure he puts on it. This inevitably leads to fewer rock lobsters being left on the fishing grounds at the end of each season, and hence fewer breeding lobsters. Because of the high exploitation, the abundance (number, density) of legal size lobsters on the fishing ground is usually very low at the end of each season and hence the catch from the fishery becomes very dependent on the new young lobster that recruit (grow) into the fishery each year. High exploitation leads to fewer and fewer resident residual lobsters surviving from year to year to act as a “buffer” if recruitment into the fishery declines. The catch from a recruitment dependent fishery can go sharply up and down as it follows the level of new recruits coming in each season, as seen in the rock lobster fishery. The competitive nature of the current fishery and the need to pay off loans or meet leasing obligations can lead to fishers taking risks with safety (e.g. going out in bad weather, fishing too close to reefs or in dangerous swell conditions, etc). The competitive pressure can also make fishers work long hours each day with few breaks during the season, which can have social (family/relationship) and safety (tiredness) implications.
The need to reduce fishing effort The second issue is a consequence of the intense competition between fishers and the very high exploitation this generates. As a consequence, the breeding stock begins to decline towards the point where it could affect the future levels of puerulus (young lobsters) settling, which would result in lower catches three to four years later. If this occurred, tough conservation strategies to reduce fishing effort would have to be implemented. Under effort control management systems, it is always necessary to periodically reduce fishing effort (exploitation) to ensure the breeding stock is maintained at a safe and sustainable level so that it does not affect recruitment. Reductions in fishing effort create debate and concern within the rock lobster industry and people have different opinions on how it should be done (e.g. time closures verses pot reductions), based on their particular type of fishing operation and personal circumstances. In particular, pot reductions are often seen as reductions in a fisher’s capital asset, whereas in fact a fisher’s percentage share of the units (pots) – and hence potential catch – in the fishery is not altered. Reductions in fishing effort and exploitation are commonly achieved by:
• closing the fishery for periods of time, for example: o moon closures; o start and end of season closures; o closures over low catch rate periods; o regular weekly, monthly, etc closures;
33

o closing areas of the fishery for specific times (e.g. the Abrolhos Is.); • reducing pot numbers (i.e. over the whole season or during particular periods,
or for example, the whites or reds); • restrictions on pot designs to make them less efficient (e.g. size and shape of
pots, one neck, etc); • increasing the minimum legal size; and • decreasing the maximum female legal size (there could also be one for males).
Fishing effort in the rock lobster fishery would have to be significantly reduced to reach the point where competition between fishers (pots) was reduced to the same extent as could potentially occur under ITQs. However, even at this much lower level of effort, fishing efficiency under the current management system would increase through advances in technology and increases in an individual fisher’s experience and expertise (i.e. fishers would still fish “smarter”).
Competition leads to over capitalisation and increased fishing costs Competition between fishers for a share of the catch results in individual fisher’s (and hence the fleet) overcapitalising their fishing operations. In the fully exploited Western Rock Lobster Fishery, the only way a fisher can consistently catch more than those fishing around him, is to fish “harder” and “smarter” than they do. Therefore, fishers invest a lot of money in heavier baiting, larger and faster boats (which cost more to purchase and operate) and the latest technology to try and maintain or increase their share of the catch. For example, if one fisher purchases a new technology or is baiting more heavily and he catches more than those fishing around him, then to maintain their share of the catch, the other fishers have to buy the same or equivalent technology or use more bait, or both. If they don’t, they will lose some of their potential catch to the more competitive fisher. Extra expenditure required to maintain catch forces the overall cost of fishing to increase and net profits from the catch to decline. Due to the competitive nature of the rock lobster fishery under the current effort control management system, it is not easy for fishers to reduce their fishing costs and still maximise their share of the catch. For example, if a fisher decided to trade in his large vessel for a smaller more economic vessel, but he could not carry all his pots in one load, he would not be able to respond as quickly as other fishers to changes in catch rates in other areas of the fishery. That is, the fisher’s ability to keep up with and compete with the mobile fleet would be reduced and his share of the catch would decline. Another example would be if a fisher decided to reduce costs by using less bait than those fishing nearby. His pots would be out-competed and his share of the catch would also decline. In both of these examples, the reduction in catch would be offset to some degree by a reduction in fishing costs. If under the current management system, fishing effort could be reduced to the point where there was little competition between fishers (pots) for the available catch, it would encourage fishers to reduce their fishing costs – for example, by using less bait and fuel (less travel), and replacing large boats with smaller more economic ones. A large reduction in fishing effort would be likely to accelerate the rate of decline in the number of boats in the fishery, unless a counter measure (incentive) was introduced.
34

It is important to note that time closures (e.g. shortened seasons, moon closures and days off) can reduce fishing costs and help protect the breeding stock, but they do not reduce competition between fishers. In fact, they can increase competition, as there is an even shorter period of time for each fisher to take a share of the catch.
Benefits of the Current Management System
It’s a familiar management system One of the major benefits of the current effort management system, which should not be underestimated, is that it is familiar to all fishers. They have grown up with it over the years and seen it evolve from a simple set of rules to the much more complex set of management arrangements it is today. Generally, fishers know how changes in the current system will affect them and there is a substantial body of experience and knowledge amongst fishers themselves, processors, marketers, accountants, boat and pot brokers, banks, insurance companies and other institutions to help them adapt their businesses to any management changes that occur under this system. Effort control is also the management system that fisheries manager, researchers, enforcement and legal officers and governments have dealt with over the past 40 years. They feel reasonably certain of being able to predict the results of any management changes that are made to the fishery and how they might impact on rock lobster stocks and the fishery generally.
Research There is a wealth of research data and information that has been painstakingly built up over the last 60 years, which makes the rock lobster itself and the fishery one of the most studied and best understood in the world. A significant aspect of this understanding is how the catch rate (catch per pot lift) of lobsters relates to their abundance on the fishing grounds. The catch rate to abundance relationship is based on understanding the catching efficiency or fishing power of the “standard” pot types (batten and beehive). If the management system is changed, for example to an ITQ system and pot numbers and design are to allowed vary, it would require additional fishery independent monitoring and modelling to ensure estimates of abundance (especially of the breeding stock) remained accurate. The cost of the additional research for ITQs is estimated to be approximately $1.1 million per year on top of the current research budget, which would have to be met through cost recovery. The additional costs have been included in the bio-economic modelling.
Enforcement The current fishing effort enforcement system has been developed over a long period of time and it monitors the main areas of illegal activities such as over-potting, consigning undersize and prohibited females, and boundary violations. The Department’s compliance program delivers very cost effective enforcement outcomes and the great majority of industry has confidence in the system. Enforcement under the current system depends on reasonably straightforward observations of illegal
35

activities, such as pot counts and inspecting and measuring lobsters at processing factories. If a decision were made to move to a quota management system, the enforcement emphasis would have to shift significantly to reflect the fact that the most important aspect from a sustainability and fisher equity perspective would be to ensure that individual quotas were not exceeded. A slippage of just 1 per cent to the black market would cost the industry about $2.5 million annually and a 5 per cent slippage would cost more than $12 million. Additional enforcement expertise would be required to monitor the quota electronic/paper trail and investigate fraud, especially collusion between fishers and processors. Also, investigation procedures would be far more intrusive in relation to fishers and processors financial affairs than they currently are. It is estimated that there would be a one-off enforcement/management cost of about $1 million to set up an ITQ system and an additional ongoing enforcement/management cost of about $2.5 million annually22, which would be cost recovered.23 The additional costs have been included in the bio-economic modelling.
Effort control systems “reward” more competitive fishers Under the effort control management system used in the rock lobster fishery, half the fishers catch more on average (sometimes a lot more) than the other half, despite the fact that they may fish the same general area and have very similar fishing operations (boat type, number of pots, bait, GPS, sounders, etc). Effort control systems “reward”, with additional catch, fishers who fish “harder” and “smarter”. This can be seen as an advantage of an effort control system in that it rewards hard work, skill, knowledge and innovation. However, it is also its Achilles heel, because at the same time it encourages increases in fishing effort and hence exploitation, which can lead to the need to implement conservation (effort reduction) measures. 2003-04 Annual catch (kg) per pot per year Minimum24 Average Maximum Zone A less than 100 210 350+ Zone B about 100 175 350+ Zone C less than 150 277 420+ The above table provides an indication of the large variation in annual catch (kg) per pot per year for the three zones of the fishery for the 2003-04 season. Some fishers catch more than twice the annual catch (kg) per pot per year of other fishers.
22 This could vary depending on the type of ITQ system that was finally adopted. 23 See report ‘How do Quota Management Systems work in Rock Lobster Fisheries?’ for further discussion on enforcement implications and cost under quota systems at www.fish.wa.gov.au or www.rocklobsterwa.com 24 Note the low minimum values are significantly affected by the low number of days fished recorded by some fishers.
36

Implementation and Costs For the purposes of the review and the bio-economic modelling, the current management system has remained unchanged to what it was in 2004-05, so that it could be compared against the other management options. However, it was decided prior to the review that a unit register would be developed to aid in the identification of unit holders and unit transfers. In addition, since the review commenced, industry and management have been discussing the possibility of installing Vessel Monitoring Systems (VMS) on all boats in the fleet. These are additional costs, which will be covered by cost recovery or individual boat owners. These cost would be the same for all the management options reviewed.
Modelling the Current Effort Control System It is recommended that the full economic modelling report A Bio-Economic Evaluation of the Management Options for the West Coast Rock Lobster Fishery, by consultants Economic Research Associates be read in conjunction with this summary. It is available at www.fish.wa.gov.au or www.rocklobsterwa.com The main assumptions and management arrangements used to model the current management system were:
• there is a strong “rush to fish”, i.e. to catch as much as possible; • no increase in pot efficiency; • effort creep/increases in fishing efficiency is 1 per cent per year;25 • boat numbers decline at 1 per cent per year; • no increase in season (15 Nov to 30 June); and • no price increases.
See Attachment 5 (Tables A and B) for further details of management rules and model assumptions for each management option reviewed. The following is a brief summary of the results of modelling the current management system over a 10-year period.
• The average increase in net benefit to the fishery under the current management arrangements was estimated to be $15.4 million. This is the “base” value against which the other management options are compared. It is significantly less than the net benefits estimated for the ITQ systems.
• Boat numbers were reduced from 549 to 505 (total 44), i.e. it is about the historic rate of boat decline.
• Catch was slightly higher and nominal fishing effort was at least 19 per cent higher compared to the other management options.
25 Efficiency gains due to “effort creep” come about through technology and other changes that improve fishing (catching) efficiency.
37

Could the Current Effort Control System Deliver Similar Benefits Compared to ITQs? There are a number of ways the current management system could deliver some of the benefits that economic modelling has predicted for ITQ systems that would help ease the “cost-price squeeze” being experienced by industry today. In general, however, the benefits from effort reductions (closures and/or pot reductions) and increases in pot catching efficiency under the current management system would not be expected to be as large as those predicted for the ITQ systems. This is because effort control systems (like the current system) encourage catch competition between fishers, which would not allow the maximum potential benefits of increasing efficiency (reducing fishing costs) to be fully realised. Having said this, there would still be merit in exploring the potential benefits that may be obtained by making the current system more efficient.
Increasing the catching efficiency of pots With a little more flexibility in the current system, fishers could be allowed to develop more efficient pots. For example, they could be larger, have multiple necks, side entrances, and parlours to stop escapement. In particular, more efficient pots could be used effectively over two- and three-day pulls and so on during high catch rate periods (e.g. the whites). This might however, further exacerbate the current catch peaks. Fewer, but more efficient, pots could result in greater net profits for a fisher due to:
• savings on pot costs, bait and fuel; and • allowing the use of smaller, more economic boats.
Extending the fishing season If processors and the marketers could demonstrate that there were substantial economic benefits to be gained by extending the current season into the winter and spring months (July to October), it could be accommodated under the current management system. However, a reduction in fishing effort (for example, the number of pots used or closures) would be necessary during other times of the season (e.g. the whites when catch volumes are very high and $ returns/kg to fishers can be at their lowest) to compensate for the extra effort during the extended season.26
Closures during low catch periods Closures during low catch periods at the beginning and end of the season, between the whites and reds and over the full moon, would enhance the rock lobster fleet’s overall economic performance. However, within season closures of any significant length of time could impact on some markets.
26 It was not possible to estimate with complete accuracy factors influencing prices, noting that most of the price variation is driven by exchange rates, supply from other sources, cold storage holdings throughout the world, etc and it is difficult to separate them from other market influences.
38
Pot reductions Pot reductions can produce economic efficiencies by reducing the amount of fishing gear that needs to be operated. Fewer pots can mean:
• less bait used; • less fuel used to set and retrieve pots; and • potentially smaller, more economic boats could be used.
Based on pervious experience, a reduction in pots would also increase demand for and the value of units (pot) entitlements and could to some degree accelerate the rate at which boats redistributed (sold) their units (pots) and left the fishery. For example a significant pot reduction in the order of 20 per cent over 10 years could help drive further fleet rationalisation and result in a fleet of around 400 to 450 boats. However as seen in Figure 2 boats are already leaving the industry at a fairly rapid rate.27 It is argued on purely economic grounds that a smaller fleet would be more efficient and thereby produce considerable economic benefits for the industry as a whole.
Possible consequences of staying with the current management system If fishing efficiency continues to increase under the current system, further effort reductions will be needed to protect the breeding stock. Effort reductions could be in the form of fewer fishing days (e.g. moon closures) or pot reductions or both. It is likely that in all cases effort reductions would lead to further reductions in the number of vessels and a larger number of pots per boat (and possibly larger boats). In the bio-economic model, the reduction in boats for the current system is factored in at 1 per cent per year. In reality, this could be significantly higher (e.g. due to the “cost-price squeeze”) and therefore the model could be underestimating the reduction in boat numbers that may occur.
Modelling a 20 per cent Pot Reduction It is recommended that the full economic modelling report A Bio-Economic Evaluation of the Management Options for the West Coast Rock Lobster Fishery, by consultants Economic Research Associates be read in conjunction with this summary. It is available at www.fish.wa.gov.au or www.rocklobsterwa.com The main assumptions and management arrangements used to model the 20 per cent pot reduction were:
• there is a “rush to fish”; • extra cost (above normal costs) of fishing for the season $5,000;28 • efficiency of pots increased by 10 per cent. • effort creep/increases in fishing efficiency is two per cent per year; • boat numbers decline at 1.5 per cent per year;
27 Boat numbers have declined from 549 to 495 (down 54) from December 2004 to December 2005. 28 The extra costs are due to fishers working their remaining gear harder, e.g. taking more time/care to set pots, using more bait, etc).
39
• no increase in season (15 Nov to 30 June); and • no price increases.
See Attachment 5 for further details of management rules and model assumptions for each management option reviewed. The following is a brief summary of the results of modelling a 20 per cent pot reduction at two per cent per year over 10 years.
• The average net benefit to the fishery was estimated to be $16.9 million, only $1.5 million above the net benefit produced by the current management system with no pot reduction. It is also significantly less than the net benefits estimated for the ITQ systems.
• Boat numbers were reduced from 549 to 480 (total 69), which is 25 more than the model estimated would leave the fishery under the current management system with no pot reduction.
A Modified, More Flexible Effort Control System This section discusses the key issues and potential benefits of moving to a modified, more flexible individual transferable effort (ITE) control management system and it briefly compares the economic modelling results of this system with the other management options that were modelled for this review. The current system could be modified to allow fishers greater operating flexibility, while at the same time meeting the ecologically sustainable development requirements for the stock. However, to gain the potential economic benefits this ITE system could offer, would require fishers to accept that fishing effort (i.e. the number of pots they could fish and the number of days they could go fishing) may be varied up or down each (or every second or third) season according to:
• the catch predictions; • fishery sustainability issues, such as breeding stock levels; • ecological issues, e.g. legal size abundance levels; • economic factors, such as levels of supply, market demand and prices; and • social considerations.
This system would retain the current competitive nature of the fishery (the “rush to fish”) and it would be a more complex system to administer and manage than the current system.
How a Flexible ITE System Would Work A flexible ITE system would work in a similar way to ITQs, except it would be the level of fishing effort (pot numbers and fishing days) that would be varied rather than the level of catch. Fishers would have a fixed number of days they could fish over an
40

extended season (e.g. November to August) and it would be up to each individual to decide how to use his fishing days. An ITE Committee would need to be established and it would recommend to the Minister for Fisheries the appropriate level of fishing effort each season (or for a number of seasons). Effort levels could be set up to three seasons in advance based on catch predictions, and the other considerations listed above. The ITE Committee would review the available information each year and set the appropriate level of effort to take the available sustainable catch. The simplest and most direct way to set fishing effort levels would be to vary the number of pots and days that could be fished each season. The ITE Committee could also recommend closing the fishery during low catch periods (e.g. for five days over the full moon) or to reduce fishing effort during the peaks of the whites and reds to help smooth the flow of product and increase the value of the catch and hence the beach price paid to fishers.
A hypothetical example of a flexible ITE system Zone X has 30,000 unit (pot) entitlements and a season that runs from 15 November to 31 August (289 days). If the catch predicted for Zone X was 4.5 million kg and the ITE Committee could, after taking breeding stock levels and other ecological and economic factors into consideration, set the level of fishing effort for the season at 4,100,000 pot lifts over 185 days29. Therefore, the combination of 30,000 unit entitlements and 185 fishing days would have to equal 4,100,000 pot lifts and the quation to calculate the value of each unit of entitlement would be: e
4,100,000 (pot lifts) ÷ [185 (days) x 30,000 (units)] = 0.72
To calculate the number of pots a fisher could use, the fisher would multiply the number of units owned by 0.72. For example, a fisher with 110 units would be able to use 79 pots (110 x 0.72 = 79). Note: A number of different combinations of pots used and days fished would have given the same level of fishing effort, i.e. total number of pot lifts for the season (4,100,000).
Key Issues Most of the key issues and benefits of a more flexible ITE system are the same as those discussed above under the section Current Rock Lobster Effort Management System (ITE), therefore they will not be repeated here. However, the additional complexity of this system compared to the current system needs to be acknowledged and fishers would have to accept that their fishing effort would be varied each season (or possibly every second or third season), i.e. number of pots to used and number of days fishing.
Benefits An additional benefit of this system compared to the current system, is that it enables fishing effort to be controlled through a flexible system of limits on pot usage and 29 The average number of days currently fished per season.
41
days fished, which are fully transferable between seasons. And, once the system “matured”, could be transferable within season. This would allow fishers to trade in ITEs to increase or decrease their potential catch and to take their catch at the most profitable time (i.e. depending on rock lobster catchability, abundance and price/kg). It would also encourage fishers to use more multiple day pulls, particularly during the lower catch rate periods of the season.
Implementation and Costs A modified, more flexible ITE system could be implemented through the current management licensing systems with some additional modifications and costs. A unit (pot) register would be necessary to keep track of unit trading and management and enforcement software and hardware would need to be modified and updated to enable it to interface with the new system in “real time”. In addition, all vessels would have to be fitted with Vessel Monitoring Systems (VMS). These management requirements and additional costs would be the same for all the management options reviewed.
Assumptions and limitations of the modelling It needs to be emphasised that due to the complexity of this management option, the bio-economic model used a much simpler version of the system than described in the section How A Flexible ITE System Would Work above. In the simplified model version, effort levels were not set based on the catch predictions or breeding stock levels. Instead, the number of fishing days for each year was held constant at 185, and there was no variation in the number of pots that could be used. This means there is significantly less flexibility in the modelled system than there would be in practice and hence the opportunity for the industry to increase efficiencies (e.g. reduce capital and operating costs) could be significantly underestimated in the model outputs. Therefore, the average annual net benefits could also be significantly greater for this option than the model estimates.
A CATCH QUOTA SYSTEM (ITQs) This section discusses the key issues and potential benefits of moving to an individual transferable quota (ITQ) management system. Two ITQ systems – one with the current effort (pot number) controls and one without30 (significantly fewer) fishing effort controls – are assessed, and the bio-economic modelling results from both systems are compared with the other management options that were modelled for this review. Also discussed are the use of constant, variable and competitive quotas and quotas for the whites and reds periods of the rock lobster fishery.
30 The ITQ system without effort controls that was modelled for this review does not have uncontrolled effort. It has been limited to a 20 per cent increase in the number of pots fishers can use because experience in other ITQ lobster fisheries has shown that fishers do not use excessive numbers of pots, when controls on pot numbers are removed.
42

Key Issues
Risks associated with constant (fixed), variable and competitive quotas If it was decided to move to an ITQ system, there are two ways of setting the quota:
• a constant quota which does not vary from year to year (i.e. it could be set for five, 10, or more years at a time), or
• a variable quota based on catch predictions, which would vary each year. Modelling has shown that the annual $ benefits of a constant quota are greater than for a variable quota system. However, there is a far greater risk of depleting the breeding stock under a constant quota (particularly during low recruitment years), unless it is set at a very conservative level,31 which significantly reduces the $ benefits. Therefore, from a sustainability and economic perspective, the use of a constant quota from year to year would be difficult to justify. So while a constant quota has been modelled and reported on as part of this review, it is not considered a viable or practicable management option. Therefore, variable quotas would be the basis of any ITQ system for the Western Rock Lobster Fishery. Variable quotas would be set annually based on the catch predictions for the season (using puerulus settlement) and would take into account the level of breeding stock, ecological factors, quota cheating, etc. Variable quotas would go up and down annually in response to the predicted level of catch. The use of a competitive Total Allowable Commercial Catch quota (TACC), i.e. where a total quota is set for the commercial fishery and fishers compete for their share of the catch (with either limited or unlimited pots), was not considered a viable alternative management option. Experience around the world has shown that competitive quotas combine the worst aspects of both quota and effort control systems and they are the most unpredictable regarding their impact on long-term sustainability (e.g. breeding stock levels). Therefore, this review has focused on ITQs.
Quota allocation The State Government has stated that if it were decided that the rock lobster fishery should move to an ITQ management system:
• the catch would be allocated on the basis of the number of units (pots) a person owned;
• a fisher’s catch history would not be taken into account; • a quota would be set for each zone of the fishery (A, B and C); and • each fisher’s share of the zone quota would be calculated on the number of
units (pots) he owned. Catch history would not be used in an ITQ allocation process because it would distort the value of authorisations (entitlements) for the following reasons:
31 possibly as low as 9 to 9,500 tonnes/year
43

• It is possible in this fishery to link catch at a given time to a managed fishery licence (MFL). But the MFL is not the ‘currency’ of the fishery – the gear unit (pot) is the currency of the fishery. The extent of trading in units (buying, selling and leasing) that has occurred within the market over the years means that it is simply not possible to track with administrative efficiency or accuracy, the ownership or fishing history of each unit in the fishery.
• The market for rock lobster units of entitlement factors in the expected earnings into the value of the units, and this therefore represents the truest judgement of their worth. The market does not differentiate between low and high catches of lobster when valuing units for sale. All units have equal value in the market.
• The strength of the lease market for rock lobster units of entitlement means that “owners” are not limited to fishing in order to use their entitlement to develop an income stream.
Allocation issues are often the stumbling block for the introduction of an ITQ system in a fishery that is already well established. This is because when it is done on the basis of units owned, it significantly changes many fishers’ share of the catch. Often fisheries that make the transition to quota management do so from a management system where there has not been sufficient controls on fishing effort. In these cases, they have failed to protect the breeding stock and ecology generally and cannot ensure the long-term sustainability of the fish stocks being exploited. The review of the current rock lobster effort control system has not been initiated because the current system has not ensured the sustainability of the rock lobster stocks. Rather, the review was undertaken to see if a different management system could offer any additional benefits (ecological, social, economic) that would warrant a change.
Maintaining biological controls to ensure sustainability Under a quota system, the biological controls such as minimum size, protection of berried, tar spot, setose and maximum size females, would be maintained in one form or another as part of the long-term sustainability settings.
Maintaining effort (pot number) controls If it were decided to move to an ITQ system, there are two main ways it could be introduced – with effort controls or without them. Initially, an ITQ system would have to be introduced with the current effort controls in place to enable everyone (fishers, processors, government, fisheries managers, researchers and other stakeholders) to become accustomed to the new arrangements and to monitor its effect on the fishery. This is known as the transition period, during which the system can stabilise and all the teething problems can be sorted out. Once the ITQ system has stabilised, consideration could be given to relaxing fishing effort (pot number) controls. An ITQ without any fishing effort controls (e.g. controls on pot numbers, pot design, season, etc) would theoretically provide the maximum economic benefits an ITQ system could deliver.
44

This review does assess an ITQ system without effort (pot) controls. However, in the model the increase in pot numbers under this system has been limited to 20 per cent, as experience in other fisheries has shown that when fishers are allowed to use as many pots as they like to take their quota, they do not use excessive numbers. In New Zealand for instance, fishers use about 20 per cent more pots.32 Pot usage is controlled largely by the vessel’s carrying capacity and how many pots can be worked effectively each day. It is not cost effective for a fisher to buy and use more pots than is necessary to take his quota in the most cost effective way.
Exploitation Under a catch quota system, fishers don’t have to be concerned about increases in fishing effort leading to increases in exploitation and hence the need to reduce fishing effort. This is because the exploitation of the stock is controlled by setting tight limits on the amount that can be caught rather than on fishing effort. If breeding stocks levels declined, quotas would need to be reduced. Catch quotas are usually set at a level a little below what could be obtained under an effort control system because of the uncertainties inherent in quota setting. This can allow more lobsters to survive each season and hence the overall abundance of lobsters to increase, which provides a ‘buffer’ against:
• uncertainties in the catch predictions that are used as the basis of quota setting; • illegal catches going to the black market (i.e. quota cheating); and • unanticipated responses of the fishing fleet and the rock lobster stocks to
exploitation and environmental factors. Conservative quota setting also ensures that fishers can catch their quota each season without risking the sustainability of the stock. If fishery independent monitoring shows that the abundance of rock lobsters has increased and is consistently above the level required for ecological sustainability, then the quota could be set higher to harvest some of them.
Competition Between Fishers Under an ITQ management system, the emphasis shifts from competition between fishers to maximise the amount of catch they take to maximising the $ value of their quota (i.e. catching the highest value lobsters) and minimising their fishing costs. There is no “reward” or incentive for fishers to fish harder to try and maximise their catch because their quota limits it. The only way to increase catch is to buy or lease more quota. When a fisher knows prior to the commencement of the season what his catch quota is and is confident he will catch it, competition between fishers is significantly reduced and the emphasis shifts to fishing “smarter” to reduce the costs of the fishing
32 Information provided by Economic Research Associates. It has also been note in New Zealand that fishers will use extra pots to secure and retain ground rather than to increase their effort, which could generate significant ecological and resource sharing issues.
45

operation to maximise net profit. This is the fundamental and important difference between effort and quota management systems. Although a quota system may produce on average a little less catch than an effort control system, it could provide greater stability in economic, social and ecological terms. This could translate into higher net profits for fishers and greater benefits to the community and marine environment generally.
Impact of ITQ allocation on a fisher’s catch and behaviour The ITQ allocation could encourage fleet restructuring to occur at an accelerated rate, particularly within the first few years, as those who remain in the fishery seek to adjust their quota holdings to the level of catch they had prior to ITQ allocation. People who own multiple boats and ITQs could be inclined to aggregate their ITQs onto fewer boats. The more proficient fishers are more likely to drive this adjustment. When fishers and other people who own pots weigh up the advantages and disadvantages of effort controls versus quota control systems, they usually do so from the perspective of whether the catch they would be allocated under a quota system would be more or less than the catch they would expect to take under the existing effort control system. ITQ systems, where initial allocation is based on the number of units (pots) owned, make all fishers average catchers. Whereas effort control systems encourage fishers to maximise their catches by being highly competitive. ITQs allow fishers to concentrate their efforts on reducing their fishing costs without the fear of being out-competed by other fishers. Competition between fishers may continue to some extent under ITQs (e.g. it could still concentrate in the highest catch periods – whites and reds) until fishers adjust to the new system and the market may take some time to provide the appropriate feedback on when to fish. Therefore, the increase in profits due to greater efficiencies, reduced costs and increased prices could take some time to be fully realised. The advantages and disadvantages of effort and quota systems are much more complex than just who would catch the most under the different management systems. The amount of rock lobsters a fisher catches is only one part of the equation that generates the net profit of the business. The other very important parts of the profit equation are:
• how much it costs to catch each kg of rock lobsters; and • the opportunities the different management systems offer to maximise the
price received for the catch. It may appear at first glance that an above average fisher would be worse off under quota, because his share of the catch would be less than what he would get under a competitive effort control system. However, the potential to reduce fishing costs and maximise the price received for his catch could significantly offset or out-weigh the reduction in catch. Below-average fishers could be seen as the big winners in moving to a quota system, as their share of the catch would increase and they may also be able to reduce their fishing costs and maximise the price they received for their catch.
46

However, some below-average catchers may have to fish more days and/or use more pots to achieve their quota or they may choose to sell or lease some of it. It also needs to be noted that fishers who catch above-average under the current management system do not always make the most profit per kg of lobsters caught. Indeed as the cost of fishing increases – as is occurring now with increases in prices such as diesel, bait, labour, maintenance, and insurance – fishing “harder” for a few extra kilos is sometimes not cost effective, i.e. the cost of fishing can exceed the profit from the catch.
Impact of ITQs on the peak catching periods ITQs could encourage fishers to concentrate on the most productive periods of the season (whites – December/January, and reds – March/April). This would be more likely to occur if there were no controls on pot numbers or if there weren’t a price differential throughout the season (e.g. higher prices paid at the end of the season). As already stated, ITQs would initially be implemented using the same controls on pots (numbers and design) as apply under the current system. The annual starting date of the ITQ season could be critical in determining fishing patterns. If the season started in November, fishers may be reluctant to forgo any fishing during the ‘high catch rate’ whites period, because of concerns about their ability to achieve their full quota during the ‘low catch rate’ periods later in the year, particularly May-August. This could even exacerbate the catches in the peak periods. However, if the season started in February/March, fishers could maximise their effort through to the end of August and if they had achieved a significant proportion of their quota, they may reduce their effort in the following whites period.
Effects on new entrants and potential new business approaches It has been suggested that, compared to the current system, ITQs could limit the scope for new entrants to the fishery to fish hard and maximise their catch to help them to pay off their loans. Under an ITQ system, fishers maximise their profit by focusing on reducing the cost of fishing, rather than increasing catch. Under an effort control system, new entrants have the opportunity to work harder to increase their catch and hence their profits, which could give them greater capacity to meet their loan repayments. ITQs could see significant new innovations around fishing operations such as:
• pots with multiple necks; • bait savers; • more fuel efficient engines; • fishing closer to port to reduce costs, etc.
Under quotas, there is likely to be much greater heterogeneity of the fleet (i.e. a greater variety of boats and gear). These could include new vessel designs to optimise the quota arrangements for a particular vessel (e.g. a vessel that specialises in fishing distant grounds such as Big Bank).
47

Experience in other fisheries has also shown that some fishers (particularly if financially pressed) would reduce their maintenance costs on boats and gear, which could affect vessel safety.
Cheating on quota Unfortunately, no matter what management system is used, there will always be a small number of fishers and processors/buyers that break the rules. The amount of quota cheating that takes place would have to be quantified and taken off the commercial quota that was set to ensure that the total catch (legal + illegal catch) was sustainable. For example, if it were estimated that the commercial quota for a zone should be 4,000,000 kg, but it was estimated that there was a 5 per cent illegal commercial take, then the commercial quota that would be allocated would be 4,000,000 kg minus 5 per cent, that is, 3,800,000 kg. That is, each fisher’s ITQ would be reduced by 5 per cent from what it would have been if there were no illegal catch. In some quota fisheries in Australia and New Zealand (e.g. abalone and lobster), illegal quota is a serious management problem that the industry has to pay for by reducing ITQs and increasing enforcement costs. If a fisher is under financial pressure, there is considerable incentive to cheat on quota. And if there is collusion between a fisher and a buyer/processor, it likely that it would be more difficult to detect him taking 10 per cent more illegal quota than it would if he were working 10 per cent more pots illegally under the current management system.
Compliance Quotas require a very high degree of enforcement, significantly more than the current management system. There would need to be very tight security around and surveillance/inspection of weigh-in stations (which may need to be restricted in number and require special supervision) and consignment dockets (the electronic and paper audit trail) to enable a fisher’s catch to be followed from his fishing boat to the “dinner plate” (end user), on a daily basis, i.e. in real time. There would be a requirement for fishers to keep accurate documentation for every kilo of lobster that they sold and they may also have to count all lobsters they consign, as they do in South Australia. Enforcement would become much more intrusive, black and white, and knifed-edged under a quota system33. There would also need to be severe penalties for quota cheating to keep the black market from undermining the ITQ system. It is estimated that there would be a one-off enforcement/management cost of about $1 million to set up an ITQ system and an additional ongoing enforcement/management cost of about $3 million annually. The additional costs have been included in the bio-economic modelling.
33 For further discussion see report ‘How do Quota Management Systems work in Rock Lobster Fisheries?’ at www.fish.wa.gov.au or www.lobsterwa.com
48

Research Historic catch and effort information would not be comparable to that under ITQs because of changes in fishing behaviour, pot catching efficiency, etc. Fishery data collected from commercial research logbooks and statutory monthly returns under an ITQ system would not be as useful for stock assessment purposes. Therefore, additional research would have to be undertaken particularly the collection of fishery independent (not obtained from the commercial fishery) stock data. For example, this data could include length frequencies, breeding stock abundance, stock densities, etc, to ensure that accurate stock assessments were produced and that quotas were being set at sustainable levels. In addition, any changes to pot design to increase catching efficiency would have to be calibrated against a ‘standard’ pot to allow comparisons of catch rates and hence abundance estimates, if commercial fishing data were to be at all useful for stock assessment purposes. It is estimated that the additional ongoing research cost would be about $1.1 million annually. The additional costs have been included in the bio-economic modelling.
Legal Framework and Procedures Required for ITQs If it were decided that the fishery was to move to an ITQ system, the details of the framework and process would be developed in conjunction with all relevant stakeholders at the time. Below is an example of what such a legal framework and process might look like.
Legal framework A legal framework would need to be established to allocate quota in the first instance and to set quota on an ongoing basis. The main aspects could include:
• a specific Act of Parliament to enshrine the initial quota allocation and perhaps the annual quota setting procedure;
• a Quota Setting Committee established under the current Fish Resources Management Act (FRMA) 1994, which would recommend quota levels to the State Government. The committee could comprise relevant members of government, commercial and recreational fishers, processors, the conservation sector, and community stakeholder groups. The composition of the committee would depend on whether a Total Allowable Catch (TAC – for all sectors, e.g. customary, commercial and recreational) was being set for the fishery as a whole, as distinct from a quota for the commercial fishery;
• a Technical Advisory Committee for quota allocation, which would calculate quota levels based on a clear set of sustainability principles. This committee would be comprised of scientific experts and fisheries managers and they would advise and make recommendations to the Quota Setting Committee;
• a new management plan under the FRMA to clearly set out the rules of the quota management system, including transfers of quota (buying, selling and leasing);
49

• new regulations and penalties for quota enforcement; and • development of new systems or modification of the current legal, licensing,
quota registrations and enforcement systems (e.g. paper trail audits of fishers and processors).
Quota setting procedure A possible quota setting process for the commercial fishery is briefly described below. Quotas would always be set at ecologically sustainable levels.
• For each zone (A, B and C) the biological information on puerulus settlement, catch predictions, rock lobster stock status (size and sex frequencies, abundances, etc), breeding stock levels and ecological issues would be compiled, modelled, analysed and documented by research scientists.
• The Technical Advisory Committee (comprising scientific experts) would use a set of clear business rules to review and assess the biological information and calculate the level of quota that it believed should be set for each zone (A, B and C). The Technical Advisory Committee would then make a recommendation to the Quota Setting Committee.
• The Quota Setting Committee would assess the Technical Advisory Committee’s recommendation and supporting documentation. It would also take into account any other ecological, economic, social or management issues it considered relevant before it made its recommendation on quota levels to the Minister for Fisheries.
• The Quota Setting Committee would meet at least annually, with a view of setting quota three years in advance.
The Basis of Quota Setting
Conservative quota setting To account for uncertainty around catch predictions and unforeseen environmental influences, catch quotas are traditionally set below the catch that could potentially be realised in an effort controlled fishery. In the short term (e.g. five years) this could produce slightly lower catches (though not necessarily lower $ returns). However, conservative quota setting can lead to an increase in abundance of the overall lobster population, which could result in:
• greater catching efficiency, i.e. because of the generally higher abundance of lobsters, they are easier and quicker to catch and hence there can be significant savings on operating costs (e.g. pot numbers, bait, travelling time, etc);
• higher catches at times of the season when catches are normally low; and • greater ecological stability due to a higher density of all sizes of lobsters on
the fishing grounds, which would result in less impact overall on the general/rock lobster ecology.34
34 It could be argued that it would also be possible to gain these benefits under an effort control system if the level of fishing effort was set conservatively enough. In addition, industry could argue for higher quotas if the lobster abundance went above that required for ecological sustainability.
50

Quota management issues Commercial35 catch quota setting for each zone would be done taking into account the following:
• Catch predictions: The catch predictions, which are predictions of recruitment levels to the fishery based on the levels of puerulus settlement that occurred in the previous three to four years, would be used to set the quota for each zone. For example, if the catch prediction for a zone was between 4.5 and 5.0 million kg, then the quota could be set at 4.5 million kg. The lower end of the catch prediction would initially be used to minimise the risk of impacting on the ecological sustainability of the stock, due to the uncertainties inherent in predicting catch, unforseen changes in fishing fleet responses and lobster behaviour due to changing patterns of exploitation and the natural variations that occur in environmental factors.
• Breeding stock: The level of breeding stock in each zone would be maintained above the level it was in the late 1970s-early 1980s (the current trigger points for management action). Quotas would be adjusted to ensure the breeding stock was maintained above this level.
• Ecological sustainability: The broad requirements of ecologically sustainable development would also be taken into account in quota setting.
• Illegal catch: A reduction in commercial quota allocation would be required to offset any illegal (unreported) catch, due to some fishers cheating on their quota. See the section Cheating on quota below for further discussion.
• Increases in lobster abundance: If over a number of years, fishery independent research monitoring showed that rock lobster abundances on the fishing grounds had increased and were consistently well above the level required for both sustainability and ecological purposes, then the quota could be increased for a number of seasons to harvest the surplus.
• The timing of the start of the season: There could be a big impact on fishers’ behaviour depending on which month the quota season started. For instance, if the season started in February after the whites or in May after the reds, fishers may adopt different fishing strategies to those they currently use. This would be further compounded if there were also significant difference in price/kg for different periods of the season (e.g. lower prices in the whites).
Zone Quotas If the rock lobster fishery moved to an ITQ system, a quota would be set for each zone – A, B and C. Quotas could be set in the following way:
• ‘A’ fishers would have a quota in Zone B that they could catch up until the 14 March. ‘A’ fishers would then move to Zone A where they would have a quota from 15 March to the end of the season, allocated on the basis of how many units (pots) were held on a licence.
35 There would be a separate quota set for recreational fishers, based on the percentage share of the total catch negotiated through the Integrated Fisheries Management process, which is currently underway.
51

• ‘B’ fishers would have one quota in Zone B up until 14 March and another quota in Zone B from 15 March to the end of the season, allocated on the basis of how many units (pots) were held on a licence. ‘B’ fishers could also be allowed to shift whites quota into the reds fishery, but not vice versa.
• ‘A’ and ‘B’ fishers could have their quotas for the period 15 November to 14 March calculated as a proportion of total catch taken in Zone B in the following way:
o Catch for the period 15 November to 14 March could be averaged over a 10-year period as a percentage of total catch in Zone B (15 November to end 30 June) and this percentage could then be used to split future quotas between these two periods of the season.
o The quota calculated for the period 15 November to 14 March would be allocated to ‘A’ and ‘B’ fishers on the basis of the number of units held on a licence.
• Zone C fishers could have one quota for the whole season allocated on the basis of how many units (pots) were held on a licence.
Whites and Reds Quotas Industry may decide that within an ITQ system there are significant processing, marketing – and hence beach price benefits – in having quotas on the whites (e.g. December-January) and reds (March-April) catch periods. Whites and reds quotas could be used to reduce some of the peak catches and make more lobsters available in traditionally lower catch periods (e.g. February and May-August). A quota for the whites could also be used to ensure sufficient migrating lobsters escaped the fishery to replenish the breeding stock on the offshore deeper water reefs and at the southern and northern ends of the fishery. If there were significant economic advantages to be obtained, a catch quota could also be considered for the first two to four weeks of the Abrolhos Islands season to help reduce the very high catch peak and spread product over a longer period. As previously mentioned, the way fishers would distribute their quota between the whites and reds peaks would depend to a large extent on the start time to the quota season.
Potential Benefits of ITQs The main potential benefits that ITQ systems could offer are described below:
• substantial potential economic benefits; • competition between fishers for catch would be significantly reduced over
time,36 provided the quota was set at a level where it could always be taken; • fishers are able to use innovation and technology to reduce fishing costs
without the fear of loosing catch to more competitive fishers. For example: o more efficient pot designs (pots that catch more and retain lobsters
better), o more economic boats and baiting strategies,
36 Some local competition may occur as local rock lobster abundances are fished down, i.e. to fill their quota fishers may have to travel further than they would prefer.
52

o greater use of two- or more day pulls using more effective pots (i.e. pots that keep catching over a longer period of time and don’t allow lobsters to escape), etc;
• if quotas help to flatten out the catch peaks (whites, reds and Abrolhos) and processors/marketers can realise price premiums through more stable and extended supply (fewer peaks and longer season), then quotas have the potential to generate higher returns from the catch;
• fishers can choose when they fish to maximise their profits and to suit their lifestyle.
ITQs with Effort Controls This section describes how a variable ITQ system with the current fishing effort (pot numbers) controls would work in practice. Variable ITQs would be used for the reasons discussed above. Zone quotas would be set annually based on catch predictions and the status of the breeding stock. Note: As stated above, if it were decided to move to a quota system, then ITQs with fishing effort controls would be the system that would initially be introduced. If additional economic benefits could be gained, then effort controls could be relaxed over time as the new system stabilised and evolved.
How an Effort Controlled ITQ System Would Work Under an ITQ system which is effort controlled, a fisher would be allocated a quota based on the number of units held on his licence and he would only be able to use the number of pots he can use under the current system. However, the pots could be 15 per cent more efficient due to changes in pot design. Below is a description of one way such a system could work.
Quota allocation • Initial and all subsequent quota allocations would be based on the number of
units held on a licence and the units would relate directly to the number of pots that could be used, as is the case under the current system.
• Prior to the commencement of each season, unit holders would be told what their quota was for the season based on the zone quota and the number of units they held.
• For example, if the zone quota were 3,500,000 kg and the number of units in the zone were 27,000, then each unit would be allocated 129.6 kg. A person with 110 units would have a total ITQ of 14,256 kg at the start of the season. If, as is currently the case, a fisher could use only 0.82 of his units, he would be able to fish his quota with 90 pots (i.e. 110 units x 0.82 = 90 pots in the water).
Quota/pot transfers and pot usage A clear set of business rules for quota/pot transfers would need to be developed with stakeholders. Transfers of quota and pots (buying, selling, leasing) would initially
53

only be allowed prior to the season, but as the system evolved over time, transfers during the season could be considered. The more flexible the transfer system was required to be, the more complex it would be, particularly if there was a strict link between quota and pot usage. For examples of how within season transfers could work see Attachment 6.
ITQs Without Effort Controls Note: As stated above, if it were decided to move to a quota system, then ITQs with fishing effort controls would be the system that would initially be introduced. If additional economic benefits could be gained, then effort controls could be relaxed over time as the new system stabilised and evolved. An ITQ system without effort controls is theoretically the management system that offers the greatest potential economic benefits for the rock lobster industry. However, these potential benefits have to be weighed up against the risks, as described under the Key Issues section above. This section describes how a variable ITQ system without effort controls would work in practice. Variable ITQs would be used for the reasons discussed above and zone quotas would be set annually based on catch predictions and the status of the breeding stock. From experience in other fisheries, ITQs without effort controls (no controls on pot numbers) do not lead to excessive increases in pots in the water. Pot numbers are largely limited by the carrying capacity of the boats and the number that can be effectively worked each day. Once fishers become used to an ITQ system, they appear to use the most cost-effective number of pots to take their quota. For this review and the bio-economic modelling exercise, it has been assumed (from experience in other fisheries) that in practice fishers would not increase their fishing effort excessively under this system (as discussed under Maintaining effort (pot number) controls), even though no pot limits would apply. Therefore, an increase in pot numbers of 20 per cent and a 40 per cent increase in the catching efficiency of a pot (through changes in pot design) has been used in the model. This equates to an increase in catching efficiency of the “standard” boat of about 68 per cent. Under the model’s assumptions, the ability to significantly increase the catching efficiency of the boats would encourage a significant number of them to sell their quota and leave the fishery.
How an ITQ System Without Effort Controls Could Work A variable ITQ system without effort controls would work in almost the same way as described for a variable ITQ system with effort controls. A fisher would be allocated a quota based on the number of units held on the licence and he would only be able to use 20 per cent more pots (as modelled) than he could use under the current system. Below is a description of one way such a system could work.
54

Quota allocation • Initial and all subsequent quota allocations would be based on the number of
units held and 20 per cent more pots than the current number could be used to take the quota.
• Prior to the commencement of each season, unit holders would be told what their quota was for the season based on the zone quota and number of units held.
• For example, if the zone quota were 3,500,000 kg and the number of units in the zone were 27,000, then each unit would be allocated 129.6 kg. A person with 110 units would have a total ITQ of 14,256 kg at the start of the season.
• A fisher could use 20 per cent more pots than his current units to fish his quota, i.e. 110 units x 120 per cent (or 1.20) = 132 pots in the water).
Quota transfers and pot usage A clear set of business rules for quota/pot transfers would need to be developed with stakeholders. Transfers of quota (buying, selling, leasing) would initially only be allowed prior to the season, but as the system evolved over time, transfers during the season could be considered. For an example of how within season transfers could work, see Attachment 6.
Comparisons Between Effort and Quota Management Systems – Results of Bio-economic Modelling This section describes and discusses the main assumptions and management rules that have been used in the bio-economic model37, some of the model’s limitations, and the care that needs to be taken in interpreting the model’s results. A summary and general comparison is made of the model estimates of average annual $ benefits for the 11 management option variations that were assessed. A more detailed description and discussion of the model outputs for breeding stock levels, annual catch and fishing effort, boat numbers and economic benefits is also provided for four of the management options, which had the most conservative assumptions (e.g. lowest price increases). A Bio-Economic Evaluation of the Management Options for the West Coast Rock Lobster Fishery, produced by Economic Research Associates (ERA) and referred to as the ERA report, should be read in conjunction with this section.38
37 More details of the management arrangements and model assumptions for each of the management options are provided in Attachment 5 (Tables A and B). 38 See A Bio-Economic Evaluation of the Management Options for the West Coast Rock Lobster Fishery, produced by Economic Research Associates on the Department of Fisheries’ web site at www.fish.wa.gov.au or the Western Rock Lobster Council’s web site www.rocklobsterwa.com or phone the Department of Fisheries on 9482 7267 for a hard copy.
55

Key Issues and Assumptions Of The Bio-Economic Model
Accuracy of the model ERA, the consultants who have undertaken the bio-economic modelling of the Western Rock Lobster Fishery have obtained the information on the assumptions that underpin the model from:
• a survey of commercial fishers (postal questionnaire – 21 respondents); • detailed discussions with focus groups of fishers, processors, research
scientists and managers; • scientific publications; • Department of Fisheries’ databases; and • Australian Bureau of Statistics.
ERA have tested the model outputs against the historical fishery information (e.g. catch and fishing effort, catch rate (kg/pot lift), distribution of catch by month, boat and pot numbers, beach prices, etc) and the fits are good, therefore they believe the model is behaving in a realistic and reliable way. ERA believe that based on the assumptions used, the model outputs provide robust estimates of what could happen to the fishery under the different management options. For example, under the ITQ system with reduced effort (pot number) controls – i.e. options 4a to 4d where pot usage has been allowed to increase by 20 per cent) the fishing season was lengthened to 31 August, the average beach price was increased by between $1.25/kg and $5.50/kg, and the catching efficiency of the pots was increased by 40 per cent through changes in pot design – the model predicts the fishery would gain a significant annual benefit in excess of $80 million. The model estimates these large benefits because it assumes that fishers would make changes to their normal fishing behaviour to maximise their profits by, for instance, catching some of their quota in July-August when the price is higher and the increase in pot efficiency could allow them to work two- and three-day pulls very economically. The model shows that the major catch peaks in the whites and the reds are still dominant under ITQs but are reduced a little, which allows more rock lobsters to be available in traditionally low catch rate periods and during the extended season, when prices are higher. The model appears to be realistic in that it does not allow fishers to concentrate their entire quota in periods of high price, because the catchability/availability of lobsters in those periods is relatively low, so only a modest portion of the quota could be taken at that time. If the price increases and efficiency gains used in the model are lower than expected, the $ benefits that would flow from the management options based on these assumptions would be significantly reduced. To give an indication of how “realistic” the model outputs are, the average number of pot lifts and the average catch (kg) per month for Zone C are shown below as examples of what the model estimates for some of the different management options. Note that 3c and 3d and 4c and 4d overlay each other, so it is difficult to distinguish between them.
56

0
100,000
200,000
300,000
400,000
500,000
600,000
700,000
800,000
900,000
November December January February March April May June July August September October
Ave
rage
nos
. pot
lifts
per
mon
th
Sc1 Sc1c Sc3c Sc3d Sc4c Sc4d
Zone C: Pot lifts by month
[Note: Sc = Scenario; Scenario 1 = the current management system; Scenario 1c = the current management system with a 20 per cent pot reduction; Scenario 3c and 3d = variable ITQ with the current effort (pot number) controls and price increases of $2.00/kg and $1.00/kg respectively; Scenario 4c and 4d = variable ITQ without the current effort (pot number) controls, i.e. pot numbers are increased by 20 per cent, and price increases of $2.50/kg and $1.25/kg respectively. Graphs 3c and 3d and 4c and 4d overlay each other, so it is difficult to distinguish between them.]
0
200,000
400,000
600,000
800,000
1,000,000
1,200,000
1,400,000
1,600,000
1,800,000
2,000,000
November December January February March April May June July August September October
Ave
rage
cat
ch p
er m
onth
(Kg.
)
Sc1 Sc1c Sc3c Sc3d Sc4c Sc4d
Zone C: Catch by month
57

[Note: Sc = Scenario; Scenario 1 = the current management system; Scenario 1c = the current management system with a 20 per cent pot reduction; Scenario 3c and 3d = variable ITQ with the current effort (pot number) controls and price increases of $2.00/kg and $1.00/kg respectively; Scenario 4c and 4d = variable ITQ without the current effort (pot number) controls, i.e. pot numbers are increased by 20 per cent, and price increases of $2.50/kg and $1.25/kg respectively. Graphs 3c and 3d and 4c and 4d overlay each other, so it is difficult to distinguish between them.] One factor that has not been modelled, which would be likely to have a significant impact on fisher behaviour and the potential $ benefits that could be gained by moving to an ITQ system, is the start time for the quota season. For instance, if the quota season started in February or May, fishers would use different fishing strategies to what they would use for a traditional November start.
Modelling fleet efficiency/economic gains An important aspect of ERA’s bio-economic modelling was to determine if any of the management options offered additional gains in fleet efficiency, that is, greater annual net economic benefits ($ profits) compared to the current system. In the model, the fleet efficiency gains were calculated and expressed as reductions in boat numbers. That is, economic theory implies (and the model assumes) that fewer boats in the fleet mean more catch per boat = lower costs/kg of lobsters caught. This, in turn, means a more efficient fleet overall and greater net profits/benefits. However, increasing fleet efficiency and net profits do not necessarily just involve boats leaving the fishery. Fleet efficiency can also be increased, particularly under an ITQ system, if fishers reduce their individual operating costs, e.g. use smaller, less costly and more economic boats and implement strategies to save on fuel, bait, labour and costs. Therefore, the significant economic gains ($), due to fleet efficiency increases (the significant reduction in boat numbers), that the model has predicted for the ITQ system with reduced effort (pot number) controls (i.e. it allows a 20 per cent increase in pot numbers) are, in practice, more than likely to be made up of a combination of reduced operating costs and fewer boats, rather than just fewer boats in the fleet. The current model cannot provide separate estimates of reductions in individual boat operating costs compared to the economic gains that can be attributed to reductions in boat numbers. However, it is reasonable to assume that the economic efficiency gains from fleet reduction can be used as a proxy for the efficiency gains.
ITEs and pot reductions Bio-economic modelling shows that under the current ITE (effort control) management system, a pot reduction (e.g. 20 per cent at two per cent per year over 10 years) would reduce the number of boats faster than the current system with no pot reduction, but not to the same extent as the ITQ system with reduced controls on pots numbers. A 20 per cent pot reduction under the current system would, according to the model, also result in slightly greater fleet economic ($) benefits than the current system without a pot reduction. But it would not yield nearly the same $ benefits as ITQs. The majority of the gains under the ITE systems (including the 20 per cent pot reduction) would come through a reduction in the number of boats (i.e. the fleet would comprise fewer boats with larger numbers of pots) rather than a reduction in individual fisher’s operating costs. This is because under the current ITE system
58

(with or without a 20 per cent pot reduction), the competitive nature of fishing is encouraged and therefore there is less scope for fishers to reduce their operating costs.
Uncertainty around the economic benefits of ITQs The potential benefits of ITQs that are predicted from the bio-economic modelling are derived from hypothetical price increases and efficiency gains that industry representatives considered were reasonable. However, there are risks that these gains may not be fully realised. Hypothetical price increase of up to $5.50/kg for the total catch The price increases used in the model apply to the total annual catch and are composed of:
• $2/kg due to the longer season of supply November to August (this also applies to the more flexible effort control option that was modelled);
• $1.50 to $3.00/kg if ITQs result in less variation in the catch from season to season; and
• $0.50/kg if ITQs result in a more stable supply of product within a season, i.e. catch is spread a little more evenly throughout the season (e.g. lower catch peaks in the whites and reds).
If these hypothetical price increases were less than estimated, or did not materialise as an additional benefit to the normal price changes due to changes in exchange rates or economic conditions, then the potential economic benefits of an ITQ system with or without effort controls would be significantly reduced. This would considerably reduce the economic incentive to change the current management system. To allow for this uncertainty, the model used what was considered to be a conservative $1.00/kg and $1.25/kg increase in price for two of the ITQ options (options 3d and 4d). See the section below on Sensitivity of $ benefits to increases in price/kg for discussion on how increases in beach prices influence model outputs, i.e. the proportion of the estimated $ benefits due to price increases compared to efficiency gains. Hypothetical efficiency gains from changes in pot design It is estimated that changes in pot design (e.g. larger pots with side entrances, parlour pots that stop escapement, etc) could yield efficiency increases of between 15 per cent and 40 per cent. This would mean that a fisher could use fewer but more efficient pots, to reduce his overall operating costs, which could result in the purchase of a smaller, more economic boat with lower fuel, bait, and labour costs. The model shows that there are significant economic benefits to be gained by increasing the catching efficiency of pots.
59

Modelled efficiency gains from boat reductions The modelling results for ITQs showed the potential for significant increases in fleet efficiency (hence annual $ benefits) that could flow from a large reduction in the number of boats in the fishery. This was particularly so for the ITQ system with reduced fishing effort controls (i.e. fishers could use up to 20 per cent more pots than they currently use and the pots could be up to 40 per cent more efficient at catching). Under this ITQ option, the number of boats declined from 549 to 256 (i.e. 293 boats left the fleet). In practice, the $ gains from increases in fleet efficiency may not be as great as predicted by the model because:
o a significant portion of the efficiency gains may come through individual fishers reducing their costs, rather than boats leaving the industry;
o the reduction in boat numbers could be less than estimated; o efficiency gains assumed for a significantly smaller fleet size may not be as
large as anticipated; and o the decline in boat numbers may occur over a very long period of time.
If the efficiency gains obtained by significantly reducing the size of the fleet were not as great as predicted and/or were slow to materialise, the significant benefits of ITQ systems, particularly with reduced controls on pot numbers and increased pot catching efficiency, could be significantly lower than the model estimates.
Time required to realise the benefits of ITQs If the fishery moved to ITQs, it may take as long as one generation of fishers to realise the full potential economic benefits. The time would depend largely on two factors:
• how quickly the management system could be deregulated under ITQs to allow fishers to design more efficient pots and to use more pots (e.g. 20 per cent more) to catch their quota. Deregulation could only proceed if it did not impact adversely on the sustainability of the stock and the integrity of the management and enforcement system (particularly the control of the black market for illegal catch); and
• how rapidly the industry (fishers, processors and marketers) would adjust to the new ITQ system and deliver the price increases (processors would need to play a lead role) and efficiency gains (fishers would have to reduce their operating costs and boats would have to retire from the fishery).
Modelling Results – the Different Management Options
Profit Optimising Behaviour The bio-economic model assumed that the operators of its average representative boat in each fishing zone would engage in profit optimising behaviour. This means, for instance, the operator would not go fishing on days when it was not profitable even when an entitlement (fishing days or quota) may not be fully utilised. In reality, individual fishers may not always behave in this way because of non-economic
60

factors that may influence their decisions about when and where to fish that may not be economically optimal.
Processing and marketing Generally, when processors and marketers assess effort and quota systems, they do so from the point of view of how they might be able to maximise the value of the catch they process. Generally, processors agree that the following factors could help to increase the value of the total catch:
• having the catch come in more constantly during the season and from one season to the next, without big peaks and troughs, so a mix of products could be produced that would maximise the overall value (e.g. lives compared to frozen tails, etc);
• catching less of the low-value lobster and more of the high-value ones (e.g. reds compared to whites); and
• having a longer catching and marketing season. The bio-economic model results indicate that ITQ systems generally offer greater scope to optimise these factors.
Summary of the bio-economic model results of the annual $ benefits for the Western Rock Lobster Fishery
0.0010.0020.0030.0040.0050.0060.0070.0080.0090.00
100.00
Ave
rage
Ann
ual B
enef
its($
mill
ion)
Scen
ario
1Sc
enar
io1c
Scen
ario
2
Scen
ario
3aSc
enar
io3b
Scen
ario
3cSc
enar
io3d
Scen
ario
4aSc
enar
io4b
Scen
ario
4cSc
enar
io4d
Input controlled Quotas with InputsControlled
Pure ITQ
Zone A/B Zone C
Figure 3. The bio-economic modelling results for average annual benefits in $ millions, for the 11 management option variations that were modelled for the Western Rock Lobster Fishery.
61

Average Annual Benefits ($million)
Input Controlled Quotas with Inputs Controlled Pure ITQ
Scen
ario
1
Scen
ario
1c
Scen
ario
2
Scen
ario
3a
Sce
nari
o 3b
Sce
nari
o 3c
Sce
nari
o 3d
Scen
ario
4a
Sc
enar
ion4
b Scen
ario
4c
Sc
enar
io
4d
Zone A/B
3.31 4.06 9.22 27.11 21.40 16.52 13.20 35.88 45.06 40.66 36.81
Zone C
12.10 12.86 18.81 34.13 30.21 26.51 22.64 51.73 51.52 50.69 45.87
TOTAL
15.41 16.92 28.03 61.24 51.61 43.03 35.84 87.61 96.58 91.35 82.68
Table 2 above shows the bio-economic modelling results for average annual benefits in $ millions, for the 11 management options modelled for the Western Rock Lobster Fishery.
Management options modelled Input (effort) controls (ITEs). The three fishing effort (pot number) control management options (Scenarios) produced the lowest benefits of all the options that were modelled:
• 1 – the current system gave an estimated annual net benefit of $15.4 million • 1c – the current system with a 20 per cent pot reduction gave an estimated
annual net benefit of $16.9 million; and • 2 – a flexible effort control system39 where pots and fishing days could be
adjusted annually, the season extended to 31 August, and there was a $2/kg
39 The main assumptions and management arrangements used to model the flexible ITE system were an extension of the season to the 31 August; 1 per cent per annum productivity gain through effort creep; minimum unit entitlement of 43 to operate in the fishery; price increase of $2.00/kg due to the extended season; $7,200 in extra costs (i.e. above normal operating costs) for fishing during the extended season; limit of 185 fishing days allowed per season, with no flexibility to change it from season to season or for different parts of the season; and limits on the number of pots used in each zone, with no flexibility to vary them from season to season or for different parts of the season. See Attachment 5 for further details of management rules and model assumptions for each management option reviewed.
62

increase in the average beach price, gave an estimated annual net benefit of $28 million.
Quotas (ITQs) with input controls. The four ITQ system options (Scenarios 3a to d) with the current effort (pot number) controls produced $ benefits that were significantly greater than the effort control options (1, 1c and 2) but significantly lower than the comparable “pure” ITQ options (4a to d) with reduced effort (pot number) controls.
• 3a – constant (fixed) ITQ with current pot number controls, a beach price increase of $5/kg and a 15 per cent increase in the catching efficiency of pots gave an estimated annual net benefit of $61.2 million. However, there are significant sustainability risks with fixed quotas (quotas that do not vary from year to year) as described under the section Risks associated with constant (fixed) and variable quotas, that make fixed quotas a less attractive management option.
• 3b – variable ITQ with current pot number controls, a beach price increase of $3.50/kg, and a 15 per cent increase in the catching efficiency of pots gave an estimated annual net benefit of $51.6 million.
• 3c – variable ITQ with current pot number controls, a beach price increase of $2.00/kg, and a 15 per cent increase in the catching efficiency of pots gave an estimated annual net benefit of $43.0 million
• 3d – variable ITQ with current pot number controls, a beach price increase of $1.00/kg, and a 15 per cent increase in the catching efficiency of pots gave an estimated annual net benefit of $38.8 million.
Pure ITQ – ITQs with reduced effort controls. The four ITQ system options (Scenarios 4a to d) without the current effort (pot number) controls40 produced $ benefits that were significantly greater than any of the other management options. Under these ITQ options, controls on pot numbers were relaxed and the number of pots was allowed to increase by 20 per cent.
• 4a – constant (fixed) ITQ with reduced controls on pot numbers, a beach price increase of $5.50/kg and a 40 per cent increase in the catching efficiency of pots gave an estimated annual net benefit of $87.6 million. However, there are significant sustainability risks with fixed quotas (quotas that do not vary from year to year) as described above under the section Risks associated with constant (fixed) and variable quotas, that make fixed quotas a less attractive management option.
• 4b – variable ITQ with reduced controls on pot numbers, a beach price increase of $4.00/kg and a 40 per cent increase in the catching efficiency of pots gave an estimated annual net benefit of $96.6 million.
• 4c – variable ITQ with reduced controls on pot numbers, a beach price increase of $2.50/kg and a 40 per cent increase in the catching efficiency of pots gave an estimated annual net benefit of $91.4 million.
• 4d – variable ITQ with reduced controls on pot numbers, a beach price increase of $1.25/kg and a 40 per cent increase in the catching efficiency of pots gave an estimated annual net benefit of $82.7 million.
40 Pot numbers were allowed to increase by 20 per cent.
63

A Detailed Examination of Four Management Options The section below is based on Chapter 6 of A Bio-Economic Evaluation of the Management Options for the West Coast Rock Lobster Fishery, produced by Economic Research Associates and should be read in conjunction with this section.41
This section describes and compares in more detail the model outputs of one example of each of the main management options that have been summarise above. They are the options that have the most conservative model assumptions (e.g. lowest price increases) and appear to provide the most robust results. Attachment 5 (Tables A and B) provides the details of the management arrangements and the assumptions used in the bio-economic modelling for all the management options assessed in this review.
The current management system (Scenario 1) The main management arrangements and assumptions used for modelling the current ITE management system compared to the other management options were:
• “rush to fish” (fishers compete for catch); • no extension of the season (other management options have the season
extended to 31 August); • 1 per cent per year productivity gain through effort creep (not relevant to
ITQs); • no price increase (other management options had a price increase of $1 to
$5.50/kg); and • no increase in the catching efficiency of pots due to changes in pot design (the
ITQs had efficiency gains from changes in pot design of between 15 per cent and 40 per cent);
The current management system with a 20 per cent pot reduction (Scenario 1c) The main management arrangements and assumptions used for modelling the current ITE management system with a 20 per cent pot reduction compared to the other management options were:
• “rush to fish” (fishers compete for catch); • 20 per cent pot reduction; • no extension of the season (other management options have the season
extended to the 31 August); • 2 per cent per year productivity gain through effort creep (not relevant to
ITQs); • no price increase (other management options had a price increase of $1 to
$5.50/kg);
41 See ERA’s full report on the Department of Fisheries’ web site at www.fish.wa.gov.au or the Western Rock Lobster Council’s web site at www.rocklobserwa.com or phone the Department of Fisheries on 9482 7267 for a hard copy.
64

• a 10 per cent catch efficiency gain through an increase in catchability (the ITQs had efficiency gains from changes in pot design of between 15 per cent and 40 per cent); and
• a $5,000 increase in costs per average boat due to fishers fishing their remaining pots harder and expending on technology to make them more competitive.
A variable ITQ system with the current effort (pot numbers) controls (Scenario 3d) The main management arrangements and assumptions used for modelling the variable ITQ system with the current effort (pot number) controls were:
• pot numbers the same as under the current system; • an extension of the season to the 31 August; • $7,200 worth of additional operating costs for the extended season (i.e. an
extra $120 per day on top of normal operating costs per average vessel); • a 15 per cent catch efficiency gain through changes in pot design; • no “rush to fish” (significantly reduced competition between fishers); and • a price increase of $1.00/kg due to greater stability in the catch.
A variable ITQ system with reduced effort (pot number) controls (Scenario 4d) The main management arrangements and assumptions used for modelling the variable ITQ system with reduced effort (pot number) controls were:
• pot numbers were allowed to increase by 20 per cent compared to the current system;
• an extension of the season to the 31 August; • $7,200 worth of additional operating costs for the extended season (i.e. an
extra $120 per day on top of normal operating costs per average vessel); • a 40 per cent catch efficiency gain through changes in pot design; • no “rush to fish” (significantly reduced competition between fishers); and • a price increase of $1.25/kg due to greater stability in the catch.
Presentation of the Modelling Results Key comparative results by fishing zone for each of the four options (outlined above) over a 10-year modelling period are presented in relation to:
• breeding stock levels;
• annual catch;
• annual number of boats;
• annual number of pot lifts;
• average annual net economic benefits; and
65
• sensitivity of annual net $ benefits to increases in price/kg average, i.e. the level of annual net benefits that result from various increases in beach price.
Breeding stock levels The breeding stock (biomass) index for Zone C is described below as an example of the model’s breeding stock estimates for the different management options. A more detailed discussion on the model’s breeding stock level estimates and the results for Zones A and B can be found in Chapter 6 of A Bio-Economic Evaluation of the Management Options for the West Coast Rock Lobster Fishery, produced by Economic Research Associates42. The model was required to adhere to a sustainability rule, for example in the case of Zone C, the breeding stock had to stay above an index of 800,000. Figure 4 shows the levels of the breeding stock in Zone C under each of the four alternative management options. The variables that explain the differences between the level of breeding stock are how and when the catch was taken, and the overall stock abundance under each management option. As Figure 4 shows, none of the options reduced the breeding stock below the 800,000 “trigger point” (the level of the late 1970s). However, for those management options where the breeding stock level fell below the opening level at the end of the ten year period (the X-marked horizontal line – Op Stock = opening stock – represents the opening breeding stock level), some adjustment to future fishing effort or quota levels may have been required to ensure that the decline did not continue. The 20 per cent pot reduction option (Sc 1c = Scenario 1c) was the most conservative, in that it produced breeding stock levels over the 10 years that were always above its opening level.
42 See ERA’s full report on the Department of Fisheries’ web site at www.fish.wa.gov.au, the Western Rock Lobster Council’s web site at www.rocklobsterwa.com or phone the Department of Fisheries on 9482 7267 for a hard copy.
66
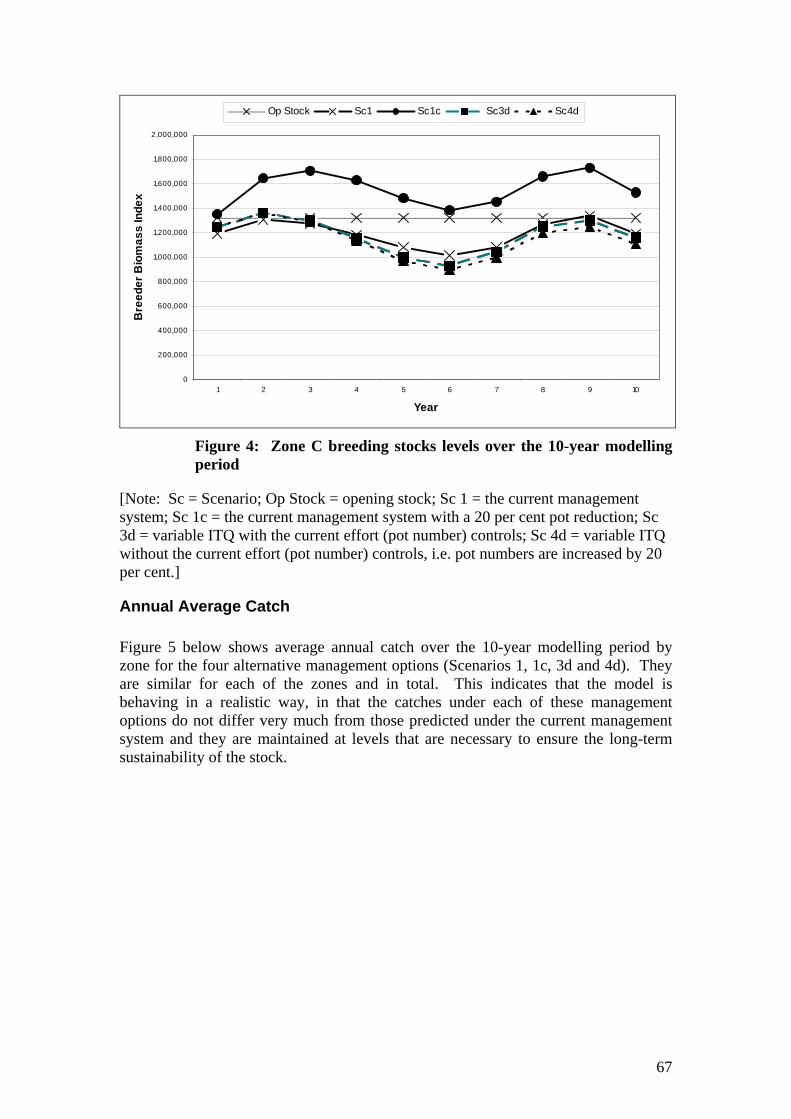
0
200,000
400,000
600,000
800,000
1,000,000
1,200,000
1,400,000
1,600,000
1,800,000
2,000,000
1 2 3 4 5 6 7 8 9 10
Year
Bre
eder
Bio
mas
s In
dex
Op Stock Sc1 Sc1c Sc3d Sc4d
Figure 4: Zone C breeding stocks levels over the 10-year modelling period
[Note: Sc = Scenario; Op Stock = opening stock; Sc 1 = the current management system; Sc 1c = the current management system with a 20 per cent pot reduction; Sc 3d = variable ITQ with the current effort (pot number) controls; Sc 4d = variable ITQ without the current effort (pot number) controls, i.e. pot numbers are increased by 20 per cent.]
Annual Average Catch Figure 5 below shows average annual catch over the 10-year modelling period by zone for the four alternative management options (Scenarios 1, 1c, 3d and 4d). They are similar for each of the zones and in total. This indicates that the model is behaving in a realistic way, in that the catches under each of these management options do not differ very much from those predicted under the current management system and they are maintained at levels that are necessary to ensure the long-term sustainability of the stock.
67

0
2,000,000
4,000,000
6,000,000
8,000,000
10,000,000
12,000,000
Ave
rage
Ann
ual C
atch
(kg)
Zone A Zone B Zone C
Zone C 5,826,471 5,616,955 5,826,471 5,826,471
Zone B 3,999,879 3,232,342 3,360,244 3,310,251
Zone A 1,704,251 1,669,983 1,704,251 1,700,734
Scenario 1Scenario
1cScenario
3dScenario
4d
Total 11,530,601 10,5192,80 10,890,966 10,837,456
Figure 5: Annual catch by zone
[Note: Scenario 1 = the current management system; Scenario 1c = the current management system with a 20 per cent pot reduction; Scenario 3d = variable ITQ with the current effort (pot number) controls; Scenario 4d = variable ITQ without the current effort (pot number) controls, i.e. pot numbers are increased by 20 per cent.] If there were a management mechanism in place that allowed the build-up in lobster abundance under options 1c and the ITQ systems (3d and 4d) to be harvested by adjustments to effort or quotas, then the benefits estimated by the model for these options would be under-estimates.
Boats Table 3 below shows what happens to boat numbers under each of the four management options. The boat numbers are after the implementation phase (which could be one or two years, or five or 10 years) and are dependent on the number of fishing days, pot efficiency and pot lifts. The boat numbers described in Table 3 as current are as at December 2004. The number of boats as at December 2005 was 495.43
As can be seen, the model estimates that under the variable ITQ system with a 20 per cent increase in the number of pots, boat numbers are reduced by 293, i.e. over half the fleet retires under this option. It should be noted, however, that the model 43 Number of boats is defined as the number of Managed Fishery Licences with the minimum number of units (pots) required to operate in the fishery.
68

expresses efficiency gains by reducing the number of boats. Whereas in reality, it is likely that there will be a combination of efficiency gains through reduced boat numbers and individual fishers making significant reductions in the costs of fishing. Therefore, the large reduction in boat numbers under option 4d may well be overestimated.
Reference Points Boat Numbers Reduction in Boat Numbers
10 Years Ago 639
Current at December 2004¹ 549 - 90
Closing Fleet at the End of the 10-year period:
Scenario 1 – current management system
505
- 44 ²
Scenario 1c – 20 per cent pot reduction
480 -69 ²
Scenario 3d – ITQ with current pot controls
505 -44 ²
Scenario 4d - ITQ with a 20 per cent increase in pots
256 -293 ²
Notes: ¹ The current boat numbers (December 2004) makes no allowance for the impact of removal of the 150-pot rule where adjustments to this rule change are still taking place within the industry. The number of boats as of December 2005 was 495. ² Compared to the current (December 2004) boat numbers. The number of boats as of December 2005 was 495.
Table 3: The decline in rock lobster boat numbers
Annual Pot Lifts Figure 6 below shows the annual number of pot lifts by zone for the four alternative management options.
69

0
2,000,000
4,000,000
6,000,000
8,000,000
10,000,000
Ave
rage
Ann
ual P
ot L
ifts
Zone A Zone B Zone C
Zone C 5,190,121 4,250,429 4,071,189 3,629,544 Zone B 3,418,159 2,838,471 2,439,501 2,277,907 Zone A 1,203,233 1,005,272 858,933 961,556
Scenario 1 Scenario 1c Scenario 3d Scenario 4d
Total 9,811,513 8,094,172 7,369,623 6,869,007
Figure 6: Annual pot lifts by zone
[Note: Scenario 1 = the current management system; Scenario 1c = the current management system with a 20 per cent pot reduction; Scenario 3d = variable ITQ with the current effort (pot number) controls; Scenario 4d = variable ITQ without the current effort (pot number) controls, i.e. pot numbers are increased by 20 per cent.] The lower number pot lifts under Scenarios 1c, 3d and 4d achieve broadly similar average annual catches compared to the current system (Scenario 1), as shown in Figure 5 above. This means that the catch per pot lift and per boat for these scenarios has increased compared to the current management system (Scenario 1), resulting in greater productivity gains, which are reflected in greater $ benefits as shown in Figure 7 below. In the case of Scenarios 3d and 4d, a significant factor in the reduction in pot lifts is the use of improved pot designs that increases pot catching efficiency by 15 per cent in 3d and 40 per cent in 4d.
Average Annual Net Benefits Figure 7 shows the average annual net $ benefits over the 10-year period of the model run for each of the four alternative management options by fishing zone and by the fishery overall.
70

0 10,000,000 20,000,000 30,000,000 40,000,000 50,000,000 60,000,000 70,000,000 80,000,000 90,000,000
Ave
rage
Ann
ual N
et B
enef
it s
($)
Zone A/B Zone C
Zone C 12,101,428 12,864,621 22,640,503 45,867,652 Zone A/B 3,309,887 4,058,537 13,199,199 36,805,714
Scenario 1 Scenario 1c Scenario 3d Scenario 4d
Total 15,411,315 16,923,158 35,839,702 82,673,366
Figure 7: Average annual net benefits over the 10-year period ($million)
[Note: Scenario 1 = the current management system; Scenario 1c = the current management system with a 20 per cent pot reduction; Scenario 3d = variable ITQ with the current effort (pot number) controls; Scenario 4d = variable ITQ without the current effort (pot number) controls, i.e. pot numbers are increased by 20 per cent.] The average annual $ benefits shown above are the same as those shown in Figure 3 above. The large increases in net benefits of the ITQ options (3d and 4d), compared to the current system (1) and a 20 per cent pot reduction (1c), are due to price increases and more particularly increases in fleet efficiency.
• Price increases –Increase in the beach price of $1.00 for 3d and $1.25/kg for 4d would increase profits by about $10 and $12 million for 3d and 4d respectively, based on an average 10 million kg catch. There are various views within the industry as to whether these beach price increases are realistic. Based on discussions with the processing sector, ERA believe the price increases are achievable under ITQs due to the longer season of supply (season runs to 31 August) and greater stability in the catch between and within seasons, which help processors maximise the value of the catch.
• Fleet efficiency gains – Significant increases in efficiency due to changes in pot design that increase catching efficiency. Scenario 1c has a 10 per cent, 3d has a 15 per cent, and 4d a 40 per cent increase in the catching efficiency of pots. Pots with greater catching efficiency allow fishers to reduce costs and hence increase profits. There are a variety of views within industry regarding how much more efficient pot designed could be. In the past, fishers have shown great ingenuity and innovative when it comes to designing pots which
71

catch much better under a variety of conditions than the standard pots. For instance, very large circular wire traps with side entrances, for the whites and parlour type traps, which prevent lobsters form escaping over two- to five-day pulls.
Under the various management options (particularly ITQs), fishers will have incentives to seek out ways to make their fishing business more efficient. They will respond to management rule and other changes in their fishing/business environment by assessing and reassessing the best way to fish. For example, fishers’ adjustments to the 18 per cent pot reduction in 1993-94 and the more recent removal of the ‘150 pot rule’, and the effort rule changes for the 2005-06 season, which are yet to fully play out in the industry. Changes in fishing behaviour/patterns do not usually occur in a single season but rather it is several seasons before the impacts of any management changes have fully played out in the industry. Management changes (e.g. pot reductions, moon closures, changing management to ITQs, etc) can generate efficiency gains in ways that cannot easily be foreseen and incorporated into modelling. These gains are what economists refer to as dynamic efficiency gains. For example, at the moment, there is undoubtedly “capital stuffing”44 under Scenarios 1 and 1c, as some capital expenditure (on boats, equipment and technology) is about catching lobster ahead of anyone else, as opposed to catching lobster more cost effectively. Under the ITQ management options, the incentive is for fishers to develop fishing strategies and to invest in boats, pots, and other gear that will enable them to catch their quota in the most cost effective way possible45. This is a dynamic adjustment that cannot be modelled at this stage.
Sensitivity of $ benefits to increases in price/kg Price increases were built into the some of the management options to reflect the enhanced marketing opportunities associated with an extended season and within and between years catch stability. The price levels and price increases used in the modelling exercise were derived from a variety of sources, including processors. The price data and rationale for the price increases used in the model are discussed in detail in Chapter 5 of ERA’s report. The price increases used change the absolute price levels between the various management options, but the pattern of prices within the season is the same for all management options (generally, there is a price increase from the beginning to the end of the season). The assumed price increases for having an extended season and having greater within and between years catch stability, are based on information from the processing sector. They reflect the current state of knowledge about the world lobster markets and the product prices achievable under different seasonal supply patterns.
44 Capital stuffing in the sense used here means that fishers spend a lot of money on items (boats, technology, etc) to catch the maximum number of lobsters they can, even though some of the expenditure may not be very cost effective. 45 It has been noticed in some ITQ fisheries (e.g. New Zealand) that fishers (particularly those leasing quota who are on slim profit margins) neglect or put off boat and other gear maintenance to reduce their costs, which can lead to reduced safety for the skipper and crew.
72

In order to show the contribution of different price increases on the average annual $ benefit outputs estimated by the model for the alternative management options, ERA have compared two sets of ITQ options where the only feature to change between them was the price increases. The options compared were ITQs with the current controls on pot numbers (3c and 3d) and ITQs with reduced effort controls that allowed pot numbers to increase by 20 per cent (4c and 4d). The price increase in 3d and 4d ($1.00 and $1.25/kg respectively) were only half of those used in 3c and 4c ($2.00 and 2.50/kg respectively). The comparative results are shown for the total fishery in Figure 8. These results show that, while the annual $ benefit outputs of the model do change due to the different price increases used, they do not change markedly. The level of recruitment to the fishery (and hence catch) and efficiency gains are of much greater significance in explaining the level of annual $ benefits the model estimates for the different management options. In short, the price increases assumed in the model are not the key drivers of the estimated profits the fishery makes under the different management options, the size of the annual catch and the efficiency gains are more important. For example, halving the price increases used in the model, as shown for the ITQ options 3c ($2.00/kg) compared to 3d ($1.00/kg), changes the net benefits obtained by less than 14 per cent on average over the 10 years of the model run.
-
20,000,000
40,000,000
60,000,000
80,000,000
100,000,000
120,000,000
140,000,000
1 2 3 4 5 6 7 8 9 10
Scen 3c Scen 3d Scen 4c Scen4d
Figure 8: Total industry net benefit sensitivity to price increases
[Note: Scenario 3c and 3d are variable ITQs with the current effort (pot number) controls and price increase of $2 and $1/kg respectively; Scenario 3c and 3d are variable ITQs without the current effort (pot number) controls, i.e. pot numbers are increased by 20 per cent and price increases of $2.50 and $1.25/kg respectively.]
73

It should be noted that if there was a different pattern of within season price increases than the model assumes, it will almost certainly induce fishermen to change their fishing behaviour, which could affect both the gains from the assumed price increases and the efficiency gains. Hence, the model results using different price increases should be seen as indicative only. There is an important conclusion to be drawn from these results. Across all the management options, the efficiency gains (i.e. the reductions in fishing costs) that are achieved are generated from within the industry itself. Competitive pressure will ensure that these gains are achieved over time and in this sense the efficiency gains are relatively more certain of being achieved (i.e. they are more “bankable”), than the $ benefits estimated from the price increase components of the model. The gains from the price increases are dependent on many factors associated with world markets, which are outside the direct control of the industry. Gains achieved due to prices increases just enhance the more significant efficiency gains associated with each management option. Rock lobster is increasingly being seen as a commodity in the market place. Commoditisation means that producers face internationally determined world prices and must be cost competitive at those prices to ensure long-run viability. With prices set in world markets, the key is to be able to reduce fishing costs to levels consistent with those prices. The relative ranking of the different management options is not affected by the price increases. Changes in the price increases only change the absolute magnitude of the annual $ benefits, but leave ITQ option 4 (a to b) the highest ranked. The model results show that ITQ option 4 (a to b) offers the greatest scope for efficiency gains because it allows the greatest flexibility to adjust capital inputs (pots and vessels) to optimise effort to best match the ITQs. The other management options (1, 1c, 2 and 3 (a to b)) do not allow the maximum efficiency gains to be realised.
Compliance – Illegal Fishing and Selling of Lobsters
Effort control system Under an effort control system, the main areas of compliance concern are over potting, selling (consigning) undersize and protected females (over the legal size, setose and tarspots) and unlicensed or recreational fishers selling lobsters. Enforcement resources are focused on these areas and under the current system there appears to be sufficient levels of inspection, along with severe penalties, to keep these illegal activities under control. There are no checks on the amount of legal size lobsters a fisher can catch or sell under the current system which, compared to an ITQ system, makes enforcement relatively simple and cost effective, as each fishers’ daily catch does not have to be recorded and assessed to ensure he is within his quota.
74

Quota system Under a quota system, the biological controls (minimum size, protection of berried, tar spot, setose and maximum size females) would be maintained, whereas controls on pot numbers, closed seasons and pot design could be relaxed, either on implementation of an ITQ system or after a transition period when the new system had stabilised.46
Under ITQ systems, it is generally considered that there is a significant risk of a black market developing for illegal catch. This is because lobsters (like abalone) are high-value, low-volume species, which means significant $ amounts can be easily transport in the boot of a car or hidden among other cargo on trucks (as has occurred in the past with undersize lobsters). By comparison, it would be very difficult to see a black market developing for low-value, high-volume fish, such as mullet, if they were managed under an ITQ system. The black market risk is increased considerably with western rock lobsters because there is a very long and, in places, isolated coastline along which illegal lobsters could easily be landed with little possibility of detection. There would need to be very tight security and inspection of boat movements, weigh-in stations and consignment dockets and severe penalties to keep quota cheating from undermining the ITQ system. Under ITQs, enforcement would be likely to become much more intrusive (e.g. to check the quota paper trail), black and white, and knifed edged (i.e. there would be no warnings given for cheating on quota) and the penalties would have to be severe. See the Compliance section under A Catch Quota System (ITQ), above, and Mclaughlan, M. 1994, ‘Long-term Management Strategies for the Western Rock Lobster Fishery. Law Enforcement Considerations’, in Volume 4, Fisheries Management Paper No. 7047, for more discussion of compliance/enforcement issues relating to quotas.
Modelling Different Variations of Effort and Quota Systems There are different ways to manage fishing effort and quota systems and many different assumptions that can be put into the bio-economic model that will give different results to those presented above. Because space is limited, and the desire not to get bogged down in the complexity of testing too many possibilities, four major options with variations have been tested (options 1, 2, 3 and 4). These provide a large spectrum of possible outcomes, which should indicate the upper and lower boundaries for the main issues of interest, i.e. breeding stock levels, catch and effort, boat numbers and $ benefits that the different management systems could potentially deliver (upper boundary – ITQ option 4 with a 20 per cent increase in pot numbers, and lower boundary – the current management system option 1).
46 If it were decided to introduce an ITQ system, it would initially be implemented with the full set of effort controls (including controls on pot numbers) that are used under the current system. 47 Available on the Department of Fisheries web site at www.fish.wa.gov.au and the Western Rock Lobster Council web site www.rocklobsterwa.com Copies can also be obtained by phoning the Fisheries Department on 9482 7267.
75

Social Issues Below is a summary of the initial findings of a three-year research project funded by the Fisheries Research and Development Corporation, titled A Social Assessment of Coastal Communities Hosting the Western Rock Lobster Fleet, produced by V. Huddleston of the Institute for Regional Development, the University of Western Australia, December 200548. This report should be read in conjunction with this section. This project still has about 18 months to run, so the results presented are preliminary and are likely to change as additional information becomes available. The project will also track the current management review process and industry’s perceptions of the likely impact of the different management options.
Community development extends beyond the formal economy to consider the needs of the population at large, and that in setting about its task it aims to balance economic, social and environmental concerns, rather than prioritising the economic approach above all else (Haughton, 1999, p. 8)49.
Analysis of 17 coastal communities between Kalbarri and Augusta revealed trends in population, employment and housing that are important in assessing the general socio-economic characteristics of the communities. The growth of most of these communities can be traced to the development of the rock lobster industry in the late 1950s and early 1960s. The rapid expansion of the lobster fishing industry led to ad hoc residential development at many points along the coast, many of which were reached by sea and virtually inaccessible by road in the early years. Most of the communities experienced substantial population growth between 1991 and 2001. The median age increased because of ageing in situ, and the increasing number of retirees from inland communities and larger centres. Most of the communities also exhibit high dependency ratios50 compared with the Australian and Western Australian ratios. This has significant economic implications, given the need to invest in social infrastructure such as schools and health care for the dependent population. Some communities also exhibit a large seasonal population change, with the number of dwellings not permanently occupied ranging between 15-20 per cent and 60-70 per cent of the total number of dwellings. This seasonality is likely to affect business activities in the communities. Localities or regions with diverse economies are generally more able to withstand downturns in a particular sector or industry. With the 17 communities, economic diversity has been measured by using the proportion of persons employed in the top three sectors to the total number of persons employed per community. A higher ratio 48 Available on the Department of Fisheries web site www.fish.wa.gov.au and the Western Rock Lobster Council web site www.rocklobsterwa.com Copies can also be obtained by phoning the Fisheries Department on 9482 7267 49 Haughton, G. (ed.) 1999, Community Economic Development, The Stationery Office, London. 50 Defined as the combined child population (0-14 years) and the aged population (65 years and over) – persons in the dependent ages, to every 100 people of the intermediate age population (15-64 years) – economically active ages
76

would indicate that the community is highly dependent on the top three sectors of employment and is thus less diversified in economic terms. With the exception of Yanchep, Jurien Bay, Geraldton and Fremantle, the rest of the communities exhibit lower- to moderately-diversified economies. In the smaller fishing communities, unemployment rates are almost double the national average. Smaller fishing communities also have high levels of part-time employment. Median weekly incomes for most communities are comparable to the national average ($300-$399). The number of boats operating in the lobster fishery declined across the 17 communities resulting, in some cases, in a potential loss of fishing-related physical facilities in some communities. The number of persons engaged in the fishery also declined, with important implications to small businesses operating in the accommodation, cafes and restaurant sector. Some communities have been found to be less resilient and more sensitive to external changes while others have greater capacity to handle change. Measuring Community Resilience In measuring community resilience, time-series indicators to describe the resilience or sensitivity of communities and regions to change51 were used to provide an indication of the “fragility” or “robustness” of the community to change or shocks. The selection of the indicators in this research has been restricted to those that are available in a time series format and for which 2001 Census data are available. In addition to Census data, two fishery-related indicators were also included in the computation of the resilience scores. Data from the Department of Fisheries were those of the 1991-92, 1996-97, 2001-02 and 2004-05 WRL seasons. The specific time series indicators used in measuring community resilience include percentage changes in:
1. Total resident population; 2. Elderly dependency ratio
defined as the number of elderly people for every 100 people of working age;
3. Child dependency ratio defined people of working age;
4. Number of occupied dwellings;
51 Coakes Consulting 2002, Socio-Economic Assessmthe Conservation Commission and the Forest Produc
Resilience is the ability to cope with change. To expressmore fully:
Resilience is the capacity of human groups or communities to cope with environmental, economic, political or other kinds of change stemming from internal or external factors. It is related to uncertainty vulnerability and risk and it can be considered at various geographical and temporal scales. An alternative interpretation of resilience is the capacity and speed of an ecosystem to recover from a disturbance. This refers either to the elasticity of the ecosystem which enables it to accommodate change while maintaining its original state, or to the elasticity ofan ecosystem which permits the assimilation of change by transformations of the ecosystem (Sustainability and Public or Private EnvironmentalManagement web-accessible database of glossary items relating to subjects of sustainability, 2005).
,
as the number of children for every 100
ent of the Forest Management Plan prepared for ts Commission, August 2002.
77

5. Labour force participation rate, calculated by expressing the number of persons in the labour force as a percentage of the population aged 15 years and over;
6. Unemployment rate defined as the number of unemployed people expressed as a percentage of the labour force;
7. Economic diversity, measured as the proportion of persons employed in the top three sectors to the total number of persons employed;
8. Total pot lifts for the whole season; and 9. Number of boats recorded in December.
To derive the composite indicator of community resilience to change, a scoring system was adopted ranging from -3.0 to 3.0 points. The scores for each of the indicators are then summed to provide a Total Resilience Score (TRS) for each community. The TRS is based on the direction and magnitude of the percentage change in each of the indicators between the 1996 and 2001 census periods and between 2001-02 and 2004-05 WRL seasons. The resilience scores vary between -27 to 27, with high positive values indicating greater robustness to change and large negative values indicating greater fragility and sensitivity to change.
4.0
-5.0
3.0
6.0
-3.0
-3.0
-5.0
7.0
3.0
15.0
15.0
12.0
15.0
-3.0
15.0
-4.0
-10.0 -5.0 0.0 5.0 10.0 15.0 20.0
Kalbarri
Geraldton
Dongara
Leeman
Green Head
Jurien Bay
Cervantes
Lancelin
Ledge Point
Two Rocks
Yanchep
Fremantle
Mandurah
Bunbury
Busselton
Augusta
Community
Number of
Persons Engaged
Augusta 7 Busselton 3 Bunbury 12 Mandurah 48 Fremantle 154 Yanchep 6 Two Rocks 90 Ledge Point 55 Lancelin 124 Cervantes 92 Jurien Bay 78 Green Head 31 Leeman 96 Dongara 140 Geraldton 211 Kalbarri 29
Figure 9 showing Overall Community Resilience Scores and Table 4 showing number of persons engaged in the WRL fishery in December
2004 While the overall resilience scores may change with the inclusion/refinement of other indicators, as data becomes available during the course of this research52, these resilience scores indicate that some communities are better able to handle change (i.e.,
52 For example, once the community surveys are complete, indicators on social capital and human capital will be incorporated in the overall resilience scores.
78

they are more resilient) and others less so. More resilient communities are Mandurah, Busselton, Two Rocks, Yanchep and Fremantle. Less resilient communities are Geraldton, Green Head, Jurien Bay, Cervantes, Bunbury and Augusta. Analysis of interviews revealed fishers’ perceptions of the problems and issues confronting them during these times of uncertainty over the price of lobsters and increasing input costs such as fuel. Lower profitability has resulted in some fishers leaving the industry and an ongoing struggle for others who remain. As one respondent put it:
“The economics of fishing are now far more important than they used to be. It used to be lifestyle, but this is changing now, with people thinking monetary wise [in financial terms] before any other reason.”
Fishers’ perceptions on alternative management options indicate a number of potential positive and negative impacts at the economic, social, environmental and management levels. The preliminary findings from interviews and consultations highlight the fact that:
• Lobster fishers had been instrumental in the earlier growth and development of coastal communities, with business operations and employment revolving primarily around rock lobster fishing.
• While rock lobster fishing is no longer the dominant economic activity in
some of these communities, it is still regarded as a significant economic and social contributor to local economies and communities.
• These communities/locations have offered good fishing grounds and a relaxed
secure lifestyle.
• For communities that have young families, these towns offer a good environment for raising children.
As the towns grew, their populations increased and their economies became more diversified, they were less dependent on the lobster fishery. The decline in the number of rock lobster fishers, coupled with younger fishers being less community oriented, have resulted in rock lobster fishers becoming less involved in community events and activities and generally becoming less community-minded. Nonetheless, there are still some fishers who contribute both financially and physically to community activities. With the increased mobility of the fleet, the number of wives participating in community/school activities is also higher because they are left behind to look after the children. Rock lobster fishers spend their income mostly in their community of residence and contribute to the financial well-being of these communities. As in most small towns, there is some social segregation (e.g. old residents and new residents). There are also disadvantages especially for those with children of high school age. Parents face the dilemma of sending the children to boarding school or having split families, with the husband staying behind in the coastal towns and the
79

wife and children relocating somewhere else. For the older population who require more intensive health care, these towns have limited medical care. A key finding of this report is that a workable management arrangement for the fishery requires the support of those involved – fishers and industry managers – and the other stakeholders in the communities, including business groups, local government and community residents. Having an intensive and open consultation and ongoing information flow among the various stakeholders would go a long way towards ensuring that any management changes that may be introduced in the fishery will result not only in a sustainable fishery but also in viable and contented communities.53
Boats Numbers and Employment This section, which is based on Chapter 7 of ERA’s report,54 looks at the possible employment impacts of the various management options, due to a reduction in boat numbers. As previously mentioned, the number of boats in the fishery has declined from 836 in 1964, to 495 as at December 2005. The decline does not appear to be slowing and under the current price-cost squeeze the industry is experiencing, it could even accelerate. Modelling results show that the number of boats declines under all management options, including the current management system, where the model estimates that 44 boats will leave the fishery. However, as shown in Table 3 above, the decline is greater under the 20 per cent pot reduction option (69 leave the fishery); and 293 (more than half) leave the fishery under the ITQ option with reduced controls on effort (pot numbers). How long it will take for the fleet to rationalise under the different management options is difficult to assess. However, if fishers’ responses to other changes in the management system can be used as an indicator (e.g. the 18 per cent pot reduction in 1993), it is likely that any major change to the current management system (e.g. a significant pot reduction or moving to ITQs) would initially see a rapid reduction in boat numbers. It is likely that boat numbers would then decline more gradually and as the fleet got smaller the decline would become even slower. Employment in the rock lobster fishery is considered to be a function of the catch and effort measured as pots per vessel, pot lifts and vessel numbers55. Currently the most
53 A Social Assessment Of Coastal Communities Hosting The Western Rock Lobster Fleet, produced by V Huddleston of the Institute for Regional Development, University of Western Australia, December 2005. Available on the Department of Fisheries web site www.fish.wa.gov.au and the Western Rock Lobster Council web site www.rocklobsterwa.com Copies can also be obtained by phoning the Fisheries Department on 9482 7267 54 See A Bio-Economic Evaluation of the Management Options for the West Coast Rock Lobster Fishery, produced by Economic Research Associates on the Department of Fisheries’ web site at www.fish.wa.gov.au or the Western Rock Lobster Council’s web site at www.rocklobsterwa.com or phone the Department of Fisheries on 9482 7267 for a hard copy. 55 For further details see A Bio-Economic Evaluation of the Management Options for the West Coast Rock Lobster Fishery, produced by Economic Research Associates on the Department of Fisheries’
80

common configuration per vessel is three crew members, consisting of one skipper plus two deckhands. This seems to be relatively stable because the current management regime has produced a fairly stable annual pot lift figure over the years. Figure 10 below shows the number of vessels and pot lifts over the last decade.
500
520
540
560
580
600
620
640
660
93/94 94/95 95/96 96/97 97/98 98/99 99/00 00/01 01/02 02/03 03/04 0
2000000
4000000
6000000
8000000
10000000
12000000
14000000
16000000
VesselsPotliftsCatch
Num
ber
of V
esse
ls
Num
ber
of P
ot L
ifts a
nd C
atch
(kgs
)
Figure 10: Vessel, pot lifts and catch (kgs): 1993-94 to2003-04
While vessel numbers have declined, the other key driver – pot lifts – has not changed as much and has held up at a stable level, which indicates that pots and pot lifts per vessel have increased. Figure 11 shows the results of using two different methods vessels numbers only and of using combined vessel numbers and pot lifts to estimate the employment impacts of the various management options. Figure 11 shows the position 10 years ago, at the Census year, currently, and then for each of the management options at the end of the 10-year modelling period.
web site at www.fish.wa.gov.au or the Western Rock Lobster Council’s web site at www.rocklobsterwa.com or phone the Department of Fisheries on 9482 7267 for a hard copy.
81

0
500
1000
1500
2000
2500
ten yearsago
current scen 1 scen 1c scen 3c scen 3d scen 4c scen 4d
Employment Based on Vessels Empoyment Based on Vessels and Pot Lifts
Figure 11: Employment change by scenario based on vessel numbers and pot lifts
Employment is highest under the management options where effort (pot numbers) are controlled (scenario 1 – the current management system, 1c – the current system with a 20 per cent pot reduction and 3c and 3d – the ITQs with the current pot number controls maintained). Employment is lowest under 4c and 4d, the ITQs with reduced effort (pot number) controls, where vessels are allowed to fully adjust to quota.
Flow on Employment Consequences ERA state in their report that previous impact studies of commercial fishing have estimated an employment multiplier of 3.28 for rock lobster fishing in Western Australia, i.e. for every person directly employed in rock lobster fishing, there are 3.28 people employed in other areas (for example, processing, boat building, and so on). Using this estimate, we can estimate the total employment impacts of each management option as shown in Table 5. Using the vessel number and pot lifts method, employment is just over 5,900 currently and reduces to 5,739 for Scenario 1; to 5,031 for Scenario 1c; to 4,801 for Scenario 3c; to 4,794 for Scenario 3d; and to just 3,800-3,900 for Scenarios 4c and 4d. While there will be some flow-on or indirect employment impacts associated with any reduction in direct employment of skippers and crews, their magnitude is not easy to assess. In broad terms, much the same quantity of fuel and bait will be purchased, boats will need to be repaired although there may be fewer of them, and pots and
82

other fishing gear will need to be replaced. Hence, these conventional multiplier impacts are likely to overstate the negative impact on employment.
Table 5: Estimates of employment by Scenario based on pot lifts and vessels
10years
ago current scen 1 scen 1c scen 3c scen 3d
scen 4c
scen 4d
Vessel Based Estimates
Aggregate Direct
Employment 1917 1647 1515 1440 1515 1515 777 768 Employment
Multiplier 3.28 3.28 3.28 3.28 3.28 3.28 3.28 3.28 Total
Employment Impact 6288 5402 4969 4723 4969 4969 2549 2519
Change Compared to Base Case 0 % -5 % 0 % 0 % -49 % -49 % Combined Vessels and Pot Lift Based Estimates
Aggregate Direct
Employment 1917 1808 1750 1534 1464 1462 1188 1178 Employment
Multiplier 3.28 3.28 3.28 3.28 3.28 3.28 3.28 3.28 Total
Employment Impact 6288 5930 5739 5031 4801 4794 3897 3864
Change Compared with Base Case 0% -12% -16% -16% -32% -33%
There are fewer representative boats in the fishery in all zones, whichever scenario is adopted. In the case of Scenarios 1, 1c, 2 and 3, the change is broadly in line with past trends. Under the ITQ Scenario 4, the boat numbers are approximately halved, with the adjustment occurring largely during the implementation phase. Fewer boat numbers under all scenarios means reduced direct employment opportunities for skippers and deck hands in the lobster fleet. In the case of Scenario 4, the reduction in employment opportunities for crew over the implementation phase is most pronounced. This, on the other hand, should see incomes rise among the fewer boats that remain. If any of ITQ management alternatives (Scenario 3 or Scenario 4) were adopted, the changed employment requirements would pose a new set of challenges for industry if it were to attract and hold suitably skilled, experienced and reliable pool of deck hands. These challenges are additional to those already confronting the industry under the existing arrangements as a consequence of very competitive remuneration being offered by emerging industries in the Mid-West such as mining.
83

Lifestyle choices The bio-economic modelling is based on profit optimising behaviour of the operator of the representative boat in each lobster fishing zone. In practice, business choices made by individual fishers about when they fish, where they fish, and how they fish may be a trade-off against lifestyle preferences that are about lifestyle optimisation, particularly where family-run businesses are generally involved. This should not be taken as suggesting that such behaviour is less than optimal from society’s viewpoint. However, such trade-offs can result in the net $ benefits being different to the modelling results and outcomes. This may see more boats remaining in the fleet, and, consequently, the employment impacts may be less.
Who will own the quota and will wealth distribution changes? The marketplace may view ITQs as a more secure and reliable share of the catch than pots. Therefore if the fishery were to move to an ITQ system, investors and processors may show more interest in owning or leasing quota than they currently do in owning or leasing pots. However, for investors in particular, there is still a similar level of security around “quota rights” in the same way as there is around unit (pot) and boat licences. That is, the Minister for Fisheries will have the authority to vary, suspend and cancel quota in a similar same way as currently applies to unit (pot) and boat licences. Investors and processors would make their investment decisions based on the $ return they could receive on their ITQ compared to other investment opportunities (e.g. real estate, shares, etc). Processors may also want to hold quota to ensure a continuity of supply at particular times of the year. In other fisheries around the world, there have been mixed experiences with changes in quota ownership. Some ITQ fisheries, particularly those with large volumes and high processing/catching infrastructure costs, appear more prone to purchase by processors/corporations than other low-volume, high-value fisheries, which appear more likely to stay in the hands of family fishing businesses. A trend towards a change in the composition of ownership of rock lobster entitlements is already apparent under the current system (investors buy unit – pot – entitlements and lease them out) and it is likely to continue. This trend may accelerate under an ITQ system for the reasons discussed. The experience in some ITQ fisheries where there has been a significant shift in the ownership of quota entitlements to investors/processors, and hence in the wealth distribution, is that it has resulted in a reduced sense of stewardship towards the resource. That is, the industry takes less ownership and responsibility for sustainability of the resource.
84

Quota Experience in other Rock Lobster Fisheries The following section describes the rock lobster quota management experience in South Australia, Tasmania and New Zealand and has been extracted from paper titled How do Quota Management Systems Work in Rock Lobster Fisheries? The Experience in New Zealand, Tasmania and South Australia, by Tim Bray, Steven Gill and Ron Edwards, Department of Fisheries, 2005.56
Findings Quota management systems are now in place for the New Zealand, Tasmanian and South Australian rock lobster fisheries. New Zealand was the first to move to QMS (1989), followed by the Southern Zone of South Australia (1993), Tasmania (1998) and Northern Zone of South Australia (2001). Throughout the world of fisheries management, there are a number of assumptions made about quota management systems. Most common are that under a QMS the fleet size falls, the ownership of commercial fishing access rights will concentrate, and there will be vertical integration through the catching and processing sectors. These assumed effects are made because the economic theory is that there are strong incentives for fishing fleets to restructure in order to become more efficient and focus on maximising the value of their catch as opposed to investing in inputs to maximise their catch. As part of a review of the system of management used for the West Coast Rock Lobster Fishery, a Western Australian delegation visited New Zealand, Tasmania and South Australia in 2004 to learn more about the management systems used for their respective rock lobster fisheries. The delegation wanted to test the quota management theories by observing and learning from the experience of similar fisheries that are quota managed. In particular, the delegation went to learn about the regulatory approach taken, and understand what effect that approach has had on the fishery and the industry from a resource sustainability, economic and sociological perspective. Each of the fisheries visited targets the southern rock lobster (Jasus edwardsii). The delegation found that common to all these management systems is the use of a total allowable commercial catch (TACC) to constrain the industry’s annual catch. The TACC is then divided into transferable quota units held on licences that are renewed annually. All fisheries complement the TACC with the use of biological controls, i.e. size limits and protection of animals in a breeding condition. Further analysis reveals that the regulatory approach taken beyond these common areas differs. Key differences include the presence or absence of: zones within the
56 Available on the Department of Fisheries’ web site at www.fish.wa.gov.au and the Western Rock Lobster Council’s web site at www.rocklobsterwa.com and available in hard copy by phoning the Department of Fisheries on 9482 7267.
85
fishery, closed seasons, limitations on pot use, pot design and restrictions on the transferability of units of entitlement (both pots and quota). The delegation observed that the absence or presence of these add on measures influences the behaviour of the industry both with respect to investment and fishing strategy decisions. Relevant literature supplied to the delegation supports many of these observations. This report groups its analysis of the respective management systems in two categories.
Fisheries management For each of the fisheries observed, the decision to move to a QMS was primarily based on the need to address sustainability concerns. In all cases, the inability to successfully manage under the pre-existing input-based systems made the decision to adopt a QMS one that was ultimately supported by the government and the majority of industry. Subsequent to implementing a QMS, each of the fisheries have experienced significant improvements in key sustainability indicators. The notable exception is the Northern Zone South Australian Fishery where the QMS is just in its second season of operation. Most have attributed the success of QMS to the setting of a TACC that actually constrained or reduced catch and in doing so allowed the stock to rebuild, and in some cases rebuild quite rapidly. The need to set a TACC has meant that the stock assessment process now comes under even further scrutiny – even though the TACC in each of the fisheries has changed very little in percentage terms since first introduced. Noting that QMS has been largely successful for management of these rock lobster fisheries, it is important to note that the failure of the previous management systems cannot be solely attributed to the fact that they were input managed. For example, senior South Australian research scientists believe that the over-reliance on catch per unit effort data obtained from the industry in the stock assessment for the Northern Zone Fishery process was a major contributing factor. The level of information available to the delegation on the cost of managing the fisheries under QMS varied and was not complete. However, the clear indication from fisheries managers and industry alike was that the greatest cost burden is experienced in the first few years as the fishery goes through a transition. The experience has been that the most significant cost impact has come from compliance and, to a lesser extent, research. Without exception, compliance was identified as an issue and there are two key elements: (i) accountability of the catch recording system for the licensed commercial fishers; and (ii) illegal take by unlicensed operators for the black market. A successful compliance program needs to have strategies to address both of these risks. The temptation to focus on tracing the catch of licensed commercial operators could
86

result in the expansion of black market activity – undermining the entire management process.
Industry dynamics and fishing patterns The response of industry to the introduction of a QMS in terms of their behaviour was an area of particular interest to the delegation, and there were some interesting findings. The first point of interest is that for three of the four fisheries there was recognition, either explicitly or implicitly, that prior to entering the QMS there was an over-capacity issue and that the new system should facilitate fleet restructure. Accordingly in New Zealand, Tasmania and Northern Zone South Australia, there has been a reduction in both boat numbers and the number of entities owning quota units. The key elements that are present for each of the fisheries where there has been a significant level of restructuring are: (i) a TACC that constrains catch and in doing so created or exacerbated fleet over-capacity – the greater the imbalance, the greater the force for restructuring; and (ii) a system that allows a market for units of entitlement to function relatively freely. The rate at which the fleet adjusts following the introduction of a QMS is a separate issue, and is most likely dependent upon the extent to which the management system limits aggregation of quota units and the degree to which the initial allocation of quota redistributed catch. When considering the Southern Zone South Australian Fishery, where there has not been any significant change in fleet size, it is apparent that the economic forces that would drive the fleet to restructure can be considerably dampened by regulation designed to prevent aggregation. In this case, it is also relevant to note that at the time the fishery moved into QMS the market for southern rock lobster was particularly buoyant and industry was highly profitable. This combination of circumstances has created an environment in which participants in the fishery have a particularly good lifestyle. The price for this lifestyle is a relatively constrained quota market, and the risk is that the fundamentals that underpin the economics of the fishery change and regulation inhibits the industry’s ability to adjust in order to maintain profitability. As trading and leasing in quota (and pots within the Australian fisheries) occurred, the value of entitlement both increased and increased quite rapidly. The rapid increase in the value of entitlement is a function of demand. The demand to buy and lease quota immediately following the introduction of a QMS is spurred by the need for participants to adjust the volume of catch to the size of their operation. It is also apparent that the improving health of the fisheries under QMS and the resultant increase in catch rates improved profitability and added confidence to the market. The trade in quota is mostly fuelled by people leaving the fishery, and to date the majority of investment in quota entitlements has come from within the existing rights
87

holders. These investors are typically “topping up” their own operations or putting quota into the lease market. Retiring fishers who choose not to sell their stake in the fishery also supply the lease market. Across all of the fisheries, it is apparent that the profitability of fishing is less for a fisher who leases entitlement as opposed to an owner/operator. The growing presence of lease fishermen (quota catchers) in these fisheries has both fisheries managers and industry leaders concerned that there is less stewardship of the resource. The development of the Chinese live market for southern rock lobster in the 1990s resulted in very high prices being realised during the southern hemisphere winter. This coincided with a move to QMS for all but the Northern Zone South Australian Fishery. In the QMS fisheries, there was a change in fishing patterns. The industry has moved away from targeting high catch rate periods and landing a variety of lobster with respect to size and colour, to an industry that increasingly supplies a size and colour of lobster to the market when the market is prepared to pay the highest price. This change in fishing strategy has occurred because the rush to fish no longer exists and it is therefore possible for processors to provide direct market signals to fishermen through regular changes in beach price. The change has been greatest in Tasmania and New Zealand, where the fishing season is structured so that the quota year ends at a traditionally high catch rate period giving fishers confidence that they will be able to take their full allocation.
General Observations The transition into QMS for the New Zealand, Tasmanian and South Australian fisheries has, on the whole, been positive. Where the systems have been in place for a number of years, it is clear that the setting of a TACC can be a very effective tool for managing sustainability, provided that the TACC setting process is underpinned by quality research and reinforced by a comprehensive compliance program. Where fleet over-capacity is an issue, the move to a QMS can accelerate the process of restructuring when combined with a management system that allows the trade and lease market to function relatively freely. The price of access to the fishery inevitably rises. On the one hand, this has a positive effect with respect to return on investment, however it will inevitably make the cost of entry high. It is possible for within season price premiums to be realised through changed fishing behaviour when market signals are provided directly to fishers via processors. There are opportunities under QMS for participants to improve their quality of life by reducing the amount of time spent fishing while maintaining profitability.
88

Conclusions The aim of this review report was not to recommend one form of management over another, but rather to provide stakeholders with information on the management options that are available and the major issues involved with them and benefits they have to offer. The debate on the most appropriate management system for the industry has been given additional momentum over the last few years because the industry is experiencing a significant “cost-price squeeze” that is unlikely to diminish in the near future. If changes to the management system can improve the industry’s efficiency and produce significant extra benefits, then they need to be thoroughly evaluated. It is hoped that stakeholders will find the information provided useful for the forthcoming discussions on which management system (effort controls or ITQs) provides the best long-term social, economic and biological benefits for the Western Rock Lobster Fishery. If, after full consultation involving all stakeholders, it were decided to change the fishery’s management system (i.e. to make changes to the current system or introduce quotas), the changes would be implemented cautiously and gradually. This would ensure all stakeholders became accustomed to the changes and to carefully monitored them to determine if they were having any negative or unforseen impacts. The bio-economic model that the consultants ERA have developed to assess the performance of the fishery under different effort control and ITQ management systems has produced interesting results that need to be carefully evaluated by fishers and the industry generally. This report has highlighted the assumptions in the model that have the greatest impact on the performance (particularly economic) of the different management options. The large efficiency gains (i.e. reductions in fishing costs through more efficient pots and reduced boat numbers) and, to a lesser extent, price increases are the major drivers in the model for fleet rationalisation and hence the net $ benefits this results in. ERA’s modelling results indicate that overall the ITQ management systems offer greater scope for fishers to be more efficient (i.e. to reduce their costs) and for processors to maximise the value of the catch (and hence the beach price paid to fishers). However, as explained in the report the significant $ benefits that the model estimates for the ITQ options are dependent on fishers maximising the potentially large efficiency gains and processors maximising the potential market opportunities that ITQs offer. The bio-economic modelling results need to be balanced against the risks regarding the breeding stock, non-compliance and quota avoidance, together with the increased economic and social dislocation costs that could flow from the implementation of the different management options. These costs will flow through to management charges and, as a consequence of fleet rationalisation (e.g. reduced boat numbers, fleet centralisation at a reduced number of ports, etc) and operation cost adjustments, they will also flow through to regional communities. The modelling does not take into account the impacts of the transition time that it takes to move from the current,
89
steady state management arrangements to a steady situation under a new system of management, which could vary from a few years to a decade or more. Noting that there are additional costs and risks associated with changing to a different management system, the benefits would need to be significant. Industry would possibly need to gain a 10% increase in annual net ($) benefits ($20 to $30 million per year) compared to the current system to warrant implementing a new approach. Desirably, the Western Rock Lobster Council will work with industry to identify the two or three key options (including the status quo) early in the consultative process, so that the focus of the debate can be brought to bear on those options that could have the greatest benefit for the industry and the community. The challenge is for industry members to understand the reports that have been provided, with the assistance of the industry appointed facilitator and relevant Department of Fisheries staff, in order to develop an informed view. This will facilitate effective communication with colleagues, fishermen, relevant peak bodies and the Rock Lobster Industry Advisory Committee, to enable industry to recommend future directions for the management of this fishery. Details of the consultations that will commence in February 2006 are provided in Attachment 2.
90

Attachments Attachment 1
Definition Of Terms And Abbreviations Table 1
TERM OR ABREVIATION
DEFINITION OR MEANING (in relation to the Western Rock Lobster Fishery)
Breeding stock Rock lobsters that are sexually mature. Catch rate or catch per unit of fishing effort
The average weight of rock lobsters caught each time a pot is pull, i.e. it is the total weight of rock lobster caught each season divided by the total number of pot pulls for the season. For example, if a fisher catches 15,000kg and makes 20,000 pot lifts for the season, then his average catch rate for the season is 0.75kg of lobsters per pot lift.
Exploitation, also referred to as the exploitation rate
The number (or weight) of legal size rock lobsters that are taken from the population/stock each season out of the estimated total biomass of legal size lobsters in the population.
Effective fishing effort
Effective fishing effort takes into account the increases in fishing efficiency that have taken place over time.
Fishing effort The number of pot pulls or lifts a fisher makes in a year. For example, if a fisher had 100 pots and fished them for 185 days in the season, he would have made 18,500 pot pulls for the season. If every fisher’s fishing effort is added up at the end of the season, it gives the total fishing effort expended in the fishery. This measure of fishing effort does not take into account the efficiency increases that have occurred in fishing operations since 1964, when a pot was not nearly as efficient/effective as it is now.
Fishing efficiency
This is the measure of how efficient the fishing effort is, i.e. how effective a pot lift is. Fishers did not fish as efficiently in 1964 as they do in 2005. This is because they now have much better boats, pots, and technology (GPS, colour sounders).
Individual transferable effort ITE
An ITE is a unit of fishing effort (e.g. a rock lobster pot) that can be transferred between fishers in the same zone.
Individual transferable quota ITQ
Each fisher’s individual share of the total allowable catch (TAC) in their zone.
Recruitment to the fishery
The number of young rock lobsters that grow to legal size each year.
Recruitment to the breeding stock
The number of rock lobsters that survive fishing and grow to become mature/breeders each year.
Stock and recruitment
The relationship between the numbers of breeders (eggs) and the number of puerulus settling (level of recruitment of young
91

relationship lobsters). A good number of breeders are required to ensure that the number of eggs produced do not affect the level of puerulus settlement (and hence level of catch 3-4 years later), no matter what the environmental conditions are. In other words, you always want the environmental conditions to be the factor that determines the level of puerulus settlement, not the number of breeding lobsters. If you reduce the number of breeders too far, then the number of eggs produced will not be sufficient to give you average or good levels of puerulus settlement, even if the environmental conditions are favourable. Even worse, in years of poor environmental conditions and too few breeders (low egg production), it could produce disastrously low levels of puerulus settlement and hence very low lobster catches three to four years later. This has occurred in many fisheries around the world, in Australia and in Western Australia (e.g. the Exmouth Gulf tiger prawn fishery, which declined to less than a quarter of its potential long-term production in the early 1980s due to not enough breeding stock). At the current levels of rock lobster breeding stock, it is the environmental conditions (e.g. strength of the Leeuwin Current) that determine the level of puerulus settlement and hence catch.
Total allowable catch TAC
The total amount (kg) of rock lobsters that can be caught by all fishers (commercial, recreational, indigenous, etc) in a season. An allowance is also made for illegal (unreported) catch.
Total allowable commercial catch TACC
The total amount (kg) of rock lobsters that can be caught by all commercial fishers.
92

Attachment 2
Scope of the Review of Management Options for the Rock Lobster Fishery Objectives Of The Review In the context of ecologically sustainable development, the objective for the review of the rock lobster management system is to:
Assess and compare alternative management systems using the current management system (fishing effort/input controls) as the benchmark. Using this comparison, make a decision as to which system offers the best long-term socio-economic return to the State of Western Australia from the ecologically sustainable use of the western rock lobster resource based on:
a) providing the greatest incentives and opportunity for growth in economic return for all sectors of the rock lobster industry and the Western Australian economy in general; and
b) in the context of providing the best socio-economic benefit to the Western Australian community, encourage the maintenance and development of regional communities.
It is important to reiterate that the current effort management system has served the fishery well over the years and would continue to do so in future provided managers and industry reduce fishing effort if overexploitation threatens the breeding stock. However, there is a need to assess if additional benefits (ecological, economic, social and management) can be obtained by moving to an alternative management system, while still ensuring long-term sustainability.
Timetable Of Review Jan 04 –
Oct 05 Oct 05 – Sept 06
Oct 06 – Feb 07
March 07 – Nov 08
Phase 1 Establishing objectives of the study and undertaking the assessment of the four management systems to be
compared
Phase 2 Communicate assessment and
comparison of management systems with stakeholders
Phase 3 Poll of stakeholder views and
RLIAC has final meetings with industry and prepares advice for
Government
Phase 4 State Government makes its
decision and any new management system is put in place for the 2008-
09 season
93
Phase 1 – Objective Analysis of Management Scenarios Commencing in October 2003, a joint departmental and industry Steering Committee chaired by the Executive Director of Fisheries, Dr Peter Rogers, oversaw the development of papers that assessed the relative advantages and disadvantages of the effort control and quota management systems outlined above, with respect to the review’s stated objective. The areas of study covered are:
1. Broad issues – Impacts on the fishing industry and fisheries management Assessment of the likely shift in catch shares, changes in fishing behaviour and fleet dynamics, and size and the risk of breeding stock depletion and management failure.
2. Economic modelling – Cost efficiency comparisons of effort control and quota management systems A cost-benefit analysis of the four management systems, including the cost of fisheries management, compliance and research; cost of production; and the identification of any economic opportunities that can be realised under the alternative management systems. Also included in the economic evaluations are some initial assessments of market development/advantage opportunities under effort control and quota management systems.
3. Social impacts – Assessment of the likely impacts on social infrastructure of
effort control and quota management systems Through the establishment of appropriate social indicators, develop a conceptual model to predict the behaviour of the rock lobster industry under the various management options and therefore their impact on existing host communities.
4. Experience in other fisheries – Assessment of management systems used in
other countries and Australian States Building on work already completed, review and update the current experience in places such as New Zealand, South Australia, Tasmania and Victoria.
Phase 2 – Communicate Analysis of Management Scenarios with Stakeholders The purpose of Phase 2 is to communicate to all stakeholders (commercial and recreational fishers, processors, conservation sector, etc) the results of the assessment and comparison of the four management options in the context of the review’s objective. The studies that have been conducted will be published and the information will empower stakeholders to arrive at their own conclusions as to which management system is best. Phase 2 will commence in October 2005 and be completed by September 2006. The communication process will use an independent facilitator who will conduct a series of workshops with professional fishermen’s associations and other interested parties. In the interests of fairness and the transparency of this process, it is desirable that an independent facilitator, who understands fisheries management and resource allocation issues and is independent of both the rock lobster industry and the Department of Fisheries, facilitates the workshops. The meetings will be co-ordinated
94

by the Western Rock Lobster Council, the Western Australian Fishing Industry Council and Western Rock Lobster Development Association. The importance of the role to be played by professional fishers’ associations, the Western Rock Lobster Council and the Western Rock Lobster Development Association in this phase cannot be overstated. There is an opportunity for industry leaders to facilitate and guide industry’s discovery of the issues and development of a broadly supported position in such a way as to enhance the prospect of a very positive outcome.
Phase 3 – RLIAC Prepare Advice for Government At the commencement of the third phase, stakeholders by now should understand the strengths and weaknesses of the four management options that have been assessed, and have made a decision as to which one they believe is the best. During this period, RLIAC will receive submissions from stakeholders and engage with them to clarify their positions. Stakeholder submissions and results from the studies that have been undertaken will be used by RLIAC to develop advice to the Government on which management option would best meet the future needs of the rock lobster industry and the community generally. RLIAC will continue to communicate with stakeholders throughout this period to ensure its understanding of the respective stakeholder positions is well understood. At this point, the Western Rock Lobster Council will conduct a poll of the rock lobster fishing sector to ascertain which management option is preferred. It is important to note that the results of this poll will not necessarily determine RLIAC’s advice to the Minister or the Government’s final position. The poll will make it clear to the Government what the majority view of fishers is, but the ultimate decision will be made based on the substantial merits of the case for or against management change. A case for changing the current management system would need to produce convincing arguments that there are significant benefits in an ecologically sustainable development context to be realised under a new system of management. By October 2006, RLIAC will be in a position to communicate the substance its intended advice to the Government on the coastal tour before formally presenting this advice to the Minister for Fisheries in early 2007. This final step provides further transparency for the process, and the opportunity for RLIAC to ensure it has properly accounted for all stakeholder views and on balance has developed the best advice.
Phase 4 – Government’s Decision and Implementation Once the Minister for Fisheries has received RLIAC’s advice, he will take his position to Cabinet. Cabinet’s view on the long-term management of the rock lobster fishery in the context of ecologically sustainable development and national competition policy is likely to be known in 2007 and will immediately be communicated to all stakeholders. If the decision is to move to a new management system, it is anticipated it will be implemented in time for the 2008-09 season.
95

Attachment 3
Economic Issues Impacting on the Western Rock Lobster Industry Introduction Rock lobster fishing has traditionally been seen as a lucrative business when compared to some other forms of agriculture and fishing. Armchair commentators point to the considerable capital value tied up in unit (pot) entitlements as evidence of the fishery’s wealth. As recently as three years ago, this was estimated to be worth almost $1.8 billion in Western Australia alone. But a closer examination of the rock lobster industry suggests that rock lobster fishing is suffering from similar pressures as other agricultural and fishing industries. The cost of fishing has been increasing while the value of rock lobsters have been declining – this cost-price squeeze is more commonly associated with industries such as the dairy and wheat industries. The recent intensification of these trends may be one of the reasons the price of rock lobster unit authorisations (pot entitlements) has declined by about 27 per cent in the last two years. However, the changing economics in the industry are not new. Boat numbers in the Western Rock Lobster Fishery have been declining for as long as 40 years as fishers have moved to larger boats with higher pot numbers per boat where they can take advantage of economies of scale. This is similar to the story told in the dairy industry, as farmers have responded to increasing costs and reducing prices by developing larger and larger herds. The concern is that in recent years, economic pressures have been increasing to a point that can no longer just be addressed by fishers moving to larger, more efficient vessels. The problem facing the industry is determining which management arrangement will provide the right incentives for fishers to improve their fishing efficiency and marketing efforts in new and innovative ways, so they can collectively tackle the ongoing cost-price pressures. The concern is that the current individual transferable effort (ITE) control system of management has restrained the ability of fishers to manage their input costs as effectively as they might otherwise been able to under a quota system of management. The issue of how much value could be derived from a quota system compared to a pot restriction system is one of the questions being addressed in the study presented in the related review report.
The Cost-price Squeeze The profitability of rock lobster fishing is affected by a few key economic and financial parameters and these are:
96

1. the prices received for rock lobsters, considering the fluctuations in price from season to season and the fluctuations in price within a season;
2. the catch of rock lobsters, considering the timing of the catch and variation in the catch across seasons;
3. input costs including, o fuel costs, o bait costs, o labour costs, o capital costs (namely the cost of boats, debt servicing and the cost of
replacing or upgrading fishing equipment), and o administration and other sundry on-costs.
Like other primary industries, the rock lobster industry has been increasingly confronted with rising costs and stagnating or declining prices. The following is a summary of these factors – showing the historical trends and providing some insight to the future.
Rock Lobster Prices More than 95 per cent of rock lobsters caught in Western Australia are exported. The major markets for lobster are in the United States and South-East Asia. This means the Western Australian export market is very dependent on the fluctuations in the Australian dollar against the US dollar57. While Western Australia’s lobster fishery is the largest spiny lobster producer, it represents less than 10 per cent of world total lobster supply, suggesting that monthly (or intra-seasonal) fluctuations in local supply are not likely to have a major impact on prices received within a given season, although annual fluctuations (season to season) could have some impact. It is noted that if monthly prices are averaged over 10 years, there is about a $2 per kilogram variation from the low price month of December to the high priced month of June. However, there have been much greater fluctuations in the average price from year to year with the average annual price fluctuating between $36 per kilogram and $20 per kilogram (CPI adjusted) over the last ten years. As noted earlier, prices for rock lobsters have, over the longer term, been declining in real terms. The downward trend in rock lobster prices is even more pronounced if they are adjusted to eliminate fluctuations in exchange rate. Figure 1 below shows the CPI adjusted price (termed the real price) of rock lobsters, plotted against the price adjusted for exchange rate and the CPI (termed the real trade weighted price). The ‘best fit’ trend line (the solid straight line in Figure 1) is down from $32 per kilogram in the early 1990s, to about $21 per kilogram now. The trend line can be considered as the price fishers would have received if exchange rates had remained constant at their current levels and inflation were taken into account.
57 Note that most South-East Asian currencies are pegged to the US dollar, which means they go up and down in value as the US dollar fluctuates. Therefore, export prices are almost solely related to the prices received at the export market in the US dollar equivalent value.
97
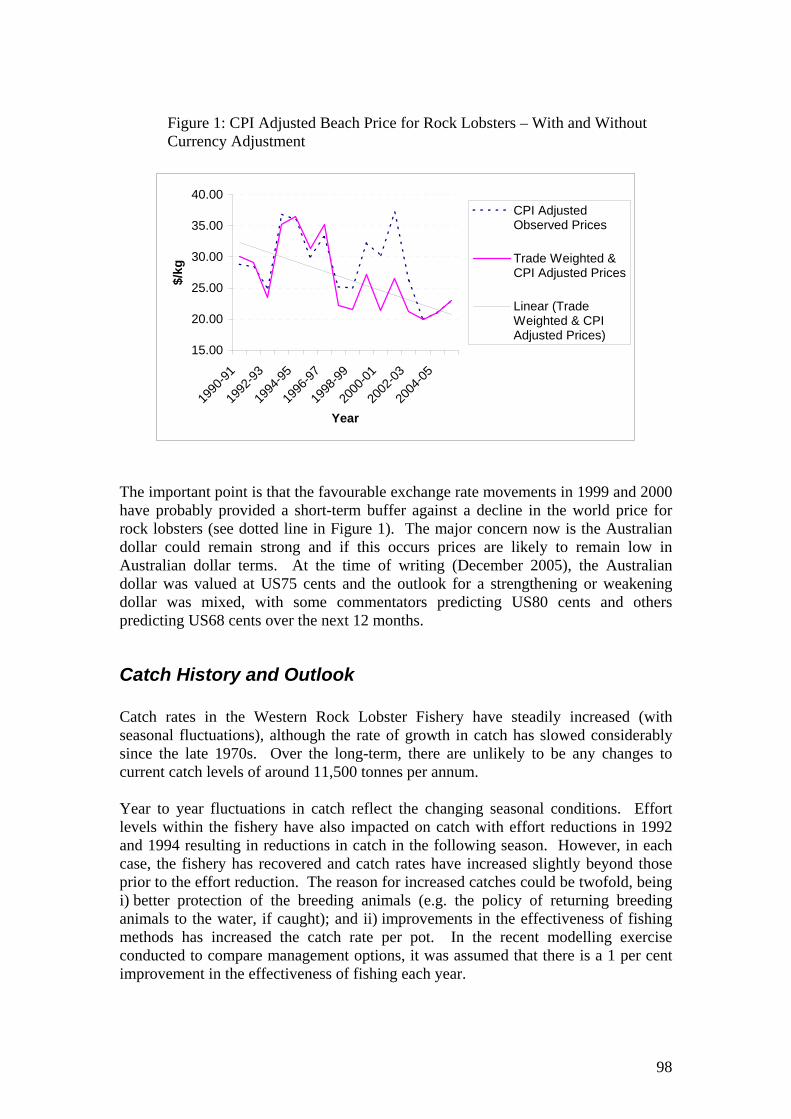
Figure 1: CPI Adjusted Beach Price for Rock Lobsters – With and Without Currency Adjustment
15.00
20.00
25.00
30.00
35.00
40.00
1990
-91
1992
-93
1994
-95
1996
-97
1998
-99
2000
-01
2002
-03
2004
-05
Year
$/kg
CPI AdjustedObserved Prices
Trade Weighted &CPI Adjusted Prices
Linear (TradeWeighted & CPIAdjusted Prices)
The important point is that the favourable exchange rate movements in 1999 and 2000 have probably provided a short-term buffer against a decline in the world price for rock lobsters (see dotted line in Figure 1). The major concern now is the Australian dollar could remain strong and if this occurs prices are likely to remain low in Australian dollar terms. At the time of writing (December 2005), the Australian dollar was valued at US75 cents and the outlook for a strengthening or weakening dollar was mixed, with some commentators predicting US80 cents and others predicting US68 cents over the next 12 months.
Catch History and Outlook Catch rates in the Western Rock Lobster Fishery have steadily increased (with seasonal fluctuations), although the rate of growth in catch has slowed considerably since the late 1970s. Over the long-term, there are unlikely to be any changes to current catch levels of around 11,500 tonnes per annum. Year to year fluctuations in catch reflect the changing seasonal conditions. Effort levels within the fishery have also impacted on catch with effort reductions in 1992 and 1994 resulting in reductions in catch in the following season. However, in each case, the fishery has recovered and catch rates have increased slightly beyond those prior to the effort reduction. The reason for increased catches could be twofold, being i) better protection of the breeding animals (e.g. the policy of returning breeding animals to the water, if caught); and ii) improvements in the effectiveness of fishing methods has increased the catch rate per pot. In the recent modelling exercise conducted to compare management options, it was assumed that there is a 1 per cent improvement in the effectiveness of fishing each year.
98

In the short term, a 13 per cent reduction in catch is expected in the 2005-06 season and a further 9 per cent reduction in the 2006-07 season. Some recovery in catch is expected in 2007-08. The predicted reductions in catch over the next two years will have a major impact on the fishers' bottom line as it is likely to coincide with increased cost-price pressures. A reduction in the value of catch will also impact on deckhands’ and skippers’ wages because most are paid under revenue sharing arrangements. Concerns about the status of the fishery’s stock have led to the adoption of further effort reduction measures across the fishery. These effort reduction measures are likely to reduce catch further than expected in the next season, although the negative impact of effort reduction measures should be dissipated within two years. Short-term reductions (and increases) in catch have an immediate impact on fishers’ profit margins because any corresponding efficiency gains are occurring at a much slower rate.
I Otccfpf(u
F Fardia 5
LA
A 10 per cent reduction in catch would have an average impact of about $50,000in reduced revenue per fisher. Given that most fishers cannot reduce their fishingcosts in poorer years, this is likely to affect the average profit margin by about thesame amount.
nput Costs
perational costs (such as fuel, bait and labour) make up nearly 60 per cent of the otal costs of ‘an average’ rock lobster fisher with fuel accounting for about 14 per ent (net of crew’s contribution and tax), bait 11 per cent and labour 34 per cent of osts. The balance (41 per cent) of costs can be attributed to the servicing of capital or boats (assuming depreciation at 5 per cent per annum and the cost of capital at 7 er cent per annum), administration, insurance, and other non-fishing costs. These igures have been derived from the analysis undertaken in February this year Thomson and Caputi, 200558) with supporting assumptions from the study ndertaken by Economic Research Associates.
uel
or most fishers, depending on the zone fished and the price of diesel fuel, their nnual fuel bill is between $40,000 and $60,000 per year, after the government tax ebate is returned to the boat owner/operator. The trend in fuel prices is a worrying evelopment for the industry as it attempts to remain profitable. Prices have ncreased 22 per cent in a 12-month period from December 2004 and 52 per cent over four-year period from February 2001.
8 Thomson, N., Caputi, N., 2005. An Economic Analysis of Management Options in the Western Rock obster Fishery of Western Australia., In: Proc of 3rd Bi-Annual Conference of the North American ssociation of Fisheries Economists, Vancouver, British Columbia.
99

Figure 2: Average Diesel Fuel Prices in the State’s Mid-West Region – Fuel Watch
Average Diesel Fuel Prices (Midwest of Western Australia - Source Fuel Watch)
50
60
70
80
90
100
110
Jan-0
1
May-01
Sep-01
Jan-0
2
May-02
Sep-02
Jan-0
3
May-03
Sep-03
Jan-0
4
May-04
Sep-04
Jan-0
5
May-05
Sep-05
Date
Cen
ts P
er L
itre
Increasing fuel prices are being driven by the rising demand for fuel in emerging economies such as China and India. These same economic drivers are fuelling higher wages in the Western Australian mining sector, which potentially add to the labour shortage in the rock lobster industry. Demand is predicted to continue to expand and over the longer term there are real concerns about the long-term supply of oil. Given these factors, it is likely that there will be ongoing price pressure on diesel fuel prices.
100
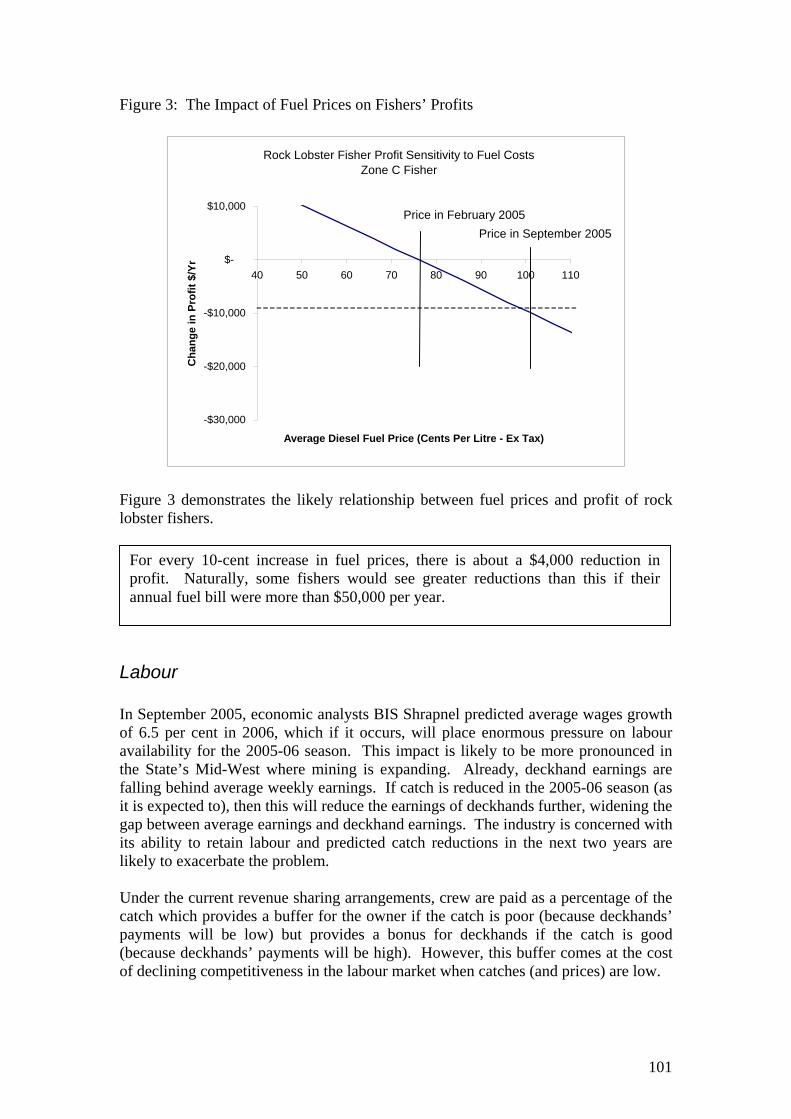
Figure 3: The Impact of Fuel Prices on Fishers’ Profits
Rock Lobster Fisher Profit Sensitivity to Fuel CostsZone C Fisher
-$30,000
-$20,000
-$10,000
$-
$10,000
40 50 60 70 80 90 100 110
Average Diesel Fuel Price (Cents Per Litre - Ex Tax)
Cha
nge
in P
rofit
$/Y
r
Price in February 2005Price in September 2005
Figure 3 demonstrates the likely relationship between fuel prices and profit of rock lobster fishers.
For every 10-cent increase in fuel prices, there is about a $4,000 reduction inprofit. Naturally, some fishers would see greater reductions than this if theirannual fuel bill were more than $50,000 per year.
Labour In September 2005, economic analysts BIS Shrapnel predicted average wages growth of 6.5 per cent in 2006, which if it occurs, will place enormous pressure on labour availability for the 2005-06 season. This impact is likely to be more pronounced in the State’s Mid-West where mining is expanding. Already, deckhand earnings are falling behind average weekly earnings. If catch is reduced in the 2005-06 season (as it is expected to), then this will reduce the earnings of deckhands further, widening the gap between average earnings and deckhand earnings. The industry is concerned with its ability to retain labour and predicted catch reductions in the next two years are likely to exacerbate the problem. Under the current revenue sharing arrangements, crew are paid as a percentage of the catch which provides a buffer for the owner if the catch is poor (because deckhands’ payments will be low) but provides a bonus for deckhands if the catch is good (because deckhands’ payments will be high). However, this buffer comes at the cost of declining competitiveness in the labour market when catches (and prices) are low.
101

Figure 4: Average Weekly Earnings and Deckhand Earnings.
Weekly Earnings
200
400
600
800
1000
1200
1400
1993
1995
1997
1999
2001
2003
2005
Year
$ Pe
r Wee
k
Full Time WeeklyEarningsDeckhand WeeklyEarnings
Figure 4 shows the fluctuation in average deckhand earnings compared to the average Australian weekly earnings rate. Since 2001, average weekly earnings have been higher than the estimated deckhand weekly earnings and the gap is likely to widen in 2006 (denoted by the dotted lines). This decline in deckhand earnings is a function of the predicted decline in total catch (although prices are assumed to increase by $2 per kilogram). One solution to the declining attractiveness of working in the rock lobster industry may be to pay crew a greater proportion of the value of the catch (either as a fixed payment or under a revenue sharing arrangement). But any increase in wages (over and above current revenue sharing arrangements) would have a considerable impact on the fishers’ profit margin, unless the increase is associated with improved efficiencies.
An increase in wages of 6.5 per cent, without a similar increase in revenue wouldmean that average profits could decline by about $7,000 (assuming the boat wascrewed by two deckhands).
102
Fixed Costs It is estimated that fixed costs make up about 41 per cent of fishing costs. Fixed costs include the cost of servicing debt, paying regular expenditure on land-based operations and paying for vessels (including depreciation). The estimate is based on the assumption that the interest rate on debt is 7 per cent per annum and boats are depreciated at a rate of 5 per cent per annum).
Depending on the level of indebtedness, fluctuations in the cost of capital can exert a significant effect on fishers’ profit margins. The prospect of an interest rate rise, of say 0.5 percentage points during the 2005-06 season, has been heightened by strong wages growth.
If it is assumed that 40 per cent of capital costs are financed, then a 0.5 percentagepoint increase in interest rates could represent an additional cost of about $1,000per boat per year. Similarly, a 1 percentage point increase in interest rates couldlead to a reduction in average annual profit of less than $2,000. The impact ofinterest rate rises would naturally be much more dramatic if the level ofindebtedness is higher. Note these calculations do not include the cost of financingpot entitlements if money is borrowed against these.
Value of Pot Entitlements The market value of rock lobster unit (pot) entitlements (that are individually transferable as a restricted entitlement of fishing effort) has increased considerably over the last 15 years (particularly after the pot reduction of 1993), although in the last two seasons the sale price of pot entitlements has declined. This is not surprising, given the number of risk factors facing the industry at the present time and the fact that the market for rock lobster unit (pot) entitlements reflects the expected future profitability of rock lobster fishing operations.
103

Figure 5: Trends in Rock Lobster Pot Prices Since 1990
Value of Rock Lobster Pots
$-
$5,000
$10,000
$15,000
$20,000
$25,000
$30,000
$35,000
$40,000
1991
1993
1995
1997
1999
2001
2003
2005
Year
Valu
e ($
) Zone AZone BZone C
If a new management system increases profits in the industry, then it is likely that the value of entitlements (whether they be pots or quota) will increase. The willingness of fishers to pay higher prices for entitlements reflects the expectation of future earnings. So profits drive entitlement values, and not the other way around. The modelling exercise does not consider the value of entitlements but rather measures the likely change in profit without any regard to entitlement values. This approach is sufficient for the purposes of comparing management options because the profitability of the industry is the key issue of concern. Capital gains in entitlements will logically follow if profits can be improved through new management methods.
Fleet Size and Composition The rock lobster fishing fleet has been steadily declining since the 1960s and by December 2004 consisted of 549 operational boats, down from a peak of 836 in 1963. The trend of declining boat numbers is likely to continue as the average number of pots per boat increases. It is noted that the trend (as shown in Figure 6) accelerated for a short time immediately after the introduction of pot reduction in 1993. Figure 6 would also suggest that changes in the catch rates have some impact on the rate at which boats are exiting the fleet. It appears to be reasonable to assume that boat numbers will continue to decline in the future, given the ongoing challenges being posed by the continuing cost price pressures. This decline is likely to be accelerated if further pot reductions are introduced or if a quota system is introduced.
104
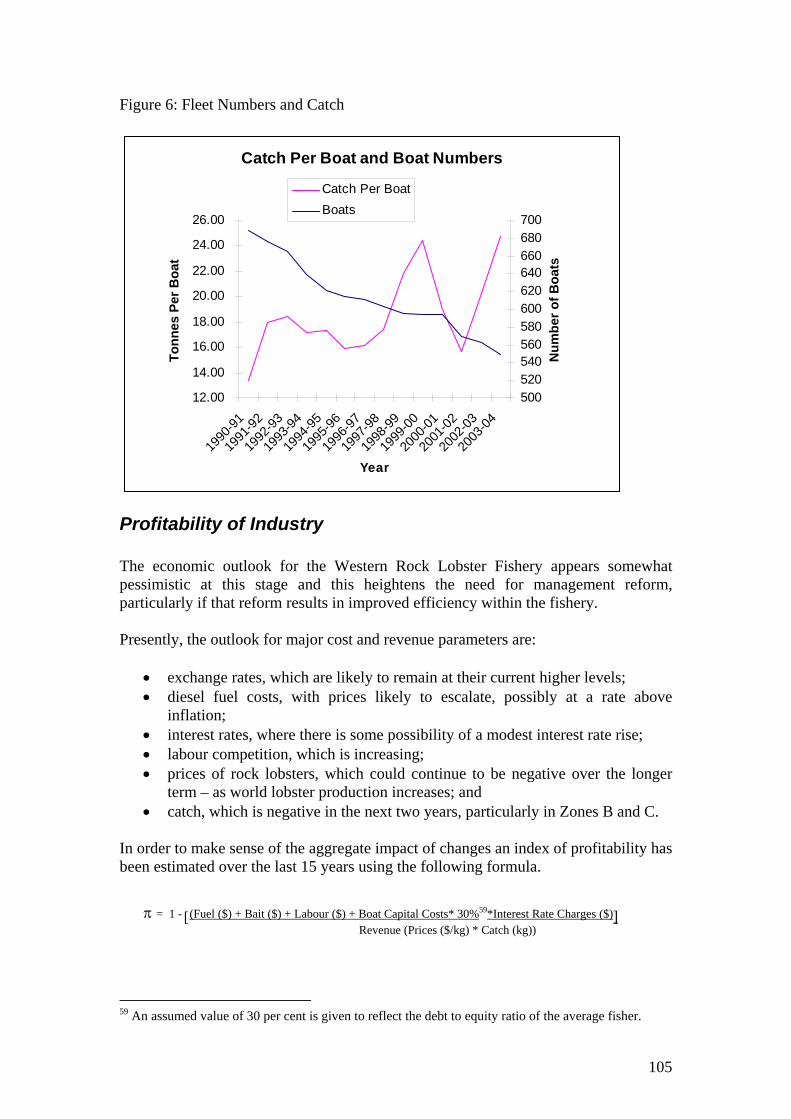
Figure 6: Fleet Numbers and Catch
Catch Per Boat and Boat Numbers
12.00
14.00
16.00
18.00
20.00
22.00
24.00
26.00
1990
-91
1991
-92
1992
-93
1993
-94
1994
-95
1995
-96
1996
-97
1997
-98
1998
-99
1999
-00
2000
-01
2001
-02
2002
-03
2003
-04
Year
Tonn
es P
er B
oat
500520540560580600620640660680700
Num
ber o
f Boa
ts
Catch Per BoatBoats
Profitability of Industry The economic outlook for the Western Rock Lobster Fishery appears somewhat pessimistic at this stage and this heightens the need for management reform, particularly if that reform results in improved efficiency within the fishery. Presently, the outlook for major cost and revenue parameters are:
• exchange rates, which are likely to remain at their current higher levels; • diesel fuel costs, with prices likely to escalate, possibly at a rate above
inflation; • interest rates, where there is some possibility of a modest interest rate rise; • labour competition, which is increasing; • prices of rock lobsters, which could continue to be negative over the longer
term – as world lobster production increases; and • catch, which is negative in the next two years, particularly in Zones B and C.
In order to make sense of the aggregate impact of changes an index of profitability has been estimated over the last 15 years using the following formula.
π = 1 - [(Fuel ($) + Bait ($) + Labour ($) + Boat Capital Costs* 30%59*Interest Rate Charges ($)] Revenue (Prices ($/kg) * Catch (kg))
59 An assumed value of 30 per cent is given to reflect the debt to equity ratio of the average fisher.
105

Where:
o π is the aggregate index of industry profitability; o all costs (fuel, bait, labour, 40 per cent of estimated boat capital * interest
charges) and revenues are estimates of nominal aggregate costs and revenues; and
o boat capital costs are scaled to boat numbers over time, assuming average inputs per boat remain unchanged.
The index shows costs increasing as a percentage of revenue (by about 2.5 per cent per annum) over the last six years and that this will increase further in the 2005-06 season. This raises concerns that the viability of the industry may be being threatened to a much greater extent than has previously been the case.
Figure 7: Aggregate Industry Profitability Index 1999-2000 to 2005-06
Profit - Revenue Ratio (Excluding On-shore Costs, Servicing of Pot Licenses)
0.40
0.50
0.60
1999
-00
2000
-01
2001
-02
2002
-03
2003
-04
2004
-05
2005
-06
Figure 7 indicates that in 1999-2000 about 60 per cent of revenue was captured by industry as profit (excluding some onshore costs and servicing of pot entitlements). But in 2005-06, it is expected that only 47 per cent of revenue will be captured in the same way (that is, costs make up over 50 per cent of direct operational revenues). In 2005-06, there is likely to be a combination of low catches, low prices, possibly higher interest rate charges (an assumed 1 per cent increase) and higher fuel prices. Assumptions for the 2005-06 season are:
• Price $23/kg, up $2/kg from the previous season; • Catch 11,500 tonnes, down 2,000 tonnes from the previous season; • Fuel prices, $1/litre ex-tax, up 22 cents/litre from the previous season; • Bait costs, up 5 per cent from the previous season; • Interest rates, up 1 percentage point from the previous season; and • Boat numbers 540, down nine from the previous season.
106

Conclusions In economic terms, it would appear that the Western Rock Lobster Fishery is facing challenging times as a result of the ongoing and intensifying cost-price squeeze, consistent with other primary commodity markets. This is likely to have a considerable long-term impact on the profitability of the fishery, unless industry can continuously improve its efficiency or value of its product. Failure to do so is likely to not only harm profit margins but also the capital value of pot entitlements. The main cost drivers show little sign of easing over the short- or longer term and the outlook for rock lobster prices is not optimistic. Even if it is assumed that prices will rise to $23/kg in the 2005-06, the season is likely to have lower profits than in the last few seasons. Neither does it appear that the industry can rely on its good fortune in the late 90s and early 2000s, when the Australian dollar moved in a favourable direction for exporters. The industry is also facing challenges with its labour arrangements. The historical method of sharing revenue with fishers is placing fishing labour in an increasingly unattractive position while mining and tourism flourish in the key fishing areas, thereby drawing down the labour pool for the rock lobster industry. If industry wishes to maintain or improve its current rate of return, it needs to find a management system that allows it to restructure input costs. Similarly, it needs to consider the prospects of improving its marketing of product.
107

Attachment 4
Previous Reviews and Studies Bowen, B. 1994, ‘Long-term Management Strategies for the Western Rock Lobster Fishery’, in Volume 1, Fisheries Management Paper No. 67, Fisheries Department of WA. Caputi, N., Chubb, C. F., Hall, N.G. & Brown, R. S. 2000, ‘Measurement of Catch and Fishing Effort in the Western Rock Lobster Fishery', in Phillips, B.F. & Kittaka, J. (Ed.), Spiny lobsters: Fisheries and Culture, Fishing News Books, Oxford, p.334-356. Hall, N. & Chubb, C. 2001, The status of the western rock lobster, Panulirus cygnus, fishery and the effectiveness of management controls in increasing the egg production of the stock, Mar. Freshwater Res. 52:1657-1667. Lindner, B. 1994, ‘Economic efficiency of alternative input and output based management systems in the Western Rock Lobster Fishery’, in Volume 2, Fisheries Management Paper No. 68, Dept of Fisheries of WA. Marec Pty, 1994, ’Long-term management strategies for the Western Rock Lobster Fishery. A market-based economic assessment for the western rock lobster industry’, in Volume 3, Fisheries Management Paper No.69. McLaughlan, N. 1994, ‘Long-term management strategies for the Western Rock Lobster Fishery. Law enforcement considerations.’ in Volume 4, Fisheries Management Paper No. 70. Shotton, R. 2001, Case Studies on the Allocation of Transferable Quota Rights in Fisheries, Food and Agricultural Organisation, Fisheries Technical Report No. 411, p373. Shotton, R. 2001, Case Studies on the Effect of Transferable Fishing Fights on Fleet Capacity and Concentration of Quota Ownership, Food and Agricultural Organisation, Fisheries Technical Report No. 412, p246.
108

Attachment 5 A description on the main management rules (Table A) and assumptions (Table B) used in the economic modelling. Table A. A description of the management arrangements used to model the management options that were assessed and compared in the review of the Western Rock Lobster Fishery (from Appendix 11 in A Bio-Economic Evaluation of Management Options for the West Coast Rock Lobster Fishery. Economic Research Associates report prepared for the Department of Fisheries on behalf of Rock Lobster Industry Advisory Committee. December 2005.)
Alternative Management Options for the Western Rock Lobster Fishery
Management controls Current ITE Modified ITE ITQ – effort controlled
ITQ
1. Spatial – boundaries Cape Leeuwin to NW Cape Four Fishing Zones (A, B, C) and Big Bank1.
No Change Three Zones60 (A, B & C)
No Change Three Zones² (A, B & C)
No Change Three Zones² (A, B & C)
2. Temporal – opening and closing times
Seasonal Controls: 15 November-30June (Zones B & C) 15 March-30 June (Zone A) Zone A authorisations are entitled to fish in Zone B up until 14 March. Big Bank¹ 10 Feb-last day of
Extended Season 15 November -31 August (Zones B & C) 15 March-31August (Zone A) Zone A authorisations are entitled to fish in Zone B up until 14 March. No Big Bank.
Extended Season 15 November-31 August (Zones B & C) 15 March-31August (Zone A) Zone A authorisations are entitled to fish in Zone B up until 14 March. No Big Bank.
Extended Season 15 November-31 August (Zones B & C) 15 Mar-31Aug (Zone A) Zone A authorisations are entitled to fish in Zone B up until 14 March. No Big Bank.
1 Big Bank is incorporated into Zone B for modelling purposes, as it is a minor subset of Zone B. In the Department’s judgment, this is not likely to impact materially on the outputs from the modelling. Under the existing management rules, Big Bank operates in the following way: A Zone fishers can fish in Zone B up until 14 March, when they must go to the Abrolhos Islands. A and B Zone fishers who nominate to fish the Big Bank from 10 February must remain in Big Bank until midday on the last day of February of the season. Big Bank then becomes part of the B Zone fishery and any Zone A or B fisher can go there or leave it as they please. 2 Big Bank is incorporated into Zone B.
109

Alternative Management Options for the Western Rock Lobster Fishery
Management controls Current ITE Modified ITE ITQ – effort controlled
ITQ
February.
3. Access Transferable zone specific WRL Managed Fishery Licence (MFL) attached to a Fishing Boat Licence (FBL). One WRL MFL per FBL61. Right of renewal. Minimum Unit Entitlement (63) is required to operate.
No Change. More than one WRL MFL can be attached to an FBL3 but only one MFL entitlement can be exercised on any day. No Change. Minimum Unit Entitlement (45) to fish.
No Change. More than one WRL MFL can be attached to an FBL3 but only one MFL entitlement can be exercised on any day. No Change. Minimum catch quota entitlement equivalent to a 45-pot entitlement to fish.
No Change. More than one WRL MFL can be attached to an FBL3 but only one MFL entitlement can be exercised on any day. No Change. Minimum catch quota entitlement equivalent to a 45-pot entitlement to fish.
4. Effort
Individually transferable Unit Entitlements (69,282 units). Individual maximum Gear Usage (56,813 pots that can be operated).
Not Applicable. No Change.
Replaced by catch quota/pot for season, but maximum daily gear usage constraint remains No Change.
Not Applicable. No maximum pot usage. Fishers can use as many pots as they like.
3Other fishery endorsements can appear on an FBL
110

Alternative Management Options for the Western Rock Lobster Fishery
Management controls Current ITE Modified ITE ITQ – effort controlled
ITQ
Pot size and volume restricted and escape gaps remain the same. Pot setting and retrievals restricted to one/day.
With a maximum number of pot/fishing day entitlements in each zone endorsed on the MFL i.e. Zones B & C-185 pot/ fishing days; Zone A-90 pot/fishing days. No allowance for ‘dud’ days. Two-day and more pulls are to be treated as one-day pulls. No carry forward of pot/fishing day credits, i.e. an individual fisher’s maximum pot numbers deemed to be used on each fishing day. No Change. No Change.
Not Applicable. Not Applicable. Not Applicable. Not Applicable.
50 per cent increase in pot volume and three necks/pot in Year 3. No Change.
Not Applicable. Not Applicable. Not Applicable. Pot design freedom up to a 40 per cent efficiency increase Multiple day pulls to be allowed.
111

Alternative Management Options for the Western Rock Lobster Fishery
Management controls Current ITE Modified ITE ITQ – effort controlled
ITQ
5. Biological
Minimum size limits. 77mm carapace (15 Nov-31 Jan). 76 mm carapace (1Feb-30 Jun). Maximum size limits for female. 115 mm carapace south of 30° South. 105 mm carapace north of 30° South. Taking setose and tarspot prohibited.
No Change. 76 mm carapace (1 Feb-31 Aug). No Change. No Change. No Change.
No Change. 76 mm carapace (1 Feb-31 Aug). No Change. No Change. No Change.
No Change. 76 mm carapace (1 Feb-31 Aug). No Change. No Change. No Change.
6. Annual Catch
Not Applicable. Not Applicable. Annual Total Allowable Commercial Catch (TACC), i.e. two scenarios: 1.Conservatively fixed ‘Year-in-year-out’ TACC for each Zone, i.e. Zone A-1,600
Annual Total Allowable Commercial Catch (TACC), i.e. two scenarios: 1.Conservatively fixed ‘year-in-year-out’ TACC for each Zone, i.e. Zone
112

Alternative Management Options for the Western Rock Lobster Fishery
Management controls Current ITE Modified ITE ITQ – effort controlled
ITQ
6. Annual Catch (continued)
tonnes, Zone B-3,600 tonnes, Zone C-4,800 tonnes Note: Zone C may need to be kicked-in at a lower figure if the introduction of annual catch quotas coincided with predicted low catch seasons. or 2.A conservatively set variable annual TACC based on predicted (puerulus) sustainable catch levels for each of Zones A, B and C. Zone A authorisation will have a catch quota in Zone B that can be fished until 15
A-1,600 tonnes, Zone B-3,600 tonnes, Zone C-4,800 tonnes Note: Zone C may need to be kicked-in at a lower figure if the introduction of annual catch quotas coincided with predicted low catch seasons. or 2.A conservatively set variable annual TACC based on predicted (puerulus) sustainable catch levels for each of Zones A, B and C. Zone A authorisations will have a catch quota in Zone B that can be fished
4 Zone A quota to be calculated using their share/proportion of the catch (based on the number of pots held on the MFL) taken in Zone B during the period 15 November to 14 March. The proportion of catch thus calculated to be used for all future quota calculations. 5 Zone A quota to be calculated using their share/proportion of the catch (based on the number of pots held on the MFL) taken in Zone B during the period 15 November to 14 March. The proportion of catch thus calculated to be used for all future quota calculations. Zone A fishers are to be able to take their quota of catch in Zone B at any time of the season.
113

Alternative Management Options for the Western Rock Lobster Fishery
Management controls Current ITE Modified ITE ITQ – effort controlled
ITQ
March4. Individual Transferable Annual Catch quotas (kg) by zone endorsed on individual MFLs.
in Zone B at any time of the season.5 Individual Transferable catch Quotas (ITQ)(kgs) by zone endorsed on individual MFLs.
7. Satellite Vessel Monitoring System (VMS)
VMS assumed to be operational6
VMS will be operational. VMS will be operational. VMS will be operational.
8. Transferability
Individual transferable pot entitlements are not transferable between Zones B & C but are transferable within these two zones. Individual pot entitlements are transferable between Zones A & B. Current policy requires that there must be a 100 per
Individual residual pot/fishing day entitlements would not be transferable between zones but transferable within zones between fishers during the season, but within a maximum gear usage constraint.
Individual residual catch quota/pot would not be transferable between zones but transferable within zones between fishers.
Individual catch quota to be fully transferable within zones and within seasons.
6 No decision has been made to introduce VMS under the current management regime but for the purposes of this evaluation it has been assumed that VMS is operational. 62 Unrestricted transferability of pot entitlements between Zones A & B was reviewed by Department of Fisheries and RLIAC during the course of this evaluation because of concerns about the transfer of effort between Zone A and B going beyond historic levels. The policy adopted is to only allow transfers of pots from A Zone to B Zone and vice versa if there is an equal transfer in the other direction.
114

Alternative Management Options for the Western Rock Lobster Fishery
Management controls Current ITE Modified ITE ITQ – effort controlled
ITQ
cent swap in each direction.62.
9. Cost Recovery
Department of Fisheries cost of management, research, compliance and enforcement recovered in accordance with agreed cost attribution and recovery rules
No Change.
No Change.
No Change.
10. Processing -Licensed processing establishments -Licensing of lobster processing for Australian domestic market is not restricted - Licensing of lobster processing for export is restricted to the existing
No Change. No Change. No restrictions on export processing licence numbers.
No Change. No Change. No restrictions on export processing licence numbers.
No Change. No Change. No restrictions on export processing licence
63 Continuation of this restriction on competition is conditional on satisfying the NCP ‘public interest’ test. There is currently an initiative to remove the restriction on the number of WRL export processing licences.
115
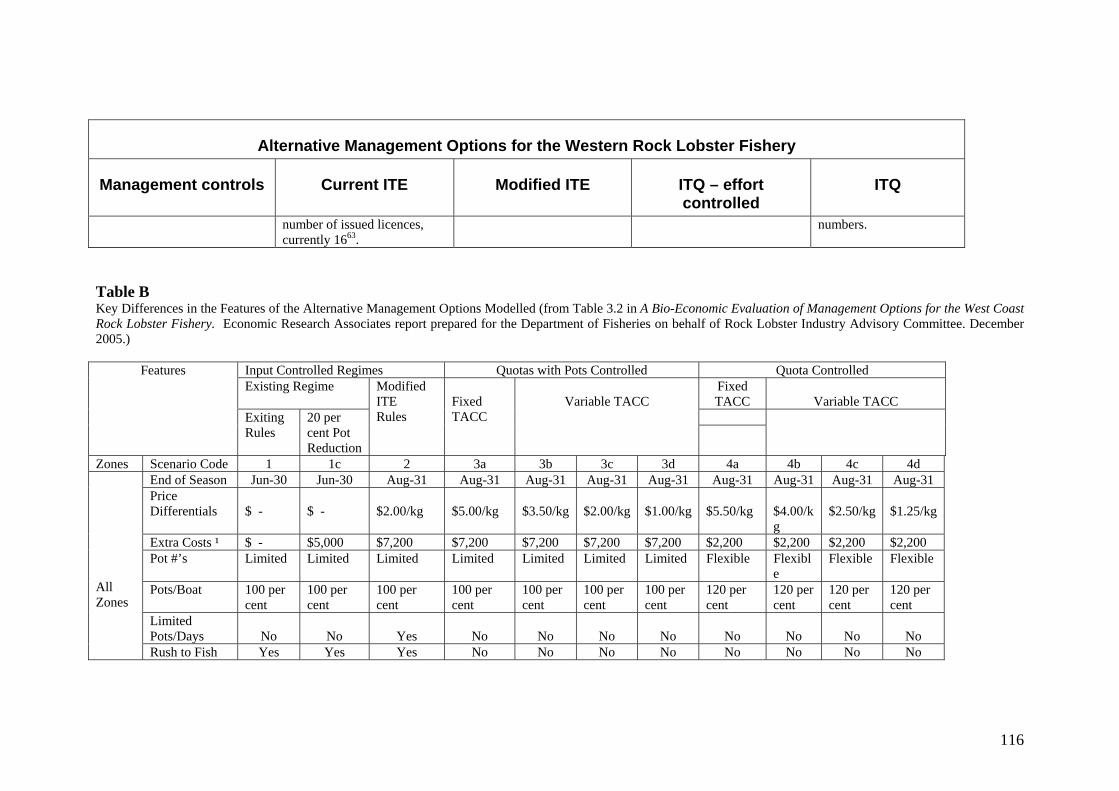
Alternative Management Options for the Western Rock Lobster Fishery
Management controls Current ITE Modified ITE ITQ – effort controlled
ITQ
number of issued licences, currently 1663.
numbers.
Table B Key Differences in the Features of the Alternative Management Options Modelled (from Table 3.2 in A Bio-Economic Evaluation of Management Options for the West Coast Rock Lobster Fishery. Economic Research Associates report prepared for the Department of Fisheries on behalf of Rock Lobster Industry Advisory Committee. December 2005.)
Input Controlled Regimes Quotas with Pots Controlled Quota Controlled Existing Regime Fixed
TACC
Variable TACC
Features
Exiting Rules
20 per cent Pot Reduction
Modified ITE Rules
Fixed TACC
Variable TACC
Zones Scenario Code 1 1c 2 3a 3b 3c 3d 4a 4b 4c 4dEnd of Season Jun-30 Jun-30 Aug-31 Aug-31 Aug-31 Aug-31 Aug-31 Aug-31 Aug-31 Aug-31 Aug-31Price Differentials
$ -
$ -
$2.00/kg
$5.00/kg
$3.50/kg
$2.00/kg
$1.00/kg
$5.50/kg
$4.00/kg
$2.50/kg
$1.25/kg
Extra Costs ¹ $ - $5,000 $7,200 $7,200 $7,200 $7,200 $7,200 $2,200 $2,200 $2,200 $2,200Pot #’s Limited Limited Limited Limited Limited Limited Limited Flexible Flexibl
e Flexible Flexible
Pots/Boat 100 percent
100 per cent
100 per cent
100 per cent
100 per cent
100 per cent
100 per cent
120 per cent
120 per cent
120 per cent
120 per cent
Limited Pots/Days
No
No
Yes
No
No
No
No
No
No
No
No
All Zones
Rush to Fish Yes Yes Yes No No No No No No No No
116
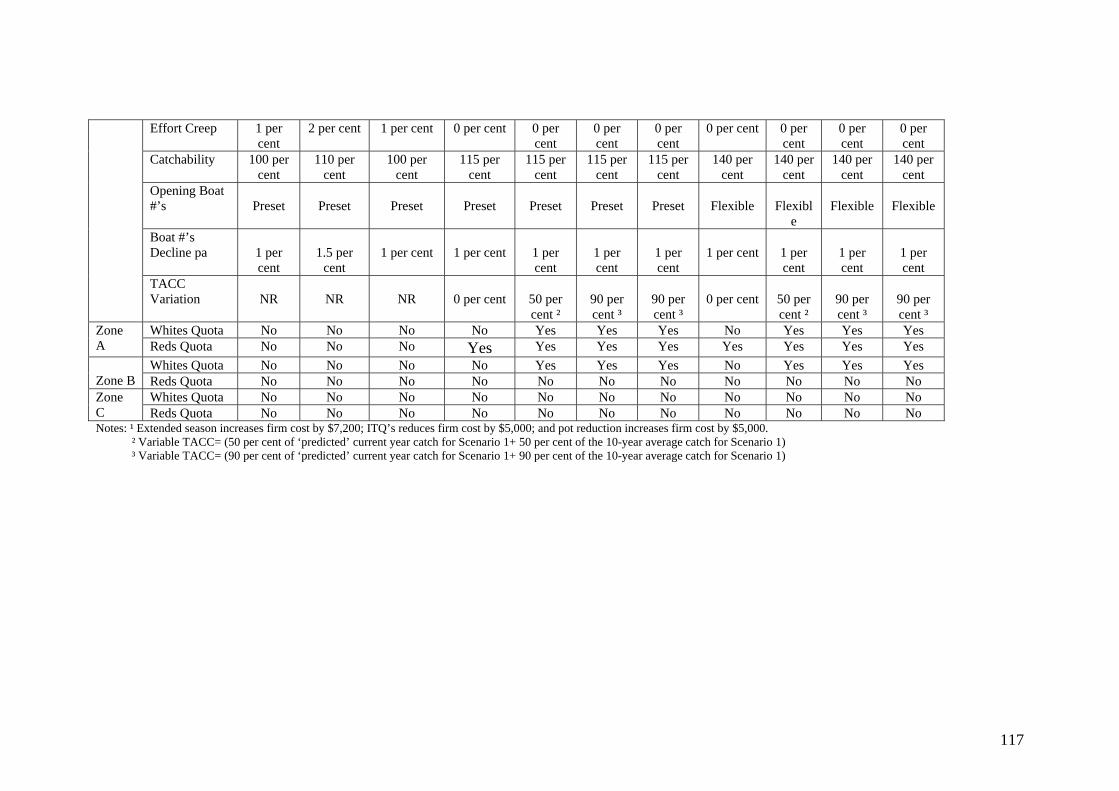
Effort Creep 1 per cent
2 per cent 1 per cent 0 per cent 0 per cent
0 per cent
0 per cent
0 per cent 0 per cent
0 per cent
0 per cent
Catchability 100 percent
110 per cent
100 per cent
115 per cent
115 per cent
115 per cent
115 per cent
140 per cent
140 per cent
140 per cent
140 per cent
Opening Boat #’s
Preset
Preset
Preset
Preset
Preset
Preset
Preset
Flexible
Flexibl
e
Flexible
Flexible
Boat #’s Decline pa
1 per cent
1.5 per
cent
1 per cent
1 per cent
1 per cent
1 per cent
1 per cent
1 per cent
1 per cent
1 per cent
1 per cent
TACC Variation
NR
NR
NR
0 per cent
50 per cent ²
90 per cent ³
90 per cent ³
0 per cent
50 per cent ²
90 per cent ³
90 per cent ³
Whites Quota No No No No Yes Yes Yes No Yes Yes Yes Zone A Reds Quota No No No Yes Yes Yes Yes Yes Yes Yes Yes
Whites Quota No No No No Yes Yes Yes No Yes Yes Yes Zone B Reds Quota No No No No No No No No No No No
Whites Quota No No No No No No No No No No No Zone C Reds Quota No No No No No No No No No No No Notes: ¹ Extended season increases firm cost by $7,200; ITQ’s reduces firm cost by $5,000; and pot reduction increases firm cost by $5,000. ² Variable TACC= (50 per cent of ‘predicted’ current year catch for Scenario 1+ 50 per cent of the 10-year average catch for Scenario 1) ³ Variable TACC= (90 per cent of ‘predicted’ current year catch for Scenario 1+ 90 per cent of the 10-year average catch for Scenario 1)
117
118
Attachment 6
Quota and Pot Transfers Under an Effort Controlled ITQ System If it were decided to move to ITQs with controls on effort (pot numbers), a clear set of business rules for quota/pot transfers would be developed with stakeholders. Transfers of quota and pots (buying, selling, leasing) could initially be done prior to the season but, as the system evolved, transfers within season could also be considered. However, there are some complex issues that would have to be carefully thought through before any system was implemented. The most important would be to decide in what way quota and pot usage should be linked, as one of the implicit aims of this system is to maintain control on the level of fishing effort (at least initially). Some examples of how quota transfers could work under this system are provided below.
No quota transfers within season As already mentioned, not allowing quota transfers during season would be a simple and perhaps first step in implementing an ITQ system with controls on pot numbers. However, industry would be likely to find such a system restrictive and there would be fishers with individual circumstances that arose during the season (e.g. health, accident, death, family, hardship, etc) who would need to be considered.
Transferring quota within season – Example 1 This example does not allow a fisher to use any more pots than he has at the start of the season. If a fisher wanted extra quota he could purchase it or lease it during the season and he would use the number of pots on his licence at the start of the season to catch it. For example if a fisher had 110 pots and he had 6,000 kg of quota left at the end of March and he purchased or leased an additional 4,000 kg, he would only be able to use his 110 pots to catch the 10,000kg by the end of the season.
Transferring quota within season – Example 2 In this example, a fisher would be able to use additional pots if he purchased or leased additional quota. This is a flexible system from the point of view of transferring quota, but it would be a very complex system to administer. It would be necessary to evolve the system to this degree of flexibility over a period of time (several years). Quota transfers
• If a fisher had an initial ITQ for the season of 129.6 kg per unit and he had 110 units, his total ITQ for the season would be 14,256 kg. If he was allowed to use all his units to fish, he could have 110 pots in the water.
• If he had already caught 8,256 kg (say by the end of March) and he wanted to transfer some of his quota and he didn’t want to continue fishing, he could transfer his 110 pots with 6,000 kg of quota attached (14,256kg – 8,256kg = 6,000kg) to another fisher, or if he just wanted to fish less, he could transfer 55 pots with 3,000 kg of quota, leaving 55 pots and 3,000 kg of quota for himself to fish.
• If he decided he wanted to have additional quota, then using the same example above, if he had 6,000kg of quota left and he purchased 40 pots with 2,000 kg of quota attached from another fisher, then his quota for the remainder of the season (April to end of August) would be 8,000 kg.

119
Pot usage In the example above in which a fisher has purchased an additional 40 pots with 2,000kg of quota to add to the remainder of his quota (110 pots with 6,000 kg of quota), he would have to fish his quota in the following way:
• he would use 150 pots to catch 4,000 kg of quota; • and then he would have to revert to using 110 pots to catch his remaining
4,000 kg. A sophisticated real time register would be needed to keep track of transfers and the records would have to be immediately available to Department of Fisheries Compliance Officers.

120
FISHERIES MANAGEMENT PAPERS No. 1 The Report of the Southern Western Australian Shark Working Group.
Chairman P. Millington (1986) No. 2 The Report of the Fish Farming Legislative Review Committee. Chairman
P.Rogers (1986) No. 3 Management Measures for the Shark Bay Snapper 1987 Season. P.
Millington (1986) No. 4 The Esperance Rock Lobster Working Group. Chairman A. Pallot (1986). No. 5 The Windy Harbour - Augusta Rock Lobster Working Group. Interim
Report by the Chairman A. Pallot (1986) No. 6 The King George Sound Purse Seine Fishery Working Group. Chairman R.
Brown (1986) No. 7 Management Measures for the Cockburn Sound Mussel Fishery. H.
Brayford (1986) No. 8 Report of the Rock Lobster Industry Advisory meeting of 27 January 1987 .
Chairman B. Bowen (1987) No. 9 Western Rock Lobster Industry Compensation Study. Arthur Young
Services (1987) No. 10 Further Options for Management of the Shark Bay Snapper Fishery. P.
Millington (1987) No. 11 The Shark Bay Scallop Fishery. L. Joll (1987) No. 12 Report of the Rock Lobster Industry Advisory Committee to the Hon
Minister for Fisheries 24 September 1987. (1987) No. 13 A Development Plan for the South Coast Inshore Trawl Fishery. (1987) No. 14 Draft Management Plan for the Perth Metropolitan Purse Seine Fishery. P.
Millington (1987) No. 15 Draft management plan, Control of barramundi gillnet fishing in the
Kimberley. R. S. Brown (1988) No. 16 The South West Trawl Fishery Draft Management Plan. P. Millington
(1988). No. 17 The final report of the pearling industry review committee . F.J. Malone,
D.A. Hancock, B. Jeffriess (1988) No. 18 Policy for Freshwater Aquaculture in Western Australia. (1988) No. 19 Sport Fishing for Marron in Western Australia - Management for the
Future. (1988) No. 20 The Offshore Constitutional Settlement, Western Australia 1988. No. 21 Commercial fishing licensing in Western Australia. (1989) No. 22 Economics and marketing of Western Australian pilchards. SCP Fisheries
Consultants Pty Ltd (1988) No. 23 Management of the south-west inshore trawl fishery. N. Moore (1989) No. 24 Management of the Perth metropolitan purse-seine fishery. N. Moore
(1989) No. 25 Rock Lobster Industry Advisory Committee report to the Minister for
Fisheries November 1988. (1989) No. 26 A report on marron fishing in Western Australia. Chairman Doug Wenn
MLC (1989)

121
No. 27 A review of the Shark Bay pearling industry. Dr D.A.Hancock, (1989) No. 28 Southern demersal gillnet and longline fishery. (1989) No. 29 Distribution and marketing of Western Australian rock lobster. P.
Monaghan (1989) No. 30 Foreign investment in the rock lobster industry. (1989) No. 31 Rock Lobster Industry Advisory Committee report to the Hon Minister for
Fisheries September 1989. (1989) No. 32 Fishing Licences as security for loans. P. Rogers (1989) No. 33 Guidelines for by-laws for those Abrolhos Islands set aside for fisheries
purposes. N. Moore (1989) No. 34 The future for recreational fishing - issues for community discussion.
Recreational Fishing Advisory Committee (1990) No. 35 Future policy for charter fishing operations in Western Australia. P.
Millington (1990) No. 36 Long term management measures for the Cockburn Sound restricted entry
fishery. P. Millington (1990) No. 37 Western rock lobster industry marketing report 1989/90 season. MAREC
Pty Ltd (1990) No. 38 The economic impact of recreational fishing in Western Australia. R.K.
Lindner, P.B. McLeod (1991) No. 39 Establishment of a registry to record charges against fishing licences when
used as security for loans. P. Rogers. (1991) No. 40 The future for Recreational Fishing - Forum Proceedings. Recreational
Fishing Advisory Committee (1991) No. 41 The future for Recreational Fishing - The Final Report of the Recreational
Fishing Advisory Committee. Recreational Fishing Advisory Committee (1991)
No. 42 Appendix to the final report of the Recreational Fishing Advisory Committee. (1991)
No. 43 A discussion of options for effort reduction. Southern Gillnet and Demersal Longline Fishery Management Advisory Committee (1991)
No. 44 A study into the feasability of establishing a system for the buy-back of salmon fishing authorisations and related endorsements. (1991)
No. 45 Draft Management Plan, Kimberley Prawn Fishery. (1991) No. 46 Rock Lobster Industry Advisory Committee, Chairman’s report to the
Minister (1992) No. 47 Long term management measures for the Cockburn Sound restricted entry
fishery. Summary of submissions and final recommendations for management. P. Millington (1992)
No. 48 Pearl oyster fishery policy guidelines (Western Australian Pearling Act 1990) Western Australian Fisheries Joint Authority (1992)
No. 49 Management plan, Kimberley prawn fishery. (1992) No. 50 Draft management plan, South West beach seine fishery. D.A. Hall (1993) No. 51 The west coast shark fishery, draft management plan. D.A. Hall (1993) No. 52 Review of bag and size limit proposals for Western Australian recreational
fishers. F.B. Prokop (May 1993)

122
No. 53 Rock Lobster Industry Advisory Committee, Chairman’s report to the Minister for Fisheries. (May 1993)
No. 54 Rock Lobster Industry Advisory Committee, Management proposals for 1993/94 and 1994/95 western rock lobster season (July 1993)
No. 55 Rock Lobster Industry Advisory Committee, Chairman’s report to the Minister for Fisheries on management proposals for 1993/94 and 1994/95 western rock lobster seasons (September 1993)
No. 56 Review of recreational gill, haul and cast netting in Western Australia. F. B. Prokop (October 1993)
No. 57 Management arrangements for the southern demersal gillnet and demersal longline fishery 1994/95 season. (October 1993)
No. 58 The introduction and translocation of fish, crustaceans and molluscs in Western Australia. C. Lawrence (October 1993)
No. 59 Proceedings of the charter boat management workshop (held as part of the 1st National Fisheries Manager Conference). A. E. Magee & F. B. Prokop (November 1993)
No. 60 Bag and size limit information from around Australia (Regulations as at September 1993) F. B. Prokop (January 1993)
No. 61 Economic impact study. Commercial fishing in Western Australia Dr P McLeod & C McGinley (October 1994)
No. 62 Management arrangements for specimen shell collection in Western Australia. J. Barrington, G. Stewart (June 1994)
No. 63 Management of the marine aquarium fish fishery. J. Barrington (June 1994) No. 64 The Warnbro Sound crab fishery draft management plan. F. Crowe (June
1994) No. 65 Not issued No. 66 Future management of recreational gill, haul and cast netting in Western
Australia and summary of submissions to the netting review. F.B. Prokop, L.M. Adams (September 1994)
No. 67 Long term management strategies for the Western Rock Lobster Fishery. (4 volumes) Evaluation of management options Volume 1. B. K. Bowen (September 1994)
No. 68 Long term management strategies for the Western Rock Lobster Fishery. (4 volumes) Economic efficiency of alternative input and output based management systems in the western rock lobster fishery, Volume 2. R.K. Lindner (September 1994)
No. 69 Long term management strategies for the Western Rock Lobster Fishery. (4 volumes) A market-based economic assessment for the western rock lobster industry, Volume 3. Marec Pty Ltd (September 1994)
No. 70 Long term management strategies for the Western Rock Lobster Fishery. (4 volumes) Law enforcement considerations, Volume 4. N. McLaughlan (September 1994)
No. 71 The Rock Lobster Industry Advisory Committee Chairman's Report, October 1994, The Western Rock Lobster Fishery - Management proposals for the 1994/95 and 1995/96 seasons (November 1994)
No. 72 Shark Bay World Heritage Area draft management plan for fish resources. D. Clayton (November 1994)

123
No. 73 The bag and size limit review: new regulations and summary of submissions. F. Prokop (May 1995)
No. 74 Report on future management options for the South West trawl limited entry fishery. South West trawl limited entry fishery working group (June 1995)
No. 75 Implications of Native Title legislation for fisheries management and the fishing industry in Western Australia. P. Summerfield (February 1995)
No. 76 Draft report of the South Coast estuarine fishery working group. South Coast estuarine fishery working group. (February 1995)
No. 77 The Offshore Constitutional Settlement, Western Australia. H. Brayford & G. Lyon (May 1995)
No. 78 The Best Available Information - Its Implications for Recreational Fisheries Management. Workshop at Second National Fisheries Managers Conference, Bribie Island Queensland. F. Prokop (May 1995)
No. 79 Management of the Northern Demersal Scalefish Fishery. J. Fowler (June 1995)
No. 80 Management arrangements for specimen shell collection in Western Australia, 1995. J. Barrington & C. Campbell (March 1996)
No. 81 Management Options (Discussion Paper) for the Shark Bay Snapper Limited Entry Fishery. Shark Bay Snapper Limited Entry Fishery Working Group, Chaired by Doug Bathgate (June 1995)
No. 82 The Impact of the New Management Package on Smaller Operators in the Western Rock Lobster Fishery R. Gould (September 1995)
No. 83 Translocation Issues in Western Australia. Proceedings of a Seminar and Workshop held on 26 and 27 September 1994. F. Prokop (July 1995)
No. 84 Bag and Size Limit Regulations From Around Australia. Current Information as at 1 July 1995. Third Australasian Fisheries Managers Conference, Rottnest Island. F. Prokop (July 1995)
No. 85 West Coast Rock Lobster Fishery Management Plan 1995 - Draft for Public Comment. Edited by M. Moran (August 1995)
No. 86 A Review of Ministerial Policy Guidelines for Rock Lobster Processing in Western Australia from the Working Group appointed by the Minister for Fisheries and chaired by Peter Rich (December 1995)
No. 87 Same Fish - Different Rules. Proceedings of the National Fisheries Management Network Workshop held as part of the Third Australasian Fisheries Managers Conference. F. Prokop
No. 88 Balancing the Scales - Access and Equity in Fisheries Management - Proceedings of the Third Australasian Fisheries Managers Conference, Rottnest Island, Western Australia 2 - 4 August 1995. Edited by P. Summerfield (February 1996)
No. 89 Fishermen's views on the future management of the rock lobster fishery. A report. Prepared on behalf of the Rock Lobster Industry Advisory Committee by The Marketing Centre. (August 1995)
No. 90 A report on the issues effecting the use of the Dampier Archipelago. Peter Driscoll, Landvision Pty Ltd (March 1996)
No. 91 Shark Bay World Heritage Property - Management Paper for Fish Resources. Kevin A Francesconi (September 1996)

124
No. 92 Pearling and Aquaculture in the Dampier Archipelago - Existing and Proposed Operations. A report for public comment. Compiled by Ben Fraser (September 1996)
No. 93 Shark Bay World Heritage Property - Summary of Public Submissions to the Draft Management Plan for Fish Resources. Kevin A Francesconi (September 1996)
No. 94 Rock Lobster Industry Advisory Committee Report - Management arrangements for the Western Rock Lobster Fishery for the 1997/98 season. Frank Prokop (May 1997)
No. 95 Australian Salmon and Herring Resource Allocation Committee. P McLeod & F Prokop (in press)
No. 96 Summary Report of the Freshwater Aquaculture Taskforce (FAT) by Chris Wells (in press)
No. 97 (in press) No. 98 A Pricing Policy for Fisheries Agencies - Standing Committee on Fisheries
and Aquaculture Management Committee. P Millington (March 1997) No. 99 Management of the South Coast Purse Seine Fishery. J Fowler, R Lenanton,
Kevin Donohue,M Moran & D Gaughan. (n.d.) No. 100 The Aquaculture of non-endemic species in Western Australia - Redclaw
crayfish (Cherax quadricarinatus). Tina Thorne (June 1997) No. 101 Optimising the worth of the catch - Options and Issues. Marec Pty Ltd
(September 1997) No. 102 Marine farm planning and consultation processes in Western Australia.
Dave Everall (August 1997) No. 103 Future management of the aquatic charter industry in Western Australia by
the Tour Operators Fishing Working Group (September 1997). No. 104 Management of the Houtman Abrolhos System (draft). Prepared by the
Abrolhos Islands Management Advisory Committee in conjunction with Fisheries Western Australia (October 1997)
No. 105 Plan for the Management of the Houtman Abrolhos Fish Habitat Protection Area (draft). Prepared by the Abrolhos Islands Management Advisory Committee in conjunction with Fisheries Western Australia (October 1997)
No. 106 The impact of Occupational Safety and Health on the management of Western Australian Fisheries. Cameron Wilson (in press)
No. 107 The Aquaculture of non-endemic species in Western Australia - Silver Perch (Bidyanus bidyanus). Tina Thorne (June 1997)
No. 108 Issues affecting Western Australia's inshore crab fishery - Blue swimmer crab (Portunus pelagicus), Sand crab (Ovalipes australiensis). Cathy Campbell (September 1997)
No. 109 Abalone Aquaculture in Western Australia. Cameron Westaway & Jeff Norriss (October 1997)
No. 110 Proposed Voluntary Fishery Adjustment Scheme - South Coast Purse Seine Managed Fishery Report by Committee of Management (October 1997)
No. 111 Management Options for Pilbara Demersal Line Fishing. Gaye Looby (December 1997)
No. 112 Summary of Submissions to Fisheries Management Paper No. 108 - issues affecting Western Australia's inshore crab fishery. Compiled by Cathy Campbell (April 1998)

125
No. 113 Western Rock Lobster Management - Options and Issues. Prepared by Kevin Donohue on behalf of the Rock Lobster Industry Advisory Committee. (June 1998)
No. 114 A Strategy for the Future Management of the Joint Authority Northern Shark Fishery. Prepared by Tim Bray and Jo Kennedy. (June 1998)
No. 115 Guidelines for granting Aquaculture Leases. Prepared by Fisheries WA, the Aquaculture Development Council & the Aquaculture Council of WA. (July 1998)
No. 116 Future Management of the Aquatic Charter Industry in Western Australia - Final Report. By the Tour Operators Fishing Working Group (September 1998)
No.117 Management of the Houtman Abrolhos System. Prepared by the Abrolhos Islands Management Advisory Committee in conjunction with Fisheries Western Australia. (December 1998)
No. 118 Plan for the Management of the Houtman Abrolhos Islands Fish Habitat Protection Area (Schedule 1)
No. 119 Access to Wildstock for Aquaculture Purposes (not published) No. 120 Draft Management Plan for Sustainable Tourism at the Houtman Abrolhos
Islands. Prepared by LeProvost, Dames and Moore for the Abrolhos Islands Managment Advisory Committee in conjunction with Fisheries WA. (December 1998)
No. 121 Future Directions for Tourism at the Houtman Abrolhos Islands - Draft for Public Comment. Prepared by LeProvost, Dames and Moore for the Abrolhos Islands Management Advisory Committee in conjunction with Fisheries WA. (December 1998)
No. 122 Opportunities for the Holding/Fattening/Processing and Aquaculture of Western Rock Lobster (Panulirus cygnus). A discussion paper compiled by Fisheries WA. (November 1998)
No. 123 Future directions for the Rock Lobster Industry Advisory Committee and the Western Rock Lobster Managed Fishery. A discussion paper prepared by Kevin Donohue on behalf of the Rock Lobster Industry Advisory Committee. (December 1998)
No. 124 A Quality Future for Recreational Fishing in the Gascoyne. Proposals for Community Discussion. A five-year management strategy prepared by the Gascoyne Recreational Fishing Working Group (May 1999).
No. 125 Changes to Offshore Constitutional Settlement Arrangements; North West Slope Trawl Fishery and Western Deepwater Trawl Fishery. A discussion paper by Fiona Crowe and Jane Borg (May 1999)[not published]
No. 126 The South Coast Estuarine Fishery. A discussion paper by Rod Pearn and Tony Cappelluti. (May 1999)
No. 127 The Translocation of Barramundi. A discussion paper by Makaira Pty Ltd.[July 1999]
No. 128 Shark Bay Pink Snapper Managed Fisheries in WA No. 129 Review of the Western Australian Pilchard Fishery 12 - 16 April 1999.
Prepared by K.L. Cochrane, Fisheries Resource Division, Food and Agriculture Division of the United Nations (November 1999)
No. 130 Developing New Fisheries in Western Australia. A guide to applicants for developing fisheries Compiled by Lucy Halmarick (November 1999)
126
No. 131 Management Directions for Western Australia's Estuarine and Marine Embayment Fisheries. A strategic approach to management (November 1999)
No. 132 Summary of Submissions to Fisheries Management Paper No. 126 - The South Coast Estuarine Fishery - A Discussion Paper. Compiled by Rod Pearn (November 1999)
No. 133 Abalone Aquaculture in Western Australia, A Policy Guideline (December 1999)
No. 134 Management Directions for WA’s Coastal Commercial Finfish Fisheries. Issues and proposals for community discussion (March 2000)
No. 135 Protecting and Sharing Western Australia's Coastal Fish Resources. The path to integrated management. Issues and proposals for community discussion (March 2000)
No. 136 Management Directions for WA’s Recreational Fisheries (March 2000) No. 137 Aquaculture Plan for the Houtman Abrolhos Islands (April 2000) No. 138 Information on Quota Management of Rock Lobster Fisheries in South
Australia, Tasmania and New Zealand. By Kevin Donohue and Eric Barker (May 2000)
No. 139 A Quality Future for Recreational Fishing on the West Coast. Proposals for Community Discussion. A five-year management strategy prepared by the West Coast Recreational Fishing Working Group (June 1999)
No. 140 Aquaculture Plan for the Recherche Archipelago, Western Australia. (June 2000)
No. 141 Fish Protection Measures in Western Australia (June 2001) No. 142 Fisheries Environmental Management Plan for the Gascoyne Region (June
2002) No. 143 Western Rock Lobster. Discussion paper for seasons 2001/2002 and
2002/2003 (July 2000) No. 144 The Translocation of Brown Trout (Salmo trutta) and Rainbow Trout
(Oncorhynchus mykiss) into and within Western Australia. Prepared by Jaqueline Chappell, contributions from Simon Hambleton, Dr Howard Gill, Dr David Morgan and Dr Noel Morrissy. (not published, superseded by MP 156)
No. 145 The Aquaculture of non-endemic species in Western Australia - Silver Perch (Bidyanus bidyanus). As amended October 2000. Tina Thorne. This replaces Fisheries Management Paper No. 107.
No. 146 Sustainable Tourism Plan for the Houtman Abrolhos Islands (February 2001)
No. 147 Draft Bycatch Action Plan for the Shark Bay Prawn Managed Fishery (Full Report) (April 2002)
No. 148 Draft Bycatch Action Plan for the Shark Bay Prawn Managed Fishery (Summary Report) (April 2002)
No. 149 Final Plan of Management for the Lancelin Island Lagoon Fish Habitat Protection Area (March 2001)
No. 150 Draft Plan of Management for the Cottesloe Reef Proposed Fish Habitat Protection Area (April 2001)
No. 151 Inventory of the Land Conservation Values of the Houtman Abrolhos Islands (July 2003)

127
No. 152 Guidelines for the Establishment of Fish Habitat Protection Areas (June 2001)
No. 153 A Five-Year Management Strategy for Recreational Fishing on the West Coast of Western Australia. Final Report of the West Coast Recreational Fishing Working Group (August 2001).
No. 154 A Five-Year Management Strategy for Recreational Fishing in the Gascoyne. Final Report of the Gascoyne Recreational Fishing Working Group (September 2001)
No. 155 Plan of Management for the Cottesloe Reef Fish Habitat Protection Area (September 2001)
No. 156 The Translocation of Brown Trout (Salmo Trutta) and Rainbow Trout (Oncorhynchus mykiss) into and within Western Australia (June 2002)
No. 157 Policy for the Implementation of Ecologically Sustainable Development for Fisheries and Aquaculture within Western Australia. By W.J. Fletcher (May 2002)
No. 158 Draft Plan of Management for the Miaboolya Beach Fish Habitat Protection Area (March 2002)
No. 159 The Translocation of Barramundi (Lates calcarifer) for Aquaculture and Recreational Fishery Enhancement in Western Australia. By Tina Thorne.
No. 160 The Introduction and Aquaculture of Non-endemic Species in Western Australia: the ‘Rotund’ Yabby Cherax rotundus and the All-male Hybrid Yabby. A Discussion Paper. (June 2002)
No. 161 Plan of Management for the Miaboolya Beach Fish Habitat Protection Area (September 2002)
No. 162 Reseeding of grazing gastropods and bivalves into the marine environment in Western Australia – a discussion paper. By Jane Borg.
No. 163 Review of recreational take of coral in Western Australia – a discussion paper October 2002.
No. 164 Report of the Mackerel Independent Advisory Panel to the Executive Director, Department of Fisheries, on criteria for access to, and management arrangements for, the proposed Mackerel Fishery (Interim) Management Plan (November 2002)
No. 165 Report to the Minister for Agriculture, Forestry and Fisheries by the Integrated Fisheries Management Review Committee (November 2002)
No. 166 Fisheries Statutory Management Authority Inquiry. A background paper (February 2003)
No. 167 Draft Fisheries Environmental Management Plan for the Northern Region (in press)
No. 168 Aboriginal Fishing Strategy: Report to the Minister for Agriculture, Forestry and Fisheries by the Hon E. M. Franklyn QC, Chairman of the Aboriginal Fishing Strategy Working Group (May 2003)
No. 169 Hardy Inlet discussion paper (February 2004) No. 170 Management of the proposed Geographe Bay Blue Swimmer and Sand
Crab Managed Fishery. By Jane Borg and Cathy Campbell (August 2003) No. 171 Draft Aquaculture Plan for Shark Bay (April 2004) No. 172 Draft Aquaculture Plan for Exmouth Gulf (April 2004) No. 173 Draft Plan of Management for the proposed Point Quobba Fish Habitat
Protection Area (August 2003)

128
No. 174 Translocation of Golden Perch, Murray Cod and Australian Bass into and within Western Australia for the Purposes of Recreational Stocking, Domestic Stocking and Commercial and Non-commercial Aquaculture (December 2003)
No. 175 Fish Stock and Fishery Enhancement in Western Australia - a discussion paper. By Jane Borg (February 2004)
No. 176 Fish Stock and Fishery Enhancement in Western Australia - a summary report. By Jane Borg (February 2004)
No. 177 Fisheries Environmental Management Plan for the Gascoyne Region (in press)
No. 178 Draft Plan of Management for the Kalbarri Blue Holes Fish Habitat Protection Area (March 2004)
No. 179 A Draft Policy for the Translocation of Brown Trout (Salmo trutta) and Rainbow Trout (Oncorhynchus mykiss) into and within Western Australia for the Purposes of Recreational Stocking, Domestic Stocking and Commercial and Non-Commercial Aquaculture (August 2004)
No. 180 The Sustainable Management of Western Australia's Temperate Shark Fisheries (July 2004).
No. 181 A Quality Future for Recreational Fishing in the Pilbara/Kimberley. Proposals for Community Discussion. A five-year strategy for managing the recreational component of the catch, prepared by the Pilbara/Kimberley Recreational Fishing Working Group (July 2004)
No. 182 A Quality Future for Recreational Fishing in the Southern Region of WA. Proposals for Community Discussion. A five-year strategy for managing the recreational component of the catch, prepared by the Southern Recreational Fishing Working Group (July 2004)
No. 183 Final Report of the Fisheries Statutory Management Authority Advisory Committee. Published by the Department of Fisheries (in press)
No. 184 South West Beach Seine Management Discussion Paper No. 185 Plan of Management for the Point Quobba Fish Habitat Protection Area
(July 2004) No. 186 Management of the West Coast Rock Lobster Fishery - Advice to
Stakeholders on Resource Sustainability Matters. (in press) No. 187 Proposals for community discussion on the future management of pink
snapper fishing in Cockburn Sound and surrounding waters. (October 2004).
No. 188 Plan of Management for the Kalbarri Blue Holes Fish Habitat Protection (in press).
No. 189 Proposed Management Arrangements for the Gascoyne Commercial ‘Wetline’ Fishery. A Discussion Paper Prepared By The West Coast And Gascoyne Wetline Review Management Planning Panel (January 2005).
No. 190 Management Arrangements for the West Coast Commercial ‘Wetline’ Fishery. A Discussion Paper Prepared By The West Coast And Gascoyne Management Planning Panel (January 2005).
No. 191 Access And Allocation Arrangements For The Commercial ‘Wetline’ Fisheries, Proposals For Discussion. A Report To The Minister For Fisheries Prepared By The Commercial Access Panel (January 2005).
No. 192 Integrated Fisheries Management Report - Western Rock Lobster Resource (February 2005)

129
No. 192A A Sustainable Future for Recreational Fishing in the Cocos (Keeling) Islands. Proposals for Community Discussion on a Five-Year Strategy for Managing the Recreational and Subsistence Catch (March 2005).
No. 193 A Five-Year Management Strategy for the Pilbara/Kimberley Region of Western Australia (June 2005).
No. 194 A Five-Year Management Strategy for the South Coast Region of Western Australia (June 2005).
No. 195 Nature and Extent of Rights to Fish in Western Australia (June 2005). No. 196 The Aquaculture of Live Rock, Live Sand, Coral and Associated Products
(in press). No. 197 Proposed Implementation of Sea Lion Exclusion Devices in the Western
Rock Lobster Fishery (June 2005). Internet publication. No. 198 A Quality Future for the Recreational Marron Fishery – Proposals for
Community Discussion. A Draft Five-Year Strategy to Ensure the Long Term Sustainability of the Marron Fishery. Produced by the RFAC Recreational Freshwater Fisheries Stakeholder Sub-Comittee (in press).
No. 199 Management of the Proposed South Coast Trawl Fishery (in press). No. 200 Integrated Fisheries Management Draft Allocation Report for the Western
Rock Lobster Resource (in press). No. 201 The Minister for Fisheries’ Decisions in Response to the Final Report of the
Pilbara/Kimberley Recreational Fishing Working Group (Fisheries Management Paper No. 193) (in press).
No. 202 The Minister for Fisheries’ Decisions in Response to the Final Report of the South Coast Recreational Fishing Working Group (Fisheries Management Paper No. 194) (in press).
No. 203 Western Rock Lobster Fishery. Ecological Risk Assessment 2005 Report (July 2005). Internet publication.
No. 204 Integrated Fisheries Management Report. Abalone Resource (in press). No. 205 Management Arrangements for the Gascoyne Commercial ‘Wetline’
Fishery. Prepared By The West Coast And Gascoyne Wetline Review Management Planning Panel (in press).
No. 206 Management Arrangements for the West Coast Commercial ‘Wetline’ Fishery. Prepared By The West Coast And Gascoyne Management Planning Panel (in press).
No. 207 Access And Allocation Arrangements For The Commercial ‘Wetline’ Fisheries. A Report To The Minister For Fisheries Prepared By The Commercial Access Panel (in press).
No. 208 Review of the Fish Resources Management Act 1994. A discussion paper (in press)
No. 209 Assessment of Western Rock Lobster Strategic Management Options An Overview of Bio-Economic, Sociological and Comparative Analyses (Volume 1 of 4)
No. 210 Assessment of Western Rock Lobster Strategic Management Options A Bio-Economic Evaluation of Management Options for the West Coast Rock Lobster Fishery (Volume 2 of 4)
No. 211 Assessment of Western Rock Lobster Strategic Management Options A Social Assessment of Coastal Communities Hosting the Western Rock
Lobster Fishing Fleet (Volume 3 of 4) No. 212 Assessment of Western Rock Lobster Strategic Management Options How do Quota Management Systems Work in Rock Lobster Fisheries? (Volume 4 of 4)

Minister for Fisheries; the Kim berley, Pil bara and Gascoyne
Our ref: 21-2261
Dear Licence Holder I Stakeholder
A Review of Management Options for the Rock Lobster Fishery
Please find enclosed an overview of some of the important information provided in the four reports produced for the review of west coast rock lobster management system.
The main purpose of the review is to assess if another management system, for example individual transferable quotas (ITQs), offers the industry greater opportunity to significantly increase its economic performance compared to the current management system.
The review was undertaken initially to address National Competition' Policy matters. However, as time has gone by it has become more relevant due to economic pressures, such as the increased cost of fishing - fuel, labour and bait - and the decline in the beach price, which have reduced the industry's profitability. These pressures are unlikely to diminish in the short to medium term. Therefore it makes good business sense to see if the fishery's management system can be improved to deliver greater benefits for the industry and the Western Australian community generally.
Everyone should take the time to carefully read and understand the information that has been provided in the review reports before making up their minds as to which management system offers the best long-term economic, social and ecological outcomes for the fishery.
At this point, the State Government does not favour one management system over another. Rather the Government has the expectation that the review process will identify the best long-term approach for managing the fishery within an ecologically sustainable framework. However, to justify a change to a new management system the additional economic benefits would have to be significant. It is likely that hdustry would need to gain $20 to $30 million per year in net profits (a 10% increase), compared to the current system to warrant implementing a new approach.
As we enter the next phase of the review, the Western Rock Lobster Council has a key leadership role to play in co-ordinating the consultation process. To assist them the Council will engage an independent facilitator to ensure industry understands the major issues involved in staying with the current management system or changing to a new system.
9th Floor, Dumas House, 2 Havelock Street,West PertR WA 6005 Telephone (08) 92 1 3 7200 Facsimile (08) 92 t 3 720 1 Email jon-fordad pc.wa.gov.au

The Council has also undertaken to conduct a poll of industry towards the end of 2006, to determine its preferred position. The poll results along with advice from the Rock Lobster Industry Advisory Committee and other stakeholders will be forwarded to the Government for its consideration in early 2007. The Government would like to be in a position to make a decision on the long-term management of the rock lobster fishery by mid 2007.
I encourage people to meet with the independent facilitator (see the enclosed summary for meeting dates) so they can enter into informed discussion and debate on the future management of the fishery. I have appointed Hon Sheila Mills MLC as my special Ministerial representative to follow the review process, so please welcome her and make your views known to her.
The Government looks forward to receiving well-considered advice and comment from industry and other stakeholders.
s; the Kimberley, Pilbara and Gascoyne

Approved for circulation by the Minister for Fisheries January 2006
IntroductionThe purpose of this paper is to provide a brief summary of some key aspects of the review of the West Coast Rock Lobster Fishery management system. It is based on the four reports that were prepared as part of the Assess-ment of Western Rock Lobster Strategic Management Options, which you are encouraged to read.
This summary is not a complete analysis of the management options before industry and Government, rather it focuses on two of the options investigated: the current management system and Individual Transferable Quotas (ITQs).
Major differences between the current system and ITQsThe current system seeks to ensure sustainability by limiting fi shing effort (principally pot numbers and fi shing time) to control catch. ITQs ensure sustainability by directly controlling the catch.
The current system encourages competition between fi shers to max-imise their catch (but not necessarily their profi ts), which leads to over-capitalisation and high fi shing costs.
The experience in other lobster fi sheries with ITQs is that fi shers are encouraged to maximise profi t from their share of the catch. Typically they do this by restructuring their businesses and changing their fi shing behaviour to reduce costs. For ex-ample, some fi shers have combined their quotas and fi sh from one boat. Fishers have also targeted their effort to catch at times when the market
is prepared to pay the highest price. The degree to which fi shers can or will change their behaviour in order to maximise profi t varies within each fi shery and between fi sheries due to a range of factors.
One negative aspect of ITQs is that there is an incentive to cheat on quota. Therefore a comprehensive compliance program is required, which is likely to increase the cost of management, at least in the transi-tional years.
Protecting the breeding stockNo matter which management sys-
tem is eventually chosen, the prime aim of management will be to ensure that the lobster breeding stocks are maintained at safe and sustainable levels, as defi ned by the decision rules framework.
The current management system has generally been successful from a sustainability perspective. However, effective fi shing effort continues to increase (fi shers are fi shing harder and smarter) and if the current sys-tem is maintained it is highly likely that further reductions in pots or fi shing time or both will be required.
Under ITQs effi ciency gains do not present the same threat to sustainability, because the catch is capped, but if there were a decline in the breeding stock the quota would have to be reduced.
Fleet Size and OwnershipThere were 836 boats in the fi shery when limited entry was introduced in 1963. The number had declined
to 549 by 2004 and a further 49 boats have retired from the fi shery in the 12 months to December 2005, bringing the total to 500 ¹. This is the largest reduction in a single year in the history of the fi shery. The con-tinual adjustment of the fl eet under the current system is facilitated by regulations that permit the transfer of licences and units without a limit on how many units (pots) can be held on a single licence.
The rate at which this adjustment occurs is dependent upon many things, but in recent times the “cost-price squeeze” which has reduced fi shers’ profi tability appears to have been a major factor. There is a gen-eral trend for boats to become larger and utilise more pots, which is likely to continue, particularly if further effort reductions are required.
In New Zealand, Tasmania and the Northern Zone South Australian Fishery, where ITQs are in place, there has been a reduction in both boat numbers and the number of entities owning quota units, due to market pressures forcing businesses to become more effi cient and profi t-able.
The rate at which industry adjusted in these quota managed fi sheries depended on the extent to which the management system limited ownership (aggregation) of quota units and the degree to which the initial allocation of quota redis-the initial allocation of quota redis-tributed catch among unit holders.
Summary of Rock Lobster Management Review
¹ Note this fi gure replaces the 495 boats quoted in ‘An Overview of Bio-Economic, Sociological and Comparative Analyses’, by ¹ Note this fi gure replaces the 495 boats quoted in ‘An Overview of Bio-Economic, Sociological and Comparative Analyses’, by the Department of Fisheries 2005. Boat numbers based on the number of active Managed Fishery Licences.the Department of Fisheries 2005. Boat numbers based on the number of active Managed Fishery Licences.
Value of entitlementUnder the current system, trading in the market for pot units has driven the price generally upwards. How-ever, in recent times the value has decreased as the business of lobster fi shing has become less profi table due to increases in the cost of fi shing and depressed prices because of increased competition in the market place and less favourable terms of trade.
It is diffi cult to predict what the value of entitlements will do should the fi shery remain with the existing management system. However, if further effort reductions are required to protect the breeding stock (par-ticularly pot reductions) it would be likely to increase demand for units (pots) and put upwards pressure on their value.
In New Zealand, Tasmania and the Southern Zone South Australian lobster fi sheries, the value of quota entitlements increased signifi cantly following the introduction of ITQs. The demand to buy and lease quota was spurred by the need for participants to adjust the amount of quota they held to fi t the size of their fi shing operation. It is also apparent that the improving health of these fi sheries under ITQs and the resultant increase in catch rates has improved profi tability, which has added confi dence to the market.
To date, the majority of invest-ment in quota entitlements in these fi sheries has come from the existing entitlement holders.
Setting ITQsIf the industry and government de-cide to move to ITQs, the Minister has indicated that the quota alloca-tion would be based on the number of unit (pot) entitlements owned. Catch history would not be taken into account. This decision is based on the fact that it is not possible in all cases to match catches with units (pots) and their owners. There have also been legal rulings handed down in Australia in recent years that support entitlement based allocation systems.
Quota would be set by zone and if they were in place now, allocations could be done for the next three years based on catch predictions and the status of the breeding stock. To allow for the uncertainty in the pre-dictions, the potential black market and the need to take a conservative approach regarding sustainability, the catch predictions would be dis-counted by about 5% prior to the quota being set.²
For Zone C the calculation is straightforward, i.e. the predicted catch for Zone C (minus 5%) divided by 35,634 unit (pot) entitlements in
Zone C = Quota (kg) allocated to each unit (pot) entitlement.
For A and B fi shers the quota al-location calculation is more complex because they both fi sh Zone B from the 15 November to 14 March. Therefore quotas have to be set for Zone B from 15 November to 14 March, which A and B fi shers would share based on the number of unit (pot) entitlements they hold. In ad-dition separate quotas have to be set for Zone A (Abrolhos Is) for A fi sh-ers only, and Zone B from 15 March to the end of the season for B fi shers only and the quota shares would be based on the number of units (pot) entitlements held.
The table below provides an ex-ample of what the quota allocations could be for Zones A, B and C for the 2005-06, 2006-07 and 2007-08 seasons, based on dividing the zone quotas by the number of unit (pot) entitlements in each zone.
2
² The level of discounting would go up and down each year depending on the status of the stock at the end of each season and ² The level of discounting would go up and down each year depending on the status of the stock at the end of each season and other factors.
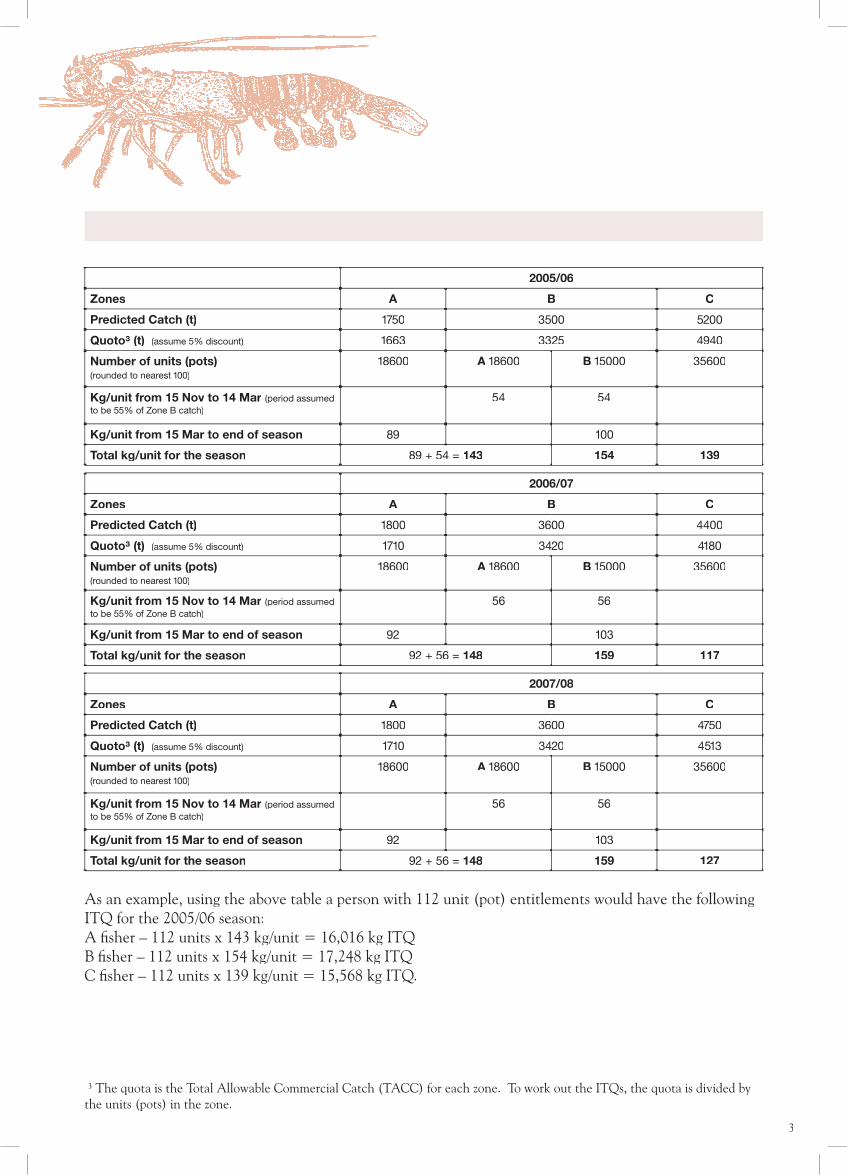
3
2005/06
Zones A B C
Predicted Catch (t) 1750 3500 5200
Quoto³ (t) (assume 5% discount) 1663 3325 4940
Number of units (pots) (rounded to nearest 100)
18600 A 18600A 18600A B 15000 35600
Kg/unit from 15 Nov to 14 Mar (period assumed to be 55% of Zone B catch)
54 54
Kg/unit from 15 Mar to end of season 89 100
Total kg/unit for the season 89 + 54 = 143 154 139
2006/07
Zones A B C
Predicted Catch (t) 1800 3600 4400
Quoto³ (t) (assume 5% discount) 1710 3420 4180
Number of units (pots) (rounded to nearest 100)
18600 A 18600A 18600A B 15000 35600
Kg/unit from 15 Nov to 14 Mar (period assumed to be 55% of Zone B catch)
56 56
Kg/unit from 15 Mar to end of season 92 103
Total kg/unit for the season 92 + 56 = 148 159 117
2007/08
Zones A B C
Predicted Catch (t) 1800 3600 4750
Quoto³ (t) (assume 5% discount) 1710 3420 4513
Number of units (pots) (rounded to nearest 100)
18600 A 18600A 18600A B 15000 35600
Kg/unit from 15 Nov to 14 Mar (period assumed to be 55% of Zone B catch)
56 56
Kg/unit from 15 Mar to end of season 92 103
Total kg/unit for the season 92 + 56 = 148 159 127
As an example, using the above table a person with 112 unit (pot) entitlements would have the following ITQ for the 2005/06 season:A fi sher – 112 units x 143 kg/unit = 16,016 kg ITQB fi sher – 112 units x 154 kg/unit = 17,248 kg ITQC fi sher – 112 units x 139 kg/unit = 15,568 kg ITQ.
³ The quota is the Total Allowable Commercial Catch (TACC) for each zone. To work out the ITQs, the quota is divided by the units (pots) in the zone.

These estimates are indicative to illustrate the process. They use the latest information on unit entitle-ments by zone (rounded to the near-est 100) but do not take into account the effort reductions implemented in 2005 or the status of the stocks at the end of the 2004/05 season.
FindingsThe results of modelling the differ-ent management options has shown that ITQs offer substantial scope for the fi shery to improve effi ciency by reducing the cost of fi shing and the number of boats to about 260. In practice it is likely that more boats would remain in the fi shery than the model predicts. ITQs could also have the potential to deliver some improvement in prices, which
combined with the effi ciency gains could result in signifi cant additional annual net benefi ts for the industry in the vicinity of $20 to $70 million per year. However, these potential benefi ts have to be weighed against the risks that they may not be as large as estimated or they may take a long time to materialise and that quota cheating could be a signifi cant issue.
4
Planned timetable of the review and decision making processA four phase consultation and decision making process will be used to decide which management system is best for the long-term management of the rock lobster industry.
Phase 1 (Jan 04 to Dec 05)Assess and compare a number of fi shing effort and quota
management systems.
Phase 2 (Jan 06 to Sept 06)Stakeholder discussion on the advantages and disadvantages
of fi shing effort and quota management systems.
Phase 3 (Oct 06 to Feb 07)
Stakeholder’s views considered and advice prepared for Gov-ernment. Industry will be polled for their views. It is hoped
that fi shers will arrive at an industry consensus on which management option they prefer.
Phase 4 (March 07 to September 08)Government makes its decision on which management system to use and implementation commences with the view to hav-
ing it in place by 2008/09.
The Western Rock Lobster Council has organised meetings to start the industry consultation process on the management review and all those involved in the rock lobster industry are encouraged to attend. For further information contact the Council on 9492 8827.
9 am Tuesday 7th February - Geraldton Entertainment Centre, Urch St, Geraldton.9 am Tuesday 7th February - Geraldton Entertainment Centre, Urch St, Geraldton.
9 am Monday 13th February - Fremantle Sailing Club, Marine Terrace, Fremantle.9 am Monday 13th February - Fremantle Sailing Club, Marine Terrace, Fremantle.
The review reports are available on the Department of Fisheries’ web site at www.fi sh.wa.gov.au or the The review reports are available on the Department of Fisheries’ web site at www.fi sh.wa.gov.au or the Western Rock Lobster Council’s web site at www.rocklobsterwa.com and hard copies are available by Western Rock Lobster Council’s web site at www.rocklobsterwa.com and hard copies are available by contacting the Department on (08) 9482 7267.