Embed Size (px)
Citation preview

Food and Nutrition Sciences, 2015, 6, 923-934 Published Online July 2015 in SciRes. http://www.scirp.org/journal/fns http://dx.doi.org/10.4236/fns.2015.610096
How to cite this paper: Hussein, L., Hassan, N., Mohamad, M. and Aziz, S.A. (2015) Assessment of Usual Fruit, Vegetable and Vitamin C Intakes in a Sample of Egyptian Children: Pilot Study. Food and Nutrition Sciences, 6, 923-934. http://dx.doi.org/10.4236/fns.2015.610096
Assessment of Usual Fruit, Vegetable and Vitamin C Intakes in a Sample of Egyptian Children: Pilot Study Laila Hussein*, Nehad Hassan, Mahmoud Mohamad, Sahar Abdel Aziz Department of Nutrition, National Research Center, Giza, Egypt Email: *[email protected], [email protected], [email protected], [email protected] Received 22 March 2015; accepted 24 July 2015; published 27 July 2015
Copyright © 2015 by authors and Scientific Research Publishing Inc. This work is licensed under the Creative Commons Attribution International License (CC BY). http://creativecommons.org/licenses/by/4.0/
Abstract The objective was to create an Egyptian database on the contributors of fruit and vegetables in the diets of preschool children and to estimate the usual daily intakes of fruits, vegetables and vitamin C. A total of 59 healthy boys and girls aged 2.5 - 6 years attending day care centers in urban Giza governorate completed the study by interviewing their mothers on 6x non-consecutive days using the 24 h dietary recall. Participants were classified according to age, gender and socioeconomic class. Prevalence of daily consumptions of fruits and vegetables amounted to 22% and 54%, re-spectively of the total children. The daily intakes of fruits and vegetables averaged 117.5 and 56.4 g, respectively. The consumption of different types of fruits and vegetables was unevenly distri-buted by different personal and social variables. Estimated daily vitamin C supply from the diet was 38 mg per child, which satisfied the respective recommended nutrient intake (RNI) of 30 mg for the first six years of life. However, the diet of 15% of the children covered less than 75% of RNI. Top fruits contributing to vitamin C were oranges, guava, watermelon, pears and grapes. Extra foods such as chipsy was consumed by 81% of the children, contributed 18% to daily vitamin C supply and also 58.6 mg sodium. A multilevel intervention strategy is warranted for promoting daily fruit and vegetable intake and healthy eating in early childhood.
Keywords Children Aged 2.5 - 6 Years, Fruit & Vegetable Intakes, Vitamin C Intake, Health Problems & Vit C Deficiency
*Corresponding author.

L. Hussein et al.
924
1. Introduction A number of international recommendations and population targets defined the desirable level of consumption of fruit and vegetables for children [1]. Dietary guidelines convey the importance of consuming 400 grams of total fruits-vegetables at all age groups [2] and limiting salty or sweet snack foods. The daily consumption of at least one portion of fruit and one portion of vegetables was considered to be an absolute minimum in children and there is inconsistency about including or excluding potatoes, fruit juice, vegetable soup and tubers. When using 400 grams as a cut-off; 6% - 24% of the European children 11 years old had an intake of ≥400 g/day; Austrian children with 175 g per day were highest, while Icelander children with 80 g per day were the lowest [1].
Dietary vitamin C (AA) is present exclusively in fruits and vegetables and the consumption of vegetables [3] and dietary intake of vitamin C has attained great importance from the point of view of prevention of disease and therapy [4]. Vitamin C is in the form of the reduced form L-ascorbic (AA) and the dike to L-dehydro- ascorbic acid (DHAA); both forms are biologically active to humans. The DHAA content of fresh fruits and vegetables is on the order of 5% - 10% of total vitamin C [5] whereas storage and/or processing may increase the proportion to 30 % or greater [5] [6].
The functions of A are based primarily on its properties as a reversible biologic reductant and it efficiently scavenges hydroxyl and superoxide radicals [4]. Vitamin C deficiency causes oxidative damage to lipids and proteins in the brain, which may end up with neurodegenerative diseases. Vitamin C improves the apparent iron absorption in individuals with low iron stores [7]. The antiscorbutic function of AA is attributed to hydroxyla-tion of peptide bound proline during the biosynthesis of collagen; an important structural component of blood vessels, tendons, ligaments and bone [8].
Reactivity of radical oxygen species (ROS) with anantioxidant molecule such as vitamins C, leading to neu-tralised or greatly reduced reactivity [9]. After this process, the antioxidant properties of AA are lost and the vi-tamin must be constantly replenished or recycled.
Vitamin C accumulates in the central nervous system and the highest concentrations of ascorbate in the body are found in the brain and the neurons. Today ascorbate is proposed as a neuromodulator of glutamatergic, do-paminergic, cholinergic, and GABAergic transmission and related behaviors [10].
Vitamin C deficiency may be due to limited dietary supply or due to losses during the processing of foods as it is water soluble, easily oxidized and attacked by enzymes. The variations of ascorbic acid in fresh and ther-mally processing led to pronounced loss in the ascorbic acid content in all crops studied [5].
The promotion of daily fruit and vegetable consumption in childhood is important, since young children can learn to accept a greater variety of foods and flavours through repeated exposure [11] and may, to a certain ex-tent, track into adolescence and adulthood. Food choice was thought to be influenced by a number of environ-mental and individual factors. Environmental factors may include food pricing [12]. Cost of food was negatively associated with dietary quality, low cost diets tending to have increased energy density and poor nutrient ade-quacy [13] [14].
The aim of the present study is to assess the usual intake of fruits and vegetables derived from repeated follow up dietary recalls performed among representative preschool children. The vitamin C supply with fruits and vegetables and percentage of children not satisfying the recommended vitamin C intake was also investigated.
2. Materials and Methods 2.1. Participating Children Fifty nine boys and girls aged 2.5 - 6 years were recruited from four daycare- centers located in El-Haram, Giza Governorate. Data related to the age of each child was obtained from birth certificate. Mothers of the children were interviewed after the nature of the study was explained to them and the mothers gave their written consent.
Socio economic characteristic The socioeconomic status (SES) was measured by a composite score of com-pleted educational level of the heads of the household (in years). Education has been used as a common indica-tor because it is easy to measure and is the most stable measure of socioeconomic status. Household income per capita (in Egyptian pounds) and parental occupation. The SES index score was predicted from the following equation [15]. Socioeconomic status = 2.259 + 1.016 (C1) + 0.886 (C2) + 0.622 (C3) + 0.013 (C4), whereby C1 = Average income of the household per month in Egyptian pounds; C2: Score of the father’s occupation (score 5 - 50); C3: Score of the father’s education (0 - 15 years); C4: Score of the mother’s occupation. The socioeco-nomic levels were categorized as low with score (48 - 96); medium (97 - 144) and high (145 - 192).

L. Hussein et al.
925
2.1.1. Dietary Assessment A face-to-face six-pass 24-hour dietary recall was used to collect dietary information. Three recalls were col-lected during the month of December and three 24-h dietary recalls were collected during the month of August. The mothers reported the intake for their childrenand the interviews were conducted in the respondent’s home. The familiar environment encouraged participation, improved the recall of foods consumed and facilitated cali-bration of local household utensils by the interviewer [16]. The mothers were given instructions tolist the actual amounts and forms of all foods consumed at breakfast, lunch, dinner and snacks at home and away from home during the last 24-hour dietary recalls. These included both simple foods such as fresh vegetables, fruits, juices and complex foods such as cooked recipes.
2.1.2. Sampling Protocol To convert food intake into vitamin C equivalent, duplicate portions were transported to the laboratory for vita-min C determinations and 106 food items were identified. The purchase of the majority of the food cores was completed by experienced dietitians. Ready to eat dishes and commercial products such as chipsy and pickles were purchased from food stands or restaurants. At least three generous servings of each sample were collected directly from the serving lines, placed in plastic containers and packed in a portable thermo-container for trans-port. Dishes that required preparation or that were ingredients for mixed dishes were home-made by experienced dieticians using tradition Egyptian cooking practices approximated those used in homes.
In the laboratory, inedible portions were removed and only edible parts of vegetables and fruits were used. Portions from two to six major brands of each product were prepared for analysis.
Food description systems followed the recommended published reports [17] [18]. These included important descriptors consisting of food source, scientific name, part of the plant, major cultivars; preservation state; food processing; heat treatments; added ingredients, packaging type or storage conditions. Identifying the major commercial products was also recorded and an approximation of their sales ranking was reported.
2.2. Laboratory Investigations Moisture determination The fresh edible portions were weighed, dehydrated by freeze-drying and final dry weight of each food sample was recorded and the percentage moisture was calculated.
The vitamin C was determined by the microfluorometric technique [19]. Food portions (0.5 - 5 g) was weighed with approximate vitamin C content between 2 and 100 mg and
blended in a Waring blender with 3% meta-phosphoric acid dissolved in 8% glacial acetic acid (mP-A-W). Juices were homogenized with mP-A-W at a ratio of 1:3 (v/v). Foodstuffs rich in basic compounds (roots; tubers and fresh leafy vegetables) were extracted with acidic solution (15 g metaphosphoric acid—40 ml glacial acetic and 200 ml of diluted sulfuric acid, 0.3 N) (mP-A-S). Further dilution was carried out with (mP-A-W), sothat the vitamin C concentration ranged between 1 - 5 mg/100ml.
The pH was checked and adjusted to around 1.2 and the volume was brought to constant volume. After filtra-tion, aliquots (25 ml) were treated with norit (2 grams) for the conversion of ascorbic acid (AA) into its oxidized derivative dehydro ascorbic acid (DHAA). Aliquots of the norit treated filtrate (5 ml) were transferred into two separate 100 ml volumetric flasks. The first flask contained 5 ml aqueous sodium acetate solution (50%) and the volume was completed to the mark with distilled water; whereas, the second flask contained 5 ml boric acid (3% dissolved in 50 % sodium acetate); which converted the ascorbic acid into borate—dehydroascorbic acid com-plex and this served as blank. It was treated in an identical manner as the first flask. Two milliliters aliquots were taken from each flask and mixed with 0.02% aqueous ortho-phenylenediamine to form the fluorescent chinoxalin derivative. The fluorescence was measured within 30 minutes at excitation and emitting wavelengths of 350 and 430 nm, respectively. A reagent blank was run in parallel.
Pure ascorbic acid (5 mg/dl) (Merck) was used throughout the present work as an external standard for cali-bration. The working solutions were prepared by dilution from the stock with (mP-A-W) to contain between 1 - 50 µg per ml. Aliquots were taken and treated in an identical manner as the test samples. The whole analytical process was carried out in dim light and care was given to avoid excess oxygen and temperature increase.
Quality control: A Standard Reference Material (SRM 1846) consisting of an Infant formulae was obtained from the National Institute of Standards and Technology (NIST; Gaithersburg, Maryland, USA) and was treated in a similar manner to the unknown samples. The analysis of the SRM 1846 by the present analytical method
L. Hussein et al.
926
gave mean level of 11.3 mg vitamin C/100g equivalent to 103.6% of the certified value (10.9 mg/100g) reported by the NIST.
Calculation: The external standard procedure was adopted throughout the course of the vitamin C analysis. Based on the concentration and the respective fluorescent reading of the standard ascorbic acid solutions, linear regression equation were derived and the regression factors a, b were used for calculating the ascorbic acid in the test samples.
2.3. Estimation of the Daily Nutrient Intakes
Six 24 hour food intake measurements for each child were the basis for estimating the usual fruits and vegetable intakes. The mean intake of the completed records was taken for each fruit and vegetable and expressed in g/d. To obtain the amount of vitamin C consumed, the amount of fruit or vegetable consumed in grams/d was mul-tiplied by the vitamin C content in the fruit or vegetable.
The probability of adequacy was determined by dividing the dietary vitamin C supply by the recommended nutrient intake (RNI) of vitamin C, which is 30 mg for the age group 2 - 6 years [20].
3. Statistical Analysis The fruit and vegetable frequency questions were categorized into response category 1 - 6 and accordingly, the children were distributed according to the frequency of consumption per 6 days. Percentages, means and stan-dard errors were calculated to describe frequency of fruit and vegetable characteristics. Mean and median esti-mated daily intake of fruits, vegetables and vitamin C among the whole study group or according to specific categories are calculated. Significant differences were assessed by using students’ t test or the non-parametric Chi square test. Differences with P ≤ 0.05 were considered significant.
4. Results Table 1 presents number of times fruits and vegetables were reported by the children during the 6-day repeated recall period. In the total sample, 22% of the children reported to eat fruit every day, 54.2% reported to eat veg-etables every day. Percentage of children who report consuming fruits less than one time daily and vegetables less than one time daily was quite high amounting to 78 and 46%, respectively.
The overall daily fruit intake averaged 117.5 ± 4.6 g and daily vegetable intake averaged 55 g (Table 2). Table 3 presents the vitamin C content of selected fruits, vegetables and juices determined by the fluorome-
tric assay. Citrus fruits and guava are the richest fruit sources in vitamin C. Paprica is the richest vegetable source in vitamin C. Chipsy is also good source of vitamin C, yet its sodium content is quite high.
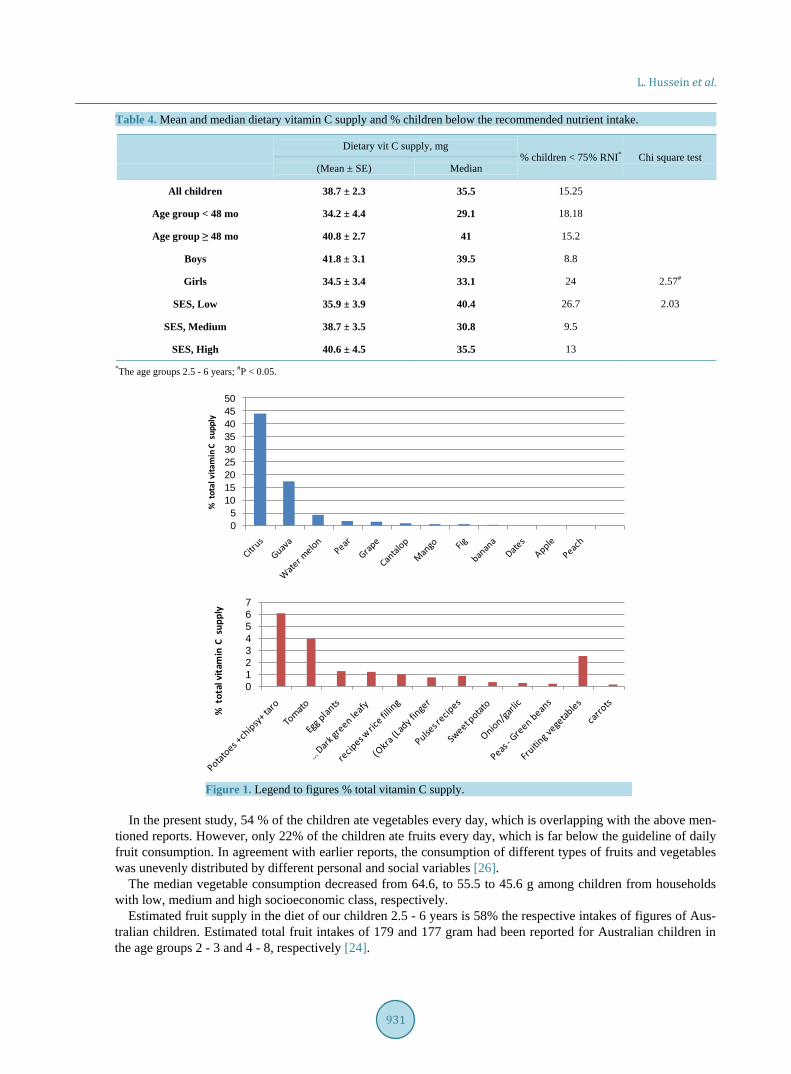
The dietary supply of vitamin C averaged 38.7 ± 2.3 mg per day among the total participants (Table 4). The % children with dietary vitamin C less than 75% of the RNI were 15.2% % among the whole study group. Fruits contributed 72% of the total dietary vitamin C; juices contributed 10 % of the dietary vitamin C; whereby vegetables contributed 18%. Citrus fruits (oranges, mandarine and lemon), guava, watermelon, pear and grapes were the five top fruit contributors to vitamin C in the diets of the children (Figure 1). Potatoes including chipsy (6%), tomatoes (4%), fruiting vegetables (2.5%) and dark green leafy vegetables (1.16%) were the top vegetable contributors of vitamin C.
5. Discussion It had been repeatedly reported that increasing the number of measurement days minimizes within-subject varia-tion [21]. The general results on contributions of numbers of days on the accuracy of mean intake estimates showed that the benefits fall off after six days [22]. Accordingly, our study was designed using six repeated 24 h dietary recall on non consecutive days to assure that the released data represents usual food intakes.
The daily consumption of at least one portion of fruit and one portion of vegetables has been considered a minimum in children [1]. A survey carried out on nine European countries reported that 43.2% of the 11-year- old children ate fruit every day; whereas, 46% ate vegetables every day [23]. Percent Australian children 2 - 16 years consuming fruits and vegetables every day amounted to 69.3% and 69.1%, respectively [24]. In Brazil, 66.2% and 48.6% of the adolescents consumed fruits and vegetables every day [25].

L. Hussein et al.
927
Table 1. Distribution of the children according to frequency of fruits and vegetables intake per 6 days.
Category Frequency fruit intakes per 6 days
Number Age, mo Day 1 Day 2 Day 3 Day 4 Day 5 Day 6
Fruits
All children 59 54.2 ± 1.5 10.2 23.7 23.7 20.3 22.0
Age group < 4 years 13 37.7 ± 1.3 23.1 38.5 23.1 15.4 0.0
Age group ≥ 4 years 46 58.8 ± 1.2 6.5 19.6 23.9 21.7 28.3
Boys 34 54 ± 1.9 2.9 26.5 20.6 26.5 23.5
Girls 25 54.4 ± 2.5 20 20 28 12 20
SES (1) 15 61.8 ± 2.4 13.3 13.3 40.0 13.3 20.0
SES (2) 21 52.9 ± 2.5 14.3 19.0 14.3 38.1 14.3
SES (3) 23 51.2 ± 2.5 4.3 34.8 21.7 8.7 30.4
Vegetables
All children 59 54.2 ± 1.5 1.7 1.7 0.0 11.9 30.5 54.2
Age group < 4 years 13 37.7 ± 1.3 7.7 0.0 23.1 38.5 30.8
Age group ≥ 4 years 46 58.8 ± 1.2 2.2 0.0 0.0 8.7 28.3 60.9
Boys 34 54 ± 1.9 0.0 0.0 0.0 8.8 35.3 55.9
Girls 25 54.4 ± 2.5 4.0 4.0 0.0 16.0 24.0 52.0
SES (1) 15 61.8 ± 2.4 6.7 0.0 0.0 26.7 13.3 53.3
SES (2) 21 52.9 ± 2.5 4.8 38.1 52.4
SES (3) 23 51.2 ± 2.5 0.0 4.3 0.0 8.7 34.8 52.2
Table 2. Distribution of the children according to daily fruit and vegetables intake in grams.
Category Estimated Median
Average (X ± SE) (g/d)
Fruit
All children 117.5 ± 4.6 113
Age group < 48 mo 109.1 ± 11.2 93
Age group ≥ 48 mo 119.9 ± 5.0 120
Boys 130.7 ± 6.6 135.5
Girls 107.8 ± 5.8 98
SES, Low 130.6 ± 9.5 131
SES, Medium 111.6 ± 6.1 96.5
SES, High 114.4 ± 8.2 117.2
Vegetables
All children 56.4 ± 2.3 55.9
Age group < 48 mo 55.4 ± 6.2 50.7
Age group ≥ 48 mo 56.6 ± 2.4 55.9
Boys 57 ± 3.2 54.9
Girls 55.5 ± 3.4 56.8
SES, Low 62.6 ± 4.3 66.8
SES, Medium 57.0 ± 4.0 54.3
SES, High 51.6 ± 2.6 50.7

L. Hussein et al.
928
Table 3. Mean vitamin C and moisture contents in fruits and vegetables commonly consumed in Egypt.
Item Eaten Edible Processing Moisture Energy Vitamin C
proportion % as eaten Kcal/100g mg/100g
Cabbage Leaves 0.71 Boiled 92.8459 5.76
Carrots Root 0.86 Raw 92.1 28.1 4.87
Carrots Root 0.82 Boiled 92.5 28.3 2.99
Carrots Root 1 Pickles 90.4 29.3 1.8
Cauliflower Flower 0.75 Boiled 94.3 20.5 9.32
Cauliflower Flower 0.75 Recipe 86.7 55.0 7.9
Cauliflower Flower 0.78 Fried 68.7 181.2 12.64
Cauliflower Leaves Fried, w eggs 59.7 199.2 6.75
Celery Leaves 0.64 Raw 93.2 7.0 5.13
Coriander Leaves 0.46 Raw 91.5 116.6
Cucumber Fruit 0.87 Raw 96.1 12.9 22
Dill Leaves 0.7 Raw 48.98
Eggplant purple color Fruit 0.84 Boiled 93.9 23.8 3.12
Eggplant white colour Fruit 0.88 Boiled 93.6 23.8 1.1
Eggplant white colour Fruit 0.88 Pickles 76.7 89.5 1.48
Eggplants Fruit 0.88 Fried 76.2 159.2 16.2
Eggplants Fruit 0.88 Fried, pickled 79.2 76.1 2.235
Eggplants Fruit 0.8 Recipe 69.5 179.7 28.37
Garden rocket Leaves 0.55 Raw 92.7 21.2 98.12
Garlic Fruit 0.22 Raw 69.4 3.97
Grape leaves Leaves 0.82 Raw 74.7 108.4 76.2
Grape leaves Leaves 0.83 Recipe w rice 87.1 55.4 13.58
Green beans Pods 0.73 Recipe 89.1 144.6 5.7
Jews mallow Leaves 1 Raw, Sun dehydration, ground 9.5 342.9 14.5
Jews mallow Leaves 0.25 Recipe 92.1 29.8 1.68
Leeks Leaves 0.87 Raw 93.2 18.26
Lemon Fruit 0.56 Pickles 83.1 69.5 5.76
Salad Green 0.8 Raw 93.4 8.97
Green mallow Leaves 0.8 Boiled 90.4 38.7 6.92
Green mallow Leaves 0.8 Recipe 81.8 80.7 1.49
Okra Fruit 0.88 Raw, Sun dehydration, ground 51.0 176.0 24.03
Okra Fruit 0.8 Recipe 87.1 52.8 9.94
Okra Fruit 0.8 Recipe w tomato 83.9 79.9 8.9
Onion White Bulb-leaves Raw 90.2 34.7 4.2
Onion White Bulb-leaves Boiled 85.7 51.9 7.74
Onion Red Bulb-leaves Raw 87.8 43.7 3.65
Parsley Leaves 0.62 Raw 85.7 48.6 114.2

L. Hussein et al.
929
Continued
Parsley Leaves 0.62 Boiled 92.4 26.8 53.2
Peas Seeds 0.48 Boiled 76.2 90.8 4.77
Peas Seeds 0.5 Recipe w carrots-tomato 80.2 91.9 3.1
Peas Seds 0.5 Recipe w tomato 81.0 72.3 4.2
Pepper bell green Fruit 0.82 Raw 92.6 26.5 68
Pepper hot green Fruit 0.97 Raw 91.7 30.4 75.9
Pepper hot green Fruit 0.95 Boiled 92.1 30.1 47
Pepper bell green Fruit 0.8 Boiled 88.6 60.3 152.9
Pepper bell green Fruit 0.82 Recipe, w rice fillings 75.3 44.4
Pepper hot Fruit Pickles 84.5 70.7 18.13
Potato Tuber 1 Boiled ;peeled 81.5 67.1 18.9
Potato Tuber 0.81 Boiled w peel 79.2 76.9 9.95
Potato Tuber 0.81 Stewed; oil added 73.8 126.2 13.8
Potato Portion 0.81 Pommes frittes 24.4 28.8 7.8
Potato Serving dish 0.83 Cooked w tomato 78.2 76.9 7.3
Raddish Root-Leaves 0.59 Raw 91.9 35.7 64.1
Spinach Leaves 0.45 Boiled 87.4 40.9 8.2
Spinach Serving dish 0.5 Cooked w tomato 87.0 60.8 7.3
Squash Fruit 0.83 Boiled 89.1 34.2 5.6
Squash Serving dish Cooked w tomato 87.2 40.4 5.3
Sweet potato Tuber 0.9 Boiled 71.8 270.6 10.54
Sweet potato Tuber 0.9 Baked 71.7 269.1 34.05
Taro Tuber 0.84 Boiled 80.9 64.6 4.1
Taro Serving dish Recipe w tomato 80.7 82.5 4.1
Taro Serving dish 0.8 Recipe w celery 82.0 63.6 5.2
Tomatoes Fruit Raw 83.9 84.1 18.6
Tomatoes Fruit 0.98 Boiled 93.8 23.3 10.7
Tomatoes Fruit Tomato salad 77.4 72.7 6.47
Carrots Mixed 1 Pickles 87.6 21.5 0.8
White beans Seeds 1 Boiled 60.5 152.7 2.875
White beans 1 Recipe w tomato 72.0 113.5 3.3
Fruits
Apple Fruit 0.9 Raw local 87.0 48.0 3.2
Apple American golden Fruit 0.94 Raw imported 85.1 55.2 5.58
Apple American red Fruit 0.93 Raw imported 86.1 51.2 3.9
Apple Syrian golden Fruit 0.92 Raw imported 82.7 64.2 3.2
Pommegranate Fruit 0.5 Raw local 80.4 72.8 11.54
Apricots Fruit 0.93 Raw local 85.9 50.2 7.8
Banana Fruit 0.7 Raw local 84.7 55.0 5.65

L. Hussein et al.
930
Continued
Banana Fruit 0.75 Raw, imported 81.7 66.7 6.78
Cantalope Fruit 0.61 Raw 91.9 28.2 29.9
Dates dehydrated Fruit 0.85 Raw, dehydrated 45.4 199.0 7.18
Dates Zaghloul red Fruit 0.85 Raw, fresh 62.6 136.5 8.62
Dates Samaniyellow Fruit Raw, fresh 60.7 147.3 5.79
Figs Fruit 0.9 Raw, fresh 82.2 66.1 10.9
Grapes purple Fruit 0.98 Raw, local 84.7 55.2 4.2
Grapes seedless Fruit 0.95 Raw, local 82.8 62.0 4.06
Grape fruits Fruit 0.88 Raw, local 90.1 35.4 45.4
Guave Fruit 0.97 Raw, local 86.8 50.1 102.3
Mandarine Fruit 0.75 Raw, local 86.9 48.3 39.9
Mango Fruit 0.51 Raw, local 83.9 60.0 32.9
Melon Fruit 0.8 Raw, local 93.4 22.8 20.2
Mulberry Fruit 0.98 Raw, local 83.2 64.6 17.49
Mulberry purple Fruit 0.97 Raw, local 84.9 56.8 21.49
Oranges baladi Fruit 0.77 Raw, local 86.4 50.7 53.16
Oranges besorra Fruit 0.75 Raw, local 86.0 52.9 49.95
Oranges sokkari Fruit 0.74 Raw, local 87.4 47.8 48.2
Oranges summer Fruit 0.81 Raw, local 86.8 49.9 44.2
Peaches Fruit 0.8 Raw, local 85.6 53.6 9.38
Pears Fruit 0.96 Raw, local 84.8 57.1 17.81
Plums golden Fruit 0.88 Raw, local 84.2 58.3 5.05
Prickly pear Fruit 0.85 Raw, local 85.0 54.1 13.12
Water melon Fruit 0.56 Raw, local 90.7 33.7 7.9
Juices
Carrots Juice 1 Proc, local 93.0 29.8 3.39
Cocktail Juice 1 Proc, local 81.4 73.5 15.47
Guava Juice 1 Proc, local 84.9 33.0 32.6
Mango Juice 1 Proc, local 81.3 72.6 5
Milk-banana Beverage 1 Fresh 76.3 90.5 2
Milk-mango Beverage 1 Fresh 80.6 81.2 0.14
Milk-strawberries Beverage 1 Fresh 80.8 81.4 6.51
Orange Juice 1 Proc, local 91.3 32.5 35.37
Orange carrots Juice 1 Proc, local 90.0 37.0 29.7
Orange peaches Juice 1 Proc, local 85.9 53.2 22.2
Pine apple Beverage 1 Proc, local 86.6 50.6 11.31
Straw berry Beverage 1 Proc, local 80.4 60.7 28.5
L. Hussein et al.
931
Table 4. Mean and median dietary vitamin C supply and % children below the recommended nutrient intake.
Dietary vit C supply, mg
% children < 75% RNI* Chi square test (Mean ± SE) Median
All children 38.7 ± 2.3 35.5 15.25
Age group < 48 mo 34.2 ± 4.4 29.1 18.18
Age group ≥ 48 mo 40.8 ± 2.7 41 15.2
Boys 41.8 ± 3.1 39.5 8.8
Girls 34.5 ± 3.4 33.1 24 2.57#
SES, Low 35.9 ± 3.9 40.4 26.7 2.03
SES, Medium 38.7 ± 3.5 30.8 9.5
SES, High 40.6 ± 4.5 35.5 13
*The age groups 2.5 - 6 years; #P < 0.05.
Figure 1. Legend to figures % total vitamin C supply.
In the present study, 54 % of the children ate vegetables every day, which is overlapping with the above men-
tioned reports. However, only 22% of the children ate fruits every day, which is far below the guideline of daily fruit consumption. In agreement with earlier reports, the consumption of different types of fruits and vegetables was unevenly distributed by different personal and social variables [26].
The median vegetable consumption decreased from 64.6, to 55.5 to 45.6 g among children from households with low, medium and high socioeconomic class, respectively.
Estimated fruit supply in the diet of our children 2.5 - 6 years is 58% the respective intakes of figures of Aus-tralian children. Estimated total fruit intakes of 179 and 177 gram had been reported for Australian children in the age groups 2 - 3 and 4 - 8, respectively [24].
05
101520253035404550
% t
otal
vita
min
C s
uppl
y
01234567
% t
otal
vita
min
C s
uppl
y

L. Hussein et al.
932
The dietary fruit and vegetable supplies in the diet of our children is still better than those reported for Indian children. Mean daily intakes of 26, 35, 12.5 and 14.6 grams fruits were reported for boys and girls (2 - 4 years) and (4 - 6 years) respectively. Respective mean daily intakes of vegetables were 64.0, 59.91, 71.28, 71.92, 12.46, 14.56 71.3, 59.1 and 55.7 and 71.92 [27]. The authors considered these amounts significantly low and wouldn’t satisfy the RNI.
In the United Kingdom, a survey reported mean daily fruit intake of 148 g/d for children 8 years of age in families never eating meal together at a table, which increased to 229 in families always eating together. The respective vegetable supply was 66 and 113 g/d [28].
The vitamin [C] composition data of new forms of vegetables and fruits appearing in the market and the im-portant commercially prepared foods are generally unavailable. The formulations of such food commodities are nonexistent and are frequently different from home-prepared products so that their vitamin [C] composition should be determined by analysis [6]. Food analysis is costly and laborious, analytical data are frequently bor-rowed from tables of developed countries and incorporated in tables of developing countries.
For the generation of accurate analytical food composition table vitamin C was analyzed based on nationally based sampling and actual chemical analyses for foods. We took advantage of this table to gain an insight into the adequacy of this practice by estimating the vitamin C content in the diets of Egyptian preschool children
Dietary supply of vitamin C among children from European and American populations is much superior compared to those estimated in the present study and in reports for African and Asian children.
Dietary intake surveys estimate US per capita vitamin C intakes at approximately 83 mg/day for children age 1 to 5 years [29]. Approximately 90% of the vitamin C comes from fruits and vegetables, with citrus fruits being main contributors [6]. Furthermore, high mean intakes of vitamin C equivalent to 202 and 166% of the Recom-mended Dietary Allowances were reported for children from food sufficient and insufficient households, respec-tively [30]. Dietary vitamin C supply averaged 90.5 and 53.5 mg for American and Russian children, respec-tively [31]. Respective mean, median estimated vitamin C intakes of 30.6 and 24 mg/day and 80% prevalence of adequacy were reported among children from Bangladesh 2 - 4 years [32]. The authors attributed the low intakes primarily due to low diversity of foods. In South Africa, estimated vitamin C intakes of 29 and 52 mg/day were reported for children 2 - 5 years of age, when the 24 d recall was conducted during the months of February and November, respectively [33].
In rural Zambia, the roots and tubers contributed to the intake of vitamin C by 16% in the diet of Zambian children two years of age; while respective contribution of fruits and vegetables amounted to 28% [34]. In the present study, tubers and potatoes were also the top vegetable contributors to vitamin dietary vitamin C supply. Chipsy and fried potatoes were consumed by 81% of the children with weighted daily intake of 8.4 g contribut-ing 3.2% of the daily vitamin C supply.
Unfortunately, the consumption of chipsy was associated with 50 mg increase in the daily intake of sodium. Respective amounts of chipsy and fried potatoes consumed by Australian children 2 - 3 and 4 - 8 years were 32 and 47 grams, respectively [24]. In the US, chips, crackers, popcorn and pretzels consumed by children 2 - 18 years contributed higher daily sodium intake of 192.6 mg [29]. Childhood is a sensitive period with respect to effects of sodium on future blood pressure [35]. The majority of children exceeded recommendation levels of sodium intake at 2 - 6 years and interventions to reduce sodium in childhood should be considered.
Vitamin C is the important single nutritional factor viewed as essential for healthy life across the lifespan. Its deficiency probably increases morbidity and mortality in children, emphasizing the public health importance of this disorder. Some sources now suggest that recommended dietary allowance (RDA) of vitamin C should be as much as double the currently advised per day depending on age and gender [36].
Results obtained from the present survey serves as baseline measurement to track consumption of fruits and vegetables over time to monitor progress towards increased F&V consumption, a key recommendation of the Dietary Guidelines for World Health organization.
Promoting healthier eating patterns among children is crucial for optimal growth and development. Because children’s eating patterns are influenced by such a range of characteristics of the social and physical environ-ment, it is important to develop interventions that target the different levels at which these influences occur.
Busy families rely on convenient foods which often come from fast food establishments, other restaurants, and the pre-packaged food sections of the grocery store [37]. Hurried families no longer have time to sit down to eat meals together, even though eating together has been associated with greater intake of foods from the basic food groups contributing to less than optimal eating patterns [28]. There is still more work to be done to promote

L. Hussein et al.
933
healthier eating patterns using a multi-faceted approach targeting children, parents, families and schools. At-tempting to increase F&V consumption should include strategies to improve access and establish policies that make it easier to target child care centers, as children are spending more of their time in these settings. These in-terventions could focus on making fruit and vegetables as healthful food choices. The state can support in-creased fruit and vegetable consumption by ensuring that their child care regulations closely align with national standards for serving fruits and vegetables.
Acknowledgements The study was supported by the Food and Agriculture Organization (TCP/EGY/6714). Thanks are extended to all children and mothers participated in the survey.
References [1] Yngve, A., Wolf, A., Poortvliet, E., Elmadfa, I., Brug, J., Ehrenblad, B., et al. (2005) Fruit and Vegetable Intake in a
Sample of 11-Year-Old Children in 9 European Countries: The Pro Children Cross-Sectional Survey. Annals of Nutri-tion & Metabolism, 49, 236-245. http://dx.doi.org/10.1159/000087247
[2] WHO (2008-2013) Action Plan for the Global Strategy for the Prevention and Control of Noncommunicable Diseases. World Health Organization, Geneva.
[3] Agudo, A., Slimani, N., Ocke, M.C., et al. (2002) Consumption of Vegetables, Fruit and Other Plant Foods in the Eu-ropean Prospective Investigation into Cancer and Nutrition (EPIC) Cohorts from 10 European Countries. Public Health Nutrition, 5, 1179-1196. http://dx.doi.org/10.1079/PHN2002398
[4] Domitrović, R. (2006) Vitamin C in Disease Prevention and Therapy. Biochemia Medica, 16, 107-125. [5] Lee, S.K. and Kader, A.A. (2000) Preharvest and Postharvest Factors Influencing Vitamin C Content of Horticultural
Crops. Postharvest Biology and Technology, 20, 207-220. http://dx.doi.org/10.1016/S0925-5214(00)00133-2 [6] Sinha, R., Block, G. and Taylor, P.R. (1993) Problems with Estimating Vitamin C Intakes. The American Journal of
Clinical Nutrition, 57, 547-550. [7] Hunt, J.R., Gallagher, S.K. and Johnson, L.A.K. (l994) Effect of Ascorbic Acid on Apparent Iron Absorption by
Women with Low Iron Stores. The American Journal of Clinical Nutrition, 59, 138l-1385. [8] England, S. and Seifter, S. (1986) The Biochemical Functions of Ascorbic Acid. Annual Review of Nutrition, 6, 365-
406. http://dx.doi.org/10.1146/annurev.nu.06.070186.002053 [9] Buettner, G.R. (1993) The Pecking Order of Free Radicals and Antioxidants: Lipid Peroxidation, Alpha-Tocopherol,
and Ascorbate. Archives of Biochemistry and Biophysics, 300, 535-543. http://dx.doi.org/10.1006/abbi.1993.1074 [10] Harrison, F.E. and May, J.M. (2009) Vitamin C Function in the Brain: Vital Role of the Ascorbate Transporter SVCT2.
Free Radical Biology and Medicine, 46, 719-730. http://dx.doi.org/10.1016/j.freeradbiomed.2008.12.018 [11] Birch, L., Savage, J.S. and Ventura, A. (2007) Influences on the Development of Children’s Eating Behaviours: From
Infancy to Adolescence. Canadian Journal of Dietetic Practice and Research, 68, s1-s56. [12] Duffey, K.J., Gordon-Larsen, P., Shikany, J.M., Jacobs, D.R. and Popkin, B.M. (2010) Food Price and Diet and Health
Outcomes: 20 Years of the CARDIA Study. Archives of Internal Medicine, 170, 420-426. http://dx.doi.org/10.1001/archinternmed.2009.545
[13] Bowman, S.A. and Vinyard, B.T. (2004) Fast Food Consumption of U.S. Adults: Impact on Energy and Nutrient In-takes and Overweight Status. Journal of the American College of Nutrition, 23, 163-168. http://dx.doi.org/10.1080/07315724.2004.10719357
[14] Schroder, H., Covas, M., Elosua, R., Mora, J. and Marrugat, J. (2008) Diet Quality and Life Style Associated with Free Selected Low-Energy Density Diets in a Representative Spanish Population. European Journal of Clinical Nutrition, 62, 1194-1200. http://dx.doi.org/10.1038/sj.ejcn.1602843
[15] ElShaks (1995) Indicators for Assessing the Socioexonomic Status of Households. Anglo Egyptian Press. [16] Gibson, R. and Fergujson, E. (1999) An Interacting 24 Hour Recall for Assessing the Adequacy of Iron and Zinc In-
takes in Developing Countries.1st Edition, Life Sci Inst, Washington DC. [17] Pennington, J. (1992) Total Diet Studies. The Identification of Core Foods in the United States Food Supply. Food Ad-
ditives and Contaminants, 9, 253-264. http://dx.doi.org/10.1080/02652039209374069 [18] WHO (2012) GEMS/Food Programme: Report of the WHO Working Group on Collection of Food Consumption Data
(COFOCO), 30 January 2012. [19] Horwitz, W., Ed. (1990) Official Methods of Analysis of the Association of Official Analytical Chemists. 15th Edition,
967.22, 1059-1060, AOAC, USA.
L. Hussein et al.
934
[20] WHO/FAO (2001) Human Vitamin and Mineral Requirement. [21] Gibson, R.S. (2005) Principles of Nutritional Assessment. 2nd Edition, Oxford University Press, Dunedin, Chap. 6,
129-149. [22] Morgan, K.J., Johnson, S.R. and Goumaetas, B. (1987) Analysis of a 12 Day Data Using Persistence Measures. Amer-
ican Journal of Epidemiology, 126, 326-335. http://dx.doi.org/10.1093/aje/126.2.326 [23] De Bourdeaudhuij, I., te Velde, S., Brug, J., Due, P., et al. (2008) Personal, Social and Environmental Predictors of
Daily Fruit and Vegetable Intake in 11-Year-Old Children in Nine European Countries. European Journal of Clinical Nutrition, 62, 834-841. http://dx.doi.org/10.1038/sj.ejcn.1602794
[24] Rangan, A.M., Kwan, J.S.L., Louie, J.C.Y., Flood, V.M. and Gill, T.P. (2011) Changes in Core Food Intake among Australian Children between 1995 and 2007. European Journal of Clinical Nutrition, 65, 1201-1210. http://dx.doi.org/10.1038/ejcn.2011.109
[25] Leite, F.M., Ferreira, H.S., Bezerra, M.K., de Assunção, M.L. and Horta, B.L. (2013) Food Intake and Nutritional Sta-tus of Preschool from Maroon Communities of the State Alagoas, Brazil. Revista Paulista de Pediatria, 31, 444-451. http://dx.doi.org/10.1590/S0103-05822013000400005
[26] Darmon, N. and Drewnowski, A. (2008) Does Social Class Predict Diet Quality? The American Journal of Clinical Nutrition, 87, 1107-1117.
[27] Kaur, P., Dahiya, S. and Rana, M.K. (2007) Food and Nutrient Intake of Pre-School Children (2-6 Year) of Sonepat District. Journal of Dairying, Foods Home Sciences, 26, 141-146.
[28] Christian, M.S., Evans, C.E.L., Hancock, N., Nykjaer, C. and Cade, J.E. (2012) Family Meals Can Help Children Reach Their 5 A Day: A Cross-Sectional Survey of Children’s Dietary Intake from London Primary Schools. Journal of Epidemiology Community Health, 67, 332-338. http://dx.doi.org/10.1136/jech-2012-201604
[29] Keast, D.R., Fulgoni, V.L., Nicklas, T.A. and O’Neil, C.E. (2013) Food Sources of Energy and Nutrients among Children in the United States: National Health and Nutrition Examination Survey 2003-2006. Nutrients, 5, 283-301. http://dx.doi.org/10.3390/nu5010283
[30] Rose, D. and Oliveira, V. (1997) Nutrient Intakes of Individuals from Food-Insufficient Households in the United States. American Journal of Public Health, 87, 1956-1961. http://dx.doi.org/10.2105/AJPH.87.12.1956
[31] Jahns, L., Carriquiry, A., Arab, L., Mroz, T.A. and Popkin, B.M. (2004) Within- and Between-Person Variation in Nu-trient Intakes of Russian and U.S. Children Differs by Sex and Age. Journal of Nutrition, 134, 3114-3120.
[32] Arsenault, J.E., Yakes, E.A., Islam, M.M., Hossain, M.B., et al. (2012) Very Low Adequacy of Micronutrient Intakes by Young Children and Women in Rural Bangladesh is Primarily Explained by Low Food Intake and Limited Diversi-ty. Journal of Nutrition, 143, 197-203. http://dx.doi.org/10.3945/jn.112.169524
[33] Faber, M. and Laubscher, R. (2008) Seasonal Availability and Dietary Intake of β-Carotene-Rich Vegetables and Fruit of 2-Year-Old to 5-Year-Old Children in a Rural South African Setting Growing These Crops at Household Level. In-ternational Journal of Food Sciences and Nutrition, 59, 46-60. http://dx.doi.org/10.1080/09637480701664852
[34] Hautvast, J.L.A., van der Heijden, L.J.M., Luneta, A.K., et al. (1999) Food Consumption of Young Stunted and Non- Stunted Children in Rural Zambia. European Journal of Clinical Nutrition, 53, 50-59. http://dx.doi.org/10.1038/sj.ejcn.1600676
[35] Brion, M.J., Ness, A.R., Smith, G.D., Emmett, P., et al. (2008) Sodium Intake in Infancy and Blood Pressure at 7 Years. Findings from the Avan Longitudinal Study of Parents and Children. European Journal of Clinical Nutrition, 62, 1162-1169. http://dx.doi.org/10.1038/sj.ejcn.1602837
[36] Levine, M., Wang, Y., Padayatty, S.J. and Morrow, J. (2001) A New Recommended Dietary Allowance of Vitamin C for Healthy Young Women. Proceedings of the National Academy of Sciences of the United States of America, 98, 9842-9846. http://dx.doi.org/10.1073/pnas.171318198
[37] Patrick, H. and Nicklas, T.A. (2005) A Review of Family and Social Determinants of Children’s Eating Patterns and Diet Quality. Journal of the American College of Nutrition, 24, 83-92. http://dx.doi.org/10.1080/07315724.2005.10719448


![[ 924 ] - users.auth.grusers.auth.gr/adagkas/images/7. 924-939_fotos02.pdf · [ 924 ] 98. Ôï êôßñéï ôçò äéáöþôéóçò, óôç MogoÕoaia, 1968 (ðçãÞ: åðéèõìåßôáé](https://img.dokumen.tips/doc/110x75/5a7441987f8b9a93088b9d27/-924-usersauth-924-939fotos02pdfaa-924-98-aa-aaaaaaa.jpg)