Embed Size (px)
Citation preview

University of Calgary
PRISM: University of Calgary's Digital Repository
Graduate Studies The Vault: Electronic Theses and Dissertations
2018-11-13
Assessment of Stage 1 in a Novel Bio-Oil Upgrading
Process: Catalytic Hydrotreating
Scheele Ferreira, Erika Maria
Scheele Ferreira, E. M. (2018). Assessment of Stage 1 in a Novel Bio-Oil Upgrading Process:
Catalytic Hydrotreating (Unpublished master's thesis). University of Calgary, Calgary, AB.
doi:10.11575/PRISM/34509
http://hdl.handle.net/1880/109182
master thesis
University of Calgary graduate students retain copyright ownership and moral rights for their
thesis. You may use this material in any way that is permitted by the Copyright Act or through
licensing that has been assigned to the document. For uses that are not allowable under
copyright legislation or licensing, you are required to seek permission.
Downloaded from PRISM: https://prism.ucalgary.ca

UNIVERSITY OF CALGARY
Assessment of Stage 1 in a Novel Bio-Oil Upgrading Process: Catalytic Hydrotreating
by
Erika Maria Scheele Ferreira
A THESIS
SUBMITTED TO THE FACULTY OF GRADUATE STUDIES
IN PARTIAL FULFILLMENT OF THE REQUIREMENTS FOR THE
DEGREE OF MASTER OF SCIENCE
GRADUATE PROGRAM IN CHEMICAL ENGINEERING
CALGARY, ALBERTA
NOVEMBER, 2018
© Erika Maria Scheele Ferreira 2018

ii
Abstract
The increasing awareness of global warming and depletion of conventional fossil fuel reserves
has motivated the study of alternative fuel sources to fulfill the increasing worldwide demand of
fuels. One promising alternative is the production of fuels using lignocellulose-derived bio-oils
that would not compete with the human food chain. However, this type of bio-oil remains a
challenge due to its high acidic oxygen content that results in corrosiveness and low energy density
compared with crude oils. Therefore, the present MSc. research focuses on the study of the first
stage of a novel catalytic upgrading approach that involves two different hydrogen-addition
processes. First, a mild hydrotreating process is carried out to reduce the oxygen content in the
bio-oil. Then, catalytic steam cracking (CSC), where hydrogen is produced by splitting water
molecules, is used to obtain lighter products from the hydro-treated oil. The main focus of this
research is to optimize the hydrotreating process.
The effect of the process variables such as operating pressure, temperature and space velocity,
on the product quality was evaluated, finding that the best quality hydrotreated product was
obtained at 345 °C, 0.2 h-1, 1400 psig, and increasing the temperature beyond 345 °C at these
conditions resulted in the appearance of fine solids dispersed in the synthetic product. Additionally,
a comparison of different catalyst formulations was done, finding that acidity is needed in the
catalyst to carry out hydrodeoxygenation reactions. It was also found that the two main compounds
contributing to the acidity of the bio-oil are carboxylic acids and phenols, the latest with a minor
contribution. By hydrotreating, it was possible to achieve a Total Acid Number (TAN) reduction
of 100 % and a maximum of 28 % reduction of the phenols content. A high quality hydrotreated
bio-oil with much reduced oxygen content, low viscosity and higher energy density was produced
in this work.
Keywords: Bio-oil, Total Acid Number, Hydrotreating, Catalytic Upgrading,
Hydrodeoxygenation

iii
Acknowledgments
First of all, I would like to give my most sincere appreciation to Dr. Pedro Pereira Almao for
the opportunity of being part of the Catalysis and Adsorption for Fuels and Energy (CAFE) group
at the University of Calgary. His guidance and advice during my years in Canada, especially, in
the development of this research work are greatly appreciated. I am very lucky to had him as my
supervisor during all these years.
I would like to thank Dr. Monica Bartolini, Mr. Lante Carbognani, Dr. Gerardo Vitale, Dr.
Carlos Scott, Dr. Josefina Scott and Dr. Azfar Hassan for all their insightful technical discussions
and helpful suggestions that guided this research work. Additionally, thanks to all the members of
CAFE group for their support, friendship and all those moments of joy that made this journey more
pleasant, especial thanks to Josune, Marianna, Eduardo, Victor, Christian and Jose Luis.
I would like to acknowledge the Department of Chemical and Petroleum Engineering at the
Schulich School of Engineering for offering me an outstanding formation. The financial support
provided by the Department and Steeper Energy Canada is also greatly appreciated.
I would also like to infinitely thank my parents for all the unconditional support they have
given me during my professional formation and life projects. Thanks for always believing in me,
for encouraging me, being the best examples and provide all the opportunities for me to grow as a
professional and as a person. In addition, I would like to thank my number one fans: my
grandparents Landys, Bertha and Maria. Thanks for the guidance and the advices and for always
cheering me up when I needed encouragement.
Finally, my infinite appreciation and love to my husband Fredy Cabrales. Thanks for being
the best company I could ever had during these past years. Thanks for your patience and
understanding during the hard times and for giving me the motivation and the extra push when I
needed it.

iv
Dedication
To my parents Sergio and Katiuska, my brother Stefan and my grandparents Pito, Tortu and
Nonnita, for all their support and motivation during this journey
To my thoughful and supporting hubby with all my love

v
Table of Contents
Abstract ........................................................................................................................................... ii
Acknowledgments.......................................................................................................................... iii
Dedication ...................................................................................................................................... iv
Table of Contents ............................................................................................................................ v
List of Tables ............................................................................................................................... viii
List of Figures and Illustrations ..................................................................................................... ix
List of Symbols, Abbreviations and Nomenclatures .................................................................... xii
Chapter 1: Introduction ....................................................................................................... 1
1.1. Background and motivation ........................................................................................ 1
1.2. Novel Bio-oil Upgrading Approach............................................................................ 3
1.3. Scope of the Research ................................................................................................. 5
Chapter 2: Literature Review .............................................................................................. 6
2.1. Lignocellulosic biomass.............................................................................................. 6
2.2. Thermochemical processing of lignocellulosic biomass .......................................... 10
2.2.1. Hydrothermal Liquefaction ....................................................................................... 11
2.2.1.1. Hydrofaction Process ........................................................................................ 12
2.3. Bio-oil from lignocellulose ....................................................................................... 13
2.3.1. Chemical composition of bio-oil derived from lignocellulose via HTL ................... 14
2.3.2. Important properties of bio-oil .................................................................................. 16
2.4. Bio-oil upgrading ...................................................................................................... 18
2.4.1. Hydrotreating ............................................................................................................ 19
Chapter 3: Experimental Methods .................................................................................... 24

vi
3.1. Bio-oil feedstock ....................................................................................................... 24
3.2. Experimental Set Up ................................................................................................. 24
3.2.1. Feed Section .............................................................................................................. 26
3.2.2. Reaction Section ....................................................................................................... 26
3.2.3. Separation and Sampling Section ............................................................................. 27
3.3. Experimental Procedure ............................................................................................ 28
3.3.1. Reactor Filling .......................................................................................................... 29
3.3.2. Catalyst Activation.................................................................................................... 29
3.3.3. Hydrotreating Operation ........................................................................................... 30
3.4. Characterization Techniques ..................................................................................... 30
3.4.1. Total Acid Number ................................................................................................... 31
3.4.2. Water Content ........................................................................................................... 31
3.4.3. Product Distribution .................................................................................................. 32
3.4.4. Viscosity ................................................................................................................... 33
3.4.5. Thermogravimetric Analysis (TGA)......................................................................... 33
3.4.6. CHN Elemental Analysis .......................................................................................... 34
3.4.7. Microcarbon residue (MCR) ..................................................................................... 34
3.4.8. Fourier-transform Infrared spectroscopy (FTIR) ...................................................... 35
3.4.9. Pre-asphaltenes stability............................................................................................ 37
3.4.10. Gas Analysis ......................................................................................................... 37
Chapter 4: Results and Discussion .................................................................................... 39
4.1. Effect of the total operating pressure ........................................................................ 40
4.2. Temperature and space velocity screening ............................................................... 42
4.2.1. Temperature effect .................................................................................................... 43

vii
4.2.2. Space velocity effect ................................................................................................. 51
4.2.3. Correlation between TAN and Infrared absorptivity at 1710-1750 cm-1 .................. 53
4.2.4. Catalyst Lifetime ....................................................................................................... 56
4.3. Increased severity evaluation .................................................................................... 57
4.3.1. Product distribution of the HDT-bio-oils .................................................................. 62
4.4. Evaluation of a dual-catalyst bed reactor (Reaction #4) ........................................... 67
4.5. Catalyst performance comparison............................................................................. 69
Chapter 5: Conclusions and Future Work ......................................................................... 78
References ......................................................................................................................... 81
Appendix I: Modifications of RTU-1 ........................................................................................... 86
Appendix II: Operational Data and Experimental Results ........................................................... 88
Appendix III. Hydrogen consumption calculation........................................................................ 96

viii
List of Tables
Table 2.1. Typical biomass and waste compositions (wt. % dry mass) adapted from ENC25 ........ 7
Table 2.2. Thermochemical conversion technologies and products, adapted from Bridgewater32
....................................................................................................................................................... 10
Table 2.3. Typical properties of wood derived bio-oil and crude oil ........................................... 14
Table 2.4. Typical operating conditions for hydrotreating bio-oils12, 36, 53 ................................... 20
Table 3.1. Properties of the bio-oil provided by Steeper Energy.................................................. 24
Table 3.2. Relative error for gas chromatography ........................................................................ 38
Table 4.1. Characterization of HDT-bio-oil at 310 °C, 0.2 h-1 and different operating pressures 41
Table 4.2. Characterization of HDT-bio-oil at 1400 psig and 315 °C using CAT-M3. Cx describes
tested condition evaluated during R2 (See Figure 4.2) ................................................................. 52
Table 4.3. Characterization of HDT-bio-oil at 1400 psig and 320 °C using CAT-M3................. 53
Table 4.4. Relative error between the measured and calculated TAN for different samples of HDT-
bio-oil ............................................................................................................................................ 55
Table 4.5. Characterization of HDT-bio-oil at 325 °C, 1400 psig, 0.2 h-1 using CAT-M3 in different
reactions (R2 and R3) ................................................................................................................... 58
Table 4.6. Temperature range for the product cuts determined via SimDist or TGA .................. 64
Table 4.7. Characterization of HDT-bio-oil at different temperatures using CAT-M3+ ............. 69
Table 4.8. Characterization of HDT-bio-oil at different temperatures during different reactions 77

ix
List of Figures and Illustrations
Figure 1.1. Proposed novel bio-oil upgrading scheme combining HDT and CSC. ........................ 4
Figure 2.1. Structure of lignocellulosic biomass10 .......................................................................... 7
Figure 2.2. Chemical structure of cellulose14.................................................................................. 8
Figure 2.3. Main components of hemicellulose14 ........................................................................... 8
Figure 2.4. Partial structure of a hardwood lignin molecule from European beech14 .................... 9
Figure 2.5. Phase diagram of water for different operating regimes10.......................................... 12
Figure 2.6. Reaction scheme for the bio-oil formation proposed by Pedersen & Rosendahl42 .... 15
Figure 2.7. Chemical composition of bio-oils according to Milne et al.39 .................................... 16
Figure 2.8. Main reactions occurring in HDT process of bio-oil64, 65 ........................................... 21
Figure 2.9. Reactivity scale of oxygenated groups under hydrotreating conditions15 .................. 22
Figure 3.1. RTU-1 diagram, adapted from Cabrales Navarro69 .................................................... 25
Figure 3.2. Reactor and thermocouple profile probe schematic, adapted from Cabrales Navarro69
....................................................................................................................................................... 27
Figure 3.3. FTIR spectra for bio-oil with the most important bands ............................................ 36
Figure 4.1. H/C ratio and butane/butene ratio vs operating pressure for HDT-bio-oil. H/C ratios
determined over the liquid product; C4/C4= determined over the associated gas phase ............. 41
Figure 4.2. Temperature and space velocity changes during R2. In order to verify the stable
behavior of the catalyst the return of the initial condition was performed twice with the last one
being at the end of the whole test run. .......................................................................................... 43
Figure 4.3. Effect of the temperature on the TAN and viscosity reduction (1400 psig, 0.2 h-1).
Viscosities were determined at 40°C ............................................................................................ 44
Figure 4.4. FTIR spectra for the feedstock (bio-oil) and HDT-bio-oil at two temperatures. ....... 46
Figure 4.5. Carboxylic acids reduction vs DOD for HDT-bio-oil at different temperatures. Values
in parenthesis are set up experimental temperatures..................................................................... 47
Figure 4.6. H/C ratio and O/C ratio vs DOD for HDT-bio-oil at 1400 psig, 0.2 h-1 using CAT-M3
....................................................................................................................................................... 48
Figure 4.7. Microscope images at 40 X for the bio-oil feed (left) and HDT-bio-oil at 325 °C (right)
....................................................................................................................................................... 48
Figure 4.8. Hydrogen consumption and water yield vs DOD for HDT-bio-oil in R2 .................. 49

x
Figure 4.9. Gas yield distribution for different temperatures in R2.............................................. 50
Figure 4.10. TAN Reduction vs Time on Stream for CSC processing adapted from Trujillo.21 .. 51
Figure 4.11. Graphic given by the TAN equipment for bio-oil feed (left) and HDT-bio-oil 315 °C
(right) ............................................................................................................................................ 54
Figure 4.12. FTIR spectra of the bio-oil feed and HDT-bio-oil at 315 °C ................................... 54
Figure 4.13. Correlation between transmittance obtained by FTIR for the bands 1710 and 1740
cm-1 between 17 and ln (TAN) ..................................................................................................... 55
Figure 4.14. TAN Conversion of the HDT-bio-oil vs time on stream in R2 using CAT-M3 ...... 56
Figure 4.15. Carboxylic acids and phenols reduction for different temperatures in R3 ............... 58
Figure 4.16. Carboxylic acids and phenols reduction vs DOD in R3 ........................................... 59
Figure 4.17. Microscope images at 40 X for the HDT-bio-oil at different temperatures in R3 ... 60
Figure 4.18. Hydrogen consumption and water yield vs DOD for HDT-bio-oil in R3 ................ 61
Figure 4.19. Gas yield distribution for different temperatures in R3 ............................................ 62
Figure 4.20. Weight percentage of CS2 insoluble material at different temperatures in R2 & R3 63
Figure 4.21. TGA in N2 of the CS2 insoluble material from the HDT-bio-oil at 340 °C in R3 ... 65
Figure 4.22. Product distribution and conversion at 343 °C+ at different temperatures in R2 & R3
....................................................................................................................................................... 66
Figure 4.23. Product yields vs conversion at 343 °C+ for different conditions in R2 & R3 ........ 66
Figure 4.24. Carboxylic acids and phenols reduction for different temperatures using CAT-M3+
....................................................................................................................................................... 67
Figure 4.25. Microscopic images at 40 X for the HDT-bio-oil at different temperatures in R4 .. 68
Figure 4.26. Carboxylic acids and phenols reduction at different T and catalysts ....................... 70
Figure 4.27. Natural logarithm of viscosity vs conversion at 343 °C+ for R2, R3, R4 & R5 ...... 72
Figure 4.28. Natural logarithm of viscosity vs conversion at 343 °C+ for the same conditions tested
in R2 & R3 .................................................................................................................................... 72
Figure 4.29. MCR vs conversion at 343 °C+ for R2, R3, R4 & R5 ............................................. 73
Figure 4.30. Product distribution and conversion at 343 °C+ for different T and catalysts ......... 74
Figure 4.31. Comparison of CS2 insoluble material in the liquid product obtained using different
catalysts ......................................................................................................................................... 75
Figure 4.32. Microscope images for the HDT-bio-oil for different T and catalysts ..................... 76

xi
Figure 4.33. H2 consumption vs DOD for different catalysts ....................................................... 77

xii
List of Symbols, Abbreviations and Nomenclatures
Symbol Description Units
ASTM American Society for Testing and Materials
BPV Back Pressure Valve
CAFE Catalysis and Adsorption for Fuels and Energy
CHN Carbon, Hydrogen and Nitrogen
CS2 Carbon disulfide
CSC Catalytic Steam Cracking
CSR Catalytic Steam Reforming
Cx Condition “x” tested
DAO Deasphalted Oil
DOD Degree of Deoxygenation %
EU European Union
FID Flame Ionization Detector
FPD Flame Photometric Detector
FTIR Fourier Transform Infrared
GC Gas Chromatography
H/C Hydrogen to Carbon ratio
HDM Hydrodemetallization
HDN Hydrodenitrogenation
HDO Hydrodeoxygenation
HDS Hydrodesulphurization
HDT Hydrotreating
HDT-bio-oil Hydrotreated Bio-oil
HHV High Heating Value MJ/kg
HTL Hydrothermal liquefaction
IBP Initial Boiling Point °C
K-F Karl Fischer
KOH Potassium hydroxide

xiii
MCR Micro Carbon Residue
O.D. Outside Diameter
O/C Oxygen to Carbon Ratio
PTV Programmable Temperature Vaporizing
R1 Reaction #1
R2 Reaction #2
R3 Reaction #3
R4 Reaction #4
R5 Reaction #5
RTU-1 Reactivity Test Unit 1
SimDist Simulated Distillation
TAN Total Acid Number mg KOH/g
TCD Thermal Conductivity Detector
TGA Thermogravimetric Analysis
THF Tetrahydrofuran
tv Valves cycle time min
VGO Vacuum Gas Oil
WGS Water Gas Shift
WHSV Weight Hourly Space Velocity h-1
WGM Wet Gas Meter
X343°C+ Conversion at 343 °C+
XTAN TAN Conversion %

1
Chapter 1: Introduction
1.1. Background and motivation
In the mid-1800s, biomass supplied more than 90% of U.S. energy and fuel demands. But in
the late 1800s to early 1900s, fossil fuels became the preferred energy resource. The discovery of
crude oil helped to industrialize the world and improved living standards by creating an
inexpensive fuel source.1 In the past few years, transport has been almost totally dependent on
petroleum-based fuels such as gasoline, diesel, liquefied petroleum gas and compressed natural
gas; nevertheless, depletion of conventional fossil fuel reserves mainly used for transportation
purposes has motivated the exploration of alternative fuel sources to fulfill the increasing
worldwide demand.2 Additionally, the increasing awareness of global warming have led to strict
regulations for releasing greenhouse gases.3 Usage of biologically derived fuels, may play an
important role for blending with crude oil fractions to supply part of the global demand and to
meet the end-product specifications as they come from a cleaner, CO2 neutral, feedstock.
Investigations in this area are becoming more relevant, as these bio-oils have the advantage of
having reduced contents of contaminants such as sulphur and nitrogen.4 Therefore, they produce
lower amounts and less harmful gas emissions compared to conventional fossil fuels on a life cycle
basis.5
Traditional oil and chemical companies such as Shell, Conoco-Phillips, Dupont and BP are
already transitioning to the carbohydrate economy by developing the technology and infrastructure
for biofuels and biochemicals production.6 Government leaders are also recognizing the
importance of this growing industry by providing tax breaks, grants, incentives and mandates. For
example, in 2006 the U.S. government started giving $0.14/L for ethanol production as a subsidy;
a number of European Union (EU) countries give full tax exemption for biotransportation fuels;
and EU is promoting the growing of crops used for biodiesel and bioethanol production by
providing a carbon credit of $54/ha.6
However, there are some political, economic and technical disadvantages associated with
using biofuels. First, most of the natural material used for producing bio-oils like corn, wheat,
sugar beet and oil seeds, can interfere with the human food chain and can lead to exacerbate current
global food shortage issues.4, 7 Second, because the biofuels industry is starting to grow, some

2
current biomass technologies have low overall thermal conversion efficiencies, making the process
highly expensive and inefficient.6 Finally, bio-oils face some technical challenges regarding some
of their properties such as poor volatility, high viscosity and acidity, thermal instability (gum-
polymers formation) and high content of oxygenated compounds that reduce their miscibility with
petroleum-based fuels.7
The biofuels industry is in its early stage with many novel biomass conversion technologies
being developed to improve overall energy and economic efficiency.8 It is foreseeable that, as
petroleum reserves decline, the price of fossil fuel products will increase and biofuels will
eventually be cost-competitive with petroleum-derived fuels.6 One promising alternative is the
production of biofuels using low-value feedstock, such as waste wood from the pulp and paper
industry, which would not interfere with the human food chain. Additionally, the greatest
advantage of using biological-derived fuels is that, unlike fossil fuels, biomass takes carbon out of
the atmosphere while it is growing, and returns it as it is burned. This maintains a closed carbon
cycle with almost no net increase in atmospheric CO2 levels.9
Steeper Energy Ltd, a Danish-Canadian company, is in the process of commercializing a
hydrothermal liquefaction technology called Hydrofaction™ for production of added-value liquid
fuel from lignocellulosic biomass via water supercritical chemistry.7 This process has been proven
to yield between 45-50 wt.% of liquid product with a low oxygen content when compared with
regular lignocellulose processing technologies.10 The bio-oil produced by Hydrofraction™ still
presents a high acidity, viscosity and oxygen content compared with petroleum-derived fuels.
Hence, an upgrading process is required to convert the bio-oil in bio-fuels or a product miscible
with crude oil.
In the last two decades, literature related to the catalytic removal of oxygen from bio-oil
derived from lignocellulose has been rapidly growing. In a hydrotreating process,
hydrodeoxygenation (HDO) reactions are used to remove oxygen from bio-oils in the form of
water, CO and CO2 by adding H2 to the process.11 Catalytic HDO has been investigated as a
feasible route for the production of fuels from bio-oils. Hydrotreating processes address the
instability of the bio-oil and it is carried out in order to prevent catalyst deactivation in further
processing, minimize coke formation and improve the properties of the oil.6

3
In 2000, the literature of kinetics and reaction networks of HDO was reviewed by Furimsky.12
Four years later, Czernik and Bridgwater investigated developments in the applications of bio-oils
in the industry13 and in 2006 Mohan et al. discussed the process of converting wood into bio-oils
via pyrolysis.14 In 2007, Elliot summarized the historical perspective on developments in catalytic
hydroprocessing of bio-oils.15 Properties and applications of bio-oils produced via pyrolysis or
hydrothermal liquefaction (HTL) has been reviewed by several authors.16, 17 Additionally, different
standard hydrotreating catalysts have been tested for HDO of bio-oils derived from
lignocellulose.18, 19
The early work demonstrated that hydroprocessing of bio-oils was feasible, although not
economical yet due to the severe reaction conditions, hydrogen consumption and the necessity of
further upgrading the hydrotreated product to obtain the commercial products.11 A promising
approach proposed in the present research is to combine hydrotreating with a catalytic steam
cracking (CSC) process, which produces hydrogen, in order to reduce or eventually eliminate
external hydrogen production making the upgrading economically viable.
1.2. Novel Bio-oil Upgrading Approach
The novel bio-oil upgrading approach aims to combine a mild hydrotreating process to mainly
reduce the oxygen content of the feedstock with a catalytic steam cracking process to reach a
deeper conversion of the bio-oil into light fuels. Catalytic steam cracking (CSC) is a process that
uses water as a hydrogen supply by catalytically splitting water molecules while cracking large
and heavy molecules in the feedstock.2 This process is configured in a single catalyst bed and it
uses a dual-function catalyst. The catalyst has a rare earth metal that cleaves the water molecule to
form hydrogen radicals and a hydrogenating metal combined with an acid support to promote
hydrocracking.20 The produced hydrogen radicals are involved in the saturation of hydrocarbon
radicals generated by molecules cracking and act as scavengers to prevent condensation reactions,
thus coke formation.2
The proposed scheme has two main features that look promising for future of upgrading of
bio-oil. First, CSC produces its own hydrogen by cleaving water molecules; hence, there is no
need to feed hydrogen to the CSC process. Second, and most importantly, the unconsumed
hydrogen produced in CSC may be recovered and recycled back to the HDT unit, reducing the

4
fresh hydrogen make-up needed for this unit. According to a study of this process made by Trujillo
in her MSc. thesis,21 the recycle of the unconsumed hydrogen per se from the CSC stage would
meet 8.6% of the hydrogen requirement for the HDT stage. However, the theoretical hydrogen
available from the hydrocarbons gaseous stream from CSC to be recovered considering a catalytic
steam reforming step was calculated and the yield exceeded the hydrogen requirements for the
HDT stage. This means, that with proper treatment for the gas stream produced in CSC, there is
enough hydrogen produced in this process to guarantee all the hydrogen make-up for HDT.
Figure 1.1 shows the proposed bio-oil upgrading diagram via HDT and CSC. First, the HDT
process consists of an up-flow fixed bed reactor containing an in-house formulated catalyst. This
catalyst has been found to be active for hydrogenation reactions in bio-oils by Trujillo in her MSc.
thesis.21 Next, the hydrotreated oil is to be further upgraded via CSC in an up-flow fixed bed
reactor containing a catalyst also assessed by Trujillo. As seen in Figure 1.1, product gases from
both reactors are going to be submitted to catalytic steam reforming (CSR) to process hydrocarbon
gases and recover hydrogen. The hydrogen produced is to be recycled to the HDT process to
minimize or eliminate the make-up hydrogen needed.
Figure 1.1. Proposed novel bio-oil upgrading scheme combining HDT and CSC.

5
In order to optimize the conditions and catalysts for each stage, the processes were evaluated
separately as a first step of the general study. Screening of conditions and catalysts for HDT were
made by Trujillo in her MSc. thesis that produced the starting point for this research. Trujillo also
studied the CSC process including some operating conditions, catalyst types and their deactivation
as well as the hydrogen balance for the whole process.21 The present work in this thesis is going
to have its main focus in optimizing the HDT process in terms of finding the best pressure, catalyst
configuration, temperature and space velocity to produce a high-quality bio-oil that can be
processed by CSC without deactivating the catalyst used in this second processing step (CSC)
while allowing it to fulfill the highest yield of distillate and naphtha products for the integrated
process.
1.3. Scope of the Research
The general objective of this research is to study the novel proposed hydrogenation process
of bio-oil derived from lignocellulosic biomass material provided by Steeper Energy. In order to
accomplish the general goal, some specific objectives were established as follows:
1. Conduct a systematic study of the variables effect such as total operating pressure,
temperature and space velocity on the reactivity of bio-oil via HDT.
2. Evaluate the best conditions and catalysts to minimize the acidity and oxygen content
on the feedstock.
3. Understand the catalyst lifetime during long term evaluation runs.
4. Develop a correlation between two analytical characterization techniques: Total Acid
Number (TAN) and Fourier-transform Infrared (FTIR) to simplify the acid content
analysis.
5. Compare the effect of different catalyst formulations and reactor configurations on the
product quality.
6. Produce a high-quality hydrotreated product for further processing via CSC to prevent
rapid CSC catalyst deactivation due to coke formation.

6
Chapter 2: Literature Review
2.1. Lignocellulosic biomass
Biomass is an abundant renewable source to produce energy efficient fuels such as bioethanol
and bio-diesel in an eco-friendly manner. These types of fuels mainly utilize plants rich in
carbohydrates like sugar cane, wheat, maize, potato, barley, corn or sugar beet as feedstock and
makes up the first generation of bio-fuels.22 The first generation of biofuels is based on well-known
and established technologies, whereas the production of bio-fuels from wood mass is still in the
early stages of research and development and is considered the second-generation bio-fuels.23
Nowadays, a large volume of wood and forest biomass is readily and commercially accessible.
The components of the biomass are obtained from wood harvest and processing residues and
include: tree branches, bark, leaves and limbs, non-merchantable wood, wood pulp wastes and
sawdust.24 Also, biomass from waste wood does not interfere with the human feed chain, which is
one of the main disadvantages of first-generation biofuels.4
Wood-based biomass is essentially a composite material constructed from oxygen-containing
organic polymers and is usually called lignocellulosic biomass. Figure 2.1 shows the main
structure of lignocellulosic biomass. Lignocellulose can be found in the cell walls of plants and
wood and is composed by three major components: cellulose, hemicellulose and lignin. Some
organic extractives such as proteins, resins and waxes and inorganic minerals can be found in
minor concentrations.10, 14 The weight percent of the components varies depending on the wood
species. Table 2.1 shows the typical composition of cellulose, hemicellulose and lignin for
different lignocellulosic materials. As a general trend, it can be observed that the major component
in all different lignocellulosic biomass is cellulose, followed by lignin that in some forest residues
represent the major component.

7
Figure 2.1. Structure of lignocellulosic biomass10
Table 2.1. Typical biomass and waste compositions (wt. % dry mass) adapted from ENC25
Lignocellulosic materials Cellulose Hemicellulose Lignin
Hard woods
Poplar 46.2 24.4 24.5
Birch 40.6 29.6 20.2
Willow 60.5 29.9 25.6
Soft woods
Spruce 44.1 21.2 26.9
Pine 43.6 24.9 25.6
Coniferous wood 57.5 22.5 30.0
Forest residues
Bark, pine 23.7 24.9 50.0
Wood stems 42.6 22.3 37.7
General residues 45.5 21.0 27.3
Other lignocellulosics 38.3 25.2 14.8
Corn stover 37.3 35.8 20.1
Sugarcane bagasse 37.9 26.8 18.3
Wheat straw 37.1 31.2 8.5
Switch grass 46.2 24.4 24.5

8
Cellulose is a high molecular weight linear polymer that consists of D-glucose molecules
bound together by -1,4-glycoside linkages.14 Cellulose fibers comprise between 40-50 % of dry
wood providing the strength of the wood.22 A large portion of cellulose is crystalline and it has a
high tendency to form intermolecular and intramolecular hydrogen bonds.10 In Figure 2.2, the
structure of the cellulose can be observed. The crystalline structure of the cellulose makes it very
resistant to thermal or biological decomposition. However, when exposed at water at supercritical
conditions , cellulose transforms from a crystalline to an amorphous structure allowing cellulose
degradation.26 When cellulose is decomposed by a complete acid hydrolysis, it breaks down to
form glucose.6, 27
Figure 2.2. Chemical structure of cellulose14
Hemicellulose is composed by amorphous and heterogeneous groups of branched
polysaccharides (copolymer of glucose, mannose, galactose, xylose and arabinose) shown in
Figure 2.3. Hemicellulose exhibits a lower average molecular weight than cellulose.14 Cellulose
fibers are surrounded by hemicellulose that acts as a linkage between cellulose and lignin as seen
in Figure 2.1.22 Hemicellulose contains short side-chain branches pending along the main
polymeric chain that makes its decomposition easier. It decomposes at lower temperature (200-
260 C) and forms less chars than cellulose.28 When hemicellulose is decomposed via hydrolysis,
it breaks down to form its 5 monomer sugars (glucose, galactose, mannose, xylose and arabinose).6
Figure 2.3. Main components of hemicellulose14

9
Finally, lignin is a highly complex three-dimensional macromolecule resulting from the
polymerization of different phenylpropane units bound together by ether and carbon-carbon
bonds.22 Figure 2.4 shows a partial structure of a lignin molecule.29 The phenyl propanoid units
that comprised lignin are not linked in a simple, repeating way due to electron delocalization in
the aromatic ring, the double bond-containing chain and the oxygen functionalities.6 Lignin is
markedly different in structure and composition from cellulose and hemicellulose because of its
high aromaticity.11 Thus, it is more difficult to dehydrate than cellulose or hemicellulose and its
maximum rate of decomposition occurs between 350 and 450 C.30 The main products from lignin
decomposition are phenols due to the cleavage of ether and carbon-carbon bonds.14
Figure 2.4. Partial structure of a hardwood lignin molecule from European beech14

10
As mentioned before, cellulose, hemicellulose and lignin interact at the plant cell wall
structural level. Cellulose and hemicellulose adhere to each other due to hydrogen bonding and
van der Waals forces. Additionally, lignin and hemicellulose form ether and ester bonds with each
other.31
In general, lignocellulosic biomass is comprised of carbon (50 wt.%), hydrogen (6 wt.%) and
oxygen (43 wt.%).10 Nitrogen and small traces of chloride account for the remaining 1%. Sulphur
is not present in this type of biomass. The high oxygen content present in this biomass is the main
disadvantage to produce transportation biofuels that are compatible and expectantly competitive
with fossil fuels. Therefore, processing lignocellulosic biomass is needed to decrease the oxygen-
to-carbon (O/C) ratio while increasing the hydrogen-to-carbon (H/C) ratio.
2.2. Thermochemical processing of lignocellulosic biomass
There are three methods of converting biomass into valuable products: gasification, pyrolysis
and liquefaction. Each one of the methods gives different range of products and employs different
equipment and operating conditions. As seen in Table 2.2, gasification is mainly used to produce
synthesis gas and fuel gas; pyrolysis is used to produce liquid fuels or chemicals, charcoal or solid
char and fuel gas; finally, the liquefaction process produces directly bio-oil or liquid fuels.32 Since
the purpose of this work is to upgrade converted biomass into liquid products that can be used as
biofuels, either pyrolysis or liquefaction must be employed.
Table 2.2. Thermochemical conversion technologies and products, adapted from Bridgewater32
Technology Primary Product Application
Gasification Gas Synthesis gas, fuel gas
Pyrolysis
Fast or flash pyrolysis Liquid Liquid fuel substitution, chemicals
Carbonization Charcoal Solid fuel or slurry fuel
Slow pyrolysis Gas, liquid char, solid char Fuel gas, solid fuel, liquid fuel
Liquefaction Liquid Oil or liquid fuel substitution
Combustion Heat Heating

11
Pyrolysis is the process where organics are thermally decomposed to solid, liquid or gas by
heating in absence of oxygen.14 Depending on the operating conditions, solid, liquid or gas
products can be produced. For example, slow pyrolysis produces large amounts of coke that can
be used as solid fuel, whereas fast pyrolysis has proven to maximize the liquid products by using
temperatures of 500 C and very short residence time (less than 1 s).32 Fast pyrolysis has the
advantage of lower capital cost compared with liquefaction processes.6 However, this process
requires a dry biomass, high heating rates and high temperatures and produces a highly-oxygenated
bio-oil because the process does not reduce the oxygen content.14
On the other hand, liquefaction or Hydrothermal Liquefaction (HTL) is considered a
promising technology for bio-oil production because of its high biomass conversion, high bio-oil
yield and low O/C ratio products.33 Additionally, HTL has no limitation to input biomass with high
water content.34
The focus of this research is to upgrade a bio-oil produced with lignocellulosic biomass via
hydrothermal liquefaction. Thus, more details including the operating conditions and catalysts are
given in Section 2.2.1.
2.2.1. Hydrothermal Liquefaction
Hydrothermal liquefaction is a biomass to bio-oil conversion route carried out in water at
moderate temperature between 250 and 400 C and high pressures (up to 30 MPa) with or without
the presence of a catalyst.33 HTL is less developed than fast pyrolysis due to the high cost and
technical difficulties associated with high-pressure processing. Many complex reactions take place
during the transformation of biomass into bio-oil where macromolecular compounds are degraded
into unstable and reactive small molecules that can repolymerize into products with a wide range
of molecular weight distribution.35 The general objective of the process is to control the reaction
rate and reaction mechanisms to minimize the oxygen content of the liquid product and maximize
the yield of the liquid product.32
The presence of different catalysts have been studied by several authors,33, 35 finding that alkali
(alkaline oxides, carbonates and bicarbonates), metals (zinc, copper, iodine, cobalt sulphide, ferric
hydroxide) and Ni and Ru heterogeneous catalysts (which aid preferential hydrogenation) have
been used for liquefaction.

12
Hydrofaction™ is a hydrothermal liquefaction process developed by Steeper Energy that
combines super-critical water chemistry and homogenous catalysts to convert biomass residues to
a high-energy bio-oil.10 More details about this technology will be given in Section 2.2.1.1.
2.2.1.1. Hydrofaction Process
Steeper Energy is commercializing a hydrothermal liquefaction technology called
Hydrofaction™ as a promising path to convert lignocellulosic biomass to bio-oil. This technology
has been proven successfully in a continuous pilot facility.10 Hydrofaction™ includes the use of
supercritical water chemistry, higher pressure and temperatures than other HTL processes reported
in literature.10 The operating conditions are above the critical point of water at pressures between
300-350 bar and temperatures of 390-420 °C. Figure 2.5 shows a phase diagram of water to
visualize the different operating regimes.10 In Hydrofaction™, a homogenous catalyst is used in
the form of potassium carbonate (K2CO3) for desired catalytic effects; recirculation of the oil and
aqueous products is also used to improve feed characteristics, energy balance, oil yields and
desired kinetics.10
Figure 2.5. Phase diagram of water for different operating regimes10
The polarity and dielectric constant decrease significantly when water gets closer to its
supercritical state allowing water to dissolve biomass molecules that are hydrophobic at ambient
conditions including phenolics and polyaromatic hydrocarbons derived from lignin.36 Also, at
supercritical conditions, mass and heat transfer rates are enhanced and interphase mass and heat
transfer resistances are significantly diminished.10 Finally, it was proven that water at supercritical
conditions, sustains a high-density at a high-pressure range compared to most HTL processes
operating near the critical point of water.10

13
Jensen, et al. proposed a scheme for the major reactions taking place at Hydrofaction™
conditions that includes: water dissociation, solvolysis, hydrolysis, dehydration, decarboxylation,
steam and CO2 reforming, water gas shift (WGS), aldol condensation and retro aldol, among
others.10 The high-density, alkaline supercritical water promotes depolymerization of
macromolecules through hydrolysis and solvolysis reactions. Some radical reactions may occur as
well due to the high temperatures; however, radical scavengers are used to participate in chain-
terminating reactions.37
Organic solvents and alkaline conditions favor the degradation of the lignocellulose to its
major macromolecules: cellulose, hemicellulose and lignin. First, the cellulose and hemicellulose
depolymerize to oligomers and eventually monomers through hydrolysis and solvolysis. The
oligomers and monomers further dehydrate and isomerize to carboxylic acids, aldehydes and
enols. Depolymerization of lignin can take two different pathways: an ionic pathway where
hydrolysis and solvolysis reactions take place, which is favored because of the conditions of the
process; or a radical pathway through the thermolytical cleavage of both ether and C-C bonds.
From the ionic pathway, low molecular weight phenols are formed.10
The organic compounds contained in the bio-oil resulting from this technology along with
some reaction pathways for cellulose, hemicellulose and lignin are presented in Section 2.3.1.
2.3. Bio-oil from lignocellulose
Bio-oils are physically very similar to crude oil as they are dark brown flowing liquids;
however, they have a very distinctive smoky and acid odor that distinguish them from petroleum-
derived oils.38 Bio-oils are a complex mixture of compounds derived from the depolymerization
of cellulose, hemicellulose and lignin. This complex mixture include water, solid particles and
hundreds of organic compounds such as acids, alcohols, ketones, aldehydes, phenols and ethers,
among others.39 Some of these compounds are directly related to the undesired properties of bio-
oil like high acidity, oxygen content, viscosity, low heating value and instability.
When comparing the properties of bio-oil and crude oil a significant difference is noticed.
Table 2.3 presents the typical properties of a bio-oil and a crude oil.6, 16 It can be seen that the two
properties that differ the most between a bio-oil and crude oil are the moisture content and the
elemental composition, where it can be observed that bio-oils have higher oxygen content than

14
crude oils. However, a low content of contaminants such as nitrogen9 and sulphur has been found
in bio-oils derived from lignocellulose.6
Table 2.3. Typical properties of wood derived bio-oil and crude oil
Bio-oil6, 16 Alberta Bitumen40
Moisture content [wt. %] 1-30 <1
Elemental Composition [wt. %]
C 65-75 82-83
H 5-8 10-11
O 10-40 <1
N <0.5 <1
S <0.05 4.5-6.0
High heating value (HHV) [MJ/kg] 20-30 40
Viscosity at 40 °C [cP] 6,000-30,000 12,000
2.3.1. Chemical composition of bio-oil derived from lignocellulose via HTL
The chemical composition of bio-oils may vary depending on different factors, such as
biomass type, feedstock composition, feedstock pretreatment, process for converting biomass and
operating conditions of the process.6 In general, bio-oils are a blend of more than 400 important
organic compounds at different compositions.41 Oxygenated aromatics, heterocyclic compounds
and long chain aliphatic backbones can be found on this renewable oil.42
Carrier et al. investigated the conversion of hemicellulose, cellulose and lignin at supercritical
water conditions and found that products can be grouped into two main pools: oxygenated and
substituted 5-membered ring structures, such as ketonic cyclopentanes and cyclopentanes; and
oxygenated and substituted aromatics.43, 44 Quitain et al. performed a qualitative evaluation on
hydrothermal treatment of a type of bark and identified furfural, benzenes, phenols and acids such
as stearic and palmitic as the main compounds found in the produced bio-oil.27
The reaction mechanism to produce bio-oil is complex and consists of multiple chemical
reactions. It was found that cellulose and hemicellulose (carbohydrates) present similarities in

15
terms of yield, composition and chemical mechanism,42 which reduces the complexity of the
mechanism. Figure 2.6 shows a proposed reaction scheme for the formation of bio-oil.42
Figure 2.6. Reaction scheme for the bio-oil formation proposed by Pedersen & Rosendahl42
Quitain et al.27 found that carbohydrates mainly yield oxygenated 5-membered ring structures
such as furfural and 5-hydroxymethyl furfural whereas lignin yields oxygenated aromatic
compounds such as catechol, phenols and cresols.42, 45 The composition of the different elements
was found to be directly related with the content of lignin, cellulose and hemicellulose in the
biomass. Feedstocks with higher content of lignin yielded more content of aromatics than those
with more cellulose or hemicellulose.42 Milne et al. summarized the chemical composition of bio-
oils derived from lignocellulosic biomass and it is presented in Figure 2.7. It can be observed that
bio-oil contains a numerous variety of compounds such as acids, esters, ketones, aldehydes, sugars,
miscellaneous oxygenates, furans, phenols, guaiacols and syringols.6, 39. In this Figure, the black
column corresponds to the minimum composition found in bio-oils of this compound while the

16
gray column corresponds to the maximum composition found in lignocellulosic-derived bio-oils
of the same compound.
Figure 2.7. Chemical composition of bio-oils according to Milne et al.39
2.3.2. Important properties of bio-oil
The main physicochemical properties resulting from the chemical composition of bio-oils will
be discussed in this section. By following the changes of these properties, it can be determined if
a bio-oil was successfully upgraded to be use as a petroleum-derived fuel.
Water in bio-oils result from the original moisture of the feedstock and from dehydration
reactions during biomass processing. Water content can vary from 15 to 30 % and although water
reduces the viscosity of the oil and enhances the fluidity, it is hard to remove from bio-oils. Its
presence lowers the heating value and flame temperature, reducing the combustion rates of the
oil.16, 46 Bio-oil produced via Hydrofaction™ has only 1-3 % of water which is another advantage
of this process.10
Due to its chemical composition, bio-oils usually have a pH of 2-4 and a total acid number of
50-100 mgKOH/g.38 As mentioned before, they comprise a substantial amount of carboxylic acids
in the form of acetic and formic acids that leads to a high level of acidity. For this reason, bio-oils

17
are corrosive to common construction materials such as carbon steel and aluminum.47 The
corrosiveness is extremely severe at high temperatures, which imposes more requirements on
construction materials and operating conditions for the upgrading process before using bio-oil as
transportation fuels.38
The oxygen content of bio-oils may vary between 10-40 %,46 distributed in more than 300
identified organic compounds. These oxygenated compounds make bio-oils polar, and therefore
immiscible with non-polar petroleum fuels. The presence of oxygen leads to a low heating value,
corrosiveness and instability.13, 16 Also, polymerization of oxygenated compounds in the form of
phenols has been reported.6 One of the primary reasons for differences in the properties and
behavior between hydrocarbon fuels and bio-oils is the high oxygen content. As seen in Table 2.3,
oxygen content for petroleum-derived hydrocarbons is between 10-40 times lower than for bio-
oils.
Viscosity plays an important role in the design and operation of the fuel injection because it
is a measure of the fluid resistance to shearing forces.16 The viscosity for bio-oils can vary between
6000-40000 cP at 40°C, depending on the feedstock and processing of the biomass. Also, the
chemical structure of the bio-oil may be related to this property. Studies have found that alcohols,
acid groups and intermolecular interactions have a strong effect on viscosity; hydrogenated
compounds are more viscous than aromatic compounds and branched hydrocarbons have lower
viscosities than straight chains.48, 49
The heating value is the amount of heat produced by a complete combustion of fuel and it is
measured as a unit of energy per unit mass or volume of substance.50 It is a quantitative
representation of the energy content of an oil because it dictates the amount of energy produced
for each volume of burned fuel. Usually bio-oils produced from plants have a higher heating value
than those produced from straw, wood or agricultural residues. The heating value of a bio-oil (20-
30 MJ/kg) is lower than the one of crude oil (40 MJ.kg). This could be related to the high amount
of oxygenated compounds found in bio-oils, since studies have found that the heating value is
proportional to the elemental composition of an oil being negatively affect by the oxygen content.9
These undesired properties have limited the range of bio-oil applications. They cannot be
directly used as transportation fuels due to bio-oils high viscosity, acidity, oxygen content and low

18
heating value. Therefore, upgrading of bio-oil is needed to improve its properties for liquid fuel,
starting with the removal of the oxygen content that will affect directly the other properties
mentioned above.
2.4. Bio-oil upgrading
In order to unlock the potential commercialization of bio-oils, upgrading of the converted
biomass is needed. Properties that negatively discern the quality of bio-oil from crude oil such as
high viscosity, acidity and high oxygen content can be improved by different upgrading routes.
The three different routes described for upgrading bio-oil to liquid transportation fuels are:
hydrotreating, hydrocracking and emulsification.6
Hydrotreating (HDT) is a simple hydrogenation process that is used to improve the product
quality without significantly altering the boiling range of an oil.16 This process is the most
commonly applied because it reduces the oxygen content of the bio-oil while increasing the H/C
ratio of heavy molecules.51 In general, depending on the targeted molecules, reactions can be
classified as hydrodesulphurization (HDS), hydrodenitrogenation (HDN), hydrodemetallization
(HDM) or hydrodeoxygenation (HDO).12 For bio-oil, the main reaction taking place is HDO
because, in contrast with crude oil, it does not have a significant amount of sulphur, nitrogen or
metals for the other reactions to take place. One of the advantages of HDO is that during the
process, oxygen in the feed is mainly converted to water, which is environmentally friendly.52
Hydrotreating involves processing bio-oil at moderate temperatures to avoid coke formation.53
It serves as a pre-treatment step to hydrogenate unsaturated hydrocarbons and remove oxygen from
the feedstock. Hence, further upgrading is needed to have a high-quality oil.
Hydrocracking (HDC) is a high-temperature process (>350 ºC) where hydrogenation
accompanies cracking to produce a large amount of light product while increasing the H/C ratio
of the feedstock.6 The products from this reaction include hydrocarbons, water-soluble organics,
oil-soluble organics, gases and coke. The wide range of products is the result of combining
catalytic cracking reactions with hydrogenation reactions.6 A dual-function catalyst containing a
cracking function (silica-alumina or zeolite) and a hydrogenating function (Pt, W and Ni) is used
for catalyzing the reactions.54 Although HDC combines hydrogenation with further upgrading of

19
the feedstock, the high costs due to the severe conditions required such as high temperature and
high hydrogen pressure to deal with acids makes this route not as common as hydrotreating.54
Finally, one of the simplest methods for using bio-oil as a transportation fuel is
emulsification. This process has been investigated by many researchers55-58 and consists of
blending bio-oils with diesel using surfactants.6 Overall, upgrading bio-oil through emulsification
provides a short-term approach to the use of this type of oil in diesel engines due to the promising
ignition characteristics showed by the emulsion. However, most fuels properties like heating value,
cetane number and acidity did not meet the requirements which is why other alternatives such as
HDT and HDC are being favored.6, 54
As mentioned before, a better alternative for upgrading the bio-oil is to combine
hydrogenation with cracking reactions in order to first pre-treat the feedstock by increasing the
H/C ratio and decreasing the O/C ratio; and then reach a deeper conversion with a cracking process.
The main disadvantage of this approach is the high amount of hydrogen needed for processing the
bio-oil in a regular hydrotreating-hydrocracking configuration. Nevertheless, the novel bio-oil
upgrading scheme proposed in this research that combines HDT with CSC, where hydrogen can
be produced and recycled, could be a promising upgrading approach.
2.4.1. Hydrotreating
A main goal of upgrading bio-oil is to convert the oxygen-rich, high-molecular-weight
compounds into hydrocarbons that are compatible with petroleum-derived fuels.11 A potentially
valuable process for pre-treating the feedstock is hydrotreating or hydrodeoxygenation, which has
been proven to significantly improve the quality of bio-oils in terms of oxygen content, viscosity,
acidity and stability.12 Without the HDO step, direct high-temperature catalytic processing, needed
to obtain the commercial products like gasoline and diesel, resulted in high levels of coke
production that plugged the catalyst bed.53
For HDT reactions to take place, the presence of hydrogen and a catalyst with a hydrogenating
function is needed. Conventional hydroprocessing catalysts, such as CoMo and NiMo supported
in alumina were useful for HDO in the sulphided form.59, 60 However, the alumina supports were
found to be instable in the presence of high levels of water. Also, a significant amount of coke was
observed when using alumina as the catalyst support.53 Other catalysts, containing Pt, Ni, Pd or

20
other metallic group, are currently being tested for this type of feed. These catalysts were assessed
to be more active at lower temperatures than the sulphided molybdenum-based ones. Metallic
phases can be easily supported on non-alumina supports like carbon or titania to avoid the water
instability of alumina. The main concern for the metallic catalysts is the high cost associated with
most hydrogenating metals like Pt or Pd.53
Regarding the operating conditions for hydrotreating bio-oils, Table 2.4 summarizes typical
conditions found in the literature. Generally, the temperature for HDT is in the low range to remove
oxygen primarily in the form of water, without severely reducing the chain length of the molecules
in the feed. Also, high-temperatures when treating bio-oils promote coke formation resulting from
the original oxygenated compounds.53 High pressure range, as seen in Table 2.4, is generally used
for HDT because hydroprocessing catalysts usually require high pressures to enable H2 and
reagents to reach all the active sites of the catalyst and perform the hydrogenation reactions.15, 61
Additionally, high pressures ensure a higher solubility of hydrogen in the oil, thus a higher
availability of hydrogen in the catalyst surrounding area. By favoring hydrogenation, the reaction
rate increases and the coke formation in the reactor decreases.62
Table 2.4. Typical operating conditions for hydrotreating bio-oils12, 36, 53
Parameter Common values
Temperature [°C] 250-400
Pressure [MPa] 3-18
Liquid hourly space velocity [h-1] 0.1-0.8
H2 feed rate [L H2 STP/ L oil] 100-700
Some of the O-compounds in the feed tend to polymerize from undesirable reactions between
aldehydes and organic acids. This leads to an increase of the molecular weight and is the main
cause for bio-fuels instability.12 Nevertheless, studies have proven that HDT is an effective way to
convert aldehydes and unsaturated compounds into more stable molecules by removing oxygen
atoms.63 The main reactions expected to take place during the HDO of bio-oils are presented in
Figure 2.8. Additionally, undesired reactions such as reverse water gas shift, methanation and coke
formation are expected to occur.64 Hydro-decarboxylation and hydro-decarbonylation remove

21
oxygen in the form of carbon dioxide and carbon monoxide, respectively. Hydro-deoxygenation
removes oxygen in the form of water without cleaving the molecules chain length.65
Figure 2.8. Main reactions occurring in HDT process of bio-oil64, 65
As reported by Milne et al.,39 bio-oil comprise many functional groups that are expected to
react at different temperatures. Grange et al. studied the activation energies and the reactivity
temperatures of different compounds found in bio-oils, finding that molecules with a bound or
sterically hindered oxygen (furans or ortho substituted phenols) required a significantly high
temperature for the reaction of hydrodeoxygenation to take place.66 Furimsky12 summarized the
apparent reactivity for different compounds as:
alcohol > ketone > alkylether > carboxylic acid ≈ M-/p-phenol ≈ naphtol > phenol > diarylether ≈
O-phenol ≈ alkylfuran > benzofuran > dibenzofuran
A study made by Weisser et al. is in agreement with Furimsky’s reactivity proposal67. In
Figure 2.9 it can be observed that at low temperatures (<200 °C), olefins, aldehydes and ketones
are the components reduced by hydrogen. Removing these components have a positive impact on
the stability of the bio-oil.15 Alcohols are reacted at 250-300 °C by catalytic hydrogenation but
also by thermal dehydration to form olefins. Carboxylic and phenolic ethers are reacted at 300 °C
while phenols and dibenzofurans need temperatures higher than 350 °C to react with hydrogen.
3 +

22
Figure 2.9. Reactivity scale of oxygenated groups under hydrotreating conditions15
Finally, Elliot et al. studied the effect of temperature for HDO of wood-based oil using a Pd/C
catalyst in a fixed bed reactor. The operating pressure was 14 MPa and the temperature range was
between 310-340 °C. It was found that above 340 °C the degree of deoxygenation (DOD) did not
increase further, but instead extensive cracking took place accompanied by a decrease in the oil
yield.68
Although HDT is considered a very effective technology to process and improve the
properties of bio-oil, it is important to consider the amount of hydrogen needed to achieve high
HDO conditions and its impact on the profitability of the process. Venderbosch et al. investigated
the hydrogen consumption for bio-oil upgrading as a function of the DOD, finding that the
hydrogen consumption increases sharply when the DOD reaches more than 50%.61 This could be
related with the reactivity of different compounds, e.g. highly reactive oxygenates like ketones can
be easily converted with low hydrogen consumption because oxygen is available for reaction,
whereas complex molecules like furans, need to be hydrogenated/saturated first which increases
the hydrogen consumption notably.12

23
The product after HDT is usually a bio-oil with a reduced oxygen content, viscosity and
acidity. Nevertheless, it still comprises non-polar high-molecular-weight organic compounds51
that, in order to obtain commercial products, require further processing of the oil in a hydrogen
rich environment. To allow further processing without consuming more hydrogen in a
hydrocracking process, a new alternative is proposed. Catalytic Steam Cracking (CSC) is a
moderate-conversion process that produces hydrogen through steam dissociation and cracks heavy
molecules both thermally and catalytically.20 The unconsumed hydrogen in CSC can be recycle to
the HDT process in order to make bio-oil upgrading more economically viable.

24
Chapter 3: Experimental Methods
3.1. Bio-oil feedstock
The experiments performed in this research project were done using a bio-oil feedstock
provided by Steeper Energy. This feedstock is produced using lignocellulosic biomass via a
patented process named Hydrofraction™, a supercritical hydrothermal liquefaction technology
explained in detail in Section 2.2.1.1. Properties of the feedstock used in this research are presented
in Table 3.1.
Table 3.1. Properties of the bio-oil provided by Steeper Energy
Property Value
Viscosity @40 °C [cP] 31172
TAN [mg KOH/g] 48.32
Microcarbon [wt. %] 22.01
Oxygen content [wt. %] 10.82
H/C molar ratio 1.36
O/C molar ratio 0.10
Water content [wt %] 1.08
Distillation Cuts [wt. %]
Naphtha (IBP - 190 °C) 2.1
Jet Fuel (190 - 260 °C) 5.2
Diesel (260 - 343 °C) 10.5
VGO (343 - 545 °C) 26.5
Residue (545 °C +) 55.8
3.2. Experimental Set Up
The reactivity tests for upgrading the bio-oil in this research were carried out in a Reactivity
Test Unit (RTU-1) bench-scale pilot plant designed and constructed by Cabrales Navarro.69 RTU-
1 is equipped with an up-flow tubular reactor that can be used to emulate the performance of
industrial processes such as hydrotreating, thermal cracking or visbreaking. Catalytic Steam

25
Cracking (CSC) and thermal cracking reactions of De-Asphalted Oil (DAO) were performed in
this unit by Cabrales Navarro69 prior to the beginning of this research. Also, a detailed description
of the design, construction and operation of RTU-1 is reported.69
The unit can be divided in three main sections: Feed section, Reaction section and Separation
and Sampling section. For the purposes of this thesis, the Separation and Sampling section was
modified to accommodate the unit for the bio-oil feedstock and hydrotreating conditions. A
summary of the modifications is found in Appendix I.
A whole schematic of RTU-1 including the modifications done to the unit is presented in
Figure 3.1.
Figure 3.1. RTU-1 diagram, adapted from Cabrales Navarro69

26
3.2.1. Feed Section
The feed section is equipped with two steel tanks to supply feedstock to the pump. The main
tank is a 10 L custom made stainless steel vessel of 6.7” and 15” height, built in the Engineering
Machine Shop at the University of Calgary. This tank is equipped with a spring-type relief valve
that opens at 100 psig in case the vessel over pressurizes. The main feed tank is heated between
80-100 °C to ensure mobility of the feedstock and it is pressurized up to 100 psig for
homogenization purposes and to provide head pressure to refill the pumps. The second feed tank
is an auxiliary 1 L Swagelok vessel operated at room temperature where vacuum gas oil (VGO) or
dichloromethane is stored for cleaning purposes. A Teledyne ISCO series 500D dual-pump
continuous flow system with dual pneumatic valves and controlled by a Series D Controller is used
to pump the feedstock to the system. The continuous flow mode allows refilling one pump while
the other one delivers fluid to the system. In case there is a reactor or lines plugging downstream,
a spring-type relief valve is placed in the pump outlet line that directs the feed flow to an auxiliary
500 mL Swagelok tank depending on the set pressure. The feed section is also equipped with a
heated water and gas outlet line (TC-201) for CSC processing. In this thesis, only hydrotreating
reactions were performed, thus only hydrogen was injected through this line. A Brooks Instrument
5850 EM hydrogen mass flow controller is installed for hydrogen injection. Lines made of ¼’’
O.D. 316 stainless steel tubing provided by Swagelok connect all the parts of the feedstock
pumping. Additionally, heating tapes are used for heating the lines at temperatures up to 140 °C
(TC-101 to TC-108) due to limitations in temperature of the pneumatic valves of the ISCO pumps.
Finally, every heated piece is insulated with Superwool insulation (Ref. 6# SW 607 supplied by
Improheat-Edmonton) to reduce heat losses.
3.2.2. Reaction Section
RTU-1 is equipped with a tubular reactor operated in up-flow mode. In this case, the reactor
was operated as a fixed-bed, filled with different types of supported catalyst for different test runs.
Volume of the reactor for most of the test runs was 29.1 mL. The reactor was assembled with 35.5
cm length 316 stainless steel Swagelok tubing, ½” O.D. and 0.049’’ wall thickness. An Omega
thermocouple with 7 sensing points is installed inside the reactor for temperature monitoring as

27
presented in Figure 3.2. As seen in Figure 3.2, 6 sensing points are distributed inside the reaction
zone and the other point indicates the temperature before the inlet of the reactor.
Figure 3.2. Reactor and thermocouple profile probe schematic, adapted from Cabrales Navarro69
To heat the reaction section, three individually controlled heating tapes (TC-204, TC-205 &
TC-206) are wrapped around the reactor to have versatility to adjust any of the sections output
independently to obtain a homogenous temperature profile. There is a ¼” O.D. pre-heating line
before the reactor entrance in order to increase the temperature of the feed and reduce the heat load
at the reactor entrance.
3.2.3. Separation and Sampling Section
The hot separation system is equipped with the following double ended 304L stainless tanks
supplied by Swagelok: one 1 gallon stability tank (not used in this research), two 1 L mass balance
vessels and one 40 mL intermediate tank.
The mixture of gases, water and liquid hydrocarbons exiting the reactor go to a collector tank
(MB Tank 1) operated at low temperature (90 °C) because of restrictions of the tank at high

28
pressure (1400 psig). In this collector tank, gases are separated from the liquid products and passed
through a back pressure valve (BPV) that maintains the operating pressure at the given set point.
Then, the gas stream is sent to the gas release and depressurization section. This section consists
of two KOH traps for gas sweeting in case of having hydrogen sulphide as a product of the reaction,
a Gas Chromatograph (GC) for gas analysis and a Shinagawa W-NK-0.5-18 Wet Gas Meter
(WGM) for gas flow measurements.
The first tank (MB Tank 1), as mentioned before, is used to separate the gases and collect the
liquid product. The second tank (MB Tank 2) works as a hot separator at 110 °C and atmospheric
pressure to ensure water separation. To collect mass balances and separate the water from the
liquid product, the last one must pass from MB Tank 1 to the hot separator (MB Tank 2) without
a high drop in the pressure of the system. For this purpose, an automated sampling system equipped
with two computer-controlled pneumatic valves are set to control the valve between MB Tank 1
and the 40 mL vessel (V-301) and the valve between the 40 mL vessel and MB Tank 2 (V-302).
The pneumatic valves are timed in such a way that V-301 opens and approximately 90% of the
small vessel is filled with liquid. This causes a small pressure drop in the unit, less than 3% of the
operating pressure. V-301 is left open for 300 s and then it closes automatically. After 10 s, V-302
opens 300 s and the product is released to the hot separator. After this point, the cycle set in the
computer starts again. To ensure water separation, a constant amount of nitrogen is injected at the
bottom of the hot separator and the residence time should not be less than one hour before
collecting the sample. Water and light products that distill at 110 °C are sent to a 304L Swagelok
stainless steel 75 mL mass balance tank (MB Tank 3) operated at room temperature and
atmospheric pressure. Nitrogen is used to flush the samples from MB Tank 2 and MB Tank 3.
3.3. Experimental Procedure
RTU-1 was used to test different catalysts and conditions through this thesis. Prior to the start-
up of the unit, it is necessary to fill the reactor with the catalyst and to treat the catalyst to activate
the metals on it. These two steps will be explained in section.3.3.1 and 3.3.2. Also, the operation
and start-up of RTU-1 for hydrotreating will be discussed in section 3.3.3.

29
3.3.1. Reactor Filling
Figure 3.2 shows a schematic of the packed bed reactor used on the experiments. First, the
reactor inlet fittings, containing the thermocouple, were closed and attached to the empty tubing
(reactor). Next, quartz wool was introduced through the tube exit end to reach the inlet of reactor.
Using a funnel, carborundum previously washed with hydrogen chloride was added until reaching
the isothermal zone (point #2 of the thermocouple). To separate the carborundum from the catalyst,
more quartz wool was incorporated to the tube. Then, catalyst was loaded until reaching point #7
applying vibration to ensure a well-packing. Afterward, more quartz wool, carborundum and
quartz wool again, were incorporated to the reactor until reaching the outlet.
The filled reactor was assembled into RTU-1 and leak test was performed at 1650 psig of
Nitrogen for at least 24 hours. Leaks were detected using Snoop Liquid Leak Detector from
Swagelok. The maximum acceptable pressure drop per hour was 0.5%.
The amount of catalyst loaded in the reactor and the Weight Hourly Space Velocity (WHSV)
selected for each experiment allowed the determination of the oil mass flowrate to be used. It can
be determined following Eq. 3.1.
𝑊𝐻𝑆𝑉 [ℎ−1] = 𝑂𝑖𝑙 𝑚𝑎𝑠𝑠 𝑓𝑙𝑜𝑤𝑟𝑎𝑡𝑒 [
𝑔ℎ
]
𝑀𝑎𝑠𝑠 𝑜𝑓 𝑐𝑎𝑡𝑎𝑙𝑦𝑠𝑡 [𝑔]
Eq. 3.1
3.3.2. Catalyst Activation
The oxidation states of the metals added to the catalyst at the start of the test run are very
important to obtain maximum performance. In order to reach the desired oxidation state for the
catalysts tested in this research, a reduction under nitrogen and hydrogen was required for
activation of the catalyst. Previous studies done by Vitale, et. al70 showed that all the metals used
in the catalysts were reduced at 500 °C. To start the reduction, nitrogen was flowed through the
reactor filled with catalyst at a rate of 60 mL/min. The temperature was ramped to 500 °C at a rate
of 10 °C/min. After reaching the set point, external temperatures were adjusted to ensure a
homogenous profile. The temperature was maintained at 500 °C for 6 hours and the nitrogen flow
was set to zero after reaching room temperature. The same procedure was repeated using hydrogen
instead of nitrogen. However, after reaching the set point (500 °C), the temperature was maintained

30
for 8 hours instead of 6 hours. Hydrogen flow was set to 10 mL/min after reaching room
temperature to keep the unit under a hydrogen environment for the start-up. The catalyst activation
was done at atmospheric pressure.
3.3.3. Hydrotreating Operation
In order to bring all the process variables to reaction conditions in a smooth manner after the
catalyst treatment, there is a procedure that needs to be followed. First, the temperatures in the feed
and separation and sampling section were increased to the regular operation set-point (between
90 °C and 110 °C). Next, the pressure of the system was increased and hydrogen flow was set to
reaction conditions. The back pressure valve (BPV) was manually closed to constrain the gas flow
at the exit of the system until reaching the set-point value. Then, the reactor temperatures were
increased at a rate of 10 °C/min until reaching the set-point. External temperatures were adjusted
to obtain a homogeneous temperature profile. Afterward, oil was flowed through the system at a
rate of 2 mL/min for 60 minutes to fill the lines leading to the reactor, and the reactor as well.
Finally, oil mass flow rate was fixed to the set-point determined using Eq. 3.1 and the time to reach
stability for the reaction was started when the internal temperatures achieved the reaction set-point.
Each condition tested was considered stable after oil passed through the reactor three times its
volume at the corresponding set-points of temperature, pressure and oil and hydrogen flowrate.
As explained in Section 3.2.3, an automated sampling system was used to transfer the liquid
product to the separation tank. The valves cycle time (tv) in the automated system was calculated
from Eq. 3.2, where 40 mL is the volume of the vessel between MB Tank 1 and MB Tank 2.
𝑡𝑣 [𝑚𝑖𝑛] = 40 𝑚𝐿
𝑂𝑖𝑙 𝐹𝑙𝑜𝑤 𝑟𝑎𝑡𝑒 [𝑚𝐿𝑚𝑖𝑛]
Eq. 3.2
3.4. Characterization Techniques
The liquid and gas products obtained from hydrotreating the bio-oil were analyzed to
understand the effect of varying different operation conditions. Most of the techniques described
in this section were modified from the ASTM norms used for heavy oil for a feasible
implementation with the resources available at the CAFE group at the University of Calgary. Also,
some modifications due to the nature of the feedstock (bio-oil) were done.

31
3.4.1. Total Acid Number
Total Acid Number (TAN) is defined as the naphthenic acid content on a crude oil and it is
commonly expressed as the milligrams of potassium hydroxide (KOH) needed to neutralize a gram
of crude oil.71 TAN number or the acidity of the samples was measured following the ASTM D644
norm.72 Although this method is well-established and accepted, with the available Mettler T70
titrator this method has disadvantages. It does not differentiate strong acids from weak acids, thus
it does not distinguish the type of molecules in the sample such as naphthenic acids, phenols,
mercaptans or other acidic components present in the sample.71 From the preceding drawbacks,
this technique was coupled with other characterization methods in order to obtain more
information about the samples.
A Mettler Toledo T70 Titration Excellence was used for measuring the acidity of the samples
using a titrant solution of 0.05 M KOH in 2-propanol and water. In this method, between 0.5 and
0.7 g of sample is diluted with 60 ml of solvent composed by 50 % toluene, 49.5 % 2-propanol
and 0.5 % of water. The vessel with the solution was placed in the auto-sampler tray and the
electrode, titrant dispenser and mixer were placed inside the vessel. The neutralization reaction
was monitored by potentiometry until reaching completion. Total Acid Number was reported by
the equipment depending on the amount of titrant used, its respective concentration and the amount
of sample used. Finally, Eq. 3.3 was used to calculate TAN conversion (XTAN). The relative error
for the TAN measurement is 3% for TAN>50 mgKOH/g, 10% for TAN ranging between 1-
5 mgKOH/g and 20% for TAN<1 mgKOH/g.
𝑋𝑇𝐴𝑁[%] = (1 −𝑇𝐴𝑁 𝑜𝑓 𝑠𝑎𝑚𝑝𝑙𝑒 [
𝑚𝑔𝐾𝑂𝐻𝑔 ]
𝑇𝐴𝑁 𝑜𝑓 𝑓𝑒𝑒𝑑 [𝑚𝑔𝐾𝑂𝐻
𝑔 ]) ∗ 100 Eq. 3.3
3.4.2. Water Content
In order to corroborate the correct separation of the water from the hydrocarbon product and
to quantify the water content on the heavy product for further calculations, the water content in the
bio-oil sample was determined by coulometric Karl-Fischer (K-F) following the procedure
described by Carbognani, et. al.73 This procedure is a modification of the ASTM D4928 method
where tetrahydrofuran (THF) is used as a solvent for homogenization purposes.74

32
In this method, approximately 0.5 g of sample diluted in 10 mL of THF were agitated until
the bio-oil was completely dissolved. A known mass of this solution was injected into the Karl-
Fischer Mettler Toledo Model DL-32. Later on, the water content was determined from the current
generated by titration of the sample with the K-F reagent applying the calibration for the
equipment.
3.4.3. Product Distribution
Product Distribution for oils provides the quantity of the weight fractions that can be distilled
at different temperatures. This is directly related to the economic value of the oil because the
fractions that can be distilled at lower temperature are easier to process and transform into valuable
products. This property is very important when defining the upgrading scheme required to process
the feedstock.75
Simulated Distillation (SimDist) was used to obtain the liquid product distribution following
the ASTM D-7169-05 norm76 with an in-house modification by Carbognani et al.77 In this method,
1 μL of a solution prepared with 150 mg of sample diluted in 20 mL of CS2 and previously filtered
with a 0.45 μm membrane was injected in an Agilent 6890N chromatograph instead of 0.2 μL as
established in the ASTM norm. The chromatograph is equipped with an automatic injector, a PTV
injection port and a 5 m x 0.53 mm metallic capillary column with a 0.1 μm film methyl silicone
stationary phase (Ref. P/N SS 112-102-01 from Separation Systems Inc). The in-house norm
modification was made to reduce from 25% to 5% the volumetric error from the injection of the
sample. Also, to diminish the volumetric error due to the potential presence of nanoparticles. For
example, the presence of 100 nm particles can result in a 20% error when 0.2 μL of sample are
injected.77 Using SimDist, the liquid distribution of an oil can be determined. Also, the conversion
for a product at 343°C+ can be determined using Eq. 3.4 where VGO is the oil fraction that boils
above 343 °C and Residue is the oil fraction with boiling point above 550 °C. The error of this
characterization technique is 1% for the light fractions (<550 °C) and 4% for heavier fractions
(>550 °C).78
𝑋343°C+ [%] = ( 1 −𝑉𝐺𝑂 + 𝑅𝑒𝑠𝑖𝑑𝑢𝑒 𝑜𝑓 𝑠𝑎𝑚𝑝𝑙𝑒
𝑉𝐺𝑂 + 𝑅𝑒𝑠𝑖𝑑𝑢𝑒 𝑜𝑓 𝑓𝑒𝑒𝑑) ∗ 100 Eq. 3.4

33
The feedstock and products obtained from lignocellulose biomass contain a great quantity of
polar molecules.14 These molecules are not completely soluble in nonpolar solvents such as CS2.
In this way, to account for the CS2-insolubles left out, samples were filtered and a quantification
of the insolubles was done. For that purpose, approximately 1 g of sample was diluted in 100 mL
of CS2. The solution was passed through a 0.45 μm membrane (previously weighted) using a
vacuum pump to accelerate filtration. When all the solution was filtrated, the membrane plus the
solids were dried in a VWR oven at 80 ºC. Finally, the membrane and solids were weighted and
the CS2-insolubles were calculated as a percentage of the initial sample following Eq. 3.5.
𝐼𝑛𝑠𝑜𝑙𝑢𝑏𝑙𝑒𝑠 𝑖𝑛 𝐶𝑆2 [%] = 𝑀𝑎𝑠𝑠 𝑜𝑓 𝑓𝑖𝑙𝑡𝑒𝑟𝑒𝑑 𝑠𝑜𝑙𝑖𝑑𝑠 [𝑔]
𝑀𝑎𝑠𝑠 𝑜𝑓 𝑠𝑎𝑚𝑝𝑙𝑒 [𝑔]∗ 100 Eq. 3.5
3.4.4. Viscosity
A Brookfield viscometer model DV-II+ Pro coupled with a water recirculation system model
TC-502 was used to determine dynamic viscosity. The temperature range for the equipment is
between 0 and 100 ºC. The measurement starts by setting up the temperature controller at 40 ºC.
Next, the spindle or the measuring device was screwed to the bottom of the motor and the
viscometer was closed with the sample cell. Once the temperature was reached, the gap between
the bottom of the sample cell and the spindle was adjusted to a value of 0.1 mm. Then, an amount
of sample enough to cover the surface of the spindle was placed in the sample cell. The viscometer
was closed and the rotation engine was started. The rotation speed was adjusted until reaching a
torque of 50-70%. The shear is generated by the cohesive forces between the fluid and the metal
plates. Rotation was continued until the spindle completed at least 5 full rotations to guarantee
proper formation of the fluid film. Finally, the dynamic viscosity (in cP) was reported by the
equipment. Viscosity reduction can be determined using Eq. 3.6. The relative error for the viscosity
measurement is ± 5%.
𝑉𝑖𝑠𝑐𝑜𝑠𝑖𝑡𝑦 𝑟𝑒𝑑𝑢𝑐𝑡𝑖𝑜𝑛 [%] = (1 −𝑉𝑖𝑠𝑐𝑜𝑠𝑖𝑡𝑦 𝑜𝑓 𝑠𝑎𝑚𝑝𝑙𝑒 [𝑐𝑃]
𝑉𝑖𝑠𝑐𝑜𝑠𝑖𝑡𝑦 𝑜𝑓 𝑓𝑒𝑒𝑑 [𝑐𝑃]) ∗ 100 Eq. 3.6
3.4.5. Thermogravimetric Analysis (TGA)
Thermogravimetric analysis consists on analyzing the heat and weight changes experienced
by a liquid or solid sample when submitted to an increase of temperature under the flow of a gas.

34
For this method, a DT Q 600 system from “Thermal Analysis Instruments Company” was used.
The oil sample (approx. 10 mg) is heated at 10 ºC/min up to 1000 ºC under a nitrogen flow of 100
Std. mL/min. The equipment produced data for weight loss, differential mass loss, heat flow and
differential heat flow for different temperatures.
3.4.6. CHN Elemental Analysis
A Perkin Elmer 2400 CHN Analyzer was used to determine the elemental composition of
carbon, hydrogen and nitrogen of the samples. The composition of these elements was used to
determine the H/C ratio and the percentage of oxygen removed of the samples, the later determined
by difference since sulphur contents are negligible. This characterization technique was conducted
in the Department of Chemistry Instrumentation Facility at the University of Calgary following
the ASTM D5291 norm.79 In this method, the combustion of the sample to form CO2, H2O and
NOx was reached at very high temperature (1000 °C) in a combustion tube loaded with an oxidation
catalyst. Next, NOx was reduced to N2 in a reduction tube and passed through a separation column
to be detected by a thermal conductivity detector (TCD). Finally, the composition of carbon,
hydrogen and nitrogen were determined using a standard chemical as reference and oxygen was
calculated by difference of the other elements. To evaluate the conversion of oxygen, the degree
of deoxygenation (DOD) was defined following Eq. 3.7. The relative error for each component is
different, for carbon is 0.5%, for hydrogen is 2% and for oxygen is 3%.
The high heating value (HHV) of a bio-oil is defined by the formula presented in Eq. 3.8.9
𝐷𝑂𝐷 [%] = (1 −𝑂𝑥𝑦𝑔𝑒𝑛 𝑐𝑜𝑛𝑡𝑒𝑛𝑡 𝑖𝑛 𝑝𝑟𝑜𝑑𝑢𝑐𝑡 [𝑤𝑡. %]
𝑂𝑥𝑦𝑔𝑒𝑛 𝑐𝑜𝑛𝑡𝑒𝑛𝑡 𝑖𝑛 𝑓𝑒𝑒𝑑 [𝑤𝑡. %]) ∗ 100 Eq. 3.7
𝐻𝐻𝑉 [𝑀𝐽
𝑘𝑔] = 0.335(𝐶) + 1.423(𝐻) − 0.154(𝑂) − 0.145(𝑁) Eq. 3.8
3.4.7. Microcarbon residue (MCR)
Microcarbon residue (MCR) determines the carbon residue remaining after evaporation and
pyrolysis of an oil under given conditions. This property is an indicative of the coke forming
tendency of an oil under thermal degradation conditions.

35
MCR was determined using the muffle furnace method developed by Hassan, Carbognani and
Pereira-Almao.80 This method is an in-house modification of the ASTM norms (ASTM D-189, D-
524 and D-4530) which reduces the analysis time and increases the samples turnaround. For this
analysis, between 10 and 20 mg of sample were weighted in a 2 mL glass vial on a 5-digits Mettler
Toledo XS 205 balance. Each sample was weighted twice. Vials were placed on the sample
platform assembly inside the muffle furnace. The platform is equipped with 26 nitrogen injection
tubes (1 per sample) to create an oxygen free environment. Next, vials were covered with a glass
cover with a 1/8” orifice in the middle and the nitrogen flush was started with a flow of 900 mL/min
for 45 min to purge the air from the furnace. Then, the temperature was increased at a rate of 10
°C/min until reaching a temperature of 520 °C that was maintained for 20 min. Finally, the furnace
was let to cool down, vials were weighted and MCR weight percentage was calculated following
Eq. 3.9. The relative error for this analytical technique is 2%.
𝑀𝐶𝑅 [%] = 𝑀𝑎𝑠𝑠 𝑜𝑓 𝑠𝑎𝑚𝑝𝑙𝑒 𝑎𝑓𝑡𝑒𝑟 ℎ𝑒𝑎𝑡𝑖𝑛𝑔 [𝑔]
𝑀𝑎𝑠𝑠 𝑜𝑓 𝑠𝑎𝑚𝑝𝑙𝑒 [𝑔]∗ 100 Eq. 3.9
3.4.8. Fourier-transform Infrared spectroscopy (FTIR)
Infrared spectroscopy is one of the most sensitive techniques for studying the functional
groups in solid and liquid samples.81 It is used to study the chemical footprint and main functional
groups present in oils. In this research, FTIR was vital to determine the acid reduction of the bio-
oil, more specifically, the phenols and carboxylic acids present in the feedstock.
FTIR spectra were recorded using an IRAffinity-1S spectrometer from Shimadzu. Samples
for FTIR were prepared by weighting 150 mg of oil in 10 mL of carbon tetrachloride (CCl4). This
solvent was selected because it is transparent in the 1000 to 4000 cm-1 wavelength range to avoid
its interference with the peaks of interest. The background was measured before each analysis with
a CaF2 cell containing CCl4 (dichloromethane was used for cleaning). Next, each sample was
injected in the same CaF2 cell and immediately put inside the chamber to acquire the spectrum that
ranged between 1000 to 4000 cm-1. All spectra were baseline corrected in a systematic way to
avoid subjective influence. Also, spectra were normalized by bringing the strongest absorbing
spectra signal to 10 % of transmittance. In this way, spectra for all the samples can be compared

36
between them and their relative intensities can provide information concerning chemical changes
during hydroprocessing.
The most important bands taken into consideration in this work are shown in Figure 3.3. The
band assignment is based on Silverstein’s work and it will allow the understanding of the behavior
of compounds of interest during the processing of the bio-oil.82 Region #1 is assigned to the ethers
and they are specifically located between 1350 and 1150 cm-1. Following the ethers band, there is
region #2 that represents the C=O acids, more specifically, the carboxylic acids. In this region,
there is two bands, the one at 1710 cm-1 is assigned to intermolecular bonded carboxylic acids
while the one at 1740 cm-1 corresponds to the free C=O acids. Lastly, region #3 is allocated to
phenol OH groups. The first band near 3600 cm-1 depicts phenols with no intermolecular hydrogen
bonding and the second band near 3550 cm-1 corresponds to vibrations for phenol groups forming
intermolecular hydrogen bonds with other molecules.
Figure 3.3. FTIR spectra for bio-oil with the most important bands
In this research, to calculate the carboxylic acids and phenols reduction, the transmittance
given by FTIR was used. Since each compound is assigned to two bands, the first step was to
obtain the transmittance for the bands of interest with the computer software from the FTIR. Then,

37
the two bands were averaged for the products obtained by hydrotreating and for the feedstock.
Once we had the average of the transmittance for each compound, Eq. 3.10 was used to calculate
the reduction of carboxylic acids and phenols separately.
𝐴𝑐𝑖𝑑 𝑟𝑒𝑑𝑢𝑐𝑡𝑖𝑜𝑛 [%] = 𝑇𝑟𝑎𝑛𝑠𝑚𝑖𝑡𝑡𝑎𝑛𝑐𝑒𝑓𝑒𝑒𝑑 − 𝑇𝑟𝑎𝑛𝑠𝑚𝑖𝑡𝑡𝑎𝑛𝑐𝑒𝑝𝑟𝑜𝑑𝑢𝑐𝑡
𝑇𝑟𝑎𝑛𝑠𝑚𝑖𝑡𝑡𝑎𝑛𝑐𝑒𝑓𝑒𝑒𝑑∗ 100 Eq. 3.10
3.4.9. Pre-asphaltenes stability
One similarity of crude oil and bio-oil is that both have polyaromatic oxygentated compounds,
deriving from lignin decomposition, suspended or peptized in the media by smaller similar
molecules. These large molecules could tend to precipitate when submitted to a high severity
process that could change the peptizing medium. To determine the stability of these molecules
after reaction in the products, a small drop of sample was transferred with a clip to a microscope
slide and covered with its corresponding cover slip. Then, the sample was examined in an optical
digital microscope model DC3-163 supplied by National Instruments with a magnification of 40X
for visual discard or confirmation of precipitated solids. It is important that the microscope slide
is heated to guarantee that paraffins, if existing, are melted and are not confused with stable solid
precipitates.
3.4.10. Gas Analysis
In order to determine the molar composition of the gases generated in the hydrotreating
process it is necessary to perform Gas Analysis. A SRI Instruments chromatograph model 8610C
was used, equipped with 4 columns, 2 TCD detectors, 2 switching valves, 1 flame photometric
detector (FPD) and 1 flame ionization detector (FID). The first TCD contains a set of 183 cm
molecular sieve column model MS13X and a silica gel column of the same length. The first TCD
is operated with helium as a carrier gas to detect hydrocarbons within the C1-C5 range, hydrogen
at high concentrations and permanent gasses such as CO2 and CO. Hydrogen and helium have
similar conductivity, therefore it is difficult to detect low concentrations of H2 using He as carrier
gas. In this way, the second TCD uses argon as carrier gas to detect hydrogen at low concentrations
using a 3 feet molecular sieve column model MSX13X. Sulphur compounds can be detected with
the FPD detector. Finally, to quantify the amount of light hydrocarbons within the C1-C5 range,
the FID detector can be used. Both FPD and FID detectors operate with a mixture of hydrogen and

38
air as carrier and use a 60 m capillary column model MXT1. The calibration of the system was
done using standard calibration gases with known and certified compositions provided by Praxair.
The relative errors between the gas composition from the standards and the values determined by
the equipment are presented in Table 3.2. Standard 1 was used for the first 4 gases presented in
Table 3.2 (H2, CO, CO2 and CH4) while Standard 2 was used to calibrate the rest of the gases. It
is important to mention that the error is higher when the real composition of the gas is considerably
higher or lower than the values from the standard.
Table 3.2. Relative error for gas chromatography
Component Standard 1 (% mol) Standard 2 (% mol) Relative Error (%)
Hydrogen (H2) 13.60 10.00 3.4
Carbon monoxide (CO) 0.00 15.00 0.6
Carbon dioxide (CO2) 3.99 10.00 0.9
Methane (CH4) 3.99 5.00 0.5
Ethane 15.90 5.00 0.8
Ethylene 1.50 0.00 1.4
Propane 8.21 0.00 0.9
Propylene 3.10 0.00 1.0
n-Butane 2.60 0.00 1.3
i-Butane 1.00 0.00 1.4
1-Butane 2.39 0.00 1.5
i-Pentane 0.10 0.00 6.5

39
Chapter 4: Results and Discussion
In this chapter, the results obtained from hydroprocessing the bio-oil are presented. Through
this research, test run or reaction (R1) was performed to study the effect of the total operating
pressure in the reaction and products quality. Once the operating pressure was selected, reaction #2
(R2) was carried out to assess the temperature and space velocity effect in the products quality and
more specifically, in the acids reduction. Next, reaction #3 (R3) was used to evaluate the effect of
increasing the temperature on the properties of the products. Then, a dual-catalyst bed
configuration was tested in reaction #4 (R4) to test the catalyst effect on the acids reduction.
Finally, one last catalyst was tested in reaction #5 (R5) to compare the effect of different catalysts
on the quality of the products. A summary of the pilot plant information for the reactions carried
out is presented in Appendix II. Moreover, the results presented for each condition tested in the
present research were for 3 or more mass balances collected after a stability time, i.e. at steady
state.
The 5 catalytic experiments were performed using 4 different in-house formulated
hydroprocessing catalysts identified as CAT-M2, CAT-M3, CAT-M3+ and CAT-M4. The
catalysts were synthesized and provided by Dr. Gerardo Vitale from the CAFE research group and
details about their preparation and formulation cannot be provided to secure patentability.
CAT-M2 was used in the first reaction and contains a highly-dispersed hydrogenating metal
supported on a Lewis-type ceramic acidic phase. CAT-M3 was used in R2 and R3 and consisted
of a modified version of CAT-M2 that contained a higher amount of the hydrogenating metal
(~30% more). CAT-M3+ was the name given to the dual-catalyst bed configuration used in R4.
In this reaction, two catalysts were introduced inside the reactor. The first bed occupied 70% of
the reactor bed and contained pure CAT-M3, the same catalyst used in R2 and R3. The second bed
occupied 30% of the reactor bed and contained a solid herein named “+” that consisted of a
bifunctional catalyst having a Brønsted-type acidic phase and another hydrogenating metallic
phase capable of hydrogenating and cracking aromatic compounds. Finally, CAT-M4 consisted
of a modified version of CAT-M3 that involved the addition of a second active hydrogenating
component, where the first metal composition remained the same as in CAT-M3.

40
4.1. Effect of the total operating pressure
As a first step of the research, the effect of the total operating pressure on the quality of the
products was assessed. Trujillo in her MSc. Thesis evaluated different operating conditions for the
hydrogenation of Steeper bio-oil and found that by using CAT-M2, the lowest TAN value was
achieved at 310 °C, 0.2 h-1 and 1400 psig.21 This was the starting point for the study of pressure.
It is reported in the literature that a high pressure range, between 430 and 2600 psig, is used for
HDT reactions.61 However, the higher the hydrogen pressure used for this process, the higher the
safety issues and costs associated due to expenses for high-pressure vessels among other
requirements.8 Hence, pressures lower than 1400 psig were evaluated to see if the same or better
qualities could been obtained at different conditions. The experiment started with a pressure of
1400 psig, followed by 1200 psig, 900 psig and the last pressure evaluated was back to 1100 psig
at constant temperature of 310 °C, space velocity 0.2 h-1 and using CAT-M2.
Table 4.1 shows the results obtained for some properties of the hydrotreated-bio-oil (HDT-
bio-oil). From this table, it is observed that the TAN conversion is similar for 1400 psig, 1200 psig
and 1100 psig, while for 900 psig there is a significant difference. In general, the 900 psig condition
showed a lower quality HDT-bio-oil as noticed when comparing the viscosity, conversion, MCR
and oxygen content reduction. Comparing the viscosities, the lower value was obtained at 1100
psig followed by the one obtained at 1400 psig. Nevertheless, the values for conversion at 343 °C+,
MCR and DOD for the 1100 psig condition were poorer than for 1200 psig and 1400 psig. As a
general conclusion from the results presented in Table 4.1, it seems that the TAN conversion,
MCR, conversion and DOD reached a plateau when submitted to pressures higher than 1200 psig.
Another aspect that is important to highlight is that pressure 1100 psig was tested after 900
psig. The DOD obtained for 900 psig is higher than for 1100 psig, which could mean that the
catalyst could have deactivated when submitted to a pressure of 900 psig. Other possible
explanation could be the error associated to the calculation of the DOD, which carries the error of
the equipment plus the error of the oxygen calculation by difference from the other elements.

41
Table 4.1. Characterization of HDT-bio-oil at 310 °C, 0.2 h-1 and different operating pressures
Property
Pressure [psig]
Feed 1400 1200 1100 900
TAN Conversion [%] - 80.8 81.9 80.9 76.9
Viscosity [cP] @ 40 °C 31172 9622 11513 7586 17148
Conversion 343 °C+ [wt. %] - 19.6 20.9 17.1 15.3
MCR [wt. %] 22.01 17.41 17.57 18.31 18.31
DOD [%] - 38.3 43.3 30.8 34.0
Even though 1200 psig appears to be the best operating pressure in terms of most of the
properties and will pose as a more economical option compared with 1400 psig, some other
parameters need to be taken into consideration before making a conclusion about the best pressure
for the hydrotreating process. Two parameters that indicate the hydrogenation level of a reaction
are the H/C ratio of an oil and the paraffin to olefin ratio of a hydrotreated product. Figure 4.1
shows the H/C ratio and butane/butene ratio of the HDT products at different pressures.
Figure 4.1. H/C ratio and butane/butene ratio vs operating pressure for HDT-bio-oil. H/C ratios
determined over the liquid product; C4/C4= determined over the associated gas phase
0
2
4
6
8
10
12
Feed 1400 1200 1100 900
1.30
1.32
1.34
1.36
1.38
1.40
1.42
1.44
Bu
tan
e/B
ute
ne
rati
o [
mo
l%]
Pressure [psig]
H/C
rat
io [
mo
lar]
H/C C4/C4=

42
As seen in Figure 4.1, the H/C ratio increased as the operating pressure increased. At 900 psig
the H/C ratio was improved by 0.02 points while at 1400 psig it was enhanced by 0.06 points.
Furthermore, the butane/butene (C4/C4=) ratio also incremented as the pressure increased. The
slope for the C4/C4= ratio sharply increased from the HDT-bio-oil at 1200 psig to 1400 psig
meaning that the hydrogenation at 1400 psig was greatly improved.
Finally, the pressure selected for continuing this research was 1400 psig due to its
improvement on the hydrogenation performance reflected both in the high H/C ratio and the lowest
MCR. The next objective was to temperature and space velocity as these parameters also have
great influence on the reaction. The 1400 psig pressure was selected to ensure a higher solubility
of hydrogen in the oil and a higher availability of hydrogen near the catalyst62 to avoid coke
formation due to an increase in the the severity of the reaction.
4.2. Temperature and space velocity screening
After the pressure was set to 1400 psig, a screening of temperature and space velocity was
done in reaction #2. Figure 4.2 presents a diagram with the changes of temperature and space
velocity during R2. For this reaction, a new catalyst formulation (CAT-M3) with a higher
composition of the hydrogenation metal was tested. R2 started with the best conditions tested
before: 310 °C, 0.2 h-1 and 1400 psig.
One of the goals of this screening was to obtain a product with zero TAN for further processing
in CSC. Nevertheless, some limitations were encountered with the equipment available in the
laboratory when trying to analyze samples with a TAN value lower than 2 for bio-oils. Thus, to
analyze the acidity of the HDT-bio-oil, FTIR was used. A correlation between these two
characterization techniques was performed and is presented in Section 4.2.3. Secondly, the catalyst
lifetime was also tested in R2, which was a long run test that lasted 55 days. The results obtained
for the catalyst lifetime are presented in Section 4.2.4. For this study, the same condition was
evaluated at the beginning of the reaction, in the middle of the reaction and at the end of the
reaction as it can be seen in Figure 4.2.
From Figure 4.2, it can be observed that the first stage of R2 was the temperature screening,
where temperatures between 295-325 °C were tested at 1400 psig, 0.2 h-1 using CAT-M3. The
second stage was to evaluate the space velocity between the 0.2-0.5 h-1 range at 315 °C. An

43
additional condition (320 °C, 0.3 h-1) was also studied in this stage. Finally, as aforementioned, the
last condition tested (310 °C, 0.2 h-1) was carried out with the objective of evaluating the catalyst
lifetime.
Figure 4.2. Temperature and space velocity changes during R2. In order to verify the stable
behavior of the catalyst the return of the initial condition was performed twice with the last one
being at the end of the whole test run.
4.2.1. Temperature effect
A temperature screening between 295-325 °C was performed to study the effect of the
temperature on TAN conversion of bio-oils, while monitoring viscosity and solids stability to
avoid extensive cracking of the feedstock.
Figure 4.3 presents the results obtained for TAN conversion and viscosity reduction at
different temperatures. It can be observed that the TAN conversion for CAT-M3 started at 80 %
when submitted to a temperature of 295 °C and increased as the temperature increased to the point

44
of almost reaching 100 % TAN conversion. It is important to mention that the TAN value for
temperatures higher than 310 °C were calculated using the correlation developed in this research
because of the limitations encountered trying to detect a TAN value lower than 2 mgKOH/g with
the standard titration procedure.
When comparing the TAN conversion (81 %) obtained for R1 at 310 °C using CAT-M2 with
the one obtained for R2 (95 %) it is noticeable that the hydrogenating metal composition did affect
positively the catalyst performance. Moreover, the viscosity reduction obtained in R1 was 70 % at
310 °C, 1400 psig and 0.2 h-1 whereas the one achieved in R2 for the same operating conditions
was 80 %, supporting the fact that CAT-M3 performed better for hydrotreating bio-oil than CAT-
M2.
Figure 4.3. Effect of the temperature on the TAN and viscosity reduction (1400 psig, 0.2 h-1).
Viscosities were determined at 40°C
Regarding the effect of the temperature on the viscosity reduction, Figure 4.3 shows that the
viscosity reduction followed the same trend as the TAN conversion, as the temperature increased,
the viscosity reduction increased. The maximum viscosity reduction reached in this reaction was
30
40
50
60
70
80
90
100
110
50
55
60
65
70
75
80
85
90
95
100
290 300 310 320 330
Vis
cosi
ty R
edu
ctio
n [
%]
TAN
Co
nve
rsio
n [
%]
Temperature [°C]TAN Reduction Viscosity Reduction

45
95 %. The differential of the viscosity reduction between 295 °C and 300 °C seems to be more
severe than for the other temperatures. One explanation for this could be that there are
intermolecular bonds between some molecules in the feedstock such as carboxylic acids and
phenols that are broken when they are expose to a thermal process. These bonds could make two
light molecules pose as one heavy molecule or aggregate when measuring the viscosity. This
hypothesis can be supported by FTIR where the vibrations of each molecule are detected
separately.
Figure 4.4 shows the FTIR spectra for bio-oil and HDT-bio-oil at the lower (295 °C) and
higher (325 °C) temperatures tested. In both bio-oil and HDT-bio-oil, there are free and bonded
OH stretching signals as well as free and bonded C=O acid bands. The bonded peaks, as indicated
by the arrows in Figure 4.4, correspond to molecules that are forming intermolecular hydrogen
bonds.82 From this figure, it seems that the intermolecular bonds are mainly formed between
phenols and C=O acids, i.e. when acids were reduced, bonded phenolic –OH decreased despite the
total phenolic –OH remained constant. In the case of the HDT-bio-oil, the phenol bonded peak
was severely reduced for both temperatures and it seems that was converted to free phenols,
meaning that intermolecular bonds were being broken while maintaining a similar phenol
composition to the original feedstock. As for the C=O acid peaks, both free and bonded bands
were significantly reduced for both temperatures which supports the proposition that the hydrogen
intermolecular bonds were being cleaved by thermal or catalytic effects.
In Figure 4.4, it can be noticed a difference in the intensity of the C=O acid peaks for the 2
temperatures evaluated. HDT-bio-oil at 295 °C has a higher C=O acid peaks compared to HDT-
bio-oil at 325 °C. This is also supported by the difference in TAN conversion achieved for each
condition. However, the phenol peak at 325 °C remained similar as the one at 295 °C. When
calculating the phenol reduction for each condition evaluated, the maximum phenol reduction
achieved was 11 % of the original composition of the feedstock. Hence, in the conditions studied
in this reaction, the phenols were not significantly reduced as it was expected, because it is reported
by several authors that phenols are not hydrotreated at temperatures lower than 350 °C.15, 17

46
Figure 4.4. FTIR spectra for the feedstock (bio-oil) and HDT-bio-oil at two temperatures.
Figure 4.5 shows the carboxylic acids reduction versus the degree of deoxygenation for HDT-
bio-oil at the temperatures evaluated in R2. It can be observed that the C=O acids reduction follows
a linear trend with the DOD, presenting a correlation factor of 0.9713. Since the data plotted in
Figure 4.5 was obtained from experimental work, the correlation factor shows that the linear trend
is a good fit.
The linearity found between the C=O acids reduction and DOD supports the results obtained
by FTIR for acid compositions. The DOD is a parameter that takes into consideration the total
oxygen removal from the feedstock. From literature review, it is known that the main compounds
found in bio-oils are acids and phenols,39, 42 which means that oxygen atoms are primarily
converted from the carboxylic acids and some phenols. The results found by FTIR showed that the
maximum phenols reduction was 11 % while the maximum C=O acids reduction was 98 %.
Because the C=O acids reduction was around 9 times higher than the phenols reduction, poor
phenols removal did not affect significantly the linearity between C=O acid reduction and DOD.

47
Figure 4.5. Carboxylic acids reduction vs DOD for HDT-bio-oil at different temperatures.
Values in parenthesis are set up experimental temperatures
The changes of the H/C ratio and O/C ratio with the DOD are presented in Figure 4.6. As it
was expected, the O/C ratio follows a linear trend with the DOD and with a high correlation factor
of 0.9997. As the DOD increases, the O/C ratio of the HDT-bio-oil decreases, whereas the H/C
ratio increases. Both trends are indications of the deep hydrogenation achieved in the process using
CAT-M3. The maximum H/C ratio obtained was 1.47, which is closer to the value of an H/C ratio
from a typical crude oil. Nevertheless, the minimum O/C ratio obtained was 0.04, still far above
from the ones usually found for crude oils (0.01).
In order to check the samples stability and solids presence of the HDT-bio-oil, microscopic
images (see description of method, equipment and augmentation to obtain this images in
experimental part), shown in Figure 4.7, were taken for the feed and the product of the higher
temperature studied in R2 (325 °C). Comparing the microscope images for the feed and the HDT-
bio-oil at 325 °C, it can be noticed that there is no solid precipitation in the HDT-bio-oil. This
means that up to 325 °C the solids in the bio-oil are still stable and there is no risk of plugging the
reactor.

48
Figure 4.6. H/C ratio and O/C ratio vs DOD for HDT-bio-oil at 1400 psig, 0.2 h-1 using CAT-M3
Figure 4.7. Microscope images at 40 X for the bio-oil feed (left) and HDT-bio-oil at 325 °C
(right)
The hydrogen consumption and the water yield as a function of the degree of deoxygenation
in R2 are presented in Figure 4.8. As it was expected, both parameters increased as the DOD
y = -0.0011x + 0.1016R² = 0.9997
y = 0.0016x + 1.3562R² = 0.9289
1.34
1.36
1.38
1.40
1.42
1.44
1.46
1.48
0.000
0.020
0.040
0.060
0.080
0.100
0.120
0.0 10.0 20.0 30.0 40.0 50.0 60.0 70.0
H/C
[m
ola
r]
O/C
[m
ola
r]
DOD [%]
O/C H/C

49
increased and have a linear relation with the oxygen reduction. However, the slope for the H2
consumed is more than 2 times higher than the slope for the water yield. This means that more
than half of the H2 consumed in the reaction was not used for the hydrodeoxygenation reaction
that removes oxygen and produces water as a secondary product without breaking the hydrocarbon
chain.52 From the preceding, more than one half of the hydrogen was then consumed in the other
reactions regarding hydrotreating such as hydrodecarbonylation, hydrodecarboxylation and
secondary reactions like methanation or saturation of olefins. The secondary products from these
reactions are carbon monoxide, carbon dioxide, methane and water. CO, CO2 and methane
compositions can be followed by analyzing the gases produced in the hydrotreating process.
Details about how hydrogen consumption was calculated are presented in Appendix III.
Figure 4.8. Hydrogen consumption and water yield vs DOD for HDT-bio-oil in R2
Figure 4.9 shows the gas yield distribution for different temperatures in R2. In this graph, the
CO2 yield increased from 300 °C to 310 °C and stayed in a similar composition for the other
temperatures. The methane yield remained between 0.6 and 1.0 % throughout all the reaction,
which led to think that methanation reaction was not promoted by increasing the temperature up
y = 0.2659x + 0.5951R² = 0.9528
y = 0.1054x + 0.4109R² = 0.932
0
2
4
6
8
10
12
0
2
4
6
8
10
12
14
16
18
20
0 20 40 60 80
Wat
er y
ield
[%
]
H2
con
sum
pti
on
[m
g H2/g
oil]
DOD [%]
Hydrogen consumed Water yield

50
to 325 °C. The ethane and propane yield increased as the temperature was increased possibly due
to hydrocracking reactions promoted by higher temperatures. Conversely, the 1-butene yield
decreased as the temperature increased, meaning that the hydrogenation of olefins was enhanced
at higher temperatures. Finally, the butane yield increased from 1.7 to 2.8 % from the 300 °C to
the 310 °C temperature. Butane production could result from the dealkylation of alkyl structures
derived from lignin-produced bio-crudes.7 The increment of n-butane after reaching 310 °C is in
agreement with studies from the literature that have stated that alkylethers and phenolic ethers start
reacting after 300 °C under hydrotreatment conditions.17, 42
Figure 4.9. Gas yield distribution for different temperatures in R2
As a last result, Trujillo21 processed a HDT-bio-oil obtained in this step of the research, more
specifically, the one obtained at 320 °C, 0.2 h-1, 1400 psig using CAT-M3 and she found Figure
4.10. Trujillo processed 4 different feedstocks via CSC, using the same catalyst in all the runs, to
study the process and the catalyst deactivation: a bio-oil feed without hydrotreating, with a TAN
value of 48.2 mgKOH/goil, HDT-bio-oil-A, with a TAN value of 21.3 mgKOH/goil, HDT-bio-oil-B
with a TAN value of 11.6 mgKOH/goil and HDT-bio-oil-C with a TAN value of 1.2 mgKOH/goil. As
0.0
0.5
1.0
1.5
2.0
2.5
3.0
295 °C 300 °C 310 °C 315 °C 320 °C 325 °C
Gas
yie
ld [
%]
CO2 Methane Ethane Propane 1-Butene n-ButaneCO2

51
it can be seen in Figure 4.10, the catalyst used in bio-oil feed presented a rapid deactivation,
followed by the HDT-bio-oil-A and HDT-bio-oil-B. The HDT-bio-oil-C did not show any sign of
deactivation. When the TAN values trend is analyzed, it is noticeable that this parameter has an
effect on the CSC catalyst deactivation. Feedstocks with higher TAN values, promotes a faster
deactivation of the CSC catalyst.
It is important to highlight that the CSC catalyst must be stable to ensure a continuous
hydrogen production for recycling to the HDT process. Therefore, producing a high-quality HDT-
bio-oil (C) that did not deactivate the CSC catalyst was an achievement of this research.
Figure 4.10. TAN Reduction vs Time on Stream for CSC processing adapted from Trujillo.21
4.2.2. Space velocity effect
The space velocity screening was made at 315 °C, 1400 psig using CAT-M3 and a space
velocity range of 0.2-0.5 h-1. Also, an additional condition (320 °C, 1400 psig, 0.3 h-1) was tested
in reaction #2.
Space velocity is defined as the inverse of residence time and it is an important parameter that
could define the severity of a reaction. If the space velocity decreases, the residence time increases,

52
extending the contact time between the feed and the catalyst. This enhances the possibility of
hydrogenating reactions like hydrodeoxygenation occurring during hydroprocessing. Although
increasing the residence time of the bio-oil in the reactor could result in better hydrogenation of
bio-oil, a long residence time means less production per unit of time of the HDT-bio-oil when
using the same reactor size. This could be avoid by using a bigger reactor, however, it would mean
more capital cost. Therefore, it is important to study the effect of the space velocity on the
properties of the bio-oil to select the condition that uses the highest space velocity possible, i.e.
more production, while also maintaining a high HDT-bio-oil quality.
Table 4.2 shows the results obtained for the HDT-bio-oil at 1400 psig, 315 °C and different
space velocities using CAT-M3. The additional condition tested is presented in Table 4.3
compared with the feed and the condition with a lower space velocity (320 °, 0.2 h-1).
Table 4.2. Characterization of HDT-bio-oil at 1400 psig and 315 °C using CAT-M3. Cx
describes tested condition evaluated during R2 (See Figure 4.2)
WHSV [h-1] - 0.2 0.3 0.4 0.5
Temperature [°C] - 315 315 315 315
Property Feed R2C3 R2C8 R2C9 R2C10
TAN Conversion [%] - 96.6 91.5 86.1 82.7
Viscosity [cP] @ 40 °C 31172 4369 5989 7424 8462
Conversion 343 °C+ [wt. %] - 26.0 18.5 17.4 15.7
MCR [wt. %] 22.01 17.16 16.55 17.96 17.77
DOD [%] - 53.8 36.8 30.7 28.4
In both Table 4.2 and Table 4.3, it can be seen that increasing the space velocity diminishes
the quality of the HDT-bio-oil. TAN conversion, the conversion at 343 °C+ and DOD decrease as
the space velocity was increased. This was expected because when the space velocity is increased,
the residence time is decreased, and thus, if the contact time between the catalyst and the bio-oil
is shorter, the upgrading of the bio-oil will be less effective. The only property that did not showed
significant variations was the MCR value, which for both cases, remained approximately constant
when the space velocity was changed.

53
Table 4.3. Characterization of HDT-bio-oil at 1400 psig and 320 °C using CAT-M3
WHSV [h-1] - 0.2 0.3
Temperature [°C] - 320 320
Property Feed R2C2 R2C11
TAN Conversion [%] - 97.6 93.9
Viscosity [cP] @ 40 °C 31172 2566 5106
Conversion 343 °C+ [wt. %] - 29.6 19.6
MCR [wt. %] 22.01 16.90 16.64
DOD [%] - 55.0 39.6
The results obtained for the assessment of the space velocity effect on the product quality are
in agreement with previous studies found in the literature. For example, an investigation made by
Elliot et al. in a continuous flow reactor showed that the oxygen content was reduced from 21% to
10% when changing the WHSV from 0.70 to 0.25 h-1 using a Pd/C catalyst at 340 °C and 2000
psig.68
4.2.3. Correlation between TAN and Infrared absorptivity at 1710-1750 cm-1
Although TAN analysis is deemed to be an acceptable method to determine the acidity of bio-
oil, it is important to stress that the standard method (i.e.: ASTM D664) was originally developed
for measuring the acidity of petroleum-derived products, fundamentally the naphthenic acids.
Other chemical species present in bio-oil (e.g., sugars, furans, ketones, aldehydes, phenols) could
affect/contribute to the TAN values measured for these types of samples. Therefore, a second
method to detect the acids in the bio-oil samples such as FTIR should be used to corroborate the
TAN measurement.
When trying to determine the TAN value for some of the HDT-bio-oil samples obtained in
R2, some limitations were encountered using the equipment available in the laboratory. For
samples with low TAN value (<2 mgKOH/g), the equipment response was “Not-a-Number” and
it could be observed that the inflection point in the titration curves was undistinguishable by the
apparatus (see Figure 4.11, for instance). However, when the samples were analyzed by FTIR, the

54
band corresponding to the C=O acids was observed (Figure 4.12), meaning that the samples still
had some acids that the TAN equipment could not detect.
Figure 4.11. Graphic given by the TAN equipment for bio-oil feed (left) and HDT-bio-oil 315 °C
(right)
Figure 4.12. FTIR spectra of the bio-oil feed and HDT-bio-oil at 315 °C
To overcome the limitations presented by the TAN method and to minimize the possible error
of the TAN values for bio-oil samples, a correlation between FTIR analysis and TAN was carried
out. Figure 4.13 shows the linear correlation between transmittance obtained by FTIR and the
natural logarithm of TAN. The graph was made with results from the samples that were detected
by the TAN method (those with a TAN value higher than 2 mgKOH/g). The correlation factor for
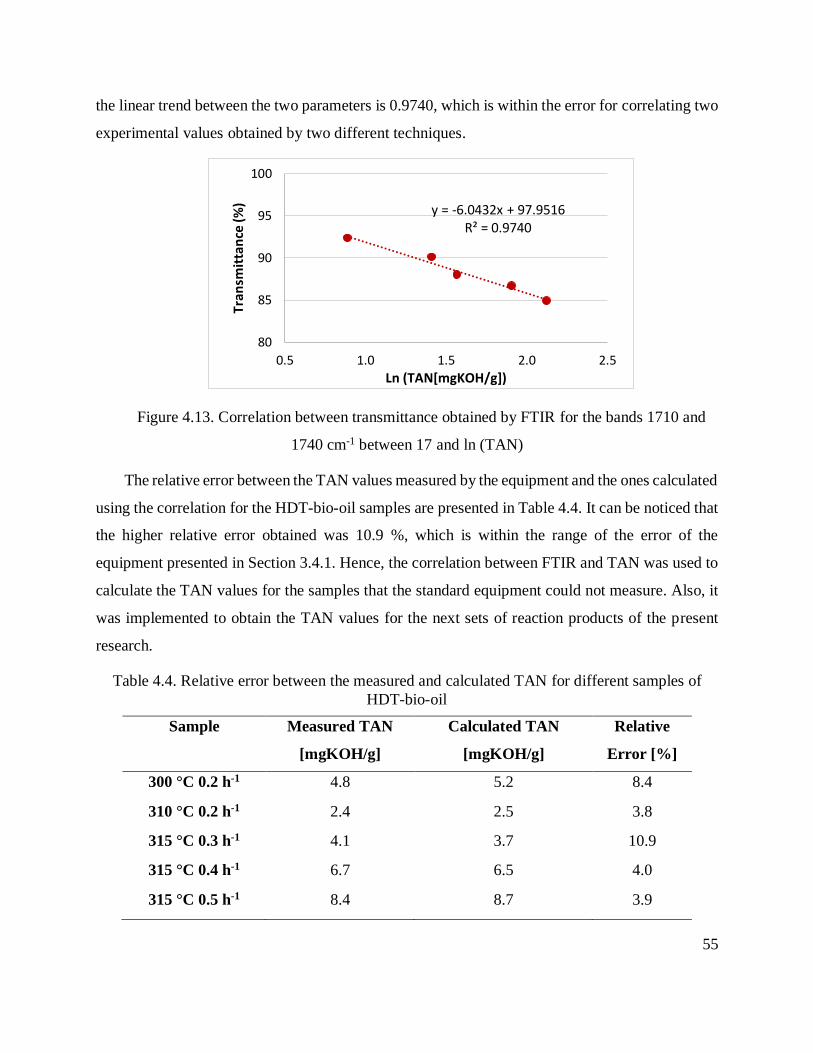
55
the linear trend between the two parameters is 0.9740, which is within the error for correlating two
experimental values obtained by two different techniques.
Figure 4.13. Correlation between transmittance obtained by FTIR for the bands 1710 and
1740 cm-1 between 17 and ln (TAN)
The relative error between the TAN values measured by the equipment and the ones calculated
using the correlation for the HDT-bio-oil samples are presented in Table 4.4. It can be noticed that
the higher relative error obtained was 10.9 %, which is within the range of the error of the
equipment presented in Section 3.4.1. Hence, the correlation between FTIR and TAN was used to
calculate the TAN values for the samples that the standard equipment could not measure. Also, it
was implemented to obtain the TAN values for the next sets of reaction products of the present
research.
Table 4.4. Relative error between the measured and calculated TAN for different samples of
HDT-bio-oil
Sample Measured TAN
[mgKOH/g]
Calculated TAN
[mgKOH/g]
Relative
Error [%]
300 °C 0.2 h-1 4.8 5.2 8.4
310 °C 0.2 h-1 2.4 2.5 3.8
315 °C 0.3 h-1 4.1 3.7 10.9
315 °C 0.4 h-1 6.7 6.5 4.0
315 °C 0.5 h-1 8.4 8.7 3.9
y = -6.0432x + 97.9516R² = 0.9740
80
85
90
95
100
0.5 1.0 1.5 2.0 2.5
Tra
nsm
itta
nce
(%)
Ln (TAN[mgKOH/g])

56
4.2.4. Catalyst Lifetime
One of the challenges faced by the process of hydrotreating bio-oil is the catalyst deactivation.
Conventional alumina-supported CoMo and NiMo catalysts are commonly used for HDO in the
sulfided form. However, because of the lack of sulphur compounds in the bio-oil feed, a decrease
in activity during time has been observed possibly due to transformation of the catalyst from
sulfided to an oxide form.17 Moreover, selective catalytic hydrogenation can also be carried out
with transition metal catalysts such as Pt, Rh and Pd supported in alumina. In this case, the catalysts
were reported to suffer from significant deactivation due to carbon formation.53
In order to evaluate the deactivation of the catalyst used for R2 (CAT-M3) that has the same
fundamental nature of CAT-M3+ and CAT-M4, a study of the catalyst lifetime was performed
throughout R2. As seen in Figure 4.2, the temperature 310 ºC was tested three times along the
length of the reaction to monitor eventual catalyst deactivation. Figure 4.14 presents the variation
of TAN Conversion with the time on stream during reaction #2 using CAT-M3.
Figure 4.14. TAN Conversion of the HDT-bio-oil vs time on stream in R2 using CAT-M3
70
75
80
85
90
95
100
0 200 400 600 800 1000 1200 1400
TAN
Co
nve
rsio
n [
%]
Time on stream [h]
310 °C310 °C 310 °C
320 °C315 °C
325 °C
300 °C
295 °C

57
It can be observed in Figure 4.14 that CAT-M3 did not deactivate within the 55 days of the
reaction. The first condition tested in R2 was 310 °C and resulted in a TAN conversion of 95 %,
after 810 hours on stream and increasing the temperature to reach 325 °C stepwise, the temperature
was lowered from this final high temperature to 310 °C to check the activity of the catalyst. The
second time 310 °C was tested, a TAN conversion of 95 % was reached, confirming that the
catalyst was still active after almost 34 days. Finally, the temperature of 310 °C was tested again
to check the activity of the catalyst at the end of the reaction. In this last condition, a TAN
conversion of 95 % was achieved for the third time, confirming that the catalyst did not deactivate
throughout all the reaction with modified conditions that lasted for a total of 55 days.
4.3. Increased severity evaluation
In R2, a TAN conversion of 98 % and an important upgrading of the bio-oil in terms of
properties like viscosity and DOD was reached. However, the maximum phenols reduction
achieved was 11%. Thus, reaction #3 was carried out to evaluate the effect of a higher increase in
temperature on the properties of the bio-oil and more specifically, the phenols reduction.
It is reported in the literature that the start-up temperature for hydrotreating phenols is
350 °C.15, 17 For this reason, the targeted temperature of R3 was set at 350 °C. Nevertheless, to
avoid possible reactor plugging due to coke formation, the temperature was increased gradually.
The operating conditions for this reaction were similar to the ones used in R2 (1400 psig, 0.2 h-1
using CAT-M3) with a range of temperature screening between 310-345 °C. The temperatures of
310 and 325 °C were tested to compare the catalyst performance in R2 and R3 because the catalyst
used for R3 corresponds to a second batch of the CAT-M3. Finally, it was not possible to reach
the targeted temperature of 350 °C due to solid formation in the HDT-bio-oil as will be explained
below.
Table 4.5 shows the results for the HDT-bio-oil at 325 °C, 1400 psig and 0.2 h-1 using CAT-
M3 in different reactions (R2 and R3). Comparing the results obtained in R2 with the ones obtained
in R3 at the same conditions, it is noticeable that a similar level of upgrading was reached in both
reactions using the same catalyst. The difference in all the properties presented in Table 4.5 are
within the error of the characterization techniques used to determine them. Another possible reason

58
for the minor differences between the results obtained in R2 and R3could be the error associated
to the pilot plant or the packing of the reactor between runs.
Table 4.5. Characterization of HDT-bio-oil at 325 °C, 1400 psig, 0.2 h-1 using CAT-M3 in
different reactions (R2 and R3)
Property Feed R2 R3
TAN Conversion [%] - 98.3 96.8
Viscosity [cP] @ 40 °C 31172 1561 2040
Conversion 343 °C+ [wt. %] - 28.73 28.27
MCR [wt. %] 22.01 15.35 15.09
DOD [%] - 59.8 62.1
The reduction of carboxylic acids and phenols for the temperatures tested in R3 are presented
in Figure 4.15. It can be observed that the carboxylic acids reduction increased as the temperature
increased whereas the phenols reduction remained constant in around 10 % from 325 to 335 °C
and it increased to 21 % at 340 and 345 °C, as it was expected because, as mentioned before, the
phenols conversion under hydrotreating conditions start at 350 °C.17 In this reaction, it was
possible to achieve a 100 % C=O acids reduction at 345 °C.
Figure 4.15. Carboxylic acids and phenols reduction for different temperatures in R3
0
10
20
30
40
50
60
70
80
90
100
325 330 335 340 345
Red
uct
ion
Per
cen
tage
[%
]
Temperature [°C]
Carboxylic acids reduction Phenols reduction

59
Figure 4.16 shows the carboxylic acids reduction versus the degree of deoxygenation for
HDT-bio-oil at the temperatures evaluated in R3. It can be noticed that the C=O acids reduction
follows a linear trend with the DOD with a correlation factor of 0.9126. This factor is not as good
as the one obtained for R2 (0.9713) and it is an expected result. In this reaction, the phenols
reduction was double than in R2, and since the DOD takes into consideration all the oxygen
removed from the feed, the DOD is impacted by both carboxylic acids and phenols. Thus, a
faultless linear relation between the C=O acids and the DOD should not be expected.
Figure 4.16. Carboxylic acids and phenols reduction vs DOD in R3
The idea of this reaction was to reach at least 350 °C in temperature being the other conditions
the same as those in R2. The increase of temperature in this reaction was made gradually because
at higher temperatures there is more risk of plugging the reactor due to solids formation. In order
to check the stability of the HDT-bio-oil, optical microscopy images were taken for the product
obtained at different temperatures.
Figure 4.17 shows the microscopic images taken for the temperatures tested in R3. It can be
observed that there is no solid formation at 325 °C. However, at 330 °C small solids precipitation
can be observed, meaning this is the start-up temperature for solid formation using CAT-M3. It
y = 1.2206x + 13.738R² = 0.9126
80
82
84
86
88
90
92
94
96
98
100
60 62 64 66 68 70 72 74
Car
bo
xylic
aci
ds
red
uct
ion
[%
]
DOD [%]

60
can also be noticed that at 340 and 345 °C the solid precipitation is more severe. At both
temperatures, the solids tend to agglomerate near the edges of the sample following a similar
behavior as asphaltenes.83 These solids could deposit in the surface and pores of the catalyst and
either deactivate the catalyst or plug the reactor. The solids formed from bio-oils are similar to the
coke formed from petroleum-derived oils since they consist of aromatic hydrocarbons with boiling
points between 350 and 650 °C.84
Figure 4.17. Microscope images at 40 X for the HDT-bio-oil at different temperatures in R3
Figure 4.18 presents the hydrogen consumption and water yield vs the DOD in R3. It can be
seen in the graph that both parameters seem to follow an exponential trend with respect the DOD.
Also, it is important to highlight the parallelism for both variables but in different ranges of values.
This could mean that as the severity of the reaction is increased, the hydrodeoxygenation reaction
is promoted over hydrodecarboxylation and hydrodecarbonylation. Additionally, it shows that the
milligrams of H2 consumed per gram of oil rise at increasingly higher rates as the DOD increases.

61
Figure 4.18. Hydrogen consumption and water yield vs DOD for HDT-bio-oil in R3
The gas yield distribution for different temperatures in R3 is presented in Figure 4.19. It can
be observed in this graph that methane, ethane and propane yields increased as the temperature
increased whereas the butane yield increased from 325 to 335 °C and then decreased when 345 °C
temperature was reached. Additionally, a sharp decrease in the 1-butene yield was observed when
the temperature was increased, reaching a concentration of zero for this olefin at 345 °C. When
comparing the gas distribution obtained from R2 with the one obtained from R3, it was noticed
that some CO production is found in R3 that could be formed by hydrodecarbonylation reactions
or by the undesired reverse water gas shift reaction. This reaction takes place by reacting CO2 with
hydrogen following Eq. 4.1.
𝐶𝑂2 + 𝐻2 ↔ 𝐻2𝑂 + 𝐶𝑂 Eq. 4.1
The reverse water gas shift reaction is favored with increase of temperature and because the
carbon dioxide yield remains constant when increasing the temperature, it is more plausible that
CO is formed by hydrocarbonylation reactions. Regarding other undesired reaction like
methanation, it is noticeable that the methane yield is increasing while the CO2 yield is decreasing
when the temperature is increased. In this case, methane could be resulting from the methanation
reaction presented in Eq. 4.2. Therefore, some of the oxygen was removed in the form of carbon
0
2
4
6
8
10
12
0
5
10
15
20
25
20 40 60 80
Wat
er y
ield
[%
]
H2
con
sum
pti
on
[m
g H2/g
oil]
DOD [%]Hydrogen consumed Water yield

62
dioxide from the bio-oil via the hydrodecarboxylation reaction, is consumed in-situ producing
methane via the methanation reaction shown in Eq. 4.2.
𝐶𝑂2 + 4𝐻2 ↔ 2𝐻2𝑂 + 𝐶𝐻4 Eq. 4.2
The presence of the methanation reaction at high temperatures is in agreement with the
literature and with the trend found from Figure 4.18.52 For methanation to occur, four molecules
of hydrogen must react with a molecule of carbon dioxide. Hence, there will be a sharp increase
on the miligrams of hydrogen consumed per gram of oil that will be used to produce methane and
water. Methane is not a desired product from the hydrotreating reaction point of view since it
consumes high quantities of hydrogen; its production must be avoided as much as possible.
Figure 4.19. Gas yield distribution for different temperatures in R3
4.3.1. Product distribution of the HDT-bio-oils
The liquid product samples obtained from hydrotreating bio-oil were analyzed via SimDist.
From the distillation profiles, the product distribution and the conversion at 343 °C were
calculated. Appendix II shows the distillation profiles for the analyzed samples.
0.0
0.2
0.4
0.6
0.8
1.0
1.2
1.4
1.6
1.8
325 °C 330 °C 335 °C 340 °C 345 °C
Gas
yie
ld [
%]
CO2 CO Methane Ethane Propane 1-Butene n-ButaneCO2

63
Due to the high polarity presented by some components of bio-oils, the feed and the HDT-
bio-oil were not fully miscible in the solvent used for the SimDist analysis (CS2). Thus, as
explained in Section 3.4.3, the samples were filtered to calculate the quantity of insolubles in CS2
per condition and to analyze the distribution of the insoluble by TGA. This insoluble material is
believed to contain most of the polar molecules originally present in the feed, more specifically,
polyphenols. The weight percentage of insoluble portion in CS2 obtained for the feed and HDT-
bio-oil in R2 and R3 are presented in Figure 4.20. It can be observed that the portion of insoluble
material does not follow a trend with respect to the temperature of the reaction and it ranges
between 3.5-7.8 wt. % in R2 and R3. Moreover, the insoluble material reduction achieved from
the feed to the HDT-bio-oil was between 60 and 80%.
Figure 4.20. Weight percentage of CS2 insoluble material at different temperatures in R2 & R3
To evaluate the insoluble material product distribution, a TGA in nitrogen was performed.
Figure 4.21 shows the TGA graph obtained for the CS2 insoluble material from the HDT-bio-oil
at 340 °C in R3. In order to compare the product distribution calculated from SimDist with the one

64
calculated by TGA, Carbognani et al. recently published a correlation between the two of them for
petroleum-derived oils. In this work, Eq. 4.3 was used to calculate the corresponding TGA
temperature for SimDist analysis. Thus, by having the TGA corresponding temperature for
SimDist, the product distribution or conversion can be calculated and compared with SimDist data.
The relative error derived from this conversion was determined to be ± 10 %.85
𝑆𝑖𝑚𝐷𝑖𝑠𝑡 𝑇𝑒𝑚𝑝𝑒𝑟𝑎𝑡𝑢𝑟𝑒 [°𝐶] = 1.36 𝑇𝐺𝐴 𝑇𝑒𝑚𝑝𝑒𝑟𝑎𝑡𝑢𝑟𝑒 [°𝐶] + 90 Eq. 4.3
The product distribution range of temperature for SimDist and the one calculated for TGA
using Eq. 4.3 are showed in Table 4.6. It can be noticed that the starting temperature for each cut
is lower for the TGA than for the SimDist. According to Carbognani et al.85 the TGA instruments
have an existing thermal cracking phenomena that breaks the molecules at lower temperature than
the SimDist.
Table 4.6. Temperature range for the product cuts determined via SimDist or TGA
Product Cut
Temperature range [°C]
SimDist TGA
Naphtha IBP-190 IBP*-73.5
Jet Fuel 190-260 73.5-125
Diesel 260-343 125-186
VGO 343-550 186-338
Residue 550+ 338+
IBP* is the IBP calculated with Eq. 4.3
Knowing that the starting temperature for the residue fraction in the TGA is 338 °C, from
Figure 4.21 it can be seen that at least 95 % of the insoluble material does not convert up to this
temperature. This result confirms that the CS2 insolubles contain mostly heavy polar aggregates
that are in the range of the residue fraction. Consequently, in all the products distribution and
conversions reported in the present research, the percentage of insoluble in the liquid sample was
added to the portion of residue obtained by SimDist.

65
Figure 4.21. TGA in N2 of the CS2 insoluble material from the HDT-bio-oil at 340 °C in R3
Figure 4.22 shows the product distribution and conversion at 343 °C+ calculated for different
temperatures in R2 and R3. Comparing the feed with the HDT-bio-oil products, it is observed that
between 3.5 and 5.8 % of the original bio-oil was converted to gases and between 5.2 and 8.8 %
was converted to water. The water yield increased as the temperature increased while the gas yield
did not follow a specific trend. Regarding the naphtha and VGO fractions, they were converted up
to 2 % compared with the feed. Nevertheless, the residue yield decreased significantly when the
temperature increased and the diesel fraction showed a meaningful increased at higher
temperatures. The conversion at 343 °C + increased around 11% from 300 °C to 320 °C and
remained constant until reaching 38.1 % at 340 °C.
From Figure 4.22, it seems that the residue fraction is mainly being converted to gases, water
and diesel, since the other product cuts did not show a significant variation when residue fraction
presented an important reduction. To support this idea, the product yields were plotted versus the
conversion of the product at 343 °C+ in Figure 4.23. The amount of residue (550 °C+) tend to
sharply decreases as the conversion increases, while VGO remained practically unchanged,
possibly because its rate of consumption is similar to its rate of generation. On the other hand, light
cuts such as naphtha and jet fuel moderately increased while the diesel fraction tended to severely
increase as the conversion increased.

66
Figure 4.22. Product distribution and conversion at 343 °C+ at different temperatures in R2 & R3
Figure 4.23. Product yields vs conversion at 343 °C+ for different conditions in R2 & R3
0
10
20
30
40
50
60
0 10 20 30 40
Yiel
d [
wt.
%]
Conversion 343°C+ [wt. %] Gas Water Naphtha Jet Fuel Diesel VGO Residue

67
4.4. Evaluation of a dual-catalyst bed reactor (Reaction #4)
In order to achieve a further conversion of the phenols, a dual-catalyst bed configuration
herein named CAT-M3+ was tested. As explained before, the first bed of catalyst (CAT-M3) has
a strong hydrogenation-dehydrogenation activity while the second bed (+) it was intended to
benefit the adsorption of phenols and the activation of their C=C bonds to be hydrogenated and
cracked (ring opening), to selectively eliminate the phenols. The conditions used in this reaction
were 1400 psig, 0.2 h-1 with respect CAT-M3, 0.5 h-1 with respect to catalyst + and a range of
temperature between 330 and 340 °C.
Figure 4.24 shows the reduction of carboxylic acids and phenols for the temperatures tested
in R4 using CAT-M3+. Reasonable trends were observed for the conversion of C=O acids and
phenols with the increase of temperature. Both reduction percentages increased as the severity of
the reaction was increased. Regarding the phenols conversion, it can be observed that at 330 °C, a
reduction of phenols of almost 20 % was achieved and when the temperature reached 340 °C, the
phenols were reduced 28 % from the original feed content. CAT-M3+ showed a better catalytic
activity towards phenols conversion but it did not achieve the same C=O acids reduction as CAT-
M3.
Figure 4.24. Carboxylic acids and phenols reduction for different temperatures using CAT-M3+
0
10
20
30
40
50
60
70
80
90
100
330 335 340
Red
uct
ion
Per
cen
tage
[%
]
Temperature [°C]
Carboxylic acids reduction Phenols reduction

68
As the severity of the reaction increased, the stability of the liquid product was monitored as
in the other reactions. Microscope images taken for the HDT-bio-oil at different temperatures in
R4 are presented in Figure 4.25. Analyzing the stability of the liquid samples, it can be seen that
at 330 °C the HDT-bio-oil was still stable but at 335 °C, some solids started to precipitate. At
340 °C, the solids remained relatively constant compared with 335 °C. However, to avoid further
deterioration of the HDT-bio-oil and possible reactor plugging, the reaction was ended at 340 °C.
Figure 4.25. Microscopic images at 40 X for the HDT-bio-oil at different temperatures in R4
Some relevant properties of the HDT-bio-oil at different temperature conditions using CAT-
M3+ are summarized in Table 4.7. A reduction in the viscosity and MCR values was found as the
temperature increased. On the other hand, the DOD increased sharply from 335 °C to 340 °C,
reaching 69 % of oxygen removal from the bio-oil feed. The conversion of the product at 343 °C+
did not follow a definite trend, it increased 9 % from 330 °C to 335 °C and decreased 3.5 % when
the 340 °C temperature was reached. It is known that the conversion of an oil usually increases
with temperature rise, hence more conditions need to be evaluated to conclude if one of the points
(335 or 340 °C) is an outlier or if the catalyst mixture affected the usual trend.

69
Table 4.7. Characterization of HDT-bio-oil at different temperatures using CAT-M3+
Property
Temperature [°C]
Feed 330 335 340
Viscosity [cP] @ 40 °C 31172 3136 576 492
Conversion 343 °C+ [wt. %] - 23.5 32.6 28.9
MCR [wt. %] 22.01 16.99 14.84 14.76
DOD [%] - 56.8 58.3 69.0
4.5. Catalyst performance comparison
A fifth reaction was carried out to evaluate the incorporation of a second hydrogenating
component to the CAT-M3 formulation and it was named as CAT-M4. This catalyst was tested to
see if it was possible to achieve a deeper conversion of phenols by improving the reactivity of
oxygenated groups with this second hydrogenating metal. The operating conditions used in this
reaction were 1400 psig, 0.2 h-1 and a range of temperature between 330 and 340 °C using CAT-
M4. The results of this reaction (R5) were compared with the ones obtained in R3 and R4 and are
presented in this section with the purpose of comparing the catalysts performance.
Figure 4.26 presents the acidity reduction (for both carboxylic acids and phenols) estimated
by FTIR quantitative analysis method at different temperatures and using different catalysts. As a
general trend, both C=O acids and phenols reduction increased as the severity of the reaction
increased. The highest carboxylic acids conversion was achieved by CAT-M3, followed by CAT-
M+ and CAT-M4. In theory, CAT-M3+ should have reached the same carboxylic acid reduction
as CAT-M3 at the same conditions because this dual-catalyst bed is the combination of CAT-M3
at the same space velocity tested in R3 (using CAT-M3) and a second bed composed by an acidic
catalyst. However, in R4 the weight of CAT-M3 was reduced to maintain a similar total weight of
catalyst in the reactor as in R3, i.e. in R3 29 g of CAT-M3 were used whereas in R4 21g of CAT-
M3 plus 8 g of catalyst + was employed. The difference in the weight of the portion corresponding
to CAT-M3 influences the linear velocity of this reactor bed. A lower linear velocity could have

70
negatively affected the performance of CAT-M3 in this experiment, explaining the difference in
the carboxylic acids reduction between R3 and R4. It can also be established that the catalyst + did
not contribute with the reduction of carboxylic acids. Analyzing CAT-M4 activity with respect to
the carboxylic acids conversion, it was noticed that the catalyst did not perform as it was expected.
This catalyst was supposed to improve the hydrogenation reactions due to its dual-hydrogenation
metal composition. However, one possible explanation for its poor performance might be that the
second hydrogenating metal phase could have covered the first hydrogenating phase, reducing the
quantity of active phases in CAT-M4 instead of increasing them or forming some sort of solid
solution that produced active sites of much less activity than the original ones or sites favoring
undesired reactions.
Figure 4.26. Carboxylic acids and phenols reduction at different T and catalysts
0
10
20
30
40
50
60
70
80
90
100
330 335 340
Red
uct
ion
Per
cen
tage
[%
]
Temperature [°C]
CAT-M3 Carboxylic CAT-M3+ Carboxylic CAT-M4 Carboxylic
CAT-M3 Phenols CAT-M3+ Phenols CAT-M4 Phenols

71
In Figure 4.26 it can be observed that the highest activity toward phenols conversion was
found for CAT-M3+, followed by CAT-M3 and CAT-M4. The acidic phase (+) used in the dual-
catalyst bed during R4 seem to play an important role in the conversion of phenols, reaching a
reduction of 28 % at 340 °C. The reason why CAT-M4 presented a poor phenols conversion could
be that adding two hydrogenating metals covered more the acidic support, reducing the acidic sites
of the catalyst needed for cracking and ring opening.
On the other hand, there is not a significant difference between the phenols reduction obtained
at 335 and 340 °C using CAT-M3+. The phenols present in the bio-oil have different sizes and
complexities. The molecules originated mostly from lignin depolimerization are known to be small
molecules such as cathecol and cresol or more complex structures with different side chain groups
such as methoxy, alkyl ester, alkyl methoxy and ether linkages.27, 39, 42 One of the reasons for
reaching a stagnant point for the phenols conversion could be that the catalyst pore diameter is not
big enough for the bulky molecules to reach the active sites confined in the catalyst crystals, thus
only the small molecules are being converted by this second catalytic bed.
Figure 4.27 illustrates the viscosity profile as a function of the conversion at 343 °C+ for the
HDT-bio-oil in R2, R3, R4 and R5. In this figure, it can be observed that the natural logarithm of
the viscosity follows a linear trend with the conversion of the HDT-bio-oil and the viscosity of the
liquid product is reduced several orders of magnitude at the maximum conversions for all cases.
Comparing the slopes for the reactions and catalysts tested, HDT-bio-oil using CAT-M4 presents
the poorer slope compared with the products using the other catalysts. The viscosity reduction in
R3 using CAT-M3 and in R4 using CAT-M3+ has similar slopes, meaning the addition of the “+”
bed in R4 did not affect the viscosity reduction in any way. It can also be seen that the slopes for
R2 and R3 are not similar although both reactions were performed with CAT-M3. The conditions
tested in R3 were more severe than the ones carried out in R2, hence some thermal contribution
can be attributed to the conversion of products to the slope obtained for R3. To confirm this idea,
the natural logarithm of the viscosity was plotted versus the conversion at 343 °C+ in Figure 4.28
for the same conditions evaluated in both R2 and R3 (310 and 325 °C) to compare the slopes
obtained.

72
Figure 4.27. Natural logarithm of viscosity vs conversion at 343 °C+ for R2, R3, R4 & R5
Figure 4.28. Natural logarithm of viscosity vs conversion at 343 °C+ for the same conditions
tested in R2 & R3
y = -0.0807x + 10.576R² = 0.9099
y = -0.1314x + 10.967R² = 0.9015
y = -0.1277x + 10.451R² = 0.9377
y = -0.0605x + 10.336R² = 0.9568
4
5
6
7
8
9
10
11
12
0 5 10 15 20 25 30 35 40 45
ln (
Vis
cosi
ty a
t 40
°C
[cP
])
Conversion 343°C+ [wt. %]
R2-CAT-M3 R3-CAT-M3 R4-CAT-M3+ R5-CAT-M4
y = -0.0807x + 10.576R² = 0.9099
y = -0.0865x + 10.493R² = 0.8581
6
7
8
9
10
11
12
0 10 20 30 40
ln (
Vis
cosi
ty a
t 40
°C
[cP
])
Conversion 343°C+ [wt. %]
R2-CAT-M3 R3-CAT-M3

73
In Figure 4.28, it can be confirmed that the difference in the slopes found in Figure 4.27 for
R2 and R3 is due to the contribution of the thermal effect to the conversion when submitting the
bio-oil to high temperatures (>325 °C). The slopes found in Figure 4.28 by plotting the same
conditions for both reactions (R2 and R3) are almost exact, agreeing with the results presented in
Table 4.5 that established the satisfactory performance of CAT-M3 in both reactions.
As observed in Figure 4.29, the obtained HDT-bio-oil using CAT-M4 has a higher tendency
to form insoluble materials (MCR) when compared with the products from the other catalysts at
similar conversion. Some of the active sites of CAT-M4 could be covered by the second
hydrogenating phase, reducing the total active sites in this catalyst. Therefore, the hydrotreating
process relies more on thermal effects than on catalytic activity, increasing the tendency to form
insoluble materials. Similarly to the viscosity profile, the slopes for the products obtained from R3
and R4 present a parallelism, which means that the acidity of catalyst + did not affect this property
either. Again, the difference found between the slopes form the HDT-bio-oil in R2 and R3 can be
attributed to the thermal contribution on the conversion after reaching a high severity.
Figure 4.29. MCR vs conversion at 343 °C+ for R2, R3, R4 & R5
y = -0.1905x + 21.989R² = 0.9057
y = -0.2513x + 22.048R² = 0.9702
y = -0.2303x + 22.038R² = 0.982
y = -0.1742x + 22.07R² = 0.8938
8.50
10.50
12.50
14.50
16.50
18.50
20.50
22.50
24.50
0 10 20 30 40 50
MC
R [
%]
Conversion 343°C+ [wt. %]
R2-CAT-M3 R3-CAT-M3 R4-CAT-M3+ R5-CAT-M4

74
The product distribution and conversion at 343 °C+ for two temperatures evaluated using
different catalysts are showed in Figure 4.30. As general trends, the highest conversion was
reached using CAT-M3, followed by CAT-M4 and CAT-M3+; the conversion at 343 °C+
increased as the temperature was increased for all catalysts; and the gas, naphtha, jet fuel and VGO
fractions remained almost constant when the temperature was increased for all the hydrotreated
products obtained using different catalysts. The residue fraction was higher for the HDT-bio-oil
using CAT-M3+ at both temperatures and that could be because, as explained before, the bulky
molecules conforming the residue fraction could not reach the active sites confined inside the
catalyst. Even if the size of the pores is larger than the molecules reacting and products, slow mass
transport of these molecules through the pore system can also reduce considerably the reaction
rate. A conversion of 38.1 % was reached at 340 °C using CAT-M3, while the maximum
conversion achieved using CAT-M4 and CAT-M3+ was around 29 %.
Figure 4.30. Product distribution and conversion at 343 °C+ for different T and catalysts
To compare the CS2 insoluble material obtained for each catalyst at different reaction
severities, the insolubles were plotted versus the conversion at 343 °C+ (see Figure 4.31). In the

75
graph, there is three main regions of insoluble, a low region between 3 and 6 wt. %, a medium
region between 6 and 8 wt. % and a high region around 10 wt. %. The insoluble material formed
by using CAT-M3 for hydrotreating the bio-oil is within the low region, the one formed by using
CAT-M3+ is within the medium region, whereas the one produced using CAT-M4 is in the high
region. This agrees with the findings regarding the acidity content of the products. The HDT-bio-
oil produced using CAT-M4 presented the higher polar compounds (C=O acids and phenols)
content compared with the other catalysts. Additionally, CAT-M4 showed less catalytic activity
and more thermal degradation due to the coverage of some active sites of the first hydrogenating
metal. Promoting thermal reactions could lead to polymerization of some high-molecular-weight
compounds, resulting in more CS2 insoluble material. On the other hand, the insolubles obtained
using CAT-M3+ could be in the medium region due to a higher quantity of carboxylic acids
compared with CAT-M3. Also, some cracking due to the acidic phase added when using this
catalyst could also result in some polymerization reactions, increasing the high-molecular-weight
compounds.
Figure 4.31. Comparison of CS2 insoluble material in the liquid product obtained using different
catalysts

76
Figure 4.32 shows the microscope images taken for the HDT-bio-oil produced at two different
temperatures (330, 340 °C) using three different catalysts (CAT-M3, CAT-M3+, CAT-M4). As
seen in Figure 4.32, the more stable HDT-bio-oil was produced using CAT-M4, followed by CAT-
M3+ and CAT-M3. The nature of this precipitated material is still unknown but it has a similar
behavior to the asphaltenes formed when processing petroleum-derived oil. However, due to these
images, it was possible to conclude that the CS2 insoluble material filtered from the liquid samples
was not the same type of material that naturally precipitates and was observed in the microscope
images. From Figure 4.31 it was found that the CS2 insoluble material formed using CAT-M4 is
in the high region, while in Figure 4.32 there is no intrinsic solid precipitation up to 340 °C.
Table 4.8 shows the conversion reached at different temperatures during different reactions
and if solid precipitations were observed. It can be seen that the solids start to precipitate after a
conversion around 29 % is reached no matter the temperature of the reaction.
Figure 4.32. Microscope images for the HDT-bio-oil for different T and catalysts

77
Table 4.8. Characterization of HDT-bio-oil at different temperatures during different reactions
Reaction Catalyst Temperature [°C] Conversion at
343 °C+ [wt. %] Solid precipitation
R2 CAT-M3 325 28.7 No
R3 CAT-M3 325 28.3 No
R3 CAT-M3 330 29.9 Yes
R4 CAT-M3+ 330 23.5 No
R4 CAT-M3+ 340 28.9 Yes
R5 CAT-M4 340 28.3 No
Finally, the hydrogen consumed per gram of oil vs the DOD for different catalysts is plotted
in Figure 4.33. The hydrogen consumption shows a linear trend with the DOD for all the catalysts.
Additionally, it seems that the hydrogen consumed to process the bio-oil using the three different
catalysts follows the same pathway because the slopes from the graph are very similar. Therefore,
the amount of hydrogen consumption to reach the same degree of deoxygenation will not vary
depending on the catalyst used. However, the severity of the reaction and the products obtained at
different conditions are, as proved by the experimental results obtained, dependent on the catalyst
used.
Figure 4.33. H2 consumption vs DOD for different catalysts
y = 0.2897x - 0.0176R² = 0.9993
y = 0.3041x - 0.0164R² = 0.9997
y = 0.2842x - 0.1491R² = 0.9879
0
5
10
15
20
25
0 20 40 60 80
H2
con
sum
pti
on
[m
g H2/g
oil]
DOD [%]
CAT-M3
CAT-M3+
CAT-M4

78
Chapter 5: Conclusions and Future Work
A summary of the key concluding remarks is presented in this section along with some
recommendations for directing the next stage of investigations in this area.
Conclusions
General trends
Some general trends were found when hydrotreating bio-oil at different conditions. First, it
was observed that increasing the total operating pressure secures a higher solubility of hydrogen
in the oil and thereby a higher availability of hydrogen in the vicinity of the catalyst, resulting in a
deeper hydrogenation of the feed. A more upgraded HDT-bio-oil was obtained at higher
temperatures and lower space velocities, i.e. a better quality HDT-bio-oil in terms of viscosity,
DOD, TAN conversion and MCR was obtained at the highest severity of reaction.
Moreover, a linear relation between the O/C and H/C ratio and the degree of deoxygenation
of the HDT-bio-oil was found, meaning that the removal of oxygen atoms from the bio-oil is linked
with the addition of hydrogen to it. Additionally, the hydrogen consumption was found to follow
a linear trend with the DOD when submitted to temperatures up to 330 °C. After this temperature,
it seems to follow a much faster trend with the DOD because the methanation reaction that
consumes a high amount of hydrogen is promoted at high temperatures. In addition, the hydrogen
consumption was found to be directly dependent on the severity of the reaction. These
inconveniences plus the in-stabilization of the largest molecules in the media mark the necessity
of introducing cracking reactions from the severity limit obtained for T, P and WHSV 330 °C,
1400 psig and 0.2 h-1, respectively, making hydro-cracking or steam-cracking the options.
Finally, it was observed that the conversion started to increase sharply after achieving 29-
30 wt. %. In addition, the solids observed in the microscope started to precipitate after reaching
the same level of conversion. Therefore, an important thermal contribution was observed in the
results of the HDT-bio-oil, specifically in the conversion at 343 °C+, after reaching 29-30 wt. %.
Upgrading of bio-oil via HDT
One of the main goals achieved in the present research was that it was possible to produce a
high quality HDT-bio-oil that was further processed via CSC (out of the scope of this thesis) and

79
did not deactivate the CSC catalyst.21 A viscosity reduction of 99 % and MCR reduction of 50 %
was reached by using CAT-M3, a temperature of 345 °C, 0.2 h-1 of space velocity and 1400 psig.
Moreover, a conversion at 343 °C+ of 39.5 wt. % was achieved at the same conditions. It was also
found that the residue was mainly converted to water, gases and diesel possibly because the VGO’s
rate of consumption was similar to its rate of generation. Finally, a reduction of 80 % of the CS2
insoluble material was achieved for the HDT-bio-oil.
Acidity of HDT-bio-oil
It was possible to measure the acidity of the HDT-bio-oil in terms of C=O acids and phenols
using the FTIR characterization technique. Moreover, a correlation between TAN and infrared
absorptivity at 1710-1750 cm-1 was successfully carried out. The relative error found for the results
measured with both analytical methods was 10.9 %, which is within the range of the error for the
TAN measurement. Therefore, the limitations faced by trying to measure bio-oils with low TAN
value (< 2 mgKOH/g) were overcome. The correlation developed can be used for determining the
acidity content in an inexpensive, more accurate and easier way by using only FTIR.
A C=O acids reduction of 100 %, thus a TAN conversion of 100 %, was achieved when
hydrotreating the bio-oil at 345 °C and using CAT-M3 (1400 psig, 0.2 h-1). On the other hand, a
phenols reduction of 28 % was reached at 340 °C, 0.2 h-1 and 1400 psig using CAT-M3+.
Catalysts performance comparison
The lifetime of CAT-M3 was tested in a long term run that lasted 55 days. It was found that
CAT-M3 remained constantly active throughout all the long term run, meaning that CAT-M3,
under the hydrotreating conditions tested in this research, did not observably deactivate for a period
of time 55 days.
Comparing CAT-M3 with CAT-M2, it was observed that at the same conditions, CAT-M3
performed better in terms of TAN conversion, MCR, DOD and viscosity reduction. In this way, a
higher amount of hydrogenating active phase in the catalyst enhances the bio-oil upgrading, as
long as the hydrogenating phase is well dispersed.
Moreover, higher temperatures were tested using CAT-M3, CAT-M3+ and CAT-M4. The
best catalyst found for C=O acids reduction was CAT-M3, whereas the best catalyst observed for

80
the phenols reduction was CAT-M3+. Regarding properties such as conversion, viscosity, MCR
and DOD, CAT-M3 was found to perform the best, followed by CAT-M3+ and CAT-M4.
In general, the more upgraded HDT-bio-oil was obtained using CAT-M3 with the exception
of the phenols reduction. CAT-M4 did not perform as good as the other two catalyst tested in the
present work and it might be related to the reduction of the active phases due to coverage of the
first hydrogenation phase by the second phase added or the formation of some solids that produced
active sites of much less activity than the ones formed in CAT-M3.
Future work
The novelty of the proposed upgrading approach relies on the fact that the unconsumed
hydrogen produced in CSC may be recycled back to the HDT unit, reducing or eliminating the
hydrogen make-up for the HDT unit. Thus, CSC and HDT units are supposed to be merged into
one single continuous operation. However, until now, the studies regarding upgrading
lignocellulose-derived bio-oils in the CAFE group have been carried out in separate units for HDT
and CSC. Therefore, merging the HDT and CSC units is being done, out of the scope of this thesis,
to study the whole process and its possible complications. Moreover, the CSR of the gases
produced in HDT and CSC will be explored in order to determine the maximum quantity of
hydrogen that could be produced to cope with the needs of the HDT unit. Additionally, an
economic study must be done to analyze the feasibility of the novel approach.
Regarding the optimization of the HDT process, a kinetic model should be developed to have
a better understanding of the process and to be able to predict the product quality at different
operating conditions. Finally, a catalyst that could reach the product quality as CAT-M3 should be
improved or modified to achieve a higher phenols reduction. The catalyst named as “+’ in the
present research could be modified to have larger pore sizes so the bulky molecules in the bio-oil
could reach the active sites.

81
References
1. Klass, D.L., Biomass for renewable energy, fuels, and chemicals. Elsevier: 1998.
2. Pereira, P., et al., Aquaconversion technology offers added value to E. Venezuela synthetic
crude oil production. Oil & Gas Journal 2001. 99(20), 79-85.
3. Mikulec, J., Kleinová, A., Cvengroš, J., and Banič, M., Catalytic transformation of tall oil
into biocomponent of diesel fuel. International Journal of Chemical Engineering 2012.
4. Anthonykutty, J.M., et al., Value added hydrocarbons from distilled tall oil via
hydrotreating over a commercial NiMo catalyst. Industrial & Engineering Chemistry
Research 2013. 52(30), 10114-10125.
5. Helwani, Z., Othman, M., Aziz, N., Fernando, W., and Kim, J., Technologies for
production of biodiesel focusing on green catalytic techniques: a review. Fuel Processing
Technology 2009. 90(12), 1502-1514.
6. Huber, G.W., Iborra, S., and Corma, A., Synthesis of transportation fuels from biomass:
chemistry, catalysts, and engineering. Chemical reviews 2006. 106(9), 4044-4098.
7. Egeberg, R., Michaelsen, N., Skyum, L., and Topsoe, H., Novel hydrotreating technology
for production of green diesel. ERTC, Nov 2009, 9-11.
8. Huber, G.W. and Dumesic, J.A., An overview of aqueous-phase catalytic processes for
production of hydrogen and alkanes in a biorefinery. Catalysis Today 2006. 111(1-2), 119-
132.
9. Demirbaş, A., Calculation of higher heating values of biomass fuels. Fuel 1997. 76(5),
431-434.
10. Jensen, C.U., Guerrero, J.K.R., Karatzos, S., Olofsson, G., and Iversen, S.B., Fundamentals
of Hydrofaction™: Renewable crude oil from woody biomass. Biomass Conversion and
Biorefinery 2017. 7(4), 495-509.
11. Saidi, M., et al., Upgrading of lignin-derived bio-oils by catalytic hydrodeoxygenation.
Energy & Environmental Science 2014. 7(1), 103-129.
12. Furimsky, E., Catalytic hydrodeoxygenation. Applied Catalysis A: General 2000. 199(2),
147-190.
13. Czernik, S. and Bridgwater, A., Overview of applications of biomass fast pyrolysis oil.
Energy & fuels 2004. 18(2), 590-598.
14. Mohan, D., Pittman, C.U., and Steele, P.H., Pyrolysis of wood/biomass for bio-oil: a
critical review. Energy & fuels 2006. 20(3), 848-889.
15. Elliott, D.C., Historical developments in hydroprocessing bio-oils. Energy & Fuels 2007.
21(3), 1792-1815.
16. Zhang, Q., Chang, J., Wang, T., and Xu, Y., Review of biomass pyrolysis oil properties
and upgrading research. Energy conversion and management 2007. 48(1), 87-92.
17. Mortensen, P.M., Grunwaldt, J.-D., Jensen, P.A., Knudsen, K., and Jensen, A.D., A review
of catalytic upgrading of bio-oil to engine fuels. Applied Catalysis A: General 2011. 407(1-
2), 1-19.
18. Bu, Q., et al., A review of catalytic hydrodeoxygenation of lignin-derived phenols from
biomass pyrolysis. Bioresource Technology 2012. 124, 470-477.
19. Elliott, D.C. and Baker, E., Upgrading biomass liquefaction products through
hydrodeoxygenation. 1984, Pacific Northwest Lab., Richland, WA (USA).

82
20. Trujillo-Ferrer, G. Thermal and Catalytic Steam Reactivity Evaluation of Athabasca
Vacuum Gasoil. University of Calgary, Calgary, AB, Canada, 2008
21. Trujillo, M., Catalytic Upgrading Process of Ligno-cellulose Derived Heavy Crude Oil.
2018, University of Calgary: Calgary.
22. Stöcker, M., Biofuels and biomass‐to‐liquid fuels in the biorefinery: Catalytic conversion
of lignocellulosic biomass using porous materials. Angewandte Chemie International
Edition 2008. 47(48), 9200-9211.
23. Kanaujia, P.K., Sharma, Y., Garg, M., Tripathi, D., and Singh, R., Review of analytical
strategies in the production and upgrading of bio-oils derived from lignocellulosic biomass.
Journal of Analytical and Applied Pyrolysis 2014. 105, 55-74.
24. Eisentraut, A., Sustainable production of second-generation biofuels. 2010.
25. ENC, P. Database for biomass and waste. 2012 18 July 2018]; Available from:
https://www.ecn.nl/phyllis2/.
26. Deguchi, S., Tsujii, K., and Horikoshi, K., Cooking cellulose in hot and compressed water.
Chemical Communications 2006(31), 3293-3295.
27. Quitain, A.T., Sato, N., Daimon, H., and Fujie, K., Qualitative investigation on
hydrothermal treatment of hinoki (Chamaecyparis obtusa) bark for production of useful
chemicals. Journal of agricultural and food chemistry 2003. 51(27), 7926-7929.
28. Soltes, E.J., Elder, T., and Goldstein, I., Organic Chemicals from Biomass. 1981, CRC
Press, Pyrolysis.
29. Nimz, H., Chemistry of potential chromophoric groups in beech lignin. Tappi Tech Ass
Pulp Pap Indus 1973.
30. Bauen, A., in Encyclopedia of Energy, Elsevier, Editor. 2004: Amsterdam.
31. Sjöström, E., Wood Chemistry—Fundamentals and Applications Academic. New York
1993.
32. Bridgwater, A., Catalysis in thermal biomass conversion. Applied Catalysis A: General
1994. 116(1-2), 5-47.
33. Zhu, Z., Rosendahl, L., Toor, S.S., Yu, D., and Chen, G., Hydrothermal liquefaction of
barley straw to bio-crude oil: effects of reaction temperature and aqueous phase
recirculation. Applied Energy 2015. 137, 183-192.
34. Brand, S. and Kim, J., Liquefaction of major lignocellulosic biomass constituents in
supercritical ethanol. Energy 2015. 80, 64-74.
35. DEMIRBAŞ, A., Balat, M., and BOZBAŞ, K., Direct and catalytic liquefaction of wood
species in aqueous solution. Energy Sources 2005. 27(3), 271-277.
36. Peterson, A.A., et al., Thermochemical biofuel production in hydrothermal media: a review
of sub-and supercritical water technologies. Energy & Environmental Science 2008. 1(1),
32-65.
37. Kruse, A. and Dinjus, E., Hot compressed water as reaction medium and reactant:
properties and synthesis reactions. The Journal of supercritical fluids 2007. 39(3), 362-
380.
38. Lu, Q., Li, W.-Z., and Zhu, X.-F., Overview of fuel properties of biomass fast pyrolysis
oils. Energy Conversion and Management 2009. 50(5), 1376-1383.
39. Milne, T., Agblevor, F., Davis, M., Deutch, S., and Johnson, D., A review of the chemical
composition of fast-pyrolysis oils from biomass, in Developments in thermochemical
biomass conversion. 1997, Springer. p. 409-424.

83
40. Banerjee, D.K., Oil sands, heavy oil & bitumen: from recovery to refinery. PennWell
Books: 2012.
41. Branca, C., Giudicianni, P., and Di Blasi, C., GC/MS characterization of liquids generated
from low-temperature pyrolysis of wood. Industrial & Engineering Chemistry Research
2003. 42(14), 3190-3202.
42. Pedersen, T.H. and Rosendahl, L.A., Production of fuel range oxygenates by supercritical
hydrothermal liquefaction of lignocellulosic model systems. Biomass and Bioenergy 2015.
83, 206-215.
43. Carrier, M., et al., Conversion of fern (Pteris vittata L.) biomass from a phytoremediation
trial in sub-and supercritical water conditions. biomass and bioenergy 2011. 35(2), 872-
883.
44. Carrier, M., Loppinet-Serani, A., Absalon, C., Aymonier, C., and Mench, M., Degradation
pathways of holocellulose, lignin and α-cellulose from Pteris vittata fronds in sub-and
super critical conditions. Biomass and bioenergy 2012. 43, 65-71.
45. Toor, S.S., Rosendahl, L., and Rudolf, A., Hydrothermal liquefaction of biomass: a review
of subcritical water technologies. Energy 2011. 36(5), 2328-2342.
46. Oasmaa, A. and Czernik, S., Fuel oil quality of biomass pyrolysis oils state of the art for
the end users. Energy & Fuels 1999. 13(4), 914-921.
47. Soltes, J. and Lin, S.-C.K., Hydroprocessing of biomass tars for liquid engine fuels, in
Progress in biomass conversion. 1984, Elsevier. p. 1-68.
48. Sipilä, K., Kuoppala, E., Fagernäs, L., and Oasmaa, A., Characterization of biomass-based
flash pyrolysis oils. Biomass and Bioenergy 1998. 14(2), 103-113.
49. Boelhouwer, J., Nederbragt, G., and Verberg, G., Viscosity data of organic liquids. Applied
Scientific Research 1951. 2(1), 249.
50. Schaschke, C., A dictionary of chemical engineering. OUP Oxford: 2014.
51. Patel, M. and Kumar, A., Production of renewable diesel through the hydroprocessing of
lignocellulosic biomass-derived bio-oil: A review. Renewable and Sustainable Energy
Reviews 2016. 58, 1293-1307.
52. Donnis, B., Egeberg, R.G., Blom, P., and Knudsen, K.G., Hydroprocessing of bio-oils and
oxygenates to hydrocarbons. Understanding the reaction routes. Topics in Catalysis 2009.
52(3), 229-240.
53. Elliott, D.C. and Hart, T.R., Catalytic hydroprocessing of chemical models for bio-oil.
Energy & Fuels 2008. 23(2), 631-637.
54. Xiu, S. and Shahbazi, A., Bio-oil production and upgrading research: A review. Renewable
and Sustainable Energy Reviews 2012. 16(7), 4406-4414.
55. Chiaramonti, D., et al., Development of emulsions from biomass pyrolysis liquid and diesel
and their use in engines—Part 1: emulsion production. Biomass and bioenergy 2003. 25(1),
85-99.
56. Chiaramonti, D., et al., Development of emulsions from biomass pyrolysis liquid and diesel
and their use in engines—Part 2: tests in diesel engines. Biomass and Bioenergy 2003.
25(1), 101-111.
57. Ikura, M., Stanciulescu, M., and Hogan, E., Emulsification of pyrolysis derived bio-oil in
diesel fuel. Biomass and bioenergy 2003. 24(3), 221-232.

84
58. Garcia-Perez, M., Adams, T.T., Goodrum, J.W., Geller, D.P., and Das, K., Production and
fuel properties of pine chip bio-oil/biodiesel blends. Energy & Fuels 2007. 21(4), 2363-
2372.
59. Baker, E. and Elliott, D., Catalytic upgrading of biomass pyrolysis oils, in Research in
thermochemical biomass conversion. 1988, Springer. p. 883-895.
60. Baldauf, W., Balfanz, U., and Rupp, M., Upgrading of flash pyrolysis oil and utilization in
refineries. Biomass and Bioenergy 1994. 7(1-6), 237-244.
61. Venderbosch, R., Ardiyanti, A., Wildschut, J., Oasmaa, A., and Heeres, H., Stabilization
of biomass‐derived pyrolysis oils. Journal of Chemical Technology & Biotechnology 2010.
85(5), 674-686.
62. Kwon, K.C., Mayfield, H., Marolla, T., Nichols, B., and Mashburn, M., Catalytic
deoxygenation of liquid biomass for hydrocarbon fuels. Renewable Energy 2011. 36(3),
907-915.
63. Tang, Z., Lu, Q., Zhang, Y., Zhu, X., and Guo, Q., One step bio-oil upgrading through
hydrotreatment, esterification, and cracking. Industrial & Engineering Chemistry Research
2009. 48(15), 6923-6929.
64. Wildschut, J., Mahfud, F.H., Venderbosch, R.H., and Heeres, H.J., Hydrotreatment of fast
pyrolysis oil using heterogeneous noble-metal catalysts. Industrial & Engineering
Chemistry Research 2009. 48(23), 10324-10334.
65. Landberg, K. Experimental and kinetic modelling study of hydrodeoxygenation of tall oil
to renewable fuel. Master Thesis, Chalmers University of Technology, Gothenburg,
Sweden, 2017
66. Grange, P., Laurent, E., Maggi, R., Centeno, A., and Delmon, B., Hydrotreatment of
pyrolysis oils from biomass: reactivity of the various categories of oxygenated compounds
and preliminary techno-economical study. Catalysis today 1996. 29(1-4), 297-301.
67. Weisser, O. and Landa, S., Sulphide catalysts, their properties and applications. Elsevier:
2013.
68. Elliott, D.C., Hart, T.R., Neuenschwander, G.G., Rotness, L.J., and Zacher, A.H., Catalytic
hydroprocessing of biomass fast pyrolysis bio‐oil to produce hydrocarbon products.
Environmental Progress & Sustainable Energy: An Official Publication of the American
Institute of Chemical Engineers 2009. 28(3), 441-449.
69. Cabrales-Navarro, F.A. Reactivity Study and Kinetic Modeling of Deasphalted Oil
Upgrading via Thermal and Catalytic Cracking. PhD, University of Calgary, 2016
70. Vitale, G., Frauwallner, M., Scott, C., and Pereira-Almao, P., Preparation and
characterization of low-temperature nano-crystalline cubic molybdenum carbides and
insights on their structures. Applied Catalysis A: General 2011. 408(1-2), 178-186.
71. Speight, J.G., High acid crudes. Gulf Professional Publishing: 2014.
72. ASTM Committee D-2 on Petroleum Products, L.F. and Lubricants, Standard test method
for acid number of petroleum products by potentiometric titration. ASTM International:
2011.
73. Carbognani, L., et al., Reliable determination of water contents of bitumen and vacuum
residua via coulometric Karl Fischer titration using tetrahydrofuran. Petroleum Science
and Technology 2014. 32(5), 602-609.
74. D, A., Standard Test Method for Water in Crude Oils by Coulometric Karl Fischer
Titration. Annual Book of Standards 2004.

85
75. Gray, M.R., Upgrading oilsands bitumen and heavy oil. University of Alberta: 2015.
76. D7169-05, A., Standard Test Method for Boiling Range Distribution of Samples with
Residues Such as Crude Oils and Atmospheric and Vacuum Residues by High Temperature
Gas Chromatography,. Annual Book of ASTM Standards. 5.
77. Carbognani, L., Lubkowitz, J., Gonzalez, M.F., and Pereira-Almao, P., High temperature
simulated distillation of Athabasca vacuum residue fractions. Bimodal distributions and
evidence for secondary “on-column” cracking of heavy hydrocarbons. Energy & Fuels
2007. 21(5), 2831-2839.
78. Rodriguez-DeVecchis, V.M., Carbognani Ortega, L., Scott, C.E., and Pereira-Almao, P.,
Use of Nanoparticle Tracking Analysis for Particle Size Determination of Dispersed
Catalyst in Bitumen and Heavy Oil Fractions. Industrial & Engineering Chemistry
Research 2015. 54(40), 9877-9886.
79. D5291, A., Standard Test Methods for Intrumental Determination of Carbon, Hydrogen
and Nitrogen in Petroleum Products and Lubricants. Annual Book of ASTM Standards
2002. 05.
80. Hassan, A., Carbognani, L., and Pereira-Almao, P., Development of an alternative setup
for the estimation of microcarbon residue for heavy oil and fractions: Effects derived from
air presence. Fuel 2008. 87(17-18), 3631-3639.
81. Venyaminov, S.Y. and Prendergast, F.G., Water (H2O and D2O) Molar Absorptivity in
the 1000–4000 cm− 1Range and Quantitative Infrared Spectroscopy of Aqueous Solutions.
Analytical biochemistry 1997. 248(2), 234-245.
82. Silverstein, R.M., Webster, F.X., Kiemle, D.J., and Bryce, D.L., Spectrometric
identification of organic compounds. John wiley & sons: 2014.
83. Barcenas, M., Orea, P., Buenrostro-González, E., Zamudio-Rivera, L.S., and Duda, Y.,
Study of medium effect on asphaltene agglomeration inhibitor efficiency. Energy & Fuels
2008. 22(3), 1917-1922.
84. Guo, X., Zheng, Y., Zhang, B., and Chen, J., Analysis of coke precursor on catalyst and
study on regeneration of catalyst in upgrading of bio-oil. Biomass and bioenergy 2009.
33(10), 1469-1473.
85. Carbognani Ortega, L.C., Josune; Pereira Almao, Pedro, Correlation of Thermogravimetry
and High Temperature Simulated Distillation for Oil Analysis: Thermal Cracking
Influence over both Methodologies, in The Boduszynski Continuum: Contributions to the
Understanding of the Molecular Composition of Petroleum. 2018, ACS Symposium
Series: Washington, DC.

86
Appendix I: Modifications of RTU-1
Figure 1 shows the RTU-1 diagram as designed and constructed by Cabrales Navarro before
modifications.69 The modifications made in the present research were done due to some limitations
found for some tanks at the high operating pressure used for hydrotreating bio-oil. In Figure 1, it
can be noticed that MB Tank 1 was used to separate the light products and gases from the heavy
products. First, the lights were passed through a condenser and the gases were separated (after
passing through Liquid Trap 1) and sent to the GC or exhaust. The light products were retained in
MB Tank 3 until the mass balance time was reached. Then, the pneumatic valves from the
automated sampling system opened, and the lights could be collected.
Figure 1. RTU-1 diagram before modifications69

87
Taking a look at Figure 3.1, it is noticed that the main modifications in RTU-1 were made in
the light products separation and collecting zone. The reason behind the alterations was that MB
Tank 1 presented some limitations of temperature when submitted to a pressure of 1400 psig.
Hence, the separation of light from heavy products could not be done in MB Tank 1. Additionally,
a N2 mass controller was used for bubbling in MB Tank 2.
The main modification done to the system was to change the separation system from MB Tank
1 which is submitted to high pressures (1400 psig) to MB Tank 2, which after the automated
sampling system is submitted to atmospheric pressure. For this purpose, a long line was connected
between MB Tank 2 and MB Tank 3 to serve as a condenser. Moreover, N2 bubbling was added
to MB Tank 2 to enhance the separation between the light and heavy products. Nitrogen flushing
lines were connected to MB Tank 2 and 3 for better collection of the samples. Finally, some lines
were added to send the remaining gases to the exhaust system.

88
Appendix II: Operational Data and Experimental Results
Table 1. Pilot plant data and operational conditions for reaction #1
RUN DATA Reaction #1
C1 C2 C2 C3 C4
Mass Balance MB1 MB1 MB3 MB1 MB2
Pressure [psig] 1400 1200 1200 1100 900
Reaction Temperature [°C] 310 310 310 310 310
WHSV [h-1] 0.2 0.2 0.2 0.2 0.2
Residence Time [min] 300 300 300 300 300
Mass Balance Time [min] 1385 1440 1440 1440 1440
Time on Stream [h] 53.1 202.3 250.3 466.3 322.3
Hydrocarbon Feed Flow [cc/min] 0.0395 0.0395 0.0395 0.0395 0.0395
Hydrogen to Oil ratio [v/v] 900 900 900 900 900
Hydrogen Feed Flow [sccm] 35.58 35.58 35.58 35.58 35.58
Total Liquid Hydrocarbon Feed [g] 54.76 59.21 59.21 59.21 59.21
Catalyst Matrix CAT-M2 CAT-M2 CAT-M2 CAT-M2 CAT-M2
LIQUID PRODUCTS Light Product - Light Collector [g] 2.65 4.36 4.21 4.20 4.03
Heavy Product [g] 50.04 52.06 53.52 52.45 53.87
Light Hydrocarbon Product [g] 0.56 1.07 1.23 0.40 1.06
Heavy Hydrocarbon Product [g] 49.53 51.82 53.26 51.34 53.65
Total Liquid Hydrocarbon Product [g] 50.09 52.89 54.48 51.74 54.71
Water in Light Collector [g] 2.08 3.29 2.99 3.80 2.97
Water in Total Liquid HC Product [g] 0.52 0.24 0.27 1.10 0.22
Total Water Collected [g] 2.60 3.53 3.25 4.90 3.20
% Light HC Product 1.12 2.02 2.25 0.78 1.93
% Heavy HC Product 98.88 97.98 97.75 99.22 98.07
GAS PRODUCTS Measured Gas Flow [sccm] 38.98 38.97 38.97 38.60 37.83
Hydrogen Content in Gas [% v/v] 97.70 97.90 97.90 98.10 98.10
Gas HC Product Flow [sccm] 0.90 0.82 0.82 0.73 0.72
Gas HC Product [g] 2.33 2.28 2.28 2.01 1.91
SOLID PRODUCTS CS2 Insolubles [g] 2.53 2.66 2.74 - -
TOTAL PRODUCTS Total Hydrocarbon Product [g] 52.42 55.17 56.76 53.75 56.62
USEFUL CALCULATIONS Overall Mass Balance [%] 100.5 99.1 101.4 99.0 101.0
Hydrocarbon Yield [%] 95.7 93.2 95.9 90.8 95.6
Water Yield [%] 4.7 6.0 5.4 8.3 5.3
Gas Yield [%] 4.2 3.9 3.8 3.4 3.2
Liquid Yield [%] 91.2 91.6 91.6 96.6 96.8
Liquid HC Yield [%] 86.5 85.6 86.2 88.2 91.5
CS2 Insolubles Yield [%] 4.6 4.5 4.6 - -

89
Table 2. Pilot plant data and operational conditions for reaction #2
RUN DATA Reaction #2
C1 C2 C3 C4 C5 C6
Mass Balance MB4 MB4 MB1 MB2 MB1 MB3
Pressure [psig] 1400 1400 1400 1400 1400 1400
Reaction Temperature [°C] 310 320 315 325 310 300
WHSV [h-1] 0.2 0.2 0.2 0.2 0.2 0.2
Residence Time [min] 300 300 300 300 300 300
Mass Balance Time [min] 720 720 720 720 720 720
Time on Stream [h] 78.0 294.0 546.0 714.0 798.0 952.0
Hydrocarbon Feed Flow [cc/min] 0.0878 0.0878 0.0878 0.0878 0.0878 0.0878
Hydrogen to Oil ratio [v/v] 1150 1150 1150 1150 1150 1150
Hydrogen Feed Flow [sccm] 101.00 100.97 100.97 100.97 100.97 101.00
Total Liquid Hydrocarbon Feed [g] 65.77 65.74 65.74 65.74 65.74 65.77
Catalyst Matrix CAT-M3 CAT-M3 CAT-M3 CAT-M3 CAT-M3 CAT-M3
LIQUID PRODUCTS Light Product - Light Collector [g] 4.02 4.02 6.34 4.94 4.53 3.97
Heavy Product [g] 58.42 58.42 56.31 56.31 57.95 59.96
Light Hydrocarbon Product [g] 0.80 0.80 1.65 1.41 1.17 0.98
Heavy Hydrocarbon Product [g] 57.77 58.16 56.13 56.07 57.74 59.56
Total Liquid Hydrocarbon Product [g] 58.57 58.96 57.78 57.48 58.90 60.53
Water in Light Collector [g] 3.22 3.22 4.69 3.52 3.36 3.00
Water in Total Liquid HC Product [g] 0.66 0.26 0.18 0.25 0.22 0.41
Total Water Collected [g] 3.88 3.48 4.87 3.77 3.58 3.40
% Light HC Product 1.36 1.35 2.86 2.46 1.98 1.61
% Heavy HC Product 98.64 98.65 97.14 97.54 98.02 98.39
GAS PRODUCTS Measured Gas Flow [sccm] 88.82 88.11 86.52 83.23 88.82 89.36
Hydrogen Content in Gas [% v/v] 96.90 96.60 97.30 97.00 96.90 98.00
Gas HC Product Flow [sccm] 2.75 3.00 2.34 2.50 2.75 1.79
Gas HC Product [g] 3.73 3.98 3.27 3.45 3.73 2.37
SOLID PRODUCTS CS2 Insolubles [g] 2.61 2.90 2.96 2.60 2.60 4.08
TOTAL PRODUCTS Total Hydrocarbon Product [g] 62.29 62.95 61.05 60.93 62.63 62.91
USEFUL CALCULATIONS Overall Mass Balance [%] 100.6 101.0 100.3 98.4 100.7 100.8
Hydrocarbon Yield [%] 94.7 95.7 92.9 92.7 95.3 95.7
Water Yield [%] 5.9 5.2 7.4 5.8 5.4 5.1
Gas Yield [%] 5.6 6.0 5.0 5.3 5.6 3.6
Liquid Yield [%] 90.4 89.6 90.5 90.7 90.4 90.3
Liquid HC Yield [%] 84.6 84.4 83.2 84.8 85.0 85.1
CS2 Insolubles Yield [%] 3.9 4.4 4.5 4.0 3.9 6.2

90
Table 3. Pilot plant data and operational conditions for reaction #2
RUN DATA Reaction #2
C7 C8 C9 C10 C11 C12
Mass Balance MB1 MB1 MB2 MB1 MB3 MB1
Pressure [psig] 1400 1400 1400 1400 1400 1400
Reaction Temperature [°C] 295 315 315 315 320 310
WHSV [h-1] 0.2 0.3 0.4 0.5 0.3 0.2
Residence Time [min] 300 200 150 120 200 300
Mass Balance Time [min] 720 960 360 300 480 720
Time on Stream [h] 1061.0 1127.0 1183.0 1200.0 1247.0 1318.0
Hydrocarbon Feed Flow [cc/min] 0.0878 0.1317 0.1757 0.2196 0.1317 0.0878
Hydrogen to Oil ratio [v/v] 1150 1150 1150 1150 1150 1150
Hydrogen Feed Flow [sccm] 101.00 151.46 202.06 252.54 151.46 100.97
Total Liquid Hydrocarbon Feed [g] 65.77 131.49 65.78 68.52 65.74 65.74
Catalyst Matrix CAT-M3 CAT-M3 CAT-M3 CAT-M3 CAT-M3 CAT-M3
LIQUID PRODUCTS Light Product - Light Collector [g] 4.83 11.13 4.09 3.52 4.01 3.83
Heavy Product [g] 59.43 114.53 59.78 61.29 59.96 57.19
Light Hydrocarbon Product [g] 3.84 6.87 1.33 2.11 1.29 1.90
Heavy Hydrocarbon Product [g] 59.23 113.51 59.17 59.62 59.61 55.99
Total Liquid Hydrocarbon Product [g] 63.06 120.38 60.50 61.73 60.90 57.90
Water in Light Collector [g] 1.00 4.26 2.76 1.41 2.72 1.92
Water in Total Liquid HC Product [g] 0.21 1.07 0.62 1.68 0.35 1.21
Total Water Collected [g] 1.21 5.33 3.38 3.09 3.07 3.13
% Light HC Product 6.08 5.71 2.20 3.41 2.12 3.29
% Heavy HC Product 93.92 94.29 97.80 96.59 97.88 96.71
GAS PRODUCTS Measured Gas Flow [sccm] 92.42 132.32 180.61 227.57 131.98 87.49
Hydrogen Content in Gas [% v/v] 98.00 97.70 97.70 97.70 97.70 97.70
Gas HC Product Flow [sccm] 1.85 3.04 4.15 5.23 3.04 2.01
Gas HC Product [g] 2.48 5.11 2.66 2.62 2.37 2.72
SOLID PRODUCTS CS2 Insolubles [g] 3.04 12.87 5.01 5.07 4.35 2.60
TOTAL PRODUCTS Total Hydrocarbon Product [g] 65.54 125.49 63.16 64.35 63.27 60.62
USEFUL CALCULATIONS Overall Mass Balance [%] 101.5 99.5 101.1 98.4 100.9 97.0
Hydrocarbon Yield [%] 99.7 95.4 96.0 93.9 96.2 92.2
Water Yield [%] 1.8 4.1 5.1 4.6 4.6 4.9
Gas Yield [%] 3.7 3.9 4.0 3.9 3.6 4.3
Liquid Yield [%] 91.7 86.3 88.5 88.6 89.9 91.6
Liquid HC Yield [%] 89.9 82.2 83.4 84.0 85.2 86.7
CS2 Insolubles Yield [%] 4.6 9.8 7.5 7.5 6.6 4.1

91
Table 4.SimDist raw data and calculated results for reaction #2
RUN DATA FEED Reaction #2
C1 C2 C3 C4 C6 C7
Pressure [psig] 1400 1400 1400 1400 1400 1400
Reaction Temperature [°C] 310 320 315 325 300 295
WHSV [h-1] 0.2 0.2 0.2 0.2 0.2 0.2
Catalyst Matrix CAT-M3 CAT-M3 CAT-M3 CAT-M3 CAT-M3 CAT-M3
Water Yield [%] 5.6 5.7 6.6 6.0 5.2 2.3
Gas Yield [%] 5.5 5.8 5.0 5.3 3.6 3.8
Naphtha Yield (28 - 190 °C) [%] 2.1 3.2 4.3 3.5 2.7 3.2 3.2
Jet Fuel Yield (190 - 260 °C) [%] 5.2 8.1 8.5 7.8 7.8 7.1 7.4
Diesel Yield (260 - 343 °C) [%] 10.5 16.6 18.1 16.6 20.0 14.1 13.8
VGO Yield (343 - 550 °C) [%] 26.5 27.1 26.8 27.1 24.7 25.4 27.6
Residue Yield (550°C+) [%] 55.8 33.6 30.8 33.4 33.6 41.3 42.0
CS2 Insolubles Yield [%] 3.9 4.4 4.5 4.0 5.6 4.5
Conversion (343 °C+) [%] 0.0 25.5 29.6 26.0 28.7 18.8 15.3
SIMULATED DISTILLATION
0 162.5 125.25 115.70 119.63 166.50 165.95 165.70
5 225.7 203.80 188.35 198.97 210.00 206.35 207.50
10 267.9 238.70 228.45 236.37 243.55 242.30 245.20
15 301.5 271.95 258.80 270.43 277.10 280.90 283.90
20 333.3 301.40 289.80 300.13 301.25 306.55 309.75
25 356.2 315.90 311.45 315.53 311.00 328.00 334.50
30 368.1 332.05 319.15 331.07 324.80 347.80 351.30
35 387.9 351.05 338.45 348.27 339.50 369.20 378.25
40 419.6 372.00 354.40 367.90 356.55 405.50 415.60
45 458.1 404.20 378.45 401.17 388.05 440.85 451.60
50 503.3 438.55 414.55 435.63 426.20 484.80 492.95
55 561.3 471.95 444.85 467.60 462.90 519.70 524.10
60 633.4 510.20 479.75 504.50 504.45 564.10 567.30
65 0.0 552.70 518.25 544.43 548.90 615.35 614.20
70 0.0 600.05 564.50 590.93 598.80 674.65 667.90
75 0.0 653.05 615.40 641.37 656.50 704.70 0.00
80 0.0 708.90 675.80 0.00 0.00 0.00 0.00
85 0.0 0.00 0.00 0.00 0.00 0.00 0.00
90 0.0 0.00 0.00 0.00 0.00 0.00 0.00
95 0.0 0.00 0.00 0.00 0.00 0.00 0.00
100 0.0 0.00 0.00 0.00 0.00 0.00 0.00

92
Table 5. Pilot plant data and operational conditions for reaction #3
RUN DATA Reaction #3
C2 C3 C4 C5 C6 C7
Mass Balance MB1 MB2 MB3 MB3 MB1 MB2
Pressure [psig] 1400 1400 1400 1400 1400 1400
Reaction Temperature [°C] 325 310 330 335 340 345
WHSV [h-1] 0.2 0.2 0.2 0.2 0.2 0.2
Residence Time [min] 300 300 300 300 300 300
Mass Balance Time [min] 720 720 720 720 720 720
Time on Stream [h] 141.5 213.5 297.5 417.5 453.5 525.5
Hydrocarbon Feed Flow [cc/min] 0.0976 0.0976 0.0976 0.0976 0.0976 0.0976
Hydrogen to Oil ratio [v/v] 900 1150 1150 1150 1150 1150
Hydrogen Feed Flow [sccm] 87.84 112.24 112.24 112.24 112.24 87.84
Total Liquid Hydrocarbon Feed [g] 70.27 73.08 73.08 70.27 70.27 70.27
Catalyst Matrix CAT-M3 CAT-M3 CAT-M3 CAT-M3 CAT-M3 CAT-M3
LIQUID PRODUCTS Light Product - Light Collector [g] 5.79 4.00 6.76 7.18 7.23 8.22
Heavy Product [g] 61.78 66.21 63.19 59.85 60.92 58.41
Light Hydrocarbon Product [g] 1.22 1.02 1.70 2.66 2.65 2.54
Heavy Hydrocarbon Product [g] 61.36 65.73 62.79 59.52 59.96 57.35
Total Liquid Hydrocarbon Product [g] 62.58 66.75 64.49 62.18 62.61 59.89
Water in Light Collector [g] 4.57 2.98 5.05 4.52 4.58 5.67
Water in Total Liquid HC Product [g] 0.43 0.49 0.41 0.35 1.00 1.08
Total Water Collected [g] 5.00 3.47 5.46 4.87 5.57 6.76
% Light HC Product 1.95 1.53 2.64 4.28 4.23 4.24
% Heavy HC Product 98.05 98.47 97.36 95.72 95.77 95.76
GAS PRODUCTS Measured Gas Flow [sccm] 81.92 91.59 91.15 94.85 92.01 92.06
Hydrogen Content in Gas [% v/v] 97.70 97.70 97.70 97.70 97.70 97.70
Gas HC Product Flow [sccm] 1.88 2.11 2.10 2.18 2.12 2.12
Gas HC Product [g] 2.35 2.76 2.60 2.62 2.48 2.38
SOLID PRODUCTS CS2 Insolubles [g] 3.21 6.13 5.03 2.37 2.22 2.72
TOTAL PRODUCTS Total Hydrocarbon Product [g] 64.93 69.51 67.09 64.80 65.09 62.27
USEFUL CALCULATIONS Overall Mass Balance [%] 99.5 99.9 99.3 99.1 100.6 98.2
Hydrocarbon Yield [%] 92.4 95.1 91.8 92.2 92.6 88.6
Water Yield [%] 7.2 4.7 7.5 7.0 7.9 9.8
Gas Yield [%] 3.4 3.8 3.6 3.8 3.5 3.4
Liquid Yield [%] 92.0 87.8 89.5 92.8 93.3 92.6
Liquid HC Yield [%] 84.9 83.1 82.0 85.8 85.5 82.8
CS2 Insolubles Yield [%] 4.6 8.4 6.9 3.4 3.1 3.9

93
Table 6.SimDist raw data and calculated results for reaction #3
RUN DATA FEED Reaction #3
C2 C4 C5 C6 C7
Pressure [psig] 1400 1400 1400 1400 1400
Reaction Temperature [°C] 325 330 335 340 345
WHSV [h-1] 0.2 0.2 0.2 0.2 0.2
Catalyst Matrix CAT-M3 CAT-M3 CAT-M3 CAT-M3 CAT-M3
Water Yield [%] 5.8 6.8 7.5 8.8 8.6
Gas Yield [%] 3.4 3.6 3.8 3.5 3.4
Naphta Yield (28 - 190 °C) [%] 2.1 3.2 3.6 4.2 4.0 5.1
Jet FuelYield (190 - 260 °C) [%] 5.2 8.1 7.9 9.2 9.3 9.4
Diesel Yield (260 - 343 °C) [%] 10.5 20.5 20.5 22.7 23.8 23.7
VGO Yield (343 - 550 °C) [%] 26.5 25.3 23.9 27.1 26.8 27.7
Residue Yield (550°C+) [%] 55.8 33.7 33.8 25.5 24.1 22.1
CS2 Insolubles Yield [%] 4.6 7.0 3.4 3.1 3.9
Conversion (343 °C+) [%] 0.0 28.3 29.9 36.0 38.1 39.5
SIMULATED DISTILLATION 0 162.5 166.40 165.45 165.30 166.77 165.05
5 225.7 204.95 197.20 191.60 192.80 182.50
10 267.9 239.45 234.45 227.60 227.30 221.85
15 301.5 271.50 266.70 256.55 256.50 247.35
20 333.3 296.35 292.65 283.45 281.90 274.85
25 356.2 309.45 307.50 302.75 301.20 296.10
30 368.1 320.05 315.85 310.75 308.60 308.90
35 387.9 336.60 332.30 322.10 319.00 314.35
40 419.6 351.65 348.05 336.85 333.17 328.90
45 458.1 378.95 368.30 351.65 348.00 341.45
50 503.3 414.25 403.60 374.30 365.97 356.10
55 561.3 444.25 431.85 408.15 398.70 382.40
60 633.4 491.35 478.35 435.90 427.57 415.45
65 0.0 537.00 525.40 471.70 461.83 441.10
70 0.0 591.10 576.55 513.45 502.87 477.55
75 0.0 652.00 637.40 560.05 547.70 519.25
80 0.0 701.35 695.05 615.00 598.93 565.60
85 0.0 0.00 0.00 0.00 0.00 0.00
90 0.0 0.00 0.00 0.00 0.00 0.00
95 0.0 0.00 0.00 0.00 0.00 0.00
100 0.0 0.00 0.00 0.00 0.00 0.00

94
Table 7. Pilot plant data and operational conditions for reaction #5 and #6
RUN DATA Reaction #4 Reaction #5
C1 C2 C3 C1 C2 C3
Mass Balance MB3 MB2 MB2 MB2 MB2 MB1
Pressure [psig] 1400 1400 1400 1400 1400 1400
Reaction Temperature [°C] 330 340 335 330 335 340
WHSV CAT-M3 [h-1] 0.2 0.2 0.2 0.2 0.2 0.2
WHSV CAT-+ [h-1] 0.5 0.5 0.5 - - -
Residence Time [min] 300 300 300 300 300 300
Mass Balance Time [min] 720 720 720 720 720 720
Time on Stream [h] 66.0 126.0 186.0 49.0 85.0 121.0
Hydrocarbon Feed Flow [cc/min] 0.0691 0.0691 0.0691 0.0927 0.0927 0.0927
Hydrogen to Oil ratio [v/v] 1150 1150 1150 1150 1150 1150
Hydrogen Feed Flow [sccm] 79.47 79.47 79.47 106.61 106.61 106.61
Total Liquid Hydrocarbon Feed [g] 49.75 49.75 49.75 66.74 66.74 66.74
Catalyst Matrix CAT-M3+ CAT-M3+ CAT-M3+ CAT-M4 CAT-M4 CAT-M4
LIQUID PRODUCTS
Light Product - Light Collector [g] 4.95 6.04 5.39 4.06 4.56 5.66
Heavy Product [g] 43.51 41.93 40.45 58.32 61.17 57.69
Light Hydrocarbon Product [g] 1.76 2.06 2.21 0.99 1.26 1.25
Heavy Hydrocarbon Product [g] 43.42 41.82 40.33 57.94 60.98 57.54
Total Liquid Hydrocarbon Product [g] 45.18 43.88 42.54 58.93 62.24 58.78
Water in Light Collector [g] 3.18 3.98 3.17 3.08 3.30 4.41
Water in Total Liquid HC Product [g] 0.09 0.12 0.13 0.38 0.19 0.16
Total Water Collected [g] 3.27 4.10 3.30 3.46 3.49 4.57
% Light HC Product 3.90 4.69 5.20 1.67 2.02 2.12
% Heavy HC Product 96.10 95.31 94.80 98.33 97.98 97.88
GAS PRODUCTS
Measured Gas Flow [sccm] 54.30 65.72 60.64 104.41 103.24 104.41
Hydrogen Content in Gas [% v/v] 97.70 97.70 97.70 97.70 97.70 97.70
Gas HC Product Flow [sccm] 1.25 1.51 1.39 2.40 2.37 2.40
Gas HC Product [g] 1.55 1.74 1.61 2.77 2.74 2.77
SOLID PRODUCTS
CS2 Insolubles [g] 3.72 2.56 3.00 5.98 6.62 5.41
TOTAL PRODUCTS
Total Hydrocarbon Product [g] 46.73 45.61 44.15 61.70 64.98 61.55
USEFUL CALCULATIONS
Overall Mass Balance [%] 100.5 99.9 95.4 97.6 102.6 99.1
Hydrocarbon Yield [%] 93.9 91.7 88.7 92.4 97.4 92.2
Water Yield [%] 6.5 8.2 7.0 5.3 5.1 6.9
Gas Yield [%] 3.1 3.5 3.4 4.2 4.0 4.2
Liquid Yield [%] 89.5 91.3 90.3 86.6 86.3 87.6
Liquid HC Yield [%] 82.9 83.1 83.3 81.3 81.2 80.7
CS2 Insolubles Yield [%] 7.4 5.2 6.3 9.2 9.7 8.2

95
Table 8.SimDist raw data and calculated results for reaction #5 and #6
RUN DATA FEED Reaction #4 Reaction #5
C1 C2 C3 C1 C3
Pressure [psig] 1400 1400 1400 1400 1400
Reaction Temperature [°C] 330 340 335 330 340
WHSV CAT-M3 [h-1] 0.2 0.2 0.2 0.2 0.2
WHSV CAT-+ [h-1] 0.5 0.5 0.5 - -
Catalyst Matrix CAT-M3+ CAT-M3+ CAT-M3+ CAT-M4 CAT-M4
Water Yield [%] 7.3 8.2 7.9 5.7 6.1
Gas Yield [%] 3.2 3.5 3.4 4.1 4.3
Naphta Yield (28 - 190 °C) [%] 2.1 3.7 4.6 3.8 4.3 3.4
Jet Fuel Yield (190 - 260 °C) [%] 5.2 7.1 7.7 8.6 8.0 7.9
Diesel Yield (260 - 343 °C) [%] 10.5 15.8 17.4 21.7 17.5 19.0
VGO Yield (343 - 550 °C) [%] 26.5 22.2 23.1 24.7 24.3 24.9
Residue Yield (550°C+) [%] 55.8 40.7 35.5 30.8 36.0 34.5
CS2 Insolubles Yield [%] 7.3 5.1 6.2 9.1 8.3
Conversion (343 °C+) [%] 0.0 23.5 28.9 32.6 26.7 28.3
SIMULATED DISTILLATION
0 162.5 164.95 164.40 167.00 163.75 165.75
5 225.7 195.60 184.60 193.50 187.65 200.25
10 267.9 237.55 227.90 229.30 227.40 235.10
15 301.5 272.75 260.95 260.20 258.70 267.20
20 333.3 302.40 291.65 286.80 288.65 294.65
25 356.2 316.75 312.90 304.10 308.80 312.15
30 368.1 334.00 322.50 310.10 317.90 319.65
35 387.9 353.35 340.70 325.30 337.10 336.85
40 419.6 377.40 357.55 339.60 354.80 352.85
45 458.1 417.70 386.50 354.70 380.00 374.50
50 503.3 454.30 425.95 382.00 416.25 410.35
55 561.3 501.00 461.95 418.00 446.75 441.35
60 633.4 557.70 509.55 449.30 487.70 478.50
65 0.0 628.40 569.10 494.20 532.55 523.05
70 0.0 701.40 648.15 543.00 583.90 574.25
75 0.0 0.00 0.00 0.00 0.00 0.00
80 0.0 0.00 0.00 0.00 0.00 0.00
85 0.0 0.00 0.00 0.00 0.00 0.00
90 0.0 0.00 0.00 0.00 0.00 0.00
95 0.0 0.00 0.00 0.00 0.00 0.00
100 0.0 0.00 0.00 0.00 0.00 0.00

96
Appendix III. Hydrogen consumption calculation
To calculate the Hydrogen consumption it is important to know how much hydrogen is
entering to the system (through the feed and the hydrogen flow) and how much hydrogen is exiting
the process. In this case, hydrogen is coming out in the form of the gases produced in hydrotreating,
in the HDT-bio-oil and in the water produced. The assumption made for this calculation is that the
density of the feed was assumed to be 1 g/mL.
To calculate the hydrogen utilized to hydrogenate the HDT-bio-oil, a balance in carbon will
be made and the H/C ratio will be used. Then, the first step is to calculate the grams of C and H in
the feed entering the HDT process per hour. The elemental analysis of the feed are used to calculate
the flow of H and C per hour for the feed.
�̇�𝐻 (𝑜𝑖𝑙) [𝑔 𝐻
ℎ] = (�̇�𝑜𝑖𝑙 [
𝑔 𝑜𝑖𝑙
ℎ] ∗ 𝑥𝐻 𝑓𝑒𝑒𝑑 [
𝑔𝐻
𝑔 𝑜𝑖𝑙])
�̇�𝐶 (𝑜𝑖𝑙) [𝑔 𝐶
ℎ] = (�̇�𝑜𝑖𝑙 [
𝑔 𝑜𝑖𝑙
ℎ] ∗ 𝑥𝐶 𝑓𝑒𝑒𝑑 [
𝑔𝐶
𝑔 𝑜𝑖𝑙])
Next, the grams of H and C per hour in the gases exiting the system are calculated.
�̇�𝐻 (𝑔𝑎𝑠)𝑖 [𝑔 𝐻
ℎ] = (�̇�𝑔𝑎𝑠 [
𝑚𝐿 𝑔𝑎𝑠
ℎ] ∗ 𝑥𝑖 [
𝑚𝐿 𝑖
𝑚𝐿 𝑔𝑎𝑠]) ∗ (𝜌𝑖 [
𝑔 𝑖
𝑚𝐿 𝑖]) ∗ (
1
𝑀𝑖[𝑚𝑜𝑙 𝑖
𝑔 𝑖]) ∗ (#𝑚𝑜𝑙 [
𝑚𝑜𝑙 𝐻
𝑚𝑜𝑙 𝑖]) ∗ 𝑀𝐻 [
𝑔 𝐻
1 𝑚𝑜𝑙 𝐻]
�̇�𝐶 (𝑔𝑎𝑠)𝑖 [𝑔 𝐶
ℎ] = (�̇�𝑔𝑎𝑠 [
𝑚𝐿 𝑔𝑎𝑠
ℎ] ∗ 𝑥𝑖 [
𝑚𝐿 𝑖
𝑚𝐿 𝑔𝑎𝑠]) ∗ (𝜌𝑖 [
𝑔 𝑖
𝑚𝐿 𝑖]) ∗ (
1
𝑀𝑖[𝑚𝑜𝑙 𝑖
𝑔 𝑖]) ∗ (#𝑚𝑜𝑙 [
𝑚𝑜𝑙 𝐶
𝑚𝑜𝑙 𝑖]) ∗ 𝑀𝐶 [
𝑔 𝐶
1 𝑚𝑜𝑙 𝐶]

97
�̇�𝐻 (𝑔𝑎𝑠)𝑡𝑜𝑡𝑎𝑙 [𝑔 𝐻
ℎ] = ∑ �̇�𝐻 (𝑔𝑎𝑠)𝑖
𝑛
𝑖=1
�̇�𝐶 (𝑔𝑎𝑠)𝑡𝑜𝑡𝑎𝑙 [𝑔 𝐶
ℎ] = ∑ �̇�𝐶 (𝑔𝑎𝑠)𝑖
𝑛
𝑖=1
Once, the carbon and hydrogen from the gases are calculated, the grams of H and C from the
HDT-bio-oil per hour can be obtained. Additionally, the grams of H per hour from the water are
calculated.
�̇�𝐶 (𝐻𝐷𝑇𝑜𝑖𝑙) [𝑔 𝐶
ℎ] = (�̇�𝐶 (𝑜𝑖𝑙) − �̇�𝐶 (𝑔𝑎𝑠)𝑡𝑜𝑡𝑎𝑙 )
(𝐻
𝐶)
𝐻𝐷𝑇𝑜𝑖𝑙[𝑔 𝐻
𝑔 𝐶] =
𝑥𝐻2𝐻𝐷𝑇𝑜𝑖𝑙 [𝑔𝐻
𝑔 𝑜𝑖𝑙]
𝑥𝐶 𝐻𝐷𝑇𝑜𝑖𝑙 [𝑔𝐶
𝑔 𝑜𝑖𝑙]
�̇�𝐻 (𝐻𝐷𝑇𝑜𝑖𝑙) [𝑔 𝐻
ℎ] = (�̇�𝐶 (𝐻𝐷𝑇𝑜𝑖𝑙) [
𝑔 𝐶
ℎ] ∗ (
𝐻
𝐶)
𝐻𝐷𝑇𝑜𝑖𝑙[𝑔 𝐻
𝑔 𝐶])
�̇� 𝐻(𝐻2𝑂) [𝑔 𝐻
ℎ] = (�̇�𝐻2𝑂 [
𝑔 𝐻2𝑂
ℎ] ∗
1
𝑀𝐻2𝑂[𝑚𝑜𝑙 𝐻2𝑂
𝑔 𝐻2𝑂] ∗ #𝑚𝑜𝑙 [
𝑚𝑜𝑙 𝐻
𝑚𝑜𝑙 𝐻2𝑂] ∗ 𝑀𝐻 [
𝑔 𝐻
𝑚𝑜𝑙 𝐻])
Knowing the mass of hydrogen per hour that entered and exited the process, it can now be
calculated the hydrogen consumption.
�̇�𝐻 (𝐸𝑥𝑖𝑡) [𝑔 𝐻
ℎ] = �̇�𝐻 (𝑔𝑎𝑠)𝑡𝑜𝑡𝑎𝑙 + �̇�𝐻 (𝐻𝐷𝑇𝑜𝑖𝑙) + �̇� 𝐻(𝐻2𝑂)
𝐻 𝑐𝑜𝑛𝑠𝑢𝑚𝑒𝑑 [𝑔 𝐻
ℎ] = �̇�𝐻 (𝐸𝑥𝑖𝑡) − �̇�𝐻 (𝑜𝑖𝑙)
yield𝐻2 𝑐𝑜𝑛𝑠𝑢𝑚𝑒𝑑 [𝑔 𝐻2
𝑔 𝑜𝑖𝑙] =
𝐻2 𝑐𝑜𝑛𝑠𝑢𝑚𝑒𝑑 [𝑔 𝐻
ℎ] ∗
1𝑀𝐻
[𝑚𝑜𝑙 𝐻
𝑔 𝐻] ∗ #𝑚𝑜𝑙 [
𝑚𝑜𝑙 𝐻2𝑚𝑜𝑙 𝐻
] ∗ 𝑀𝐻2[
𝑔 𝐻2
𝑚𝑜𝑙 𝐻2]
�̇�𝑜𝑖𝑙 [𝑔 𝑜𝑖𝑙
ℎ]