Embed Size (px)
Citation preview
Limit of Detection
Ubiquitin IMS
Instrument Layout & Control Software .
A) Ion Mobility Spectrometer (IMS) layout as shown in Graphical User Interface (GUI) of the instrument control software. B) Experimental sequences used for encoding raw data with Ion Mobility Spectrometer (IMS) coupled to Q Exactive mass spectrometer.
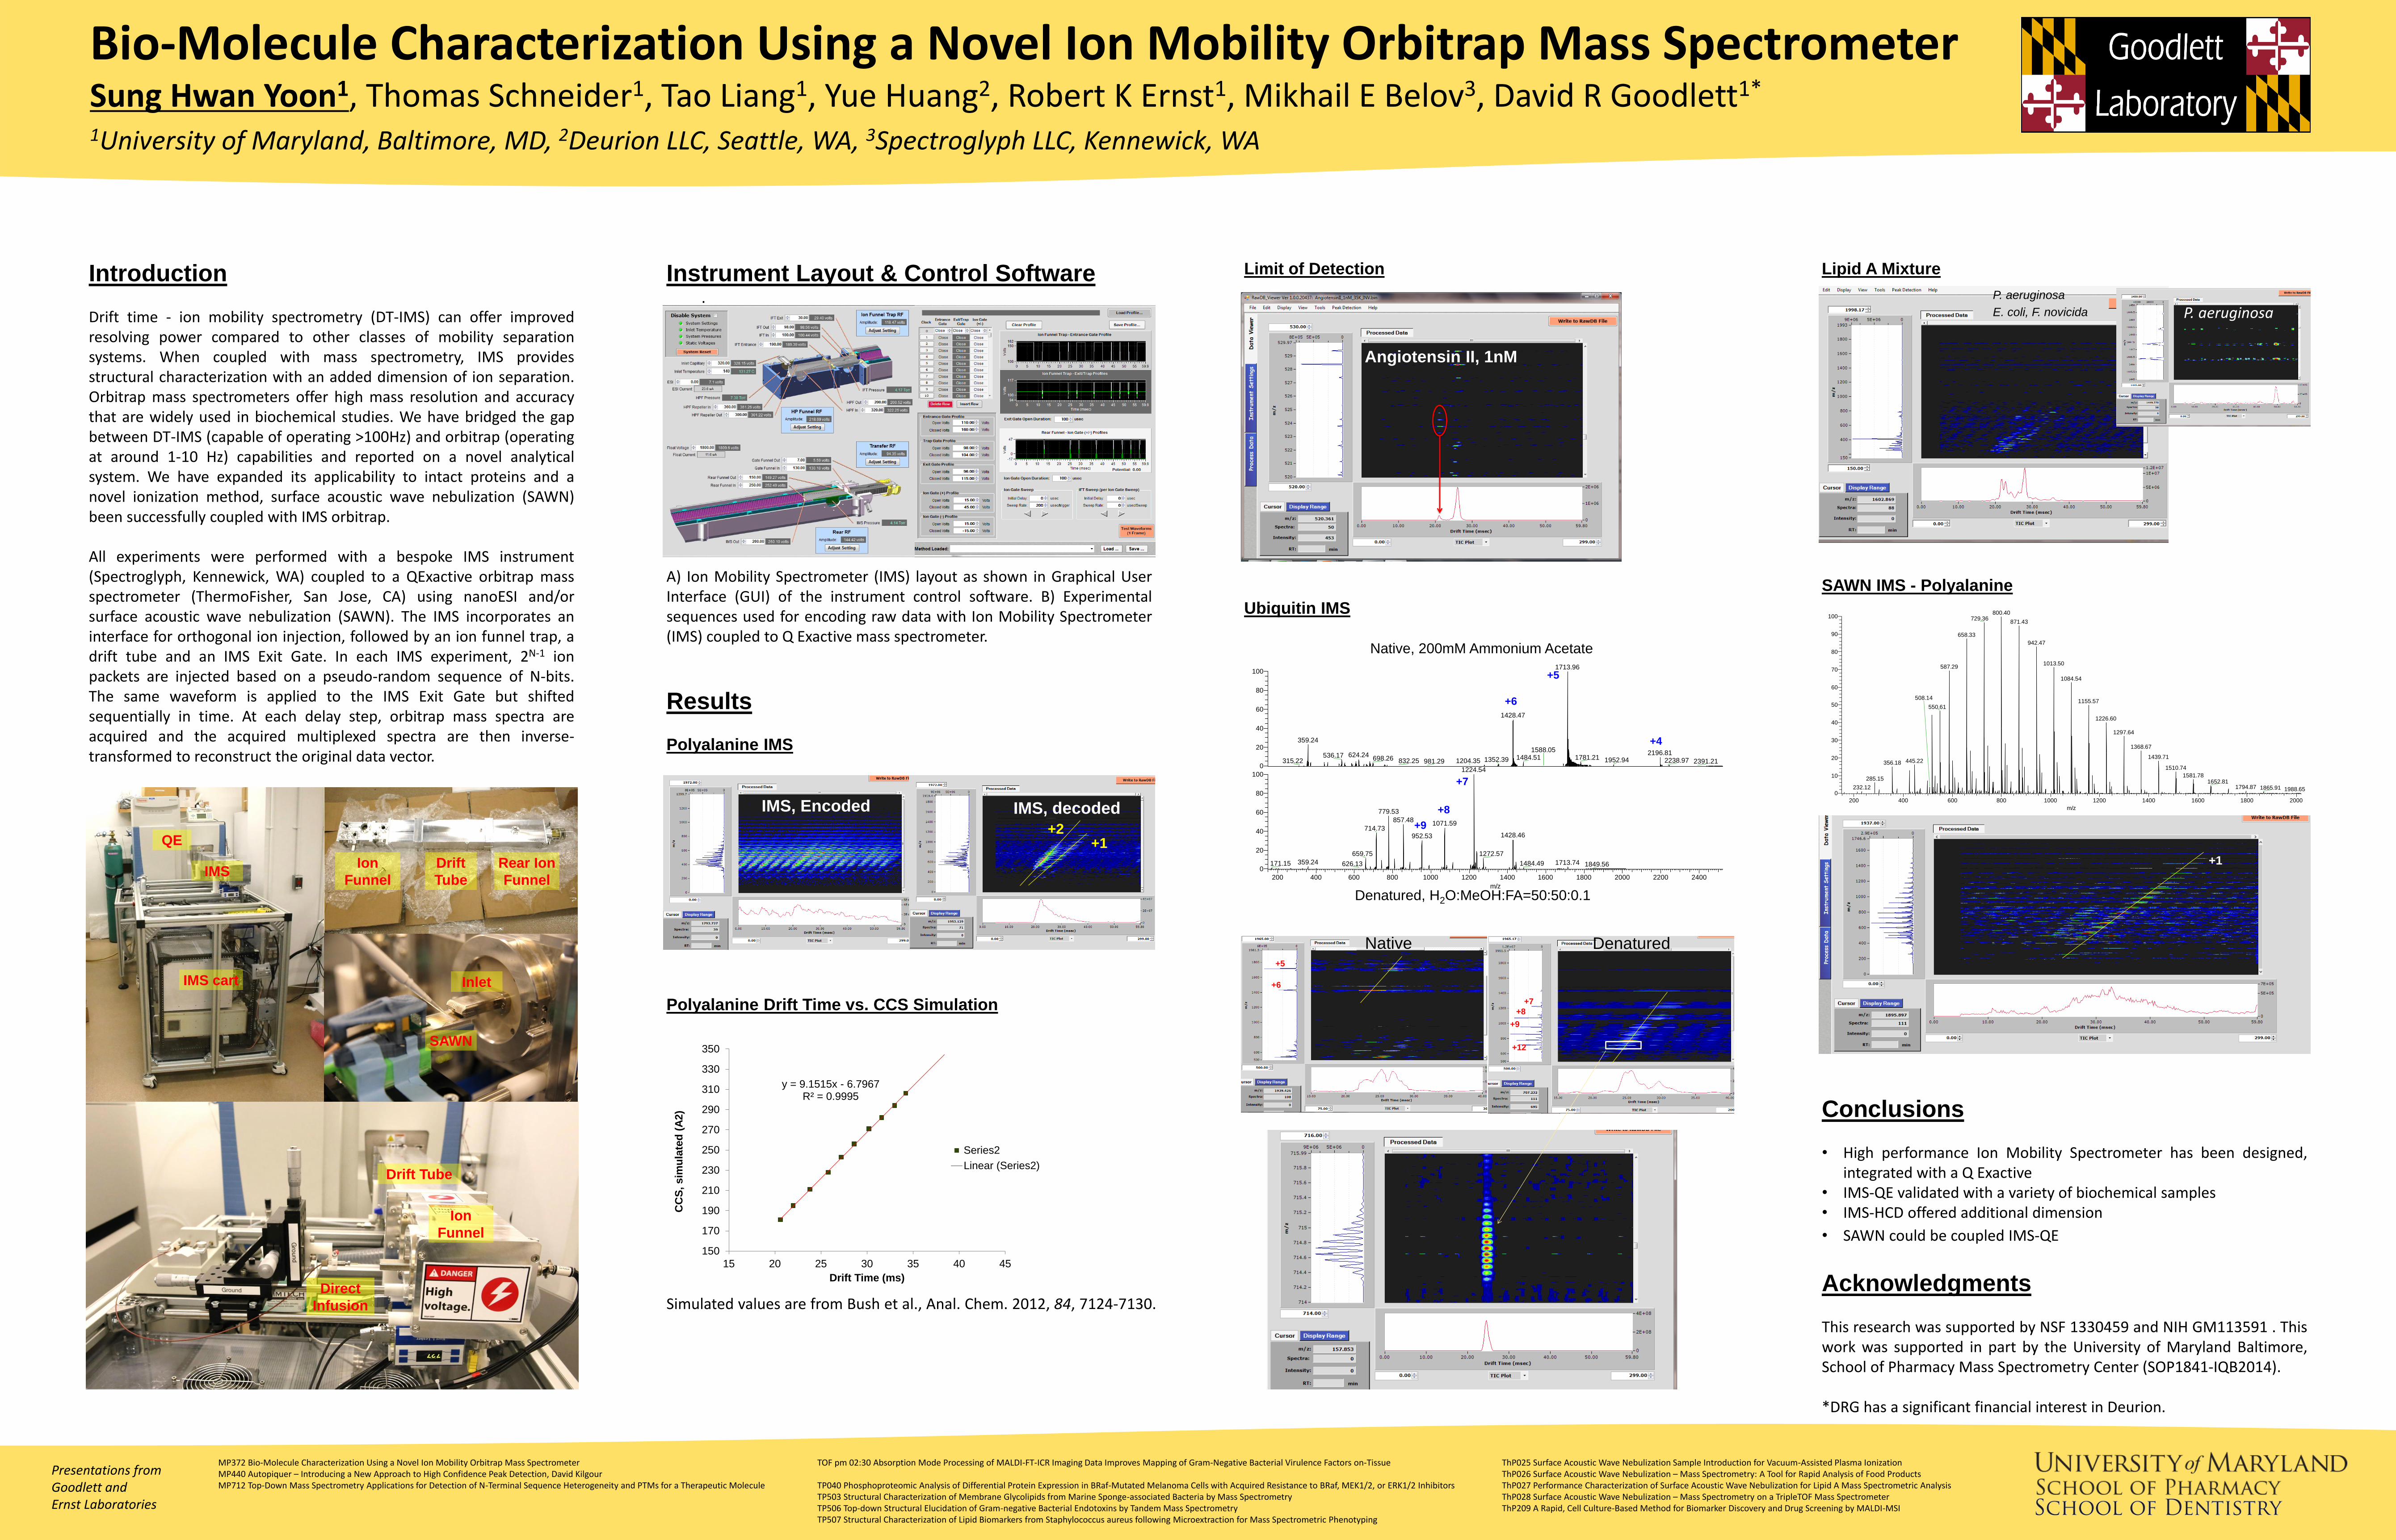
Results Polyalanine IMS Polyalanine Drift Time vs. CCS Simulation Simulated values are from Bush et al., Anal. Chem. 2012, 84, 7124-7130.
Introduction Drift time - ion mobility spectrometry (DT-IMS) can offer improved resolving power compared to other classes of mobility separation systems. When coupled with mass spectrometry, IMS provides structural characterization with an added dimension of ion separation. Orbitrap mass spectrometers offer high mass resolution and accuracy that are widely used in biochemical studies. We have bridged the gap between DT-IMS (capable of operating >100Hz) and orbitrap (operating at around 1-10 Hz) capabilities and reported on a novel analytical system. We have expanded its applicability to intact proteins and a novel ionization method, surface acoustic wave nebulization (SAWN) been successfully coupled with IMS orbitrap. All experiments were performed with a bespoke IMS instrument (Spectroglyph, Kennewick, WA) coupled to a QExactive orbitrap mass spectrometer (ThermoFisher, San Jose, CA) using nanoESI and/or surface acoustic wave nebulization (SAWN). The IMS incorporates an interface for orthogonal ion injection, followed by an ion funnel trap, a drift tube and an IMS Exit Gate. In each IMS experiment, 2N-1 ion packets are injected based on a pseudo-random sequence of N-bits. The same waveform is applied to the IMS Exit Gate but shifted sequentially in time. At each delay step, orbitrap mass spectra are acquired and the acquired multiplexed spectra are then inverse-transformed to reconstruct the original data vector.
Bio-Molecule Characterization Using a Novel Ion Mobility Orbitrap Mass Spectrometer Sung Hwan Yoon1, Thomas Schneider1, Tao Liang1, Yue Huang2, Robert K Ernst1, Mikhail E Belov3, David R Goodlett1*
1University of Maryland, Baltimore, MD, 2Deurion LLC, Seattle, WA, 3Spectroglyph LLC, Kennewick, WA
MP372 Bio-Molecule Characterization Using a Novel Ion Mobility Orbitrap Mass Spectrometer MP440 Autopiquer – Introducing a New Approach to High Confidence Peak Detection, David Kilgour MP712 Top-Down Mass Spectrometry Applications for Detection of N-Terminal Sequence Heterogeneity and PTMs for a Therapeutic Molecule
TOF pm 02:30 Absorption Mode Processing of MALDI-FT-ICR Imaging Data Improves Mapping of Gram-Negative Bacterial Virulence Factors on-Tissue TP040 Phosphoproteomic Analysis of Differential Protein Expression in BRaf-Mutated Melanoma Cells with Acquired Resistance to BRaf, MEK1/2, or ERK1/2 Inhibitors TP503 Structural Characterization of Membrane Glycolipids from Marine Sponge-associated Bacteria by Mass Spectrometry TP506 Top-down Structural Elucidation of Gram-negative Bacterial Endotoxins by Tandem Mass Spectrometry TP507 Structural Characterization of Lipid Biomarkers from Staphylococcus aureus following Microextraction for Mass Spectrometric Phenotyping
Presentations from Goodlett and Ernst Laboratories
Lipid A Mixture
SAWN IMS - Polyalanine
Conclusions • High performance Ion Mobility Spectrometer has been designed,
integrated with a Q Exactive • IMS-QE validated with a variety of biochemical samples • IMS-HCD offered additional dimension
• SAWN could be coupled IMS-QE
Acknowledgments This research was supported by NSF 1330459 and NIH GM113591 . This work was supported in part by the University of Maryland Baltimore, School of Pharmacy Mass Spectrometry Center (SOP1841-IQB2014). *DRG has a significant financial interest in Deurion.
ThP025 Surface Acoustic Wave Nebulization Sample Introduction for Vacuum-Assisted Plasma Ionization ThP026 Surface Acoustic Wave Nebulization – Mass Spectrometry: A Tool for Rapid Analysis of Food Products ThP027 Performance Characterization of Surface Acoustic Wave Nebulization for Lipid A Mass Spectrometric Analysis ThP028 Surface Acoustic Wave Nebulization – Mass Spectrometry on a TripleTOF Mass Spectrometer ThP209 A Rapid, Cell Culture-Based Method for Biomarker Discovery and Drug Screening by MALDI-MSI
QE
IMS
IMS cart
SAWN
Inlet
Ion
Funnel
Drift
Tube
Rear Ion
Funnel
Direct
Infusion
Ion
Funnel
Drift Tube
y = 9.1515x - 6.7967 R² = 0.9995
150
170
190
210
230
250
270
290
310
330
350
15 20 25 30 35 40 45
CC
S,
sim
ula
ted
(A
2)
Drift Time (ms)
Series2
Linear (Series2)
Angiotensin II, 1nM
200 400 600 800 1000 1200 1400 1600 1800 2000 2200 2400
m/z
0
20
40
60
80
100
0
20
40
60
80
100
Re
lative
Ab
un
da
nce
1713.96
1428.47
359.24
2196.81624.24536.17 1781.211484.51698.26 1352.39 1952.94 2238.971204.35315.22 832.25
1588.05
981.29 2391.21
1224.54
779.53
857.481071.59
714.731428.46952.53
1272.57659.75
359.24 1713.74171.15 1484.49626.13 1849.56
NL: 7.88E4
no ims ubi native 70k#1-75 RT: 0.01-1.00 AV: 75 T: FTMS + p NSI Full ms [200.00-2500.00]
NL: 1.73E6
no ims denatured ubi 001#1-137 RT: 0.01-1.00 AV: 137 T: FTMS + p NSI Full ms [150.00-2000.00]
Native, 200mM Ammonium Acetate
Denatured, H2O:MeOH:FA=50:50:0.1
+5
+6
+7
+8
+9
+4
IMS, Encoded IMS, decoded
+2 +1
+5
+6
+7
+8
+9
Native Denatured
+12
P. aeruginosa
E. coli, F. novicida
P. aeruginosa
SAWN_pAla_IMS01 #1-305 RT: 0.01-2.13 AV: 305 NL: 3.21E3T: FTMS + p NSI Full ms2 [email protected] [150.00-2000.00]
200 400 600 800 1000 1200 1400 1600 1800 2000
m/z
0
10
20
30
40
50
60
70
80
90
100
Re
lative
Ab
un
da
nce
800.40729.36
871.43
658.33
942.47
1013.50587.29
1084.54
1155.57550.61
1226.60
1297.64
1368.67
1439.71445.22356.18
1510.74
1581.78285.15
1652.81
508.14
1794.87232.12 1865.91 1988.65
+1