Embed Size (px)
Citation preview

Saria., Tanzania J. Sci & Technol., (2020), Vol. 3(2), 1– 16
1
Assessment of Minerals, Heavy Metals in Soil and Vegetables Cultivated in
Mbezi Luis, Ubungo Municipality: Associated Health Risks to Consumers
Josephat Alexander Saria*
Department of Environmental Studies,
The Open University of Tanzania
P. O. Box 23409, Dar es Salaam, Tanzania
Abstract:
The present study was intended to determine the levels of minerals and heavy metals in Green
Leafy Vegetables (GLV) and soil at Ubungo, Dar es Salaam City, so as to establish the risk
associated with consumption of these vegetables. These GLV can absorb heavy metals through
contaminated soil and irrigation water sources. The samples were digested by dry-ashing
techniques and the minerals and heavy metals were determined using atomic Absorption
Spectrophotometry (AAS).The concentration of Pb in all GLV samples ranged between 0.23 and
8.51 mg/kg, where about 78% were higher than TBS acceptable limit (0.3 mg/kg). Zinc
concentration ranged from 26.24 mg/kg to 57.34 mg/kg where about 22% of these GLV detected
high concentration than joint FAO/WHO allowable limit of 47.4 mg/kg. The heavy metals
concentration in the soil was 24.41 mg/kg for Pb and 9.60 mg/kg, both of them lower than
WHO/FAO permissible limit of 50 mg/kg and 300 mg/kg respectively. The ratio between sodium
and potassium in all samples analysed is < 1. Therefore, consumption of the selected leafy
vegetables in this study could probably serve to reduce high blood pressure diseases to
consumers. The Target Hazard Quotient (THQ) showed that Pb ranged between 0.001 – 0.026,
while Zn ranged between 0.081 – 0.178. These values were far less than 1 in all the vegetables
species. Therefore, there is no health risk associated with the current level of exposure to a given
substance and the population under study is considered to be safe. Mineral content analyzed in
this study showed that the vegetables contained appreciable amounts of macro-minerals like
magnesium, calcium and potassium which work synergistically to maintain optimal health by
keeping the body and tissue fluids from being too acidic or too alkaline and hence allowing for
exchange of nutrients between body cells.
Keywords: green leafy vegetable, daily intake, heavy metals, hazard quotient, Dar es Salaam
* Corresponding author: [email protected], +255 65 532 8346

Saria., Tanzania J. Sci & Technol., (2020), Vol. 3(2), 1– 16
2
1. Introduction
In Sub-Saharan Africa, the urbanization
phenomena has led to an increase in urban
food demand and changes in diets that are
coupled with increased demands for a
wider range of food types that serve the
emerging middle-class markets (Laura,
2016). The rapid urbanization that is
taking place goes together with a rapid
increase in urban poverty and urban food
insecurity (Boeing, 2016). The most
striking feature of urban agriculture, which
distinguishes it from rural agriculture, is
that it is integrated into the urban
economic and ecological system: urban
agriculture is embedded in interacting with
the urban ecosystem (Skar, et al., 2020).
Such linkages include the use of urban
residents as laborers, use of typical urban
resources like organic waste as compost
and urban wastewater for irrigation
(Laura, 2016). Also direct links with urban
consumers, direct impacts on urban
ecology (positive and negative), being part
of the urban food system, competing for
land with other urban functions, being
influenced by urban policies and plans
(Algert, et al., 2006).
Other than increase in urban food
demands, the increase of urban
populations has far outpaced sanitation
infrastructure and service delivery (Asoka,
et al., 2013). About 2.6 billion people in
the developing world lack access to basic
sanitation infrastructure. Hutton and
Varughese (2016) estimated that in 2012
the proportion of Tanzania’s Gross
Domestic Product (GDP) that was invested
in sanitation was less than 0.1%. People
living in these areas usually use traditional
latrines which are not connected to a septic
tank and so wastewater soaks into the
ground. This is particularly problematic
during rainy season when rainwater
washes the latrine waste into city water
sources, streams, rivers and streets and
hence used to irrigate GLV grown around
these contaminated water sources due to
scarcity of treated water supply.
The effect of heavy metal contamination
of GLV cannot be underestimated as these
foodstuffs are important components of
human diet. The GLV are rich sources of
vitamins, minerals, and fibers and also
have beneficial ant oxidative effects
(Sathawara, et al., 2004). The study
conducted earlier in Bangladesh by
Tasrina, et al., (2015), detected the
concentration of lead (Pb) in vegetables
was found in toxic level, which were
varied from 0.119 mg/kg to 1.596 mg/kg.
The highest lead content was found in
spinach amarantha (1.596 mg/kg) while in
cabbage it was lowest in concentration
(0.119 mg/kg).
Africa is not exceptional in heavy metal
contamination in vegetables. For example
Afolayan and Bvenura (2012) in South
Africa, in their study conducted in
vegetables cultivated in home gardens; in
Brassica oleracea (cabbage), Daucus
carota (carrot), Allium cepa (onion),
Spinacia oleracea (spinach) and Solanum
lycopersicum (tomato), they detected the
concentrations vegetables in the ranged
from 0.01mg/kg – 1.12 mg/kg for
cadmium, 0.92 mg/kg – 9.29 mg/kg for
copper, 0.04 mg/kg – 373.38 mg/kg for
manganese and 4.27 mg/kg – 89.88 mg/kg
for zinc in the respective vegetables.
In another study conducted in Dar es
Salaam city (Kihampa, 2013) detected
high levels of several heavy metals in
streams/rivers, soils and vegetables grown
along streams and river banks. According
to Kihampa, et al., (2011), the primary
source of the heavy metals is considered to
be untreated or treated wastewater from
industries that discharge their wastewater
directly into streams and rivers, effluents
from municipal wastewater treatment
plants (MWWTPs).

Saria., Tanzania J. Sci & Technol., (2020), Vol. 3(2), 1– 16
3
The heavy metal pollution is one of the
serious ecological/environmental concerns
due to the fact that they are not easily
biodegradable or metabolized, thus
precipitating far reaching effects on the
biological system such as human, animals,
plants and other soil biota (Saria, 2017;
Yoon, 2003). Heavy metals enter the body
system through food, air and water and
bio-accumulate over a period of time
(Duruibe, et al., 2007). Excess heavy
metal accumulation in the environment has
toxicological implication in humans and
other animals (Saria, 2016). There are
several sources of heavy metals to
contaminate the environment as they are
summarized in Figure 1 (Khan, et al.,
2008).
Pollutants Sources of Heavy Metals
Sationary SourceMobile Source
Others
Smoke and
Dust of Industries
na Mine
Sewage
and Sluge
Mine Waste
Solid Waste
Incinerator's
By-products
Auto-exhaust
Highway Dust
Waste Metal
Sludge Compost
Rubbish Compost
Pesticides
Fertilizer
used in
Agriculture
Deposition Irrigation Stocking Deposition Sedimentation Application
Pollution
Accummulation in GLV
Health Hazards
Figure 1. Sources of heavy metals in the environment
Green leafy vegetables (GLV) are precious
source of vitamins, minerals, dietary fiber
and anti oxidants (Sobukola, et al., 2010;
Sharma, et al., 2009). Recently, there is an
increased trend of consumption of GLV,
particularly among the urban community.
However, both vital and lethal elements
are present in GLV. They can absorb
heavy metals through contaminated soil
and irrigation water sources. Further GLV
have the ability to absorb the metals
deposited on plant surfaces exposed to the
polluted environments.
Consumption of the contaminated GLV
with heavy metals in a chronic level
through soil and hence to vegetables has
adverse impacts on human and has
harmful impacts only after several years of
exposure (Ikeda, et al., 2000). However,
the consumption of heavy metal
contaminated GLV can seriously deplete
some essential nutrients in the body that
are further responsible for decreasing
immunological defenses. The current
study was intended to determine minerals
and heavy metals concentration in GLV

Saria., Tanzania J. Sci & Technol., (2020), Vol. 3(2), 1– 16
4
cultivated at Ubungo, Dar es Salaam city,
and then assesses the risk associated with
consumption of the vegetables used in the
city of Dar es Salaam.
2. Materials and Methods
2.1 Study Area
This study was conducted at Mbezi Luis
Ward in Ubungo Municipality (Fig 2)
(Mayunga, (2018).
Figure 2. Map of Dar es Salaam City
Showing Location of Ubungo District
The selection of Ubungo Municipality was
randomly selected from the three
municipal districts of the Dar es Salaam
city namely; Ilala, Kinondoni, Temeke,
Kigamboni and Ubungo. The Ubungo
Municipality has a total area of 260.40
square kilometres. According to the 2012
population Census (URT, 2012), the
Municipality had a population of 845,368
where male was 409,149 and female was
436,219. Mbezi Luis Ward Ward was
selected purposely because it is the fastest
growing Ward out of 14 wards of Ubungo
Municipality. According to the
government 2012 population census
(URT, 2012), Mbezi Luis Ward has a
population of 73,314 people where 35,637
were male and 37,777 were female with a
growth rate of 5% (URT, 2012).
2.2 Sample Collection
Samples of each GLV identified
commonly used in Ubungo Municipality
were taken in an interval of seven days
making a total of three samples each.
About 1 kg of GLV samples were obtained
from gardens of local farmers at Mbezi
Luis Ward, Ubungo Municipality, over a
period of three weeks from 5th
– 26th
August 2018 and kept in pre-cleaned
polyethylene bags. Three soil samples
(about 500 g each) were also taken from
the same vegetable gardens sampling site
and reserved in pre-cleaned polyethylene
bags. Each day the samples were
transferred to Chief Government
Chemistry Laboratory for analysis.
2.2.1 Sampling of Soil Samples
Soil samples were collected at depth of
about 15cm using hand auger, stored in
polyethylene bags and oven dried at 60°C
for 2 days, followed by grinding with
mortar and pestle and sieved using a 2 mm
sieve. About 1.0 g of the oven dried
ground sample was weighed into a 250 mL
beaker which has been previously washed
with nitric acid and distilled water. The
mixture of 5 mL of HNO3, 15 mL of
concentrated H2SO4 and 0.3 mL of HClO4
were added to the sample using pipette.
The mixture was digested in a fume
cupboard, heating continued until a dense
white fume appeared which was then
digested for 15 minutes, set aside to cool
and diluted with distilled water. The
mixture was filtered through acid washed
Whattman No.44 filter paper into a 50 mL
volumetric flask and diluted to mark

Saria., Tanzania J. Sci & Technol., (2020), Vol. 3(2), 1– 16
5
volume. The sample solution was then
aspirated into the Atomic Absorption
Spectroscopic machine at intervals.
2.2.2 Sampling and Treatment of Green
Leafy Vegetables
An investigation survey was conducted at
Mbezi Luis Ward Ward to identify locally
grown vegetables, site history and
marketing areas. Nine sampling locations
were established along the cultivated area
of closed river Mbezi. Twenty seven
samples (500 g each) of leaves vegetable
from nine different types of vegetables
namely Ipomoea sp, Brassica L,
.Corchorus L,.Lactuca Inermis Forssk,
Amaranthus sp, Cucurbita sp, Solanum sp,
Manihot esculenta Crantz, Bidens pilosa
L were collected. The collected samples
were wrapped in aluminium foils and
stored in polythene bags according to their
type and brought to the laboratory for
preparation and analysis. The vegetable
species were authenticated at the
Herbarium of the Department of Botany at
the University of Dar es Salaam, Tanzania
where voucher specimens are preserved.
Triplicate of each sample had their stalks
removed, rinsed with de-ionized water and
the residual moisture evaporated at room
temperature before sun-drying for 2 -3
days on a clean paper with constant
turning over to avert fungal growth.
Sample portions were dried in a drying
oven, at 105°C, until constant weight was
obtained then cooled to ambient
temperature, crushed by means of a clean
pestle and mortar to obtain homogenized
samples. About 2.0 g of each of the
processed samples was weighed and
subjected to dry aching in a well-cleaned
porcelain crucible at 550 0C in a muffle
furnace. The resultant ash was dissolved in
5.0 mL of HNO3/HCl/H2O (1:2:3) and
heated gently on a hot plate until brown
fumes disappeared. To the remaining
material in each crucible, 5.0 mL of de-
ionized water was added and heated until a
colourless solution was obtained. The
mineral solution in each crucible was
transferred into a 100.0 mL volumetric
flask by filtration through Whatman No.42
filter paper and the volume was made to
the mark with de-ionized water. This
prepared solution was used for elemental
analysis in Perking Elmer Analyst 100
AAS with Perking Elmer HGA 850
Graphite Furnace and Perking Elmer and
AS 800 Auto-sampler made in Germany.
2.2.3 Flame Atomic Absorption
Analysis
For Lead (Pb) and Zinc (Zn),
measurements were made using standard
hollow cathode lamps. The limit of
detection (LOD) of the analytical method
for each metal was calculated as being
triple the standard deviation of a series of
measurements for each solution, the
concentration of which is distinctly
detectable above the background level.
The value was 0.001 mg/kg for both
elements and the limit of quantification
(LOQ) of these elements were calculated
to be 0.003 mg/kg respectively.
For the rest of other metals the procedure
followed standardized method (Jońca and
Lewandowski, 2004; Temminghoff and
Houba, 2004). The concentration values in
correspond with measurements performed
using acetylene-nitrous oxide flame were
1.0 mg/L for sodium, potassium, 2.0 mg/L,
magnesium 0.5 mg/L and calcium 7.0
mg/L. This requires a multiple increase of
the dilution factor depending on the
concentration in the sample.
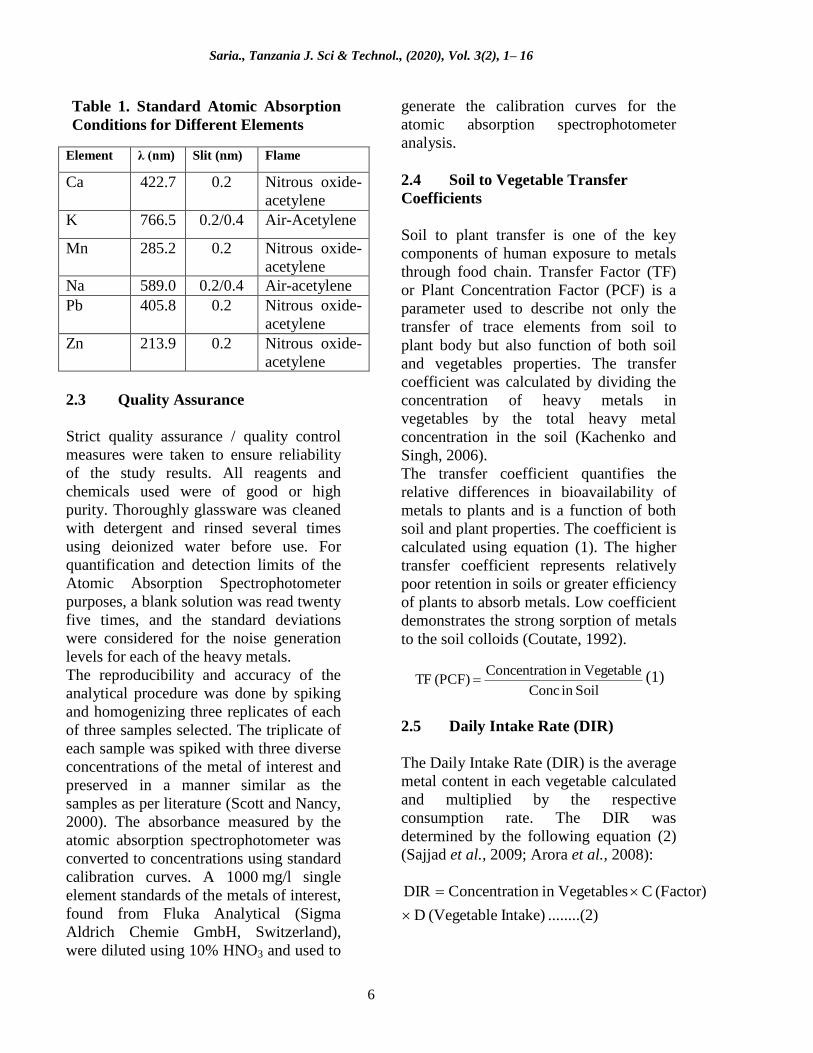
The standard operating conditions for the
analysis of heavy metals using atomic
absorption spectrometry used in our
experiments are given in Table 1 (Perkin-
Elmer, 1996).
Saria., Tanzania J. Sci & Technol., (2020), Vol. 3(2), 1– 16
6
Table 1. Standard Atomic Absorption
Conditions for Different Elements
Element λ (nm) Slit (nm) Flame
Ca 422.7 0.2 Nitrous oxide-
acetylene
K 766.5 0.2/0.4 Air-Acetylene
Mn 285.2 0.2 Nitrous oxide-
acetylene
Na 589.0 0.2/0.4 Air-acetylene
Pb 405.8 0.2 Nitrous oxide-
acetylene
Zn 213.9 0.2 Nitrous oxide-
acetylene
2.3 Quality Assurance
Strict quality assurance / quality control
measures were taken to ensure reliability
of the study results. All reagents and
chemicals used were of good or high
purity. Thoroughly glassware was cleaned
with detergent and rinsed several times
using deionized water before use. For
quantification and detection limits of the
Atomic Absorption Spectrophotometer
purposes, a blank solution was read twenty
five times, and the standard deviations
were considered for the noise generation
levels for each of the heavy metals.
The reproducibility and accuracy of the
analytical procedure was done by spiking
and homogenizing three replicates of each
of three samples selected. The triplicate of
each sample was spiked with three diverse
concentrations of the metal of interest and
preserved in a manner similar as the
samples as per literature (Scott and Nancy,
2000). The absorbance measured by the
atomic absorption spectrophotometer was
converted to concentrations using standard
calibration curves. A 1000 mg/l single
element standards of the metals of interest,
found from Fluka Analytical (Sigma
Aldrich Chemie GmbH, Switzerland),
were diluted using 10% HNO3 and used to
generate the calibration curves for the
atomic absorption spectrophotometer
analysis.
2.4 Soil to Vegetable Transfer
Coefficients
Soil to plant transfer is one of the key
components of human exposure to metals
through food chain. Transfer Factor (TF)
or Plant Concentration Factor (PCF) is a
parameter used to describe not only the
transfer of trace elements from soil to
plant body but also function of both soil
and vegetables properties. The transfer
coefficient was calculated by dividing the
concentration of heavy metals in
vegetables by the total heavy metal
concentration in the soil (Kachenko and
Singh, 2006).
The transfer coefficient quantifies the
relative differences in bioavailability of
metals to plants and is a function of both
soil and plant properties. The coefficient is
calculated using equation (1). The higher
transfer coefficient represents relatively
poor retention in soils or greater efficiency
of plants to absorb metals. Low coefficient
demonstrates the strong sorption of metals
to the soil colloids (Coutate, 1992).
Soilin Conc
Vegetablein ion Concentrat(PCF) TF (1)
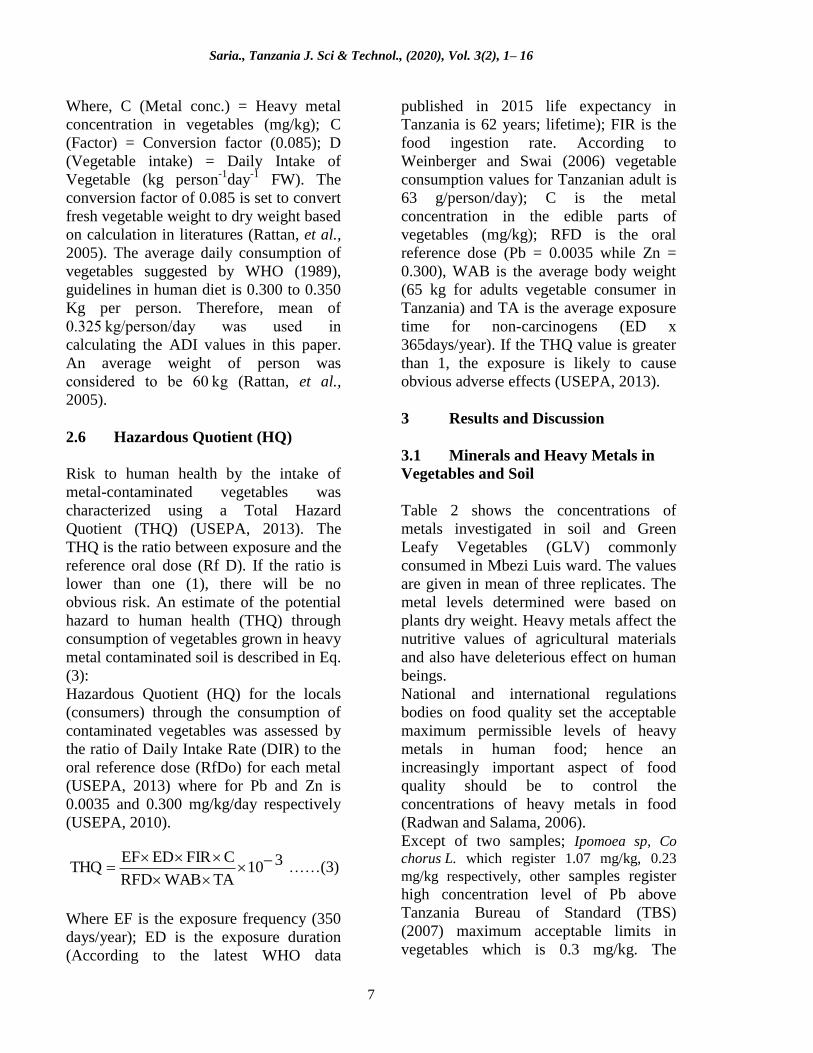
2.5 Daily Intake Rate (DIR)
The Daily Intake Rate (DIR) is the average
metal content in each vegetable calculated
and multiplied by the respective
consumption rate. The DIR was
determined by the following equation (2)
(Sajjad et al., 2009; Arora et al., 2008):
)........(2 Intake) (Vegetable D
(Factor) CVegetablesin ion ConcentratDIR
Saria., Tanzania J. Sci & Technol., (2020), Vol. 3(2), 1– 16
7
Where, C (Metal conc.) = Heavy metal
concentration in vegetables (mg/kg); C
(Factor) = Conversion factor (0.085); D
(Vegetable intake) = Daily Intake of
Vegetable (kg person-1
day-1
FW). The
conversion factor of 0.085 is set to convert
fresh vegetable weight to dry weight based
on calculation in literatures (Rattan, et al.,
2005). The average daily consumption of
vegetables suggested by WHO (1989),
guidelines in human diet is 0.300 to 0.350
Kg per person. Therefore, mean of
0.325 kg/person/day was used in
calculating the ADI values in this paper.
An average weight of person was
considered to be 60 kg (Rattan, et al.,
2005).
2.6 Hazardous Quotient (HQ)
Risk to human health by the intake of
metal-contaminated vegetables was
characterized using a Total Hazard
Quotient (THQ) (USEPA, 2013). The
THQ is the ratio between exposure and the
reference oral dose (Rf D). If the ratio is
lower than one (1), there will be no
obvious risk. An estimate of the potential
hazard to human health (THQ) through
consumption of vegetables grown in heavy
metal contaminated soil is described in Eq.
(3):
Hazardous Quotient (HQ) for the locals
(consumers) through the consumption of
contaminated vegetables was assessed by
the ratio of Daily Intake Rate (DIR) to the
oral reference dose (RfDo) for each metal
(USEPA, 2013) where for Pb and Zn is
0.0035 and 0.300 mg/kg/day respectively
(USEPA, 2010).
310TAWABRFD
CFIREDEFTHQ
……(3)
Where EF is the exposure frequency (350
days/year); ED is the exposure duration
(According to the latest WHO data
published in 2015 life expectancy in
Tanzania is 62 years; lifetime); FIR is the
food ingestion rate. According to
Weinberger and Swai (2006) vegetable
consumption values for Tanzanian adult is
63 g/person/day); C is the metal
concentration in the edible parts of
vegetables (mg/kg); RFD is the oral
reference dose (Pb = 0.0035 while Zn =
0.300), WAB is the average body weight
(65 kg for adults vegetable consumer in
Tanzania) and TA is the average exposure
time for non-carcinogens (ED x
365days/year). If the THQ value is greater
than 1, the exposure is likely to cause
obvious adverse effects (USEPA, 2013).
3 Results and Discussion
3.1 Minerals and Heavy Metals in
Vegetables and Soil
Table 2 shows the concentrations of
metals investigated in soil and Green
Leafy Vegetables (GLV) commonly
consumed in Mbezi Luis ward. The values
are given in mean of three replicates. The
metal levels determined were based on
plants dry weight. Heavy metals affect the
nutritive values of agricultural materials
and also have deleterious effect on human
beings.
National and international regulations
bodies on food quality set the acceptable
maximum permissible levels of heavy
metals in human food; hence an
increasingly important aspect of food
quality should be to control the
concentrations of heavy metals in food
(Radwan and Salama, 2006).
Except of two samples; Ipomoea sp, Co
chorus L. which register 1.07 mg/kg, 0.23
mg/kg respectively, other samples register
high concentration level of Pb above
Tanzania Bureau of Standard (TBS)
(2007) maximum acceptable limits in
vegetables which is 0.3 mg/kg. The

Saria., Tanzania J. Sci & Technol., (2020), Vol. 3(2), 1– 16
8
sources of lead accumulated in the
investigated vegetables are envisaged to be
water used for irrigation and hence soil
used for cultivation. These were conceived
to be the sources due to the fact that during
its operation the dump the river and
discharge of waste water from hospitals,
houses, schools were directed to Mbezi
River.

Saria., Tanzania J. Sci & Technol., (2020), Vol. 3(2), 1– 16
9
Table 2. Levels of Minerals and Heavy Metals from Selected Commonly Used GLV (mg/kg)
S/No Swahili Family Genus and Species Zn Pb Ca K Mg Na
1 Matembele Convolvulaceae Ipomoea sp 26.24 1.07 361.98 3163.51 3001.90 361.98
2 Sukuma Wiki Brassicaceae Brassica L. 57.34 4.45 936.39 36116.42 3393.78 936.39
3 Mlenda Tiliaceae Corchorus L. 35.62 0.23 538.93 42251.03 3135.13 538.93
4 Mchunga Compositae Lactuca Inermis Forssk 33.59 3.15 436.14 44692.46 3195.69 436.14
5 Mchicha Amaranthaceae Amaranthus sp 45.64 7.74 858.78 23233.21 3408.57 858.78
6 Maboga Cucurbitaceae Cucurbita sp 37.23 8.51 467.23 42924.33 3360.07 467.21
7 Mnavu Solanaceae Solanum sp 36.69 3.95 923.17 24689.41 3666.58 923.17
8 Kisamvu Euphorbiaceae Manihot esculenta Crantz 48.52 5.98 761.48 24443.02 3583.82 761.48
9 Mashona nguo Compositae Bidens pilosa L 46.31 4.88 527.92 23742.22 3331.42 537.95
10 Soil 9.60 24.41 13781.00 412.11 2819.10 479.14
Saria., Tanzania J. Sci & Technol., (2020), Vol. 3(2), 1– 16
10
Also all wastes such as medical waste,
batteries, waste cloths, newspapers, paints,
glass and bottles, industrial dust, ash, tires,
metal cans, inks, plastics, used motor oils,
ceramics, electronics and containers, were
thrown in the river, hence contaminate the
irrigating water and The level of lead in the
soil detected 24.41 mg/kg, which is lower
than WHO/FAO (2001) permissible limit of
50.00 mg/kg for soils.
Zinc is an essential mineral for human
health. The recommended dietary
allowances (RDAs) for adult woman are 8
mg while for man is 11 mg per day (Van
Jaarsveld, et al., 2014). Zinc levels ranged
from 26.24 mg/kg to 57.34 mg/kg with
Ipomoea sp register the lowest while
Brassica L. registered the highest. About
22% of these GLV detected high
concentration than joint WHO/FAO (2001),
allowable limit of 47.4 mg/kg Zn levels in
edibles. However, these values are lower
than the one detected earlier (Kihampa, et
al., 2011) in V. unguiculata in which in their
study zinc concentration level was detected
to be 122.88 mg/kg. All the analyzed
samples registered lowest value compared to
recommended value by TBS (2007) in
vegetables, which is 60.0 mg/kg. The mean
concentration of zinc (Zn) in the soil was
9.60 mg/kg, which were about 31 times
lower than WHO/FAO (2001) permissible
limit of 300.00 mg/kg for soils.
Fresh vegetables are highly recommended in
any diet virtually without quantitative
restriction and the roles of vegetables in
maintenance of good health are well known.
Green leafy vegetables form an
indispensable constituent of diet in
Tanzania. Sodium and potassium are two
critical minerals that have consistently been
identified as nutrients of concern in the diet.
These two cations have an inverse relation
in the body, complicating this known intake
imbalance. Because of this, it is important to
examine not only individual mineral intakes
but also the ratio of these two minerals in
the diet. Recent studies (Food and Nutrition
Board 2008; Yang et al., 2014), suggests
that the dietary sodium-to-potassium ratio
(Na:K) is more strongly associated with an
increased risk of hypertension and
cardiovascular disease (CVD)-related
mortality than the risk associated from either
sodium or potassium alone (Perez and
Chang 2014; Cook, et al., 2009). The level
of Na ranged from 361.98 mg/kg in Ipomoea
sp up to 936.39 mg/kg in Brassica L. while
K ranged from 3163.51 mg/kg (Ipomoea sp)
up to 44692.46 (Lactuca Inermis Forssk). These values are higher than values detected
by Akpana, et al., (2017). The values are
higher due to excessive use of organic
manure especially chicken and cow as well
as inorganic fertilizer especially NPK and
urea in the sampling site. According to
Institute of Medicine (Institute of Medicine,
Food and Nutrition Board 2005), the RDA
for potassium for both normal healthy males
and non-pregnant females between the ages
of 19 and 50 years is 4700 mg/day. The
range of potassium content reported in this
study shows that the vegetables may be a
poor source, capable of providing about
0.67% to 9.5% of RDA for healthy living.
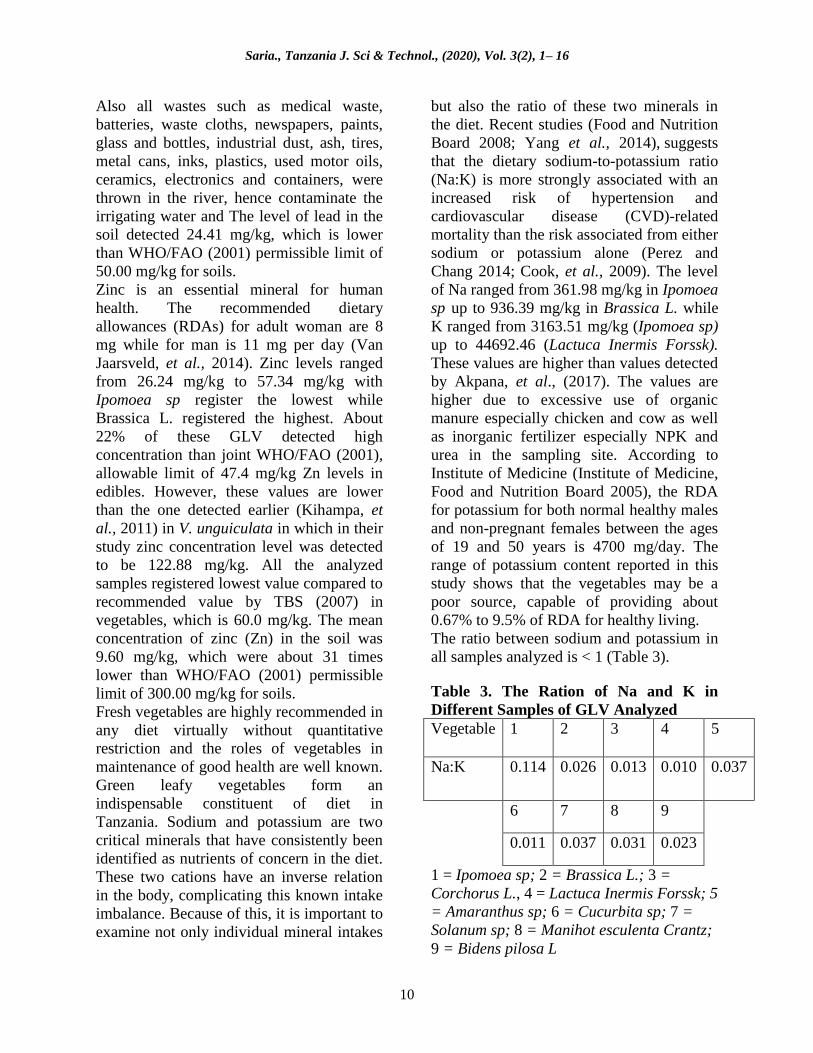
The ratio between sodium and potassium in
all samples analyzed is < 1 (Table 3).
Table 3. The Ration of Na and K in
Different Samples of GLV Analyzed
Vegetable 1 2 3 4 5
Na:K 0.114 0.026 0.013 0.010 0.037
6 7 8 9
0.011 0.037 0.031 0.023
1 = Ipomoea sp; 2 = Brassica L.; 3 =
Corchorus L., 4 = Lactuca Inermis Forssk; 5
= Amaranthus sp; 6 = Cucurbita sp; 7 =
Solanum sp; 8 = Manihot esculenta Crantz;
9 = Bidens pilosa L

Saria., Tanzania J. Sci & Technol., (2020), Vol. 3(2), 1– 16
11
The ratio is in line with a related study
(Caunii, et al., 2010). Thus, the consumption
of the selected leafy vegetables in this study
could probably serve to reduce high blood
pressure diseases to consumers, due to the
less than one value obtained for their Na/K
ratio (Drewnowski, et al., 2015). This may
be due to harvesting stage, seasonal
variations, soil differences and differences in
methods used in analysis (Chawanje, 1998).
Magnesium is known to plays an essential
role in many of the functions of the energy
production. This element is an integral part
of the energy (ATP) and protein (enzymes -
as co-factor and as a structural component of
the muscle protein, myosin) molecules
without which the energy to contract and
relax the heart does not occur properly
(WHO, 1989). The absence of magnesium in
diet might result in weak, underdeveloped or
poor bone growth (Effiong and Udo, 2010).
Result of magnesium content ranged from
3001.90 mg/kg to 3666.58 mg/kg. The
magnesium content of the samples is higher
than the value obtained recently by Akpana,
et al., (2017).
Calcium plays an important role in building
strong and keeping healthy bones as well as
teeth at both early and later life. The
concentration detected ranged from 361.98
mg/kg to 936.36 mg/kg in Ipomoea sp and
Brassica L. respectively. The detected
values are lower than the one determined by
other researchers (Iyaka et al., 2014) which
ranged between 3870 – 9060 mg/kg.
The concentrations of Pb in vegetables were
lower than that of the corresponding soils.
This might be attributed to the root which
seems to act as a barrier to the translocation
of metals. To evaluate the accumulating
capacity of heavy metals from soils to plant,
a quantitative evaluation of the relationship
between metals concentration in vegetable
and in corresponding soils was made by
calculating the transfer factor for the
soil/plant system. The transfer factor varies
from one plant to another plant due to a
selectivity of the plants in absorbing
respective elements from soils.
3.2 Soil-Vegetable Transfer
Coefficients
To estimate the heavy metals transferred to
plants, the transfer coefficient, a function of
both soil and plant properties, is used due to
its representative bioavailability of heavy
metals to plants. The leafy vegetables are
found to show a higher transfer factor
among the studied vegetables (Figure 3)
Figure 3. Transfer Factors of Heavy
Metal from Soils into the Vegetable
Samples.
The TF value for toxic element Zn (2.733 –
5.973) is quite high compared to Pb (0.009 –
0.349). The higher concentrations of these
heavy metals are due to the waste water
irrigation, solid waste disposal and sludge
applications, solid waste combustion,
agrochemicals and increase in geologic
and anthropogenic activities. The present
result agrees with the investigation made by
Satter, (2012) who found that the transfer of
Zn and Pb from soil to plant Enhydra
fluctuans and Oryza sativa is 1.762 and
1.05; and 5.519 and 1.20 respectively, which
is quite high. Soil electrolyte plays an
important role in the process of metal

Saria., Tanzania J. Sci & Technol., (2020), Vol. 3(2), 1– 16
12
transfer. The electrochemical properties of
soil reflected through the temperature, pH,
and electrolyte concentration etc. thus
influence the migration transformation
ability of toxic metal indirectly (Iyaka, et al.,
2014). These green leaf plants are widely
consumed by human, toxic elements can be
transferred to human body creating
disruption in various biological systems.
3.3 The Daily Intake Rate
The average daily intake rate (DIR) of heavy
metals obtained is given in Figure 4. The
DIR values for Pb range from 0.005 – 0.162
mg/day which is below the recommended
level by Joint WHO/FAO (2007) indicated
to be 0.214 mg/day.
Figure 4. The Daily Intake Rate (DIR in
mg/day) for Zn and Pb in Respective
Vegetables
However they are very close to the values
determined by earlier researchers (Orisakwe,
et al., 2012). The DIR value for Zn ranged
from 0.551 – 1.204 mg/day which is far
below the 60 mg/day set by WHO/FAO
(2007).
The THQ values of, Pb and Zn due to
vegetable consumption for the populace
(adults) of the study area are shown in
Figure 5. The THQ values range showed
that Pb was 0.001 – 0.026, Zn was 0.081 –
0.178. These results concur with the values
detected earlier (Hannah, et al., 2016), in
which Pb ranged from 0.150 to 0.587 and Zn
was 0.021 – 0.190. These results reflected
the risk associated with Pb, Zn exposure for
the period of life expectancy considered. In
this study, the THQ in all metals is far less
than 1 in all the vegetables species;
therefore, it does not pose health risk
concern.
.
Figure 5. The Target Health Hazard of Pd
and Zn
Higher THQ for Pb, were reported by Singh,
et al., (2010) in vegetables area which use
waste water for irrigation. Higher THQ for
Pb in an area near a lead (Pb) and antimony
(Sb) smelter in Nanning, China, was also
reported by Zhou et al., (2016) in vegetable
species planted in contaminated soils.
However, for women who are pregnant, the
potential health risks of heavy metal
accumulation through vegetable
consumption were likely to be higher than
for the normal population.
4 Conclusions and
Recommendations
The present study was performed to assess
mineral elements and heavy metal levels of
commonly consumed vegetables and their
associated health risks in Mbezi Luis,
Ubungo district. Generally, the heavy metals
concentrations in the various vegetables are
Saria., Tanzania J. Sci & Technol., (2020), Vol. 3(2), 1– 16
13
all above the maximum TBS (2007),
permissible limit. The individual hazard
quotient values were all below 1 except
suggesting an acceptable level of non-
carcinogenic adverse risk. Based on the
findings of this study; it is recommended
that further research work should be carried
out to study the levels of heavy metals in
vegetables in and around Dar es Salaam City
in order to maintain and/or improve
measures to reduce their levels in vegetables
and ultimately prevent these avoidable
health problems.
No matter how the concentration of heavy
metals present in vegetables, their presence
is not desirable. Therefore, this study
suggests the regular scrutiny of the heavy
metals present in soil, irrigating water, and
foodstuff to avoid extreme accrual in the
food chain and thus elude human health
risks. Consequently, this study encourages
administrators, environmentalists and public
health workers to create public awareness to
avoid the consumption of vegetables grown
in contaminated soils, hence reducing health
risks to consumers.
5 Acknowledgement
The author expresses his gratitude to the
support from Chief Government Chemistry
Office that provided necessary laboratory
facilities for data analysis.
6 References
Afolayan, A. J. and Bvenura, C. (2012).
Heavy Metal Contamination of
Vegetables Cultivated in Home
Gardens in the Eastern Cape, South
Africa Journal of Science
108(9/10):1-6
Akpana, A. M., Mgbang, J. E., Peters, H.,
Akuirene, J. (2017). Mineral and
Vitamin Composition of Some
Lesser Known Leafy Vegetables
Consumed in Northern Senatorial
District of Cross River State, Nigeri,
American Journal of Food and
Nutrition 5(2):51-57
Algert, S. J., Agrawal, A. and Lewis, D. S.
(2006). Disparities in Access to
Fresh Produce in Low-Income
Neighborhoods in Los Angeles.
American Journal of Preventive
Medicine, 30(5): 365–370
Arora, M., Kiran B., Rani, S., Rani, A.,
Kaur, B. and Mittal, N. (2008).
Heavy Metal Accumulation in
Vegetable Irrigated with Water from
Different Sources, Food Chem., 111:
811-815.
Asoka, G. W. N., Thuo A. D. M., Bunyasi,
M. M. (2013). Effects of Population
Growth on Urban Infrastructure and
Services: A Case of Eastleigh
Neighborhood Nairobi, Kenya,
Journal of Anthropology and
Archaeology 1(1):41-56
Boeing, G. (2016). How Our Neighborhoods
Lost Food, and How They Can Get It
Back Progressive Planning
206(5)35–37
Caunii, A., Cuciureanu, R., Zakar, M. A.,
Tonea, E., Giuchici, C. (2010).
Chemical Composition of Common
Leafy Vegetables, Studia
Universitatis “Vasile Goldiş”, Seria
Ştiinţele Vieţii 20(2): 45-48
Chawanje, C. M. (1998). Nutrient and
Antinutrient Content of an
Underexploited Malawian Water
Tuber Nymphaea Petersiana
(Nyiaka). Virginia Polytechnic,
Institute and State University
Cook, N.R., Obarzanek, E., Cutler, J. A.,
Buring, J. E., Rexrode, K. M. and
Kumanyika, S. K. (2009). Joint
Effects of Sodium and Potassium
Intake on Subsequent Cardiovascular
Disease: The Trials of Hypertension
Prevention Follow-up Study. Arch
Int Med. 169(1):32–40.
Saria., Tanzania J. Sci & Technol., (2020), Vol. 3(2), 1– 16
14
Coutate, T. P. (1992). Food, the Chemistry
of its Component, 2nd
edn,
Cambridge: Royal Society of
Chemistry
Duruibe, J. O., Ogwuegbu, M. O. C. and
Egwurugwu, J. N. (2007), Heavy
Metal Pollution and Human Biotoxic
Effects, Inter. J. Phys. Sci., 2(5):112-
118
Effiong, G. S., Udo, I. F. (2010). Nutritive
Value of Indigenous Wild Fruits in
Southeastern Nigeria. Electronic J.
Environ. Agric. Food Chem. 9:1168-
1176
FAO/WHO (2001). Codex Alimentarius
Commission, Food Additives and
Contaminants. Joint FAO/WHO
Food Standards Programme.
Food and Nutrition Board (2008). Dietary
Reference Intakes for Water,
Potassium, Sodium, Chloride, and
Sulfate. Washington (DC): National
Academy Press
Hannah, A. A., Njoku, K. L., Akinola, M.
O., Adesuyi, A. A., Jolaoso, A. O.
(2016). Potential Human Health
Risk Assessment of Heavy Metals
Intake via Consumption of some
Leafy Vegetables obtained from
Four Market in Lagos Metropolis,
Nigeria, J. Appl. Sci. Environ.
Managen. 20(3):530-539
Hutton, G. and Varughese, M. (2016). The
Costs of Meeting the 2030
Sustainable Development Goal
Targets on Drinking Water,
Sanitation, and Hygiene, Summary
Report, Water and Sanitation
Programme, World Bank Group
Ikeda M., Zhang Z. W., Shimbo S.,
Watanabe T. and Nakatsuka H.
(2000). Urban Population Exposure
to Lead and Cadmium in East and
South-East Asia, Sci Total Environ
249: 373-384
Institute of Medicine, Food and Nutrition
Board (2005). Dietary Reference
Intakes for Energy, Carbohydrates,
Fibre, Fat, Fatty Acids, Cholesterol,
Protein and Amino Acids
(Macronutrients) National Academic
Press, Washington DC
Iyaka, Y. A., Idris, S., Alawode, R. A. and
Bagudo, B. U. (2014). Nutrient
Content of Selected Edible Leafy
Vegetables, American Journal of
Applied Chemistry 2(3):42-45
Jońca, Z. and Lewandowski, W. (2004),
Verification of Measurement
Capabilities of Flame Atomic
Spectrometry for the Determination
of Sodium, Potassium, Magnesium,
and Calcium in Natural Fresh Water
Part I. Comparison of Recommended
Methods, Polish Journal of
Environmental Studies 13(3): 275-
280
Kachenko, A. G. and Singh, B. (2006),
Heavy Metals Contamination in
Vegetables Grown in Urban and
Metal Smelter Contaminated Sites in
Australia, Water Air Soil Pollut
169:101-123
Khan, S., Cao, Q., Zheng, Y. M., Huang, Y.
Z. and Zhu, Y. G. (2008). Health
Risks of Heavy Metals in
Contaminated Soils and Food Crops
Irrigated with Wastewater in Beijing,
Kihampa, C. (2013). Heavy Metal
Contamination in Water and
Sediment Downstream of Municipal
Wastewater Treatment Plants, Dar es
Salaam, Tanzania, International
Journal of Environmental Sciences
3(5):1407-1414
Kihampa, C., Mwegoha, W. J. S. and
Shemdoe R. S. (2011). Heavy Metals
Concentrations in Vegetables Grown
in the Vicinity of the Closed
Dumpsite, International Journal of
Saria., Tanzania J. Sci & Technol., (2020), Vol. 3(2), 1– 16
15
Environmental Sciences 2(2):889 -
895
Laura, L. (2016). Agriculture: Sowing the
City, Nature. 540 (7634):522–524
Mayunga, S. D. (2018). Suitability Analysis
of Satellite Towns Using Saaty
Model and Geographical Information
System (GIS), Journal of Data
Analysis and Information
Processing, 6: 1-14
Orisakwe, O. E., Nduka, J. K., Amadi, C.
N., Dike, D. O. and Bede, O. (2012).
Heavy Metals Health Risk
Assessment for Population via
Consumption of Food Crops and
Fruits in Owerri, South Eastern,
Nigeria, Chem Cent J. 6:77 - 85
Perez, V. and Chang, E. T. (2014). Sodium-
to-Potassium Ratio and Blood
Pressure, hypertension, and Related
Factors. Adv Nutr 5:712–41.
Perkin-Elmer (1996). Analytical Methods
for Atomic Absorption
Spectroscopy, The Perkin-Elmer
Corporation, United States of
America
Radwan, M. A., Salama, A. K. (2006).
Market Basket Survey for Some
Heavy Metals in Egyptian Fruits and
Vegetables, Food Chem. Toxicol.
44:1273-1278.
Rattan, R. K., Datta, S. P., Chhonkar, P. K.,
Suribabu, K., Singh, A. K. (2005).
Long-term Impact of Irrigation with
Sewage Effluents on Heavy Metal
Content in Soils, Crops and
Goundwater-a Case Study,
Agriculture. Ecosystem and
Environment 109:310e322.
Sajjad, K., Farooq, R., Shahbaz, S., Aziz,
M. and Sadique, M. (2009). Health
Risk Assessment of Heavy Metals
for Population via Consumption of
Vegetables, World Appl. Sci. J, 6:
1602-1606.
Saria, J. A. (2016). Assessment of Heavy
Metals Pollution in the Soil around
the Industries in Dar es Salaam City,
African Resource Development
Journal 2(2):214 – 228
Saria, J. A. (2017). Assessment of Human
Hazard due to Metal Uptake via Fish
Consumption from the Coast of
Tanzania, Ethiopian Journal of
Environmental Studies and
Management 10(4):555 – 565
Sathawara, N. G. Parikh, D. J. and Agarwal,
Y. K. (2004). Essential Heavy
Metals in Environmental Samples
from Western India, Bulletin of
Environmental Contamination and
Toxicology, 73(4):756–761
Satter, S. (2012). Transfer of trace elements
from Soil to Plants in Industrial Area
of Dhaka and its Health Risk. Savar,
Bangladesh: M. Sc Thesis,
Department of Environmental
Science, Jahangirnagar University
Scott A. B. and Nancy J. M. (2000).
Encyclopedia of Analytical
Chemistry, John Wiley & Sons, Ltd
Sharma, R. K., Agrawal, M. and Marshall,
F. M. (2009). Heavy Metals in
Vegetables Collected from
Production and Market Sites of a
Tropical Urban Area of India, Food
and Chemical Toxicology, 47:583-
591
Skar; S. L. G., Pineda-Martos, R., Timpe,
A., Pölling;, B., Bohn, K., Külvik,
M., Delgado, C., Pedras, C. M. G.,
Paço T. A., Ćujić, M., Tzortzakis,
N., Chrysargyris, A., Peticila, A.,
Alencikiene, G., Monsees, H. and
Junge, R. (2020). Urban
Agriculture as a Keystone
Contribution Towards Securing
Sustainable and Healthy
Development for Cities in the Future,
Blue-Green Systems 2 (1):1–27

Saria., Tanzania J. Sci & Technol., (2020), Vol. 3(2), 1– 16
16
Sobukola, O. P., Adeniran, O. M., Odedairo,
A. A. and Kajihausa, O. E. (2010).
Heavy Metal Levels of Some Fruits
and Leafy Vegetables from Selected
Markets in Lagos, Nigeria, Afr. J.
Food Sci., 4(2):389-393
Tasrina, R. C., Rowshon, A., Mustafizur, A.
M. R., Rafiqul, I., and Ali, M. P.
(2015). Heavy Metals Contamination
in Vegetables and its Growing Soil,
Environmental Analytical Chemistry
J Environ Anal Chem 2(3):1-6
Tanzania Bureau of Standards (TBS),
(2007). Soil Quality-Limits for Soil
Contaminants in Habitat and
Agriculture.TZS 972
Temminghoff, E. J. M. and Houba, V. J. G.
(2004), Plant Analysis Procedures,
2nd ed. Dordrecht: Kluwer
Academic Publishers
URT (2012). Population and Housing
Census Population Distribution by
Administrative Areas, National
Bureau of Statistics Ministry of
Finance, Dar es Salaam
USEPA (2010). Risk-based Concentration
Table, United State Environmental
Protection Agency, Washington, DC.
USEPA (2013). Reference dose (RfD):
Description and use in Health Risk
Assessments, Background Document
1A, Integrated Risk Information
System (IRIS); United States
Environmental Protection Agency:
Washington, DC, 20 September
2017; http://www
epa.gov/iris/rfd.htm.
Van Jaarsveld, P., Faber, M., van Heerden,
I., Wenhold, F., van Rensburg, W. J.
and van Averbeke, W. (2014).
Nutrient Content of Eight African
Leafy Vegetables and their Potential
Contribution to Dietary Reference
Intakes, J. Food Compos. Anal.
33:77–84
Weinberger, K. and Swai, I. (2006).
Consumption of Traditional
Vegetables in Central and
Northeastern Tanzania, Ecology of
Food and Nutrition, 45(2):87-103
WHO (1989). Evaluation of Certain Food
Additives and Contaminants. 33rd
Report of the Joint FAO/WHO
Expert Committee on Food
Additives. Technical Report Series
Geneva
WHO/FAO (2007). Joint WHO/FAO Food
Standards Program Code
Alimentarius Commission 13th
Session, Report of the Thirty Eight
Session of the Codex Committee on
Food Hygiene, Houston, Texas, USA
Yang, Q., Liu, T., Kuklina, E. V., Flanders,
W. D., Hong, Y., Gillespie, C.,
Chang, M. H., Gwinn, M., Dowling,
N. and Khoury, M. J.
(2011). Sodium and Potassium
Intake and Mortality among US
Adults: Prospective Data from the
Third National Health and Nutrition
Examination Survey. Arch Intern
Med 171:1183–91
Yoon, K. P. (2003). Construction and
Characterization of Multiple Heavy
Metal-resistant Phenol-degrading
Pseudomonads Strains, J. Micro.
Biotech., 13(6)1001-1007
Zhou, H., Yang, W., Zhou, X., Liu, L., Gu,
J. F., Wang, W. L., Zou, J. L., Tian,
T., Peng, P. Q. and Liao, B. H.
(2016). Accumulation of Heavy
Metals in Vegetable Species Planted
in Contaminated Soils and the Health
Risk Assessment, International
Journal of Environmental Research
and Public Health, 13:289-291