Embed Size (px)
Citation preview

Assessment of Library Service Quality
At
Thammasat University Library System
Assist. Prof. Narit Nimsomboon
Department of Library Science
Faculty of Liberal Arts
Thammasat University
THAILAND
And
Prof. Haruki Nagata
Research Center for Knowledge Communities
University of Library and Information Science
JAPAN
August, 2003
Assessment of Library Service Qualityat
Thammasat University Library System
Narit Nimsomboon and Haruki Nagata
Abstract
This study examines the overall service quality of Thammasat University
Library System from users’ perspectives, as well as identifies the dimensions that
determine the customers’ evaluation of service quality The concept of the Zone of
Tolerance was applied to investigate which are the essential attributes that library
managers should allocate the resource for good service quality. The problems users had
encountered when involved in library service are also investigated in this study.
A survey of undergraduate students, graduate students, facutly members and
researchers was used. The modification of SERVQUAL questionnaires were distributed
for data gathering. Several insight gained from this study shown that all users desired
expectations are not met. The result of the Zone of Tolerance reveals that each user group
was treated differently. The three dimensions of service quality ; Affect of service –
Organizational, Collection&Access, and Affect of service – Personal were extracted by
factor analysis method. The problems users encountered when involved in library service
are counted manually and categorized into free categories. The most problematic is about
insufficient and non update collection. Some useful recommendations are presented to
improve service quality of TU library system.

i
ACKNOWLEDGMENT
This research project “ Assessment of Library Service Quality at Thammasat
University Library System ” was conducted under auspices of Research Center for
Knowledge Communities, University of Tsukuba, JAPAN. First of all, I have to
present my high gratitude to Prof. Haruki Nagata for his kind cooperation and
helpfulness. Besides, I feel very thankful for kindness of
Mr. Yoshinori Sato and Mr. Toshimori Atsushi for giving me most useful
comments. I don’t forget Miss Matsuo Yoko for her endeavor to be my data editor
and giving me most valuable friendship that make me spend most happy time in
Japan.
Assist. Prof. Narit Nimsomboon
Contents
Page
ACKNOWLEDGEMENT i
CONTENT ii
TABLES
GRAPHES
iv
v
CHAPTER
I. Introduction
Background
Study Problem
Purposes of the study
Significance of the Study
Research Questions
Scope and Limitations
1
1
1
2
2
3
3
II. Review of the Related Literature
Introduction
History of SERVQUAL
SERVQUAL in Library Setting
Using SERVQUAL for Library Service Quality Assessment in Thailand
Concept of Service Quality for Library Assessment
Related Research
Related Research in Thailand
4
4
4
6
6
6
7
9
III. Method and Procedures
Instrumentation
Sampling and Response Rates
Data Treatment
Characteristics of Sample Groups
Statistical Method and Techniques Used for Data Analysis
11
11
11
12
14
25
IV. Data Analysis
1. What are the gaps between user desired service expectations and actual
service perception
2. By individual group of users, what are the gaps between user desired
service expectations and actual service perception ?
3. By individual group of users, what are the users’ expectations for excellent
service quality from TU Library system?
4. What are the underlying dimensions of service quality of TU Library
System from user perspectives.
5. By individual user group, what attributes are inside and outside the range
of the “ Zone of Tolerance “?
6. What are the problems users encountered when involved in Library
services?
Summary of findings
26
26
29
36
41
45
49
51
V. Summary, Discussion and Recommendations
Overview of the study
55
55
Statement of the Problem
Subjects
Instrumentation
55
55
55
Data Collection
Statistical Analysis
Discussion
55
55
56
The Gaps Between User Desired Expectations and Actual Service
Perception
The User Desired Service Expectations
The Dimensions of User Desired Expectations
The Zone of Tolerance
The Problems Users Encountered When Involved in Library Services
Recommendations
56
57
57
58
58
59
REFERENCES 61
APPENDIX A : The Modification of SERVQUAL Questionnaire 63
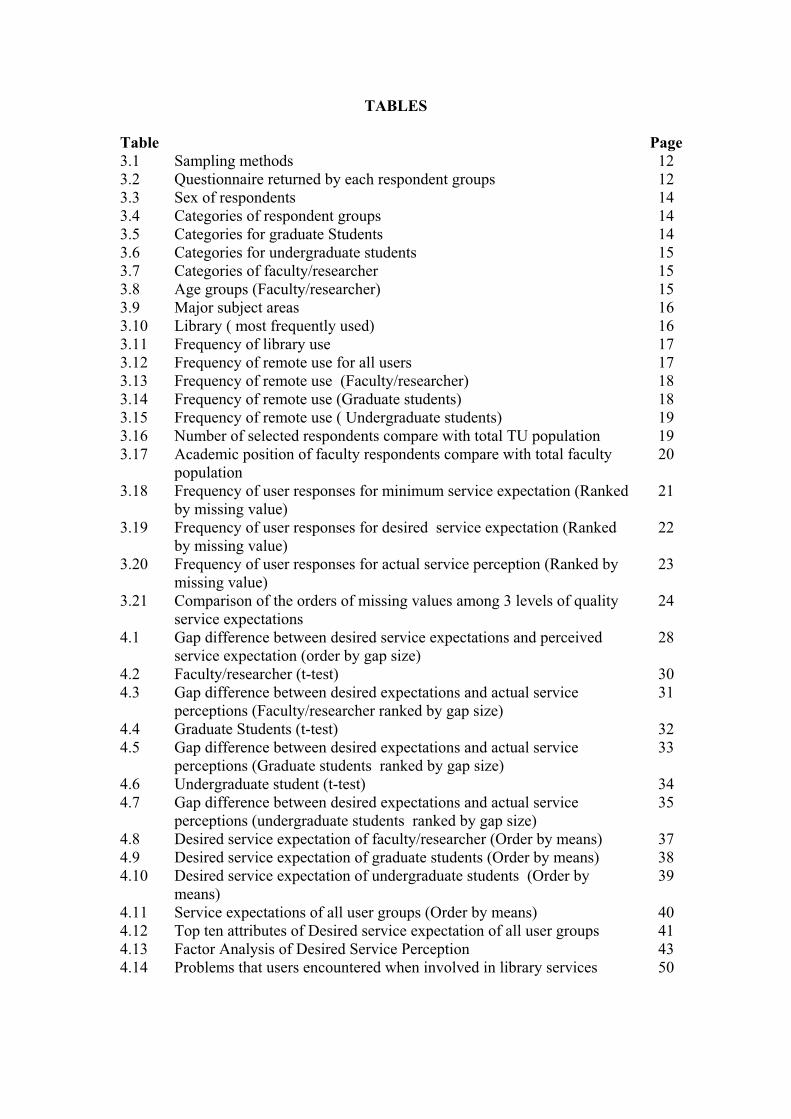
TABLES
Table Page
3.1 Sampling methods 12
3.2 Questionnaire returned by each respondent groups 12
3.3
3.4
3.5
3.6
3.7
3.8
3.9
3.10
3.11
3.12
3.13
3.14
3.15
3.16
3.17
3.18
3.19
3.20
3.21
Sex of respondents
Categories of respondent groups
Categories for graduate Students
Categories for undergraduate students
Categories of faculty/researcher
Age groups (Faculty/researcher)
Major subject areas
Library ( most frequently used)
Frequency of library use
Frequency of remote use for all users
Frequency of remote use (Faculty/researcher)
Frequency of remote use (Graduate students)
Frequency of remote use ( Undergraduate students)
Number of selected respondents compare with total TU population
Academic position of faculty respondents compare with total faculty
population
Frequency of user responses for minimum service expectation (Ranked
by missing value)
Frequency of user responses for desired service expectation (Ranked
by missing value)
Frequency of user responses for actual service perception (Ranked by
missing value)
Comparison of the orders of missing values among 3 levels of quality
service expectations
14
14
14
15
15
15
16
16
17
17
18
18
19
19
20
21
22
23
24
4.1
4.2
4.3
4.4
4.5
4.6
4.7
4.8
4.9
4.10
4.11
4.12
4.13
4.14
Gap difference between desired service expectations and perceived
service expectation (order by gap size)
Faculty/researcher (t-test)
Gap difference between desired expectations and actual service
perceptions (Faculty/researcher ranked by gap size)
Graduate Students (t-test)
Gap difference between desired expectations and actual service
perceptions (Graduate students ranked by gap size)
Undergraduate student (t-test)
Gap difference between desired expectations and actual service
perceptions (undergraduate students ranked by gap size)
Desired service expectation of faculty/researcher (Order by means)
Desired service expectation of graduate students (Order by means)
Desired service expectation of undergraduate students (Order by
means)
Service expectations of all user groups (Order by means)
Top ten attributes of Desired service expectation of all user groups
Factor Analysis of Desired Service Perception
Problems that users encountered when involved in library services
28
30
31
32
33
34
35
37
38
39
40
41
43
50
GRAPHES
Graph Page
4.1
4.2
4.3
Faculty/researcher perceptions and Zone of Tolerance
Graduate student perceptions and perceptions and Zone of
Tolerance
Undergraduate student perceptions and perceptions and Zone of
Tolerance
46
47
48

1
Chapter 1
Introduction
Background
Academic libraries are facing two major threats : a global digital
environment and increasing competition. They must improve the quality of their
services in order to survive. (Cullen, 2001) Historically, the quality of an academic
library has been described in terms of its collection and measured by the size of the
library’s holdings and various counts of its uses. “ A measured of library quality
based solely on collections has become obsolete” . Alternative approaches to measure
quality emerge in the business sector. Specifically, through marketing research, the
SERVQUAL ( which was developed by A. Parasuraman, Valarie A. Zeithaml and
Leonard L. Berry ) has evolved as an instrument to measure service quality and what
customers values as important. SERVQUAL is a mechanism to shift the assessment
of quality of a library from the traditions of measuring collection size and counting
incidents of its uses, to begin investigating how the provision of services relates to the
library users’ service quality expectations ( Nitecki, 1996). SERVQUAL has been
used in various service industries, including academic, public, and special libraries.
( Hernon, 2002) . It is important for libraries to know how well their performance by
getting feedback from users because it is the factor for libraries to succeed in service
performance.
This study used the adapted version of SERVQUAL to examine the library
service quality of Thai academic library and explore how the service factors derived
from the factor analysis were related to user expectation.
Study Problem
In Thailand, the quality of educational development and its academic
excellence has been emphasized in the eighth National Economic and Social
Development Plan (1997-2001). The Ministry of University Affairs has played a
significant role to encourage higher education institutions in maintaining and
improving their academic standards so that they can produce graduates who satisfy
the need of employers. In order to achieve the objective, the quality assurance policy
was proclaimed for institutions to implement for better productivity on July 8, 1996.
The policy has required all public universities to improve and enhance their efforts for
quality of instruction and the academic learning environment. (Bureau of Higher
Education Standards, Ministry of University Affairs ( http://www.qa.mua.go.th
/English/policy.html ) All academic libraries in Thailand including Thammasat
University (TU) Library System as an academic service organizations are involved
in such an environment inevitably.
The TU Library system is among the largest academic library system in
Thailand and was established in 1934 along with the founding of the University.
Thammasat libraries serve university students, staff, and faculty as its first priority
members; other users include students, staff and faculty of other academic
institutions, alumni, and paying members. Major portions of the collection cover the
subject areas of social science and humanities, science and technology, applied
science, and medical science. Presently, the libraries serve approximately 9,000 users
per day consisting of: lecturers ,undergraduate students ,graduate students ,university
staff ,as well as other users. The libraries’ collections comprise 930,226 monograph
2
volumes. These consist of 625,619 books in the Thai language and 304,607 in foreign
languages. The libraries have 2,235 journals in the Thai language and 2,123 journals
in foreign languages. There are 6,323 documents in the Thai language and 8,325
documents in foreign languages in the collection. The library receives 32 newspapers;
in addition, there are 20,835 audiovisual items, 46 CD-ROM databases and 9 online
databases. Besides providing modern facilities to their users, the libraries have tried to
improve the service quality continually by providing a various kinds of services such
as inter-library loan , audiovisual material service and information retrieval in various
subjects from internet and CD-ROM databases ; furthermore , individual and class
instruction for users are provided on request. (TU Library System ,
http://library.tu.ac.th/detail/about.html, and Self Study Report – SSR : ThammasatUniversity Library System, Thammasat Univeristy (January1-June 30, 2002,63-64 ) .
The TU library managers are also hearing user opinion via the various
channels such as e-mail and poll box as well as doing the survey about library user’s
satisfaction at least once a year but service quality is multidimensional so the library
managers must look for better ways to measure and describe the quality of their
services. ( Hernon & Altman, 1998) The result obtained from this study will help the
library managers in understanding institutional and user differences and similarities,
finding the user problems and reducing the gap between user perception and
expectation.
Purposes of the Study
The purposes of the study are as the followings:
1. To assess the overall service quality of TU Library System from the
users’ perspectives.
2. To assess the service quality of TU library System from the
perspective of each different respondent user group. (Faculty/researchers, graduate
and undergraduate students) .
3. To identify the dimensions that determine the customers’ evaluation of
service quality in TU Library System
4. To investigate which are the essential attributes that library managers
should allocate the resource for good service quality.
5. To identify the problems users had encountered when involved in
library service.
Significance of the study
This research study deems to important because of the following reasons :
1. As the culture of assessment in libraries has strong international
dimensions ( Kyrillidou and Hipps, 2001,
http://www.arl.org/newsltr/215/octsymp.html ), this study is international
collaboration on assessing library service quality among scholars in Finland, Japan,
United Kingdom and Thailand so the result obtained maybe confirm that there are
global commonalities in the way users think about library service quality.
2. It is the chance to implement the study related to library service quality
in Thai library community by using the adaptation of SERVQUAL and ;
3. This study may urge the new culture of assessment library service
quality among Thai academic libraries.
3
Research Questions
The research study seeks answers to the following questions :
1. In what ways do TU Library System provide service to its users?
2. By individual group of users, in what ways do TU Library System
provide service to its users?
3. By individual group of users, which attributes of service quality equal,
exceed or fall short user perceptions?
4. By individual group of users, in what way do the users expect for
excellent service quality from TU Library system?
5. What are the dimensions that determine the customers’ evaluation of
service quality in TU Library System
6. What are the most essential attributes that library managers should
allocate the resources to support for improving excellent service quality?
7. What problems did the users encounter when involved in library
service?
Scope and Limitations
1. This study is conducted to assess the library service quality for the
purpose to help the library managers in understanding institutional and user
differences and similarities. The data collected should not be seen as value judgments
or as indicators or defining “good” or “bad” service.
2. The subjects in this study include 228 faculties/researchers, 165
graduate students, and 266 undergraduate students. The findings cannot be
generalized beyond TU.
Chapter 2
Review of Related Literature
Introduction
Academic libraries are facing two major threats : a global digital
environment and increasing competition. They must improve the quality of their
services in order to survive. (Rowena Cullen, 2001) Traditionally, the quality of an
academic library has been described in terms of its collection and measured by the
size of the library’s holding and various counts of its use. ( Danuta A. Nitecki , 1996)
According to Peter Hernon and Ellen Altman , most of traditional statistics gathered
by libraries lack relevance and do not measure the library’s performance in terms of
element important to customers. They do not really describe performance or indicate
whether service quality is good, indifferent, or bad. Even worse, the do not indicate
any action that the administration or any team could or should take to improve
performance. ( Perter Hernon & Ellen Altman , 1998) The need to understand what
library customers expect in terms of service quality is now necessary for good
management. ( Philip Calvert, 2000) so the library managers should extend the
profitable way to assess library service quality. In business industries, SERVQUAL
is an alternative instrument proposed to measure service quality from customer
perspectives and perhaps it has been the most popular standardized questionnaire to
measure service quality. ( Albert Caruna, Michael T. Ewing & B. Ramaseshan) In
the library setting, SERVQUAL was used to assess library quality service continually
and it seems that culture of assessment in libraries had strong international dimensions
as there is much potential for international collaboration on assessing library service
quality. ( Martha Kyrillidou & Kaylyn Hipps,2000 ).
History of SERVQUAL
SERVQUAL was introduced in 1988 by A. Parasuraman , Valarie A.
Zeithaml and Leonard L. Berry as an instrument for assessing customer perceptions
of service quality in service and retailing organization. ( A. Parasuraman, et al.,
1988) It was consisted of 22 pairs of statements ,the first of which measure the
expectations of a service provider’s customers by asking each respondent to rate, on a
seven-point scale, how essential each item is for an excellent service provider to
deliver. The second set to 22 identical statements ascertains the respondent’s
perceptions to the level of service given by the institution or organization examined.
For each pair of statements, the difference between the ranked perception and the
ranked expectation is calculated; the average of the gap scores is the SERVQUAL
overall quality score. ( Danuta A. Nitecki and Peter Hernon, 2000). The designers
also developed the Gaps model of service quality and the definitions of each of the
gap are as follows :
Gap 1: The discrepancy between customers’ expectations and management’s
perceptions of these expectations;
Gap 2: The discrepancy between management’s perceptions of customers’
expectations and service quality specifications ;
Gap 3: The discrepancy between service quality specifications and actual service
delivery;
Gap 4: The discrepancy between actual service delivery and what is communicated to
customers about it; and
Gap 5: The discrepancy between Customers’ expected services and perceived service
delivered.
The first four gaps are the major contributors to the service-quality gap
that customers may perceive. The fifth gap is the basis of a customer-oriented
definition of service quality: the discrepancy between customers’ expectations for
excellence, and their perceptions of actual service delivered. This discrepancy is the
conceptual basis for the SERVQUAL instrument. ( Danuta A. Nitecki, 1996) The
narrower the gap is, the better service quality is provided so the managers have to
reduce Gap 5 as smallest as they can in order to provide excellent service to their
customers.
To test the data by factor analysis, the designers concluded that
SERVQUAL was consisted of 5 dimensions as follows:
Tangibles : Physical facilities, equipment, an appearance
of personnel.
Reliability : Ability to perform the promised service dependably
and accurately.
Responsiveness : Willingness to help customers and provide prompt service.
Assurance : Knowledge and courtesy of employees and their ability to inspire
trust and confidence.
Empathy : Caring, individualized attention the firm provides its customers.
Later, A. Parasuraman , Valarie A. Zeithaml, and Leonard L. Berry revised
SERVQUAL to ask respondents to rate statements from three contexts ( minimum
service expectations, desired service expectations, and the perception of service
performance) On a continuum, the minimum and desired service expectations appear
at either end, with the area in between known as the Zone of Tolerance. The zone of
tolerance represents the range of service performance that customers consider
satisfactory. ( Peter Hernon, 2002) According to Johnson ( 1995) Berry and
Parasuraman defined the zone of tolerance in terms of the customer’s evaluation of in-
process service performances ( Robert Johnson, 1995) :
The zone of tolerance is a range of service performance that a customer
considers satisfactory. A performance below the tolerance zone will engender
customer frustration and decrease customer loyalty. A performance level above the
tolerance zone will pleasantly surprise customers and strengthen their loyalty.The importance of the zone of tolerance was clarified by Marketing
consultants for MCB University Press (2000) : Consumers have two different level of
expectations for service quality : desired level and one they find adequate. A “ Zone
of Tolerance ” separates the two. The managers should measure both levels of
expectations because the service providers can fine-tune the way they allocate
resources by incorporating the zone of tolerance framework. For example, a service
provider with limited resources can improve customers’ perceptions of service quality
by making improvements to meet consumer’s minimum expectation levels on the
most essential attributes first. The service provider can then devote more resources
and attention to less essential attributes, and/or to better meeting desired standards.
SERVQUAL in Library Setting
The researchers of various subject areas contribute and adapt SERVQUAL
as the instrument to assess service quality and also in library setting. SERVQUAL has
been used in public, academic and research libraries continually. According to
Rowena Cullen ( See Cullen(2001), for a useful review) the modification of
SERVQUAL model was introduced to academic library managers by Hernon and
Altman . They used the data collected from surveys and focus groups to refine the
SERVQUAL model in order to develop a robust survey instrument for use
specifically in library and information services. Two later research projects have
tested the validity of the standard instrument used in the SERVQUAL model.
Nitecki’s doctoral research tested the SERVQUAL instrument on the three aspects of
library service- interlibrary loan, reference, and closed-reserve and concluded that the
instrument was useful in determining how well services match user expectations.
Hernon and Calvert tested the validity of the SERVQUAL instrument for evaluating
academic libraries among library students and librarians, and came up with an
instrument based on SERVQUAL.
Now, there is much potential for international collaboration on assessing
library service quality as seen from a cross-cultural study comparing perceptions of
service quality among library users in New Zealand and China and unequivocally
concluded that there are global commonalities in the way users think about library
service quality.( Kyrillidou and Hipps,2001)
Using SERVQUAL for Library Service Quality Assessment in Thailand
In Thailand, the first library service quality assessment by using
SERVQUAL was conducted by Surithong Srisa-ard (1997) for the fulfillment of her
doctoral dissertation “ User Expectations and Perceptions of Library Service Quality
of An Academic Library in Thailand” . The survey was set at an academic library at
Mahasarakham University (MSU) Thailand, to examined user expectations and
perceptions of library service quality. The survey focused on three services areas :
a) circulation; b) reference; and c) computer information service. The instrument is a
Thai translation of the SERVQUAL instrument as adapted by Danuta Ann Nitecki for
use in academic libraries. A follow-up survey of library staff based on the findings of
the SERVQUAL instrument was developed by the researcher to prioritize actions for
service improvement. The subjects of this study consisted of 582 graduate students,
84 faculty members of Mahasarakham University, and 25 professional library staff
members.
Presently, academic libraries in Thailand have faced the same situations as
most academic libraries in the world such as money cutback, digital environment, and
have to involve in some form of evaluation caused by the policy of the educational
quality assurance. The library managers have to seek the better way to improve the
service quality in order to survive and derive user’s loyalty.
Concept of Service quality for Library assessment
Service quality was defined in different ways but for the concept of service
quality that use for library evaluation is “ to examine the difference between a
customer’s expectations and the customer’s perceived sense to actual performance.”
( Calvert, 2001) Philip J. Calvert and Peter Hernon also mentioned that :
“Most typically, service quality is defined in terms of reducing the gap
between user expectations and actual service provided ” ( Philip J. Calvert
and Peter Hernon, 1997)
Though there is ambiguity between the concept of service quality and
satisfaction, Peter Hernon concluded that “ service quality focuses on the interaction
between customers and service providers, and the gap or difference between
expectations about service provision and perception about how the service wasactually provided. Satisfaction, on the other hand, does not involve gap analysis”
(Peter Hernon, 2002)
According to Philip Calvert (2001), the precursors o service quality can be
configured as follows:
The customer1. past experience of the customers:
2. word-of-mouth from other customers:
3. personal needs of the customer: and
4. national culture of the customer:
The service provider:5. Communications (direct and indirect) about what the customer can
expect.
Competitors:6. service provided by other providers that acts as a benchmark.
Related Research
According to literature review of Surithong Srisa-ard’s doctoral
dissertation, the article “ Measuring Service Quality at Yale University’s Libraries ”
written by Danuta A. Nitecki and Peter Hernon as well as database searching
( Dissertation Abstracts, EbscoHost Service, ScienceDirect , Ingenta, LISA ,and web
search) , the researchers in the field of library and information science used a
modification of SERVQUAL as an alternative instrument for shifting the way of
assessing library service quality. Surithong Srisa-ard mentioned that :
“ Library researchers have begun to use the SERVQUAL in their own
studies. Reviewing the literature on the SERVQUAL, Nitecki (1995) found that by
1994 it had been introduced explicitly to the library field through at least four
empirical studies undertaken in public, special, and academic libraries and through
three descriptive articles about service quality” The former research results revealed the useful findings that provide the
intellectual background for the present study as the followings :
SERVQUAL Dimensions in Library setting
The research results from Danuta A. Nitecki’s doctoral dissertation (1995)
was shown that among the 5 dimensions of SERVQUAL, the users rated reliability
was most important and tangibles was least important. This finding is parallel to
those of Surithong Srisa-ard’s (1997) , Fawz S. Abdallah ’s (2002) as well as Ford’s
(1994) which found that the users reported the high expectation on reliability. On the
contrary, the findings from the research project of Seay, Seaman and Cohen (1996)
was shown that tangibles and reliability were the key concerns of library patrons.
Anyway, most findings reflected that reliability is the most important quality in
evaluating library services that is similar to the result which the designers of
SERVQUAL proposed.
For the number of SERVQUAL dimensions , there are empirical research
which examined dimensions of SERVQUAL instrument. To test the data of user
expectations by factor analysis, Nitecki’s data, however, suggest a three-factor
relationship among the 22 SERVQUAL items rather than the five collapsed
dimensions which the scale’s designers identify from other applications. As literature
review of Nitecki and Hernon in the article “Measuring Service Quality at Yale
University’s Libraries ” , the point of view of researchers cited in the review can be
concluded that “ there may be three dimensions in libraries, tangibles, reliability or
service efficiency , and affect of service, and that there is a need for further researchto explore the dimensions “ that may underlie quality service as a construct in the
research library setting. ” ( Nitecki& Hernon, 2000)
The dimensions of the LibQUAL+
In October 1999, LibQUAL+ was developed to be a tool for library
service quality assessment by the Association of Research Libraries (ARL). This new
tool is a derivative of the SERVQUAL protocol. Through the LibQUAL+. The
dimensions of the tools are as the followings :
Affect of Service : it collapses three of the service dimensions identified
by SERVQUAL into one. These dimensions are Assurance, Empathy, and Reliability.
Reliability : Ability to perform the promised service dependably
and accurately.
Access to Information : the access was ensured through the provision of
comprehensive collections and ubiquity of access or the provision by all means
possible of barrier-free access to information at the time of need.
Library as Place : the ability to meet community requirements for
utilitarian space for study, collaboration, or rendezvous.
The concept about Library as Place is oftentimes especially important for
undergraduates whose options are more limited than graduate students and faculties
Self-reliance : the ability to foster self reliant information seeking
behavior through instruction, mentoring, signage and other means.
(Colleen Cook, et al.,2001)
Users’ Expectation Examination Related to National Culture
Philip J. Calvert (2001) studied the customer expectations in the
comparative research project “ International Variations in Measuring Customer
Expectations ” which examined the expectation between the library users in New
Zealand and China. ( library and information studies (LIS) students at Peking
University in China and Victoria University of Wellington in New Zealand ) The data
suggested that “ academic library users have very similar expectations of services”
Three dimensions that concern staff attitudes, the library environment, and services
that help the customers to find and use the library’s material efficiently are found in
both studies. Remarkably, the users from both countries prefer to work on their own
without personal contact. The library should make its service readily available when
the customer wants them, and offering the collection in good order that matches the
customer’s need. The result from the secondary project which examined the user
attitudes of both countries revealed that national culture does not seem to be a major
precursor of attitudes to service quality.
Related Research in Thailand
Surithong Srisa-ard (1997) used the modification of SERVQAUL to
assess the user expectations and perceptions in three service areas ( circulation,
reference and computer information service ) at the Academic Resource Center
( AREC) library at Maharakham University (MSU) in the fall of 1996 and the spring
of 1997. First, samples were the faculty and graduate students of MSU were asked to
complete a Thai translation of SERVQUAL instrument as modified by Nitecki
(1995).Second, all librarians and staff members of AREC were asked to complete an
accompanying questionnaire, designed by the researcher to interpret the survey results
in terms of the priority actions they suggest for the improvement of services of AREC
library users. This study is the only one SERVQUAL replication applied with
academic library service quality assessment in Thailand so the findings are useful for
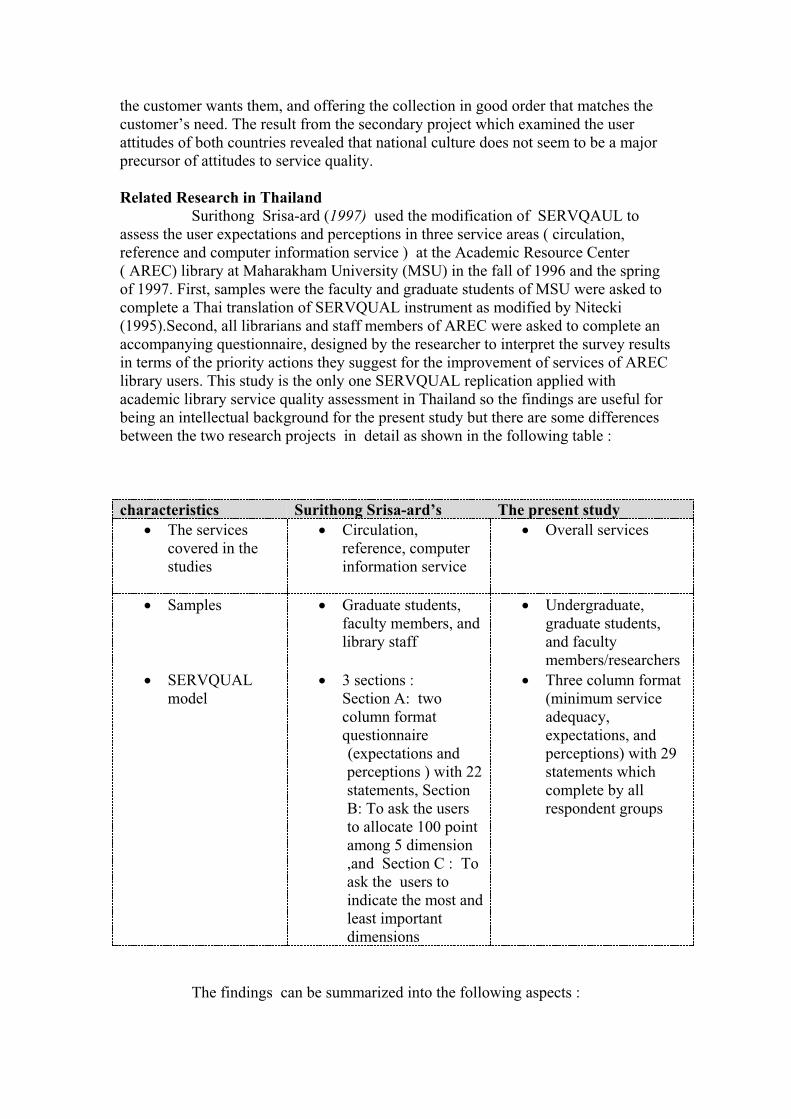
being an intellectual background for the present study but there are some differences
between the two research projects in detail as shown in the following table :
characteristics Surithong Srisa-ard’s The present study
The services
covered in the
studies
Circulation,
reference, computer
information service
Overall services
Samples Graduate students,
faculty members, and
library staff
Undergraduate,
graduate students,
and faculty
members/researchers
SERVQUAL
model
3 sections :
Section A: two
column format
questionnaire
(expectations and
perceptions ) with 22
statements, Section
B: To ask the users
to allocate 100 point
among 5 dimension
,and Section C : To
ask the users to
indicate the most and
least important
dimensions
Three column format
(minimum service
adequacy,
expectations, and
perceptions) with 29
statements which
complete by all
respondent groups
The findings can be summarized into the following aspects :
On most of the SERVQUAL statements, user expectations for service
quality lagged behind user expectations of actual service quality. When looking at the
size of the expectation-perception gaps, faculty members appeared to desire
improvements in the updating of equipment and in the promptness, sincerity ,
knowledge-ability, and degree of understanding with which staff assist users.
Graduate students had the same concerns, though they are generally more critical of
the library in terms of the number of SERVQUAL statements for which mean
expectation rating exceeded mean perception ratings. Unlike the faculty, students
indicated that their expectations for physical facilities, the visual appearance of library
materials, the neatness of employees, operating hours and the personal attention staff
give to users were not met. Among 5 dimensions of service quality, the findings
suggested that the AREC library users place a premium on the non- tangible aspects
of service, particularly reliability and responsiveness.
For conducting the research in Thai context, Surithong Srisa-ard found
some interesting aspects such as the much difference of treatment that library staff did
between faculty members and students , as well as the different interpretation with
some statements in SERVQUAL.
SERVQUAL Questionnaire of the Present Study
For the present study, the modification of SERVQUAL questionnaire
used in 2 universities in Japan (1 national, 1 private) , and one university each in
England and Finland was adopted . The SERVQUAL questionnaires .( see Appendix
A) were distributed to each respondent group of Thammasat University Library
System. The users were asked to complete the questionnaires with three levels of
services : minimum service , desired service, and perceived service. There are 7 point-
scale and 29 statements are arranged at random.
11
Chapter 3
Methods and Procedures
This chapter explains the methods used in carrying out the study, giving
special emphasis to the treatment and techniques used to analyze data. This survey
was conducted at one of the most important academic library system in Thailand,
Thammasat University Library System during August 20 – October 10, 2002. The
randomly selected respondents were asked to complete the modification of
SERVQUAL questionnaires. A pretest was managed to make the statements
understandable in Thai context. Data was gathered over 6 weeks and the second
copy of questionnaires were mailed to the non-respondents who are lecturers. After
that data was gathered and treated properly. The regulations were set to validate data
treatment.
This chapter explains the procedures, instrumentation, sampling, data
treatment, data analysis and techniques used in conducting research.
Instrumentation
The selected sample groups were asked to complete the SERVQUAL
instrument (Appendix A ). The instrument is divided into 2 sections. The first one
asked about background information such as personal information, major subject area,
faculties, as well as experience related to using library services. The second one is 29
statement questionnaire which asks users to rate the 3 service levels : minimum
service adequacy, desired services, and perceptions of actual service performance
which each rating prioritized by 7 point- scale.
The SERVQUAL instrument was translated into Thai by the researcher.
For the validation of the translation, Miss Yoopin Claymon , a specialist researcher
and linguist of the East Asian Studies Institute, Thammasat University checked for
the meaning and commented some statements that give ambiguous meanings. After
that, the edited version was re-examined by a lecturer of Department of Thai
Language for giving comment for language usage
As pretest, The Thai version of SERVQUAL instrument was completed by
4 lecturers, 1 researcher, and 3 students of Thammasat University. Some services
specified in the statements have to be giving more detail such as statements no. 12 “
Timely document delivery ” and no. 16 “ Access to digital collections from PC”. The
researcher added more detail in those statements such as what are “Document
delivery ” and “ Digital Collections ” as the result from a pretest shown that some
users exploited those services but don’t realize the technical terms used. . To avoid
misunderstanding while filling the questionnaire as the three column format
SERVQUAL model was quite new to Thai respondents, an instruction sheet was
attached with the copy of mailed instrument.
Sampling and Response Rates
The Samples
The samples in this study are the four groups of users of Thammasat
University Library System at Prachand and Rangsit Campus. The name list of student
samples ( undergraduate and graduate students ) were prepared by the programmer of
12
the Office of the Registrar through a computer random sampling. For faculty and
researcher samples, the researcher prepared from “ Thammasat Directory 2002”
.Only the researcher samples , the complete survey was used. The representative
samples of 2,139 users from each groups of users were targeted for participation in
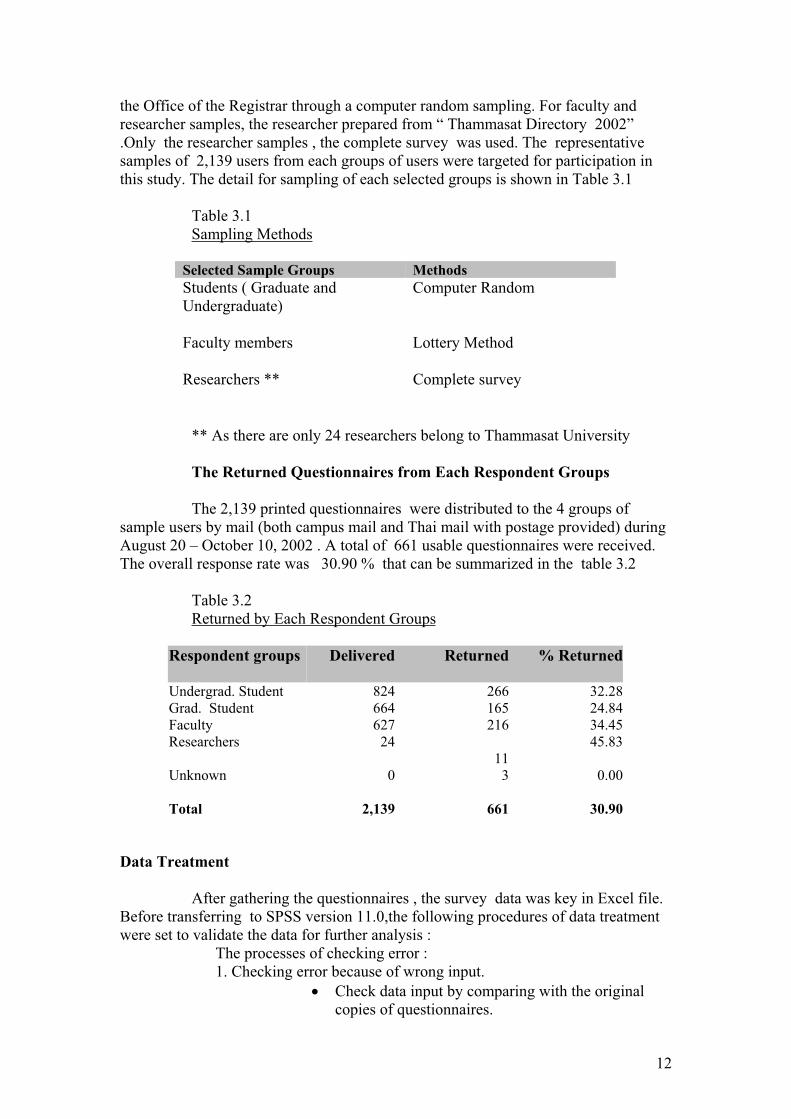
this study. The detail for sampling of each selected groups is shown in Table 3.1
Table 3.1
Sampling Methods
Selected Sample Groups Methods
Students ( Graduate and
Undergraduate)
Computer Random
Faculty members Lottery Method
Researchers ** Complete survey
** As there are only 24 researchers belong to Thammasat University
The Returned Questionnaires from Each Respondent Groups
The 2,139 printed questionnaires were distributed to the 4 groups of
sample users by mail (both campus mail and Thai mail with postage provided) during
August 20 – October 10, 2002 . A total of 661 usable questionnaires were received.
The overall response rate was 30.90 % that can be summarized in the table 3.2
Table 3.2
Returned by Each Respondent Groups
Respondent groups Delivered Returned % Returned
Undergrad. Student 824 266 32.28
Grad. Student 664 165 24.84
Faculty 627 216 34.45
Researchers 24
11
45.83
Unknown 0 3 0.00
Total 2,139 661 30.90
Data Treatment
After gathering the questionnaires , the survey data was key in Excel file.
Before transferring to SPSS version 11.0,the following procedures of data treatment
were set to validate the data for further analysis :
The processes of checking error :
1. Checking error because of wrong input.
Check data input by comparing with the original
copies of questionnaires.
13
Correct the wrong records.
2. Checking the gap differences among the following sections:
DEs (Desired service) - MEs (Minimum service)
which is called “Zone of Tolerance” (The area
between minimally acceptable and desired service
quality rating) . DEs must be higher than MEs or
can be at the same level. If the value in DEs is
minus, it means erroneous occurrence caused by the
response in the MEs section is higher than DEs.
Ps (Perceived service) - MEs (Minimum service)
If values from P1-29 – ME1-29 are all 0s , it means
the values in each section are the same so that
record has to be checked and modified if necessary.
Ps (Perceived service) - DEs ( Desired service)
The gap difference between these two sections will
help the administrators to provide excellent services
so if the values from Ps – DEs are all 0s or too
much gap difference , the record has to be checked
and modified if necessary.
** If the response in any record is blank , it means the following cases
appear in either section : 1. duplicate answers (9) 2. no reply (0) or 3. No comment
(N=8) in P section
The errors mentioned above have to be modified. Thus, the following
regulations were applied for survey data modification :
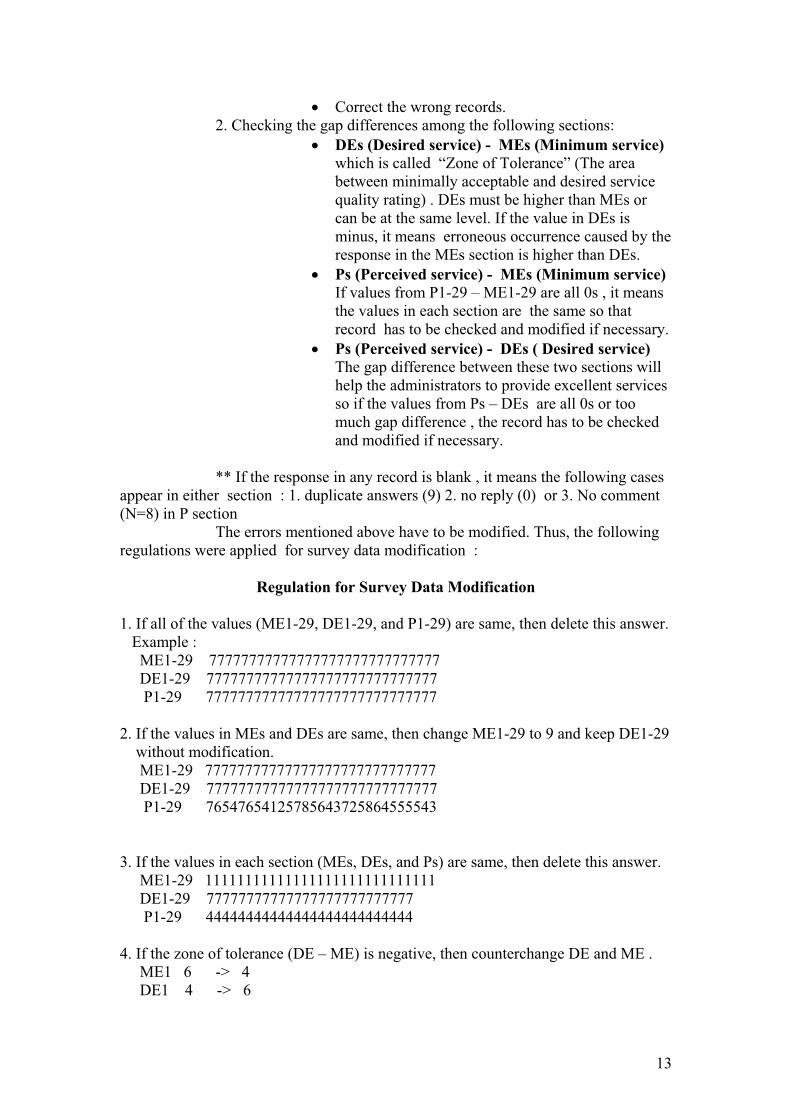
Regulation for Survey Data Modification
1. If all of the values (ME1-29, DE1-29, and P1-29) are same, then delete this answer.
Example :
ME1-29 77777777777777777777777777777
DE1-29 77777777777777777777777777777
P1-29 77777777777777777777777777777
2. If the values in MEs and DEs are same, then change ME1-29 to 9 and keep DE1-29
without modification.
ME1-29 77777777777777777777777777777
DE1-29 77777777777777777777777777777
P1-29 76547654125785643725864555543
3. If the values in each section (MEs, DEs, and Ps) are same, then delete this answer.
ME1-29 11111111111111111111111111111
DE1-29 77777777777777777777777777
P1-29 44444444444444444444444444
4. If the zone of tolerance (DE – ME) is negative, then counterchange DE and ME .
ME1 6 -> 4
DE1 4 -> 6
14
Characteristics of Sample Groups
Of 661 respondents , more than a half are female ( 63%) ( see
Table 3.3) and the majorities of the respondents are students : undergraduate 40.2%
and graduate students 25 % ( see Table 3.4)
Table 3. 3Sex of the Respondents
Frequency Valid Percent
female 411 63.0
male 241 37.0
Total 652 100
unknown 9
Total 661 100
Table 3.4
Categories of Respondent Groups
Frequency Valid Percent
Undergraduate
Student
266 40.2
Graduate Student 165 25.0
Faculty/Researcher 228 34.5
Unknown 2 .3
Total 661 100
For graduate students, most are studying in the master degree level
(93.9%) but for the undergraduate, the proportions of each year are slightly different.
(see Table 3.5 and 3.6).
Table 3.5
Categories for Graduate Students
Frequency Valid Percent
Master degree 155 93.9
Doctoral degree 4 2.4
Diploma 6 3.6
Total 165 100
15
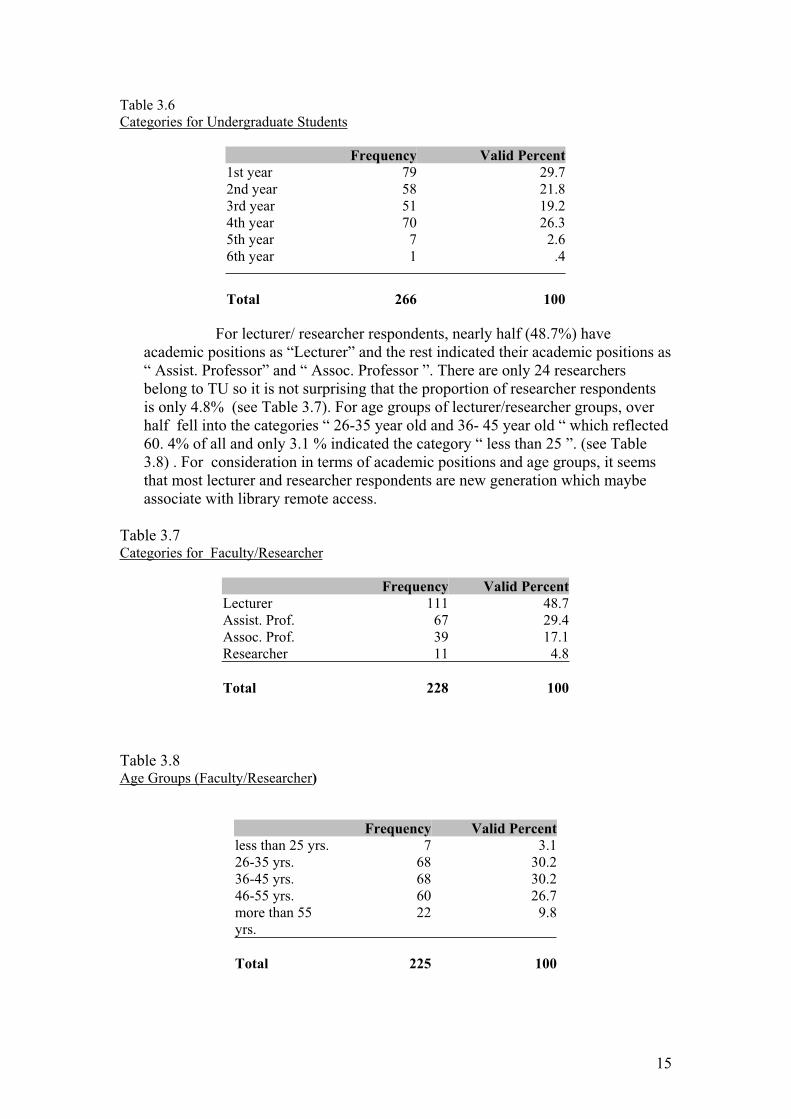
Table 3.6
Categories for Undergraduate Students
Frequency Valid Percent
1st year 79 29.7
2nd year 58 21.8
3rd year 51 19.2
4th year 70 26.3
5th year 7 2.6
6th year 1 .4
Total 266 100
For lecturer/ researcher respondents, nearly half (48.7%) have
academic positions as “Lecturer” and the rest indicated their academic positions as
“ Assist. Professor” and “ Assoc. Professor ”. There are only 24 researchers
belong to TU so it is not surprising that the proportion of researcher respondents
is only 4.8% (see Table 3.7). For age groups of lecturer/researcher groups, over
half fell into the categories “ 26-35 year old and 36- 45 year old “ which reflected
60. 4% of all and only 3.1 % indicated the category “ less than 25 ”. (see Table
3.8) . For consideration in terms of academic positions and age groups, it seems
that most lecturer and researcher respondents are new generation which maybe
associate with library remote access.
Table 3.7Categories for Faculty/Researcher
Frequency Valid Percent
Lecturer 111 48.7
Assist. Prof. 67 29.4
Assoc. Prof. 39 17.1
Researcher 11 4.8
Total 228 100
Table 3.8Age Groups (Faculty/Researcher)
Frequency Valid Percent
less than 25 yrs. 7 3.1
26-35 yrs. 68 30.2
36-45 yrs. 68 30.2
46-55 yrs. 60 26.7
more than 55
yrs.
22 9.8
Total 225 100
16
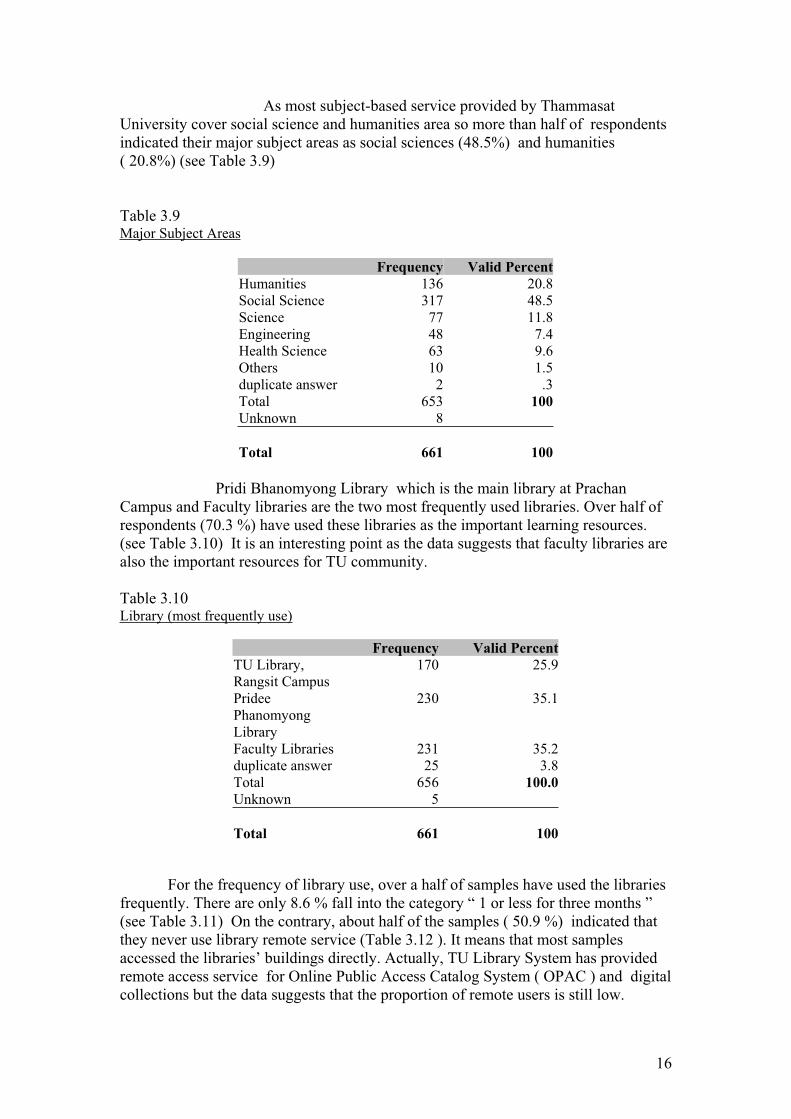
As most subject-based service provided by Thammasat
University cover social science and humanities area so more than half of respondents
indicated their major subject areas as social sciences (48.5%) and humanities
( 20.8%) (see Table 3.9)
Table 3.9Major Subject Areas
Frequency Valid Percent
Humanities 136 20.8
Social Science 317 48.5
Science 77 11.8
Engineering 48 7.4
Health Science 63 9.6
Others 10 1.5
duplicate answer 2 .3
Total 653 100
Unknown 8
Total 661 100
Pridi Bhanomyong Library which is the main library at Prachan
Campus and Faculty libraries are the two most frequently used libraries. Over half of
respondents (70.3 %) have used these libraries as the important learning resources.
(see Table 3.10) It is an interesting point as the data suggests that faculty libraries are
also the important resources for TU community.
Table 3.10Library (most frequently use)
Frequency Valid Percent
TU Library,
Rangsit Campus
170 25.9
Pridee
Phanomyong
Library
230 35.1
Faculty Libraries 231 35.2
duplicate answer 25 3.8
Total 656 100.0
Unknown 5
Total 661 100
For the frequency of library use, over a half of samples have used the libraries
frequently. There are only 8.6 % fall into the category “ 1 or less for three months ”
(see Table 3.11) On the contrary, about half of the samples ( 50.9 %) indicated that
they never use library remote service (Table 3.12 ). It means that most samples
accessed the libraries’ buildings directly. Actually, TU Library System has provided
remote access service for Online Public Access Catalog System ( OPAC ) and digital
collections but the data suggests that the proportion of remote users is still low.

17
Table 3.11
Frequency of Library use
Frequency Valid Percent
2 or more times a
week
218 33.3
once every 2 or 3
weeks
110 16.8
1 or less for three
months
56 8.6
once a week 171 26.1
once a month 99 15.1
Total 654 100
Unknown 7
Total 661 100
Table 3.12Frequency of remote use of all users
Frequency Valid Percent
2 or more
times a week
60 9.3
once every 2
or 3 weeks
52 8.0
1 or less for
three months
85 13.1
once a week 62 9.6
once a month 59 9.1
never 330 50.9
Total 648 100
Unknown 13
Total 661
For frequency of remote use by individual user group, about a half of each
user group use remote access while the percentage of the most frequent use ( 2 or
more times a week) is very low ( see Table 3.13 – Table 3.15). It is interesting that
the percentage of non user in graduate student group (which most are young
generation) is more than a half ( 59.1%) ( see Table 3.14). For undergraduate
student group, it seems that they access remote service more often than other groups
do. ( see Table 3.15)
18
Frequency of remote use by individual user group
Table 3.13
Facutly/Researcher
Frequency Valid Percent
2 or more times a
week
18 8.2
once every 2 or 3
weeks
22 10.0
1 or less for three
months
33 15.0
once a week 27 12.3
once a month 22 10.0
never 98 44.5
Total 220 100.0
Unknown 8
Total 228
Table 3.14
Graduate Students
Frequency Valid Percent
2 or more
times a
week
7 4.3
once every
2 or 3
weeks
8 4.9
1 or less
for three
months
26 15.9
once a
week
8 4.9
once a
month
18 11.0
never 97 59.1
Total 164 100.0
Unknown 1
Total 165
19
Table 3.15
Undergraduate students
Frequency Valid Percent
2 or more
times a week
35 13.3
once every 2
or 3 weeks
22 8.3
1 or less for
three months
26 9.8
once a week 27 10.2
once a month 19 7.2
never 135 51.1
Total 264 100.0
Unknown 2
Total 266
Number of Respondents Compared with Total TU Library Users
To compare the number of respondents with total library users of TU Library
System, the respondents are 2.37 % of the total users (faculty member, researcher,
graduate and undergraduate student ). The highest proportion is researcher group as
there are only 24 researchers belong to TU. For faculty member group, the data
reflects 17.79% of all. For graduate and undergraduate groups, the data reflects 2.58
% and 1.36% respectively. (see Table 3.16)
Table 3.16
Number of selected respondents compare with total TU population
(Based on information of the year 2002)
Types of Population Population Respondents %
Faculty 1,220 217 17.79
Researcher 24 11 45.83
Graduate student 6,396 165 2.58
Undergraduate student 20,261 266 1.36
Unknown 2
Total 27,901 661 2.37
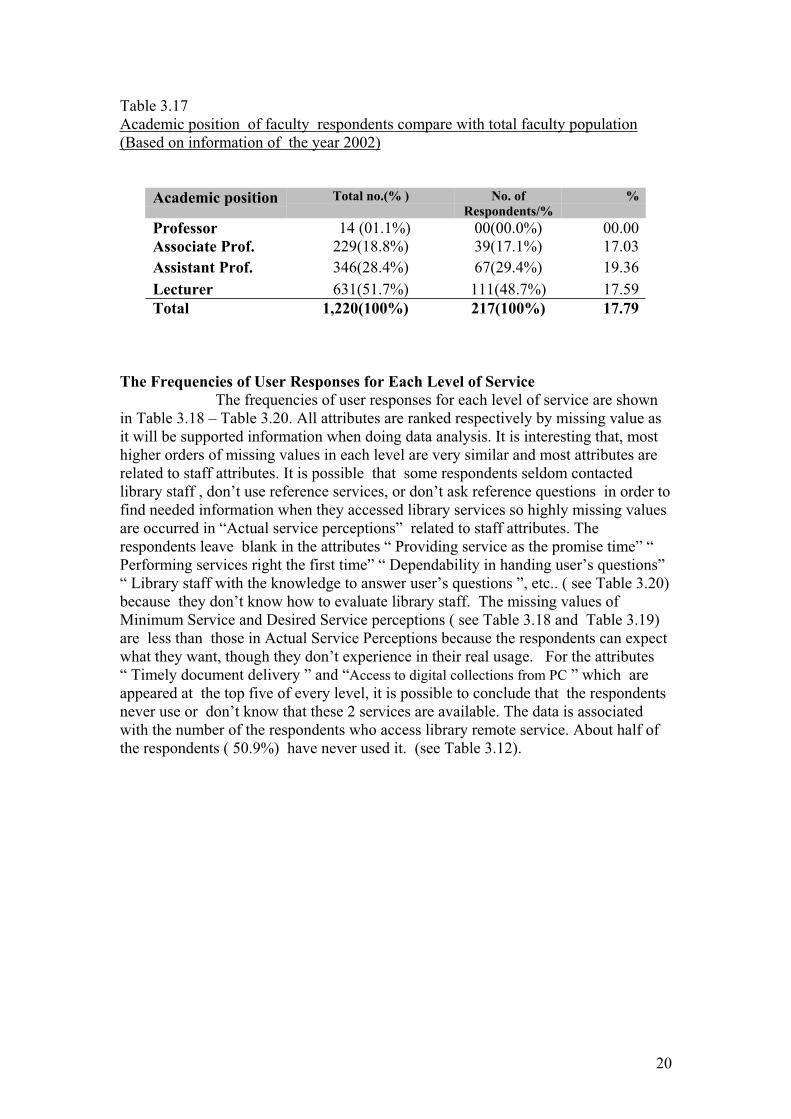
In the present study, the percentage of faculty respondent group compare
with faculty population is 17.79% ( see Table 3.17) and it is not surprising that most
respondents (48.7%) have academic position as “Lecturer” because “ Lecturer”
position occupied 51.7% of all TU lecturers. (Thammasat University Yearbook 2002,
52)
20
Table 3.17
Academic position of faculty respondents compare with total faculty population
(Based on information of the year 2002)
Academic position Total no.(% ) No. of
Respondents/%
%
Professor 14 (01.1%) 00(00.0%) 00.00
Associate Prof. 229(18.8%) 39(17.1%) 17.03
Assistant Prof. 346(28.4%) 67(29.4%) 19.36
Lecturer 631(51.7%) 111(48.7%) 17.59
Total 1,220(100%) 217(100%) 17.79
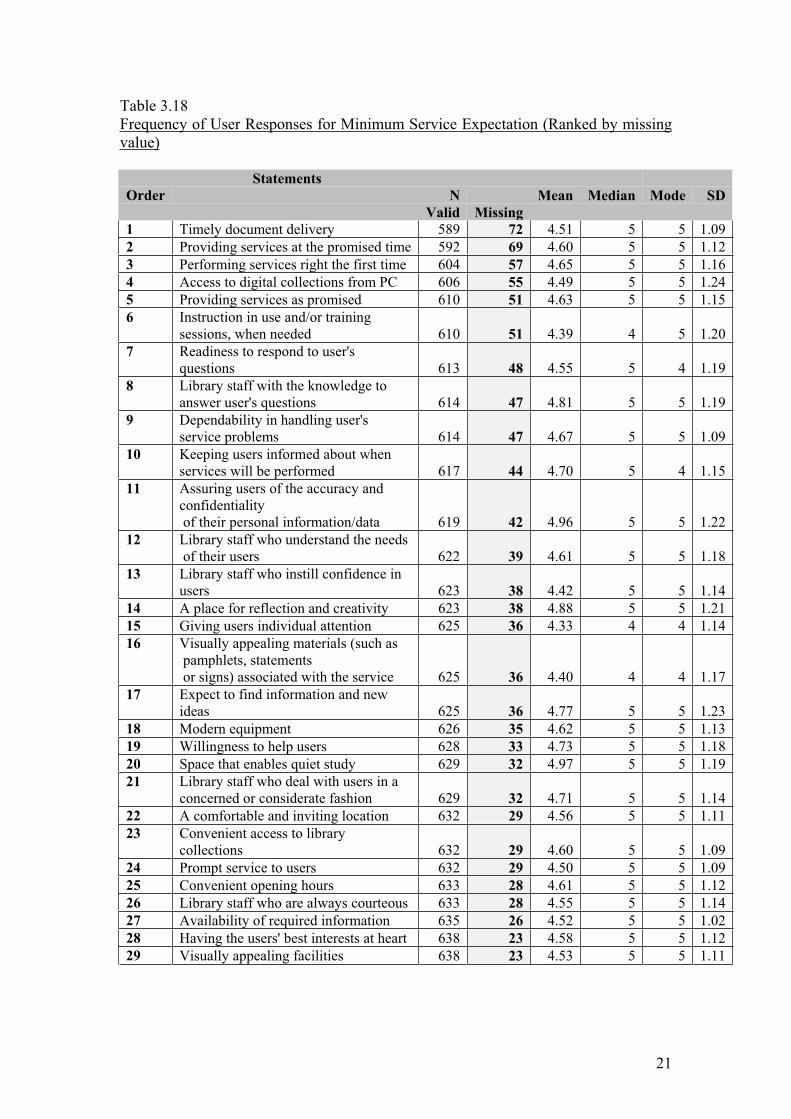
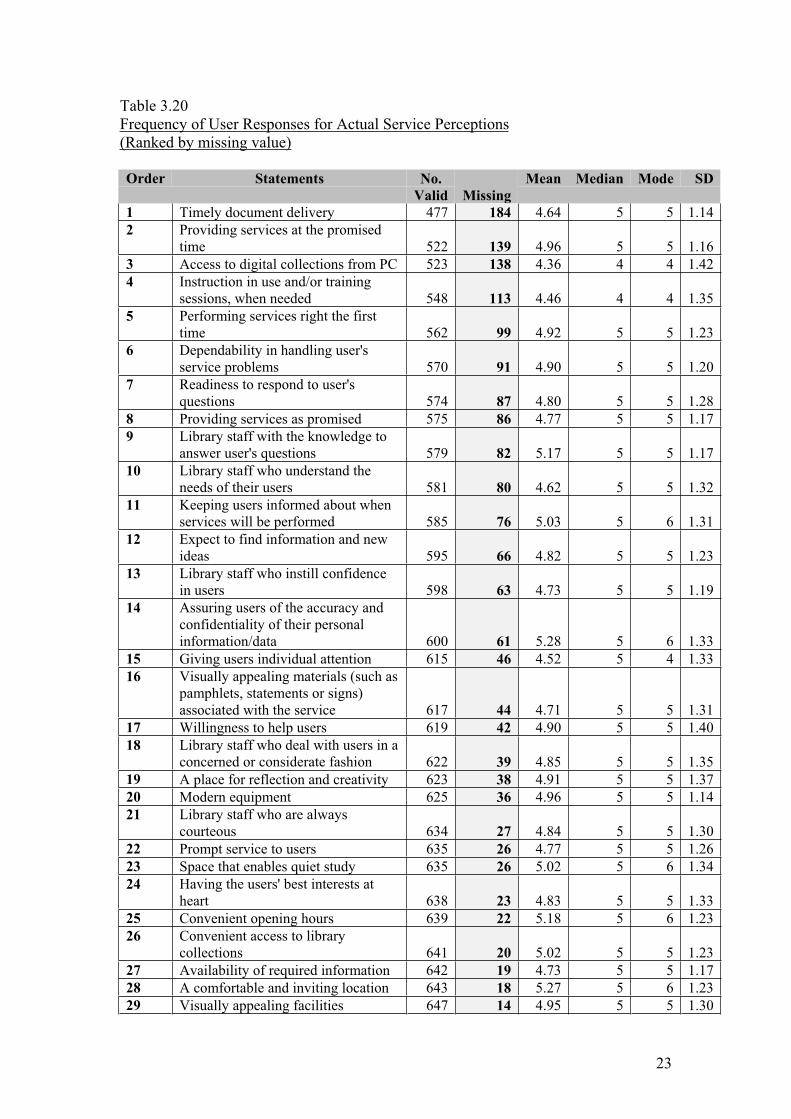
The Frequencies of User Responses for Each Level of Service
The frequencies of user responses for each level of service are shown
in Table 3.18 – Table 3.20. All attributes are ranked respectively by missing value as
it will be supported information when doing data analysis. It is interesting that, most
higher orders of missing values in each level are very similar and most attributes are
related to staff attributes. It is possible that some respondents seldom contacted
library staff , don’t use reference services, or don’t ask reference questions in order to
find needed information when they accessed library services so highly missing values
are occurred in “Actual service perceptions” related to staff attributes. The
respondents leave blank in the attributes “ Providing service as the promise time” “
Performing services right the first time” “ Dependability in handing user’s questions”
“ Library staff with the knowledge to answer user’s questions ”, etc.. ( see Table 3.20)
because they don’t know how to evaluate library staff. The missing values of
Minimum Service and Desired Service perceptions ( see Table 3.18 and Table 3.19)
are less than those in Actual Service Perceptions because the respondents can expect
what they want, though they don’t experience in their real usage. For the attributes
“ Timely document delivery ” and “Access to digital collections from PC ” which are
appeared at the top five of every level, it is possible to conclude that the respondents
never use or don’t know that these 2 services are available. The data is associated
with the number of the respondents who access library remote service. About half of
the respondents ( 50.9%) have never used it. (see Table 3.12).
21
Table 3.18
Frequency of User Responses for Minimum Service Expectation (Ranked by missing
value)
Statements
Order N Mean Median Mode SD
Valid Missing
1 Timely document delivery 589 72 4.51 5 5 1.09
2 Providing services at the promised time 592 69 4.60 5 5 1.12
3 Performing services right the first time 604 57 4.65 5 5 1.16
4 Access to digital collections from PC 606 55 4.49 5 5 1.24
5 Providing services as promised 610 51 4.63 5 5 1.15
6 Instruction in use and/or training
sessions, when needed 610 51 4.39 4 5 1.20
7 Readiness to respond to user's
questions 613 48 4.55 5 4 1.19
8 Library staff with the knowledge to
answer user's questions 614 47 4.81 5 5 1.19
9 Dependability in handling user's
service problems 614 47 4.67 5 5 1.09
10 Keeping users informed about when
services will be performed 617 44 4.70 5 4 1.15
11 Assuring users of the accuracy and
confidentiality
of their personal information/data 619 42 4.96 5 5 1.22
12 Library staff who understand the needs
of their users 622 39 4.61 5 5 1.18
13 Library staff who instill confidence in
users 623 38 4.42 5 5 1.14
14 A place for reflection and creativity 623 38 4.88 5 5 1.21
15 Giving users individual attention 625 36 4.33 4 4 1.14
16 Visually appealing materials (such as
pamphlets, statements
or signs) associated with the service 625 36 4.40 4 4 1.17
17 Expect to find information and new
ideas 625 36 4.77 5 5 1.23
18 Modern equipment 626 35 4.62 5 5 1.13
19 Willingness to help users 628 33 4.73 5 5 1.18
20 Space that enables quiet study 629 32 4.97 5 5 1.19
21 Library staff who deal with users in a
concerned or considerate fashion 629 32 4.71 5 5 1.14
22 A comfortable and inviting location 632 29 4.56 5 5 1.11
23 Convenient access to library
collections 632 29 4.60 5 5 1.09
24 Prompt service to users 632 29 4.50 5 5 1.09
25 Convenient opening hours 633 28 4.61 5 5 1.12
26 Library staff who are always courteous 633 28 4.55 5 5 1.14
27 Availability of required information 635 26 4.52 5 5 1.02
28 Having the users' best interests at heart 638 23 4.58 5 5 1.12
29 Visually appealing facilities 638 23 4.53 5 5 1.11

22
Table 3.19
Frequency of User Responses for Desired Service Expectation
(Ranked by missing value)
Statements
Order N
Valid Missing Mean Median Mode SD
1 Timely document delivery 596 65 5.84 6 6 0.98
2 Providing services at the promised time 597 64 5.90 6 6 0.95
3 Access to digital collections from PC 610 51 5.89 6 6 1.06
4 Performing services right the first time 610 51 5.99 6 6 0.99
5 Providing services as promised 615 46 5.97 6 7 0.99
6 Instruction in use and/or training
sessions,
when needed 615 46 5.71 6 6 1.07
7 Library staff with the knowledge to
answer
user's questions 618 43 6.15 6 7 0.93
8 Readiness to respond to user's
questions 618 43 5.96 6 6 1.00
9 Dependability in handling user's
service problems 620 41 5.95 6 6 0.96
10 Keeping users informed about when
services will be performed 623 38 5.91 6 6 0.98
11 Assuring users of the accuracy and
confidentiality of their personal
information/data 625 36 6.14 6 7 0.96
12 Library staff who understand the needs
of their users 627 34 5.95 6 6 1.00
13 Library staff who instill confidence in
users 629 32 5.84 6 6 0.95
14 A place for reflection and creativity 629 32 6.30 7 7 0.87
15 Modern equipment 631 30 6.00 6 6 0.97
16 Giving users individual attention 632 29 5.65 6 6 1.06
17 Visually appealing materials
(such as pamphlets, statements or
signs)
associated with the service 632 29 5.76 6 6 1.06
18 Willingness to help users 634 27 6.10 6 7 0.95
19 Prompt service to users 635 26 6.03 6 6 0.96
20 Library staff who deal with users in a
concerned or considerate fashion 635 26 6.09 6 6 0.95
21 Convenient opening hours 636 25 6.04 6 6 0.90
22 Convenient access to library
collections 636 25 6.13 6 6 0.89
23 Space that enables quiet study 636 25 6.32 7 7 0.86
24 Expect to find information and new
ideas 636 25 6.16 6 7 0.97
25 Library staff who are always courteous 638 23 5.97 6 6 0.96
26 Visually appealing facilities 640 21 6.09 6 6 0.96
27 Availability of required information 641 20 6.08 6 6 0.88
28 A comfortable and inviting location 641 20 6.02 6 6 0.90
29 Having the users' best interests at heart 642 19 6.02 6 6 0.97
23
Table 3.20
Frequency of User Responses for Actual Service Perceptions
(Ranked by missing value)
Order Statements Mean Median Mode SDNo.
Valid Missing
1 Timely document delivery 477 184 4.64 5 5 1.14
2 Providing services at the promised
time 522 139 4.96 5 5 1.16
3 Access to digital collections from PC 523 138 4.36 4 4 1.42
4 Instruction in use and/or training
sessions, when needed 548 113 4.46 4 4 1.35
5 Performing services right the first
time 562 99 4.92 5 5 1.23
6 Dependability in handling user's
service problems 570 91 4.90 5 5 1.20
7 Readiness to respond to user's
questions 574 87 4.80 5 5 1.28
8 Providing services as promised 575 86 4.77 5 5 1.17
9 Library staff with the knowledge to
answer user's questions 579 82 5.17 5 5 1.17
10 Library staff who understand the
needs of their users 581 80 4.62 5 5 1.32
11 Keeping users informed about when
services will be performed 585 76 5.03 5 6 1.31
12 Expect to find information and new
ideas 595 66 4.82 5 5 1.23
13 Library staff who instill confidence
in users 598 63 4.73 5 5 1.19
14 Assuring users of the accuracy and
confidentiality of their personal
information/data 600 61 5.28 5 6 1.33
15 Giving users individual attention 615 46 4.52 5 4 1.33
16 Visually appealing materials (such as
pamphlets, statements or signs)
associated with the service 617 44 4.71 5 5 1.31
17 Willingness to help users 619 42 4.90 5 5 1.40
18 Library staff who deal with users in a
concerned or considerate fashion 622 39 4.85 5 5 1.35
19 A place for reflection and creativity 623 38 4.91 5 5 1.37
20 Modern equipment 625 36 4.96 5 5 1.14
21 Library staff who are always
courteous 634 27 4.84 5 5 1.30
22 Prompt service to users 635 26 4.77 5 5 1.26
23 Space that enables quiet study 635 26 5.02 5 6 1.34
24 Having the users' best interests at
heart 638 23 4.83 5 5 1.33
25 Convenient opening hours 639 22 5.18 5 6 1.23
26 Convenient access to library
collections 641 20 5.02 5 5 1.23
27 Availability of required information 642 19 4.73 5 5 1.17
28 A comfortable and inviting location 643 18 5.27 5 6 1.23
29 Visually appealing facilities 647 14 4.95 5 5 1.30
24
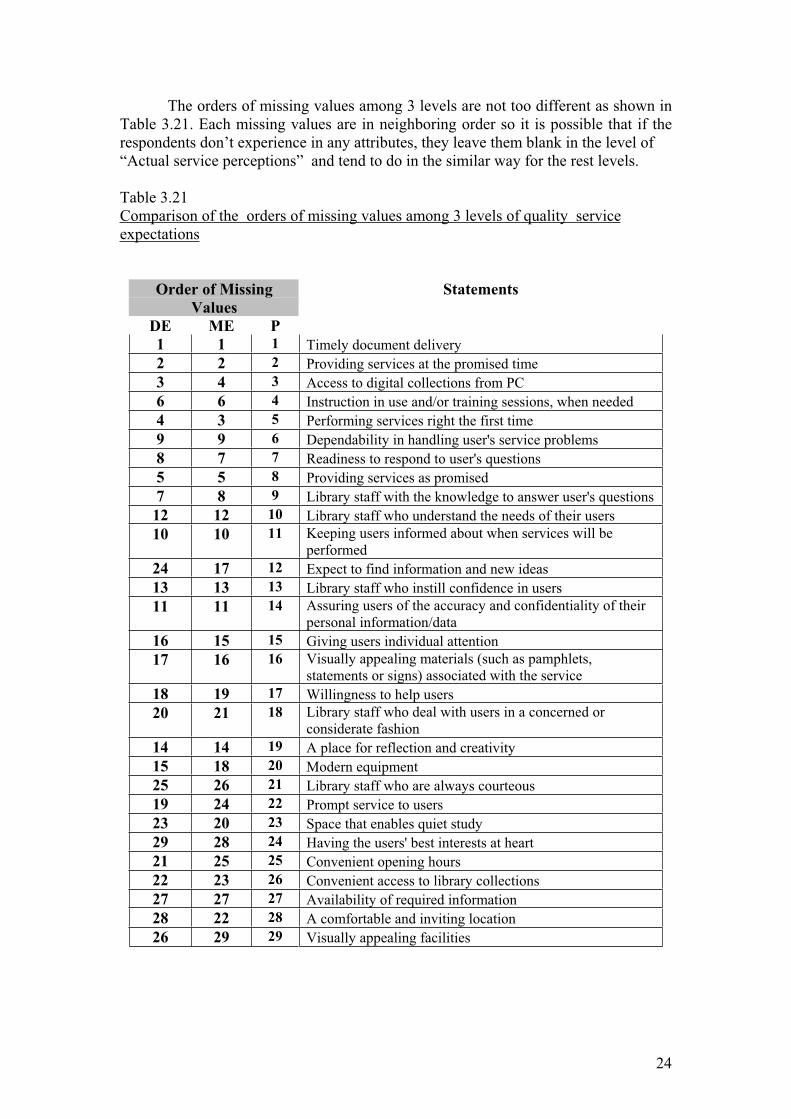
The orders of missing values among 3 levels are not too different as shown in
Table 3.21. Each missing values are in neighboring order so it is possible that if the
respondents don’t experience in any attributes, they leave them blank in the level of
“Actual service perceptions” and tend to do in the similar way for the rest levels.
Table 3.21
Comparison of the orders of missing values among 3 levels of quality service
expectations
Order of Missing
Values
DE ME P
Statements
1 1 1 Timely document delivery
2 2 2 Providing services at the promised time
3 4 3 Access to digital collections from PC
6 6 4 Instruction in use and/or training sessions, when needed
4 3 5 Performing services right the first time
9 9 6 Dependability in handling user's service problems
8 7 7 Readiness to respond to user's questions
5 5 8 Providing services as promised
7 8 9 Library staff with the knowledge to answer user's questions
12 12 10 Library staff who understand the needs of their users
10 10 11 Keeping users informed about when services will be
performed
24 17 12 Expect to find information and new ideas
13 13 13 Library staff who instill confidence in users
11 11 14 Assuring users of the accuracy and confidentiality of their
personal information/data
16 15 15 Giving users individual attention
17 16 16 Visually appealing materials (such as pamphlets,
statements or signs) associated with the service
18 19 17 Willingness to help users
20 21 18 Library staff who deal with users in a concerned or
considerate fashion
14 14 19 A place for reflection and creativity
15 18 20 Modern equipment
25 26 21 Library staff who are always courteous
19 24 22 Prompt service to users
23 20 23 Space that enables quiet study
29 28 24 Having the users' best interests at heart
21 25 25 Convenient opening hours
22 23 26 Convenient access to library collections
27 27 27 Availability of required information
28 22 28 A comfortable and inviting location
26 29 29 Visually appealing facilities
25
Statistical Method and Techniques Used for Data Analysis
After data treatment, the data was transferred to SPSS Version 11.0 and do
statistical analysis in order to accomplish the purposes of the study. The data will be
analyzed in the following ways. First, to elicit in what way the TU Library System
provided service to its users, the gap discrepancy between desired service and actual
service performance will be calculated and ranked respectively.
Second, to examine in what way TU Library System provided service to its
individual group of user , the gap discrepancy between desired service and actual
service performance will be calculated by individual group of users and ranked
respectively. This result can suggest what service meet, exceed or fall short into the
user expectations.
Third, to investigate which dimensions that determine the customers’
evaluation of service quality in TU Library System, factor analysis will be applied .
The data will be useful for the library managers in terms of management the service
planning what they should do urgently.
Fourth, to investigate which are the most essential attributes that library
manager should allocate the resource for good service quality, the “Zone of
Tolerance” which is the range between desired service expectation and minimum
service adequacy will be calculated.
Finally, the open-ended questions will be categorized, counted, and ranked
respectively as the data will suggest what problems the users encountered when they
involved in library service.
26
Chapter 4
Data Analysis
To assess the service quality of TU Library system, the adaptation of
SERVQUAL questionnaires were distributed to the target groups by mail. The
respondents were asked to rate each attribute of service quality 3 times in the three
columns : minimum service level , desired service level , and perception of actual
service level. The scales used were 7 point scale which ordered from 1“lowest ” to 7
“ highest ” .
This chapter reports the study results which will answer the 6 research
questions. The 7 research questions are as the followings :
1. In what ways do TU Library System provide service to its users ?
2. By individual group of users, in what ways do TU Library System
provide service to its users?
3. By individual group of users, which attributes of service quality equal,
exceed or fall short user perceptions ?
For these 3 research questions, the gap difference between desired service
level and actual service perceptions as well as a paired sample t-test will be
calculated.
4. By individual group of users, in what way do the users expect for
excellent service quality from TU Library system ?
The means of desired service expectations will be ranked and compared
among 3 groups of users.
5. What are the dimensions that determine the customers’ evaluation of
service quality of TU Library System?
Factor analysis methods will be applied to investigate the dimensions of
service quality. The results can be supported information for the library managers to
convert the theory into practical resources allocation decisions (Philip J. Calvert,
2001)
6. What are the most essential attributes that library managers should
allocated the resources to support for improving excellent service quality?
The “ Zone of Tolerance ” which is the range between desired service
expectation and minimum service expectation will be calculated to find such
attributes.
7. What problems did the users encounter when involved in library
services?
To investigate the problems users encountered when involved in library
service, the open ended comments will be counted and classified by categories.
What are the gaps between user desired service expectations and actual
service perception ?
As the gap discrepancy between desired service expectation and perception
of actual service is the key concept of service quality so the gaps difference between
the two levels of service expectations were calculated and ranked order by gap size.
The result from Table 4.1 reveals that all attributes of service quality
don’t meet the users’ expectations. The reason is like Surithong Srisa-ard mentioned
in her doctoral thesis :
“It is natural tendency of people to wish for more than they have ”
27
The larger gaps are the attributes that related to materials, study
environment and staff attributes. The result reflects that the attributes related to
dimensions “ Collection & Access ” and “Library as Place ” occupied among the top
five ranking. The gap differences related to staff attributes ( Empathy &
Responsiveness) are ranked respectively behind the “ Collection & Access” and
“ Library as Place”. It seems that “Tangibles” dimension is not problematic as the
gap rank is quite low. It is interesting that the attribute “A comfortable and inviting
location” is at the lowest rank which is contradictory to the aforementioned ranking.
It seems that the libraries are comfortable and inviting but too noisy and don’t have
enough space for quiet study.
For the attribute related to “ Reliability ” dimension, the most problematic
attribute is “ Providing services as promise”, For the rest attributes, the gaps are not
too large.
28
Table 4.1
Gap Difference between Desired Service Expectation and Perceived Service
Expectation (Order by Gap size)
Rank
Order
By
Gap
size
Dimensions
Statements Mean
diff.
1Collection&
Access Access to digital collections from PC 1.58
2 Library as
Place A place for reflection and creativity 1.39
3 Collection &
Access Availability of required information 1.37
4 Collection &
Access Expect to find information and new ideas 1.37
5 Empathy Library staff who understand the needs of their users 1.33
6 Collection&
Access Instruction in use and/or training sessions, when needed 1.29
7 Library as
Place Space that enables quiet study 1.28
8 Responsiveness Prompt service to users 1.25
9
Empathy
Library staff who deal with users in a concerned or considerate
fashion 1.24
10 Responsiveness Willingness to help users 1.20
11 Empathy Having the users' best interests at heart 1.20
12 Reliability Providing services as promised 1.19
13 Collection &
Access Timely document delivery 1.19
14 Responsiveness Readiness to respond to user's questions 1.17
15 Empathy Giving users individual attention 1.16
16 Tangibles Visually appealing facilities 1.15
17 Assurance Library staff who are always courteous 1.15
18 Assurance Library staff who instill confidence in users 1.12
19 Collection&
Access Convenient access to library collections 1.11
20 Reliability Performing services right the first time 1.07
21 Reliability Dependability in handling user's service problems 1.06
22
Tangibles
Visually appealing materials (such as pamphlets, statements or
signs) associated with the service 1.04
23 Tangibles Modern equipment 1.04
24 Assurance Library staff with the knowledge to answer user's questions 0.97
25 Reliability Providing services at the promised time 0.93
26 Responsiveness Keeping users informed about when services will be performed 0.89
27
Assurance
Assuring users of the accuracy and confidentiality of their
personal information/data 0.87
28 Empathy Convenient opening hours 0.86
29 Library as
Place A comfortable and inviting location 0.75
29
By individual group of users, what are the gaps between user desired
service expectations and actual service perception ?
The result reveals that by individual group of user, all desired service
expectations are lagged behind the actual service perception. (see Table 4.2, 4.4 and
4.6) When the gap sizes were ranked by order, there are similarities between
faculty/researcher group and graduate student group ( see Table 4.3 & Table 4.5) The
ranks of gap differences for dimensions “ Collection &Access” and ”Library as Place
” are at the top five. On the contrary, for undergraduate student group, the dimensions
related to library staff attributes ( “Responsiveness ”, “ Empathy”, and “Assurance” )
are at the top five.
For faculty/researcher group and graduate student group, the largest gap is
the same attribute “Access to digital collection from PC ” and the top five gaps are
very similar. If we consider the frequency of remote access use of these 2 groups, a
half of the respondents never use remote access service (see Table 3.12) and by
individual group, about a half of each group never use remote access either (see Table
3.13 – Table 3.15) This result can be anticipated in many ways such as most users
have to access digital collection within library building, never use this service at all,
or don’t know that the services are available.
For the attributes that related to staff attributes, it is interesting that in the
perspectives of each user group the rank are different. For faculty/researcher group,
the gap differences are not too large and most are at the low rank. ( see Table 4.3) For
graduate student group, the staff attributes are ranked behind the physical attributes :
especially the dimension “Empathy” (see Table 4.5) For undergraduate group, it
seems that the gap differences are larger than those of other groups.( see Table 4.7)
Anyway, in the perspectives of undergraduate student group, the dimension “ Library
as Place ”and “ Collection&Access” are problematic as they are ranked at the higher
orders and the gap differences are large. It seems library staff treat the
faculty/researcher different from students.

30
Table 4.2
Faculty/Researcher (t-test)
Expectation Perception Mean t
Statements Score SD Score SD Diff.
Mean Mean
1.Availability of required information 6.07 0.91 4.81 1.17 1.26 13.42*
2.Convenient opening hours 6.01 0.89 5.15 1.32 0.86 8.40*
3.A comfortable and inviting location 6.01 0.94 5.15 1.24 0.86 8.99*
4.Having the users' best interests at heart 6.08 1.00 5.22 1.19 0.85 9.68*
5.Convenient access to library collections 6.20 0.86 5.16 1.26 1.04 11.04*
6.Prompt service to users 6.00 0.98 5.06 1.27 0.94 10.48*
7.Visually appealing facilities 6.04 1.00 4.87 1.29 1.18 11.29*
8.Library staff who are always courteous 6.12 0.87 5.30 1.15 0.82 9.49*
9.Giving users individual attention 5.81 0.94 4.95 1.27 0.86 8.67*
10.Space that enables quiet study 6.30 0.82 4.94 1.29 1.35 13.76*
11.Modern equipment 6.03 0.94 4.87 1.14 1.16 11.91*
12.Timely document delivery 6.02 0.81 4.81 1.12 1.21 10.78*
13.Keeping users informed about when
services will be performed 6.05 0.95 5.18 1.30 0.87 8.37*
14.Assuring users of the accuracy and
confidentiality of their personal
information/data 6.23 0.87 5.41 1.29 0.82 8.67*
15.Visually appealing materials (such as
pamphlets, statements or signs) associated
with the service 5.91 0.99 4.67 1.26 1.25 12.26*
16.Access to digital collections from PC 6.17 0.94 4.47 1.48 1.70 12.84*
17.Providing services as promised 6.05 0.95 4.88 1.16 1.17 11.20*
18.Willingness to help users 6.15 0.90 5.29 1.34 0.86 8.21*
19.Instruction in use and/or training
sessions, when needed 5.90 1.02 4.78 1.41 1.13 10.09*
20.Library staff who understand the needs
of their users 6.01 0.95 4.87 1.33 1.14 10.29*
21.Library staff who instill confidence in
users 5.90 0.97 4.97 1.20 0.93 10.02*
22.Providing services at the promised time 6.02 0.94 5.09 1.13 0.93 9.90*
23.Library staff with the knowledge to
answer user's questions 6.18 0.93 5.40 1.15 0.77 9.14*
24.Performing services right the first time 5.98 0.92 5.16 1.15 0.83 8.36*
25.Dependability in handling user's service
problems 6.00 0.89 5.08 1.16 0.92 9.53*
26.Expect to find information and new ideas 6.19 0.95 4.84 1.28 1.36 13.22*
27.Readiness to respond to user's questions 6.01 0.97 5.07 1.27 0.94 9.42*
28.A place for reflection and creativity 6.23 0.95 4.75 1.40 1.48 13.36*
29.Library staff who deal with users in a
concerned or considerate fashion 6.13 0.90 5.17 1.30 0.95 9.88*
* Note p < . 05
31
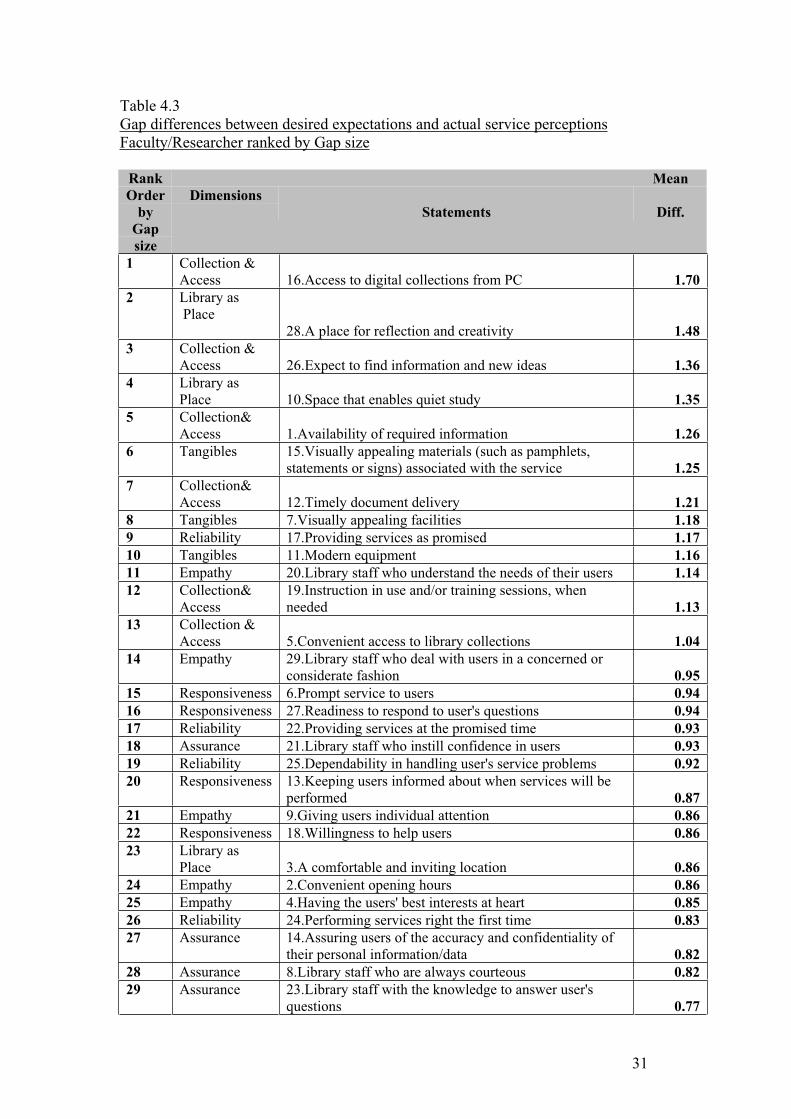
Table 4.3
Gap differences between desired expectations and actual service perceptions
Faculty/Researcher ranked by Gap size
Rank Mean
Order
by
Dimensions
Statements Diff.
Gap
size
1 Collection &
Access 16.Access to digital collections from PC 1.70
2 Library as
Place
28.A place for reflection and creativity 1.48
3 Collection &
Access 26.Expect to find information and new ideas 1.36
4 Library as
Place 10.Space that enables quiet study 1.35
5 Collection&
Access 1.Availability of required information 1.26
6 Tangibles 15.Visually appealing materials (such as pamphlets,
statements or signs) associated with the service 1.25
7 Collection&
Access 12.Timely document delivery 1.21
8 Tangibles 7.Visually appealing facilities 1.18
9 Reliability 17.Providing services as promised 1.17
10 Tangibles 11.Modern equipment 1.16
11 Empathy 20.Library staff who understand the needs of their users 1.14
12 Collection&
Access
19.Instruction in use and/or training sessions, when
needed 1.13
13 Collection &
Access 5.Convenient access to library collections 1.04
14 Empathy 29.Library staff who deal with users in a concerned or
considerate fashion 0.95
15 Responsiveness 6.Prompt service to users 0.94
16 Responsiveness 27.Readiness to respond to user's questions 0.94
17 Reliability 22.Providing services at the promised time 0.93
18 Assurance 21.Library staff who instill confidence in users 0.93
19 Reliability 25.Dependability in handling user's service problems 0.92
20 Responsiveness 13.Keeping users informed about when services will be
performed 0.87
21 Empathy 9.Giving users individual attention 0.86
22 Responsiveness 18.Willingness to help users 0.86
23 Library as
Place 3.A comfortable and inviting location 0.86
24 Empathy 2.Convenient opening hours 0.86
25 Empathy 4.Having the users' best interests at heart 0.85
26 Reliability 24.Performing services right the first time 0.83
27 Assurance 14.Assuring users of the accuracy and confidentiality of
their personal information/data 0.82
28 Assurance 8.Library staff who are always courteous 0.82
29 Assurance 23.Library staff with the knowledge to answer user's
questions 0.77
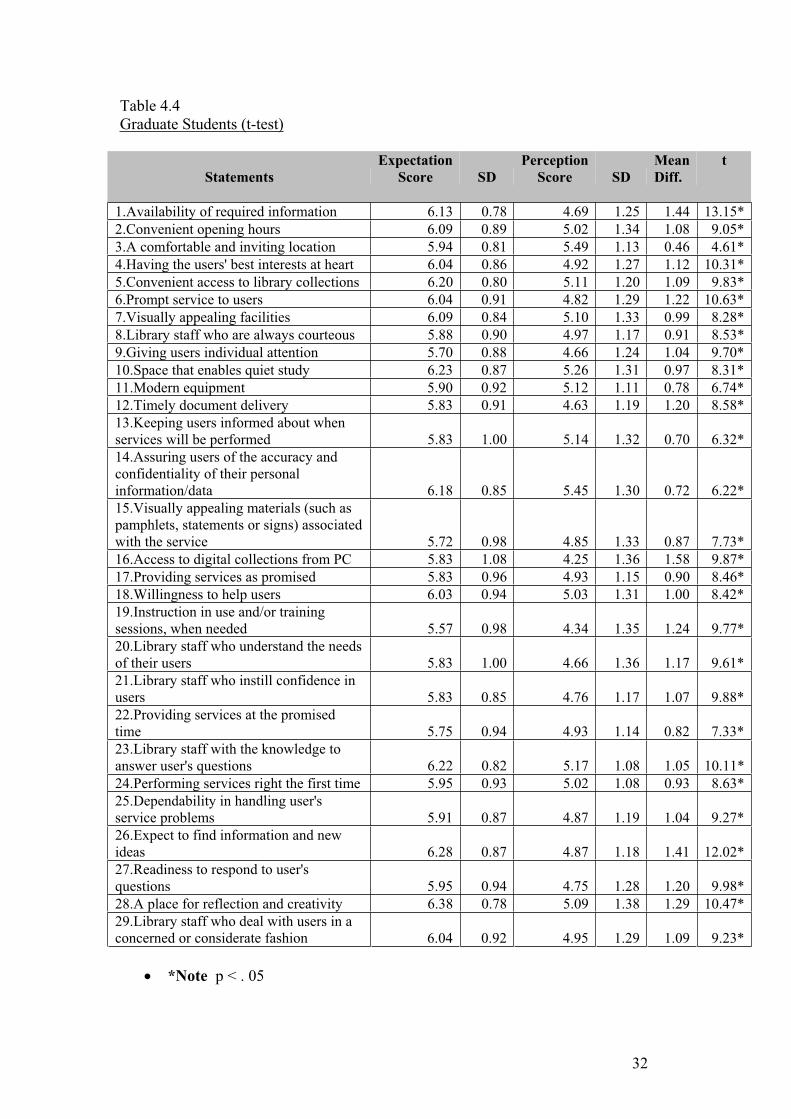
32
Table 4.4
Graduate Students (t-test)
Expectation Perception Mean t
Statements Score SD Score SD Diff.
1.Availability of required information 6.13 0.78 4.69 1.25 1.44 13.15*
2.Convenient opening hours 6.09 0.89 5.02 1.34 1.08 9.05*
3.A comfortable and inviting location 5.94 0.81 5.49 1.13 0.46 4.61*
4.Having the users' best interests at heart 6.04 0.86 4.92 1.27 1.12 10.31*
5.Convenient access to library collections 6.20 0.80 5.11 1.20 1.09 9.83*
6.Prompt service to users 6.04 0.91 4.82 1.29 1.22 10.63*
7.Visually appealing facilities 6.09 0.84 5.10 1.33 0.99 8.28*
8.Library staff who are always courteous 5.88 0.90 4.97 1.17 0.91 8.53*
9.Giving users individual attention 5.70 0.88 4.66 1.24 1.04 9.70*
10.Space that enables quiet study 6.23 0.87 5.26 1.31 0.97 8.31*
11.Modern equipment 5.90 0.92 5.12 1.11 0.78 6.74*
12.Timely document delivery 5.83 0.91 4.63 1.19 1.20 8.58*
13.Keeping users informed about when
services will be performed 5.83 1.00 5.14 1.32 0.70 6.32*
14.Assuring users of the accuracy and
confidentiality of their personal
information/data 6.18 0.85 5.45 1.30 0.72 6.22*
15.Visually appealing materials (such as
pamphlets, statements or signs) associated
with the service 5.72 0.98 4.85 1.33 0.87 7.73*
16.Access to digital collections from PC 5.83 1.08 4.25 1.36 1.58 9.87*
17.Providing services as promised 5.83 0.96 4.93 1.15 0.90 8.46*
18.Willingness to help users 6.03 0.94 5.03 1.31 1.00 8.42*
19.Instruction in use and/or training
sessions, when needed 5.57 0.98 4.34 1.35 1.24 9.77*
20.Library staff who understand the needs
of their users 5.83 1.00 4.66 1.36 1.17 9.61*
21.Library staff who instill confidence in
users 5.83 0.85 4.76 1.17 1.07 9.88*
22.Providing services at the promised
time 5.75 0.94 4.93 1.14 0.82 7.33*
23.Library staff with the knowledge to
answer user's questions 6.22 0.82 5.17 1.08 1.05 10.11*
24.Performing services right the first time 5.95 0.93 5.02 1.08 0.93 8.63*
25.Dependability in handling user's
service problems 5.91 0.87 4.87 1.19 1.04 9.27*
26.Expect to find information and new
ideas 6.28 0.87 4.87 1.18 1.41 12.02*
27.Readiness to respond to user's
questions 5.95 0.94 4.75 1.28 1.20 9.98*
28.A place for reflection and creativity 6.38 0.78 5.09 1.38 1.29 10.47*
29.Library staff who deal with users in a
concerned or considerate fashion 6.04 0.92 4.95 1.29 1.09 9.23*
*Note p < . 05

33
Table 4.5
Gap differences between desired expectations and actual service perceptions
Graduate students ranked by gap size
Rank Mean
Order
by
Dimensions
Statements Diff.
Gap
size
1 Collection&
Access 16.Access to digital collections from PC 1.58
2 Collection &
Access 1.Availability of required information 1.44
3 Collection&
Access 26.Expect to find information and new ideas 1.41
4 Library as
Place 28.A place for reflection and creativity 1.29
5 Collection &
Access
19.Instruction in use and/or training sessions, when
needed 1.24
6 Responsiveness 6.Prompt service to users 1.22
7 Responsiveness 27.Readiness to respond to user's questions 1.20
8 Collection&
Access 12.Timely document delivery 1.20
9 Empathy 20.Library staff who understand the needs of their users 1.17
10 Empathy 4.Having the users' best interests at heart 1.12
11 Empathy 29.Library staff who deal with users in a concerned or
considerate fashion 1.09
12 Collection &
Access 5.Convenient access to library collections 1.09
13 Empathy 2.Convenient opening hours 1.08
14 Assurance 21.Library staff who instill confidence in users 1.07
15 Assurance 23.Library staff with the knowledge to answer user's
questions 1.05
16 Reliability 25.Dependability in handling user's service problems 1.04
17 Empathy 9.Giving users individual attention 1.04
18 Responsiveness 18.Willingness to help users 1.00
19 Tangibles 7.Visually appealing facilities 0.99
20 Library as Place 10.Space that enables quiet study 0.97
21 Reliability 24.Performing services right the first time 0.93
22 Assurance 8.Library staff who are always courteous 0.91
23 Reliability 17.Providing services as promised 0.90
24 Tangibles 15.Visually appealing materials (such as pamphlets,
statements or signs) associated with the service 0.87
25 Reliability 22.Providing services at the promised time 0.82
26 Tangibles 11.Modern equipment 0.78
27 Assurance 14.Assuring users of the accuracy and confidentiality of
their personal information/data 0.72
28 Responsiveness 13.Keeping users informed about when services will be
performed 0.70
29 Library as Place 3.A comfortable and inviting location 0.46
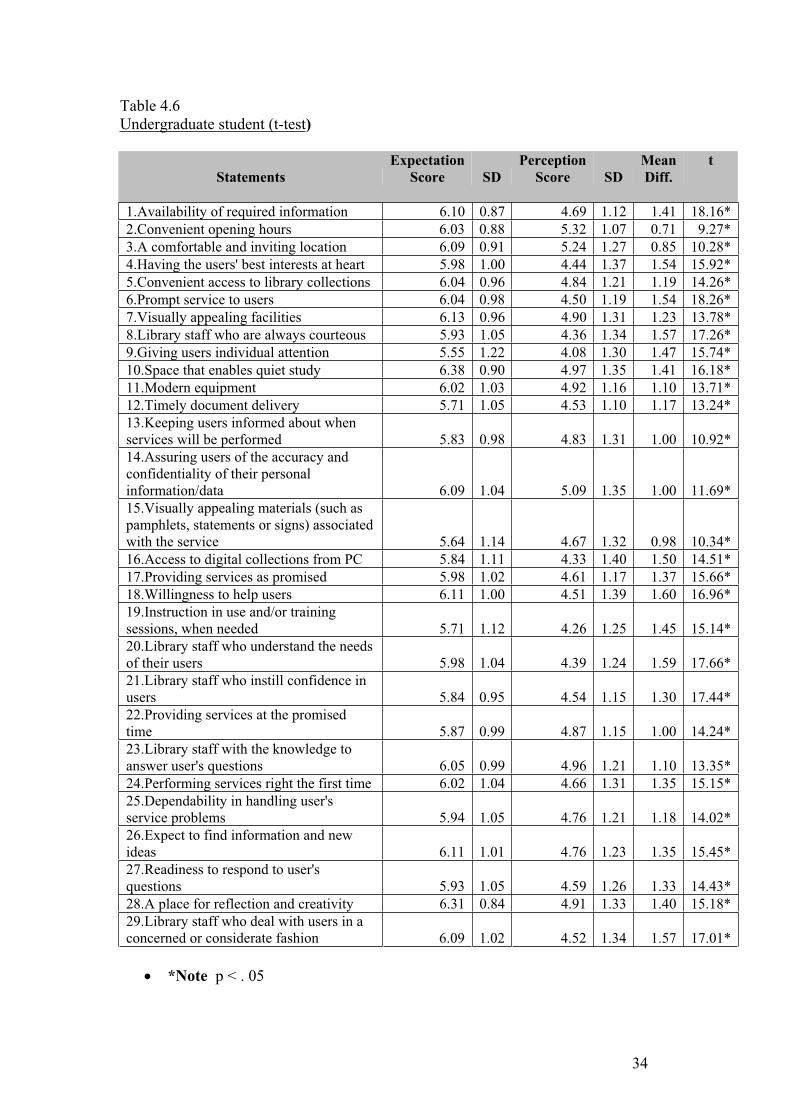
34
Table 4.6
Undergraduate student (t-test)
Expectation Perception Mean t
Statements Score SD Score SD Diff.
1.Availability of required information 6.10 0.87 4.69 1.12 1.41 18.16*
2.Convenient opening hours 6.03 0.88 5.32 1.07 0.71 9.27*
3.A comfortable and inviting location 6.09 0.91 5.24 1.27 0.85 10.28*
4.Having the users' best interests at heart 5.98 1.00 4.44 1.37 1.54 15.92*
5.Convenient access to library collections 6.04 0.96 4.84 1.21 1.19 14.26*
6.Prompt service to users 6.04 0.98 4.50 1.19 1.54 18.26*
7.Visually appealing facilities 6.13 0.96 4.90 1.31 1.23 13.78*
8.Library staff who are always courteous 5.93 1.05 4.36 1.34 1.57 17.26*
9.Giving users individual attention 5.55 1.22 4.08 1.30 1.47 15.74*
10.Space that enables quiet study 6.38 0.90 4.97 1.35 1.41 16.18*
11.Modern equipment 6.02 1.03 4.92 1.16 1.10 13.71*
12.Timely document delivery 5.71 1.05 4.53 1.10 1.17 13.24*
13.Keeping users informed about when
services will be performed 5.83 0.98 4.83 1.31 1.00 10.92*
14.Assuring users of the accuracy and
confidentiality of their personal
information/data 6.09 1.04 5.09 1.35 1.00 11.69*
15.Visually appealing materials (such as
pamphlets, statements or signs) associated
with the service 5.64 1.14 4.67 1.32 0.98 10.34*
16.Access to digital collections from PC 5.84 1.11 4.33 1.40 1.50 14.51*
17.Providing services as promised 5.98 1.02 4.61 1.17 1.37 15.66*
18.Willingness to help users 6.11 1.00 4.51 1.39 1.60 16.96*
19.Instruction in use and/or training
sessions, when needed 5.71 1.12 4.26 1.25 1.45 15.14*
20.Library staff who understand the needs
of their users 5.98 1.04 4.39 1.24 1.59 17.66*
21.Library staff who instill confidence in
users 5.84 0.95 4.54 1.15 1.30 17.44*
22.Providing services at the promised
time 5.87 0.99 4.87 1.15 1.00 14.24*
23.Library staff with the knowledge to
answer user's questions 6.05 0.99 4.96 1.21 1.10 13.35*
24.Performing services right the first time 6.02 1.04 4.66 1.31 1.35 15.15*
25.Dependability in handling user's
service problems 5.94 1.05 4.76 1.21 1.18 14.02*
26.Expect to find information and new
ideas 6.11 1.01 4.76 1.23 1.35 15.45*
27.Readiness to respond to user's
questions 5.93 1.05 4.59 1.26 1.33 14.43*
28.A place for reflection and creativity 6.31 0.84 4.91 1.33 1.40 15.18*
29.Library staff who deal with users in a
concerned or considerate fashion 6.09 1.02 4.52 1.34 1.57 17.01*
*Note p < . 05

35
Table 4.7
Gap differences between desired expectations and actual service perceptions
Undergraduate students ranked by gap size
Rank Mean
Order
by
Dimensions
Statements Diff.
Gap
size
1 Responsiveness 18.Willingness to help users 1.60
2 Empathy 20.Library staff who understand the needs of their
users 1.59
3 Empathy 29.Library staff who deal with users in a
concerned or considerate fashion 1.57
4 Assurance 8.Library staff who are always courteous 1.57
5 Empathy 4.Having the users' best interests at heart 1.54
6 Responsiveness 6.Prompt service to users 1.54
7 Collection &
Access 16.Access to digital collections from PC 1.50
8 Empathy 9.Giving users individual attention 1.47
9 Collection &
Access
19.Instruction in use and/or training sessions,
when needed 1.45
10 Collection &
Access 1.Availability of required information 1.41
11 Library as Place 10.Space that enables quiet study 1.41
12 Library as Place 28.A place for reflection and creativity 1.40
13 Reliability 17.Providing services as promised 1.37
14 Reliability 24.Performing services right the first time 1.35
15 Collection &
Access 26.Expect to find information and new ideas 1.35
16 Responsiveness 27.Readiness to respond to user's questions 1.33
17 Assurance 21.Library staff who instill confidence in users 1.30
18 Tangibles 7.Visually appealing facilities 1.23
19 Collection &
Access 5.Convenient access to library collections 1.19
20 Reliability 25.Dependability in handling user's service
problems 1.18
21 Collection &
Access 12.Timely document delivery 1.17
22 Tangibles 11.Modern equipment 1.10
23 Assurance 23.Library staff with the knowledge to answer
user's questions 1.10
24 Reliability 22.Providing services at the promised time 1.00
25 Responsiveness 13.Keeping users informed about when services
will be performed 1.00
26 Assurance 14.Assuring users of the accuracy and
confidentiality of their personal information/data 1.00
27 Tangibles 15.Visually appealing materials (such as
pamphlets, statements or signs) associated with
the service 0.98
28 Library as Place 3.A comfortable and inviting location 0.85
29 Empathy 2.Convenient opening hours 0.71
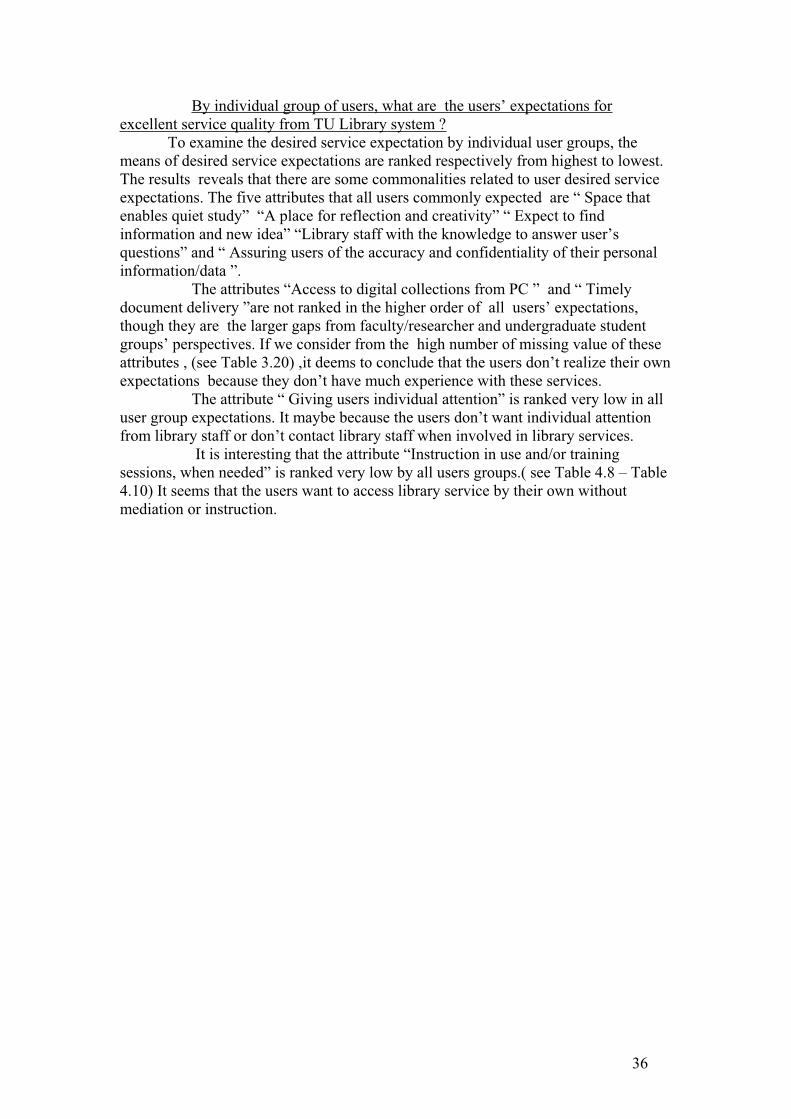
36
By individual group of users, what are the users’ expectations for
excellent service quality from TU Library system ?
To examine the desired service expectation by individual user groups, the
means of desired service expectations are ranked respectively from highest to lowest.
The results reveals that there are some commonalities related to user desired service
expectations. The five attributes that all users commonly expected are “ Space that
enables quiet study” “A place for reflection and creativity” “ Expect to find
information and new idea” “Library staff with the knowledge to answer user’s
questions” and “ Assuring users of the accuracy and confidentiality of their personal
information/data ”.
The attributes “Access to digital collections from PC ” and “ Timely
document delivery ”are not ranked in the higher order of all users’ expectations,
though they are the larger gaps from faculty/researcher and undergraduate student
groups’ perspectives. If we consider from the high number of missing value of these
attributes , (see Table 3.20) ,it deems to conclude that the users don’t realize their own
expectations because they don’t have much experience with these services.
The attribute “ Giving users individual attention” is ranked very low in all
user group expectations. It maybe because the users don’t want individual attention
from library staff or don’t contact library staff when involved in library services.
It is interesting that the attribute “Instruction in use and/or training
sessions, when needed” is ranked very low by all users groups.( see Table 4.8 – Table
4.10) It seems that the users want to access library service by their own without
mediation or instruction.
37
Table 4.8
Desired Service Expectation of Faculty/Researcher (Order by Means)
Faculty/Researcher desired expectations
Statements Frequency Missing Mean SD
1 Space that enables quiet study 214 14 6.32 0.81
2 A place for reflection and creativity 210 18 6.23 0.95
3 Convenient access to library collections 217 11 6.21 0.86
4
Assuring users of the accuracy and
confidentiality of their personal information/data 203 25 6.21 0.87
5
Library staff with the knowledge to answer
user’s questions 205 23 6.20 0.92
6 Expect to find information and new ideas 213 15 6.16 0.95
7 Willingness to help users 214 14 6.14 0.90
8
Library staff who deal with users in a concerned
or considerate fashion 214 14 6.12 0.90
9 Library staff who are always courteous 215 13 6.11 0.86
10 Access to digital collections from PC 201 27 6.10 0.96
11 Having the users’ best interests at heart 219 9 6.08 0.99
12 Availability of required information 215 13 6.06 0.90
13 Visually appealing facilities 216 12 6.06 0.99
14 Providing services as promised 197 31 6.04 0.96
15 Modern equipment 213 15 6.04 0.94
16 Providing services at the promised time 193 35 6.03 0.93
17
Keeping users informed about when services
will be performed 208 20 6.02 0.97
18 Convenient opening hours 215 13 6.02 0.88
19 Prompt service to users 215 13 6.01 0.97
20 A comfortable and inviting location 218 10 6.01 0.95
21 Readiness to respond to user’s questions 206 22 6.01 0.96
22
Library staff who understand the needs of their
users 209 19 6.01 0.95
23 Timely document delivery 193 35 5.99 0.88
24
Dependability in handling user’s service
problems 207 21 5.98 0.88
25 Performing services right the first time 198 30 5.96 0.96
26
Visually appealing materials (such as pamphlets,
statements or signs) associated with the service 209 19 5.92 0.98
27 Library staff who instill confidence in users 211 17 5.88 0.98
28
Instruction in use and/or training sessions, when
needed 203 25 5.87 1.03
29 Giving users individual attention 210 18 5.79 0.96
38
Table 4.9
Desired Service Expectation of Graduate Students (Order by Means)
Graduate Students desired expectations
Statements Frequency Missing Mean SD
1 A place for reflection and creativity 160 5 6.36 0.80
2 Expect to find information and new ideas 162 3 6.29 0.86
3 Space that enables quiet study 160 5 6.23 0.86
4
Library staff with the knowledge to answer user's
questions 154 11 6.23 0.82
5 Convenient access to library collections 159 6 6.19 0.80
6
Assuring users of the accuracy and confidentiality of
their personal information/data 158 7 6.15 0.88
7 Availability of required information 162 3 6.13 0.78
8 Convenient opening hours 159 6 6.09 0.89
9 Visually appealing facilities 160 5 6.09 0.84
10 Prompt service to users 160 5 6.03 0.92
11
Library staff who deal with users in a concerned or
considerate fashion 160 5 6.03 0.93
12 Having the users' best interests at heart 162 3 6.02 0.87
13 Willingness to help users 159 6 6.02 0.94
14 Performing services right the first time 157 8 5.95 0.95
15 Readiness to respond to user's questions 156 9 5.94 0.97
16 A comfortable and inviting location 161 4 5.94 0.81
17 Dependability in handling user's service problems 154 11 5.90 0.92
18 Modern equipment 158 7 5.89 0.93
19
Keeping users informed about when services will be
performed 156 9 5.88 0.99
20 Providing services as promised 156 9 5.88 0.97
21 Library staff who are always courteous 160 5 5.86 0.92
22 Timely document delivery 150 15 5.85 0.95
23 Library staff who understand the needs of their users 156 9 5.83 1.00
24 Providing services at the promised time 152 13 5.81 0.93
25 Library staff who instill confidence in users 160 5 5.79 0.89
26 Access to digital collections from PC 152 13 5.76 1.08
27
Visually appealing materials (such as pamphlets,
statements or signs) associated with the service 160 5 5.72 1.00
28 Giving users individual attention 159 6 5.65 0.91
29 Instruction in use and/or training sessions, when needed 154 11 5.56 1.00
39
Table 4.10
Desired Service Expectation of Undergraduate Students (Order by Means)
Undergraduate students’ desired expectation
Order Statements Frequency Missing Mean SD
1 Space that enables quiet study 260 6 6.38 0.89
2 A place for reflection and creativity 257 9 6.31 0.84
3 Visually appealing facilities 262 4 6.12 0.99
4 Willingness to help users 259 7 6.11 0.99
5
Library staff who deal with users in a concerned or
considerate fashion 259 7 6.09 1.01
6 A comfortable and inviting location 260 6 6.08 0.91
7
Assuring users of the accuracy and confidentiality of their
personal information/data 262 4 6.08 1.07
8 Availability of required information 262 4 6.07 0.91
9 Expect to find information and new ideas 259 7 6.07 1.04
10
Library staff with the knowledge to answer user's
questions 257 9 6.06 1.00
11 Prompt service to users 258 8 6.04 0.98
12 Performing services right the first time 253 13 6.02 1.03
13 Convenient access to library collections 258 8 6.02 0.97
14 Modern equipment 258 8 6.02 1.02
15 Convenient opening hours 261 5 6.02 0.91
16 Providing services as promised 260 6 5.97 1.03
17 Library staff who understand the needs of their users 260 6 5.97 1.04
18 Having the users' best interests at heart 259 7 5.97 1.01
19 Dependability in handling user's service problems 257 9 5.96 1.04
20 Readiness to respond to user's questions 254 12 5.93 1.05
21 Library staff who are always courteous 261 5 5.93 1.05
22 Providing services at the promised time 250 16 5.86 0.97
23 Library staff who instill confidence in users 256 10 5.84 0.97
24
Keeping users informed about when services will be
performed 257 9 5.82 0.98
25 Access to digital collections from PC 255 11 5.80 1.11
26 Timely document delivery 251 15 5.72 1.05
27 Instruction in use and/or training sessions, when needed 256 10 5.68 1.13
28
Visually appealing materials (such as pamphlets,
statements or signs) associated with the service 261 5 5.64 1.14
29 Giving users individual attention 261 5 5.55 1.21
If all attributes are ranked respectively by means, the top ten of the desired
service expectations of all user groups are as the following table :
40
Table 4.11
Service Expectations of all User Groups (Order by Means)
Overall Expectation
Order Statements Frequency Missing Mean SD
1 Space that enables quiet study 636 25 6.32 0.86
2 A place for reflection and creativity 629 32 6.30 0.87
3 Expect to find information and new ideas 636 25 6.16 0.97
4
Library staff with the knowledge to answer user's
questions 618 43 6.15 0.93
5
Assuring users of the accuracy and confidentiality of
their personal information/data 625 36 6.14 0.96
6 Convenient access to library collections 636 25 6.13 0.89
7 Willingness to help users 634 27 6.10 0.95
8 Visually appealing facilities 640 21 6.09 0.96
9
Library staff who deal with users in a concerned or
considerate fashion 635 26 6.09 0.95
10 Availability of required information 641 20 6.08 0.88
11 Convenient opening hours 636 25 6.04 0.90
12 Prompt service to users 635 26 6.03 0.96
13 A comfortable and inviting location 641 20 6.02 0.90
14 Having the users' best interests at heart 642 19 6.02 0.97
15 Modern equipment 631 30 6.00 0.97
16 Performing services right the first time 610 51 5.99 0.99
17 Library staff who are always courteous 638 23 5.97 0.96
18 Providing services as promised 615 46 5.97 0.99
19 Readiness to respond to user's questions 618 43 5.96 1.00
20 Dependability in handling user's service problems 620 41 5.95 0.96
21 Library staff who understand the needs of their users 627 34 5.95 1.00
22
Keeping users informed about when services will be
performed 623 38 5.91 0.98
23 Providing services at the promised time 597 64 5.90 0.95
24 Access to digital collections from PC 610 51 5.89 1.06
25 Timely document delivery 596 65 5.84 0.98
26 Library staff who instill confidence in users 629 32 5.84 0.95
27
Visually appealing materials (such as pamphlets,
statements or signs) associated with the service 632 29 5.76 1.06
28
Instruction in use and/or training sessions, when
needed 615 46 5.71 1.07
29 Giving users individual attention 632 29 5.65 1.06
If we consider the top ten attributes that were commonly or partially expected
by all respondent groups, the result are as follows:

41
Table 4.12
Top Ten Attributes of Desired Service Expectation of all User Groups
Dimensions Attributes Fac./Res. Grad. Under
grad.1. Library as Place Space that enables quiet
study
2. Library as Place A place for reflection and
creativity
3. Collection &
Access
Expect to find information
and new ideas
4. Assurance Library staff with the
knowledge to answer user's
questions
5. Assurance Assuring users of the
accuracy and confidentiality
of their personal
information/data
6. Collection
&Access
Convenient access to library
collections
7. Responsiveness Willingness to help users
8. Tangibles Visually appealing facilities
9. Empathy Library staff who deal with
users in a concerned or
considerate fashion
10.Collection &
Access
Availability of required
information
The desired service expectations shown in Table 4.12 reflect that the users
required information that match their needs with convenient accessibility. They can
find material easily and library can provide a place for quiet study, appealing facilities
and modern equipment. Whenever they encounter the service problem, the staff with
knowledge are willing to help them and they want the accuracy and confidentiality of
their personal information and data.
* Note : From Table 4.1 to Table 4.12 , the dimensions of original SERVQUAL will
be used for simple interpretation
What are the underlying dimensions of service quality of TU Library System from
user perspectives?
The factor analysis method is applied to investigate the dimensionalities of
service quality from user perspectives. Table 4.13 represents the result of the
exploratory factor analysis after excluding non-users from the data collected at TU
Library System. The values of desired expectations were set as the variables, and the
principal factor method with direct-oblimin rotation (oblique rotation) was used. After
considering the result from the scree plot, The following 3 factors are the most
appropriate.
1.Affect of Service – Organizational The first factor is about the service
content which planned or offered by the library as an organization .Some items that
strong response to this factor are related to the service which provide by the library
42
such as ; “Visually appealing materials (such as pamphlets, statements or signs)
associated with the service” “Instruction in use and/or training sessions, when
needed” “Access to digital collections from PC” and “Providing services as
promised” . The items related to service mind such as “Library staff who understand
the needs of their users” “Library staff who are always courteous ” and “Willingness
to help users” are also included in this factor. It seems that the users want to access
library service via staff approach.
2. Collection and Access This factor is about complete collection which is
conveniently accessible via modern equipment , library location which is convenient
for access and appropriate service time. The items which show strong response on this
factor are “ A comfortable and inviting location” Convenient access to library
collections “Availability of required information” and “Convenient opening hours”
3. Affect of service – Personal The third factor is associated to staff
knowledge and ability to perform good service. The items show high loading on this
factor are “Dependability in handling user's service problems” “Readiness to respond
to user's questions” “Performing services right the first time” and “Library staff with
the knowledge to answer user's questions”
Although the items which associate to the place such as “Space that enables
quiet study” “A comfortable and inviting location ” and “A place for reflection and
creativity” can’t form a new factor, they show strong response on entire factors. It
means that libraries as places for study, rendezvous are still important from user
perspectives.
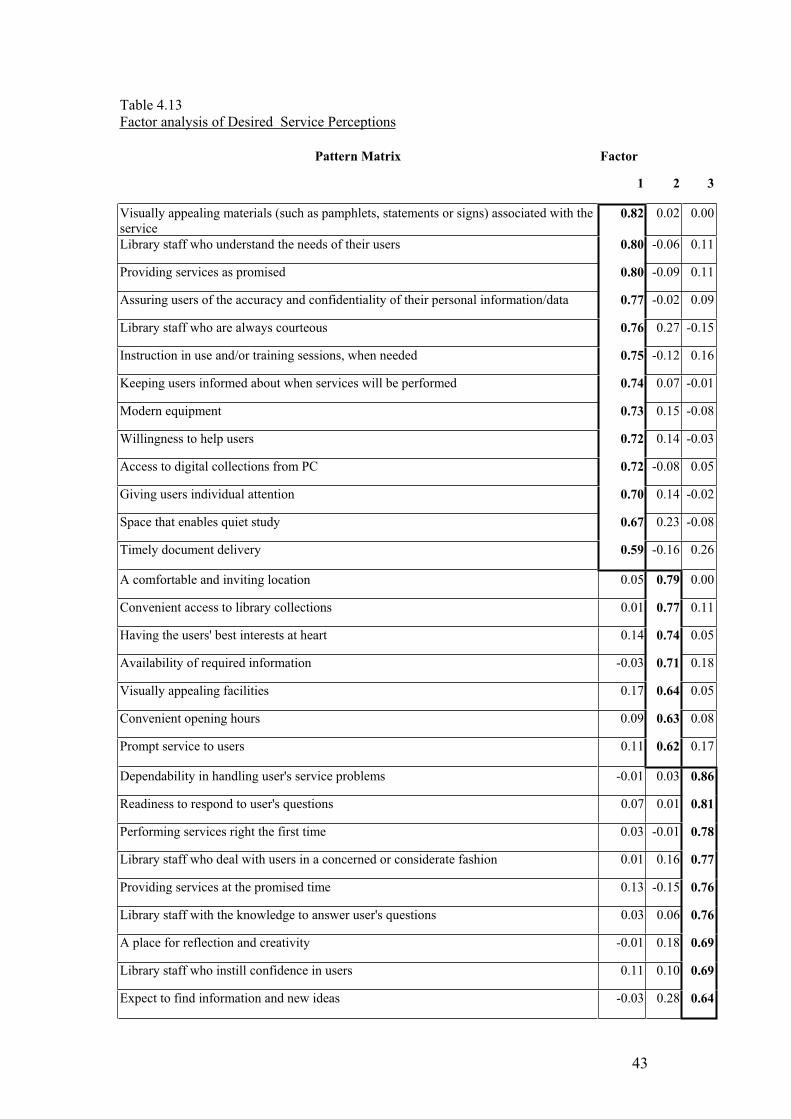
43
Table 4.13
Factor analysis of Desired Service Perceptions
Pattern Matrix Factor
1 2 3
Visually appealing materials (such as pamphlets, statements or signs) associated with the
service0.82 0.02 0.00
Library staff who understand the needs of their users 0.80 -0.06 0.11
Providing services as promised 0.80 -0.09 0.11
Assuring users of the accuracy and confidentiality of their personal information/data 0.77 -0.02 0.09
Library staff who are always courteous 0.76 0.27 -0.15
Instruction in use and/or training sessions, when needed 0.75 -0.12 0.16
Keeping users informed about when services will be performed 0.74 0.07 -0.01
Modern equipment 0.73 0.15 -0.08
Willingness to help users 0.72 0.14 -0.03
Access to digital collections from PC 0.72 -0.08 0.05
Giving users individual attention 0.70 0.14 -0.02
Space that enables quiet study 0.67 0.23 -0.08
Timely document delivery 0.59 -0.16 0.26
A comfortable and inviting location 0.05 0.79 0.00
Convenient access to library collections 0.01 0.77 0.11
Having the users' best interests at heart 0.14 0.74 0.05
Availability of required information -0.03 0.71 0.18
Visually appealing facilities 0.17 0.64 0.05
Convenient opening hours 0.09 0.63 0.08
Prompt service to users 0.11 0.62 0.17
Dependability in handling user's service problems -0.01 0.03 0.86
Readiness to respond to user's questions 0.07 0.01 0.81
Performing services right the first time 0.03 -0.01 0.78
Library staff who deal with users in a concerned or considerate fashion 0.01 0.16 0.77
Providing services at the promised time 0.13 -0.15 0.76
Library staff with the knowledge to answer user's questions 0.03 0.06 0.76
A place for reflection and creativity -0.01 0.18 0.69
Library staff who instill confidence in users 0.11 0.10 0.69
Expect to find information and new ideas -0.03 0.28 0.64

44
Extraction Method: Principal Axis Factoring.
Rotation Method: Oblimin with Kaiser Normalization.
Rotation converged in 10
iterations.
Eigen values 15.14 1.96 1.63
Contribution (%) 52.20 6.76 5.62
Cumulative
contribution (%)
52.20 58.96 64.58
Factor correlation matrix
Factor 1 2 3
1 1 0.59 0.69
2 0.59 1 0.48
3 0.69 0.48 1
45
By individual user group, what attributes are inside and outside the range of the
“ Zone of Tolerance ” ?
To investigate the “ Zone of Tolerance ” among 3 user groups, the means of 3
levels of services : desired service expectations, perception of actual services, and
minimum service expectations are compared and shown in graphs (see Graph 4.1-
4.3).
For faculty/researcher group, there are 4 attributes that are not in the range of
the “Zone of Tolerance” : “ Access to digital collection from PC ” “ Space that
enables quiet study ” “ A place for reflection and creativity ”, and “Expect to find
information and new idea ” (see Graph 4.1)
For graduate student group, 2 attributes are not in the range of the “ Zone of
Tolerance ” : “ Access to digital collections from PC ”, “ Instruction in use and/or
training when needed ” (see Graph 4.2)
For undergraduate student group, there are 4 attributes which are not in the
range of the “ Zone of Tolerance ” and both are related to staff attributes : “
Willingness to help users” “ Library staff who deal with users in a concerned or
considerate fashion ”, “ Library staff who understand the needs of their users ”, and
“ Giving user individual attention” (see Graph 4.3) It seems that undergraduate
students encountered problem related to library staff when involved in library service
but for the faculty/researcher and graduate students the attributes related to the
dimensions “ Collection&Access ” and the place are not so problematic.
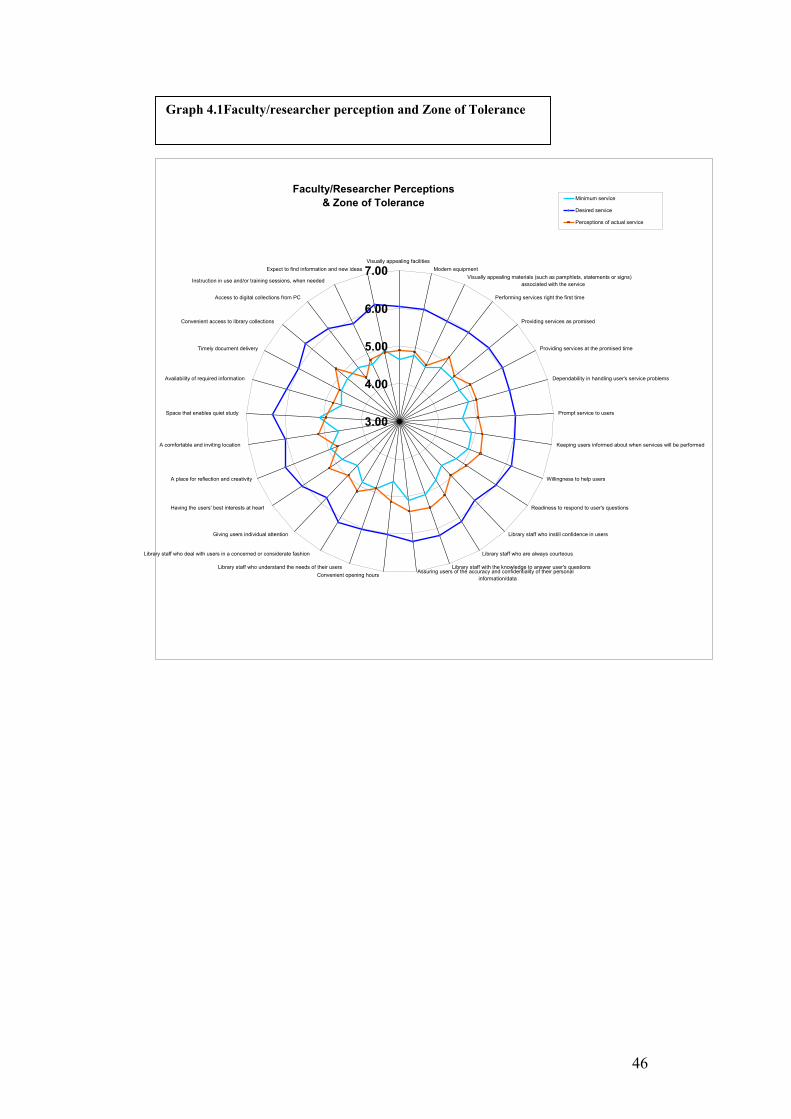
46
Faculty/Researcher Perceptions
& Zone of Tolerance
3.00
4.00
5.00
6.00
7.00Visually appealing facilities
Modern equipment
Visually appealing materials (such as pamphlets, statements or signs)
associated with the service
Performing services right the first time
Providing services as promised
Providing services at the promised time
Dependability in handling user's service problems
Prompt service to users
Keeping users informed about when services will be performed
Willingness to help users
Readiness to respond to user's questions
Library staff who instill confidence in users
Library staff who are always courteous
Library staff with the knowledge to answer user's questionsAssuring users of the accuracy and confidentiality of their personal
information/dataConvenient opening hours
Library staff who understand the needs of their users
Library staff who deal with users in a concerned or considerate fashion
Giving users individual attention
Having the users' best interests at heart
A place for reflection and creativity
A comfortable and inviting location
Space that enables quiet study
Availability of required information
Timely document delivery
Convenient access to library collections
Access to digital collections from PC
Instruction in use and/or training sessions, when needed
Expect to find information and new ideas
Minimum service
Desired service
Perceptions of actual service
Graph 4.1Faculty/researcher perception and Zone of Tolerance
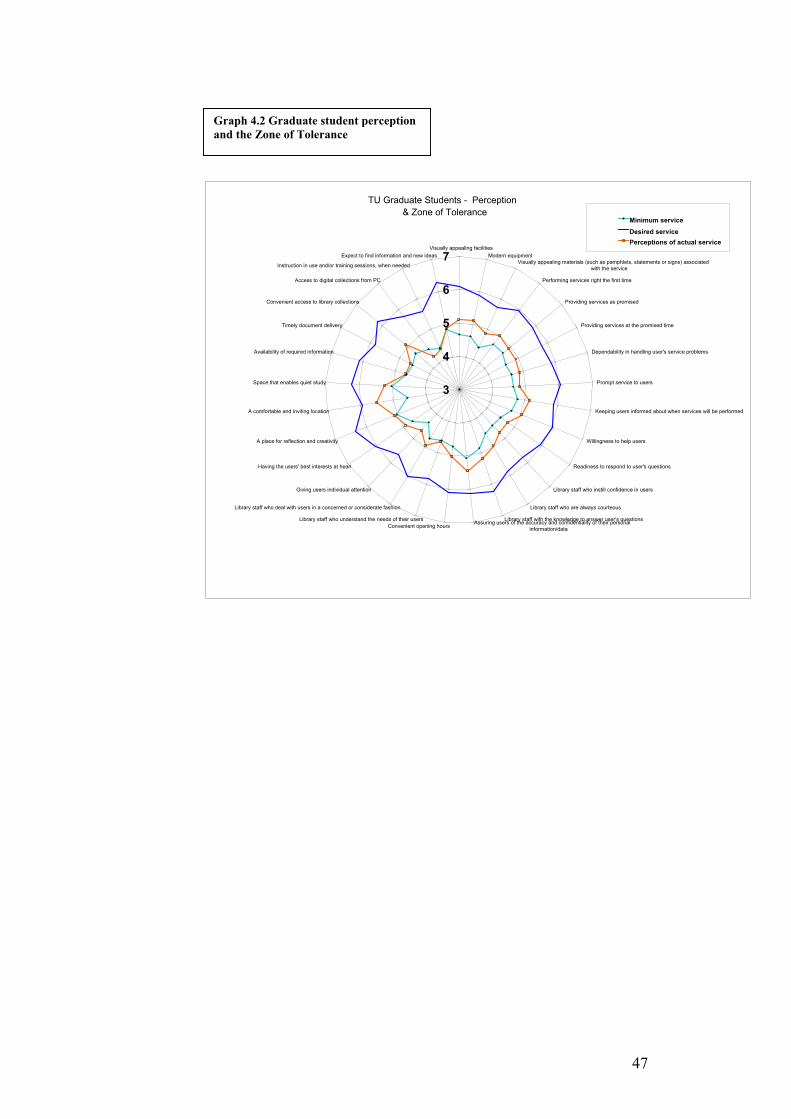
47
TU Graduate Students - Perception
& Zone of Tolerance
3
4
5
6
7Visually appealing facilities
Modern equipment
Visually appealing materials (such as pamphlets, statements or signs) associated
with the service
Performing services right the first time
Providing services as promised
Providing services at the promised time
Dependability in handling user's service problems
Prompt service to users
Keeping users informed about when services will be performed
Willingness to help users
Readiness to respond to user's questions
Library staff who instill confidence in users
Library staff who are always courteous
Library staff with the knowledge to answer user's questionsAssuring users of the accuracy and confidentiality of their personal
information/dataConvenient opening hours
Library staff who understand the needs of their users
Library staff who deal with users in a concerned or considerate fashion
Giving users individual attention
Having the users' best interests at heart
A place for reflection and creativity
A comfortable and inviting location
Space that enables quiet study
Availability of required information
Timely document delivery
Convenient access to library collections
Access to digital collections from PC
Instruction in use and/or training sessions, when needed
Expect to find information and new ideas
Minimum service
Desired service
Perceptions of actual service
Graph 4.2 Graduate student perception
and the Zone of Tolerance
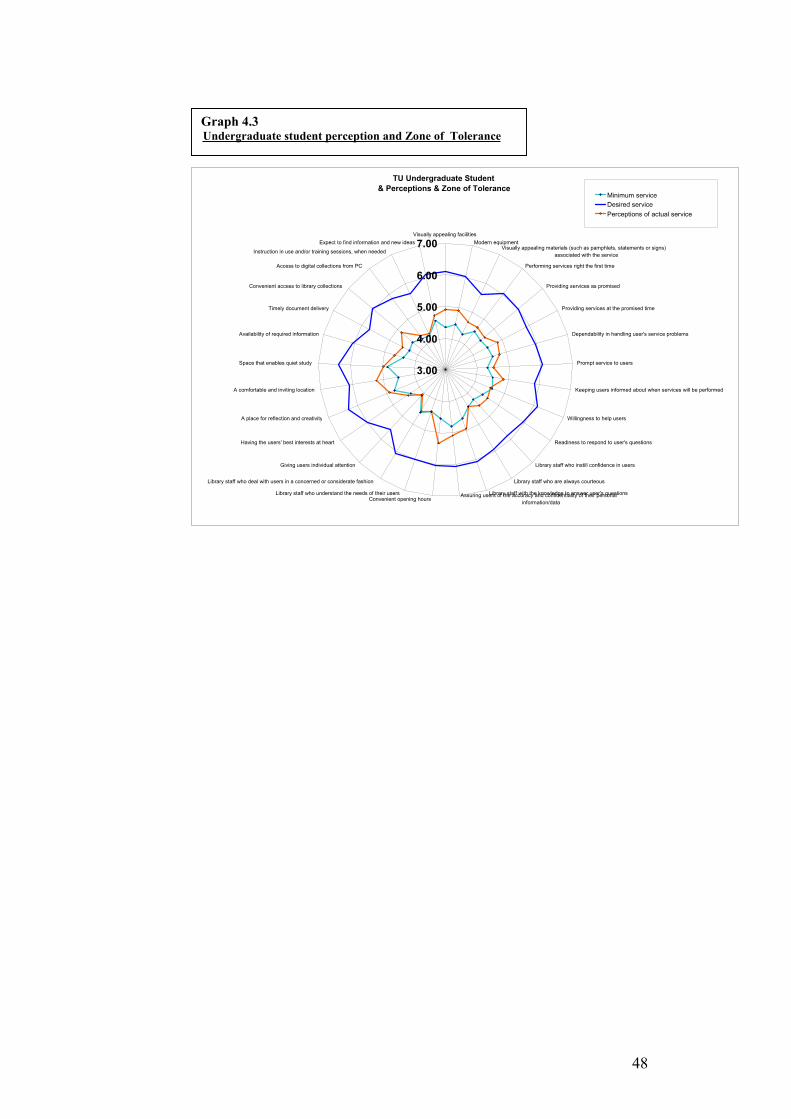
48
TU Undergraduate Student
& Perceptions & Zone of Tolerance
3.00
4.00
5.00
6.00
7.00Visually appealing facilities
Modern equipmentVisually appealing materials (such as pamphlets, statements or signs)
associated with the service
Performing services right the first time
Providing services as promised
Providing services at the promised time
Dependability in handling user's service problems
Prompt service to users
Keeping users informed about when services will be performed
Willingness to help users
Readiness to respond to user's questions
Library staff who instill confidence in users
Library staff who are always courteous
Library staff with the knowledge to answer user's questionsAssuring users of the accuracy and confidentiality of their personal
information/dataConvenient opening hours
Library staff who understand the needs of their users
Library staff who deal with users in a concerned or considerate fashion
Giving users individual attention
Having the users' best interests at heart
A place for reflection and creativity
A comfortable and inviting location
Space that enables quiet study
Availability of required information
Timely document delivery
Convenient access to library collections
Access to digital collections from PC
Instruction in use and/or training sessions, when needed
Expect to find information and new ideas
Minimum service
Desired service
Perceptions of actual service
Graph 4.3Undergraduate student perception and Zone of Tolerance

49
What are the problems users encountered when involved in library services?
To investigate the problems users encountered when involved in library
services, the user comments are classified by categories and counted.(Table 4.14) The
most problems users encountered are library material inadequacy and outdated
resources (books, journal, newspaper, computer terminals ) The reshelving problem
is also another problem as the users cannot find the books on shelves, though they
found in OPAC. It seems that most problems are related to library resources, place for
study, and modern equipment. The library staff attributes cannot satisfy the users
because the users still comment about service mind, impoliteness and courtesy. The
users also comment about the locker service as they don’t understand why they have
to leave their baggage in the lockers while the library has censor machine at the
entrance gate that can examine the non-circulated material. Though the library
installed barcode on all material and the circulation process is computerized, the users
still wait too long in line when they access circulation process.

50
Table 4. 14
Problems that users encountered when involved in library services
Categories
No. of
comment
Books are not sufficient 51
Reshelving problem 41
Books are not update 23
Wait too long in line 15
Computer are not sufficient 15
Space are not sufficient for study 14
Some staff are impolite 13
Staff should have service mind 10
Service hours are not convenient 10
Libraries are too noisy 10
OPAC problem (interface, complicate, slow retrieval) 10
Locker service is not convenient 10
Problem when use remote access (slow, cannot access) 7
ILL is not convenient 7
Circulation service is not flexible 7
Want more remote service 6
Want more internet service 6
Circulation information is not reliable 5
Journal are not enough and update 5
Temperature in library (too cold, too hot etc.) 4
Want more facilities ( toilet, drinking water, snack corner) 3
More directional signs 3
Access card system has problem 3
Staff are not sufficient 3
Library should inform about services 3
Want more online journal 3
Librarians should have knowledge 2
Material is out of order, damaged (books, computers) 2
Photocopy service is not convenient 2
Want more index&abstract service 2
Library server often has problem 2
I don’t feel safe in library 1
Improve subject heading specification 1
Want more newspaper 1
Want comfortable seats 1
Instruction and/or training via video 1
Computer work very slow 1
TOTAL 303
51
Summary of Findings
The research findings can answer the research questions and can
be summarized as the followings :
Research question 1 : In what ways do TU Library System provide service to its
users ?
The results from calculation of gap differences between desired
expectations and perceptions of actual service of all user groups were ranked
respectively in order to investigate what attributes of service quality meet, exceed, or
fall shot from the user perspectives.(see Table 4.1) The results revealed that all
attributes of service quality don’t meet the users’ expectations. The reason is that it is
natural tendency of people to wish for more than they have. From user perspectives,
the dimensions “Collection & Access” and the place are most problematic as the gap
differences are larger. The result is relevant to user comments that the books are not
sufficient and update, there is problem about reshelving, and library space is not
sufficient for study, besides the libraries are too noisy. The largest gap among all
attributes is “ Access to digital collection from PC ”. Though only a half of
respondents use remote access( Table 3.12), the gap is the largest. It seems that users
want to use remote service but the libraries cannot provide sufficiently. Though the
gaps related to staff attributes are not too large, it cannot be concluded that the users
are satisfied. The missing values of the attributes related to staff are high when users
rated for actual service perceptions ( see Table 3.20) It is possible that users seldom
contact librarians because they cannot decided whether library staff can provided
services at the promised time, provided instruction in use, performed service right
the first time, etc. or not.
To summarize the result, all attributes of service quality that TU Library
System provide to its users don’t meet the user expectations and the attributes related
to dimensions “ Collection & Access ” and the place are most problematic as the gap
differences are larger that the others. It is possible that library users seldom contact
library staff when they involved in library services so the attributes that occupied the
larger gaps are about service mind not about ability of staff.
Research question 2 : By individual group of users, in what ways do TU Library
System provide service to its users?
The t-test and the gap difference ranking of individual user group are
calculated to investigate what attributes of service quality meet, exceed, or fall shot
from the user perspectives (see Table 4.2- 4.7)
The results revealed that by individual group of user, all desired service
expectations are lagged behind the actual service perceptions and there are different
perspectives among 3 user groups.
For faculty/researcher group and graduate student group, the larger gaps
are fell into dimensions “ Collection & Access ” and related to library place and the
gap of the attribute “ Access to digital collection from PC ” is the largest.
For undergraduate group, the staff attributes are occupied the larger gaps
and followed by those of dimensions “ Collection & Access ” and the library place.
It seems that library may treat faculty/researcher different from students.
Research question 3 : By individual group of users, which attributes of service quality
meet, exceed or fall short user perceptions ?
52
For the 3rd
research questions, the gap differences between desired service
level and actual service perception as well as a paired sample t-test will be calculated.
( Table 4.2-4.7) . It can be summarize that from the perspectives of individual user
group, all service quality attributes don’t meet their desired expectations and the
reason was aforementioned. For faculty/researcher group and graduate group, most
attributes which don’t meet user expectations are related to Collection & Access and
Library as Place. For undergraduate group, most attributes related to staff attributes
don’t meet user expectations.
Research question 4 : By individual group of users, in what way do the users expect
for excellent service quality from TU Library system ?
The means of desired service expectations of each user group and all user
groups were ranked and compared .( Table 4.8 – Table 4.12) to elicit the answer of
this research question. The result reveals that among 3 groups of users, the
expectations are very similar. The top five expectations of all user groups are the same
attributes. (Table 4.12) (though the orders are a little different) The users expect to
find information that match their needs with convenient accessibility via modern
equipment as well as expect to find the quiet place for study. They expect library
staff with service mind and knowledge to help them when they encounter service
problems . The users expect to find information by their own as the attribute
“ Instruction in user and/or training sessions when needed” is ranked very low in all
user groups. Anyway, some users don’t know their real expectations as they don’t
realize some service such as Document delivery of Remote access service.
Research question 5 : What are the dimensions that determine the customers’
evaluation of service quality of TU Library System?
Factor analysis method will be applied to investigate the underlying
dimensions of service quality. The results can be supported information for the
library managers to convert the theory into practical resources allocation decisions
(Philip J. Calvert, 2001).
The result from factor analysis method shows the dimensions that
determine the customers’ evaluation of service quality are ; Affect of service –
organizational , Collection and Access , and Affect of service – personal. This finding
reveals which are the important items in each factors.
On entire factors, the items related to service mind show high loading. It
implies that users still want the library staff to help them to accomplish their
objectives of library usage. Although the attributes related to library place cannot be
formed a new factor, high loading on each factor also implies its importance.

53
Research question 6 : What are the most essential attributes that library managers
should allocated the resources to support for improving excellent service quality?
The “ Zone of Tolerance ” which is the range between desired service
expectation and minimum service expectation will be calculated to find such
attributes. A performance below the tolerance zone will engender customer frustration
and decrease customer loyalty. Among 3 user groups, some attributes are below the
zone of tolerance and TU Library System should allocate the resources to support for
improving excellent service quality. The attributes are as the followings :
For faculty/researcher group, the attributes belong to dimensions “
Collection & Access ” and library place are below the zone of tolerance. The
attributes which library should concern are “ Access to digital collection from PC ”
“ Space that enables quiet study ” “ A place for reflection and creativity ”, and
“ Expect to find information and new idea ” (See Table 4.1)
For graduate student group, the attributes belong to dimension
“ Collection & Access ” are below the zone of tolerance. The attributes are
“ Access to digital collection from PC ” and “ Instruction in user and/or training
session when needed ”
For undergraduate group, the attributes belong to staff attributes
are below the zone of tolerance. Those attributes are “ Willingness to help users” and
“ Library staff who understand the needs of their users ” “ Library staff who deal with
users in a concern or considerate fashion ” and “ Giving users individual attention ”
The library managers should provide collection that match user need with
convenient accessibility via modern equipment as well as comfortable and quiet
place for study. In addition to library staff should be helpful when the users encounter
service problems.
The result also confirms the finding in research question 2 that library staff
may treat faculty different from students.
Summary of the attributes below the Zone of Tolerance
Groups The attributes
Faculty/researcher Access to digital collection from PC
Space that enables quiet study
A place for reflection and creativity
Expect to find information and new idea
Graduate Students Access to digital collection from PC
Instruction in user and/or training session
when needed
Undergraduate Students Willingness to help users
Library staff who understand the needs of
their users
Library staff who deal with users in a concern
or considerate fashion
Giving users individual attention
54
Research question 7 : What problems did the users encountered when involved in
library service?
To answer this question, user comments are counted and classified by
categories. (Table 4.14 ) The results reveal that most problems users encountered are
related to library material inadequacy, outdate resources, inconvenient accessibility as
well as lacking quiet place for study. Another problem is related to staff attributes as
the users commented about service mind and courtesy. In addition, the users want
more effective remote service access.
55
Chapter 5
Summary, Discussion and Recommendations
Overview of the Study
This chapter presents a summary, discussion of the research findings and
examines implications.
Statement of the Problem
The problem of this study was to assess the service quality of TU Library
System by investigating the 3 levels of service quality from the user perspectives:
(minimum service adequacy, desired expectations, and actual service perceptions)
The result gained can identify what are user desired expectations and whether those
expectations have been met or not.
Surveys of faculty members, researchers, graduate and undergraduate
students were used to identify each level of services. The results gained from the
calculation of the Zone of Tolerance and dimensionalities of service quality can help
the library managers to identify action and allocate resource that can be taken to
improve library services.
Subjects
The subjects of this study consisted of 216 faculty members, 11
researchers, 165 graduate students, and 266 undergraduate students ( 3 unknown
users) of Thammasat University.
Instrumentation
For pretest, the Thai version of the instrumentation was administered to 4
faculty members, 1 researcher, 3 students of Thammasat University. The validation
of the translation was checked and edited after the pretest. Some questions were
expanded and the samples about library services were raised to clarify the meaning.
Data Collection
The Thai translation of the modification of SERVQUAL questionnaire
was administered to 4 groups of users : faculty members, researchers, graduate and
undergraduate students of Thammasat University. The response was constituted
17.79 % of total population of faculty members, 45.83% of total population of
researchers, 2.58% of total population of graduate students, and 1.36 % of total
population of undergraduate students.
Statistical Analysis
After gathering the questionnaires, the survey data was keyed in Excel file.
Before transferring to SPSS version 11.0, the procedures of data treatment were set to
validate the data for further analysis. After data treatment, the data was transferred to
SPSS Version 11.0 and do statistical analysis in order to accomplish the purposes of
the study. The descriptive research approach was used in addition to means, standard
deviation, percent, and a t-test for dependent samples. To investigate the underlying
dimensions of service quality, the multivariate statistical method like factor analysis
was used.
56
Open-ended responses were read by the researcher, counted and
categorized into free categories.
Discussion
The study examined the 3 levels of user perspectives: (minimum service
adequacy, desired expectations, and actual service perceptions). The results gained
can identify the gap differences between desired expectations and actual service
perceptions of TU Library System and the way that library has provided service to its
users. The information can also reveal the way users expect for excellent service
quality from TU Library System.
There are several insights gained from the unmet expectations, the way of
user expectations, and the problem user encountered. At the same time, the Zone of
Tolerance and dimensionalities are investigated. The results can be used for future
study related to library service quality at TU Library System.
The Gaps Between User Desired Expectations and Actual Service Perceptions
The study results reveal that all service quality attributes of desired
expectations are not met. The reason maybe like Surithong Srisa-ard mentioned in
her doctoral dissertations that it is so common for people to expect more than they
have in their day-to-day life. The larger gaps are related to the dimensions “
Collection & Access ” and library place .This finding is relevant to user comments in
open-ended responses (Table 4.13) . The largest gap of all is “ Access to digital
collection from PC ”. It is interesting that about a half of the respondents don’t access
library remote service (Table 3.12) but the gap is still the largest one. It seems that
users want to access this service but don’t have enough facilities or computer literacy
for using this service. It is possible that they don’t know this service is available.
The gap differences related to staff attributes also have large sizes and it is about
service mind. The gap sizes relate to staff attributes (Reliability) are not too large as it
seems that the users seldom contact the staff personally so they cannot rate those
attributes. (Table 3.20) When looking at the age of most respondents, it seems that
most to them are young generation so it is possible they want to access library service
by their own without intermediation. (Table 3.8). The gap sizes relate to the place for
quiet study and rendezvous are also large and this is relevant to the frequencies of
library use and remote use. (Table 3.1 – Table 3.12). Anyway, for the attribute “ A
comfortable and inviting location ”, the gap size is the smallest one. It is possible that
the libraries are comfortable and have inviting locations but don’t have quiet space
for study. A half of users never access remote access so it seems that they access
library buildings directly so the sufficient space is still required.
There are the differences of gap sizes among 3 user groups in terms of
orders. (Table 4.2-Table 4.6). While the higher order gaps of faculty/researcher group
relate to dimensions “ Collection & Access ” and library place , the gap sizes of the
attributes relate to library staff are at the top five in the perspectives of undergraduate
students. For graduate students, these attributes are ranked behind the physical
attributes so the result is relevant to that of Surithong Srisa-ard’s. The library staff
may treat faculty/researcher group different from student groups. Anyway, the
collection inadequacy and lack of place for study are still problems of all groups.
When looking at the dimensions “ Collection & Access ” , the faculty/researcher
group and graduate student group seems to have more problem about the insufficient
resource than that of undergraduate student group because the gap of an attribute “

57
Expect to find information and new ideas ” are at top five ranking. On the contrary,
this gap size of undergraduate student group is quite low (rank 15). It is possible that
about a half of the undergraduate student respondents are freshmen and sophomores
(Table 3.6). The freshmen are still studying prerequisite courses and if compare with
faculty/researcher group and undergraduate student group , they are not heavy users
so information and new idea are not needed at this time.
The User Desired Service Expectations
The top five of desired service expectations that commonly expected by all
user groups relate to library place, knowledge of librarians, accuracy of their service
record, and convenient access to complete collection (Table 4.12).It seems that in
addition to rich collection, convenient accessibility and place for study, the users still
want the librarians to have knowledge to answer their questions and library can assure
the accuracy and confidentiality for their personal information/data.
Although the users want to access library collection conveniently, the
attribute “ Access to digital collections from PC ” is not ranked at the higher order. It
is possible that the users don’t have much experience in using remote access service
and digital collection so they cannot clarify their real expectations. The attribute “
Availability of required information ” was not ranked in higher order either,
especially in the perspectives of faculty/researcher group, though it is belong to the
dimension “ Collection & Access ”. It is possible that some users used their own
collections or department collections. The data reveals that about 35.2% of users use
faculty libraries which include department collections ( in the sense of the
respondents).( Table 3.10) The attribute “Instruction in use and/or training sessions,
when needed ” was ranked very low by all user groups. It seems that the users want to
use library by their own without intermediation. This finding is very similar to that of
Philip J. Calvert’s. In addition, the staff attributes ( Reliability) are not ranked in
higher orders. It is possible that most users seldom contact librarians when access
library services so they cannot clarify their real expectations. The data from desired
service expectations suggested that the users need required information that matches
their needs with conveniently accessibility by their own. They can find material easily
and library can provide a place for quiet study, appealing facilities and modern
equipment. Whenever they encounter service problem, they library staff with
knowledge are willing to help them and they want the accuracy and confidentiality of
their personal information and data. This finding implies that “ academic users users
have very similar expectations of services. The national culture does not seem to be a
major precursor of attitudes to service quality.
The Dimensions of User Desired Expectations
The dimensions of service quality were analyzed by factor analysis
method. Factor loadings on each dimension suggests that 3 dimensions are
appropriate to explain service quality from user expectations. Those dimensions are
Affect of service –organizational, Collection&Access, and Affect of service –
personal. This finding is similar to those of Nitecki’s and Calvert’s. It seem that
users concern staff attitude, complete collection, and the ability of organization to
perform good service. The result from factor analysis reveal that staff attributes play
major role on service quality because of high loading on entire factors. The attributes
related to library place also have high loading on entired factors which is relevant to
58
the result of the Zone of Tolerance. It seems that the library place is still needed by
users. The space doesn’t seem problematic but the quietness, creativity are needed.
The Zone of Tolerance
There are some service quality attributes below the Zone of Tolerance. For
faculty/researcher group and graduate student group, the attributes belong to library
place and “Collection & Access” are below the Zone of Tolerance. On the contrary,
from the perspectives of undergraduate students, the staff attributes belong to
dimensions are below the Zone. The library staff may treat faculties/researchers
different from students. The data from open-ended responses also confirms this
finding. From the perspectives of faculty/researcher group and graduate student
group, the attribute that is commonly below the Zone of Tolerance are “ Access to
digital collection from PC ”. It implies that the library has to provide more service
through networked environment. In addition, the library should provide sufficient
facilities too. Although the collection size belong to TU Library System is higher than
that of the standard of academic library 2001 ( TU Library System, 2002), the
attribute “ Expect to find information and new idea ” is still below the Zone. Actually,
it is so common that no library can own complete collection that match user needs.
The concept of resource sharing may alleviate this problem but it seems that users
don’t realize some useful service such as document delivery service and only a few
access digital collection. The missing values of these 2 attributes confirms this
surmise.( Table 3.21). When looking at the missing values of the attributes related to
reliability , it implies that users seldom contact library staff when access library
service so they have a little chance to receive appropriate instruction. For graduate
student group, the attribute “ Instruction in use and / or instruction sessions , when
need ” is below the Zone. It implies that they still want to learn to use library
effectively but the data from desired expectation reveals that the users don’t expect
this service so much. The library should find an alternative way to provide the
instruction. For undergraduate student group, the staff attributes that related to service
mind are below the Zone. Thammasat University don’t provide the prerequisite course
about library using for undergraduate students so they may have problems when
access library services and want to personally contact library staff. Thai students don’t
have much background in using library from school education system so they need
willingness, courtesy, and empathy when they encounter service problems.
The Problems Users Encountered When Involved in Library Services
All user comments were classified into categories and counted manually.
The data suggested that most problems users encountered are library collection,
accessibility, insufficient space, and service mind. The most problems are about the
insufficient and outdate collection. Another underlying problems is about inaccurate
accessibility. The reshelving problem is also most problematic. The users cannot find
the books on shelves, though they found information via OPAC. The service mind is
another problem too. When looking at the missing value related to library staff
attributes (most related to Reliability) , it seems that users don’t have problem with
professional staff but they have problems with other staff. The comments are like “
Some staff are impolite ”, “ Some staff don’t have service mind ” or “ Some staff are
not courteous” and there are only 2 comments related to knowledge of staff. It
maybe because the users seldom contact the librarians so they didn’t complain.
59
Recommendations
After reviewing the result, the recommendations will be presented for
improvement of good service quality.
1. The service attributes that library should allocate resources to
improve for good service quality The service quality attributes which don’t meet
user desired expectations from the calculation of the Zone of Tolerance and Factor
analysis shown that most problems are related to insufficient library collection, quiet
place for study, and service mind. Though the library budget is not sufficient, library
should consider how to minimize the gap between user desired expectations and
actual service perceptions appropriately. The attribute “ Access to digital collection
from PC” is below the Zone of Tolerance from the perspectives of both
faculty/researcher and graduate student groups so the libraries should facilitate
urgently. More computer terminals, internet access points must be provided. For
undergraduate student group, they comment about staff service mind because they are
not keen in library using so the staff should more concern.
2. Library instruction or training session Though the data reveals that
the attribute “ Instruction in use and/or training sessions, when needed ” is ranked
very low from user desired expectations, the result of the zone of tolerance reveals
that graduate student group still need instruction/or training. The researcher believe
that they don’t want formal training course so the libraries should seek alternative
way of training. The missing value also reveals that the users seldom contact
librarians when involve in library service and it seems that users want to use library
by their own. The library should consider how to provide library effective guide both
printed and electronic version associate with the services. For the researcher’s
opinion, the librarians should cooperate with the lecturers to recommend library
resources, service etc. on the beginning of the class.
3. Remote access service Though only a half of respondents access
remote service, the data from desired expectations reveals that users want to access
digital collection. The library should provide more facilities such as computer
terminal, internet service, etc. to enhance remote access service.
4. Material associated with the service The data reveals that about a
half of users don’t access remote access. It seems that users don’t know how to access
those services. Actually, the library provide such document in library building but the
5. Staff The data calculated from the Zone of Tolerance implies that
library staff may treat each user group differently so the library staff should consider
this finding. High missing value related to staff knowledge implies that users seldom
contact professional staff so reference service should be more proactive, besides
reference desk should be easy to observe.
6. Public relations about the services The libraries should announce
services and resources via library homepage. The library homepage need urgently
improved. It must be more informative and well organized. The structure of the
homepage should be clear and easy to use. Remote access will be more and more
increased as most users are young generation. They get use to using library services
via internet.
7. Interlibrary loan service User comment about insufficient and out
date library collection is at the highest rank. Though it is so common that no library
has complete collection, effective interlibrary loan service must be enhanced to
60
alleviate this problem. The ILL regulations must be officially set. Now TU Libraries
located at too many locations so effective ILL is needed.
8. Reshelving problems The data from user comments reveals that this
problem is at the higher rank. The library should seek the better way for improving
reshelving speed. The missing books is also another problem.It maybe because the
books are missing.
. : Self Study Report - SSR
: , 2545
, . 2545 : , 2545.
Bibliographies
Abdallah,Fawz S. Service Quality in the Reference services of theLebanese American
University (LAU) Libraries : Gap Analysis. Phd. Dissertation. Simons
College, 2002.
Cook, Colleen and Heath, Fred. SERVQUAL and the Quest for New Measures.
(http://www.arl.org/newsltr/207/servqual.html)
Cook, Colleen and Thompson, Bruce. “ Reliability and Validity of SERVQUAL Scores
Used to Evaluate Perceptions of Library Service Quality “ Journal of
Academic Librarianship Vol.26, no. 4 : p. 248-258.
Cullen, Rowena. Perspectives on User Satisfaction Surveys. Library Trends. Vol.49,no.4
(Spring 2001) : p. 662-686.
Grapentine, Terry. The History and Future of Sercvice Quality Assessment : Connecting
Customer Needs and Expectations to Business Processes
(http://www.grapentine.com/displayarticles.asp?Id=10.
Hernon, Peter and Altman Ellen. Assessing Service Quality : Satisfying the Expectations
of Library Customers Chicago : American Library Association, 1998.
Hernon, Peter. “ Quality : New Directions in the Research” Journal of Academic
Librarianship. Vol.28, no.4 (Jul 2002) : p. 224-231.
Johnston, Robert.” The Zone of Tolerance : Exploring the relationship between service
transactions and satisfaction with the overall service International”
Journal of Service Industry Management vol. 6,no.2 ,1995 :p. 46-61.
Marketing Consultant for MCB University Press. Journal of Services Marketing
vol.14,no.5 , 2000.
Nitecki, Danuta A. and Hernon, Peter. Measuring Service Quality at Yale University's
Libraries. Journal of Academic Librarianship Vol.26,no.4 : p. 259-273.
Nitecki, Danuta A. Changing the Concept and Measure of Service Quality in Academic
Libraries. Journal of Academic ibrarianship vol. 22,no.3 (May 1996) : p.
181-191.
Surithong Srisa-Ard. User Expectations and Perceptions of Library Service Quality of an
Academic Library in Thailand PhD. Dissertation . Illinois State University,
1997.
APPENDIX
The modification of SERVQUAL questionnaire
2
2
/
/
(1)
(
1 2
) (
2)
(1
3 )
(3)
1
4 “
”
“
N ”
……
……
…..
: :
1.
1 2
3
4
5
6
7
1 2
3
4
5
6
7
1 2
3
4
5
6
7
N
2.
(-
)1
2
3
4
5
6
7
1 2
3
4
5
6
7
1 2
3
4
5
6
7
N
3.
1 2
3
4
5
6
7
1 2
3
4
5
6
7
1 2
3
4
5
6
7
N
4.
1 2
3
4
5
6
7
1 2
3
4
5
6
7
1 2
3
4
5
6
7
N
5.
1 2
3
4
5
6
7
1 2
3
4
5
6
7
1 2
3
4
5
6
7
N
6.
1 2
3
4
5
6
7
1 2
3
4
5
6
7
1 2
3
4
5
6
7
N
7.
1 2
3
4
5
6
7
1 2
3
4
5
6
7
1 2
3
4
5
6
7
N
****
****
***
****
****
3
……
……
…..
: :
8.
1 2
3
4
5
6
7
1 2
3
4
5
6
7
1 2
3
4
5 6
7
N
9.
1 2
3
4
5
6
7
1 2
3
4
5
6
7
1 2
3
4
5
6
7
N
10
.1
2
3
4
5
6
7
1 2
3
4
5
6
7
1 2
3
4
5
6
7
N
11
.1
2
3
4
5
6
7
1 2
3
4
5
6
7
1 2
3
4
5
6
7
N
12
.1
2
3
4
5
6
7
1 2
3
4
5
6
7
1 2
3
4
5
6
7
N
13
.1
2
3
4
5
6
7
1 2
3
4
5
6
7
1 2
3
4
5
6
7
N
14
.1
2
3
4
5
6
7
1 2
3
4
5
6
7
1 2
3
4
5
6
7
N
15
.1
2
3
4
5
6
7
1 2
3
4
5
6
7
1 2
3
4
5
6
7
N
16
.
( E
bsc
o H
ost , A
BI/
INF
OR
M
)
1 2
3
4
5
6
7
1 2
3
4
5 6
7
1 2
3
4
5
6
7
N
17
.1
2
3
4
5
6
7
1 2
3
4
5
6
7
1 2
3
4
5
6
7
N
18
.1
2
3
4
5
6
7
1 2
3
4
5
6
7
1 2
3
4
5
6
7
N
19
.1
2
3
4
5
6
7
1 2
3
4
5
6
7
1 2
3
4
5
6
7
N
20
.1
2
3
4
5
6
7
1 2
3
4
5
6
7
1 2
3
4
5
6
7
N
4
……
……
…..
: :
21
.1
2
3
4
5
6
7
1 2
3
4
5
6
7
1 2
3
4
5
6
7
N
22
.1
2
3
4
5
6
7
1 2
3
4
5
6
7
1 2
3
4
5
6
7
N
23
.1
2
3
4
5
6
7
1 2
3
4
5
6
7
1 2
3
4
5
6
7
N
24
.
(
)
1 2
3
4
5
6
7
1 2
3
4
5
6
7
1 2
3
4
5
6
7
N
25
.1
2
3
4
5
6
7
1 2
3
4
5
6
7
1 2
3
4
5
6
7
N
26
.1
2
3
4
5
6
7
1 2
3
4
5
6
7
1 2
3
4
5
6
7
N
27
.1
2
3
4
5
6
7
1 2
3
4
5
6
7
1 2
3
4
5
6
7
N
28
.1
2
3
4
5
6
7
1 2
3
4
5
6
7
1 2
3
4
5
6
7
N
29
1 2
3
4
5
6
7
1 2
3
4
5
6
7
1 2
3
4
5
6
7
N
****
****
****
****
**