Embed Size (px)
Citation preview

Assessment of geographic scope of electricity markets: the case of flow-basedmarket coupling
Dmitri PerekhodtsevLECG
The Economics of Energy Markets
Toulouse, June 20-21, 2008
26 August, 2008
2
Introduction
Method currently used by ETSO to determine cross-border Net Transfer Capacity (NTC) available for commercial use is inefficient.
NTC may result in allocating less cross-border capacity than is physically feasible.
That aggravates to geographic fragmentation of electricity markets along national borders and potential competition problems in each national market
Flow-based market coupling initiatives of ETSO and EuroPEX have a potential to significantly improve the efficiency of cross-border capacity determination and allocation. That alone may extend the geographic scope of national markets.
This paper attempts to quantify the possible effect of market coupling on the geographic scope of European electricity markets

26 August, 2008
3
Outline
Current methodology of NTC identification flow-based market coupling
Assessment of geographic scope of electricity markets
Model of measuring unilateral market power in a meshed network
Data
Results
26 August, 2008
4
ETSO methodology for cross-border NTC determination
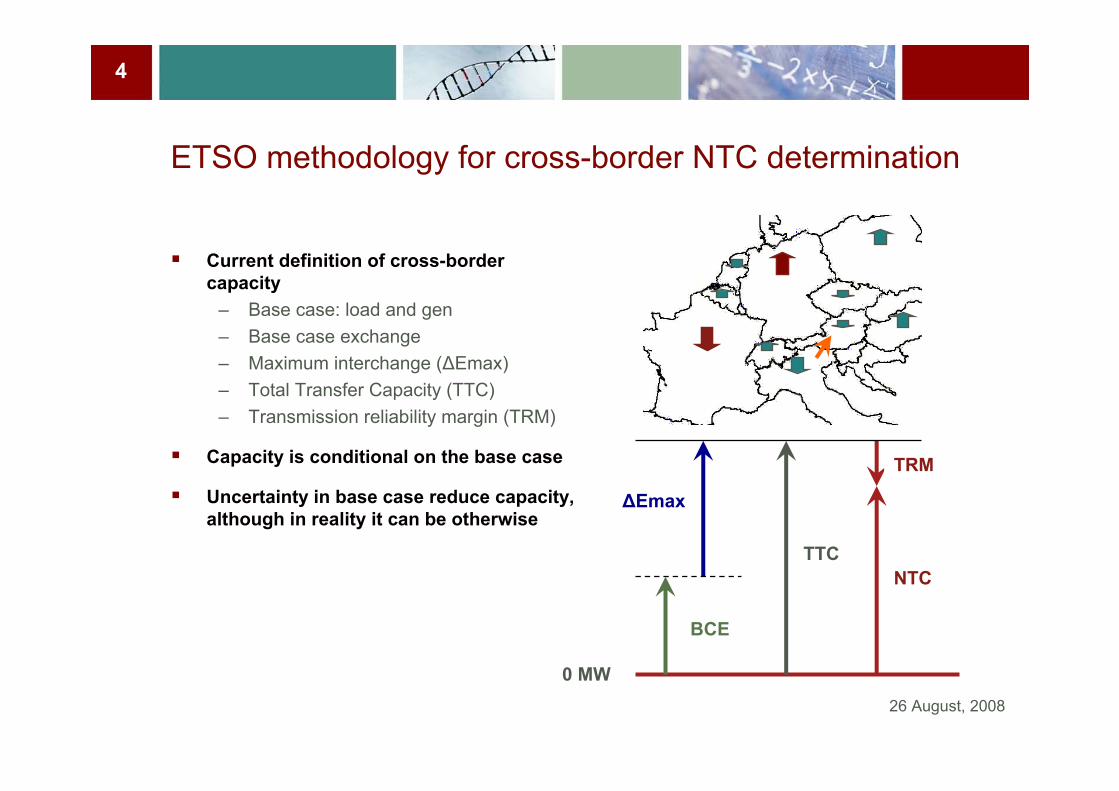
Current definition of cross-border capacity
– Base case: load and gen– Base case exchange– Maximum interchange (ΔEmax)– Total Transfer Capacity (TTC)– Transmission reliability margin (TRM)
Capacity is conditional on the base case
Uncertainty in base case reduce capacity, although in reality it can be otherwise
0 MW
BCE
ΔEmax
TTCNTC
TRM

26 August, 2008
5
Base case:– 800 MWh load in A is served by local
generation;– 0 generation at B and C.– 0 BCE: BA and CA
Emax BA– Determined by BC limit– 400 MW
Emax CA– Determined by BC limit– 133.3 MW
Energy deliverable to A under cross-border– 400 MWh from B– 100 MWh from C– 500 MWh total
Maximum actual energy deliverable to A– 700 MWh from B – 100 MWh from C– 800 MWh total
Current transfer capacity calculation does not take into account possible counterflow that can be provided by C
Example: Transfer capacity B-A and C-A
A
B
C
Load: 800MWhGeneration: 800MWhCapacity: 1000MW
Base Case Q: 0MWhCapacity: 1000MWEffect on line BCwrto A: 0.25
Base case Q: 0MWhCapacity: 100MWEffect on line BCwrto A: -0.75
Line
Lim
it: 1
00M
W

26 August, 2008
6
Flow-based market coupling
Simplified transmission model using:
– Physical capacities of cross-border links and
– Power Transfer Distribution Factors (PTDF)
Coordinated cross-border congestion management based on:
– Implicit auctions– Export-import bids from national
power exchanges
Does not rely on the base case
Provides more flexibility to allocate available capacity

26 August, 2008
7
Identification of geographic relevant markets
SSNIP test– Starts from a smallest candidate geographic market (a country)– Tests whether if this market was controlled by a hypothetical monopolist, it would be
profitable for the monopolist to raise prices. – NO means that the competitive pressure from the neighboring countries is strong, need to
expand the geographic market definition and repeat the exercise– YES means that external competitive pressure is week, the boundary of the geographic
market is reached
Profitability of a price increase by a hypothetical monopolist– Pivotality – whether the demand can be met without relying on the capacity of a particular
generator– Residual Supplier Index – share of demand that can be met without relying on capacity of a
particular generator.– RSI < 1 means a generator is pivotal, the smaller RSI the smaller is the external competitive
pressure on the generator

26 August, 2008
8
, , , 1
min
. .1. 0
2. 03.
4.
fi i j
N
iq q f ij i
i i
f fi i
cb
q
s tq c
q c
∀ =
≤ ≤
≤ ≤≤
⋅
∑
f
f L
A f = (q + q - d)
Model
Minimize the output of the considered firm, while:– Meeting load in all locations;– Respecting generation capacity constraints;– Respecting transmission constraints
( )
, , 1
1 1
( )
min
. .1. 0
2. 0
3.
4.
fi i
N
iq q i i
i i
f fi i
N Nf
i i ii i
r fmc
q
s tq c
q c
q q d
∀ =
= =
≤ ≤
≤ ≤
+ =
⋅ + − ≤
∑
∑ ∑PTDF q q d L
Flow-based market coupling Bilateral cross-border NTC

26 August, 2008
9
Data
Transmission model– Market coupling scenario
• Zhou and Bialek, 2005• PTDF matrix,
transmission limits– Current scenario:
• NTC from ETSO
National load scenarios– Winter Off-Peak/Peak, – Summer Peak
National generating capacity– DG-TREN 2004

26 August, 2008
10
Results: Germany
RSIDemand at candidatemarket
CompetitiveImportRSI
Demand at candidatemarket
CompetitiveimportCandidate Market
70%49,89934,93841%49,89920,253D
50%76,22138,25130%76,22123,178D-A-CH-CZ-SV-CRT
55%73,50540,13932%73,50523,378D-A-CH-CZ
49%87,83743,31433%87,83729,053D-CH-I
57%60,58234,76836%60,58221,973D-A-H55%64,33535,44032%64,33520,778D-A-CZ65%65,34942,23337%65,34924,023D-A-CH
48%67,42332,29330%67,42320,253D-PL
40%106,52742,21318%106,52718,903D-F
47%57,13627,00131%57,13617,603D-NL
63%58,05436,50936%58,05421,178D-CZ70%59,06941,20944%59,06925,853D-CH66%56,18036,88638%56,18021,423D-A
Market couplingCross-border allocation

26 August, 2008
11
Result: Germany

26 August, 2008
12
Results: France
RSIDemand at candidatemarket
CompetitiveImportRSI
Demand at candidatemarket
CompetitiveimportCandidate Market
35%56,62819,75713%56,6287,150F
17%94,56716,44514%94,56713,500F-CH-I
30%65,79819,81120%65,79812,900F-CH
23%85,39719,78013%85,39711,000F-I
26%123,52332,1189%123,52310,653F-B-NL-D
35%73,62425,79910%73,6247,500F-B-NL
34%66,38822,35811%66,3887,000F-B40%106,52742,21318%106,52718,903F-D24%79,58719,0789%79,5876,800F-E
Market couplingCross-border allocation

26 August, 2008
13
Conclusion
This work attempts to quantify the effect of a change of transmission model on geographic scope of electricity markets in Europe.
The approach based on assessment of pivotality of hypothetical national monopolists.
Little chances of expansion of relevant markets for France
German market can be expanded to include Czech Republic, Switzerland, Austria, Slovakia, and Croatia
Further analysis: perform for other countries