Embed Size (px)
Citation preview

Assessment of Ecological Effects: For Sand Extraction from the Midshore Pakiri Embayment August 2020
Consulting Biologists – Established 1972 P.O. Box 2027, Auckland 1140. New Zealand
www.Bioresearches.co.nz
P O Box 2027, Auckland 1140. Telephone: (09) 379-9417, Website: www.Bioresearches.co.nzAssessment of Ecological Effects MBL Midshore Final v3 Final V3 4 September 2020 i
Assessment of Ecological Effects: For Sand Extraction from the Midshore Pakiri Embayment August 2020
DOCUMENT APPROVAL
Document title:Assessment of Ecological Effects: For Sand Extraction from the Midshore Pakiri Embayment
Prepared for: McCallum Brothers Limited
Version: Final V3
Date: 4 September 2020
Document name: Assessment of Ecological Effects MBL Midshore Final v3.docx
Authors:Simon WestSenior Marine Ecologist, M.Sc. (Hons)
Dr Laureline Meynier Marine Ecologist
Reviewer:Annabelle CoatesEcologist, M.Sc. (Hons)
Approved for Release:
Simon WestSenior Marine Ecologist, M.Sc. (Hons)
REVISION HISTORY
Rev. No. Date Description Author(s) Reviewer Approved1 December 2019 Draft 1 S. West & L. Meynier A. Coates
2 April 2020 Draft 2 S. West & L. Meynier S. West
Reference: Bioresearches (2020). Assessment of Ecological Effects: For Sand Extraction from the Midshore Pakiri Embayment. Report for McCallum Brothers Limited. pp 109
Cover Illustration: Sand dredge in operation off Pakiri beach (November 2019)

P O Box 2027, Auckland 1140. Telephone: (09) 379-9417, Website: www.Bioresearches.co.nz Assessment of Ecological Effects MBL Midshore Final v3 Final V3 4 September 2020 ii
CONTENTS
1. Introduction ................................................................................................................ 1 1.1 Previous Surveys ................................................................................................................. 3 1.2 Dredging Activities and the Potential Effects ...................................................................... 4
2. Methods ..................................................................................................................... 7 2.1 Seabed Sampling ................................................................................................................. 7
2.1.1 Surficial Sediment Particle Size .............................................................................. 7 2.1.2 Seabed Photographs .............................................................................................. 8
2.2 Benthic Fauna Sampling .................................................................................................... 13 2.2.1 Infauna (box dredges) .......................................................................................... 13 2.2.2 Epibenthic Macrofauna (dredge tows) ................................................................. 14
2.3 Macrofauna Survivorship .................................................................................................. 14 2.4 Literature Review on Fish .................................................................................................. 15 2.5 Ecological Impact Assessment Methodology .................................................................... 19
3. Results ...................................................................................................................... 22 3.1 Seabed Characteristics ...................................................................................................... 22
3.1.1 Surficial Sediment Particle Size ............................................................................ 22 3.1.2 Seabed Photographs ............................................................................................ 22
3.2 Benthic Fauna .................................................................................................................... 23 3.2.1 Infauna .................................................................................................................. 23 3.2.2 Epibenthic macrofauna ........................................................................................ 27
3.3 Macrofauna Survivorship .................................................................................................. 29 3.3.1 Numbers of Individuals ........................................................................................ 29 3.3.2 Size of Individuals ................................................................................................. 31
4. Discussion ................................................................................................................. 32 4.1 Seabed Characteristics ...................................................................................................... 32
4.1.1 Surficial Sediment Particle Size ............................................................................ 32 4.1.2 Seabed Photographs ............................................................................................ 32
4.2 Benthic Fauna .................................................................................................................... 32 4.2.1 Methodology Differences ..................................................................................... 32 4.2.2 Midshore Benthic Community ............................................................................. 32 4.2.3 Differences in Benthic Communities Alongshore ................................................. 33 4.2.4 Differences in Benthic Communities Between Consent Areas (depth) ............... 33
4.3 Macrofauna Survivorship .................................................................................................. 33 4.4 Fish Review ........................................................................................................................ 34 4.5 General Implications of Findings ....................................................................................... 35
5. Ecological Values ....................................................................................................... 37 5.1 Benthic Habitat and Fauna ................................................................................................ 37 5.2 Fish .................................................................................................................................... 37 5.3 Summary of Ecological Values .......................................................................................... 37
P O Box 2027, Auckland 1140. Telephone: (09) 379-9417, Website: www.Bioresearches.co.nz Assessment of Ecological Effects MBL Midshore Final v3 Final V3 4 September 2020 iii
6. Assessment Of Effects of Sand Extraction on Biota .................................................... 38 6.1 Benthic Biota and Macrobenthic Epifauna ....................................................................... 38
6.1.1 Community structure and habitat ........................................................................ 38 6.1.2 Benthic Fauna Survival ......................................................................................... 39 6.1.3 Suspended Sediment and Turbidity ..................................................................... 40
6.2 Fish .................................................................................................................................... 41 6.2.1 Effects of Underwater Noise ................................................................................ 41 6.2.2 Effects of Entrainment.......................................................................................... 42 6.2.3 Effects of Suspended Sediment ............................................................................ 43 6.2.4 Effects of Food Source Reduction ........................................................................ 43
6.3 Summary of the Magnitude of Effects .............................................................................. 43 6.4 Level of Ecological Effects ................................................................................................. 43
7. References ................................................................................................................ 46
8. Appendices ............................................................................................................... 50 Appendix 1 Sampling Area Geographical Positions .................................................... 50 Appendix 2 Surficial Sediment Particle Size ................................................................ 52 Appendix 3 Seabed Photographs ................................................................................ 54 Appendix 4 Benthic Fauna .......................................................................................... 68 Appendix 5 Macrofauna Survivorship ........................................................................ 88 Appendix 6 Statistical Results - Infauna ...................................................................... 95 Appendix 7 Statistical Results - Epibenthic macrofauna .......................................... 104

Assessment of Ecological Effects: For Sand Extraction from the Midshore Pakiri Embayment Assessment of Ecological Effects MBL Midshore Final v3 Final V3 4 September 2020 1
1. INTRODUCTION
In 2006, McCallum Brothers Limited® (MBL) was granted the Coastal Permits (ARC28165, ARC28172, ARC28173 & ARC28174), under which they are permitted to remove up to 76,000 m³/year of sand from the nearshore area between the 5 m and 10 m water depths located between the Auckland/Northland regional boundary and the Poutawa Stream as shown in Figure 1.1. This extraction regime was consented by the Environment Court in May 2006 for a 14-year period, expiring on the 6th September 2020. McCallum Brothers Limited (MBL) lodged an application to renew extraction with the existing inshore area in late February 2020 (Council References: BUN60352951, CST60352952 and DIS60347549). However, MBL has reviewed its sand extraction operation at Pakiri and considers that a relocation will improve some operational aspects of the extraction process and reduce potential opposition to the extraction from residents, beach users and some environmental groups. MBL proposes to move to an extraction area further offshore to between the 15 and 25 m chart datum depth contours (Proposed Midshore McCallums area) over the same length of Pakiri and Te Arai beaches as shown in Figure 1.1. The offshore boundary of the proposed mid-shore MBL area will be concurrent with the inshore boundary of the proposed Kaipara Excavators Limited (KEL) Offshore area. It is recognised that considerable additional technical information will be required to support this application, and that final decisions on the granting of these consents may not be made until after the expiry of the current consents. Therefore, due to the economic significance of the resource for Auckland, MBL has applied for the renewal of the existing inshore extraction consents prior to their expiry in September of 2020. This then allows for their continuation under s124 of the Resource Management Act (RMA) 1991. Concurrently, MBL will apply for consent to relocate the area of extraction to the 15 to 25 m water depth area, with the aim of relinquishing the inshore consent should the mid-shore consent be granted. A comparison of the benthic biota data from with the existing extraction areas against an adjacent control area has been provided in Bioresearches (2019a), to describe any effects related to the recent level of sand extraction. To provide comparative benthic biota and sediment particle size data, sampling was conducted seawards of the current consented area out to the 25 m contour, with reference to determining any pattern in the distribution of biota or changes in seabed sediments. The samples in the proposed consent area (mid-shore) were collected using an MBL vessel in 2019, in accordance with a sampling plan devised by MBL and Dr Roger Grace. In order to provide clarity, the different consent areas were named as follows:
MBL “Current Consent Area” or “Inshore” (~5 to 10 m deep) MBL “Proposed Consent Area” or “Mid-shore” (~15 to 25 m deep) KEL “Offshore” area (~25 to 40 m deep) The “Inshore Between” area, between “Inshore” and “Mid-shore” (~12 to 16 m deep)

Assessment of Ecological Effects: For Sand Extraction from the Midshore Pakiri Embayment Assessment of Ecological Effects MBL Midshore Final v3 Final V3 4 September 2020 2
Figure 1.1 Existing MBL Inshore and KEL Offshore Sand Extraction Areas and the proposed New
Midshore Sand Extraction Area at Pakiri Beach.

Assessment of Ecological Effects: For Sand Extraction from the Midshore Pakiri Embayment Assessment of Ecological Effects MBL Midshore Final v3 Final V3 4 September 2020 3
1.1 Previous Surveys
In parallel to sand extraction along the shore of the Pakiri – Mangawhai Embayment, biological and physical surveys in the bay have been conducted since the late 80s to determine the sedimentation process along the shore, and the degree of impact from sand extraction on the dynamics of the bay’s ecosystem. Hilton’s thesis published in 1990 (Hilton, 1990) presented the results of macrobenthos surveys carried out in 1986 and 1987 along transects perpendicular to the beach to ~5 km offshore (> 40 m deep). Hilton described associations of species along a depth gradient. Within shallow waters to 10 m deep, the wheel shell (Zethalia zelandica) and the sand dollar (Fellaster zelandiae) dominated the macrobenthos. The gastropods Cominella adspersa and Amalda australis, and the heart urchin (Echinocardium cordatum) were also present in lower densities. These species were also part of the mid-shore assemblage (10 to 25 m deep) with clams such as Tawera spissa and Myadora striata. Offshore in deeper waters, other clams were common, such as the purple cockle Purpurocardia purpurata, the scallop Pecten novaezelandiae, and the clam Corbula zelandica. Only the macrobenthos was investigated in Hilton’s study, as his ultimate purpose was to estimate the biogenic sand production, for which the source is mostly from the decomposition of molluscs. Dr Grace undertook biological investigations in 1990 and 2005 in the inshore extraction area (Grace, 1991; Grace, 2005). Benthic fauna has been noted as extremely sparse as the environment is naturally harsh. Species such as the wheel shell, scale worms (Sigalion), mantis shrimp (Pterygosquilla armata), and large pink siphon worm (Sipunculus maoricus) showed a consistent occurrence and association with the dominant sand dollar. A small number of surf clams (Dosinia anus & Dosinia subrosea) were also found in the samples. The 1990 study noted that wheel shells were at lower densities than that of the Hilton (1990) study. In 2005, Dr Grace’s investigations found no wheel shell or surf clam. However, there was the presence of stink worms and paddle crab (Grace, 2005). The main changes that were identified between the 1990 and 2005 studies was the decrease in species diversity and decrease in abundance in some species. Dr Grace attributed these changes to natural variations in recruitment of biota and the naturally harsh environment, and not to sand extraction. There was also a note that variation in sampling technique could lead to biota differences. In 2003 and 2006, baseline physical and biological studies of the benthos in offshore waters (>25 m deep) were carried out. Extraction of offshore sand started in 2003 by Kaipara Excavators Ltd in Area 1 south of Te Arai Point, an area (Area 2) to the north of Te Arai Point was surveyed in 2006 (ASR, 2006). Subsequent surveys of Area 1 and a control area south of Area 1 were carried out in 2011 and 2017 to assess potential effects of sand mining on the benthos (Bioresearches 2011, 2019b). Offshore benthic fauna since 2003 showed a dominance in numbers of amphipods and polychaetes. Corbula zelandica and Purpurocardia purpurata were the most abundant bivalves in 2003, but their abundance decreased over the years. Scallops were present in surveys in patchy aggregations. Horse mussel (Atrina zelandica) beds recorded in the 2003 ASR survey have disappeared. According to comments by Dr Roger Grace a series of large storms lifted the horse mussel beds through wave activity and deposited them on the shore, the beds have not recovered from this natural damage. In 1992 Beca Carter Hollings and Ferner noted "Large numbers of horse mussels (Atrina zelandica) wash ashore in storms from time to time. Their sizes suggest that heavy settlements occur in intermittent years, individuals growing rapidly and the population tending to consist of similar sized individuals....". The above observation was noted as consistent with the views expressed by Dr Bob Creese in the NIWA sand study (Healy, et al. 1996), that in his experience, colonies of horse mussels seem to be transient. A decline in water clarity has also been linked in Ellis et al. 2002 as a likely factor for declining horse mussel beds in estuarine environments However, the water quality report (Kubale, 2020) shows the levels of

Assessment of Ecological Effects: For Sand Extraction from the Midshore Pakiri EmbaymentAssessment of Ecological Effects MBL Midshore Final v3 Final V3 4 September 2020 4
suspended solids in water from the normal operation of the William Fraser and earlier dredging operations(1.5-4.5 mg/L) would not be sufficient to cause a decline in horse mussels, which experimental studies showed occurred and suspended solids concentrations greater than 80 mg/L. The benthic community in the control area adjacent to the south of the sand-extracted area did not show significant differences with that of the Area 1, indicating a negligible effect of offshore sand mining on benthic communities (Bioresearches 2019b).
1.2 Dredging Activities and the Potential Effects
All extraction activities in the Proposed Consent area will be conducted by a Trailing Suction dredge. Trailing suction dredgers operate by sucking material from the seabed as a sand slurry using a trailing suction head fitted to pipes that trail over the bed as the ship sails over the extraction area. The sand pumps lift the extracted sand slurry through the pipework to pass through sand screens to be deposited in the onboard hopper. A key component of the activity is that once the dredge vessel is fully loaded, it returns directly by sea to the MBL depot at the Ports of Auckland for unloading, hence there are no local onshore components to the extraction operation.
A schematic diagram of a trailing suction hopper dredge is presented in Figure 1.2, note the vessel is not an MBL vessel.
Figure 1.2 Schematic Diagram of Trailing Suction hopper Dredge (note not an actual MBL vessel)
In late 2019, MBL took possession of a new sand extraction vessel the William Fraser (see Cover Photo) to replace the ageing Coastal Carrier (1968). The William Fraser has been specifically built for trailing suction dredging of sand and has a number of new technologies that provide improvements in the operation of the vessel whilst minimising other impacts on the surrounding environment. The William Fraser is larger than the Coastal Carrier with improved pumping and screening technology.

Assessment of Ecological Effects: For Sand Extraction from the Midshore Pakiri Embayment Assessment of Ecological Effects MBL Midshore Final v3 Final V3 4 September 2020 5
There are some key operational changes between the William Fraser and the Coastal Carrier: The increased speed of the vessel when extracting; between 1.5 to 2.5 knots vs the Coastal Carrier
at 1 – 1.5 knots. This is mainly due to the size of the vessel and the type of drag-head used, Wider dredge head (1.5 m vs 1.2 m) and larger hopper (900 m³ vs 460 m³), meaning fewer dredging
trips to obtain the same consent volume, The increased speed of the vessel and wider dredge head has resulted in a wider shallower dredge
path profile (1.6 m x 100 mm vs 1.2 m x 150 mm), The screening technology on the William Fraser is significantly improved from the Coastal Carrier
resulting in significant improvements in the efficiency of sand retention, resulting in lower water quality effects and less over dredging.
The addition of moon pools to discharge water below the keel, rather than via flume pipes and over the side of the vessel. This introduces the overspill and oversize material under the vessel rather than at the surface, reducing the effects of turbidity on the receiving environment.
The dredge head used by the William Fraser is shown in operation on the seabed in Figure 1.3, with the resulting dredge path profile.
Figure 1.3 William Fraser dredge head and seabed dredge profile at Pakiri. The effects of sand extraction occur in two general categories: seabed disturbance and water quality. The effects to the seabed (and biota) occur in two ways:
1. Removal of seabed and disturbance of the seabed substrate. The magnitude and frequency of occurrence at any one location will influence the level of effects to biota. The William Fraser drag head is 1.5 m wide. Seabed investigations by MBL, showed the dredge path was 1.6 m wide and ranged in depth of 80 mm to 120 mm below the sediment surface. More frequent disturbances by dredging will likely result in greater observed effects to the biota population. Excessive dredging could potentially result in increased seabed depth, which has the potential to influence biota community composition. Shallower layers of dredging are likely to recover quicker than deeper layers of dredging.
2. Damage to biota by passage through the dredge and screening. Larger fragile biota are more likely to be adversely affected by passage through the dredge and screening equipment than robust biota. Smaller, less robust biota can potentially be damaged by impact with hard surfaces on passage through the dredge, pump, pipes and screen. The level of damage will vary among species and sizes, from minor scratches and chips to mortal cracks and dismemberment.
The effects to water quality are by discharge to the ocean from the dredge vessel and occur in two ways:

Assessment of Ecological Effects: For Sand Extraction from the Midshore Pakiri EmbaymentAssessment of Ecological Effects MBL Midshore Final v3 Final V3 4 September 2020 6
1. Discharge of by-wash containing oversized material that is too large to pass through the sand screens to the hopper. For safety reasons sampling was not undertaken at the discharge moon pool. Once discharged the concentration quickly reduces back to ambient conditions in both depth and distance from the discharge point, this is further defined in Kubale (2020).
2. Discharge over the weir boards as the hopper fills with sand. Water sampling of the weir board discharges indicated Total Suspended Solids (TSS) values of 450 to 1240 mg/L, to form part of the overall plume with the by-wash discharge as noted above. All discharge going over weir boards passes into moon pools that discharge at keel level on the vessel.
The effects of sand extraction dredging are summarised in Figure 1.4.
Figure 1.4 Summary of the effects of sand dredging (note not an actual MBL vessel)
Surface overflow plume
Oversizeplume
Seabed disturbance Debris

Assessment of Ecological Effects: For Sand Extraction from the Midshore Pakiri Embayment Assessment of Ecological Effects MBL Midshore Final v3 Final V3 4 September 2020 7
2. METHODS
MBL in combination with Dr Grace devised the sampling methodologies as outlined below, to assess the nearshore benthic ecology in the Pakiri – Mangawhai embayment potentially affected by the proposed relocation of the sand extraction from the inshore extraction areas (Figure 1.1) operated by MBL to the proposed mid-shore area defined in Figure 1.1. The sampling was largely conducted by MBL using their own vessel but with Dr Mathew Jones present to ensure the methodology was followed. Potential effects on birds and marine mammals or on marine water quality are not part of this assessment. 2.1 Seabed Sampling
2.1.1 Surficial Sediment Particle Size
Changes in the particle size composition of the seabed has the potential to influence benthic biota community composition. Samples were collected to determine the variation in sediment particle size in the proposed mid-shore sand extraction area, and therefore potential influences on the benthic biota communities. A total of 118 box dredge samples were collected in early 2019, numbers of samples were distributed as shown in Table 2.1. Each sampling site is shown in Figure 2.2 and the GPS locations are listed in Appendix 1. Table 2.1 Numbers of samples in areas1
Northern Te Arai Point Southern Control Offshore 15 4 10 2 Proposed Midshore Area 10 3 11 14 Inshore-Between area 4 5 1 Inshore Consent Area 10 10 10 A 1 kg subsample of the sediment was retained from that passing through a 3.15 mm sieve from the 118 box dredge samples collected for benthic fauna (see 2.2 Benthic Fauna Sampling), for the sediment size analysis. The sand was dried and processed to the concrete industry standard - NZS 3111: 1986 Methods of Test for Water and Aggregate for Concrete by MBL, which results in percentage composition based on the weight of particles passing a series of screen sizes. The NZS 3111 method uses different sieve sizes to samples normally processed for environmental samples and excludes large particles, but the results are still comparable across sites and provide indications of habitat variability. Where possible, the raw particle size data has been grouped into the following standard size fractions.
Class Gravel Sand Silt and Clay Particle Size (mm) > 2.00 2.00 – 0.063 < 0.063
According to the methodology defined in Folk (1980), the sediments were assigned a description based on the principle particle size fraction with modifiers based on the next important particle sizes. These descriptions are given as letter codes. For example,
A sample which consisted of mostly sand with a significant proportion of silt and clay would be described as muddy sand. This would be denoted mS.
1 Note: The Table consent area colour highlights are derived from Figure 1.1 and colour theme is continued through the document
Assessment of Ecological Effects: For Sand Extraction from the Midshore Pakiri Embayment Assessment of Ecological Effects MBL Midshore Final v3 Final V3 4 September 2020 8
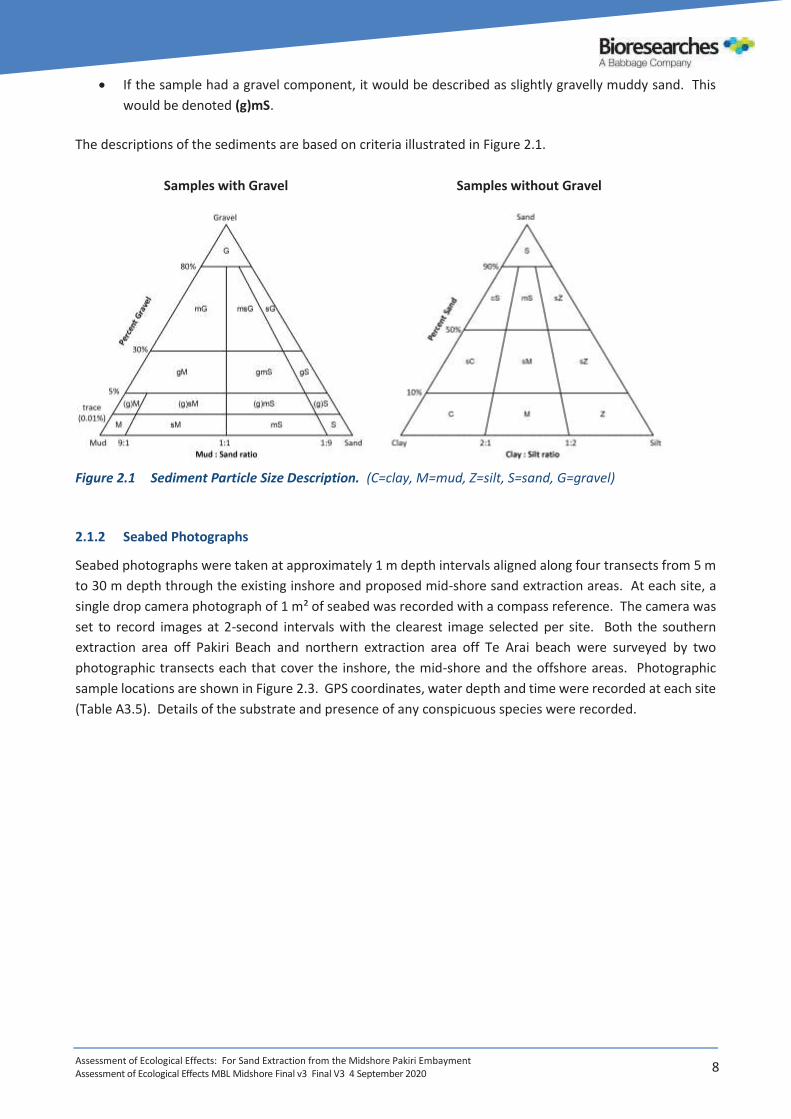
If the sample had a gravel component, it would be described as slightly gravelly muddy sand. This would be denoted (g)mS.
The descriptions of the sediments are based on criteria illustrated in Figure 2.1.
Samples with Gravel Samples without Gravel
Figure 2.1 Sediment Particle Size Description. (C=clay, M=mud, Z=silt, S=sand, G=gravel) 2.1.2 Seabed Photographs
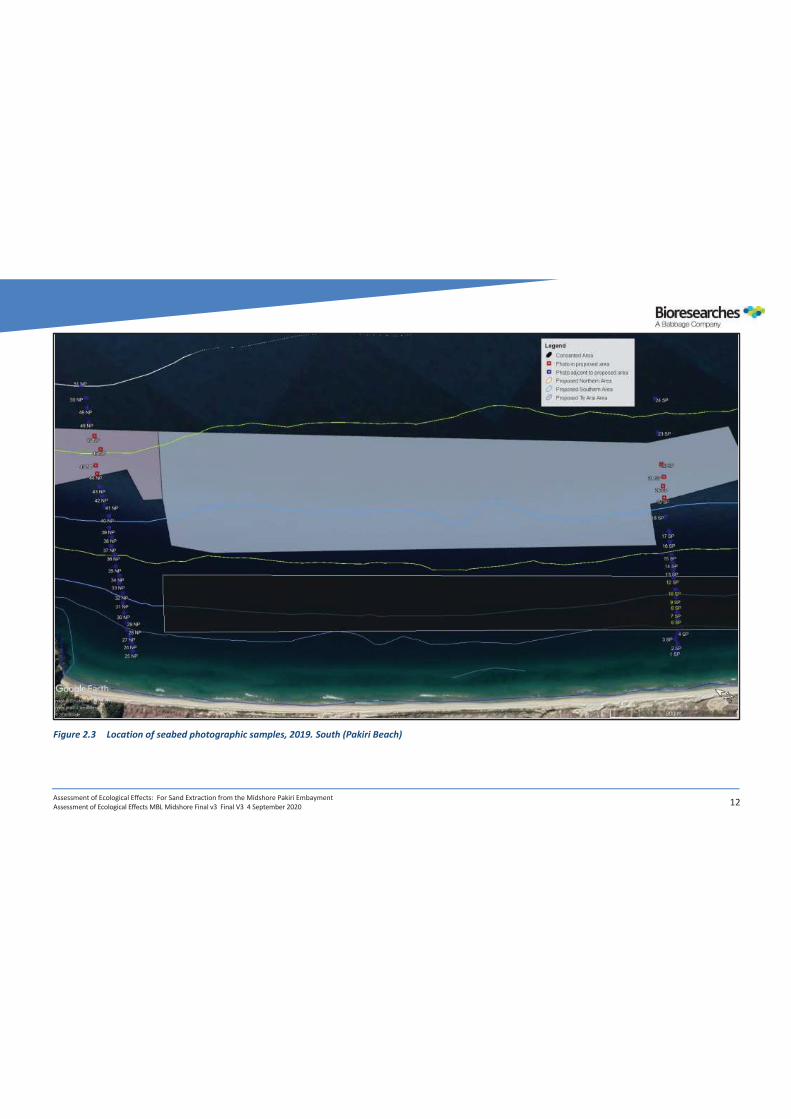
Seabed photographs were taken at approximately 1 m depth intervals aligned along four transects from 5 m to 30 m depth through the existing inshore and proposed mid-shore sand extraction areas. At each site, a single drop camera photograph of 1 m² of seabed was recorded with a compass reference. The camera was set to record images at 2-second intervals with the clearest image selected per site. Both the southern extraction area off Pakiri Beach and northern extraction area off Te Arai beach were surveyed by two photographic transects each that cover the inshore, the mid-shore and the offshore areas. Photographic sample locations are shown in Figure 2.3. GPS coordinates, water depth and time were recorded at each site (Table A3.5). Details of the substrate and presence of any conspicuous species were recorded.

Assessment of Ecological Effects: For Sand Extraction from the Midshore Pakiri Embayment Assessment of Ecological Effects MBL Midshore Final v3 Final V3 4 September 2020 9
Figure 2.2 Location of benthic box dredge samples, 2019. North

Assessment of Ecological Effects: For Sand Extraction from the Midshore Pakiri Embayment Assessment of Ecological Effects MBL Midshore Final v3 Final V3 4 September 2020 10
Figure 2.2 Location of benthic box dredge samples, 2019. South

Assessment of Ecological Effects: For Sand Extraction from the Midshore Pakiri Embayment Assessment of Ecological Effects MBL Midshore Final v3 Final V3 4 September 2020 11
Figure 2.3 Location of seabed photographic samples, 2019. North (Te Arai Beach)
Assessment of Ecological Effects: For Sand Extraction from the Midshore Pakiri Embayment Assessment of Ecological Effects MBL Midshore Final v3 Final V3 4 September 2020 12
Figure 2.3 Location of seabed photographic samples, 2019. South (Pakiri Beach)

Assessment of Ecological Effects: For Sand Extraction from the Midshore Pakiri Embayment Assessment of Ecological Effects MBL Midshore Final v3 Final V3 4 September 2020 13
2.2 Benthic Fauna Sampling
2.2.1 Infauna (box dredges)
The potential effects of sand extraction on the relative abundance and diversity of benthic communities in the proposed mid-shore area (proposed new consent area) and adjacent seabed were assessed. A total of 118 box dredge samples were collected in early 2019, numbers of samples were distributed as shown in Table 2.1. Each sampling site is shown in Figure 2.2 and the GPS locations are listed in Appendix 1. The samples were collected with a box dredge sampler, with a sample width of 180 mm, and a bite depth of about 75 mm, producing sample volumes of up to 4.5 L. The dredge was lowered to the seabed, towed to full and bought to surface for processing. If the sample volume was less than 3.75 L, the sample was discarded and repeated. Diver observation of the box dredge in operation (Figure 2.4) determined that the drag length to fill the box was in the order of 0.9 m.
Figure 2.4 Box dredge in operation and full retrieved sample Sieving large volumes of sandy material through 1 mm mesh sieves is time-consuming and produces large numbers of biota to identify and count, for little gain in understanding. Increasing the mesh size reduces the sample processing time and number of biota, but at the expense of not retaining some of the smaller species. Therefore, a combined approach has been adopted. A 200 mL subsample was taken from each sample and the material was screened over a 1 mm mesh screen and all material retained was transferred to a zip lock plastic bag, labelled and preserved in methylated spirits prior to later identification. The remainder of the box dredge sample was screened over a 3.15 mm mesh screen and all material retained was transferred to a zip lock plastic bag, labelled and preserved in methylated spirits prior to later identification. In both samples all animals were identified to the lowest possible taxonomic level and counted by Dr M. Jones. The differences in abundance and diversity measures between areas alongshore (North, Te Arai, South and Control) were statistically compared within each consent area by ANOVA, when data satisfied the assumptions of normality and equal variance, but were compared by the non-parametric equivalent Kruskall-Wallis when otherwise, using Sigmaplot 11.0. The comparison of diversity measures does not describe any changes in composition of benthic biota communities. A multivariate approach is required to test differences in species assemblages between the sample area groupings. Multivariate tests were conducted with the software PRIMER-E (version 7.0.13, Quest Research Ltd).
Assessment of Ecological Effects: For Sand Extraction from the Midshore Pakiri Embayment Assessment of Ecological Effects MBL Midshore Final v3 Final V3 4 September 2020 14
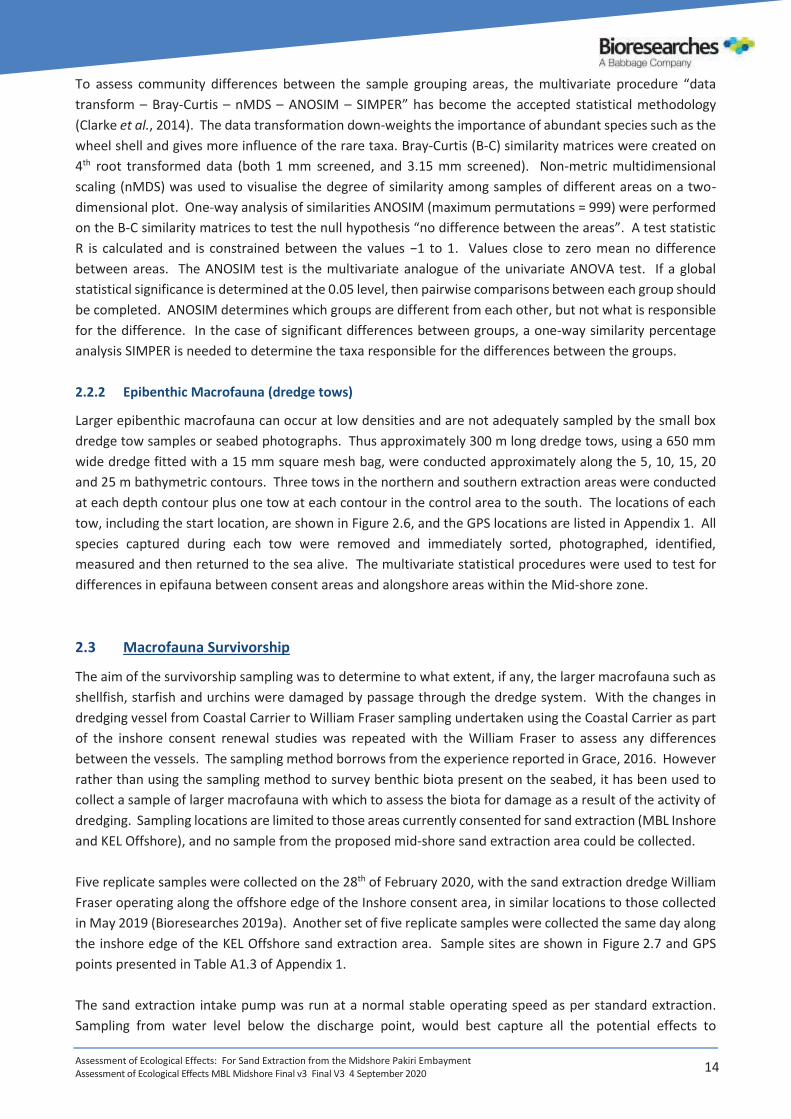
To assess community differences between the sample grouping areas, the multivariate procedure “data transform – Bray-Curtis – nMDS – ANOSIM – SIMPER” has become the accepted statistical methodology (Clarke et al., 2014). The data transformation down-weights the importance of abundant species such as the wheel shell and gives more influence of the rare taxa. Bray-Curtis (B-C) similarity matrices were created on 4th root transformed data (both 1 mm screened, and 3.15 mm screened). Non-metric multidimensional scaling (nMDS) was used to visualise the degree of similarity among samples of different areas on a two-dimensional plot. One-way analysis of similarities ANOSIM (maximum permutations = 999) were performed on the B-C similarity matrices to test the null hypothesis “no difference between the areas”. A test statistic R is calculated and is constrained between the values −1 to 1. Values close to zero mean no difference between areas. The ANOSIM test is the multivariate analogue of the univariate ANOVA test. If a global statistical significance is determined at the 0.05 level, then pairwise comparisons between each group should be completed. ANOSIM determines which groups are different from each other, but not what is responsible for the difference. In the case of significant differences between groups, a one-way similarity percentage analysis SIMPER is needed to determine the taxa responsible for the differences between the groups. 2.2.2 Epibenthic Macrofauna (dredge tows)
Larger epibenthic macrofauna can occur at low densities and are not adequately sampled by the small box dredge tow samples or seabed photographs. Thus approximately 300 m long dredge tows, using a 650 mm wide dredge fitted with a 15 mm square mesh bag, were conducted approximately along the 5, 10, 15, 20 and 25 m bathymetric contours. Three tows in the northern and southern extraction areas were conducted at each depth contour plus one tow at each contour in the control area to the south. The locations of each tow, including the start location, are shown in Figure 2.6, and the GPS locations are listed in Appendix 1. All species captured during each tow were removed and immediately sorted, photographed, identified, measured and then returned to the sea alive. The multivariate statistical procedures were used to test for differences in epifauna between consent areas and alongshore areas within the Mid-shore zone. 2.3 Macrofauna Survivorship
The aim of the survivorship sampling was to determine to what extent, if any, the larger macrofauna such as shellfish, starfish and urchins were damaged by passage through the dredge system. With the changes in dredging vessel from Coastal Carrier to William Fraser sampling undertaken using the Coastal Carrier as part of the inshore consent renewal studies was repeated with the William Fraser to assess any differences between the vessels. The sampling method borrows from the experience reported in Grace, 2016. However rather than using the sampling method to survey benthic biota present on the seabed, it has been used to collect a sample of larger macrofauna with which to assess the biota for damage as a result of the activity of dredging. Sampling locations are limited to those areas currently consented for sand extraction (MBL Inshore and KEL Offshore), and no sample from the proposed mid-shore sand extraction area could be collected. Five replicate samples were collected on the 28th of February 2020, with the sand extraction dredge William Fraser operating along the offshore edge of the Inshore consent area, in similar locations to those collected in May 2019 (Bioresearches 2019a). Another set of five replicate samples were collected the same day along the inshore edge of the KEL Offshore sand extraction area. Sample sites are shown in Figure 2.7 and GPS points presented in Table A1.3 of Appendix 1. The sand extraction intake pump was run at a normal stable operating speed as per standard extraction. Sampling from water level below the discharge point, would best capture all the potential effects to

Assessment of Ecological Effects: For Sand Extraction from the Midshore Pakiri Embayment Assessment of Ecological Effects MBL Midshore Final v3 Final V3 4 September 2020 15
macrofauna of passing through the dredge during normal operation. Due the design of the William Fraser this is not possible:
The lower end of the full overflow pipe discharges into a “well” and out under the hull. The volume of water being discharged under normal operating conditions makes sampling at the end
of the pipe unsafe. Sampling at the water surface in the “well” is not accessible.
Therefore, sampling methods differed from that used in the Inshore consent renewal study. A 1 m wide box net (Figure 2.5) with a 9 mm square mesh, was inserted flush with the top of the 2.5 mm screen, for approximately 5 to 10 seconds, in order to collect sufficient sample. The material collected on each net was retrieved, photographed, and all live macrofauna were collected, bagged with site labels and chilled prior to damage assessment on shore. Each sample was sorted by species and level of damage, the size of individuals was recorded or estimated depending on damage. Each individual was assigned a damage level following criterion based on Moschino et al., 2003. Three damage states were assessed:
“no damage” for intact fauna, “sub-lethal” for fauna with a small level of damage (shells with small chips), “lethal” for fauna with broken shells or parts of their body missing.
Individuals classified as having “no” and “sub-lethal” damage were defined as having survived passage through the dredge. Individuals classified as suffering “lethal” damage were either already dead or were unlikely to survive.
Figure 2.5 Sand and water pumped into the sieving system where sampling occurred (Left); and mesh basket used for sampling (right)
2.4 Literature Review on Fish
Fish occurrence in the bay was not studied directly, and information provided in that report was sourced from anecdotal observations recorded during previous surveys conducted by Grace (2005), and Bioresearches (2019b). This is presented in the Discussion section.
Assessment of Ecological Effects: For Sand Extraction from the Midshore Pakiri Embayment Assessment of Ecological Effects MBL Midshore Final v3 Final V3 4 September 2020 16
Figure 2.6 Location of epibenthic macrofauna dredge tows, 2019. North

Assessment of Ecological Effects: For Sand Extraction from the Midshore Pakiri Embayment Assessment of Ecological Effects MBL Midshore Final v3 Final V3 4 September 2020 17
Figure 2.6 Location of epibenthic macrofauna dredge tows, 2019. South

Assessment of Ecological Effects: For Sand Extraction from the Midshore Pakiri Embayment Assessment of Ecological Effects MBL Midshore Final v3 Final V3 4 September 2020 18
Figure 2.7 Location of Macrofauna Survivorship sample collection, 2020
Assessment of Ecological Effects: For Sand Extraction from the Midshore Pakiri Embayment Assessment of Ecological Effects MBL Midshore Final v3 Final V3 4 September 2020 19
2.5 Ecological Impact Assessment Methodology
In its simplest form, the Ecological Impact Assessment framework needs to include the following:
• Describe and assign value to ecological features and components potentially impacted • Describe and determine the magnitude of effects • Combine value and magnitude to assess the level of effect
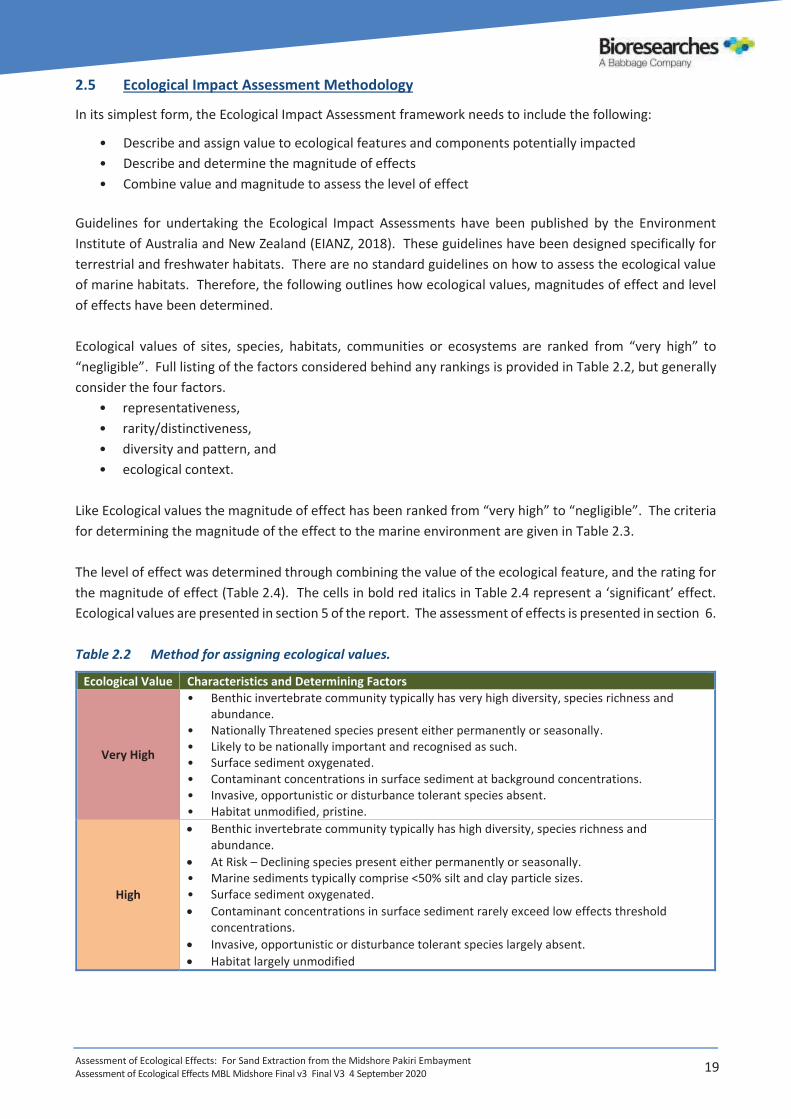
Guidelines for undertaking the Ecological Impact Assessments have been published by the Environment Institute of Australia and New Zealand (EIANZ, 2018). These guidelines have been designed specifically for terrestrial and freshwater habitats. There are no standard guidelines on how to assess the ecological value of marine habitats. Therefore, the following outlines how ecological values, magnitudes of effect and level of effects have been determined. Ecological values of sites, species, habitats, communities or ecosystems are ranked from “very high” to “negligible”. Full listing of the factors considered behind any rankings is provided in Table 2.2, but generally consider the four factors.
• representativeness, • rarity/distinctiveness, • diversity and pattern, and • ecological context.
Like Ecological values the magnitude of effect has been ranked from “very high” to “negligible”. The criteria for determining the magnitude of the effect to the marine environment are given in Table 2.3. The level of effect was determined through combining the value of the ecological feature, and the rating for the magnitude of effect (Table 2.4). The cells in bold red italics in Table 2.4 represent a ‘significant’ effect. Ecological values are presented in section 5 of the report. The assessment of effects is presented in section 6. Table 2.2 Method for assigning ecological values.
Ecological Value Characteristics and Determining Factors
Very High
• Benthic invertebrate community typically has very high diversity, species richness and abundance.
• Nationally Threatened species present either permanently or seasonally. • Likely to be nationally important and recognised as such. • Surface sediment oxygenated. • Contaminant concentrations in surface sediment at background concentrations. • Invasive, opportunistic or disturbance tolerant species absent. • Habitat unmodified, pristine.
High
Benthic invertebrate community typically has high diversity, species richness and abundance.
At Risk – Declining species present either permanently or seasonally. • Marine sediments typically comprise <50% silt and clay particle sizes. • Surface sediment oxygenated. Contaminant concentrations in surface sediment rarely exceed low effects threshold
concentrations. Invasive, opportunistic or disturbance tolerant species largely absent. Habitat largely unmodified

Assessment of Ecological Effects: For Sand Extraction from the Midshore Pakiri Embayment Assessment of Ecological Effects MBL Midshore Final v3 Final V3 4 September 2020 20
Ecological Value Characteristics and Determining Factors
Medium
• Benthic invertebrate community typically has moderate species richness, diversity and abundance.
• At Risk – Relict, Naturally Uncommon, Recovering species present either permanently or seasonally; and or Locally uncommon or distinctive species present.
• Benthic invertebrate community has both (organic enrichment and mud) tolerant and sensitive taxa present.
• Marine sediments typically comprise less than 50-70% silt and clay particle sizes. • Shallow depth of oxygenated surface sediment. • Contaminant concentrations in surface sediment generally below ISQG-high or ARC-red
effects threshold concentrations. • Few invasive, opportunistic or disturbance tolerant species present. • Habitat modification limited.
Low
• Benthic invertebrate community degraded with low species richness, diversity and abundance.
• Nationally and locally common indigenous species. • Benthic invertebrate community dominated by organic enrichment tolerant and mud
tolerant organisms with few/no sensitive taxa present. • Marine sediments dominated by silt and clay particle sizes. • Surface sediment predominantly anoxic (lacking oxygen). • Elevated contaminant concentrations in surface sediment, above ISQG-high or ARC-red
effects threshold concentrations. • Invasive, opportunistic or disturbance tolerant species dominant. • Habitat highly modified.
Negligible
• Benthic invertebrate community highly degraded with very low species richness, diversity and abundance.
• Invasive, opportunistic or disturbance tolerant species dominant. Exotic species including pests, species having recreational value.
• High contaminant concentrations in surface sediment, above ISQG-high or ARC-red effects threshold concentrations.
• Habitat entirely artificial. Table 2.3 Criteria for describing the magnitude of effects
Magnitude Description
Very High
Total loss of, or a very major alteration to, key elements/features of the existing baseline conditions, such that the post-development character, composition and/or attributes will be fundamentally changed and may be lost form the site altogether; AND/OR Loss of a very high proportion of the known population or range of the element/feature.
High Major loss of major alteration to key elements/features of the existing baseline conditions such that the post-development character, composition and/or attributes will be fundamentally changed; AND/OR Loss of a high proportion of the known population or range of the element/feature.
Moderate Loss or alteration to one or more key elements/features of the existing baseline conditions, such that the post-development character, composition and/or attributes will be partially changed; AND/OR Loss of a moderate proportion of the known population or range of the element/feature.
Minor
Minor shift away from existing baseline conditions. Change arising from the loss/alteration will be discernible, but underlying character, composition and/or attributes of the existing baseline condition will be similar to pre-development circumstances and patterns; AND/OR Having minor effect on the known population or range of the element/feature.
Negligible Very slight change from the existing baseline condition. Change barely distinguishable, approximating to the ‘no change’ situation; AND/OR Having negligible effect on the known population or range of the element/feature.

Assessment of Ecological Effects: For Sand Extraction from the Midshore Pakiri Embayment Assessment of Ecological Effects MBL Midshore Final v3 Final V3 4 September 2020 21
Table 2.4 Criteria for describing the level of effects
Ecological Value
Very High High Moderate Low Negligible
Mag
nitu
de
of E
ffect
Very High Very High Very High High Moderate Minor
High Very High Very High Moderate Minor Negligible
Moderate High High Moderate Minor Negligible
Minor Moderate Minor Minor Negligible Negligible
Negligible Minor Negligible Negligible Negligible Negligible
Positive Net Gain Net Gain Net Gain Net Gain Net Gain

Assessment of Ecological Effects: For Sand Extraction from the Midshore Pakiri EmbaymentAssessment of Ecological Effects MBL Midshore Final v3 Final V3 4 September 2020 22
3. RESULTS
3.1 Seabed Characteristics
3.1.1 Surficial Sediment Particle Size
The raw particle size data for each of the 118 sites sampled are presented in Table A2.4 of Appendix 2. The concrete method rather than the environmental method was used so that the data generated can be used to demonstrate suitability of the product to the industry requirements. With few exceptions, sediment in and adjacent to the proposed consented sand extraction areas were described as Sand (S), those that differed were described as slightly gravelly Sand ((g)S).
When the proximity to shore was considered, the consent areas show differing patterns of particle size distribution. The Mid-shore area consisted of approximately 26 to 40 % of fine sand (Figure 3.1). This was much less than the reported 58 to 59 % of fine sand in the Inshore area (current consent). The general pattern is that the proportion of larger sized sediment particles increased with greater depth (i.e. mediumsand of 21 to 30 % in Inshore, compared with 48 to 66 % in Midshore, and 50 to 74 % in Offshore). This pattern was also seen in the Control area.
Particle composition showed some difference alongshore with more fine sand in the Midshore Southern area (40 %) than in the Midshore Northern area (26 %) (Figure 3.1).
Figure 3.1 Sediment particle size composition, in consent areas and alongshore within the Midshore area.
3.1.2 Seabed Photographs
Seabed photographs from each of the photographic sites sampled in March 2019 are presented in Figure A3.8.1 and Figure A3.8.2 in Appendix 3. The GPS locations and depths of each photographic site together with comments on sediment composition, topography and biota are presented in Table A3.5 in Appendix 3.

Assessment of Ecological Effects: For Sand Extraction from the Midshore Pakiri Embayment Assessment of Ecological Effects MBL Midshore Final v3 Final V3 4 September 2020 23
The descriptive nature of the photographic data (Table A3.5) precludes statistical analysis. In general, the seabed micro topography and condition shows a pattern that varies with increased depth and distance from shore, of:
fine sand with irregular small or no ripples inshore of the Inshore consent areas, increasing sand size with shell debris and ripple size with depth, across the Inshore consent area, larger ripples but low or flat shape in areas deeper than the Inshore area.
No significant difference in surface biota was detected between consent areas (depth factor), and between North and South. 3.2 Benthic Fauna
3.2.1 Infauna
The raw benthic infauna data from each screen size are presented in Appendix 4. From all 118 stations sampled, the combined 1 mm and 3.15 mm screen data showed a total of 181 identified species/taxa and a total of 3683 individuals were counted. Within the proposed new sand extraction area and control sites (Midshore), 150 species/taxa were identified and a total of 1440 individuals were counted from the combined screens. A total of 73 species/taxa were identified in the 1 mm screen samples (320 individuals counted) and 132 species/taxa were identified in the 3.15 mm screen samples (1120 individuals counted). Of the 150 species/taxa identified, 18 were only recorded in the 1 mm screen samples and 77 only in the 3.15 mm screen samples, with the remaining 55 common to both screens. The abundance and diversity measures (species richness and the Shannon index) were calculated for each station and screen size and are summarised in Table 3.1. The statistical test results are presented in Appendix 6. All tests showed no statistical difference between the areas alongshore. Statistical differences were detected between the current consent area and the “Inshore between” for the 1 mm screen abundance and both diversity measures, and between the Offshore and “Inshore between” areas for the 1 mm screen abundances. No other statistically significant differences were detected (Appendix 6). The benthic biota data sets for both screens contain species/taxa, where only one individual was recorded from a single sample site. This has an adverse effect on the multivariate statistical analysis; thus, the data sets were reduced to taxa with 2 or greater individuals present. Those taxa excluded were then combined to higher taxa grouping and re-included in the data set providing more than 2 individuals were present. This data reduction resulted in data sets of 73 taxa from the 1 mm screen samples and 115 taxa from the 3.15 mm screen samples. Multivariate tests are presented in Appendix 6. The sample data were grouped according to alongshore areas (North, Te Arai, South, and Control), and consent areas, which were divided into current Inshore consent area (approx. 5 – 10 m depth), “inshore-between” area (approx. 10 – 15 m depth), proposed Midshore consent area (approx. 15 – 25 m depth), and Offshore area (approx. 25 – 30 m depth).

Assessment of Ecological Effects: For Sand Extraction from the Midshore Pakiri Embayment Assessment of Ecological Effects MBL Midshore Final v3 Final V3 4 September 2020 24
Table 3.1 Summary of Benthic Biota Population Statistics by offshore and alongshore areas for each Screen Size
Current Consent (Inshore) In between consent areas Alongshore Northern Southern Control All
1 mm Screen Average SD Average SD Average SD Average SD Average SD Number of Species / taxa 3.10 3.03 3.20 3.65 4.00 3.43 3.43 3.29 6.50 2.55 Number of Individuals 6.60 6.02 4.80 6.07 6.40 7.23 5.93 6.29 10.30 3.83 Shannon-Weiner Diversity Index 0.753 0.891 0.748 0.904 1.030 0.803 0.844 0.847 1.653 0.446 3 mm Screen Average SD Average SD Average SD Average SD Average SD Number of Species / taxa 7.00 3.40 10.30 11.13 6.90 4.86 8.07 7.21 12.00 10.21 Number of Individuals 20.50 13.22 50.90 74.49 13.70 10.86 28.37 45.64 30.30 34.10 Shannon-Weiner Diversity Index 1.522 0.760 1.572 1.009 1.447 0.712 1.514 0.809 1.886 0.664
Proposed New Consent Area (Midshore) Offshore of Proposed area Alongshore Northern Te Arai Southern Control All
1 mm Screen Average SD Average SD Average SD Average SD Average SD Average SD Number of Species / taxa 4.00 2.13 3.67 3.21 5.27 3.00 6.36 3.67 4.98 3.02 3.74 2.56 Number of Individuals 5.21 2.88 4.33 3.79 7.64 5.77 8.86 5.05 6.81 4.60 5.39 4.33 Shannon-Weiner Diversity Index 1.157 0.610 1.089 0.956 1.466 0.464 1.561 0.695 1.345 0.636 1.033 0.687 3 mm Screen Average SD Average SD Average SD Average SD Average SD Average SD Number of Species / taxa 8.58 7.31 9.67 1.15 13.55 12.65 8.64 7.43 9.83 8.70 8.65 5.31 Number of Individuals 16.32 18.19 18.00 2.65 35.27 51.02 26.29 32.93 23.83 32.57 20.68 15.26 Shannon-Weiner Diversity Index 1.604 0.785 2.060 0.182 1.996 0.800 1.481 0.704 1.688 0.755 1.619 0.680 3.2.1.1 Comparison between Consent areas
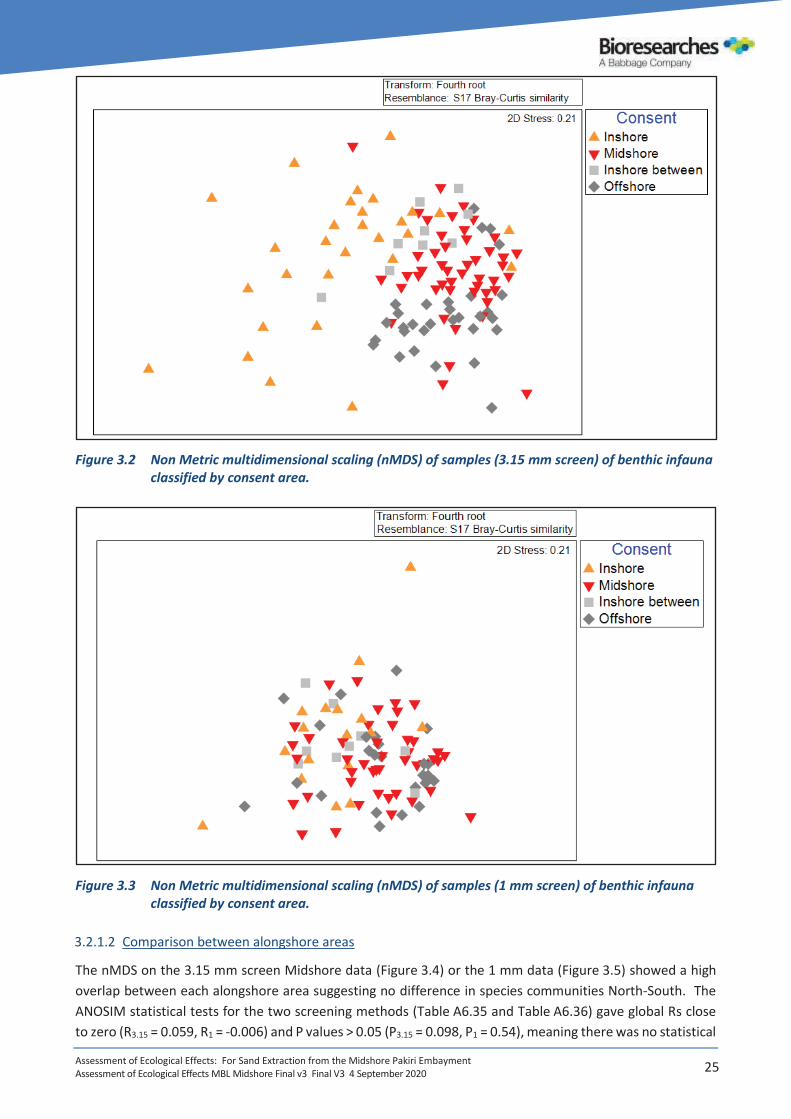
For each screen data set, benthic assemblages were compared between consent areas (Inshore, Inshore Between, Midshore, Offshore) to assess whether the Midshore area (proposed consent area) had different characteristics compared to adjacent areas. The nMDS plot on the 3.15 mm similarity matrix (see Method section 2.2.1) showed distinctive groupings with the consent areas and therefore water depth (Figure 3.2). Midshore samples overlapped with the Offshore samples suggesting similar communities while there was a clear distinction with the Inshore samples. The ANOSIM test confirmed these observations (Table A6.31; Global R = 0.317, Global P = 0.001), and further pairwise tests showed a stronger dissimilarity between Midshore and Inshore samples (RMid-In = 0.451) than between Midshore and Offshore samples (RMid-Off = 0.192). A SIMPER test (Table A6.32) revealed that dissimilarities were driven by the wheel shell (Zethalia), the sand dollar Fellaster, the lancelet Epigonichthys hectori, and the clams (Myadora and Dosinia), which were more abundant in the Inshore samples. The taxa characteristics of the Midshore samples were the polychaetes (Maldanidae), the speckled whelk Cominella quoyana and the amphipods Phoxocephalidae. These taxa were also dominant in the Offshore samples. The particularity of the Offshore samples compared to Midshore was the presence of the Turritellid Striacolpus pagoda. With the 1 mm screen method, species communities showed weak differences compared to the 3.15 mm screen method (Table A6.33; ANOSIM, Global R = 0.092, Global P = 0.008). Pairwise tests revealed a significant variation only between Inshore and Midshore samples (RMid-In = 0.204, PMid-In = 0.003) and between Inshore and Offshore samples (RMid-In = 0.200, PMid-In = 0.001). The nMDS plot showed the high overlap between area groupings (Figure 3.3).
Assessment of Ecological Effects: For Sand Extraction from the Midshore Pakiri Embayment Assessment of Ecological Effects MBL Midshore Final v3 Final V3 4 September 2020 25
Figure 3.2 Non Metric multidimensional scaling (nMDS) of samples (3.15 mm screen) of benthic infauna classified by consent area.
Figure 3.3 Non Metric multidimensional scaling (nMDS) of samples (1 mm screen) of benthic infauna classified by consent area.
3.2.1.2 Comparison between alongshore areas
The nMDS on the 3.15 mm screen Midshore data (Figure 3.4) or the 1 mm data (Figure 3.5) showed a high overlap between each alongshore area suggesting no difference in species communities North-South. The ANOSIM statistical tests for the two screening methods (Table A6.35 and Table A6.36) gave global Rs close to zero (R3.15 = 0.059, R1 = -0.006) and P values > 0.05 (P3.15 = 0.098, P1 = 0.54), meaning there was no statistical

Assessment of Ecological Effects: For Sand Extraction from the Midshore Pakiri Embayment Assessment of Ecological Effects MBL Midshore Final v3 Final V3 4 September 2020 26
difference between the North, South, Te Arai and Control area within the proposed new consent midshore zone.
Figure 3.4 Non Metric multidimensional scaling (nMDS) of Midshore samples (3.15 mm screen) of
benthic fauna classified by alongshore area.
Figure 3.5 Non Metric multidimensional scaling (nMDS) of Midshore samples (1 mm screen) of benthic
fauna classified by alongshore area.
Assessment of Ecological Effects: For Sand Extraction from the Midshore Pakiri Embayment Assessment of Ecological Effects MBL Midshore Final v3 Final V3 4 September 2020 27
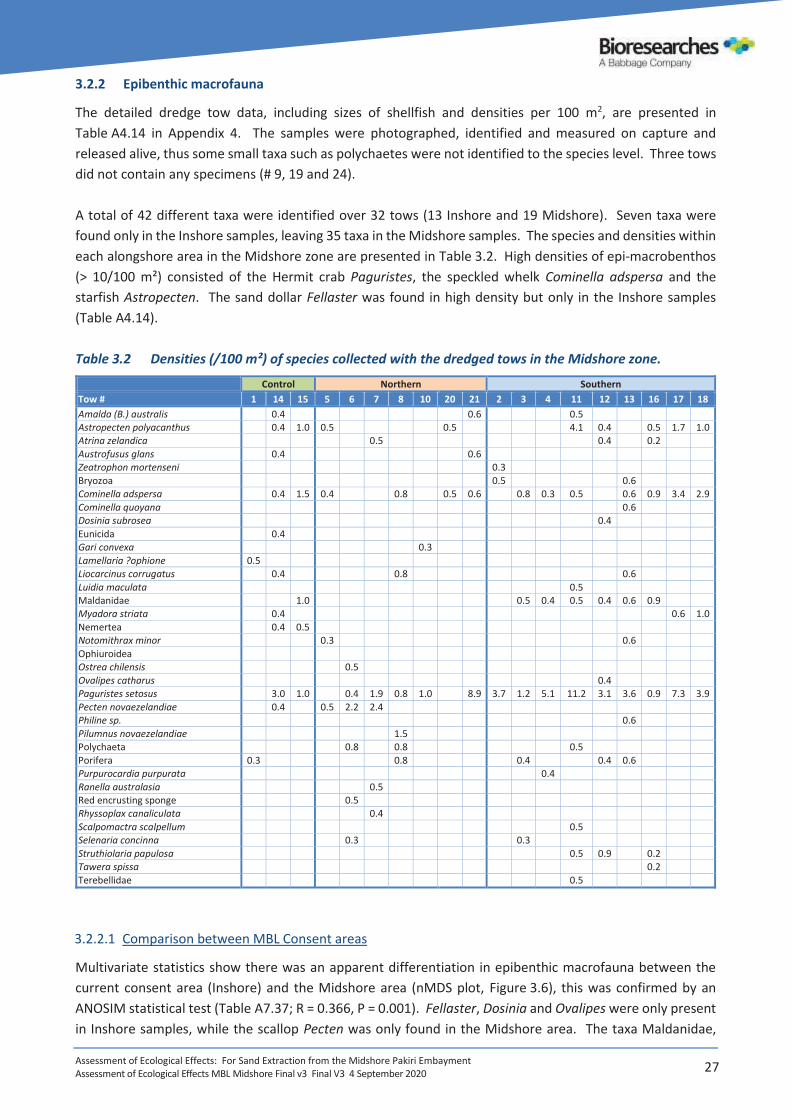
3.2.2 Epibenthic macrofauna
The detailed dredge tow data, including sizes of shellfish and densities per 100 m2, are presented in Table A4.14 in Appendix 4. The samples were photographed, identified and measured on capture and released alive, thus some small taxa such as polychaetes were not identified to the species level. Three tows did not contain any specimens (# 9, 19 and 24). A total of 42 different taxa were identified over 32 tows (13 Inshore and 19 Midshore). Seven taxa were found only in the Inshore samples, leaving 35 taxa in the Midshore samples. The species and densities within each alongshore area in the Midshore zone are presented in Table 3.2. High densities of epi-macrobenthos (> 10/100 m²) consisted of the Hermit crab Paguristes, the speckled whelk Cominella adspersa and the starfish Astropecten. The sand dollar Fellaster was found in high density but only in the Inshore samples (Table A4.14). Table 3.2 Densities (/100 m²) of species collected with the dredged tows in the Midshore zone. Control Northern Southern Tow # 1 14 15 5 6 7 8 10 20 21 2 3 4 11 12 13 16 17 18 Amalda (B.) australis 0.4 0.6 0.5 Astropecten polyacanthus 0.4 1.0 0.5 0.5 4.1 0.4 0.5 1.7 1.0 Atrina zelandica 0.5 0.4 0.2 Austrofusus glans 0.4 0.6 Zeatrophon mortenseni 0.3 Bryozoa 0.5 0.6 Cominella adspersa 0.4 1.5 0.4 0.8 0.5 0.6 0.8 0.3 0.5 0.6 0.9 3.4 2.9 Cominella quoyana 0.6 Dosinia subrosea 0.4 Eunicida 0.4 Gari convexa 0.3 Lamellaria ?ophione 0.5 Liocarcinus corrugatus 0.4 0.8 0.6 Luidia maculata 0.5 Maldanidae 1.0 0.5 0.4 0.5 0.4 0.6 0.9 Myadora striata 0.4 0.6 1.0 Nemertea 0.4 0.5 Notomithrax minor 0.3 0.6 Ophiuroidea Ostrea chilensis 0.5 Ovalipes catharus 0.4 Paguristes setosus 3.0 1.0 0.4 1.9 0.8 1.0 8.9 3.7 1.2 5.1 11.2 3.1 3.6 0.9 7.3 3.9 Pecten novaezelandiae 0.4 0.5 2.2 2.4 Philine sp. 0.6 Pilumnus novaezelandiae 1.5 Polychaeta 0.8 0.8 0.5 Porifera 0.3 0.8 0.4 0.4 0.6 Purpurocardia purpurata 0.4 Ranella australasia 0.5 Red encrusting sponge 0.5 Rhyssoplax canaliculata 0.4 Scalpomactra scalpellum 0.5 Selenaria concinna 0.3 0.3 Struthiolaria papulosa 0.5 0.9 0.2 Tawera spissa 0.2 Terebellidae 0.5
3.2.2.1 Comparison between MBL Consent areas
Multivariate statistics show there was an apparent differentiation in epibenthic macrofauna between the current consent area (Inshore) and the Midshore area (nMDS plot, Figure 3.6), this was confirmed by an ANOSIM statistical test (Table A7.37; R = 0.366, P = 0.001). Fellaster, Dosinia and Ovalipes were only present in Inshore samples, while the scallop Pecten was only found in the Midshore area. The taxa Maldanidae,

Assessment of Ecological Effects: For Sand Extraction from the Midshore Pakiri Embayment Assessment of Ecological Effects MBL Midshore Final v3 Final V3 4 September 2020 28
Cominella, Paguristes, and Astropecten were present in both current Inshore and proposed Midshore consent areas, but their densities were higher in the deeper Midshore zone, driving the differences between the two areas (SIMPER test in Table A7.38).
Figure 3.6 Non Metric multidimensional scaling (nMDS) of epibenthic macrofauna classified by consent area. The numbers represent the tow codes.
3.2.2.2 Comparison between alongshore areas
As with infauna samples, variation in epibenthic macrofauna was weaker alongshore (nMDS plot in Figure 3.7; ANOSIM in Table A7.39, Global R = 0.123, P = 0.047). Tow samples in the Control area showed a high dispersion in the nMDS plot. Dissimilarities between samples were mostly between the Northern and Southern regions with scallops only in the North. The Southern region showed higher densities by at least 2-fold of Hermit’s crabs, Cominella and Astropecten than that in the North (Table A7.40).

Assessment of Ecological Effects: For Sand Extraction from the Midshore Pakiri Embayment Assessment of Ecological Effects MBL Midshore Final v3 Final V3 4 September 2020 29
Figure 3.7 Non Metric multidimensional scaling (nMDS) of epibenthic macrofauna classified by alongshore area. The numbers represent the tow codes.
3.3 Macrofauna Survivorship
The macrofauna collected from the screening deck on the William Fraser were sorted by species and by state of damage (none, sub lethal and lethal), counted (Table A5.15), measured (Table A5.16 and Table A5.17) and photographed (Table A5.18). 3.3.1 Numbers of Individuals
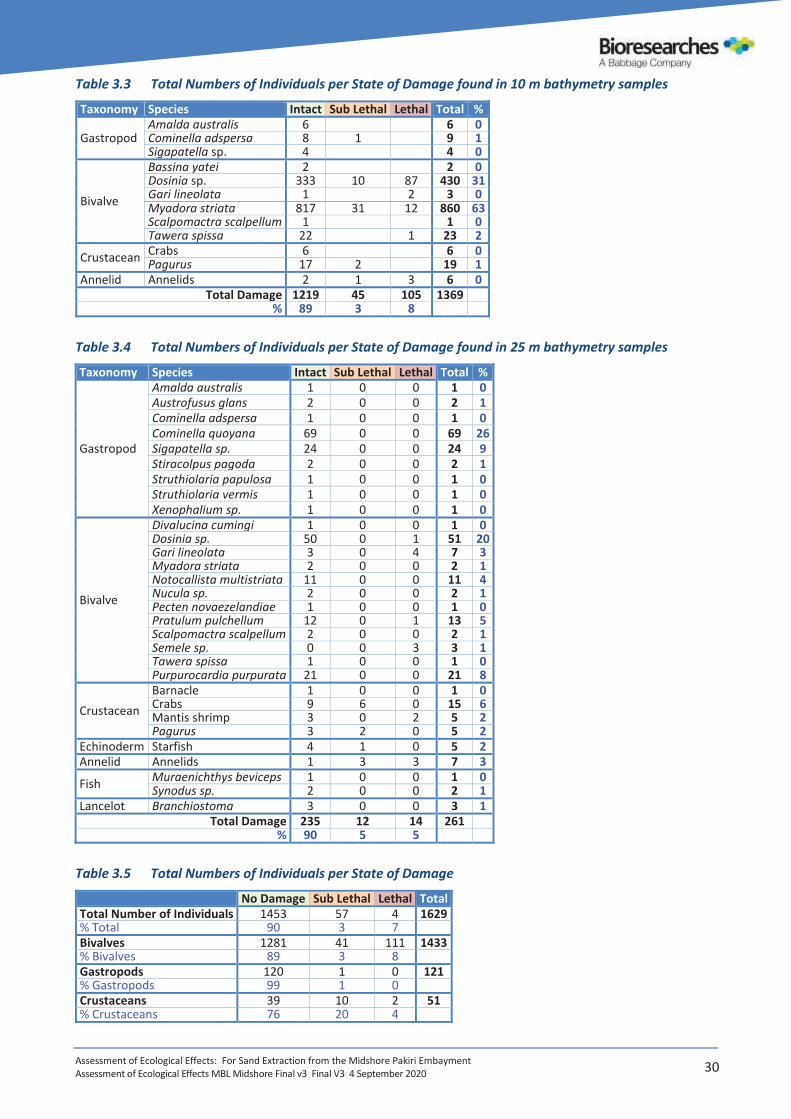
The five samples collected at a 10 m bathymetry contained approximately 10 times more individuals than that found at a 25 m bathymetry (1369 individuals at 10 m, Table 3.3; 261 individuals at 25 m, Table 3.4), but the biodiversity was poor at 10 m compared to the fauna pumped at 25 m. This is reflective of the different communities living at these two depths, rather than any dredge related effects. The most common taxum represented in the dredge discharge at both bathymetries was the surf clam Dosinia sp. (31% at 10 m; 20% at 25 m). Myadora striata, represented more than half of the fauna in the 10 m samples. The other taxa found were gastropods, a few crabs and shrimps, annelids, fish and echinoderms (the last four taxa in the 25 m only). With both sets of bathymetry data combined, 93% of individuals recorded no damage or had survivable damage (Table 3.5). When the numbers of individuals were divided by taxonomic group, differences were notable with the gastropods suffering no lethal damage. The bulk of Bivalves and Crustaceans found in the samples survived the dredging process with little or no damage (more than 90%).
Assessment of Ecological Effects: For Sand Extraction from the Midshore Pakiri Embayment Assessment of Ecological Effects MBL Midshore Final v3 Final V3 4 September 2020 30
Table 3.3 Total Numbers of Individuals per State of Damage found in 10 m bathymetry samples
Taxonomy Species Intact Sub Lethal Lethal Total %
Gastropod Amalda australis 6 6 0 Cominella adspersa 8 1 9 1 Sigapatella sp. 4 4 0
Bivalve
Bassina yatei 2 2 0 Dosinia sp. 333 10 87 430 31 Gari lineolata 1 2 3 0 Myadora striata 817 31 12 860 63 Scalpomactra scalpellum 1 1 0 Tawera spissa 22 1 23 2
Crustacean Crabs 6 6 0 Pagurus 17 2 19 1
Annelid Annelids 2 1 3 6 0 Total Damage 1219 45 105 1369
% 89 3 8 Table 3.4 Total Numbers of Individuals per State of Damage found in 25 m bathymetry samples
Taxonomy Species Intact Sub Lethal Lethal Total %
Gastropod
Amalda australis 1 0 0 1 0 Austrofusus glans 2 0 0 2 1 Cominella adspersa 1 0 0 1 0 Cominella quoyana 69 0 0 69 26 Sigapatella sp. 24 0 0 24 9 Stiracolpus pagoda 2 0 0 2 1 Struthiolaria papulosa 1 0 0 1 0 Struthiolaria vermis 1 0 0 1 0 Xenophalium sp. 1 0 0 1 0
Bivalve
Divalucina cumingi 1 0 0 1 0 Dosinia sp. 50 0 1 51 20 Gari lineolata 3 0 4 7 3 Myadora striata 2 0 0 2 1 Notocallista multistriata 11 0 0 11 4 Nucula sp. 2 0 0 2 1 Pecten novaezelandiae 1 0 0 1 0 Pratulum pulchellum 12 0 1 13 5 Scalpomactra scalpellum 2 0 0 2 1 Semele sp. 0 0 3 3 1 Tawera spissa 1 0 0 1 0 Purpurocardia purpurata 21 0 0 21 8
Crustacean Barnacle 1 0 0 1 0 Crabs 9 6 0 15 6 Mantis shrimp 3 0 2 5 2 Pagurus 3 2 0 5 2
Echinoderm Starfish 4 1 0 5 2 Annelid Annelids 1 3 3 7 3
Fish Muraenichthys beviceps 1 0 0 1 0 Synodus sp. 2 0 0 2 1
Lancelot Branchiostoma 3 0 0 3 1 Total Damage 235 12 14 261
% 90 5 5 Table 3.5 Total Numbers of Individuals per State of Damage
No Damage Sub Lethal Lethal Total Total Number of Individuals 1453 57 4 1629 % Total 90 3 7 Bivalves 1281 41 111 1433 % Bivalves 89 3 8 Gastropods 120 1 0 121 % Gastropods 99 1 0 Crustaceans 39 10 2 51 % Crustaceans 76 20 4
Assessment of Ecological Effects: For Sand Extraction from the Midshore Pakiri EmbaymentAssessment of Ecological Effects MBL Midshore Final v3 Final V3 4 September 2020 31
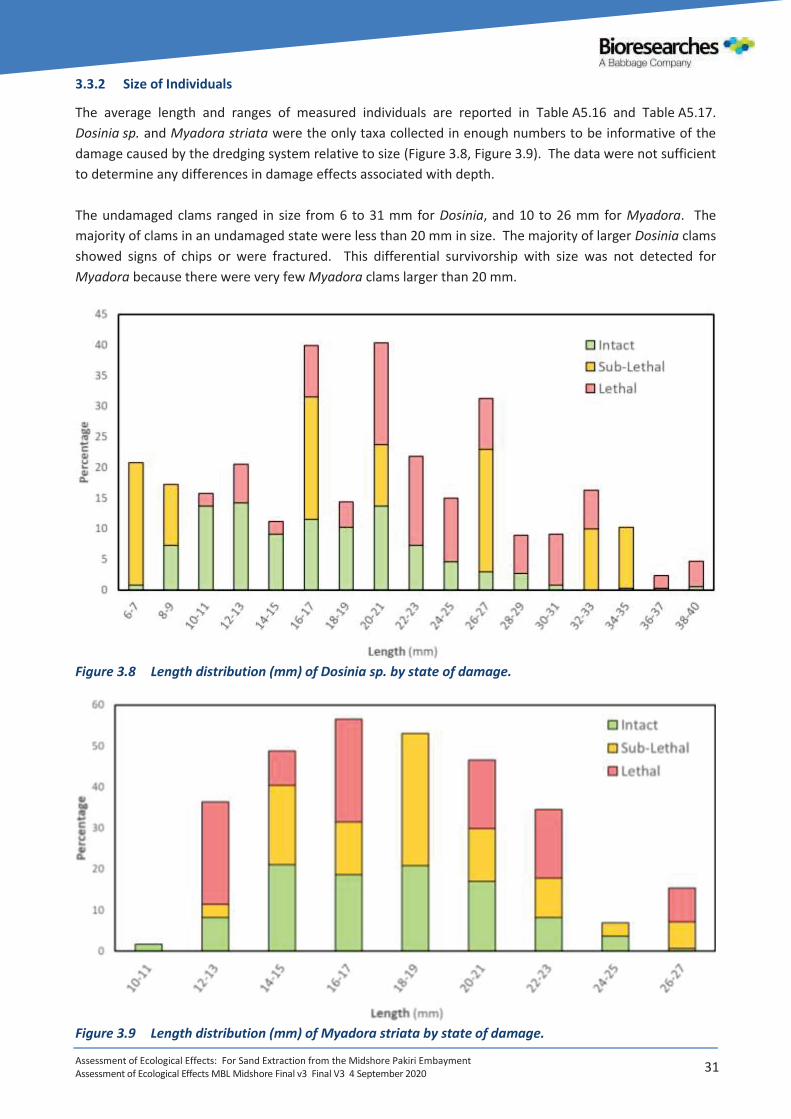
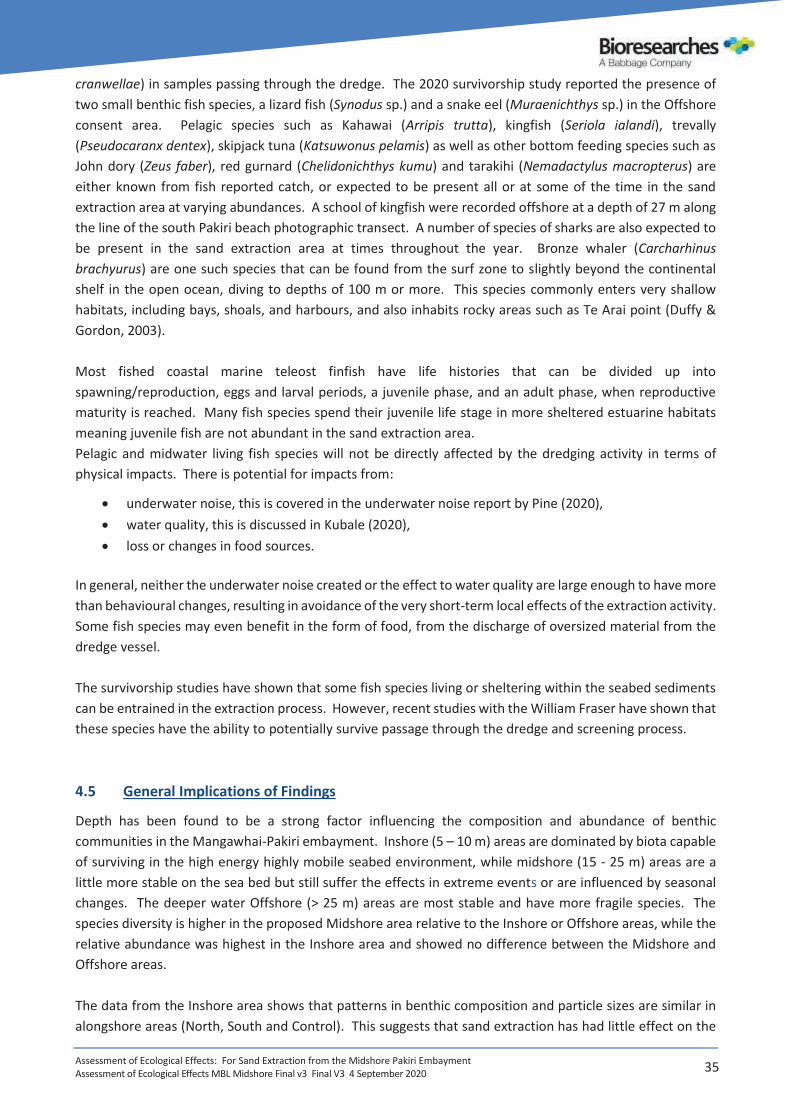
3.3.2 Size of Individuals
The average length and ranges of measured individuals are reported in Table A5.16 and Table A5.17.Dosinia sp. and Myadora striata were the only taxa collected in enough numbers to be informative of the damage caused by the dredging system relative to size (Figure 3.8, Figure 3.9). The data were not sufficient to determine any differences in damage effects associated with depth.
The undamaged clams ranged in size from 6 to 31 mm for Dosinia, and 10 to 26 mm for Myadora. The majority of clams in an undamaged state were less than 20 mm in size. The majority of larger Dosinia clams showed signs of chips or were fractured. This differential survivorship with size was not detected for Myadora because there were very few Myadora clams larger than 20 mm.
Figure 3.8 Length distribution (mm) of Dosinia sp. by state of damage.
Figure 3.9 Length distribution (mm) of Myadora striata by state of damage.

Assessment of Ecological Effects: For Sand Extraction from the Midshore Pakiri Embayment Assessment of Ecological Effects MBL Midshore Final v3 Final V3 4 September 2020 32
4. DISCUSSION
4.1 Seabed Characteristics
4.1.1 Surficial Sediment Particle Size
None of the samples recorded the presence of gravel sized particles or silt and clay sized particles, this is due to the sampling methodology, which focused on processing benthic fauna. Pre-sieving the sample through a 3.15 mm sieve, removed the gravel sized particles from the sediment tested. Silt and clay sized particles are also likely to have been removed from the tested sample in the pre-sieving process by washing through and out. For the sediment tested the size of sediment particles varied with the depth, with larger particles in deeper waters. This gradient in sediment particle size across the shore from 5 to 30 m depth, was seen in areas which have had sand extraction Inshore (Northern and Southern), but also in the Control zone where no sand extraction has occurred. This suggests that sand extraction is not likely to alter the sediment particle size composition. The sediments in the proposed Midshore sand extraction area were largely (59 %) of medium sand size (0.3 – 0.6 mm diameter) with a further average 31 % made up of fine sand (0.15 – 0.3 mm diameter). The remaining 10 % was distributed relatively evenly either larger or smaller. The differences alongshore within the proposed Midshore area were relatively minor with less medium sand in the Southern area (47 %) compared to the Northern area (66 %) and more fine sand in the Southern area (40 %) compared with the Northern area (26 %), meaning the total of medium and fine sand ranged from 92 % in the Northern area to 87 % in the Southern area. 4.1.2 Seabed Photographs
Based on the photographic evidence collected in the Midshore areas, the seabed is relatively homogeneous in appearance, with some minor suggestion of more shell present in the deeper areas. 4.2 Benthic Fauna
4.2.1 Methodology Differences
Both screening methods (1 mm and 3.15 mm) using the box dredge are complementary to each other by representing different communities in the benthos. Indeed, amphipods, isopods and several polychaete species were only present when the 1 mm sieve was used. The dredge tow, by contrast, is a technique limited to collecting large individuals such as molluscs, crabs and echinoderms. For instance, the scallop Pecten, the starfish Astropecten, and the swimming crab Ovalipes, were only recorded with the dredge tow. This highlights the necessity to use a range of methods to quantify species presence/absence and abundance when surveying soft sediment habitats. The 3.15 mm mesh size was chosen as this was the mesh size use on the sand extraction vessel Coastal Carrier at the time of the sampling in early 2019. Thus, those biota larger than 3.15 mm would pass through the oversize discharge and be returned to the sea. Post sampling the sand extraction vessel has changed to the William Fraser which uses a 2.5 mm mesh, those biota larger than 3.15 mm will still be returned to the sea. 4.2.2 Midshore Benthic Community
Within the proposed Midshore consent area the combined infuana samples showed the biota was

Assessment of Ecological Effects: For Sand Extraction from the Midshore Pakiri Embayment Assessment of Ecological Effects MBL Midshore Final v3 Final V3 4 September 2020 33
numerically dominated by the polychaete worms Maldanidae and Capitellidae, hermit crabs, Phoxocephalidae amphipods, the bivalves Nucula and Myadora, the gastropods Striacolpus and Cominella, foraminifera, and the Lancelet Epigonichthys hectori. The community is comprised of 30 species of polychaetes, 10 species of amphipods 10 species of decapods, with 16 additional crustacea, 22 gastropods, 27 bivalves, 7 echinoderms, 4 sponges and 12 other species form a range of taxa groupings, to make a total diversity of 139 species or taxa. 4.2.3 Differences in Benthic Communities Alongshore
Alongshore, the benthic infauna was similar within the box dredge samples for both screening methods. Differences were found between the Northern and the Southern areas only when the dredge tow was used. Scallops were only found in the Northern Midshore area while Hermit’s crabs, starfish, and Cominella were more abundant in the Southern Midshore area. 4.2.4 Differences in Benthic Communities Between Consent Areas (depth)
Benthic infauna in the Midshore area had a different assemblage of species than that found in the Inshore and Offshore areas. This was observed in both screening methods and for dredge tows. Differences were however weaker with the 1 mm screening method, suggesting differences were mostly driven by large taxa. Considering all methods, Midshore samples were characterised by higher densities of Maldanidae, the whelk Cominella, scallops and starfish. These taxa were also present in the Offshore area but in lower densities. The Inshore area consisted of taxa specific to shallow depths such as sand dollars, the Wheel shell Zethalia, the lancelet, and clams Myadora and Dosinia. This inshore assemblage is consistent with previous reports from Hilton (1990) and Grace (1991), and the effects of sand extraction on the current Inshore consent area were discussed in Bioresearches, 2019a. 4.3 Macrofauna Survivorship
Ninety three percent of benthic macrofauna individuals sampled, were deemed to have survived the pumping and screen system on the William Fraser. A similar study was carried out with the previous vessel, the Coastal Carrier, in which the bivalves suffered more damage, with an estimated survivorship of fifty five percent (Bioresearches, 2019a). The improved survivorship of macrofauna could be the result of the shallower profile of the William Fraser’s drag head on the seabed, which does not extract the larger biota, buried deeper in the sand and / or an increase in the size of the pump. As part of monitoring studies in the Kaipara harbour Grace (Grace, 2016) found that an increase in the pump size resulted in greater survivorship of shellfish entrained. Additionally, many larger burrowing worms and crustaceans were found to not be entrained during the extraction process. It is likely with their burrows being deeper than the deepest extraction depth of 120 mm, they somehow manage to remain in – situ, thus they survive the passage of the dredge.

Assessment of Ecological Effects: For Sand Extraction from the Midshore Pakiri Embayment Assessment of Ecological Effects MBL Midshore Final v3 Final V3 4 September 2020 34
Figure 4.1 Seabed immediately post dredging showing worms and stomatopods still present in the dredge path.
As with the earlier study there were differences between the taxa groupings of gastropods, bivalves and crustaceans. It is hypothesised gastropods have harder more robust shells in a structurally stronger shape, than the thinner more fragile shelled bivalves in a weaker flat plane, resulting in the fewer occurrences of damage in gastropods. Similarly, more fragile macrofauna such as crustaceans and annelids are likely to suffer more damage than more robust biota such as molluscs as they lack the protection of the shells. However, even fragile taxa were found to pass through the new dredge of the William Fraser with mostly no damage detected. It is unknown whether all the biota passing through the screening deck were recovered. It is possible that some biota may have been completely disassembled beyond recognition, or into fragments too small to be retained and thus excluded from the assessment, however there was no evidence of this occurring. When the sizes of biota were cross referenced with damage the data showed, large bivalves seem to be more susceptible to damage when extracted than smaller bivalves. For the Dosinia clam, individuals larger than 20 mm suffered more damage than the smaller individuals. These results are consistent with the previous survivorship study on the Coastal Carrier. In the present study, only two bivalve taxa could be tested for differences of survivorship with size, as the other taxa were not found in enough numbers. Individuals classified as having “no” and “sub-lethal” damage were defined as having survived passage through the dredge. There is still a possibility that they could suffer predation by fish on their descent to the seabed and prior to their reburial in the seabed sediments. The new pump system in the William Fraser is likely to reduce the risk of predation as the waste material is rejected under the boat, and not on the side as for the Coastal Carrier. Only larger macrofauna greater than about 10 mm were able to be assessed for damage and survivorship. The survivability of the much smaller infaunal species retained on the 3.15 mm biota sieves as discussed in section 4.2, were not able to be assessed. However, it is hypothesised that an unknown proportion of this biota will have survived passage through the dredge and screening. The biota is small and in part fragile, so there is greater threat of opportune predation on its return passage to the seabed. 4.4 Fish Review
Very few surveys of fish community composition have been undertaken in the region of the sand extraction areas. Snapper (Pagrus auratus), Red gurnard (Chelidonichthys kumu) and blue cod (Parapercis colias) are known to be present further offshore (Bioresearches, 2019b) and are likely to occur in the sand extraction area. Grace (2005) reported the presence of sole (Peltorhamphus novaezeelandiae) and sand divers (Tewara
Assessment of Ecological Effects: For Sand Extraction from the Midshore Pakiri Embayment Assessment of Ecological Effects MBL Midshore Final v3 Final V3 4 September 2020 35
cranwellae) in samples passing through the dredge. The 2020 survivorship study reported the presence of two small benthic fish species, a lizard fish (Synodus sp.) and a snake eel (Muraenichthys sp.) in the Offshore consent area. Pelagic species such as Kahawai (Arripis trutta), kingfish (Seriola ialandi), trevally (Pseudocaranx dentex), skipjack tuna (Katsuwonus pelamis) as well as other bottom feeding species such as John dory (Zeus faber), red gurnard (Chelidonichthys kumu) and tarakihi (Nemadactylus macropterus) are either known from fish reported catch, or expected to be present all or at some of the time in the sand extraction area at varying abundances. A school of kingfish were recorded offshore at a depth of 27 m along the line of the south Pakiri beach photographic transect. A number of species of sharks are also expected to be present in the sand extraction area at times throughout the year. Bronze whaler (Carcharhinus brachyurus) are one such species that can be found from the surf zone to slightly beyond the continental shelf in the open ocean, diving to depths of 100 m or more. This species commonly enters very shallow habitats, including bays, shoals, and harbours, and also inhabits rocky areas such as Te Arai point (Duffy & Gordon, 2003). Most fished coastal marine teleost finfish have life histories that can be divided up into spawning/reproduction, eggs and larval periods, a juvenile phase, and an adult phase, when reproductive maturity is reached. Many fish species spend their juvenile life stage in more sheltered estuarine habitats meaning juvenile fish are not abundant in the sand extraction area. Pelagic and midwater living fish species will not be directly affected by the dredging activity in terms of physical impacts. There is potential for impacts from:
underwater noise, this is covered in the underwater noise report by Pine (2020), water quality, this is discussed in Kubale (2020), loss or changes in food sources.
In general, neither the underwater noise created or the effect to water quality are large enough to have more than behavioural changes, resulting in avoidance of the very short-term local effects of the extraction activity. Some fish species may even benefit in the form of food, from the discharge of oversized material from the dredge vessel. The survivorship studies have shown that some fish species living or sheltering within the seabed sediments can be entrained in the extraction process. However, recent studies with the William Fraser have shown that these species have the ability to potentially survive passage through the dredge and screening process. 4.5 General Implications of Findings
Depth has been found to be a strong factor influencing the composition and abundance of benthic communities in the Mangawhai-Pakiri embayment. Inshore (5 – 10 m) areas are dominated by biota capable of surviving in the high energy highly mobile seabed environment, while midshore (15 - 25 m) areas are a little more stable on the sea bed but still suffer the effects in extreme events or are influenced by seasonal changes. The deeper water Offshore (> 25 m) areas are most stable and have more fragile species. The species diversity is higher in the proposed Midshore area relative to the Inshore or Offshore areas, while the relative abundance was highest in the Inshore area and showed no difference between the Midshore and Offshore areas. The data from the Inshore area shows that patterns in benthic composition and particle sizes are similar in alongshore areas (North, South and Control). This suggests that sand extraction has had little effect on the

Assessment of Ecological Effects: For Sand Extraction from the Midshore Pakiri Embayment Assessment of Ecological Effects MBL Midshore Final v3 Final V3 4 September 2020 36
benthos in the Inshore environment. The commonality in benthic composition between the Inshore and Midshore areas suggests a similar lack of effects would be likely in the proposed Midshore area. The disturbance and removal of sand by dredging of any kind results in the loss of benthic habitat along with infaunal and epifaunal organisms. The depth of the dredge profile has a significant influence on how the benthic community is impacted. Empirically, different biota from different functional groups have different preferences and abilities to live at different depths within the sediments. Predatory species (Cominella) or surface deposit feeders live on the surface of the sediment as they need to move around to find food, some have the ability to bury themselves just below the sediment surface and some live at varying depths in burrows they create. While other biota such as filter feeders permanently live on the sediment surface or buried within the sediment at varying depths, sending up siphon tubes to suck water and food to them. The depths within the sediment at which they live is dependent on the length of siphon they possess. Polychaete worms and crustacea have similar functional groupings with a range of within-sediment living depths. Dernie et al (2003) reported that sediment disturbances to deeper depths (20 cm) took longer to recover than areas of shallower (10 cm) sediment disturbance. Therefore, a shallow disturbance dredge profile, will not only affect fewer species, but likely result in faster recovery times from the disturbance. The benthic community in the sand extraction area is seasonally subjected to the settlement of juvenile biota from planktonic larvae and constantly subjected to the migration of biota from adjacent habitats. The initial step towards recovery of local bottom topography and benthos occurs through slumping and slope re-equilibration of the sides of the dredge depressions (Cooper, et al. 2007). Lateral migration of juvenile and adult benthic organisms into the dredged depression may help accelerate recolonization (Brooks, et al. 2004, 2006). The majority of benthic biological recovery occurs through subsequent larval settlement and interactive community development, analogous to recovery from other mass perturbations of seafloor sediments and benthos at these depths where sand extraction occurs.

Assessment of Ecological Effects: For Sand Extraction from the Midshore Pakiri Embayment Assessment of Ecological Effects MBL Midshore Final v3 Final V3 4 September 2020 37
5. ECOLOGICAL VALUES
5.1 Benthic Habitat and Fauna
The proposed Midshore consent area has an assemblage of species similar to the Offshore area, but at different densities. Scallops represent the only taxa with moderate ecological and high commercial value but were found in low numbers. No invasive species were recorded as present. Based on the sparse populations of biota of nationally and locally common species, with no “At Risk” species, the benthic biota faunal community is ascribed a classification of low to moderate ecological value. The low ecological value is due to low abundance of nationally and locally common species, while the diversity of 150 taxa and lack of invasive species suggests an ecological value of moderate. 5.2 Fish
Fish are more mobile than the benthic biota therefore a wider area was considered. The fish identified as present within the Pakiri embayment were all typical of the region. These include a number of economically important species such as Snapper, Red gurnard, Blue cod, Kahawai, Kingfish, Trevally, John Dory and Tarakihi. None of these species are likely to be directly killed or negatively impacted by the sand extraction process. Many of these species can be found around the dredge while it is in operation and are clearly taking advantage of the opportunity for an easy meal. Therefore, the dredge has a potentially positive effect on fish present in the area providing easier access to food. Based on the sparse populations of fish of nationally and locally common species, the fish community is ascribed a classification of low ecological value. 5.3 Summary of Ecological Values
The sand extraction area represents habitat typical of the wider outer Hauraki Gulf and north eastern New Zealand. That is, dynamic, mobile sediments supporting common, opportunistic benthic fauna; and a fish community containing common nearshore species. Less common fish species may pass through the area. However, they are considered to be vagrant and therefore not part of the fish community. Table 5.1 provides a summary of ecological values for the marine environment using the criteria described in Table 2.2. The values of Birds and Marine Mammals are covered by separate reports (Thompson, 2020, Clement and Johnston, 2020). Table 5.1 Summary of ecological values within the sand extraction area and surrounding areas
Component Value Comments
Benthic Fauna Low – Moderate
Species adapted to the high energy environment. Benthic fauna was sparse but moderately diverse. Benthic community has an ecological function as a food resource for the fish community.
Benthic Habitat Low Benthic habitat dominated by mobile substrates typical of the shallow outer Hauraki Gulf area as well as wider north east coast of North Island. The habitat does not provide protection for sensitive life stages.
Fish Low Species that frequent the area are locally common, present within the Hauraki Gulf area. Most species widely distributed around New Zealand.
Assessment of Ecological Effects: For Sand Extraction from the Midshore Pakiri Embayment Assessment of Ecological Effects MBL Midshore Final v3 Final V3 4 September 2020 38
6. ASSESSMENT OF EFFECTS OF SAND EXTRACTION ON BIOTA
Sand has been extracted from the Mangawhai-Pakiri embayment since post World War 2 to supply the Northland-Auckland region with a high-quality product that requires minimum processing for use in the concrete industry. The quantities recovered have varied over the years based on demand and consenting constraints. The majority of sand has been extracted from the shallow nearshore environment but sand from water depths of deeper than 25 m has been extracted since 2003. The comments presented below are based on data obtained as part of monitoring of the current Inshore consent area (Bioresearches, 2019a), the Offshore consent area (Bioresearches, 2019b) and proposed new Midshore consent area (this report), and from background information available. The assessment of effects includes:
changes to benthic biota changes to the fish community
Effects to marine mammals and birds are addressed in separate reports (Clement and Johnston, 2020, Thompson, 2020). 6.1 Benthic Biota and Macrobenthic Epifauna
6.1.1 Community structure and habitat
Estimates of the time taken for a benthic community to recover from a disturbance event of the scale of sand dredging is between 6 months to several years (Michel et al. 2013). This is based on international monitoring studies and defines recovery to be the benthic community returning to a similar composition and abundance. Many studies did not extend until complete recovery was achieved. The complexity of some habitats and changes in the benthic environment resulting from dredging can result in total recovery not occurring for many years. The longer recovery time periods have been linked to coarser sediment particle sizes. Post dredging changes in sediment characteristics can result in benthic communities recovering with different compositions and abundance. Seasonal timing will also influence the speed of recovery. Initially recovery will be by survival and migration from adjacent habitats, which will occur almost immediately. On a longer time frame, recovery will be by reproductive settlement which will be seasonal and vary from species to species. The degree of impact on the composition and abundance of the benthic communities caused by the dredge operation will to some extent determine the recovery time. Incomplete removal of biota will potentially result in shorter recovery times. The dredge head currently used by the William Fraser has been shown to extract a shallow layer of sand to a depth of between 80 – 120 mm below the seabed. Observations by divers immediately post dredging have shown large worms, clams and some crustacea being retained in the sediment after passage of the dredge. The abundance of smaller molluscs and other biota remaining within the seabed after the passage of the William Fraser dredge head has yet to be assessed. Divers have recorded Stomatopods surviving the passage of the dredge and resuming feeding and other activities less than 5 minutes after dredging, and predatory gastropods moving into the dredge footprint in search of prey (Figure 6.1).

Assessment of Ecological Effects: For Sand Extraction from the Midshore Pakiri Embayment Assessment of Ecological Effects MBL Midshore Final v3 Final V3 4 September 2020 39
Figure 6.1 Survival and migration biota in the dredge path at Pakiri, August 2020 MBL. The shallow disturbance dredge profile not only affects fewer species, but has been shown to result in faster recovery times from the disturbance. Dernie et al (2003) reported that sediment disturbances to deeper depths (200 mm) took longer to recover than areas of shallower (100 mm) sediment disturbance. Dernie et al showed recovery occurred after 64 days when shallow disturbance occurred, compared with more than 107 days when deeper disturbance occurred. Therefore, it is predicted that the shallow sand layer extracted by the William Fraser‘s dredge head will result in a short recovery time of less than 1 year. The dredging practices previously used in both the Inshore and Offshore consented areas, where a deeper sand layer was extracted, did not result in significant differences in the composition and abundance of benthic communities in dredged areas as opposed to the non-dredged control areas. The Pakiri Mangawhai embayment is considered a dynamic environment with currents and sea swells influencing the movement of the seabed surface (e.g. large ripples of sand visible on seabed photographs). Considering the naturally dynamic environment in the Bay and the shallow (< 120 mm) layer of sand extracted during dredging it is not expected to alter the benthic community over and above what is experienced naturally in extreme events. Therefore the magnitude of effects is expected to be minor on the benthic community. 6.1.2 Benthic Fauna Survival
Macrofauna survivorship studies showed that the macrofauna passing through the dredge and screening deck suffers some damage but the majority (93%) survive and are returned to the seabed. This will further decrease the recovery time of the benthic community. The data showed bivalves are more likely to suffer some shell damage and potential mortality than gastropods. Gastropods are generally more robust and compact than bivalves and suffered no lethal damage by the passage through the dredge of the William Fraser. More fragile species such as echinoderms and polychaete worms are likely to be more affected than robust species such as molluscs. Crustaceans, which consisted mostly of small crabs, showed a high survival rate of 96%, this is largely due to many of the crabs being hermit crabs living inside robust gastropod shells.

Assessment of Ecological Effects: For Sand Extraction from the Midshore Pakiri Embayment Assessment of Ecological Effects MBL Midshore Final v3 Final V3 4 September 2020 40
The upgrading of the dredging vessel in late 2019 to the William Fraser has resulted in significantly lower mortality rates of the macrofauna passing through the dredge. The mortality rate of bivalves with the Coastal Carrier was estimated at 45%, while this study on the William Fraser estimated only an 8% mortality rate. The surviving benthic fauna passing through the dredge, screens and discharged through moon pools below the William Fraser, are likely to suffer predation by fish during their descent to the seabed. However, the large volume discharged means a significant proportion will reach the seabed intact. The change in discharge to under the vessel via moon pools means predation by birds is limited and much less than previously occurred from the Coastal Carrier which discharged over the side of the vessel. Considering the lower mortality, greater volume and sub-surface discharge, the dredging is expected to have effects of a minor magnitude on macrofauna survival. 6.1.3 Suspended Sediment and Turbidity
The sediment quality has been assessed in Gibbs and Kubale (2019) and shown to be devoid of contaminants. Therefore, there is no source of chemical contamination in or near the sand extraction area. Thus, the composition of the seabed sediments will not result in the release of contaminants causing adverse effects if disturbed. Water clarity is important for the healthy functioning of marine ecosystems. Increased suspended solid loads that reduce water clarity, through increased turbidity, can affect the amount of photosynthesis (primary production) of aquatic plants, which in turn means less food for filter feeders. Reduced water clarity can also affect the feeding efficiency of visual predators like fish and sea birds. Water quality testing of the discharges from the William Fraser and the ambient conditions at the extraction site were conducted and reported by Kubale (2020). To define ambient background natural water quality Kubale used both water quality monitoring data collected for a short period adjacent to the extraction area and from regular repeated long-term council monitoring sites nearby. The water quality monitoring at the dredge area was generally lower in concentration than the Goat Island monitoring site for turbidity and suspended solids, while other physical parameters were similar, which was as expected. Background turbidity at the dredge area ranged from 0.14 to 3.11 NTU, averaging 0.31 NTU in May - July 2019. Similarly background suspended solids at the extraction site ranged from 0.47 to 10.46 mg/l, averaging 1.04 mg/l. During sand extraction operations, the seabed sediment is sucked up through the dredge head, extraction pipe and discharged into an 8 m² screening tray. The water and sediment pass over and through two screens; a coarse 35 mm screen and a fine 2.5 mm screen. The coarse shell and other material not passing through the fine screen is then discharged through a pipe which discharges into a moon pool and out under the vessel. The sand passing through the 2.5 mm screen is then discharged into the hopper. Water discharged into the hopper overflows weir boards which discharge into several moon pools and out under the vessel. The oversize discharge contains both shell and sand, and the weir board hopper overflows contain very small amounts of silt and clay sized sediments. The plume created behind the vessel is approximately as wide as the vessel with very little lateral spread visually obvious. In December 2019 during routine sand extraction operations the turbidity and suspended solids were assessed in the discharge plume created behind the William Fraser. The results showed minor elevations in turbidity (1 – 2 NTU) values and suspended solids (3.5 – 8 mg/l) concentrations in the surface water at the
Assessment of Ecological Effects: For Sand Extraction from the Midshore Pakiri Embayment Assessment of Ecological Effects MBL Midshore Final v3 Final V3 4 September 2020 41
point of discharge that rapidly decline back to ambient ranges of 0.13 - 0.14 NTU and 2.4 - 2.9 mg/l by a distance of 250 m behind the dredge. The increases in turbidity and suspended solids concentrations recorded immediately behind the William Fraser, are within the range of natural variation recorded as part of the background water quality studies. The suspended solids concentrations and turbidity values found within the plume beyond 250 m from the William Fraser were within ranges recorded in the nearby unaffected coastal marine environment. Under the test operating speed of 2.5 knots this equates to the very weak plume being present at any one location for no more than 3 minutes 15 seconds in any one area on a day. The initial aim was to operate the William Fraser at 1.5 knots as had been possible with the Coastal Carrier, however course maintenance problems due to the low speed were initially encountered, therefore, the operating speed was increased to 2.5 knots. Since the water quality tests were conducted the crew have managed to operate the vessel at speeds between 1.5 – 2.5 knots. The variance is typically based on weather conditions on the day of extraction. Biota in and on the seabed areas adjacent to the dredge path could suffer temporary minor smothering from the settlement of oversized material discharges, however the level of discharge is not expected to result in complete coverage of the seabed with burial of biota, just light partial covering. The magnitude of effects of sediment discharges on water quality are expected to be negligible, in regard to the absence of contaminants in the sediments and the limited time period of the plume. Similarly, the effects on the benthic biota are expected to be negligible. 6.2 Fish
No direct assessment has been made of the fish population prior to and following sand dredging, or in comparison between areas dredged and not dredged. The assessment of effects on fish is based on literature information. Fish will potentially be affected by a number of factors related to the operation of the sand dredge. These include:
Underwater noise entrainment suspended sediment; and food source reduction.
6.2.1 Effects of Underwater Noise
An underwater noise assessment was undertaken by Styles Group in 2020 (Pine, 2020). The main noise sources associated with the activity will be the drag head making contact with the seafloor, the water jetting and the movement of the sand slurry up the pipe to the hopper. The assessment was based on the loudest operational stage (active dredging), using measured noise level data of the William Fraser. The data revealed a typical soundscape for an open coastal area, with sounds from fish, marine mammals, snapping shrimp, vessels, dredging and weather (wind and waves) generating daily sound pressure levels between 96 and 111 dB re 1 μPa. The average source level of the William Fraser was approximately 168 dB re 1 μPa @ 1m. Predicted noise emissions from the William Fraser were evaluated in terms of critical distances for which injury or behavioural changes occur:

Assessment of Ecological Effects: For Sand Extraction from the Midshore Pakiri Embayment Assessment of Ecological Effects MBL Midshore Final v3 Final V3 4 September 2020 42
permanent threshold shifts (PTS), where hearing sensitivities do not return to normal following noise exposure,
temporary threshold shifts (TTS), whereby hearing sensitivities do return to pre-exposure thresholds after a period of time following noise exposure,
risk of behavioural effects, as a percentage over range, auditory masking, whereby noise interferes with a biologically-important signal that marine fauna
rely on.
The assessment considers the dredging noise effects on invertebrates, fish and marine mammals. However, given the physical properties of the dredging noise in this case and differing hearing mechanisms between the different groups of animals, the potential noise effects on invertebrates and fishes were directly measured. Therefore, the effects modelling was undertaken specifically for marine mammals, with effects on fishes and invertebrates being assumed less than those for the marine mammals. Audibility of the dredging noise from the William Fraser for marine mammals is calculated to be within 5.6 km, beyond which, acoustic disturbance is theoretically not possible. While the underwater noise produced by the William Fraser under normal operation in the southern end of the extraction area may be faintly heard by marine mammals and fish within the Cape Rodney-Okakari Point Marine Reserve, the sound levels are not expected to result in any adverse injury or behavioural effects within the marine reserve. Injury (PTS) from the sand extraction activities using the William Fraser is not expected to occur at any stage of the dredging within the Extraction Area, for any species. Temporary threshold shifts are also not expected to occur for any species beyond 1 m from the pump of the William Fraser while extraction is taking place. Based on the measured ambient sound levels and published hearing thresholds there is a risk of auditory masking and behavioural effects in marine mammals and fish occurring at a limited range from the William Fraser. However, the risks to fish are substantially smaller than for marine mammals. It has been calculated that there is a 50% probability of a low behavioural response in delphinids within 28 m compared to 0 m for a moderate response. Response distances for fish are expected to be less. Thus, the magnitude of effects of noise on fish are expected to be negligible. 6.2.2 Effects of Entrainment
It is not expected that fish will be entrained in the dredge as the water flow will be targeted at sucking sediment up from the seabed. Fish are highly mobile and it is expected that the majority of fish species present will be able to avoid the drag head and avoid entrainment due to the slow speed (1.5 – 2.5 knots) the sand dredge moves over the seabed. Fish species that are slow moving, have behaviours that limit escape or avoidance, or live within the sediment, may be entrained. Both sand divers and sole have been reported in samples passing through the dredge in the current Inshore consent area (Bioresearches 2019a). Opal fish and short finned worm eels have been recorded further north and offshore (Bioresearches, 2016). In this survivorship study conducted on the fringes of the proposed Midshore consent area, two species of benthic fish, lizardfish and snake eel, were recorded as surviving passage through the dredge and screening deck and returned to sea via the moon pool discharge. The magnitude of effects of entrainment on fish are expected to be negligible.

Assessment of Ecological Effects: For Sand Extraction from the Midshore Pakiri Embayment Assessment of Ecological Effects MBL Midshore Final v3 Final V3 4 September 2020 43
6.2.3 Effects of Suspended Sediment
Recent studies have identified that increased suspended solids in the water column are detrimental to juvenile snapper health in estuarine environments (Lowe, 2013). While the research was aimed at the effects of increased terrestrial sediment inputs, the discharge of fine marine sediments from the sand barge could have similar effects. However, the percentage of fine sediments in the seabed of the sand extraction area is, and has been, low, ranging from 0 – 3 percent. The water quality data suggests that the suspended solids and turbidity effects of discharges are within the natural variation ranges for the proposed Midshore consent area. This means the amount of fine sediment discharged from the sand dredge that remains suspended for any significant length of time, will be small and very unlikely to adversely affect fish. The frequency of dredging events is likely to be greater than that of natural events producing similar suspended solids concentrations, however it is not considered significant due to its limited area. The magnitude of effects of suspended sediment on fish is expected to be negligible. 6.2.4 Effects of Food Source Reduction
Benthic biota forms the basis of many fish diets. A reduction in benthic biota abundance or a change in composition as a result of sand dredging could potentially impact bottom feeding fish species. The comparison of benthic biota collected in the current Inshore sand extraction area and an adjacent control area did not suggest a decrease in abundance or a change in species composition (Bioresearches 2019a). A similar level of effect is expected to occur in the proposed Midshore consent area, therefore fish are not expected to be adversely affected through loss of prey. It has also been noted that the discharge of oversized material from the sand dredge, includes damaged and undamaged biota which acts as a food source and attracts fish. The changes in water quality are insufficient in concentration, geographic scale, duration and frequency to measurably affect the production of phytoplankton, which generally forms the base of the food chain, supporting zooplankton, benthic biota and thus fish. The magnitude of effects of food reduction for fish is expected to be negligible. 6.3 Summary of the Magnitude of Effects
Table 6.1 summarises the magnitude of potential effects associated with sand extraction in the proposed Midshore consent area. 6.4 Level of Ecological Effects
Table 6.2 presents the overall assessment of the potential level of ecological effects, based on the matrix shown in Table 2.4. The level of ecological effects are determined by combining the ecological values presented in Table 5.1 and the magnitude of potential ecological effects presented in Table 6.1. Overall, we estimated a less than minor level of effects due to the operation of the sand dredge on benthic fauna and fish. Dredging is considered to have a minor level of effects on the benthic community structure. Dredging is considered to have a minor level of effects on the survival of macro fauna (including crustaceans and bivalves) other than gastropods passing through the dredge, gastropods showed 100% survival, thus the level of effects is considered negligible.

Assessment of Ecological Effects: For Sand Extraction from the Midshore Pakiri Embayment Assessment of Ecological Effects MBL Midshore Final v3 Final V3 4 September 2020 44
Table 6.1 Magnitude of potential ecological effects from sand extraction
Biota Effect Magnitude of Effect Comments
Benthic fauna
Community structure Minor
The area of disturbed sediment is shallow with fauna small in size. It is expected to be recolonised quickly from adjacent areas. Long term changes in community composition are not expected to be directly attributable to sand extraction, rather, result from natural dynamics of the bay.
Survival Minor Mortality of macrofauna due to passage through the dredge is estimated to be low. Predation of fauna after being discharged from the boat is expected but the amount unknown.
Turbidity Negligible
The increases in turbidity and suspended solids concentrations recorded immediately behind the William Fraser, are within the range of natural variation recorded as part of the background water quality studies. Biota in and on the seabed areas adjacent to the dredge path could suffer temporary minor partial smothering from the settlement of oversized material discharges.
Fish
Underwater Noise Negligible The underwater noise created will not cause injury but may cause
behavioural effects when in very close proximity to the pump.
Entrainment Negligible Only a few benthic fishes were found to pass through the dredge, and they were all undamaged.
Suspended sediment Negligible
The water quality data suggests that the suspended solids and turbidity effects of discharges are within the natural variation ranges for the proposed Midshore consent area.
Food reduction Negligible
Composition and abundance of benthic biota is not expected to change, therefore no shortage of food is expected due to sand dredging. Potentially dredging could have a positive effect on predatory fish species such as snapper by providing a food source.
Table 6.2 Level of ecological effects incorporating the ecology values (in Table 5.1) and magnitude of
effects (in Table 6.1) for the project.
Biota Ecological value Effects Magnitude of effects Level of effects
Benthic fauna Low-Moderate
Community structure Minor Minor
Survival Minor Minor
Turbidity Negligible Negligible
Fish Low
Noise Negligible Negligible
Entrainment Negligible Negligible
Suspended sediment Negligible Negligible
Food reduction Negligible Negligible

Assessment of Ecological Effects: For Sand Extraction from the Midshore Pakiri Embayment Assessment of Ecological Effects MBL Midshore Final v3 Final V3 4 September 2020 45
The consent application is for a rolling annual average rate of 125,000 m³/year over any consecutive 5 year period, with a maximum rate of 150,000 m³ over any consecutive 12-month period. Further the temporal distribution of the extraction volume will be limited to a maximum of 15,000 m³ over any consecutive 30 day period, with the dredging spatially balanced over the entire dredging area. Current dredging operations are reporting the 900 m³ hopper is filled with sand in 3-4 hours of dredging, with an average dredging track length of approximately 12 km, based on the dredge profile 1.6 m wide and 0.1 m deep this would equate to a sand extraction efficiency by volume of 47%. Based on this the annual volume limits will limit the number of dredging trips per year to an average of less than 139 trips, effecting approximately 2.67 km² of the 6.6 km². MBL have stated they plan to distribute the dredging spatially evenly within and between management cells. Therefore, theoretically up to 40% of the seabed included in the application will be dredged in any one year, and any particular area of seabed should not be dredged in theory more than once in any 30 month period. Thus seabed biota will have approximately 30 months to recolonise the dredged area either from lateral migration or from reproductive settlement. Given recolonization is predicted to occur over a 12 month period, a 30 month recovery period is expected to result in no detectable ecological differences in composition and abundance above or below natural variation. If further increases in the efficiency of sand retention in the barge or slightly greater dredge profile depths can be achieved, then a smaller area would need to be dredged to obtain the same volume of sand. This would also have the added benefit of increasing the period between re-dredging allowing for greater recovery. However this should be tempered with the reality that deeper dredging profile depths have been shown in the literature to increase the time needed for recovery.
Assessment of Ecological Effects: For Sand Extraction from the Midshore Pakiri Embayment Assessment of Ecological Effects MBL Midshore Final v3 Final V3 4 September 2020 46
7. REFERENCES
ANZECC (2000) Australian and New Zealand Guidelines for Fresh and Marine Water Quality, Volume 1, The Guidelines (Chapters 1 - 7). Australian and New Zealand Environment and Conservation Council (ANZECC) and Agriculture and Resource Management Council of Australia and New Zealand (ARMCANZ). Paper No. 4 - Volume 1 (Chapters 1 - 7) October 2000.
Auckland Regional Council (2002) Environmental targets for the urban coastal marine area, ARC Technical Publication No. 169.
ASR (2003) Pre-dredging assessment: ecological component - Infaunal sampling and drop-camera video surveys of a 1 x 8 km area off Pakiri Beach (Area 1). Report prepared for Kaipara Extractors Ltd. pp29
Beca Carter Hollings and Ferner Ltd. (1992) Sand extraction from the Pakiri Mangawhai beach system. Environmental Impact Assessment, 94p.
Bioresearches (2011) Pakiri sands Control Area ecological characteristics assessment report. Job # 11053. Report prepared for Kaipara Excavators Limited. pp11
Bioresearches (2016) Hawaiki Submarine Cable NZ, Environment Assessment of the Benthic Ecology of the Cable Route. Job # 16192. Report prepared for Mortimer Consulting. pp49
Bioresearches (2019a) Assessment of Ecological Effects: Following Sand Extraction from the Pakiri Sand Extraction Areas. Job # 62559. Report for McCallum Brothers Ltd. pp 69
Bioresearches (2019b) Assessment of Ecological Effects: Following Sand Extraction from the Auckland Offshore Sand Extraction Site. Job # 16186. Report for Kaipara Excavators Ltd. pp 93
Brooks, R. A., S. S. Bell, C. N. Purdy and K. J. Sulak. (2004) The benthic community of offshore sand banks: A literature synopsis of the benthic fauna resources in potential MMS OCS sand mining areas. Minerals Management Service (MMS), USGS Outer Continental Shelf Studies Ecosystem Program Report USGS-SIR-2004-5198, OCS Study MMS- 2004. 338 pp.
Brooks, R. A., C. N. Purdy, S. S. Bell and K. J. Sulak. (2006) The benthic community of the eastern U.S. continental shelf: A literature synopsis of benthic faunal resources. Continental Shelf Research. 26(2006):804-818.
Clarke, K. R., Gorley, R. N., Somerfield, P.J., and Warwick, R.M. (2014) Change in marine communities: an approach to statistical analysis and interpretation, 3nd edition. PRIMER-E: Plymouth
Clement D., Johnston O. (2020) Pakiri offshore sand extraction: marine mammal assessment of effects. Prepared for McCallum Brothers Ltd. Cawthron Report No. 3471. 40 p. plus appendices.
Assessment of Ecological Effects: For Sand Extraction from the Midshore Pakiri Embayment Assessment of Ecological Effects MBL Midshore Final v3 Final V3 4 September 2020 47
Cooper, K., S. Boyd, J. Eggleton, D. Limpenny, H. Rees and K. Vanstaen. (2007) Recovery of the seabed following marine aggregate dredging on the Hastings Shingle Bank off the southeast coast of England. Estuarine, Coastal and Shelf Science. 75(2007):547-558.
Dernie, K. M., Kaiser, M. J., Richardson, E. A., & Warwick, R. M. (2003) Recovery of soft sediment communities and habitats following physical disturbance. Journal of Experimental Marine Biology and Ecology, 285, 415-434.
Duffy, C. & Gordon, I. (2003) Carcharhinus brachyurus. The IUCN Red List of Threatened Species 003: SSG Australia & Oceania Regional Workshop, March 2003. https://dx.doi.org/10.2305/IUCN.UK.2003.RLTS.T41741A10551730.en. Downloaded on 14 April 2020.
Dwyer, S. L. (2014) Spatial ecology and conservation of cetaceans using the Hauraki Gulf, New Zealand (Doctoral dissertation, Massey University, Albany, New Zealand).
Dwyer, S. L., Tezanos-Pinto, G., Visser, I. N., Pawley, M. D., Meissner, A. M., Berghan, J. and Stockin, K. A. (2014)
Overlooking a potential hotspot at Great Barrier Island for the nationally endangered bottlenose dolphin of New Zealand. Endangered Species Research, 25(2), 97-114.
Dwyer, S. L., Clement, D. M., Pawley, M. D. M. and Stockin, K. A. (2016) Distribution and relative density of cetaceans in the Hauraki Gulf, New Zealand. New Zealand Journal of Marine and Freshwater Research, 50(3), 457-480.
EIANZ (2018) Ecological Impact Assessment (EcIA), EIANZ guidelines for use in New Zealand: terrestrial and freshwater ecosystems’, Environment Institute of Australia and New Zealand, Melbourne.
Ellis, J., Cummings, V., Hewitt, J., Thrush, S., & Norkko, A. (2002) Determining effects of suspended sediment on condition of a suspension feeding bivalve (Atrina zelandica): results of a survey, a laboratory experiment and a field transplant experiment. Journal of Experimental Marine Biology and Ecology, 267(2), 147-174.
Folk, R. L. (1980) Petrology of sedimentary rocks. Hemphill Publishing Company.
Gaskin, D. E. (1968) Distribution of Delphinidae (Cetacea) in relation to sea surface temperatures off eastern and southern New Zealand. New Zealand Journal of Marine and Freshwater Research, 2, pp. 527-534.
Gibbs, E. and Kubale, A. (2019) Pakiri Sand Extraction Consent Application, Water Quality Technical Report, November 2019. For McCallum Brothers Limited Report No. IZ111900 -NM-RPT-002 48p. plus Appendices
Grace R. V. (1991) Pakiri - Te Arai Sand Extraction. Biological Investigations. Report for McCallum Bros Limited and Sea-Tow Limited, May 1991. 33 pages.
Grace R. V. (2005) Pakiri - Te Arai Sand Extraction. Biological Investigations. Report for McCallum Bros Limited, September 2005. 16 pages.

Assessment of Ecological Effects: For Sand Extraction from the Midshore Pakiri Embayment Assessment of Ecological Effects MBL Midshore Final v3 Final V3 4 September 2020 48
Grace R. V. (2016) Kaipara Harbour Sand Extraction. Fitzgerald Bank Biological Monitoring 2015. Report Prepared For: Winstone Aggregates Ltd and Mt Rex Shipping Ltd. May 2016. pp 33.
Healy, T., Imminga, D., Mathew, J., Nicholl, S., and Hume, T.M. (1996) Mangawhai - Pakiri sand study. Module 2 : Technical report marine sands. The Working Party, Mangawhai-Pakiri Sand Study, ARC Environment, Auckland Regional Council, Hamilton.
Hilton M. J. (1990) Processes of Sedimentation on the Shoreface and Continental Shelf and the Development of Facies Pakiri, New Zealand. Ph.D. Thesis, University of Auckland. pp 352.
Hupman, K., Visser, I. N., Fyfe, J., Cawthorn, M., Forbes, G., Grabham, A. A., ... & Cooper, T. (2019) From Vagrant to Resident: occurrence, residency and births of leopard seals (Hydrurga leptonyx) in New Zealand waters. New Zealand Journal of Marine and Freshwater Research, 1-23.
Kubale, A. (2020) Pakiri Sand Extraction Consent Application, Water Quality Technical Report, August 2020. For McCallum Brothers Limited Report No. IZ111900 -NP-RPT-002 42p. plus Appendices
Lowe, M. (2013) Factors affecting the habitat usage of estuarine juvenile fish in northern New Zealand (Doctoral dissertation, ResearchSpace@ Auckland).
Michel, J., A.C. Bejarano, C.H. Peterson, and C. Voss (2013) Review of Biological and Biophysical Impacts from Dredging and Handling of Offshore Sand. U.S. Department of the Interior, Bureau of Ocean Energy Management, Herndon, VA. OCS Study BOEM 2013-0119. 258 pp
Montevecchi, W.A. (2006) Influences of Artificial Light on Marine Birds. pp94-113 In Rich, C and Longcare R Ecological Consequences of Artificial Lighting. Island Press. 458 pp.
Moschino, V., Deppieri, M., & Marin, M. G. (2003) Evaluation of shell damage to the clam Chamelea gallina captured by hydraulic dredging in the Northern Adriatic Sea. ICES Journal of Marine Science, 60(2), 393-401.
Neumann, D. R., Leitenberger, A. and Orams, M. B. (2002) Photo identification of short-beaked common dolphins (Delphinus delphis) in the north-east New Zealand: a photo-catalogue of recognisable individuals. New Zealand Journal of Marine and Freshwater Research, 36, pp. 593-604.
Pine, M. (2020) Proposed Offshore (<25m depth) Sand Extraction: Mangawhai Pakiri Coast, June 2020. Prepared by Styles Group for McCallum Brothers Limited. 35 p. plus Appendices.
Standard, N. Z. (1986) Methods of test for water and aggregate for concrete. NZS, 3111, 1986.
Thompson D. (2020) Sand Extraction from the Mangawhai-Pakiri Embayment: Assessment of Effects on Seabirds. Prepared for McCallum Brothers Ltd. 24pp

Assessment of Ecological Effects: For Sand Extraction from the Midshore Pakiri Embayment Assessment of Ecological Effects MBL Midshore Final v3 Final V3 4 September 2020 49
Todd, D. (2020) Pakiri Sand Extraction Consents: Assessment of Effects on Coastal Processes, September 2020. For McCallum Brothers Limited Report No. IZ111900 -NM-RPT-004 64p. plus Appendices
Visser, I. N. (2000) Orca (Orcinus orca) in New Zealand waters. Ph.D. Dissertation. University of Auckland, Auckland, New Zealand. pp. 200.
Whitehead, E.A., Adams, N., Baird, K.A., Bell, E.A., Borrelle, S.B., Dunphy, B.J., Gaskin, C.P., Landers, T.J., Rayner, M.J., Russell, J.C. (2019)
Threats to Seabirds of Northern Aotearoa New Zealand. Northern New Zealand Seabird Charitable Trust, Auckland, New Zealand. 76pp

Assessment of Ecological Effects: For Sand Extraction from the Midshore Pakiri Embayment Assessment of Ecological Effects MBL Midshore Final v3 Final V3 4 September 2020 50
8. APPENDICES
Appendix 1 Sampling Area Geographical Positions
Table A1.1 Benthic Biota and Sediment particle size Sampling coordinates in the Consented and Proposed Sand Extraction Areas, Control Areas and Adjacent Areas, 2019 (WGS 84 datum)
Area Site World Geodetic System 1984 Depth Offshore Longshore Latitude Longitude m
Curr
ent
Nort
hern
PIB01 -36.11882 174.62399 4.9 PIB05 -36.12737 174.62977 5.8 PIB11 -36.13625 174.63578 10.1 PIB19 -36.14514 174.64179 7.9
PIB114 -36.14407 174.64122 9.1 PIB27 -36.15017 174.64649 4.5 PIB04 -36.12337 174.62927 8.5 PIB10 -36.13230 174.63501 15.9 PIB18 -36.14124 174.64075 11.0 PIB26 -36.14567 174.64640 13.1
Sout
hern
PIB39 -36.16827 174.65844 2.7 PIB46 -36.17667 174.66429 7.7 PIB54 -36.18141 174.66939 18.7
PIB111 -36.18078 174.66830 11.8 PIB62 -36.19034 174.67514 4.8 PIB68 -36.19477 174.68079 5.8 PIB45 -36.17247 174.66364 7.0 PIB53 -36.17690 174.66929 21.1
PIB109 -36.17907 174.67165 17.2 PIB61 -36.18584 174.67504 9.7
Cont
rol
PIB75 -36.20336 174.68695 6.7 PIB82 -36.20813 174.69220 6.2 PIB88 -36.21256 174.69786 5.5
PIB100 -36.21360 174.69867 5.7 PIB94 -36.21646 174.70305 10.7 PIB74 -36.19920 174.68645 15.0
PIB105 -36.19930 174.68555 12.2 PIB81 -36.20353 174.69204 11.2 PIB87 -36.20805 174.69776 11.0 PIB93 -36.21248 174.70342 17.5
Insh
ore
Betw
een Northern
PIB121 -36.11138 174.62407 17.4 PIB03 -36.11886 174.62917 12.5 PIB09 -36.12780 174.63491 17.2 PIB17 -36.13673 174.64066 14.7
Southern
PIB44 -36.16797 174.66354 9.6 PIB67 -36.19026 174.68070 11.3 PIB73 -36.19469 174.68635 22.6
PIB106 -36.19333 174.68533 20.0 PIB72 -36.19019 174.68625 23.8
Control PIB103 -36.19808 174.68847 18.1
Prop
osed
(mid
shor
e)
Nort
hern
PIB02 -36.11435 174.62908 19.4 PIB08 -36.12329 174.63482 22.8
PIB119 -36.12065 174.63448 21.8 PIB07 -36.11878 174.63473 29.6 PIB06 -36.11428 174.63463 27.4
PIB120 -36.11240 174.63398 26.2 PIB117 -36.12933 174.63770 17.2 PIB16 -36.13223 174.64056 27.7
PIB115 -36.12940 174.64090 23.0 PIB15 -36.12772 174.64047 24.1 PIB14 -36.12321 174.64038 24.9 PIB25 -36.14116 174.64631 16.2 PIB24 -36.13666 174.64621 19.8 PIB23 -36.13215 174.64612 24.7 PIB33 -36.15010 174.65205 16.1
PIB112 -36.14408 174.65102 20.5 PIB32 -36.14559 174.65196 23.2 PIB31 -36.14109 174.65186 24.4 PIB37 -36.15002 174.65761 19.2
Te Arai Point
PIB38 -36.15412 174.65866 18.6 PIB43 -36.15896 174.66335 20.0 PIB42 -36.15445 174.66326 21.0
Area Site World Geodetic System 1984 Depth Offshore Longshore Latitude Longitude m
Prop
osed
(mid
shor
e)
Sout
hern
PIB52 -36.17240 174.66920 21.8 PIB51 -36.16789 174.66910 24.0 PIB50 -36.16338 174.66900 29.8 PIB60 -36.18133 174.67494 20.5
PIB108 -36.17923 174.67502 20.8 PIB59 -36.17682 174.67485 22.8 PIB58 -36.17232 174.67475 24.1 PIB66 -36.18576 174.68060 15.3 PIB65 -36.18125 174.68050 23.7 PIB64 -36.17675 174.68041 25.4 PIB71 -36.18568 174.68616 24.6
Cont
rol
PIB104 -36.19497 174.68838 20.4 PIB80 -36.19912 174.69201 22.8
PIB101 -36.19857 174.69178 20.5 PIB79 -36.19461 174.69191 24.2
PIB102 -36.19457 174.69167 22.5 PIB78 -36.19011 174.69181 27.1 PIB86 -36.20355 174.69766 15.5 PIB85 -36.19851 174.69699 24.5 PIB84 -36.19454 174.69747 25.2 PIB92 -36.20797 174.70332 20.5 PIB91 -36.20347 174.70322 22.9 PIB90 -36.19896 174.70312 25.7 PIB96 -36.20789 174.70888 25.0 PIB95 -36.20339 174.70878 20.0
Offs
hore
Nort
hern
PIB118 -36.11260 174.63740 28.1 PIB13 -36.11871 174.64028 25.2 PIB12 -36.11420 174.64019 30.1 PIB22 -36.12764 174.64602 26.1
PIB116 -36.12977 174.64643 20.4 PIB21 -36.12314 174.64593 26.5 PIB20 -36.11863 174.64584 27.2 PIB30 -36.13658 174.65177 25.6 PIB29 -36.13207 174.65167 30.0 PIB28 -36.12757 174.65158 30.8
PIB113 -36.12907 174.65082 29.5 PIB36 -36.14552 174.65751 25.0 PIB35 -36.14101 174.65742 26.2 PIB34 -36.13650 174.65732 27.9 PIB40 -36.14544 174.66307 27.5
Te Arai Point
PIB41 -36.14994 174.66316 21.9 PIB49 -36.15888 174.66891 30.0 PIB48 -36.15437 174.66881 30.6 PIB47 -36.14987 174.66872 30.7
Sout
hern
PIB110 -36.16210 174.67140 29.8 PIB57 -36.16781 174.67466 25.8 PIB56 -36.16331 174.67456 33.2 PIB55 -36.15880 174.67447 33.9 PIB63 -36.17224 174.68031 26.3 PIB70 -36.18117 174.68606 28.5
PIB107 -36.18017 174.68492 25.8 PIB69 -36.17667 174.68596 30.1 PIB77 -36.18560 174.69172 28.0 PIB76 -36.18110 174.69162 29.3
Control PIB83 -36.19003 174.69737 26.4 PIB89 -36.19446 174.70303 27.5

Assessment of Ecological Effects: For Sand Extraction from the Midshore Pakiri Embayment Assessment of Ecological Effects MBL Midshore Final v3 Final V3 4 September 2020 51
Table A1.2 Dredge tow sampling coordinates in the Consented and Proposed Sand Extraction Areas and Control Areas, 2019 (WGS 84 datum)
Area Site Date Depth World Geodetic System 1984 Distance Beginning End Consent Alongshore (m) Latitude Longitude Latitude Longitude (m)
Current
Northern
35 31-Jan-19 5 -36.11767 174.62208 -36.11555 174.62205 235 34 15-Apr-19 5 -36.13685 174.63420 -36.13467 174.63202 311 33 15-Apr-19 5 -36.15007 174.64383 -36.14755 174.64177 336 22 31-Jan-19 10 -36.11272 174.62122 -36.11515 174.62205 280 23 31-Jan-19 10 -36.13835 174.63808 -36.13657 174.63595 275 24 31-Jan-19 10 -36.15038 174.64718 -36.15248 174.64718 233
Southern
32 15-Apr-19 5 -36.16922 174.65668 -36.16652 174.65580 310 31 15-Apr-19 5 -36.18452 174.66947 -36.18245 174.66780 274 30 15-Apr-19 5 -36.19305 174.67640 -36.19060 174.67510 296 25 31-Jan-19 10 -36.17133 174.66140 -36.16993 174.65892 272 26 14-Feb-19 10 -36.17795 174.66632 -36.18002 174.66807 278 27 14-Feb-19 10 -36.19013 174.67655 -36.18863 174.67482 228
Control 29 15-Apr-19 5 -36.20757 174.69118 -36.20920 174.69345 273 28 14-Feb-19 10 -36.20552 174.69183 -36.20387 174.68990 252
Proposed (midshore)
Northern
21 31-Jan-19 15 -36.11107 174.62325 -36.11337 174.62368 258 20 31-Jan-19 15 -36.13952 174.64165 -36.13730 174.63952 312 19 31-Jan-19 15 -36.15025 174.65165 -36.15243 174.65153 242 8 31-Jan-19 20 -36.10777 174.62433 -36.10948 174.62522 206 9 31-Jan-19 20 -36.13788 174.64595 -36.14048 174.64630 290
10 31-Jan-19 20 -36.14563 174.65332 -36.14448 174.65002 323 7 31-Jan-19 25 -36.10762 174.63173 -36.11105 174.63233 384 6 31-Jan-19 25 -36.13482 174.65068 -36.13777 174.65110 330 5 31-Jan-19 25 -36.14255 174.65465 -36.14467 174.65652 289
Southern
17 14-Feb-19 15 -36.16820 174.66203 -36.16995 174.66410 269 18 31-Jan-19 15 -36.17715 174.66837 -36.17842 174.66933 165 16 14-Feb-19 15 -36.18417 174.68168 -36.18945 174.67845 654 11 31-Jan-19 20 -36.16758 174.66635 -36.16600 174.66367 298 12 14-Feb-19 20 -36.17073 174.67060 -36.17343 174.66855 352 13 14-Feb-19 20 -36.18833 174.68490 -36.19045 174.68412 245 4 31-Jan-19 25 -36.16258 174.66798 -36.16580 174.66965 388 3 14-Feb-19 25 -36.17593 174.67693 -36.17193 174.67395 519 2 14-Feb-19 25 -36.18437 174.68555 -36.18760 174.69087 598
Control 15 14-Feb-19 15 -36.20050 174.69385 -36.20260 174.69630 321 14 14-Feb-19 20 -36.20285 174.69633 -36.20577 174.69797 356 1 14-Feb-19 25 -36.20318 174.70460 -36.20072 174.70167 379
Table A1.3 Macrofauna Survivorship 2020 sampling coordinates (WGS 84 datum)
Depth Site World Geodetic System 1984 Latitude Longitude
10 m
10A -36.18183 174.68667 10B -36.18511 174.67389 10C -36.18789 174.67611 10D -36.19124 174.67917 10E -36.19227 174.68000
Depth Site World Geodetic System 1984 Latitude Longitude
25 m
25A -36.17539 174.68528 25B -36.17859 174.68778 25C -36.18173 174.69028 25D -36.18356 174.69167 25E -36.18739 174.69472

Assessment of Ecological Effects: For Sand Extraction from the Midshore Pakiri Embayment Assessment of Ecological Effects MBL Midshore Final v3 Final V3 4 September 2020 52
Appendix 2 Surficial Sediment Particle Size
Table A2.4 Summary Sediment Particle Size Data 2019 (Percentage by Weight)
Area Site Depth (m)
% of particles in each size class (mm)
Fineness Modulus Characterization Gravel
Very Coarse sand
Coarse sand Medium sand Fine
sand Very fine
sand Silt and
Clay
>4.75 4.75 - 2.36 2.36 - 1.18 1.18 - 0.6 0.6 - 0.43 0.43 - 0.3 0.3 - 0.15 0.15 - 0.08 <0.075
Cont
rol a
rea
BD75 6.7 2 5 7 14 59 13 1.26 S BD82 6.2 3 9 8 20 54 6 1.51 S BD88 5.5 2 1 2 10 71 14 1.07 S
BD100 5.7 2 5 7 16 60 10 1.27 S BD94 10.7 1 1 4 22 59 13 1.15 S BD74 15.0 2 6 23 33 32 4 1.54 S
BD105 12.2 1 1 4 10 66 18 1.01 S BD81 11.2 2 2 2 13 62 19 1.07 S BD87 11.0 1 1 7 80 11 0.98 S BD93 17.5 2 11 35 48 4 1.36 S
BD104 20.4 4 23 43 28 2 1.55 S BD80 22.8 1 4 25 61 9 1.19 S
BD101 20.5 2 10 22 24 36 6 1.58 S BD86 15.5 2 4 18 64 12 1.13 S BD92 20.5 1 6 32 55 6 1.30 S BD79 24.2 1 7 37 49 6 1.34 S
BD102 22.5 1 11 32 37 18 1 1.75 S BD85 24.5 1 1 7 30 54 7 1.32 S BD91 22.9 1 8 45 42 4 1.45 S BD96 25.0 1 4 27 43 24 1 1.57 S BD78 27.1 1 9 38 46 6 1.35 S BD84 25.2 1 9 24 45 20 1 1.73 S BD90 25.7 1 5 21 44 27 2 1.62 S BD95 20.0 1 1 9 40 45 4 1.42 S
BD103 18.1 5 21 34 36 4 1.45 S BD83 26.4 1 5 16 39 36 3 1.54 S BD89 27.5 1 18 26 23 21 10 1 2.74 (g)S
Inshore 10.2 1.5 3.3 6.9 18.0 59.1 11.2 1.22 S Inshore between 18.1 5 21 34 36 4 1.45 S
Midshore 22.6 0.6 3.6 14.5 35.8 40.6 4.8 1.45 S Offshore 26.9 0.5 9.5 15.5 19.5 30.0 23.0 2.0 2.14 (g)S
Nor
ther
n ar
ea
BD1 4.9 1 2 7 77 13 0.98 S BD5 5.8 8 21 10 10 43 8 1.99 S
BD11 10.1 2 1 4 10 63 20 1.01 S BD19 7.9 5 10 16 20 42 7 1.64 S
BD114 9.1 2 3 5 17 59 14 1.20 S BD27 4.5 1 1 3 7 73 15 1.00 S BD4 8.5 4 6 6 18 55 11 1.40 S
BD10 15.9 1 9 47 38 5 1.44 S BD18 11.0 1 1 2 10 69 17 0.98 S BD26 13.1 1 3 8 70 18 0.95 S BD25 16.2 1 2 11 66 20 0.94 S BD33 16.1 1 2 16 71 10 1.08 S BD2 19.4 1 23 48 25 3 1.48 S BD8 22.8 1 5 49 32 12 1 1.49 S
BD117 17.2 1 3 25 61 10 1.17 S BD16 27.7 2 36 45 16 1 1.51 S BD24 19.8 3 19 67 11 1.10 S BD32 23.2 1 7 32 44 15 1 1.68 S
BD112 20.5 9 36 38 16 1 1.65 S BD7 29.6 1 14 53 22 9 1 1.66 S
BD119 21.8 2 40 42 15 1 1.46 S BD15 24.1 4 42 39 14 1 1.49 S
BD115 23.0 5 39 42 13 1 1.57 S BD23 24.7 6 43 37 13 1 1.54 S BD31 24.4 1 4 31 42 21 1 1.56 S BD37 19.2 1 3 25 46 24 1 1.58 S BD6 27.4 1 7 48 32 11 1 1.56 S
BD14 24.9 4 46 36 13 1 1.46 S BD120 26.2 1 4 46 34 14 1 1.47 S BD121 17.4 8 30 52 10 1.21 S
BD3 12.5 1 2 10 69 18 0.95 S BD9 17.2 1 29 54 15 1 1.56 S
BD17 14.7 1 2 12 70 15 1.01 S BD22 26.1 1 10 47 31 10 1 1.64 S
BD116 20.4 1 31 50 17 1 1.53 S BD30 25.6 2 13 43 32 9 1 1.78 S BD36 25.0 1 4 27 46 20 2 1.59 S

Assessment of Ecological Effects: For Sand Extraction from the Midshore Pakiri Embayment Assessment of Ecological Effects MBL Midshore Final v3 Final V3 4 September 2020 53
Area Site Depth (m)
% of particles in each size class (mm)
Fineness Modulus Characterization Gravel
Very Coarse sand
Coarse sand Medium sand Fine
sand Very fine
sand Silt and
Clay
>4.75 4.75 - 2.36 2.36 - 1.18 1.18 - 0.6 0.6 - 0.43 0.43 - 0.3 0.3 - 0.15 0.15 - 0.08 <0.075 BD118 28.1 1 12 47 30 9 1 1.69 S BD13 25.2 1 7 49 31 11 1 1.54 S BD21 26.5 2 12 44 30 11 1 1.72 S BD29 30.0 3 15 48 22 10 2 1.77 S BD35 26.2 1 7 45 35 11 1 1.58 S BD12 30.1 1 9 46 30 13 1 1.60 S BD20 27.2 1 11 42 33 12 1 1.69 S BD28 30.8 6 21 49 17 6 1 2.04 S
BD113 29.5 2 13 46 26 11 2 1.72 S BD34 27.9 2 14 45 27 11 1 1.75 S BD40 27.5 2 12 41 30 13 2 1.71 S
Inshore 9.1 2.4 4.5 6.0 15.4 58.9 12.8 1.26 S Inshore between 15.5 0.7 10.3 26.5 51.5 11.0 1.18 S
Midshore 22.5 0.4 4.2 31.5 34.2 26.1 3.6 1.44 S Offshore 27.1 1.7 10.7 43.3 31.3 11.6 1.3 1.69 S
Te A
rai P
oint
BD38 18.6 0 7 38 50 5 1.34 S BD43 20.0 1 11 49 36 3 1.48 S BD42 21.0 3 36 45 15 1 1.55 S BD49 30.0 13 22 27 27 10 1 2.43 S BD41 21.9 4 41 38 16 1 1.51 S BD48 30.6 1 14 25 29 23 8 2.58 (g)S BD47 30.7 9 20 34 23 13 1 2.19 S
Midshore 19.9 1.3 18.0 44.0 33.7 3.0 1.46 S Offshore 28.3 0.3 9.0 17.8 32.8 27.8 11.8 0.8 2.18 (g)S
Sout
hern
are
a
BD39 2.7 1 3 25 67 4 1.23 S BD46 7.7 2 5 7 23 55 8 1.37 S BD54 18.7 1 2 23 64 10 1.16 S
BD111 11.8 2 2 3 12 64 17 1.09 S BD62 4.8 1 4 19 68 8 1.15 S BD68 5.8 1 2 7 22 58 10 1.21 S BD45 7.0 3 12 15 21 43 6 1.65 S BD53 21.1 3 19 47 29 2 1.55 S
BD109 17.2 1 6 25 59 9 1.21 S BD61 9.7 1 1 2 9 69 18 0.98 S BD52 21.8 1 4 23 63 9 1.17 S BD60 20.5 2 11 48 36 3 1.50 S BD66 15.3 1 2 12 71 14 1.01 S
BD108 20.8 2 6 34 38 19 1 1.63 S BD51 24.0 1 2 22 64 11 1.13 S BD59 22.8 1 13 51 33 2 1.53 S BD65 23.7 1 2 15 67 15 1.03 S BD50 28.9 1 21 33 22 17 5 1 3.05 (g)S BD58 24.1 1 7 27 44 20 1 1.66 S BD64 25.4 3 23 48 24 2 1.55 S BD71 24.6 3 19 41 35 2 1.49 S BD67 11.3 1 1 1 11 70 16 1.00 S BD44 9.6 1 1 9 74 15 0.97 S BD73 22.6 1 4 20 64 11 1.12 S
BD106 20.0 1 1 3 14 69 12 1.08 S BD72 23.8 2 18 42 35 3 1.46 S
BD110 29.8 13 28 34 18 6 1 2.53 S BD57 25.8 1 3 27 48 19 2 1.60 S BD63 26.3 1 4 31 45 17 2 1.59 S BD70 28.5 5 11 29 33 20 2 1.85 S
BD107 25.8 1 12 29 37 20 1 1.74 S BD77 28.0 5 18 26 32 17 2 2.03 S BD56 33.2 1 19 18 30 22 9 1 2.57 (g)S BD69 30.1 4 9 33 33 19 2 1.75 S BD76 29.3 6 11 32 32 18 1 1.89 S BD55 33.9 1 13 17 33 24 11 1 2.31 (g)S
Inshore 10.7 1.0 2.8 6.8 22.6 57.6 9.2 1.26 S Inshore between 17.5 0.4 1.2 5.4 19.2 62.4 11.4 1.13 S
Midshore 22.9 0.1 2.2 5.4 14.5 32.6 39.7 5.5 1.52 (g)S Offshore 29.1 0.2 6.8 13.1 30.4 32.4 15.6 1.5 1.99 (g)S

Assessment of Ecological Effects: For Sand Extraction from the Midshore Pakiri Embayment Assessment of Ecological Effects MBL Midshore Final v3 Final V3 4 September 2020 54
Appendix 3 Seabed Photographs Northern Boundary Te Arai Beach Southern Boundary Te Arai Beach
97 N
TA 5
.3m
71 S
TA 5
.0m
98 N
TA 6
.2m
72 S
TA 6
.1m
99 N
TA 7
.0m
73 S
TA 7
.2m
100
NTA
8.0m
74 S
TA 7
.8m
101
NTA
9.0m
75 S
TA 9
.1m
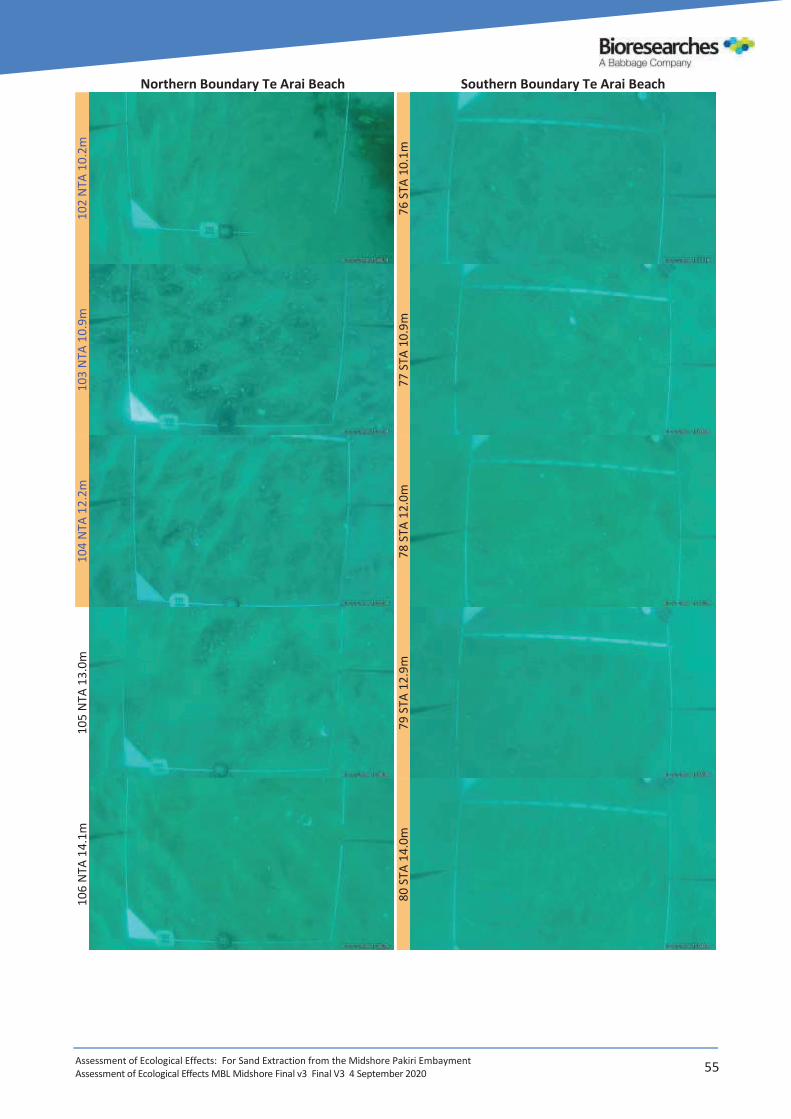
Assessment of Ecological Effects: For Sand Extraction from the Midshore Pakiri Embayment Assessment of Ecological Effects MBL Midshore Final v3 Final V3 4 September 2020 55
Northern Boundary Te Arai Beach Southern Boundary Te Arai Beach 10
2 NT
A 10
.2m
76 S
TA 1
0.1m
103
NTA
10.9
m
77 S
TA 1
0.9m
104
NTA
12.2
m
78 S
TA 1
2.0m
105
NTA
13.0
m
79 S
TA 1
2.9m
106
NTA
14.1
m
80 S
TA 1
4.0m
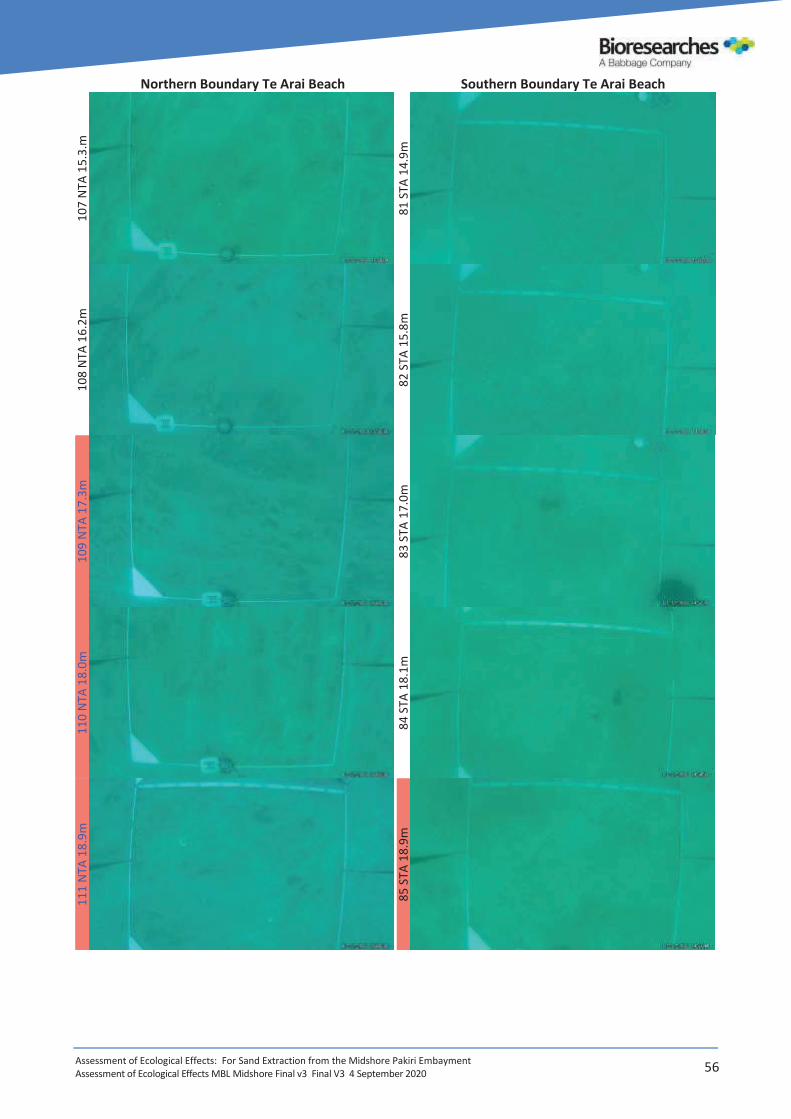
Assessment of Ecological Effects: For Sand Extraction from the Midshore Pakiri Embayment Assessment of Ecological Effects MBL Midshore Final v3 Final V3 4 September 2020 56
Northern Boundary Te Arai Beach Southern Boundary Te Arai Beach 10
7 NT
A 15
.3.m
81 S
TA 1
4.9m
108
NTA
16.2
m
82 S
TA 1
5.8m
109
NTA
17.3
m
83 S
TA 1
7.0m
110
NTA
18.0
m
84 S
TA 1
8.1m
111
NTA
18.9
m
85 S
TA 1
8.9m
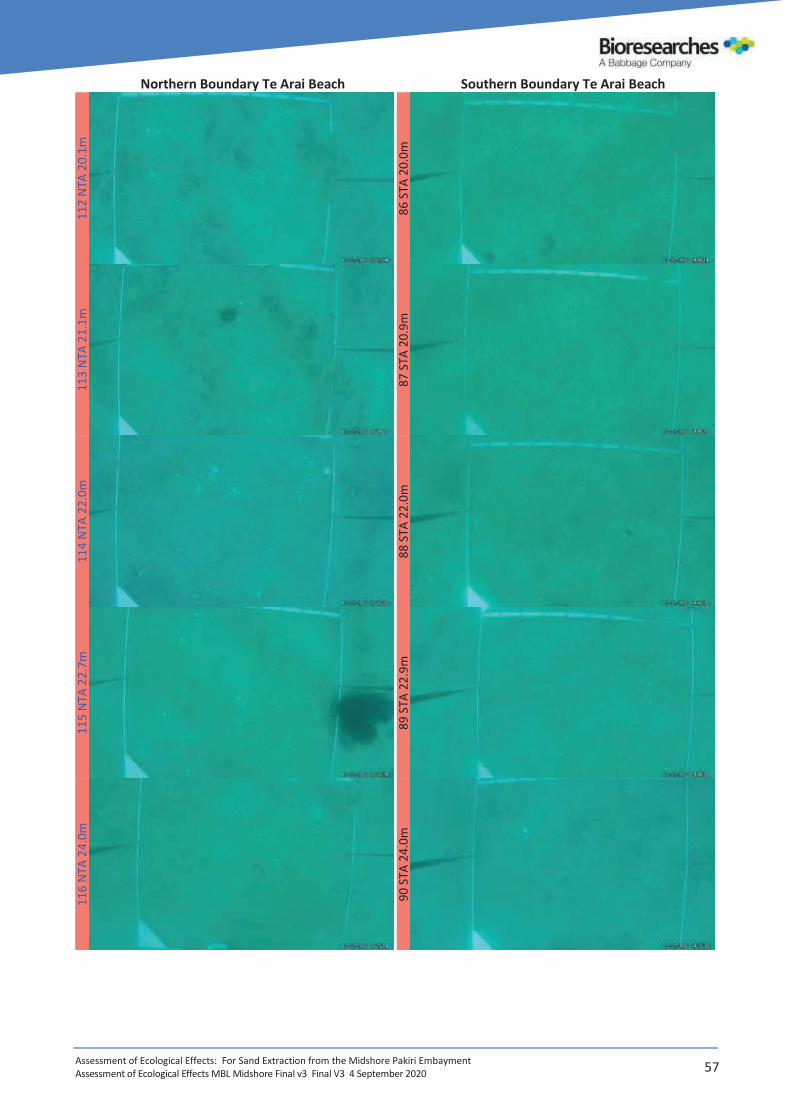
Assessment of Ecological Effects: For Sand Extraction from the Midshore Pakiri Embayment Assessment of Ecological Effects MBL Midshore Final v3 Final V3 4 September 2020 57
Northern Boundary Te Arai Beach Southern Boundary Te Arai Beach 11
2 NT
A 20
.1m
86 S
TA 2
0.0m
113
NTA
21.1
m
87 S
TA 2
0.9m
114
NTA
22.0
m
88 S
TA 2
2.0m
115
NTA
22.7
m
89 S
TA 2
2.9m
116
NTA
24.0
m
90 S
TA 2
4.0m

Assessment of Ecological Effects: For Sand Extraction from the Midshore Pakiri Embayment Assessment of Ecological Effects MBL Midshore Final v3 Final V3 4 September 2020 58
Northern Boundary Te Arai Beach Southern Boundary Te Arai Beach 11
7 NT
A 25
.1m
91 S
TA 2
4.9m
118
NTA
26.0
m
92 S
TA 2
6.0m
119
NTA
27.2
m
93 S
TA 2
7.0m
120
NTA
28.0
m
94 S
TA 2
8.2m
Inshore Midshore Offshore
Inshore Midshore Offshore
Photos are colour-coded according to the consent areas. The blue text represent areas not dredged or not in the proposed dredging but with similar depths to the consent areas.
95 S
TA 2
9.0m
Figure A3.8.1 Drop Camera images from Northern Area Te Arai Beach, March 2019.

Assessment of Ecological Effects: For Sand Extraction from the Midshore Pakiri Embayment Assessment of Ecological Effects MBL Midshore Final v3 Final V3 4 September 2020 59
Northern Boundary Pakiri Beach Southern Boundary Pakiri Beach 25
NP
5.1m
1 SP
5.1
m
26 N
P 6.
1m
2 SP
5.9
m
27 N
P 7.
3m
3 SP
6.9
m
28 N
P 8.
2m
4 SP
8.0
m
29 N
P 9.
0m
5 SP
9.0
m

Assessment of Ecological Effects: For Sand Extraction from the Midshore Pakiri Embayment Assessment of Ecological Effects MBL Midshore Final v3 Final V3 4 September 2020 60
Northern Boundary Pakiri Beach Southern Boundary Pakiri Beach 30
NP
10.0
m
6 SP
9.9
m
31 N
P 11
.2m
7 SP
10.
6m
32 N
P 12
.2m
8 SP
11.
8m
33 N
P 13
.0m
9 SP
12.
8m
34 N
P 14
.3m
10 S
P 13
.9m

Assessment of Ecological Effects: For Sand Extraction from the Midshore Pakiri Embayment Assessment of Ecological Effects MBL Midshore Final v3 Final V3 4 September 2020 61
Northern Boundary Pakiri Beach Southern Boundary Pakiri Beach 35
NP
15.0
m
11 S
P 15
.0m
36 N
P 16
.2m
12 S
P 15
.9m
37 N
P 17
.1m
13 S
P 17
.0m
38 N
P 18
.0m
14 S
P 18
.1m
39 N
P 19
.3m
15 S
P 18
.9m

Assessment of Ecological Effects: For Sand Extraction from the Midshore Pakiri Embayment Assessment of Ecological Effects MBL Midshore Final v3 Final V3 4 September 2020 62
Northern Boundary Pakiri Beach Southern Boundary Pakiri Beach 40
NP
20.1
m
16 S
P 20
.1m
41 N
P 21
.0m
17 S
P 21
.1m
42 N
P 22
.1m
18 S
P 22
.0m
43 N
P 23
.2m
19 S
P 23
.0m
44 N
P 24
.0m
20 S
P 23
.8m

Assessment of Ecological Effects: For Sand Extraction from the Midshore Pakiri Embayment Assessment of Ecological Effects MBL Midshore Final v3 Final V3 4 September 2020 63
Northern Boundary Pakiri Beach Southern Boundary Pakiri Beach 45
NP
25.1
m
21 S
P 25
.2m
46 N
P 26
.3m
22 S
P 25
.8m
47 N
P 27
.2m
23 S
P 27
.0m
48 N
P 28
.2m
24 S
P 28
.6m
49 N
P 29
.1m

Assessment of Ecological Effects: For Sand Extraction from the Midshore Pakiri Embayment Assessment of Ecological Effects MBL Midshore Final v3 Final V3 4 September 2020 64
Northern Boundary Pakiri Beach Southern Boundary Pakiri Beach 50
NP
30.2
m
51 N
P 30
.9m
Inshore Midshore Offshore
Inshore Midshore Offshore
Photos are colour-coded according to the consent areas. The blue text represent areas not dredged or not in the proposed dredging but with similar depths to the consent areas.
Figure A3.8.2 Drop Camera images from Southern area Pakiri Beach, March 2019.

Assessment of Ecological Effects: For Sand Extraction from the Midshore Pakiri Embayment Assessment of Ecological Effects MBL Midshore Final v3 Final V3 4 September 2020 65
Table A3.5 Seabed photography summary descriptions, 2019. (colour-codes correspond to the colours used in Figures A3.1 and A3.2)
Photo ID World Geodetic System 1984 Depth Date Comments Latitude Longitude (m) Substrate Ripples Biota
Northern Boundary Te Arai Beach 97 NTA 5.3 -36.11035 174.61655 5.3 12 Mar 19 sand 100% irregular small 98 NTA 6.2 -36.11017 174.61690 6.2 12 Mar 19 sand 100% irregular small 99 NTA 7.0 -36.11005 174.61730 7.0 12 Mar 19 sand 100% irregular small
100 NTA 8.0 -36.11012 174.61780 8.0 12 Mar 19 Sand 85%, Shell debris 5%, rock 10% medium 101 NTA 9.0 -36.10990 174.61863 9.0 12 Mar 19 sand 100% medium irregular
102 NTA 10.2 -36.10978 174.61905 10.2 12 Mar 19 sand 100% medium irregular 103 NTA 10.9 -36.10967 174.61958 10.9 12 Mar 19 sand 90%, shell debris 10% medium burrows 104 NTA 12.2 -36.10953 174.62023 12.2 12 Mar 19 sand 98%, shell debris 2% medium burrows 105 NTA 13.0 -36.10937 174.62078 13.0 12 Mar 19 sand 95%, shell debris 5% medium burrows 106 NTA 14.1 -36.10930 174.62145 14.1 12 Mar 19 sand 95%, shell debris 5% medium burrows 107 NTA 15.3 -36.10913 174.62213 15.3 12 Mar 19 sand 100% medium flat burrows 108 NTA 16.2 -36.10897 174.62272 16.2 12 Mar 19 sand 100% medium flat 109 NTA 17.3 -36.10855 174.62342 17.3 12 Mar 19 sand 100% medium flat burrows 110 NTA 18.0 -36.10870 174.62400 18.0 12 Mar 19 sand 100% medium flat burrows 111 NTA 18.9 -36.10853 174.62483 18.9 12 Mar 19 sand 98%, shell debris 2% none burrows 112 NTA 20.1 -36.10838 174.62568 20.1 12 Mar 19 sand 98%, shell debris 2% large flat burrows 113 NTA 21.1 -36.10820 174.62655 21.1 12 Mar 19 sand 98%, shell debris 2% large flat burrows 114 NTA 22.0 -36.10792 174.62777 22.0 12 Mar 19 sand 98%, shell debris 2% large flat 115 NTA 22.7 -36.10782 174.62770 22.7 12 Mar 19 sand 98%, shell debris 2% large flat red sea weed 116 NTA 24.0 -36.10743 174.63000 24.0 12 Mar 19 sand 98%, shell debris 2% large flat 117 NTA 25.1 -36.10718 174.63132 25.1 12 Mar 19 sand 98%, shell debris 2% large flat 118 NTA 26.0 -36.10680 174.63268 26.0 12 Mar 19 sand 100% large flat 119 NTA 27.2 -36.10663 174.63403 27.2 12 Mar 19 sand 95%, shell debris 5% large flat 120 NTA 28.0 -36.10628 174.63548 28.0 12 Mar 19 sand 98%, shell debris 2% large flat Southern Boundary Te Arai Beach
71 STA 5.0 -36.15068 174.64438 5.0 12 Mar 19 sand 98%, shell debris 2% irregular 72 STA 6.1 -36.15050 174.64463 6.1 12 Mar 19 sand 100% irregular 73 STA 7.2 -36.15042 174.64502 7.2 12 Mar 19 sand 100% irregular medium 74 STA 7.8 -36.15022 174.64532 7.8 12 Mar 19 sand 98%, shell debris 2% irregular medium 75 STA 9.1 -36.14988 174.64570 9.1 12 Mar 19 sand 98%, shell debris 2% irregular medium
76 STA 10.1 -36.14968 174.64613 10.1 12 Mar 19 sand 95%, shell debris 5% irregular medium flat 77 STA 10.9 -36.14957 174.64650 10.9 12 Mar 19 sand 98%, shell debris 2% irregular medium flat burrows 78 STA 12.0 -36.14945 174.64698 12.0 12 Mar 19 sand 98%, shell debris 2% irregular medium flat burrows 79 STA 12.9 -36.14895 174.64740 12.9 12 Mar 19 sand 100% large flat burrows 80 STA 14.0 -36.14877 174.64775 14.0 12 Mar 19 sand 98%, shell debris 2% irregular small flat burrows large 81 STA 14.9 -36.14843 174.64823 14.9 12 Mar 19 sand 100% none burrows 82 STA 15.8 -36.14828 174.64883 15.8 12 Mar 19 sand 100% none burrows 83 STA 17.0 -36.14780 174.64933 17.0 12 Mar 19 sand 100% none weed 84 STA 18.1 -36.14745 174.65007 18.1 12 Mar 19 sand 100% none 85 STA 18.9 -36.14710 174.65067 18.9 12 Mar 19 sand 100% none

Assessment of Ecological Effects: For Sand Extraction from the Midshore Pakiri Embayment Assessment of Ecological Effects MBL Midshore Final v3 Final V3 4 September 2020 66
Photo ID World Geodetic System 1984 Depth Date Comments Latitude Longitude (m) Substrate Ripples Biota
86 STA 20.0 -36.14655 174.65142 20.0 12 Mar 19 sand 100% large flat 87 STA 20.9 -36.14630 174.65225 20.9 12 Mar 19 sand 100% large flat 88 STA 22.0 -36.14562 174.65318 22.0 12 Mar 19 sand 100% large flat 89 STA 22.9 -36.14508 174.65425 22.9 12 Mar 19 sand 100% large flat 90 STA 24.0 -36.14460 174.65515 24.0 12 Mar 19 sand 100% large flat burrows 91 STA 24.9 -36.14400 174.65615 24.9 12 Mar 19 sand 98%, shell debris 2% large flat burrows 92 STA 26.0 -36.14355 174.65693 26.0 12 Mar 19 sand 98%, shell debris 2% large flat burrows 93 STA 27.0 -36.14288 174.65807 27.0 12 Mar 19 sand 95%, shell debris 5% large flat scallop 94 STA 28.2 -36.14248 174.65882 28.2 12 Mar 19 sand 75%, shell debris 25% none 95 STA 29.0 -36.14198 174.65953 29.0 12 Mar 19 sand 95%, shell debris 5% none burrows
Northern Boundary Pakiri Beach 25 NP 5.1 -36.16768 174.65537 5.1 12 Mar 19 sand 100% irregular small 26 NP 6.1 -36.16737 174.65583 6.1 12 Mar 19 sand 100% small aligned 27 NP 7.3 -36.16707 174.65623 7.3 12 Mar 19 sand 100% medium aligned 28 NP 8.2 -36.16685 174.65642 8.2 12 Mar 19 sand 100% medium irregular 29 NP 9.0 -36.16653 174.65685 9.0 12 Mar 19 sand 100% medium irregular burrows
30 NP 10.0 -36.16612 174.65735 10.0 12 Mar 19 sand 98%, shell debris 2% large with small sub-ripples burrows 31 NP 11.2 -36.16573 174.65792 11.2 12 Mar 19 sand 98%, shell debris 2% large flat 32 NP 12.2 -36.16543 174.65842 12.2 12 Mar 19 sand 98%, shell debris 2% large flat burrows 33 NP 13.0 -36.16497 174.65888 13.0 12 Mar 19 sand 98%, shell debris 2% large flat burrows large 34 NP 14.3 -36.16470 174.65932 14.3 12 Mar 19 sand 98%, shell debris 2% large flat burrows 35 NP 15.0 -36.16428 174.65975 15.0 12 Mar 19 sand 98%, shell debris 2% large flat burrows 36 NP 16.2 -36.16385 174.66040 16.2 12 Mar 19 sand 95%, shell debris 5% none burrows 37 NP 17.1 -36.16342 174.66077 17.1 12 Mar 19 sand 98%, shell debris 2% none burrows 38 NP 18.0 -36.16315 174.66133 18.0 12 Mar 19 sand 98%, shell debris 2% none burrows 39 NP 19.3 -36.16278 174.66177 19.3 12 Mar 19 sand 98%, shell debris 2% none burrows 40 NP 20.1 -36.16240 174.66242 20.1 12 Mar 19 sand 100% none burrows 41 NP 21.0 -36.16193 174.66287 21.0 12 Mar 19 sand 98%, shell debris 2% none burrows 42 NP 22.1 -36.16148 174.66338 22.1 12 Mar 19 sand 98%, shell debris 2% large flat 43 NP 23.2 -36.16110 174.66382 23.2 12 Mar 19 sand 95%, shell debris 5% none weed 44 NP 24.0 -36.16053 174.66450 24.0 12 Mar 19 sand 95%, shell debris 5% large flat burrows, weed 45 NP 25.1 -36.16022 174.66493 25.1 12 Mar 19 sand 95%, shell debris 5% none 46 NP 26.3 -36.15995 174.66607 26.3 12 Mar 19 sand 98%, shell debris 2% none burrows, weed 47 NP 27.2 -36.15925 174.66662 27.2 12 Mar 19 sand 100% large flat 48 NP 28.2 -36.15850 174.66723 28.2 12 Mar 19 sand 95%, shell debris 5% large flat burrows 49 NP 29.1 -36.15803 174.66798 29.1 12 Mar 19 sand 90%, shell debris 10% large flat weed 50 NP 30.2 -36.15768 174.66850 30.2 12 Mar 19 sand 80%, shell debris 20% large flat weed 51 NP 30.9 -36.15708 174.66910 30.9 12 Mar 19 sand 80%, shell debris 20% large flat weed
Southern Boundary Pakiri Beach 1 SP 5.1 -36.19347 174.67617 5.1 12 Mar 19 sand 100% irregular small burrows 2 SP 5.9 -36.19337 174.67657 5.9 12 Mar 19 sand 100% small aligned 3 SP 6.9 -36.19307 174.67682 6.9 12 Mar 19 sand 98%, shell debris 2% medium aligned burrows 4 SP 8.0 -36.19305 174.67725 8.0 12 Mar 19 sand 95%, shell debris 5% medium aligned burrows

Assessment of Ecological Effects: For Sand Extraction from the Midshore Pakiri Embayment Assessment of Ecological Effects MBL Midshore Final v3 Final V3 4 September 2020 67
Photo ID World Geodetic System 1984 Depth Date Comments Latitude Longitude (m) Substrate Ripples Biota
5 SP 9.0 -36.19278 174.67790 9.0 12 Mar 19 sand 90%, shell debris 10% medium aligned 6 SP 9.9 -36.19257 174.67808 9.9 12 Mar 19 sand 95%, shell debris 5% large with small sub-ripples
7 SP 10.6 -36.19235 174.67843 10.6 12 Mar 19 sand 95%, shell debris 5% large 8 SP 11.8 -36.19212 174.67893 11.8 12 Mar 19 sand 90%, shell debris 10% medium aligned burrows 9 SP 12.8 -36.19190 174.67923 12.8 12 Mar 19 sand 90%, shell debris 10% large aligned burrows
10 SP 13.9 -36.19160 174.67970 13.9 12 Mar 19 sand 95%, shell debris 5% large smooth burrows common, C. adspersa 11 SP 15.0 -36.19132 174.68003 15.0 12 Mar 19 sand 95%, shell debris 5% medium flat burrows 12 SP 15.9 -36.19115 174.68030 15.9 12 Mar 19 sand 95%, shell debris 5% medium flat burrows large 13 SP 17.0 -36.19088 174.68073 17.0 12 Mar 19 sand 98%, shell debris 2% none burrows large 14 SP 18.1 -36.19060 174.68120 18.1 12 Mar 19 sand 98%, shell debris 2% none burrows large 15 SP 18.9 -36.19030 174.68160 18.9 12 Mar 19 sand 95%, shell debris 5% none burrows 16 SP 20.1 -36.18987 174.68230 20.1 12 Mar 19 sand 95%, shell debris 5% none burrows 17 SP 21.1 -36.18952 174.68285 21.1 12 Mar 19 sand 98%, shell debris 2% medium flat 18 SP 22.0 -36.18893 174.68365 22.0 12 Mar 19 sand 95%, shell debris 5% large flat burrows 19 SP 23.0 -36.18823 174.68467 23.0 12 Mar 19 sand 98%, shell debris 2% large flat 20 SP 23.8 -36.18782 174.68530 23.8 12 Mar 19 sand 100% none 21 SP 25.2 -36.18758 174.68588 25.2 12 Mar 19 sand 100% none 22 SP 25.8 -36.18707 174.68652 25.8 12 Mar 19 sand 100% large flat 23 SP 27.0 -36.18593 174.68827 27.0 12 Mar 19 sand 95%, shell debris 5% none 24 SP 28.6 -36.18478 174.69015 28.6 12 Mar 19 sand 98%, shell debris 2% none

Assessment of Ecological Effects: For Sand Extraction from the Midshore Pakiri Embayment Assessment of Ecological Effects MBL Midshore Final v3 Final V3 4 September 2020 68
Appendix 4 Benthic Fauna
Table A4.6 Benthic Infauna Retained in 1 mm screen samples from the currently consented sand extraction areas and control (“Inshore”), 2019 (Number per sample).
Taxa Area Current Consent (inshore)
North South Control Sample number 01 05 11 19 114 27 04 10 18 26 39 46 54 111 62 68 45 53 109 61 75 82 88 100 94 74 105 81 87 93
Depth (m) 5 6 10 8 9 5 9 16 11 13 3 8 19 12 5 6 7 21 17 10 7 6 6 6 11 15 12 11 11 18 Annelida Polychaeta Paraprionospio pinnata 1 7 Cirratulidae 2 ?Aglaophamus/Nephtys 1 Phyllodocidae 1 Magelona cf. dakini 2 1 Capitellidae 1 Armandia cf. maculata 2 2 2 1 1 Maldanidae 2 3 2 1 1 ?Aricidea sp. 1 Scalibregmidae 1 Polychaeta undet. 2 1 1 1 1 Nemertea Nemertea 1 1 Arthropoda Malacostraca Amphipoda Gammaridea undet. 2 1 1 1 1 Lysianassidae 4 Phoxocephalidae sp. 1 2 1 1 3 1 4 1 2 2 Phoxocephalidae sp. 2 1 2 Phoxocephalidae sp. 3 1 1 1 Haustoriidae 2 1 2 1 3 1 Liljeborgiidae 1 1 Cumacea Cyclaspis elegans 2 1 Cyclaspis cf. levis 1 1 1 1 Decapoda Paguridae 1 Isopoda Sphaeromatidae sp. 1 3 2 Paranthura sp. 1 Cirolanidae sp. 1 1 1 1 1 1 3 1 Cirolanidae sp. 2 1 Mysida Tenagomysis spp. 1 1 1 1 Mollusca Gastropoda Zethalia zelandica 6 2 20 2 Antisolarium egenum 1 Maoricolpus roseus 1 Epitonium jukesianum 1 Amalda depressa 1 Turbonillia sp. 1 Bivalvia Nucula nitidula 1 1 1 Hiatula nitida 1 Tawera spissa 1 Myadora boltoni 1 1 Myadora striata 1 Echinodermata Ophiuroidea Amphiura aster 1 1 Chordata Leptocardii Epigonichthys hectori 1 1 1 3 7 3 Actinopterygii Limnichthys polyactis 1 Number of Species / taxa 1 1 4 0 1 1 2 7 5 9 1 1 5 9 2 0 0 10 3 1 1 0 8 0 6 3 6 10 2 4 Number of Individuals 6 2 6 0 1 20 4 10 5 12 2 1 7 11 3 0 0 19 4 1 1 0 17 0 6 3 8 21 2 6 Shannon - Wiener Diversity Index 0.00 0.00 1.33 0.00 0.00 0.00 0.56 1.89 1.61 2.14 0.00 0.00 1.55 2.10 0.64 0.00 0.00 2.16 1.04 0.00 0.00 0.00 1.71 0.00 1.79 1.10 1.67 2.02 0.69 1.33
Table A4.7 Benthic Infauna Retained in 3.15 mm screen samples from the currently consented sand
extraction areas and control (“Inshore”), 2019 (Number per sample).
Taxa Area Current Consent (inshore)
North South Control Sample number 1 5 11 19 114 27 4 10 18 26 39 46 111 54 62 68 45 53 109 61 75 82 88 100 94 105 74 81 87 93
Depth (m) 5 6 10 8 9 5 9 16 11 13 3 8 12 19 5 6 7 21 17 10 7 6 6 6 11 12 15 11 11 18 Annelida Polychaeta Hydroides sp. 1 1 ?Prionospio sp. 1 Paraprionospio pinnata 1 4 Terebellidae 4 Ampharetidae 1 2 2 4 Cirratulidae 3 1 Eunicidae 2 Lumbrineries sp. 1 Onuphidae 1 Nephtyidae 1 ?Aglaophamus/Nephtys 1 1 Phyllodocidae 1 Polynoidae 1 Sigalionidae 2 1 Syllidae 1 Magelona cf. dakini 1 Capitellidae 1 3 1 1 1 1 Armandia cf. maculata 1 Maldanidae 7 4 5 3 2 4 6 13 4 1 7 3 7 4 3 1 5 1 6 Polychaeta undet. 2 1 2 3 20 5 2 Nemertea Nemertea 1 1 Arthropoda Neocopepoda Calanoida 2 Cyclopoida 3

Assessment of Ecological Effects: For Sand Extraction from the Midshore Pakiri Embayment Assessment of Ecological Effects MBL Midshore Final v3 Final V3 4 September 2020 69
Taxa Area Current Consent (inshore)
North South Control Sample number 1 5 11 19 114 27 4 10 18 26 39 46 111 54 62 68 45 53 109 61 75 82 88 100 94 105 74 81 87 93
Depth (m) 5 6 10 8 9 5 9 16 11 13 3 8 12 19 5 6 7 21 17 10 7 6 6 6 11 12 15 11 11 18 Malacostraca Amphipoda Gammaridea undet. 5 1 Gammaridea sp. 2 2 Gammaridea sp. 3 22 Gammaridea sp. 5 1 Phoxocephalidae sp. 1 3 3 1 3 1 Phoxocephalidae sp. 3 1 Haustoriidae 1 Corophiidae 1 Cumacea Cyclaspis cf. levis 2 Decapoda Periclimenes yaldwyni 1 1 Pontophilus sp. 1 Liocarcinus corrugatus 1 1 1 1 Ovalipes catharus 1 Ebalia laevis 2 1 1 Anomura 1 1 1 3 1 1 Paguridae 1 9 1 21 2 2 1 1 2 Paguristes setosus 1 1 Isopoda Sphaeromatidae sp. 1 1 2 Paranthura sp. 2 1 1 1 Cirolanidae sp. 1 3 2 1 2 Mysida Tenagomysis spp. 1 1 1 Tenagomysis producta 1 Stomatopoda Pariliacantha georgeorum 1 1 1 Tanaidacea Tanaidacea 1 Insecta Coleoptera undet. 1 Mollusca Polyplacophora Leptochiton inquinatus 5 Gastropoda Zethalia zelandica 30 42 1 204 Antisolarium egenum 1 2 2 1 Maoricolpus roseus 1 1 Striacolpus pagoda 3 2 4 Sigapatella tenuis 1 1 3 1 2 1 3 4 1 Trichosirius inornatus 1 Tanea zelandica 1 Semicassis pyrum (juvenile) 1 Cominella adspersa 1 Cominella quoyana 2 1 2 1 1 Austrofusus glans 1 Amalda australis 1 Amalda depressa 1 Amalda novaezelandiae 1 2 ?Antiguraleus sp. 2 Euterebra tristis 1 1 Pupa affinis 1 1 5 Cylichna thetidis 1 Bivalvia Nucula nitidula 2 5 9 3 1 1 Glycymeris modesta 1 Purpurocardia purpurata 1 Athritica bifurcata 1 1 Gari convexa 1 Gari lineolata 2 1 Gari stangeri 2 Hiatula nitida 1 1 Zemysina globus 1 Bassinia yatei 1 Tawera spissa 3 1 1 Dosinia lambata 1 Dosinia maoriana 1 Dosinia subrosea 1 1 2 1 1 1 Corbula zelandica 10 Myadora boltoni 1 3 4 1 1 2 1 1 2 Myadora striata 1 4 3 4 1 1 1 2 Myadora subrostrata 6 Echinodermata Ophiuroidea Amphiura aster 1 3 1 1 Echinoidea Fellaster zelandiae 7 Nematoda Nematoda 7 Foraminifera Foraminifera 1 3 Bryozoa Selenaria concinna 4 4 1 1 Bryozoa 3 Porifera Beige finger sponge 1 7 1 Cnidaria Hydrozoa Leptothecata 1 Chordata Thaliacia Salpida 1 Leptocardii Epigonichthys hectori 1 4 1 8 1 13 10 2 9 Actinopterygii Limnichthys polyactis 1 Number of Species / taxa 2 5 7 9 9 9 2 12 10 5 3 8 3 2 5 9 38 13 3 19 12 8 3 16 3 8 11 3 3 2 Number of Individuals 31 50 17 20 16 10 2 28 15 16 206 20 15 2 8 15 174 26 4 39 37 17 3 20 3 18 20 9 3 7 Shannon - Wiener Diversity Index 0.14 0.64 1.62 2.07 1.98 2.16 0.69 2.17 2.21 1.53 0.06 1.88 0.49 0.69 1.39 1.95 3.13 2.41 1.04 2.68 2.10 1.48 1.10 2.69 1.10 1.64 2.18 0.68 1.10 0.41

Assessment of Ecological Effects: For Sand Extraction from the Midshore Pakiri Embayment Assessment of Ecological Effects MBL Midshore Final v3 Final V3 4 September 2020 70
Table A4.8 Benthic Infauna Retained in 1 mm screen samples from the proposed sand extraction areas (“Midshore”), 2019 (Number per sample).
Taxa Area Proposed New Consent Area (midshore)
Northern Te Arai Point Southern Sample number 2 8 119 7 6 120 117 16 115 15 14 25 24 23 33 112 32 31 37 38 43 42 52 51 50 60 108 59 58 66 65 64 71
Depth (m) 19 23 22 30 27 26 17 28 23 24 25 16 20 25 16 21 23 24 19 19 20 21 22 24 30 21 21 23 24 15 24 25 25 Annelida Polychaeta ?Euchone sp. 1 1 ?Prionospio sp. 1 Spionidae 1 Ampharetidae 1 Cirratulidae 3 1 1 2 1 Eunicidae 1 Goniadidae 1 Nephtyidae 1 Phyllodocidae 1 1 1 Polynoidae 1 Sigalionidae 1 1 1 1 Capitellidae 1 2 1 Armandia cf. maculata 1 1 1 1 1 Maldanidae 1 3 1 1 2 1 4 1 2 1 1 1 3 2 1 2 4 4 2 1 1 1 ?Aricidea sp. 1 1 Polychaeta undet. 1 1 2 1 2 Nemertea Nemertea 1 1 1 1 Arthropoda Malacostraca Amphipoda Gammaridea undet. 1 1 Gammaridea sp. 2 1 Lysianassidae 1 Phoxocephalidae sp. 1 2 1 5 2 1 1 1 1 1 1 Phoxocephalidae sp. 2 1 1 2 1 Phoxocephalidae sp. 3 2 Haustoriidae 1 2 Liljeborgiidae 1 1 2 Cumacea Cyclaspis elegans 1 Cyclaspis cf. levis 1 1 1 1 Diastylopsis thileniusi 1 Cumacean undet. 1 Decapoda Callianassa sp. 1 Callianassidae 1 Anomura 6 Isopoda Sphaeromatidae sp. 1 1 1 5 1 1 1 Cirolanidae sp. 1 1 Cirolanidae sp. 2 Isopoda undet. 1 Mysida Tenagomysis spp. 1 1 1 Ostracoda Leuroleberis zealandica 1 1 1 Myodocopida sp. 1 1 Mollusca Gastropoda Roseaplagis rufozona 1 Sigapatella tenuis 1 Mesoginella larochei 1 1 Amalda novaezelandiae 1 Bivalvia Nucula nitidula 1 2 Limatula maoria 1 Myllita vivens 1 Athritica bifurcata 3 Gari stangeri 1 Zemysina globus 1 Tawera spissa 1 Myadora striata 1 Myadora subrostrata 1 Echinodermata Holothuroidea ?Kolostoneura sp. 1 Ophiuroidea Amphiura aster 1 Ophiozonoida picta 1 1 Echinoidea Apatopygus recens 1 Nematoda Nematoda 3 Bryozoa Selenaria concinna 1 1 1 Bryozoa 3 Hemichordata Enteropneusta 1 Chordata Leptocardii Epigonichthys hectori 1 2 1 1 1 1 1 1 Number of Species / taxa 5 3 5 2 1 3 5 2 1 3 8 7 6 4 4 2 2 7 6 0 6 5 4 4 13 5 6 3 4 4 8 5 2 Number of Individuals 6 3 7 4 2 3 9 2 2 3 8 12 6 5 8 3 2 7 7 0 6 7 7 4 24 8 8 7 6 4 8 6 2 Shannon - Wiener Diversity Index 1.56 1.10 1.48 0.56 0.00 1.10 1.30 0.69 0.00 1.10 2.08 1.79 1.79 1.33 1.07 0.64 0.69 1.95 1.75 0.00 1.79 1.48 1.28 1.39 2.34 1.39 1.73 0.96 1.33 1.39 2.08 1.56 0.69

Assessment of Ecological Effects: For Sand Extraction from the Midshore Pakiri Embayment Assessment of Ecological Effects MBL Midshore Final v3 Final V3 4 September 2020 71
Table A4.9 Benthic Infauna Retained in 3.15 mm screen samples from the proposed sand extraction areas (“Midshore”), 2019 (Number per sample).
Taxa Area Proposed New Consent Area (midshore)
Northern Te Arai Point Southern Sample number 2 8 119 7 6 120 117 16 115 15 14 25 24 23 33 112 32 31 37 38 43 42 52 51 50 60 108 59 58 66 65 64 71
Depth (m) 19 23 22 30 27 26 17 28 23 24 25 16 20 25 16 21 23 24 19 19 20 21 22 24 30 21 21 23 24 15 24 25 25 Annelida Polychaeta Hydroides sp. 1 2 1 14 Paraprionospio pinnata 1 Terebellidae 1 1 1 2 3 1 Ampharetidae 1 2 2 ?Lanice sp. 1 Cirratulidae 1 1 4 1 1 1 ?Lagis australis 2 Eunicidae 1 1 1 Lumbrineries sp. 1 1 1 Onuphidae 1 ?Aglaophamus/Nephtys 1 Neanthes cricognatha 1 Nereididae 1 Phyllodocidae 1 1 Polynoidae 1 1 Sigalionidae 2 1 2 2 1 1 1 2 Magelona cf. dakini 1 1 1 1 Capitellidae 8 2 2 1 2 8 Cossuridae 2 1 Maldanidae 9 8 1 5 1 1 1 3 10 4 12 4 2 4 6 6 4 10 4 2 11 Travisia olens 3 Polychaeta undet. 1 1 1 8 7 1 1 1 6 1 5 Nemertea Nemertea 1 1 1 1 1 1 Arthropoda Malacostraca Amphipoda Gammaridea undet. 1 1 1 1 Gammaridea sp. 2 1 1 1 Gammaridea sp. 3 4 1 3 1 Gammaridea sp. 5 2 Lysianassidae 1 Phoxocephalidae sp. 1 1 2 1 1 1 1 1 3 Liljeborgiidae 1 1 1 1 5 Cumacea Cyclaspis cf. levis 1 1 Decapoda Ogyrides delli 2 Liocarcinus corrugatus 1 1 2 Ovalipes catharus 1 Ebalia laevis 1 1 1 1 Notomithrax minor 1 1 Anomura 1 1 1 Paguridae 1 1 2 1 13 1 1 3 17 Paguristes setosus 1 Isopoda Sphaeromatidae sp. 1 2 Sphaeromatidae sp. 2 1 Paranthura sp. 1 1 1 1 Cirolanidae sp. 1 1 Isopoda undet. 1 1 Mysida Tenagomysis spp. 1 1 Stomatopoda Pariliacantha georgeorum 1 1 Ostracoda Myodocopida sp. 1 1 Myodocopida sp. 2 2 Pycnogonida Pycnogonida 1 Insecta Coleoptera undet. 1 Mollusca Polyplacophora Ischnochiton maorianus 1 1 Leptochiton inquinatus 1 10 1 3 3 Gastropoda Zethalia zelandica 4 15 Antisolarium egenum 1 4 1 2 1 Roseaplagis rufozona 1 Solariella tryphenensis 1 Maoricolpus roseus 1 Striacolpus pagoda 4 1 9 1 1 1 1 2 2 1 Rissoina fictor 1 2 1 2 Pisinna semisulcata 1 Sigapatella tenuis 2 1 1 1 1 1 3 2 2 Trichosirius inornatus 1 Seila cf. cincta 1 1 Epitonium jukesianum 1 Cominella quoyana 1 1 1 2 2 3 3 1 1 6 Austrofusus glans 1 Zemitrella aff. regis 1 Amalda australis 1 2 1 Amalda depressa 1 Amalda novaezelandiae 1 1 1 Antimelatoma buchanani maorum 1 Euterebra tristis 1 Cylichna thetidis 1 1 1

Assessment of Ecological Effects: For Sand Extraction from the Midshore Pakiri Embayment Assessment of Ecological Effects MBL Midshore Final v3 Final V3 4 September 2020 72
Taxa Area Proposed New Consent Area (midshore)
Northern Te Arai Point Southern Sample number 2 8 119 7 6 120 117 16 115 15 14 25 24 23 33 112 32 31 37 38 43 42 52 51 50 60 108 59 58 66 65 64 71
Depth (m) 19 23 22 30 27 26 17 28 23 24 25 16 20 25 16 21 23 24 19 19 20 21 22 24 30 21 21 23 24 15 24 25 25 Bivalvia Nucula nitidula 2 2 2 8 1 2 12 1 14 Glycymeris modesta 2 1 Talochlamys zelandiae 1 Limatula maoria 1 Pleuromeris latiuscula 1 Pleuromeris paucicostata 1 1 3 Pleuromeris zelandica 1 Purpurocardia purpurata 1 3 2 Myllita vivens 1 Scalpomactra scalpellum 1 Gari convexa 1 Gari stangeri 1 3 1 1 Hiatula nitida 1 Zemysina zelandica 1 Zemysina globus 1 Notocallista multistriata 1 Tawera spissa 1 Dosinia lambata 1 Dosinia maoriana 1 1 1 Dosinia subrosea 1 1 1 1 Corbula zelandica 1 3 1 Myadora boltoni 1 4 4 11 1 Myadora striata 1 2 5 1 2 Myadora subrostrata 1 1 2 1 Hunkydora novozelandica 1 Bivalvia undet. 1 Echinodermata Holothuroidea Holothuroidea 1 Ophiuroidea Amphiura aster 1 1 1 1 Ophiocentrus novaezelandiae 1 Ophiozonoida picta 2 Echinoidea Fellaster zelandiae 1 3 Nematoda Nematoda 1 Foraminifera Foraminifera 24 Bryozoa Selenaria concinna 1 1 1 1 1 2 2 5 2 Bryozoa 12 Porifera Callyspongiidae 1 Beige finger sponge 1 6 2 12 Orange sponge 1 Black sponge 1 Cnidaria Hydrozoa Leptothecata 1 1 Hemichordata Enteropneusta 1 Chordata Ascidiacea Stolidobranchia 1 Molgula sp. 1 2 Leptocardii Epigonichthys hectori 1 1 2 3 1 1 1 3 1 6 Actinopterygii Limnichthys polyactis 1 2 1 1 Number of Species / taxa 12 7 5 13 13 8 4 3 4 13 7 2 8 2 6 1 18 32 5 9 11 9 6 6 22 20 12 5 5 12 10 4 47 Number of Individuals 22 15 5 18 22 9 11 3 7 23 16 5 25 3 6 1 23 84 12 21 17 16 8 20 56 27 19 9 15 18 12 20 184 Shannon - Wiener Diversity Index 2.07 1.51 1.61 2.43 2.35 2.04 0.89 1.10 1.15 2.13 1.33 0.50 1.64 0.64 1.79 0.00 2.77 3.01 1.52 1.91 2.26 2.01 1.67 1.27 2.75 2.90 2.23 1.43 1.08 2.32 2.25 0.80 3.25
Table A4.10 Benthic Infauna Retained in 1 mm screen samples from Offshore and “Inshore Between”
areas, 2019 (Number per sample).
Taxa Area Inshore Between Offshore
Northern Southern Northern Te Arai Point Southern Sample number 121 3 9 17 44 67 73 106 72 118 13 12 22 116 21 20 30 29 28 113 36 35 34 40 41 49 48 47 110 57 56 55 63 70 107 69 77 76
Depth (m) 17 13 17 15 10 11 23 20 24 28 25 30 26 20 27 27 26 30 31 30 25 26 28 28 22 30 31 31 30 26 33 34 26 29 26 30 28 29 Annelida Polychaeta Spionidae 1 1 Paraprionospio pinnata 1 1 3 Terebellidae 1 1 Ampharetidae 1 1 Cirratulidae 1 1 2 1 1 1 1 1 1 Eunicidae 1 2 Goniadidae 1 Nephtyidae 1 Sigalionidae 1 Magelona cf. dakini 1 Capitellidae 2 5 1 1 Armandia cf. maculata 1 1 Maldanidae 2 2 1 3 2 1 4 1 2 2 1 2 1 4 3 3 1 2 1 1 1 2 2 ?Aricidea sp. 1 7 1 1 Polychaeta undet. 1 1 2 1 1 1 Nemertea Nemertea 1 1 Arthropoda Malacostraca Amphipoda Gammaridea undet. 1 Gammaridea sp. 2 1 Gammaridea sp. 3 1 1 Gammaridea sp. 4 1 Lysianassidae 2 1 Phoxocephalidae sp. 1 1 2 1 5 2 5 1 1 1 1 1 1 1 1 1 1 Phoxocephalidae sp. 2 1 Phoxocephalidae sp. 3 1 1 Haustoriidae 2 1 1 3 2 3 1 Liljeborgiidae 2 1 2 3 2 2 Cumacea Cyclaspis cf. levis 2 1 2 1 Cumacean undet. 1
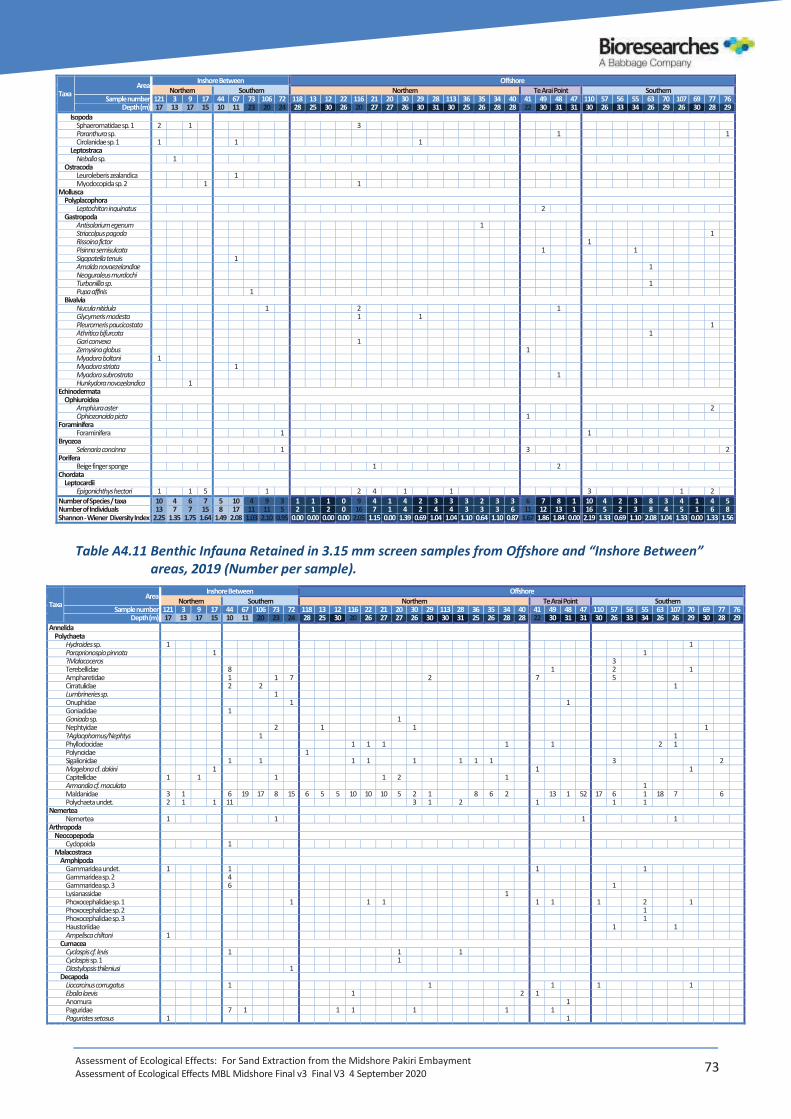
Assessment of Ecological Effects: For Sand Extraction from the Midshore Pakiri Embayment Assessment of Ecological Effects MBL Midshore Final v3 Final V3 4 September 2020 73
Taxa Area Inshore Between Offshore
Northern Southern Northern Te Arai Point Southern Sample number 121 3 9 17 44 67 73 106 72 118 13 12 22 116 21 20 30 29 28 113 36 35 34 40 41 49 48 47 110 57 56 55 63 70 107 69 77 76
Depth (m) 17 13 17 15 10 11 23 20 24 28 25 30 26 20 27 27 26 30 31 30 25 26 28 28 22 30 31 31 30 26 33 34 26 29 26 30 28 29 Isopoda Sphaeromatidae sp. 1 2 1 3 Paranthura sp. 1 1 Cirolanidae sp. 1 1 1 1 Leptostraca Nebalia sp. 1 Ostracoda Leuroleberis zealandica 1 Myodocopida sp. 2 1 1 Mollusca Polyplacophora Leptochiton inquinatus 2 Gastropoda Antisolarium egenum 1 Striacolpus pagoda 1 Rissoina fictor 1 Pisinna semisulcata 1 1 Sigapatella tenuis 1 Amalda novaezelandiae 1 Neoguraleus murdochi Turbonillia sp. 1 Pupa affinis 1 Bivalvia Nucula nitidula 1 2 1 Glycymeris modesta 1 1 Pleuromeris paucicostata 1 Athritica bifurcata 1 Gari convexa 1 Zemysina globus 1 Myadora boltoni 1 Myadora striata 1 Myadora subrostrata 1 Hunkydora novozelandica 1 Echinodermata Ophiuroidea Amphiura aster 2 Ophiozonoida picta 1 Foraminifera Foraminifera 1 1 Bryozoa Selenaria concinna 1 3 2 Porifera Beige finger sponge 1 2 Chordata Leptocardii Epigonichthys hectori 1 1 5 1 2 4 1 1 3 1 2 Number of Species / taxa 10 4 6 7 5 10 4 9 3 1 1 1 0 9 4 1 4 2 3 3 3 2 3 3 6 7 8 1 10 4 2 3 8 3 4 1 4 5 Number of Individuals 13 7 7 15 8 17 11 11 5 2 1 2 0 16 7 1 4 2 4 4 3 3 3 6 11 12 13 1 16 5 2 3 8 4 5 1 6 8 Shannon - Wiener Diversity Index 2.25 1.35 1.75 1.64 1.49 2.08 1.03 2.10 0.95 0.00 0.00 0.00 0.00 2.05 1.15 0.00 1.39 0.69 1.04 1.04 1.10 0.64 1.10 0.87 1.67 1.86 1.84 0.00 2.19 1.33 0.69 1.10 2.08 1.04 1.33 0.00 1.33 1.56
Table A4.11 Benthic Infauna Retained in 3.15 mm screen samples from Offshore and “Inshore Between”
areas, 2019 (Number per sample).
Taxa Area Inshore Between Offshore
Northern Southern Northern Te Arai Point Southern Sample number 121 3 9 17 44 67 106 73 72 118 13 12 116 22 21 20 30 29 113 28 36 35 34 40 41 49 48 47 110 57 56 55 63 107 70 69 77 76
Depth (m) 17 13 17 15 10 11 20 23 24 28 25 30 20 26 27 27 26 30 30 31 25 26 28 28 22 30 31 31 30 26 33 34 26 26 29 30 28 29 Annelida Polychaeta Hydroides sp. 1 1 Paraprionospio pinnata 1 1 ?Malacoceros 3 Terebellidae 8 1 2 1 Ampharetidae 1 1 7 2 7 5 Cirratulidae 2 2 1 Lumbrineries sp. 1 Onuphidae 1 1 Goniadidae 1 Goniada sp. 1 Nephtyidae 2 1 1 1 ?Aglaophamus/Nephtys 1 1 Phyllodocidae 1 1 1 1 1 2 1 Polynoidae 1 Sigalionidae 1 1 1 1 1 1 1 1 3 2 Magelona cf. dakini 1 1 1 Capitellidae 1 1 1 1 2 1 Armandia cf. maculata 1 Maldanidae 3 1 6 19 17 8 15 6 5 5 10 10 10 5 2 1 8 6 2 13 1 52 17 6 1 18 7 6 Polychaeta undet. 2 1 1 11 3 1 2 1 1 1 Nemertea Nemertea 1 1 1 1 Arthropoda Neocopepoda Cyclopoida 1 Malacostraca Amphipoda Gammaridea undet. 1 1 1 1 Gammaridea sp. 2 4 Gammaridea sp. 3 6 1 Lysianassidae 1 Phoxocephalidae sp. 1 1 1 1 1 1 1 2 1 Phoxocephalidae sp. 2 1 Phoxocephalidae sp. 3 1 Haustoriidae 1 1 Ampelisca chiltoni 1 Cumacea Cyclaspis cf. levis 1 1 1 Cyclaspis sp. 1 1 Diastylopsis thileniusi 1 Decapoda Liocarcinus corrugatus 1 1 1 1 1 Ebalia laevis 1 2 1 Anomura 1 Paguridae 7 1 1 1 1 1 1 Paguristes setosus 1 1

Assessment of Ecological Effects: For Sand Extraction from the Midshore Pakiri Embayment Assessment of Ecological Effects MBL Midshore Final v3 Final V3 4 September 2020 74
Taxa Area Inshore Between Offshore
Northern Southern Northern Te Arai Point Southern Sample number 121 3 9 17 44 67 106 73 72 118 13 12 116 22 21 20 30 29 113 28 36 35 34 40 41 49 48 47 110 57 56 55 63 107 70 69 77 76
Depth (m) 17 13 17 15 10 11 20 23 24 28 25 30 20 26 27 27 26 30 30 31 25 26 28 28 22 30 31 31 30 26 33 34 26 26 29 30 28 29 Isopoda Sphaeromatidae sp. 1 1 Paranthura sp. 2 1 1 1 2 2 1 Cirolanidae sp. 1 1 1 Isopoda undet. 1 Mysida Tenagomysis spp. 1 2 Stomatopoda Pariliacantha georgeorum 1 Ostracoda Myodocopida sp. 2 1 Myodocopida undet. 3 Pycnogonida Pycnogonida 1 Mollusca Polyplacophora Leptochiton inquinatus 1 14 Gastropoda Zethalia zelandica 2 1 1 Antisolarium egenum 2 1 2 2 Roseaplagis rufozona 1 Solariella tryphenensis 1 1 Striacolpus pagoda 1 1 1 1 2 Rissoina fictor 2 Pisinna semisulcata 1 Sigapatella tenuis 4 5 1 1 1 4 4 Cominella adspersa 1 1 1 2 Cominella quoyana 2 1 1 1 2 2 3 1 1 2 2 3 Xymenella pusillus 1 Alcithoe arabica (juvenile) 1 Peculator hedleyi 1 Amalda australis 1 2 Amalda novaezelandiae 1 2 1 1 2 Phenatoma zealandicum 1 Antimelatoma buchanani maorum 2 Euterebra tristis 1 1 Pupa affinis 3 1 5 1 Philine sp. 1 Cylichna thetidis 1 Bivalvia Nucula nitidula 7 2 1 4 2 2 5 4 1 1 1 1 2 Glycymeris modesta 1 2 1 2 Pleuromeris latiuscula 1 Pleuromeris paucicostata 1 Purpurocardia purpurata 1 Pratulum pulchellum 1 Athritica bifurcata 1 Scalpomactra scalpellum 1 Gari convexa 1 Gari stangeri 3 1 1 1 Hiatula nitida 1 3 Zemysina globus 1 1 1 1 1 Tawera spissa 2 Dosinia maoriana 1 1 1 1 1 Dosinia subrosea 2 1 1 1 1 1 Corbula zelandica 6 6 Myadora boltoni 5 1 2 1 3 1 1 6 1 9 Myadora striata 1 2 1 3 1 6 Myadora subrostrata 1 1 2 1 1 1 Hunkydora novozelandica 1 1 Bivalvia undet. 1 1 Echinodermata Ophiuroidea Amphiura aster 1 1 1 Amphiura amokurae 1 Echinoidea Fellaster zelandiae 2 1 1 Apatopygus recens 1 Nematoda Nematoda 9 Foraminifera Foraminifera 1 3 Bryozoa Selenaria concinna 1 1 3 4 6 2 2 4 4 1 3 1 1 9 1 9 Bryozoa 1 2 1 1 Porifera Beige finger sponge 3 1 1 1 1 2 2 Black sponge 1 Cnidaria Anthozoa Actiniaria 1 Chordata Leptocardii Epigonichthys hectori 5 1 4 1 1 1 1 1 1 1 2 Actinopterygii Limnichthys polyactis 1 1 Number of Species / taxa 23 4 4 8 36 12 8 8 13 7 6 5 7 10 9 10 14 8 0 7 6 6 10 6 14 14 7 5 8 19 2 12 5 16 10 2 7 3 Number of Individuals 45 4 4 9 117 35 28 16 39 15 12 9 20 22 22 21 21 10 0 9 13 15 14 12 23 32 15 56 24 41 3 27 31 29 20 2 15 3 Shannon - Wiener Diversity Index 2.86 1.39 1.39 2.04 3.20 1.74 1.36 1.65 2.00 1.68 1.54 1.30 1.44 1.79 1.73 2.02 2.53 2.03 0.00 1.89 1.29 1.53 2.14 1.47 2.34 2.10 1.68 0.36 1.17 2.74 0.64 2.06 1.07 2.56 1.87 0.69 1.68 1.10

Assessment of Ecological Effects: For Sand Extraction from the Midshore Pakiri Embayment Assessment of Ecological Effects MBL Midshore Final v3 Final V3 4 September 2020 75
Table A4.12 Benthic Infauna Retained in 1 mm screen samples from the Control area south of the proposed sand extraction areas, 2019 (Number per sample).
Taxa Area Inshore Between Proposed New Consent Area (midshore) Offshore
Control Control Control Sample number 103 104 80 101 79 102 78 86 85 84 92 91 90 96 95 83 89
Depth (m) 18 20 23 21 24 23 27 16 25 25 21 23 26 25 20 26 28 Annelida Polychaeta Terebellidae 1 Ampharetidae 1 1 ?Lanice sp. 2 Cirratulidae 1 1 3 Eunicidae 1 1 Goniadidae 1 Nephtyidae 1 Nereididae 1 1 Phyllodocidae 1 Sigalionidae 1 1 Capitellidae 1 3 Armandia cf. maculata 1 1 2 Maldanidae 2 4 2 2 3 6 1 2 1 4 3 3 ?Aricidea sp. 1 2 Polychaeta undet. 1 1 Nemertea Nemertea 1 Arthropoda Malacostraca Amphipoda Gammaridea undet. 1 1 Gammaridea sp. 2 1 Gammaridea sp. 5 1 1 Lysianassidae Phoxocephalidae sp. 1 1 1 1 2 1 1 1 1 Phoxocephalidae sp. 2 4 Haustoriidae 1 1 1 1 1 Liljeborgiidae 1 2 1 Cumacea Cyclaspis elegans 1 1 1 Cyclaspis cf. levis 1 1 Cyclaspis sp. 1 1 Cyclaspis sp. 2 1 Diastylopsis thileniusi 1 Decapoda Paguridae 1 Isopoda Sphaeromatidae sp. 1 1 1 2 1 Cirolanidae sp. 1 1 1 Mysida Tenagomysis spp. 2 1 1 Stomatopoda Pariliacantha georgeorum 1 Ostracoda Leuroleberis zealandica 1 1 1 1 Mollusca Gastropoda Cominella quoyana 1 1 1 Mesoginella larochei 1 Amalda depressa 1 Neoguraleus murdochi 1 Pupa affinis 1 1 Cylichna thetidis 1 Bivalvia Nucula nitidula 2 1 1 Tawera spissa 2 Myadora boltoni 1 Myadora subrostrata 1 Hunkydora novozelandica 1 Echinodermata Ophiuroidea Amphiura aster 1 2 Bryozoa Selenaria concinna 1 Chordata Leptocardii Epigonichthys hectori 1 3 2 1 Number of Species / taxa 7 5 6 5 8 8 8 14 5 2 0 11 8 2 7 5 5 Number of Individuals 9 6 10 8 9 10 13 18 6 2 0 16 12 4 10 7 7 Shannon - Wiener Diversity Index 1.89 1.56 1.61 1.56 2.04 1.97 1.74 2.55 1.56 0.69 0.00 2.25 1.91 0.56 1.83 1.48 1.48

Assessment of Ecological Effects: For Sand Extraction from the Midshore Pakiri Embayment Assessment of Ecological Effects MBL Midshore Final v3 Final V3 4 September 2020 76
Table A4.13 Benthic Infauna Retained in 3.15 mm screen samples from the Control area south of the proposed sand extraction areas, 2019 (Number per sample).
Taxa Area Inshore Between Proposed New Consent Area (midshore) Offshore
Control Control Control Sample number 103 104 101 80 102 79 78 86 85 84 92 91 90 96 95 83 89
Depth (m) 18 20 21 23 23 24 27 16 25 25 21 23 26 25 20 26 28 Annelida Polychaeta ?Euchone sp. 3 Hydroides sp. 1 1 Spionidae 1 Paraprionospio pinnata 1 Terebellidae 1 Terebellidae 1 2 1 Ampharetidae 4 1 1 ?Lanice sp. 1 Cirratulidae 1 1 1 1 Eunicidae 1 Lumbrineries sp. 1 2 Onuphidae 1 Nephtyidae 1 ?Aglaophamus/Nephtys 1 1 Phyllodoce sp. (Purple) 1 Phyllodocidae 1 Polynoidae 2 1 Sigalionidae 1 2 1 1 1 Pelogenia antipoda 1 Syllidae 4 Capitellidae 1 5 Cossuridae 1 Orbiniidae 1 Maldanidae 3 3 24 8 4 12 6 10 4 24 7 30 3 26 Travisia olens 1 1 Scalibregmidae 1 Polychaeta undet. 1 8 3 1 4 Nemertea Nemertea 1 1 2 Arthropoda Malacostraca Amphipoda Gammaridea undet. 3 Gammaridea sp. 2 14 Gammaridea sp. 3 18 ?Calliopiidae 1 Phoxocephalidae sp. 1 1 1 2 1 Phoxocephalidae sp. 2 1 Liljeborgiidae 1 1 Ampelisca chiltoni 2 Cumacea Cyclaspis sp. 2 1 Diastylopsis thileniusi 1 Decapoda Callianassidae 1 Processa sp. 1 Anomura 2 1 Paguridae 12 2 1 Isopoda Paranthura sp. 2 1 Cirolanidae sp. 1 1 Mysida Tenagomysis spp. 1 1 Stomatopoda Pariliacantha georgeorum 1 Tanaidacea Tanaidacea 1 Ostracoda Myodocopida undet. 5 Mollusca Polyplacophora Leptochiton inquinatus 4 Gastropoda Antisolarium egenum 1 Roseaplagis rufozona 1 Maoricolpus roseus 2 Striacolpus pagoda 1 Pisinna semisulcata 1 Sigapatella tenuis 1 2 1 2 Cominella quoyana 1 12 1 1 1 Xymenella pusillus 1 Amalda australis 2 Amalda novaezelandiae 2 1 Pupa affinis 3 Cylichna thetidis 1 Bivalvia Nucula nitidula 6 3 1 1 7 Pleuromeris latiuscula 2 Purpurocardia purpurata 1 Scalpomactra scalpellum 1 Gari convexa 1 1 Gari stangeri 4 Zemysina globus 1 Tawera spissa 2 Dosinia maoriana 1 Dosinia subrosea 1 Myadora boltoni 1 2 1 Myadora striata 1 1 1 Myadora subrostrata 1 Bivalvia undet. 1 Echinodermata Ophiuroidea Amphiura aster 2 1 2 1 1 1 Echinoidea Fellaster zelandiae 1 Nematoda Nematoda 2 7 Foraminifera Foraminifera 2 14 Bryozoa Selenaria concinna 6 8 Bryozoa 1 Porifera Beige finger sponge 1

Assessment of Ecological Effects: For Sand Extraction from the Midshore Pakiri Embayment Assessment of Ecological Effects MBL Midshore Final v3 Final V3 4 September 2020 77
Taxa Area Inshore Between Proposed New Consent Area (midshore) Offshore
Control Control Control Sample number 103 104 101 80 102 79 78 86 85 84 92 91 90 96 95 83 89
Depth (m) 18 20 21 23 23 24 27 16 25 25 21 23 26 25 20 26 28 Cnidaria Anthozoa Actiniaria 1 Chordata Leptocardii Epigonichthys hectori 12 1 1 1 5 Number of Species / taxa 4 32 3 7 7 10 5 13 5 7 9 3 2 7 11 26 7 Number of Individuals 6 135 26 14 14 23 18 22 9 34 12 4 8 9 40 72 33 Shannon - Wiener Diversity Index 1.24 3.01 0.32 1.45 1.81 1.70 1.29 2.04 1.43 1.10 2.14 1.04 0.38 1.89 1.14 2.86 0.89

Assessment of Ecological Effects: For Sand Extraction from the Midshore Pakiri Embayment Assessment of Ecological Effects MBL Midshore Final v3 Final V3 4 September 2020 78
Table A4.14 Epibenthic Macrofauna Retrieved in Dredge Tows, 2019.
Areas Depth Tow
Number Date Distance Area
Common Name Scientific Name Size Density
Comments Photo (m) (m) m2 mm n /100m²
Curr
ent C
onse
nt (I
nsho
re)
Nort
hern
5 m
35 31 Jan 19 235 152.8 Paddle Crab Ovalipes catharus 30 1 0.65
Sand Dollar Fellaster zelandiae 60 1 0.65
34 15 Apr 19 311 202.2 Isopod (with Kelp) Euidotea peronii
1 0.49 Kelp dweller
Amphipod (with kelp) Gammaridea 5 to 10 5 2.47 Kelp dweller Hermit Crab Paguridae 15, 25 2 0.99
Cartwright Shell Dicathais orbita 15 1 0.49
Sand Dollar Fellaster zelandiae 35 to 70 19 9.40 Lots of Seaweed present
33 15 Apr 19 336 218.4 Paddle Crab Ovalipes catharus 30 1 0.46
Hermit Crab Paguridae 15 1 0.46
Dosinia Dosinia subrosea 25 1 0.46 Lots of Shell Hash Olive Shell Amalda (B.) australis 30 1 0.46
Wheel shell Zethalia zelandica 5 to 15 7 3.21
Sand Dollar Fellaster zelandiae 50 to 60 8 3.66

Assessment of Ecological Effects: For Sand Extraction from the Midshore Pakiri Embayment Assessment of Ecological Effects MBL Midshore Final v3 Final V3 4 September 2020 79
Areas Depth Tow
Number Date Distance Area
Common Name Scientific Name Size Density
Comments Photo (m) (m) m2 mm n /100m²
Curr
ent C
onse
nt (i
nsho
re)
Nort
hern
10 m
22 31 Jan 19 280 182 Nemertean (black) Nemertea 70 1 0.55
Spiny Starfish (arm) Astropecten polyacanthus
1 0.55 Shell Hash
23 31 Jan 19 275 178.8 Paddle Crab Ovalipes catharus 20 1 0.56
Limpet (on shell) Sigapatella tenuis 5 1 0.56
24 31 Jan 19 233 151.5 Nothing in Tow
Curr
ent C
onse
nt (i
nsho
re)
Sout
hern
5 m
32 15 Apr 19 310 201.5 Bamboo Worm Maldanidae 40 1 0.50
Isopod (with Kelp) Euidotea peronii 25 1 0.50
Amphipod (with kelp) Gammaridea 10 2 0.99
Hermit Crab Paguridae 20, 20 2 0.99
Dosinia Dosinia subrosea 20, 25 2 0.99
Olive Shell Amalda (B.) australis 30 1 0.50
Speckled Whelk Cominella adspersa 35, 45 2 0.99
Sand Dollar Fellaster zelandiae 15 1 0.50
Brittle Star Ophiuroidea 60 1 0.50
Ulva Branches
2 0.99 Seaweed
31 15 Apr 19 274 178.1 Polychaete Tube
70 1 0.56 Empty tube
Hermit Crab Paguridae 10 1 0.56
Silky Dosinia Dosinia subrosea 35, 45 2 1.12
Myadora Myadora striata 35 1 0.56
Sand Dollar Fellaster zelandiae 15 1 0.56
Brittle Star Ophiuroidea 100 1 0.56
30 15 Apr 19 296 192.4 Dosinia Dosinia subrosea 30, 30 2 1.04

Assessment of Ecological Effects: For Sand Extraction from the Midshore Pakiri Embayment Assessment of Ecological Effects MBL Midshore Final v3 Final V3 4 September 2020 80
Areas Depth Tow
Number Date Distance Area
Common Name Scientific Name Size Density
Comments Photo (m) (m) m2 mm n /100m²
Sand Dollar Fellaster zelandiae 20, 20, 70, 70 4 2.08
Curr
ent C
onse
nt (i
nsho
re)
Sout
hern
10 m
25 31 Jan 19 272 176.8 Bamboo Worm Maldanidae 30, 60 1 0.57
Paddle Crab Ovalipes catharus 20, 20, 30 3 1.70
Hermit Crab Paguridae 10 1 0.57
Speckled Whelk Cominella adspersa 30 1 0.57
26 14 Feb 19 278 180.7 Hermit Crab Paguridae 30 6 3.32
Speckled Whelk Cominella adspersa 30 1 0.55
Spiny Starfish Astropecten polyacanthus 100 to 200 7 3.87
27 14 Feb 19 228 148.2 Spiny Starfish Astropecten polyacanthus 10 1 0.67
Sand Dollar Fellaster zelandiae 50 1 0.67

Assessment of Ecological Effects: For Sand Extraction from the Midshore Pakiri Embayment Assessment of Ecological Effects MBL Midshore Final v3 Final V3 4 September 2020 81
Areas Depth Tow
Number Date Distance Area
Common Name Scientific Name Size Density
Comments Photo (m) (m) m2 mm n /100m²
Curr
ent C
onse
nt (i
nsho
re)
Cont
rol
5 m
29 15 Apr 19 273 177.5 Polychaete
30 to 65 2 1.13
Paddle Crab Ovalipes catharus 15 1 0.56
Silky Dosinia Dosinia subrosea 40 1 0.56
Myadora Myadora striata 20 1 0.56
Speckled Whelk Cominella adspersa 35 1 0.56
Sand Dollar Fellaster zelandiae 15, 20, 20 3 1.69
Brittle Star - arms Ophiuroidea 80 1 0.56
10 m
28 14 Feb 19 252 163.8 Spiny Starfish Astropecten polyacanthus 130 1 0.61
Prop
osed
New
Con
sent
Are
a (m
idsh
ore)
Nort
hern
15 m
21 31 Jan 19 258 167.7 Hermit Crab Paguridae 30,20 15 8.94
Olive Shell Amalda (B.) australis 30 1 0.60
Polychaete Tube
40 1 0.60 Empty tube Gastropod (Knobbed) Austrofusus glans 30 1 0.60
Gastropod (Speckled) Cominella adspersa 20 1 0.60
20 31 Jan 19 312 202.8 Spiny Starfish Astropecten polyacanthus 40 1 0.49
Speckled Whelk Cominella adspersa 15 1 0.49
Isopod (with Kelp) Isopoda
0.00
19 31 Jan 19 242 157.3 Nothing Present

Assessment of Ecological Effects: For Sand Extraction from the Midshore Pakiri Embayment Assessment of Ecological Effects MBL Midshore Final v3 Final V3 4 September 2020 82
Areas Depth Tow
Number Date Distance Area
Common Name Scientific Name Size Density
Comments Photo (m) (m) m2 mm n /100m²
Prop
osed
New
Con
sent
Are
a (m
idsh
ore)
Nort
hern
20 m
8 31 Jan 19 206 133.9 Sponge – massive brown/orange
Porifera 100 1 0.75
Paddle Crab Liocarcinus corrugatus 20 1 0.75
Crab Pilumnus novaezelandiae 5, 10 2 1.49
Hermit Crab Paguridae
1 0.75
Speckled Whelk Cominella adspersa 25 1 0.75
Polychaete Polychaeta
1 0.75
9 31 Jan 19 290 188.5 Nothing Present
10 31 Jan 19 323 209.95 Hermit Crab Paguristes setosus 20, 40 2 0.95
Prop
osed
New
Con
sent
Are
a
Nort
hern
25 m
7 31 Jan 19 384 249.6 Scallops Pecten novaezelandiae 70, 70, 90, 90, 95, 95 6 2.40
Hermit Crab Paguridae 10 to 50 13 5.21
Paguristes setosus 30 2 0.80
Speckled Whelk Cominella adspersa 30 1 0.40
Sponge red Porifera 50 1 0.40
Bamboo Worm Maldanidae
1 0.40
6 31 Jan 19 330 214.5 Horse Mussel Atrina zelandica 40 1 0.47

Assessment of Ecological Effects: For Sand Extraction from the Midshore Pakiri Embayment Assessment of Ecological Effects MBL Midshore Final v3 Final V3 4 September 2020 83
Areas Depth Tow
Number Date Distance Area
Common Name Scientific Name Size Density
Comments Photo (m) (m) m2 mm n /100m²
Sea Slug Lamellaria ?ophione 10 1 0.47
Hermit Crab Paguridae
1 0.47
Trumpet Shell Ranella australasia 70 1 0.47
Scallops Pecten novaezealandiae 70 1 0.47
Starfish Astropecten polyacanthus 200 1 0.47
Sponge Red encrusting sponge 140 1 0.47
5 31 Jan 19 289 187.9 Scallops Pecten novaezelandiae 50, 60, 80, 90 4 2.13
Hermit Crab Paguridae 10 to 50 5 2.66
Bamboo Worm Maldanidae 50 1 0.53
Dredge Oyster Ostrea chilensis
1 0.53
Prop
osed
New
Con
sent
Are
a (m
idsh
ore)
Sout
hern
15 m
17 14 Feb 19 269 174.9 Spiny Starfish Astropecten polyacanthus 120 3 1.72
Hermit Crab Paguridae 20 to 50 13 7.43
Speckled Whelk Cominella adspersa 20 to 30 6 3.43
Myadora Myadora striata 25 1 0.57
18 31 Jan 19 165 107.25 Spiny Starfish Astropecten polyacanthus 130 1 0.93 Lot of shell Hash Speckled Whelk Cominella adspersa 25,40,40 3 2.80
Hermit Crab Paguridae 5,30,50,60 4 3.73 Myadora Myadora striata 20 1 0.93
16 14 Feb 19 654 425.1 Spiny Starfish Astropecten polyacanthus 130, 120 2 0.47 Hermit Crab Paguridae 10 to 35 4 0.94
Polychaete Tube Maldanidae
2 0.47 Broken (Empty)

Assessment of Ecological Effects: For Sand Extraction from the Midshore Pakiri Embayment Assessment of Ecological Effects MBL Midshore Final v3 Final V3 4 September 2020 84
Areas Depth Tow
Number Date Distance Area
Common Name Scientific Name Size Density
Comments Photo (m) (m) m2 mm n /100m²
Morning Star Tawera spissa 25 1 0.24
Speckled Whelk Cominella adspersa 30 to 45 4 0.94
Ostrich Foot Shell Struthiolaria papulosa 60 1 0.24
Horse Mussel Atrina zelandica 40 1 0.24
Bamboo Worm Maldanidae 40, 60 2 0.47
11 31-Jan-19 298 193.7 Hermit Crab Paguridae 5 to 50 22 11.36
Bamboo Worm Maldanidae 30 1 0.52
Speckled Whelk Cominella adspersa 40 1 0.52
Olive Shell Amalda (B.) australis 20 1 0.52
Bivalve Scalpomactra scalpellum 15 1 0.52
Spiny Starfish Astropecten polyacanthus 100 - 150 8 4.13
Starfish Luidia maculata 250 1 0.52
Ostrich Foot Shell Struthiolaria papulosa 70 1 0.52
Tube Worms (clump) Terebellidae 50 1 0.52
Polychaete Polychaeta 100 1 0.52
12 14-Feb-19 352 228.8 Paddle Crab Ovalipes catharus 30 1 0.44
Spiny Starfish Astropecten polyacanthus 200 1 0.44
Ostrich Foot Shell Struthiolaria papulosa 65, 45 2 0.87
Hermit Crab Paguridae 25 - 40 6 2.62
Hermit Crab Paguristes setosus 25 1 0.44
Silky Dosinia Dosinia subrosea 25 1 0.44
Horse Mussel Atrina zelandica 50 1 0.44
Polychaete
60 1 0.44 Empty tube Red Sponge (on hermit crab)
Porifera 40 1 0.44
Bamboo Worm Maldanidae 50 1 0.44
13 14-Feb-19 245 159.25 Hermit Crab Paguridae 30 - 50 6 3.77
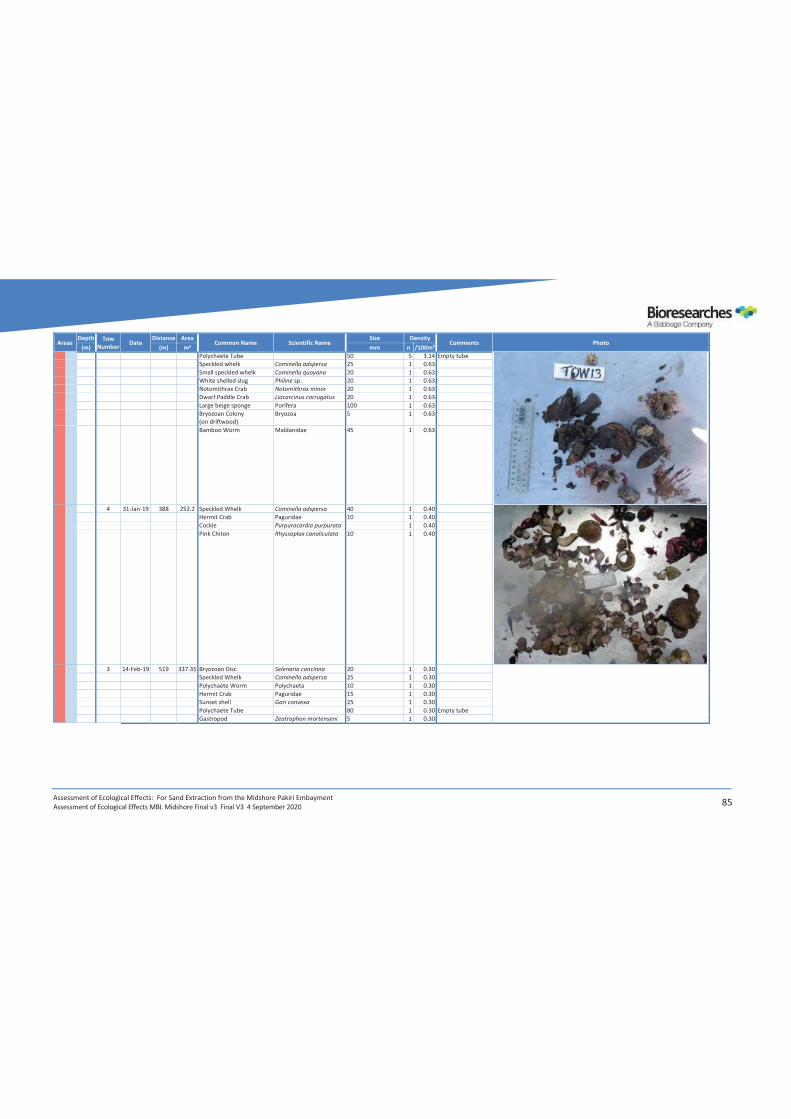
Assessment of Ecological Effects: For Sand Extraction from the Midshore Pakiri Embayment Assessment of Ecological Effects MBL Midshore Final v3 Final V3 4 September 2020 85
Areas Depth Tow
Number Date Distance Area
Common Name Scientific Name Size Density
Comments Photo (m) (m) m2 mm n /100m²
Polychaete Tube
50 5 3.14 Empty tube
Speckled whelk Cominella adspersa 25 1 0.63
Small speckled whelk Cominella quoyana 20 1 0.63
White shelled slug Philine sp. 20 1 0.63
Notomithrax Crab Notomithrax minor 20 1 0.63
Dwarf Paddle Crab Liocarcinus corrugatus 20 1 0.63
Large beige sponge Porifera 100 1 0.63
Bryozoan Colony (on driftwood)
Bryozoa 5 1 0.63
Bamboo Worm Maldanidae 45 1 0.63
4 31-Jan-19 388 252.2 Speckled Whelk Cominella adspersa 40 1 0.40
Hermit Crab Paguridae 10 1 0.40
Cockle Purpurocardia purpurata
1 0.40
Pink Chiton Rhyssoplax canaliculata 10 1 0.40
3 14-Feb-19 519 337.35 Bryozoan Disc Selenaria concinna 20 1 0.30
Speckled Whelk Cominella adspersa 25 1 0.30
Polychaete Worm Polychaeta 10 1 0.30
Hermit Crab Paguridae 15 1 0.30
Sunset shell Gari convexa 25 1 0.30
Polychaete Tube
80 1 0.30 Empty tube
Gastropod Zeatrophon mortenseni 5 1 0.30

Assessment of Ecological Effects: For Sand Extraction from the Midshore Pakiri Embayment Assessment of Ecological Effects MBL Midshore Final v3 Final V3 4 September 2020 86
Areas Depth Tow
Number Date Distance Area
Common Name Scientific Name Size Density
Comments Photo (m) (m) m2 mm n /100m²
Orange Finger Sponge Porifera 30 1 0.30
2 14-Feb-19 598 388.7 Notomithrax Crab Notomithrax minor 15 1 0.26
Bryozoan Colony (Tree like) Bryozoa 65 2 0.51
Bryozoan Disc Selenaria concinna 5 1 0.26
Polychaete Worm
40 2 0.51
Cont
rol
15 14-Feb-19 321 208.65 Spiny Starfish Astropecten polyacanthus 130, 120 2 0.96
Bamboo Worm Maldanidae 60 2 0.96 Shell Hash present
Black nemertean Nemertea 20 1 0.48
Speckled Whelk Cominella adspersa 30 to 35 3 1.44
Hermit Crab Paguridae 30, 60 2 0.96
14 14-Feb-19 356 231.4 Hermit Crab Paguridae 5 to 60 7 3.03
Scallops Pecten novaezealandiae 110 1 0.43
Spiny Starfish Astropecten polyacanthus 150 1 0.43
Olive Shell Amalda (B.) australis 25 1 0.43
Dwarf Paddle Crab Liocarcinus corrugatus 10 1 0.43

Assessment of Ecological Effects: For Sand Extraction from the Midshore Pakiri Embayment Assessment of Ecological Effects MBL Midshore Final v3 Final V3 4 September 2020 87
Areas Depth Tow
Number Date Distance Area
Common Name Scientific Name Size Density
Comments Photo (m) (m) m2 mm n /100m²
Speckled Whelk Cominella adspersa 30 1 0.43 Also eggs
Red Polychaete Eunicida 70 1 0.43
Black nemertean Nemertea 70 1 0.43
Knob Whelk Austrofusus glans 35 1 0.43
Bivalve Myadora striata 25 1 0.43
1 14-Feb-19 379 246.35 Hermit Crab Paguridae 20 or less 4 1.62
Bamboo Worm Maldanidae 30-60 5 2.03 Mostly empty tubes
Speckled Whelk Cominella adspersa 30 1 0.41

Assessment of Ecological Effects: For Sand Extraction from the Midshore Pakiri Embayment Assessment of Ecological Effects MBL Midshore Final v3 Final V3 4 September 2020 88
Appendix 5 Macrofauna Survivorship
Table A5.15 Numbers of live macrofauna passing through the dredge head (William Fraser) sorted by site and degree of damage, February 2020.
Depth Site Species Damage Intact Sub Lethal Lethal
10 m
10A
Myadora striata 74 8 1 Dosinia sp. 32 3 7 Tawera spissa 8 Cominella adspersa 1 Amalda australis 1 Sigapatella sp. 2 Crab 1 Pagurus 7
10B
Myadora striata 379 14 8 Dosinia sp. 125 3 28 Tawera spissa 11 1 Scalpomactra scalpellum 1 Cominella adspersa 1 1 Sigapatella sp. 1 Crab 1 Pagurus 4 Annelids 2 1
10C
Myadora striata 118 4 2 Dosinia sp. 62 2 13 Bassina yatei 1 Cominella adspersa 1 Sigapatella sp. 1 Crab 2 Pagurus 2 2
10D
Myadora striata 105 3 Dosinia sp. 37 10 Bassina yatei 1 Gari lineolata 1 1 Cominella adspersa 2 Amalda australis 2 Pagurus 2 Annelids 3
10E
Myadora striata 141 2 1 Dosinia sp. 77 2 29 Tawera spissa 3 Gari lineolata 1 Cominella adspersa 3 Amalda australis 3 Crab 2 Pagurus 2
25 m
25A
Dosinia sp. 10 Purpurocardia purpurata 2 Notocallista multistriata 8 Scalpomactra scalpellum 2 Pratulum pulchellum 6 Sigapatella sp. 7 Stiracolpus pagoda 2 Austrofusus glans 1 Cominella quoyana 19 Crabs 6 Starfish 1 Annelids 3
Depth Site Species Damage Intact Sub Lethal Lethal
25 m
25B
Dosinia sp. 11 Purpurocardia purpurata 6 Notocallista multistriata 1 Pratulum pulchellum 4 Gari lineolata 1 Pecten novaezelandiae 1 Sigapatella sp. 2 Cominella quoyana 11 Struthiolaria papulosa 1 Crabs 3 Pagurus 1 Mantis shrimp 1 Starfish 3 Annelid 1 Synodus sp. 1
25C
Dosinia sp. 12 1 Purpurocardia purpurata 4 Notocallista multistriata 1 Pratulum pulchellum 2 Sigapatella sp. 1 Cominella quoyana 14 Xenophalium sp. 1 Amalda australis 1 Pagurus 1 Mantis shrimp 1 Barnacle 1 Annelid 1
25D
Dosinia sp. 10 Notocallista multistriata 1 Pratulum pulchellum 1 Divalucina cumingi 1 Semele sp. 2 Gari lineolata 2 4 Nucula sp. 1 Austrofusus glans 1 Cominella adspersa 1 Cominella quoyana 15 Crab 1 Pagurus 1 1 Mantis shrimp 1 Starfish 1 1 Annelids 2
25E
Dosinia sp. 7 Myadora striata 2 Tawera spissa 1 Purpurocardia purpurata 9 Semele sp. 1 Nucula sp. 1 Struthiolaria vermis 1 Cominella quoyana 10 Sigapatella sp. 14 Crab 5 Mantis shrimp 1 1 Pagurus 1 Synodus sp. 1 Muraenichthys beviceps 1 Branchiostoma 3

Assessment of Ecological Effects: For Sand Extraction from the Midshore Pakiri Embayment Assessment of Ecological Effects MBL Midshore Final v3 Final V3 4 September 2020 89
Table A5.16 Sizes of live macrofauna passing through the dredge head (William Fraser) at 10 m depth sorted by degree of damage, February 2020
Taxonomy Species Average size (mm) Range (mm)
Damage Damage Intact Sub Lethal Lethal Intact Sub Lethal Lethal
Gastropods Amalda australis 20 [14-25] Cominella adspersa 31 36 [23-39] -
Bivalves
Bassina yatei 18 [17-18] Dosinia sp. 17 20 24 [6-40] [6-34] [10-38] Gari lineolata 19 18 Myadora striata 18 18 19 [10-33] [13-26] [12-26] Scalpomactra scalpellum 14 Tawera spissa 9 [6-17]
Crustaceans Crabs 17 [15-20] Table A5.17 Sizes of live macrofauna passing through the dredge head (William Fraser) at 25 m depth
sorted by degree of damage, February 2020
Taxonomy Species Average size (mm) Range (mm)
Damage Damage Intact Sub Lethal Lethal Intact Sub Lethal Lethal
Gastropods
Amalda australis 26 - Austrofusus glans 28 [20-35] Cominella adspersa 17 - Cominella quoyana 17 [13-19] Stiracolpus pagoda 20 [16-24] Struthiolaria papulosa 62 - Struthiolaria vermis 48 - Xenophalium sp. 33 -
Bivalves
Divalucina cumingi 11 [10-19] Dosinia sp. 16 14 [9-30] - Gari lineolata 24 25 [15-30] [20-28] Myadora striata 15 [14-15] Notocallista multistriata 19 [17-22] Nucula sp. 7 - Pecten novaezelandiae 12 Pratulum pulchellum 15 17 - Scalpomactra scalpellum 19 [18-19] Semele sp. 10 [10-12] Tawera spissa 15 Purpurocardia purpurata 21 [10-30]
Crustaceans Crabs 10 9 [6-16] [6-15] Mantis shrimp 29 [24-36]
Echinoderm Starfish 15 18 22 [14-22]
Fish Muraenichthys beviceps 268 - Synodus sp. 39 [37-40]
Lancelet Branchiostoma 40 [27-50]

Assessment of Ecological Effects: For Sand Extraction from the Midshore Pakiri Embayment Assessment of Ecological Effects MBL Midshore Final v3 Final V3 4 September 2020 90
Table A5.18 Photographic records of live macrofauna after passing through the dredge head sorted by site and degree of damage, February 2020.
Site Intact Sub Lethal Damage Lethal Damage
10A
10B

Assessment of Ecological Effects: For Sand Extraction from the Midshore Pakiri Embayment Assessment of Ecological Effects MBL Midshore Final v3 Final V3 4 September 2020 91
Site Intact Sub Lethal Damage Lethal Damage
10C
10D

Assessment of Ecological Effects: For Sand Extraction from the Midshore Pakiri Embayment Assessment of Ecological Effects MBL Midshore Final v3 Final V3 4 September 2020 92
Site Intact Sub Lethal Damage Lethal Damage
10E
25A

Assessment of Ecological Effects: For Sand Extraction from the Midshore Pakiri Embayment Assessment of Ecological Effects MBL Midshore Final v3 Final V3 4 September 2020 93
Site Intact Sub Lethal Damage Lethal Damage
25B
25C

Assessment of Ecological Effects: For Sand Extraction from the Midshore Pakiri Embayment Assessment of Ecological Effects MBL Midshore Final v3 Final V3 4 September 2020 94
Site Intact Sub Lethal Damage Lethal Damage
25D
25E
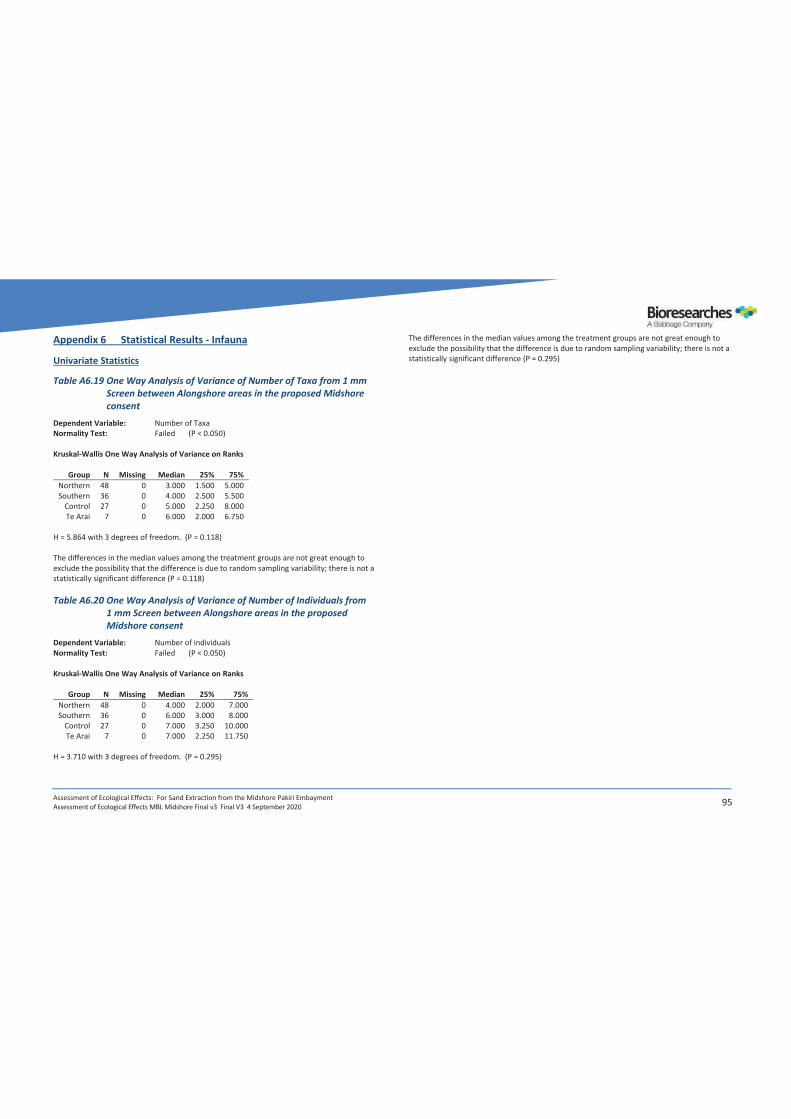
Assessment of Ecological Effects: For Sand Extraction from the Midshore Pakiri Embayment Assessment of Ecological Effects MBL Midshore Final v3 Final V3 4 September 2020 95
Appendix 6 Statistical Results - Infauna
Univariate Statistics
Table A6.19 One Way Analysis of Variance of Number of Taxa from 1 mm Screen between Alongshore areas in the proposed Midshore consent
Dependent Variable: Number of Taxa Normality Test: Failed (P < 0.050) Kruskal-Wallis One Way Analysis of Variance on Ranks
Group N Missing Median 25% 75% Northern 48 0 3.000 1.500 5.000 Southern 36 0 4.000 2.500 5.500
Control 27 0 5.000 2.250 8.000 Te Arai 7 0 6.000 2.000 6.750
H = 5.864 with 3 degrees of freedom. (P = 0.118) The differences in the median values among the treatment groups are not great enough to exclude the possibility that the difference is due to random sampling variability; there is not a statistically significant difference (P = 0.118) Table A6.20 One Way Analysis of Variance of Number of Individuals from
1 mm Screen between Alongshore areas in the proposed Midshore consent
Dependent Variable: Number of individuals Normality Test: Failed (P < 0.050) Kruskal-Wallis One Way Analysis of Variance on Ranks
Group N Missing Median 25% 75% Northern 48 0 4.000 2.000 7.000 Southern 36 0 6.000 3.000 8.000
Control 27 0 7.000 3.250 10.000 Te Arai 7 0 7.000 2.250 11.750
H = 3.710 with 3 degrees of freedom. (P = 0.295)
The differences in the median values among the treatment groups are not great enough to exclude the possibility that the difference is due to random sampling variability; there is not a statistically significant difference (P = 0.295)

Assessment of Ecological Effects: For Sand Extraction from the Midshore Pakiri Embayment Assessment of Ecological Effects MBL Midshore Final v3 Final V3 4 September 2020 96
Table A6.21 One Way Analysis of Variance of Shannon – Weiner Diversity from 1 mm Screen between Alongshore areas in the proposed Midshore consent
Dependent Variable: Shannon-Weiner Diversity index Normality Test: Failed (P < 0.050) Kruskal-Wallis One Way Analysis of Variance on Ranks
Group N Missing Median 25% 75% Northern 48 0 1.099 0.281 1.585 Southern 36 0 1.331 0.822 1.647
Control 27 0 1.561 0.795 1.875 Te Arai 7 0 1.673 0.369 1.827
H = 5.867 with 3 degrees of freedom. (P = 0.118) The differences in the median values among the treatment groups are not great enough to exclude the possibility that the difference is due to random sampling variability; there is not a statistically significant difference (P = 0.118) Table A6.22 One Way Analysis of Variance of Number of Taxa from
3.15 mm Screen between Alongshore areas in the proposed Midshore consent
Dependent Variable: Number of Taxa Normality Test: Failed (P < 0.050) Kruskal-Wallis One Way Analysis of Variance on Ranks
Group N Missing Median 25% 75% Northern 48 0 7.000 5.000 10.000 Southern 36 0 8.000 5.000 13.000
Control 27 0 7.000 3.000 10.750 Te Arai 7 0 9.000 7.500 13.250
H = 3.922 with 3 degrees of freedom. (P = 0.270) The differences in the median values among the treatment groups are not great enough to exclude the possibility that the difference is due to random sampling variability; there is not a statistically significant difference (P = 0.270)
Table A6.23 One Way Analysis of Variance of Number of Individuals from 3.15 mm Screen between Alongshore areas in the proposed Midshore consent
Dependent Variable: Number of individuals Normality Test: Failed (P < 0.050) Kruskal-Wallis One Way Analysis of Variance on Ranks
Group N Missing Median 25% 75% Northern 48 0 15.000 9.000 21.500 Southern 36 0 20.000 13.500 33.000
Control 27 0 17.000 8.250 25.250 Te Arai 7 0 21.000 16.250 29.750
H = 7.491 with 3 degrees of freedom. (P = 0.058) The differences in the median values among the treatment groups are not great enough to exclude the possibility that the difference is due to random sampling variability; there is not a statistically significant difference (P = 0.058)

Assessment of Ecological Effects: For Sand Extraction from the Midshore Pakiri Embayment Assessment of Ecological Effects MBL Midshore Final v3 Final V3 4 September 2020 97
Table A6.24 One Way Analysis of Variance of Shannon- Weiner Diversity from 3.15 mm Screen between Alongshore areas in the proposed Midshore consent
Dependent Variable: Shannon-Weiner Diversity index Normality Test: Passed (P = 0.337) Equal Variance Test: Passed (P = 0.394)
Group Name N Missing Mean Std Dev SEM Northern 48 0 1.620 0.694 0.100 Southern 36 0 1.756 0.832 0.139
Control 27 0 1.489 0.716 0.138 Te Arai 7 0 1.809 0.677 0.256
Source of Variation DF SS MS F P
Between Groups 3 1.318 0.439 0.796 0.499 Residual 114 62.938 0.552
Total 117 64.256 The differences in the mean values among the treatment groups are not great enough to exclude the possibility that the difference is due to random sampling variability; there is not a statistically significant difference (P = 0.499).
Table A6.25 One Way Analysis of Variance of Number of Taxa from 1 mm Screen between Consent areas
Dependent Variable: Number of Taxa Normality Test: Failed (P < 0.050) Kruskal-Wallis One Way Analysis of Variance on Ranks
Group N Missing Median 25% 75% Current 30 0 2.000 1.000 6.000
Between 10 0 6.500 4.000 9.000 Proposed 47 0 5.000 3.000 6.750 Offshore 31 0 3.000 2.000 5.000
H = 12.722 with 3 degrees of freedom. (P = 0.005) The differences in the median values among the treatment groups are greater than would be expected by chance; there is a statistically significant difference (P = 0.005) To isolate the group or groups that differ from the others use a multiple comparison procedure. All Pairwise Multiple Comparison Procedures (Dunn's Method) :
Comparison Diff of Ranks Q P<0.05 Between vs Current 37.383 2.993 Yes
Between vs Offshore 31.903 2.564 No Between vs Proposed 17.862 1.499 Do Not Test
Proposed vs Current 19.522 2.442 No Proposed vs Offshore 14.042 1.774 Do Not Test
Offshore vs Current 5.480 0.626 Do Not Test Note: The multiple comparisons on ranks do not include an adjustment for ties.

Assessment of Ecological Effects: For Sand Extraction from the Midshore Pakiri Embayment Assessment of Ecological Effects MBL Midshore Final v3 Final V3 4 September 2020 98
Table A6.26 One Way Analysis of Variance of Number of Individuals from 1 mm Screen between Consent areas
Dependent Variable: Number of individuals Normality Test: Failed (P < 0.050) Kruskal-Wallis One Way Analysis of Variance on Ranks
Group N Missing Median 25% 75% Current 30 0 4.000 1.000 8.000
Between 10 0 10.000 7.000 13.000 Proposed 47 0 6.000 3.250 8.000 Offshore 31 0 4.000 2.000 7.000
H = 12.486 with 3 degrees of freedom. (P = 0.006) The differences in the median values among the treatment groups are greater than would be expected by chance; there is a statistically significant difference (P = 0.006) To isolate the group or groups that differ from the others use a multiple comparison procedure. All Pairwise Multiple Comparison Procedures (Dunn's Method) :
Comparison Diff of Ranks Q P<0.05 Between vs Current 39.483 3.161 Yes
Between vs Offshore 38.026 3.057 Yes Between vs Proposed 25.789 2.165 No
Proposed vs Current 13.694 1.713 No Proposed vs Offshore 12.236 1.546 Do Not Test
Offshore vs Current 1.458 0.166 Do Not Test Note: The multiple comparisons on ranks do not include an adjustment for ties.
Table A6.27 One Way Analysis of Variance of Shannon- Weiner Diversity from 1 mm Screen between Consent areas
Dependent Variable: Shannon-Weiner Diversity index Normality Test: Failed (P < 0.050) Kruskal-Wallis One Way Analysis of Variance on Ranks
Group N Missing Median 25% 75% Current 30 0 0.665 0.000 1.667
Between 10 0 1.691 1.352 2.084 Proposed 47 0 1.475 0.985 1.792 Offshore 31 0 1.099 0.651 1.475
H = 12.067 with 3 degrees of freedom. (P = 0.007) The differences in the median values among the treatment groups are greater than would be expected by chance; there is a statistically significant difference (P = 0.007) To isolate the group or groups that differ from the others use a multiple comparison procedure. All Pairwise Multiple Comparison Procedures (Dunn's Method) :
Comparison Diff of Ranks Q P<0.05 Between vs Current 35.083 2.809 Yes
Between vs Offshore 29.832 2.398 No Between vs Proposed 15.172 1.274 Do Not Test
Proposed vs Current 19.911 2.491 No Proposed vs Offshore 14.660 1.852 Do Not Test
Offshore vs Current 5.251 0.599 Do Not Test Note: The multiple comparisons on ranks do not include an adjustment for ties.

Assessment of Ecological Effects: For Sand Extraction from the Midshore Pakiri Embayment Assessment of Ecological Effects MBL Midshore Final v3 Final V3 4 September 2020 99
Table A6.28 One Way Analysis of Variance of Number of Taxa from 3.15 mm Screen between Consent areas
Dependent Variable: Number of Taxa Normality Test: Failed (P < 0.050) Kruskal-Wallis One Way Analysis of Variance on Ranks
Group N Missing Median 25% 75% Current 30 0 7.500 3.000 10.000
Between 10 0 8.000 4.000 13.000 Proposed 47 0 7.000 5.000 12.000 Offshore 31 0 7.000 6.000 10.000
H = 2.117 with 3 degrees of freedom. (P = 0.548) The differences in the median values among the treatment groups are not great enough to exclude the possibility that the difference is due to random sampling variability; there is not a statistically significant difference (P = 0.548) Table A6.29 One Way Analysis of Variance of Number of Individuals from
3.15 mm Screen between Consent areas Dependent Variable: Number of individuals Normality Test: Failed (P < 0.050) Kruskal-Wallis One Way Analysis of Variance on Ranks
Group N Missing Median 25% 75% Current 30 0 16.500 8.000 26.000
Between 10 0 22.000 6.000 39.000 Proposed 47 0 16.000 9.000 22.750 Offshore 31 0 20.000 12.000 26.250
H = 0.767 with 3 degrees of freedom. (P = 0.857) The differences in the median values among the treatment groups are not great enough to exclude the possibility that the difference is due to random sampling variability; there is not a statistically significant difference (P = 0.857)
Table A6.30 One Way Analysis of Variance of Shannon- Weiner Diversity from 3.15 mm Screen between Consent areas
Dependent Variable: Shannon-Weiner Diversity index Normality Test: Passed (P = 0.713) Equal Variance Test: Passed (P = 0.456)
Group Name N Missing Mean Std Dev SEM Current 30 0 1.514 0.809 0.148
Between 10 0 1.886 0.664 0.210 Proposed 47 0 1.688 0.755 0.110 Offshore 31 0 1.619 0.680 0.122
Source of Variation DF SS MS F P
Between Groups 3 1.208 0.403 0.728 0.537 Residual 114 63.048 0.553
Total 117 64.256 The differences in the mean values among the treatment groups are not great enough to exclude the possibility that the difference is due to random sampling variability; there is not a statistically significant difference (P = 0.537).

Assessment of Ecological Effects: For Sand Extraction from the Midshore Pakiri Embayment Assessment of Ecological Effects MBL Midshore Final v3 Final V3 4 September 2020 100
Multivariate Statistics
Table A6.31 ANOSIM - Analysis of Similarities by Consent Areas, 3.15 mm Screen
Consent levels Inshore Midshore Inshore between Offshore Tests for differences between unordered Consent groups Global Test Sample statistic (R): 0.317 Significance level of sample statistic: 0.1% Number of permutations: 999 (Random sample from a large number) Number of permuted statistics greater than or equal to R: 0 Pairwise Tests
Groups R Statistic Significance Level (%) Inshore, Midshore 0.451 0.1
Inshore, Inshore between -0.028 64 Inshore, Offshore 0.44 0.1
Midshore, Inshore between 0.132 10.9 Midshore, Offshore 0.192 0.1
Inshore between, Offshore 0.413 0.1
Table A6.32 SIMPER - Similarity Percentages - species contributions by consent areas, 3.15 mm Screen
Parameters Resemblance: S17 Bray-Curtis similarity Cut off for low contributions: 70.00% Group Inshore Average similarity: 11.26
Species Av.Abund Av.Sim Sim/SD Contrib% Cum.% Fellaster zelandiae 0.28 1.64 0.23 14.59 14.59
Myadora boltoni 0.43 1.45 0.35 12.84 27.43 Epigonichthys hectori 0.39 1.23 0.30 10.89 38.32
Zethalia zelandica 0.45 1.15 0.18 10.19 48.51 Dosinia subrosea 0.25 0.85 0.22 7.51 56.01
Maldanidae 0.29 0.79 0.22 7.04 63.05 Amphiura aster 0.21 0.73 0.19 6.50 69.56
Myadora striata 0.30 0.62 0.23 5.48 75.04 Group Midshore Average similarity: 24.77
Species Av.Abund Av.Sim Sim/SD Contrib% Cum.% Maldanidae 1.51 15.53 1.69 62.70 62.70
Cominella quoyana 0.36 1.16 0.33 4.69 67.38 Selenaria concinna 0.38 1.11 0.28 4.48 71.86
Group Offshore Average similarity: 23.83
Species Av.Abund Av.Sim Sim/SD Contrib% Cum.% Maldanidae 1.16 5.82 0.94 24.44 24.44
Selenaria concinna 0.63 2.14 0.54 8.97 33.41 Striacolpus pagoda 0.56 1.52 0.50 6.37 39.79
Epigonichthys hectori 0.58 1.18 0.50 4.94 44.72 Cominella quoyana 0.56 1.15 0.45 4.84 49.56
Sigapatella tenuis 0.52 1.11 0.46 4.65 54.22 Paranthura sp. 0.42 0.94 0.38 3.95 58.17
Phoxocephalidae sp. 1 0.39 0.90 0.34 3.76 61.93 Porifera 0.46 0.81 0.37 3.40 65.33
Nucula nitidula 0.54 0.77 0.38 3.22 68.54 Antisolarium egenum 0.36 0.74 0.31 3.10 71.65

Assessment of Ecological Effects: For Sand Extraction from the Midshore Pakiri Embayment Assessment of Ecological Effects MBL Midshore Final v3 Final V3 4 September 2020 101
Groups Inshore & Midshore Average dissimilarity = 90.62 (only more than 2% of dissimilarities is displayed)
Group Inshore Midshore
Species Av.Abund Av.Abund Av.Diss Diss/SD Contrib% Cum.% Maldanidae 0.29 1.51 10.21 1.51 11.26 11.26
Zethalia zelandica 0.45 0.04 3.83 0.47 4.23 15.49 Myadora boltoni 0.43 0.23 3.61 0.76 3.98 19.47
Epigonichthys hectori 0.39 0.19 3.11 0.72 3.43 22.91 Selenaria concinna 0.00 0.38 2.85 0.58 3.14 26.05
Nucula nitidula 0.13 0.39 2.84 0.71 3.13 29.18 Fellaster zelandiae 0.28 0.00 2.71 0.51 2.99 32.17
Cominella quoyana 0.03 0.36 2.64 0.66 2.91 35.09 Myadora striata 0.30 0.18 2.59 0.67 2.85 37.94
Dosinia subrosea 0.25 0.11 2.44 0.58 2.69 40.63 Phoxocephalidae 1 0.16 0.24 2.35 0.61 2.59 43.22
Amphiura aster 0.21 0.11 2.26 0.54 2.49 45.71 Sigalionidae 0.07 0.27 2.23 0.60 2.46 48.18
Paguridae 0.07 0.32 2.16 0.60 2.39 50.56 Groups Midshore & Offshore Average dissimilarity = 79.47 (only more than 2% of dissimilarities is displayed)
Group Midshore Offshore
Species Av.Abund Av.Abund Av.Diss Diss/SD Contrib% Cum.% Maldanidae 1.51 1.16 3.57 0.92 4.50 4.50
Selenaria concinna 0.38 0.63 3.29 0.94 4.14 8.63 Cominella quoyana 0.36 0.56 2.58 0.90 3.25 11.88 Striacolpus pagoda 0.07 0.56 2.55 0.85 3.21 15.10
Nucula nitidula 0.39 0.54 2.54 0.89 3.20 18.29 Sigapatella tenuis 0.26 0.52 2.36 0.88 2.97 21.26
Epigonichthys hectori 0.19 0.58 2.27 0.92 2.86 24.12 Phoxocephalidae 1 0.24 0.39 2.22 0.77 2.80 26.92
Paguridae 0.32 0.47 2.21 0.85 2.79 29.70 Sigalionidae 0.27 0.39 2.02 0.78 2.54 32.24
Table A6.33 ANOSIM - Analysis of Similarities by Consent Areas, 1 mm Screen
Consent levels Inshore Midshore Inshore between Offshore Tests for differences between unordered Consent groups Global Test Sample statistic (R): 0.092 Significance level of sample statistic: 0.8% Number of permutations: 999 (Random sample from a large number) Number of permuted statistics greater than or equal to R: 7 Pairwise Tests
Groups R Statistic Significance Level % Midshore, Inshore between 0.05 29
Midshore, Inshore 0.204 0.3 Midshore, Offshore 0.003 42.3
Inshore between, Inshore -0.042 70.4 Inshore between, Offshore 0.066 20.3
Inshore, Offshore 0.2 0.1

Assessment of Ecological Effects: For Sand Extraction from the Midshore Pakiri Embayment Assessment of Ecological Effects MBL Midshore Final v3 Final V3 4 September 2020 102
Table A6.34 SIMPER - Similarity Percentages - species contributions by consent areas, 1 mm Screen
Parameters Resemblance: S17 Bray-Curtis similarity Cut off for low contributions: 70.00% Group Inshore Average similarity: 18.79
Species Av.Abund Av.Sim Sim/SD Contrib% Cum.% Phoxocephalidae 1 0.65 5.91 0.65 31.44 31.44
Gammaridea 0.36 2.29 0.32 12.16 43.60 Epigonichthys hectori 0.50 2.00 0.42 10.66 54.26
Cirolanidae 0.35 1.69 0.34 8.97 63.23 Haustoriidae 0.41 1.63 0.35 8.68 71.91
Group Midshore Average similarity: 21.91
Species Av.Abund Av.Sim Sim/SD Contrib% Cum.% Maldanidae 0.88 13.85 0.95 63.20 63.20
Phoxocephalidae 1 0.37 2.05 0.33 9.36 72.56 Group Offshore Average similarity: 22.79
Species Av.Abund Av.Sim Sim/SD Contrib% Cum.% Maldanidae 0.84 15.04 0.88 66.00 66.00
Phoxocephalidae 1 0.41 3.00 0.40 13.18 79.18
Groups Midshore & Inshore Average dissimilarity = 84.46 (only more than 2% of dissimilarities is displayed)
Group Midshore Inshore
Species Av.Abund Av.Abund Av.Diss Diss/SD Contrib% Cum.% Maldanidae 0.88 0.33 8.11 1.08 9.60 9.60
Phoxocephalidae 1 0.37 0.65 6.15 0.96 7.28 16.88 Epigonichthys hectori 0.27 0.50 4.74 0.88 5.61 22.49
Gammaridea 0.07 0.36 4.29 0.62 5.08 27.57 Haustoriidae 0.16 0.41 3.98 0.79 4.71 32.28
Cyclaspis 0.25 0.28 3.68 0.73 4.36 36.64 Sphaeromatidae 0.22 0.22 3.68 0.59 4.36 41.00
Armandia maculata 0.21 0.27 3.61 0.66 4.28 45.28 Cirolanidae 1 0.10 0.35 3.61 0.72 4.28 49.55
Cirratulidae 0.18 0.13 2.80 0.48 3.31 52.87 Nucula nitidula 0.09 0.25 2.70 0.57 3.20 56.07
Phoxocephalidae 2 0.13 0.13 2.60 0.47 3.08 59.15 Tenagomysis sp. 0.14 0.18 2.47 0.57 2.92 62.07
Phoxocephalidae 3 0.03 0.24 2.02 0.55 2.39 64.46 Groups Midshore & Offshore Average dissimilarity = 77.76 (only more than 2% of dissimilarities is displayed)
Group Midshore Offshore
Species Av.Abund Av.Abund Av.Diss Diss/SD Contrib% Cum.% Maldanidae 0.88 0.84 6.10 0.96 7.84 7.84
Phoxocephalidae1 0.37 0.41 5.58 0.86 7.17 15.01 Cirratulidae 0.18 0.29 4.67 0.65 6.01 21.03
Epigonichthys hectori 0.27 0.31 4.50 0.74 5.78 26.81 Cyclaspis 0.25 0.08 2.79 0.60 3.59 30.39
Liljeborgiidae 0.12 0.19 2.66 0.53 3.43 33.82 Sphaeromatidae 0.22 0.05 2.38 0.51 3.06 36.88
Armandia maculata 0.21 0.00 2.17 0.48 2.80 39.68 Haustoriidae 0.16 0.08 2.05 0.48 2.64 42.32
Selenaria concinna 0.11 0.10 2.02 0.44 2.59 44.91
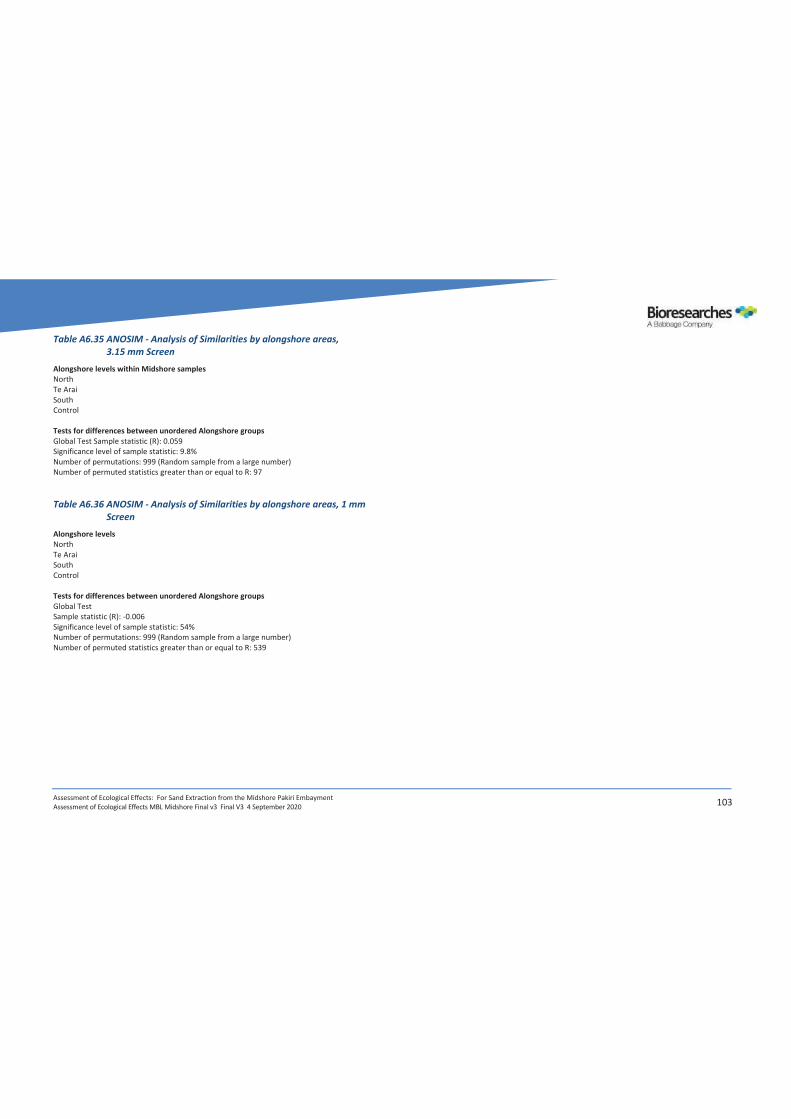
Assessment of Ecological Effects: For Sand Extraction from the Midshore Pakiri Embayment Assessment of Ecological Effects MBL Midshore Final v3 Final V3 4 September 2020 103
Table A6.35 ANOSIM - Analysis of Similarities by alongshore areas, 3.15 mm Screen
Alongshore levels within Midshore samples North Te Arai South Control Tests for differences between unordered Alongshore groups Global Test Sample statistic (R): 0.059 Significance level of sample statistic: 9.8% Number of permutations: 999 (Random sample from a large number) Number of permuted statistics greater than or equal to R: 97 Table A6.36 ANOSIM - Analysis of Similarities by alongshore areas, 1 mm
Screen Alongshore levels North Te Arai South Control Tests for differences between unordered Alongshore groups Global Test Sample statistic (R): -0.006 Significance level of sample statistic: 54% Number of permutations: 999 (Random sample from a large number) Number of permuted statistics greater than or equal to R: 539

Assessment of Ecological Effects: For Sand Extraction from the Midshore Pakiri Embayment Assessment of Ecological Effects MBL Midshore Final v3 Final V3 4 September 2020 104
Appendix 7 Statistical Results - Epibenthic macrofauna Multivariate analysis Table A7.37 ANOSIM - Analysis of Similarities by Consent Areas, tow Consent levels Midshore Inshore Tests for differences between unordered Consent groups Global Test Sample statistic (R): 0.366 Significance level of sample statistic: 0.1% Number of permutations: 999 (Random sample from 347373600) Number of permuted statistics greater than or equal to R: 0 Table A7.38 SIMPER - Similarity Percentages - species contributions by
Consent Areas, tow Parameters Resemblance: S17 Bray-Curtis similarity Cut off for low contributions: 70.00% Group Midshore Average similarity: 30.89
Species Av.Abund Av.Sim Sim/SD Contrib% Cum.% Paguristes setosus 1.08 14.91 1.32 48.26 48.26
Cominella adspersa 0.65 7.72 0.85 24.98 73.24 Group Inshore Average similarity: 23.33
Species Av.Abund Av.Sim Sim/SD Contrib% Cum.% Fellaster zelandiae 0.69 8.37 0.66 35.88 35.88
Astropecten polyacanthus 0.31 3.66 0.27 15.67 51.56 Paguristes setosus 0.45 3.31 0.47 14.17 65.73 Ovalipes catharus 0.35 3.13 0.35 13.42 79.14
Groups Midshore & Inshore Average dissimilarity = 83.01 (only more than 2% of dissimilarities is displayed)
Group Midshore Inshore
Species Av.Abund Av.Abund Av.Diss Diss/SD Contrib% Cum.% Paguristes setosus 1.08 0.45 10.53 1.17 12.68 12.68 Fellaster zelandiae 0.00 0.69 8.13 1.04 9.80 22.48
Cominella adspersa 0.65 0.28 7.43 1.06 8.95 31.43 Astropecten polyacanthus 0.46 0.31 6.72 0.90 8.09 39.52
Ovalipes catharus 0.04 0.35 4.67 0.71 5.63 45.14 Maldanidae 0.32 0.13 4.05 0.77 4.87 50.02
Dosinia subrosea 0.04 0.36 4.04 0.72 4.87 54.89 Porifera 0.22 0.00 2.77 0.53 3.34 58.22
Pecten novaezelandiae 0.22 0.00 2.61 0.48 3.14 61.36 Myadora striata 0.14 0.13 2.56 0.56 3.08 64.45
Amalda (B.) australis 0.13 0.13 2.13 0.56 2.56 67.01 Polychaeta 0.14 0.08 2.01 0.50 2.42 69.43
Table A7.39 ANOSIM - Analysis of Similarities by Alongshore Areas, tow Alongshore levels Control South North Tests for differences between unordered Alongshore groups Global Test Sample statistic (R): 0.123 Significance level of sample statistic: 4.7% Number of permutations: 999 (Random sample from a large number) Number of permuted statistics greater than or equal to R: 46 Pairwise Tests
Groups R Statistic Significance Level % Control, South 0.216 7.4 Control, North -0.077 72.1
South, North 0.146 2.1
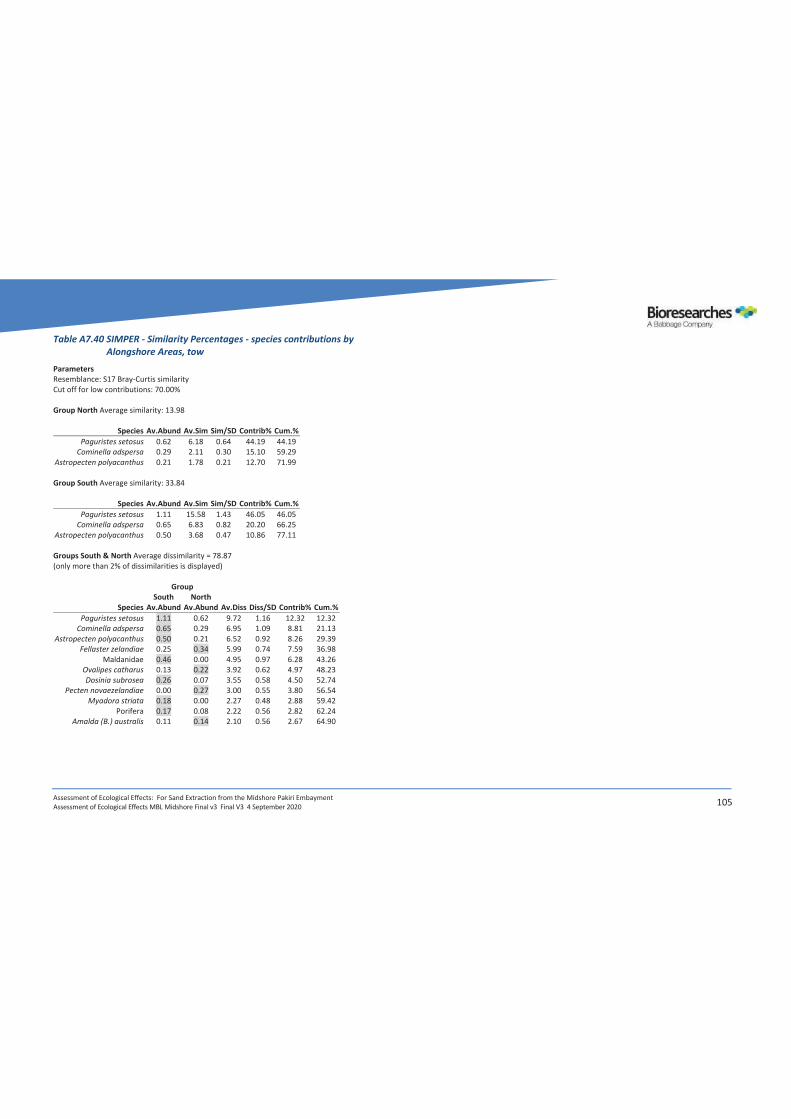
Assessment of Ecological Effects: For Sand Extraction from the Midshore Pakiri Embayment Assessment of Ecological Effects MBL Midshore Final v3 Final V3 4 September 2020 105
Table A7.40 SIMPER - Similarity Percentages - species contributions by Alongshore Areas, tow
Parameters Resemblance: S17 Bray-Curtis similarity Cut off for low contributions: 70.00% Group North Average similarity: 13.98
Species Av.Abund Av.Sim Sim/SD Contrib% Cum.% Paguristes setosus 0.62 6.18 0.64 44.19 44.19
Cominella adspersa 0.29 2.11 0.30 15.10 59.29 Astropecten polyacanthus 0.21 1.78 0.21 12.70 71.99 Group South Average similarity: 33.84
Species Av.Abund Av.Sim Sim/SD Contrib% Cum.% Paguristes setosus 1.11 15.58 1.43 46.05 46.05
Cominella adspersa 0.65 6.83 0.82 20.20 66.25 Astropecten polyacanthus 0.50 3.68 0.47 10.86 77.11 Groups South & North Average dissimilarity = 78.87 (only more than 2% of dissimilarities is displayed)
Group South North
Species Av.Abund Av.Abund Av.Diss Diss/SD Contrib% Cum.% Paguristes setosus 1.11 0.62 9.72 1.16 12.32 12.32
Cominella adspersa 0.65 0.29 6.95 1.09 8.81 21.13 Astropecten polyacanthus 0.50 0.21 6.52 0.92 8.26 29.39
Fellaster zelandiae 0.25 0.34 5.99 0.74 7.59 36.98 Maldanidae 0.46 0.00 4.95 0.97 6.28 43.26
Ovalipes catharus 0.13 0.22 3.92 0.62 4.97 48.23 Dosinia subrosea 0.26 0.07 3.55 0.58 4.50 52.74
Pecten novaezelandiae 0.00 0.27 3.00 0.55 3.80 56.54 Myadora striata 0.18 0.00 2.27 0.48 2.88 59.42
Porifera 0.17 0.08 2.22 0.56 2.82 62.24 Amalda (B.) australis 0.11 0.14 2.10 0.56 2.67 64.90