Embed Size (px)
Citation preview
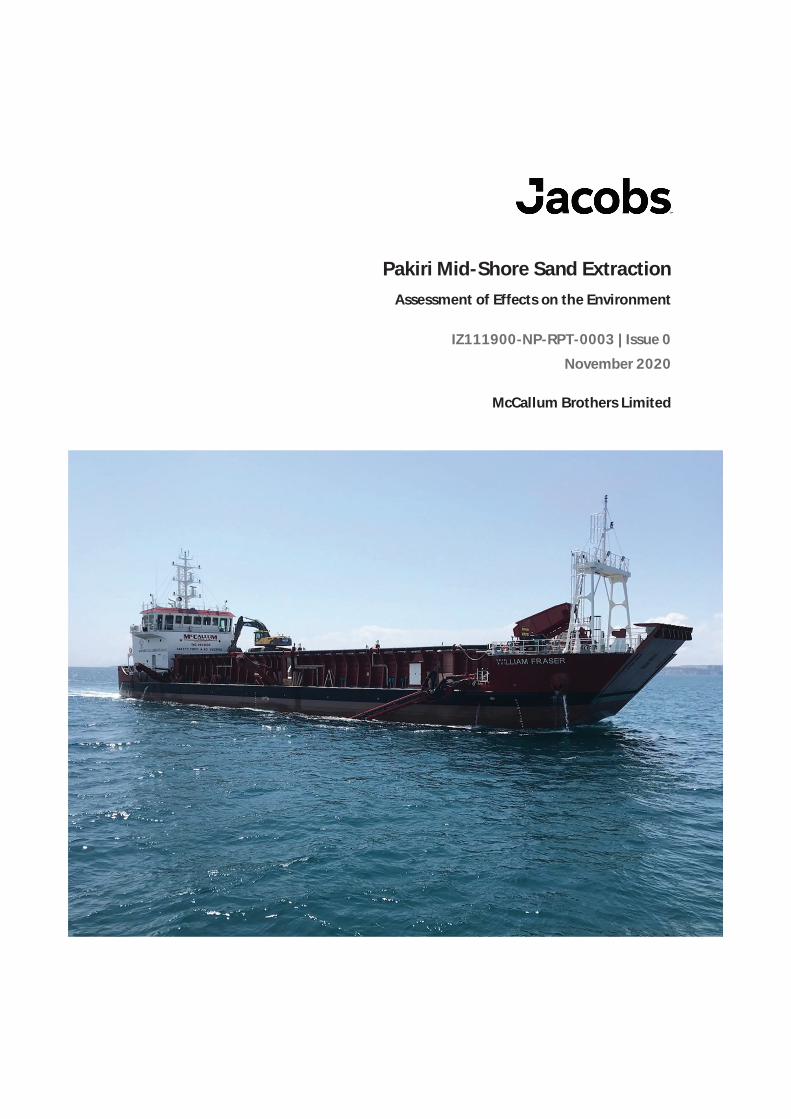
Pakiri Mid-Shore Sand ExtractionAssessment of Effects on the Environment
IZ111900-NP-RPT-0003 | Issue 0November 2020
McCallum Brothers Limited
A ssessm ent of Eff ects on th e Envi ro nm entMcCall um Br others Lim it ed
Assessment of Effects on the Environment
IZ111900-EP-RPT-002 ii
Pakiri Offshore Sand Extraction
Project No: IZ111900Document Title: Assessment of Effects on the EnvironmentDocument No.: IZ111900-NP-RPT-0003Revision: Issue 0Document Status: FinalDate: November 2020Client Name: McCallum Brothers LimitedProject Manager: Anthony KubaleAuthor: Tim HegartyFile Name: J:\IE\Projects\02_New Zealand\IZ111900\21 Deliverables\AEE - New Area\Pakiri Mid-
Shore AEE November 2020 Lodgement Version.docx
Jacobs New Zealand Limited
Carlaw Park12-16 Nicholls Lane, ParnellAuckland 1010PO Box 9806, NewmarketAuckland 1149New ZealandT +64 9 928 5500F +64 9 928 5501www.jacobs.com
© Copyright 2020 Jacobs New Zealand Limited. The concepts and information contained in this document are the property of Jacobs. Use orcopying of this document in whole or in part without the written permission of Jacobs constitutes an infringement of copyright.
Limitation: This document has been prepared on behalf of, and for the exclusive use of Jacobs’ client, and is subject to, and issued in accordance with, theprovisions of the contract between Jacobs and the client. Jacobs accepts no liability or responsibility whatsoever for, or in respect of, any use of, or relianceupon, this document by any third party.
Document history and status
Revision Date Description Author Checked Reviewed ApprovedA 29/06/20 Draft for client review Tim
HegartyAnthonyKubale
AndrewHenderson
BruceClarke
B 26/08/2020 Updated following Client Review TimHegarty
AnthonyKubale
AndrewHenderson
BruceClarke
Issue 0 18/11/2020 Updated following completion of supportingtechnical reports
TimHegarty
DerekTodd
AndrewHenderson
BruceClarke
Assessment of Effects on the Environment
IZ111900-EP-RPT-002 iii
ContentsExecutive Summary ............................................................................................................................................................ viPART A: RESOURCE CONSENT APPLICATION ............................................................................................................... 1PART B: ASSESSMENT OF EFFECTS ON THE ENVIRONMENT .................................................................................... 3LIST OF ABBREVIATIONS ................................................................................................................................................... 41. Introduction ............................................................................................................................................................ 52. Description of Activity .......................................................................................................................................... 82.1 Background and Current Extraction Operation ........................................................................................................... 82.2 Proposed Consent Area and Volumes ............................................................................................................................ 92.3 Dredging Vessels and Equipment ................................................................................................................................. 112.4 Sand Extraction Operation ............................................................................................................................................... 112.5 Discharge of Water and Extraction Material to the Ocean .................................................................................. 132.5.1 By-Wash and Over-sized Material Discharge ............................................................................................................ 132.6 Noise Discharge .................................................................................................................................................................... 143. The Pakiri Sand Resource and its Strategic Importance to Auckland .................................................... 163.1 The Pakiri Sand Resource ................................................................................................................................................. 163.2 Auckland’s Sand Demand ................................................................................................................................................. 174. Site Location and Existing Environment ....................................................................................................... 194.1 Location and Surrounding Development ................................................................................................................... 194.2 Auckland Unitary Plan Controls and Overlays .......................................................................................................... 194.2.1 Zoning ...................................................................................................................................................................................... 194.2.2 Significant Ecological Areas............................................................................................................................................. 204.2.3 Landscape Overlays ............................................................................................................................................................ 214.2.4 Surf Breaks .............................................................................................................................................................................. 224.3 Cultural Aspects ................................................................................................................................................................... 244.3.1 Treaty Settlements and Other Claims.......................................................................................................................... 244.4 Existing Environment ......................................................................................................................................................... 254.4.1 Introduction ........................................................................................................................................................................... 254.4.2 Wave Climate and Currents .............................................................................................................................................. 254.4.3 Geomorphology and Bathymetry .................................................................................................................................. 274.4.4 Sediment and Sand Quality ............................................................................................................................................. 284.4.5 Shoreline Movements ....................................................................................................................................................... 304.4.6 Sediment Budget ................................................................................................................................................................. 324.4.7 Landscape and Visual Values .......................................................................................................................................... 334.4.8 Water Quality ......................................................................................................................................................................... 354.4.9 Marine Ecology ..................................................................................................................................................................... 384.4.9.1 Invertebrate and Benthic Ecology ................................................................................................................................. 384.4.9.2 Fin Fish ..................................................................................................................................................................................... 394.4.9.3 Marine Mammals ................................................................................................................................................................. 40
Assessment of Effects on the Environment
IZ111900-EP-RPT-002 iv
4.4.9.4 Avifauna ................................................................................................................................................................................... 424.4.10 Terrestrial Noise Conditions ............................................................................................................................................ 444.4.11 Underwater Noise Conditions ......................................................................................................................................... 444.5 Other marine activities ....................................................................................................................................................... 465. Consent Requirements ...................................................................................................................................... 475.1 Reasons for Consent ........................................................................................................................................................... 475.1.1 Consents Required .............................................................................................................................................................. 476. Assessment of Effects on the Environment .................................................................................................. 486.1 Crown Minerals Act ............................................................................................................................................................. 486.2 Positive Economic and Environmental Effects ......................................................................................................... 496.3 Water Quality Effects .......................................................................................................................................................... 506.4 Coastal Processes Effects.................................................................................................................................................. 536.4.1 Effects on Shoreline Position – Aerial Photography and Excursion Distance Analysis ............................ 536.4.2 Effects on Sediment Budget ............................................................................................................................................ 556.4.3 Sea Level Rise ........................................................................................................................................................................ 566.4.4 Effects on Bathymetry ........................................................................................................................................................ 566.4.5 Cumulative Effects ............................................................................................................................................................... 576.4.6 Summary of Effects on Coastal Processes ................................................................................................................. 576.5 Ecological Effects ................................................................................................................................................................. 586.5.1 Benthic Ecology .................................................................................................................................................................... 586.5.2 Fish ............................................................................................................................................................................................ 596.5.3 Birds .......................................................................................................................................................................................... 596.5.4 Marine Mammals ................................................................................................................................................................. 616.6 Cultural Effects...................................................................................................................................................................... 626.7 Biosecurity Effects ............................................................................................................................................................... 626.8 Surface Noise Effects .......................................................................................................................................................... 626.9 Recreational Effects ............................................................................................................................................................ 636.9.1 Effects on Surf Breaks ........................................................................................................................................................ 636.9.2 Effects on Recreational Fishing and Boating ............................................................................................................ 636.10 Landscape Effects ................................................................................................................................................................ 636.11 Summary of Effects ............................................................................................................................................................. 657. Notification assessment .................................................................................................................................... 668. Consultation ......................................................................................................................................................... 678.1 Auckland Council ................................................................................................................................................................. 678.1.1 Regulatory Services............................................................................................................................................................. 678.2 Mana Whenua ........................................................................................................................................................................ 678.2.1 Local Mana Whenua Groups ............................................................................................................................................ 678.2.2 Customary Marine Title Applicants............................................................................................................................... 678.3 Department of Conservation ........................................................................................................................................... 68
Assessment of Effects on the Environment
IZ111900-EP-RPT-002 v
8.4 NZ Fairy Tern Trust .............................................................................................................................................................. 698.5 Friends of Pakiri .................................................................................................................................................................... 698.6 Other groups .......................................................................................................................................................................... 699. Statutory Considerations .................................................................................................................................. 709.1 Part 2 (Purposes and Principles) - Sections 5, 6, 7, and 8 ................................................................................... 709.1.1 Section 5 assessment ......................................................................................................................................................... 709.1.2 Section 6 Assessment ........................................................................................................................................................ 719.1.3 Section 7 Assessment ........................................................................................................................................................ 729.1.4 Section 8 Assessment ........................................................................................................................................................ 739.2 Section 104(1)(a) ................................................................................................................................................................ 739.3 Section 104(1)(b)(i) ........................................................................................................................................................... 749.4 Section 104(1)(b)(ii) .......................................................................................................................................................... 749.5 Section 104(1)(b)(iii) ......................................................................................................................................................... 749.6 Section 104(1)(b)(iv) ......................................................................................................................................................... 759.7 Section 104(1)(b)(v) .......................................................................................................................................................... 779.8 Section 104(1)(b)(vi) ......................................................................................................................................................... 779.9 Section 104(1)(c) ................................................................................................................................................................ 779.9.1 Auckland Plan 2050 ........................................................................................................................................................... 779.9.2 Hauraki Gulf Marine Spatial Plan ................................................................................................................................... 789.10 Consent duration.................................................................................................................................................................. 789.11 Sections 105 and 107 ........................................................................................................................................................ 7810. Conclusion ............................................................................................................................................................ 80
Appendix A. Previous Consent ConditionsAppendix B. Objectives and PoliciesAppendix C. Effects Assessment MethodologyAppendix D. Economic AssessmentAppendix E. Concrete Industry ReportAppendix F. Draft ConditionsAppendix G. Coastal Processes AssessmentAppendix H. Water Quality AssessmentAppendix I. Terrestrial Noise AssessmentAppendix J. Underwater Noise AssessmentAppendix K. Ecological Effects AssessmentAppendix L. Marine Mammal AssessmentAppendix M. Landscape and Visual Effects AssessmentAppendix N. Avifauna AssessmentAppendix O. Consultation Summary

Assessment of Effects on the Environment
IZ111900-EP-RPT-002 vi
Executive SummaryMcCallum Brothers Limited (MBL) seek resource consent under sections 12 and 15 of the Resource ManagementAct 1991 (RMA) to undertake the extraction of sand from a mid-shore area between the 15 and 25 m chartdatum depth contours at the Pakiri and Te Arai Beaches (Figure 1-1). This extraction area (known as the newextraction area) is planned to replace MBL’s existing extraction area, which is located within the inshore area ofboth beaches. The area sought by this application is located further offshore and is outside any of the landscapeor ecological overlays present in the Auckland Unitary Plan (Operative in Part) (AUP(OP)).
MBL seek the following extraction rate for a 35-year period:
An annual average rate of 125,000 m3/year over any consecutive 5 year period and a maximum rate of150,000 m3 over any 12-month period, with the temporal distribution of the extraction volume beinglimited to a maximum of 15,000 m3 over any consecutive 30 day period and to be spatially balancedbetween a series of extraction cells located along the beach and between the 15 and 25 m depthcontours.
In addition, resource consent is sought for the discharge of sediment, seawater and biota into the coastal marinearea (CMA) from the extraction vessel, with this material resulting from disturbance of the local seabed andbeing separated from the required sand resource.
The sand resource at Pakiri is of regional importance to Auckland given its critical role for concrete productionand ease of transport to urban Auckland via sea vessels to the Port of Auckland. Currently, operations at Pakirisupply at least 43% of the sand used to manufacture concrete in Auckland. With the projected populationgrowth and quality compact form1 planned by Auckland Council, concrete will be of increasing importance as abuilding material. Without continued access to this resource, Auckland will be reliant on sand resources whichare of lower quality due to their chemical composition and/or are a greater distance away from Auckland.
These other sand resources located at the Kaipara Harbour, Tomorata and in the Waikato Region require longdistance road transport to the market, causing road congestion, increased risk of traffic accidents and increasedgreenhouse gas emissions. Of these sands, the Waikato sourced aggregates are also not favoured in Aucklanddue to the increased risk of alkali silica reaction and the higher proportion of cement required to reach targetstrength. As such, these other sand sources generate additional greenhouse gas emissions in the order of 1,304tonnes of CO2 per annum and at least an additional 2.3 million km of incremental truck movements. Thesefactors also increase the cost of sand sourced from these other locations and consequently the cost of concreteproduction, thereby affecting the affordability of building Auckland’s new homes and infrastructure. Theseimpacts are further detailed by Market Economics in the economic assessment provided with this application.
A range of technical assessments have been commissioned which demonstrate that the extraction activity willhave no more than minor adverse effects on the environment, including effects on benthic ecology, marinemammals, avifauna, water quality, landscape values, cultural values and coastal processes.
The activity also has limited effects on local water quality. The discharge is limited to material extracted from theseabed and is currently returned to coastal waters via moon pools on the extraction vessel. As such, it onlycontains sediment and biota removed from the seabed, with sediment testing finding no contaminants ofconcern at levels above natural background. Furthermore, the sediment plume from the extraction vessel rapidlydisperses, thereby avoiding any significant effects throughout the water column or on landscape values.
MBL have also engaged with mana whenua to ensure that cultural values and effects are addressed. The culturalvalues associated with the landscape, kaimoana, other taonga and the mauri of coastal waters have all beenconsidered, with any significant effects avoided. In addition, Cultural Values Assessments (CVAs) have beensought from local iwi.
1 The “quality compact” form refers to the urban growth model of the Auckland Plan 2050 and the AUP(OP). It is based on 70% of new housing beingaccommodated within existing urban areas, with the remaining 30% provided in greenfield areas and coastal/rural settlements.
Assessment of Effects on the Environment
IZ111900-EP-RPT-002 vii
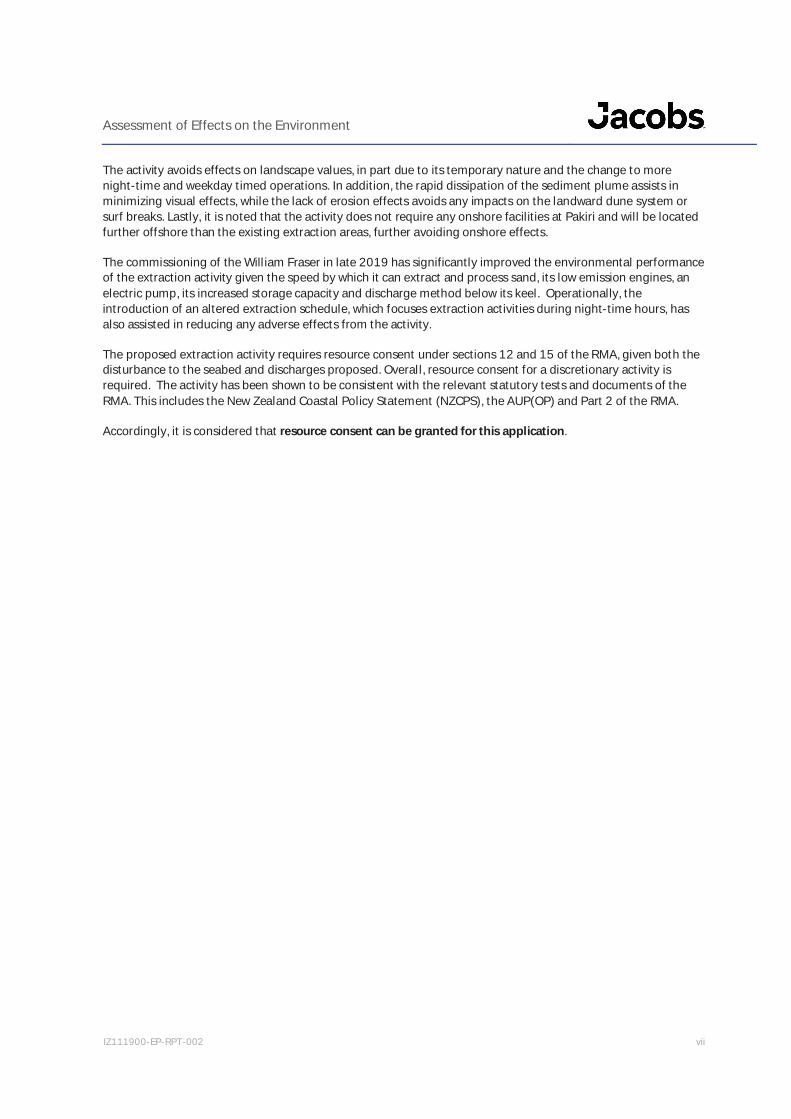
The activity avoids effects on landscape values, in part due to its temporary nature and the change to morenight-time and weekday timed operations. In addition, the rapid dissipation of the sediment plume assists inminimizing visual effects, while the lack of erosion effects avoids any impacts on the landward dune system orsurf breaks. Lastly, it is noted that the activity does not require any onshore facilities at Pakiri and will be locatedfurther offshore than the existing extraction areas, further avoiding onshore effects.
The commissioning of the William Fraser in late 2019 has significantly improved the environmental performanceof the extraction activity given the speed by which it can extract and process sand, its low emission engines, anelectric pump, its increased storage capacity and discharge method below its keel. Operationally, theintroduction of an altered extraction schedule, which focuses extraction activities during night-time hours, hasalso assisted in reducing any adverse effects from the activity.
The proposed extraction activity requires resource consent under sections 12 and 15 of the RMA, given both thedisturbance to the seabed and discharges proposed. Overall, resource consent for a discretionary activity isrequired. The activity has been shown to be consistent with the relevant statutory tests and documents of theRMA. This includes the New Zealand Coastal Policy Statement (NZCPS), the AUP(OP) and Part 2 of the RMA.
Accordingly, it is considered that resource consent can be granted for this application.

Assessment of Effects on the Environment
IZ111900-EP-RPT-002 1
PART A: RESOURCE CONSENT APPLICATIONTo: Auckland Council
Address: Private Bag 92300
Auckland 1142
McCallum Brothers Limited requires a coastal permit under sections 12 and 15 of the Resource Management Act1991 informed by (but not limited to) the following plan provisions:
Auckland Unitary Plan (Operative in Part)
Coastal Permit (s12)
The proposal involves the disturbance of coastal marine area within the General Coastal Marine Zonefor mineral extraction. Pursuant to Rule F2.19.4 (A28), this is a discretionary activity.
Coastal Permit (s15)The proposal involves disposal of waste and other materials arising directly from the offshoreprocessing of a seabed mineral resource within the General Coastal Marine Zone. Pursuant to RuleF2.19.2 (A15), this is a discretionary activity.
Overall, consent is required for a discretionary activity.
The extraction activity is proposed between the following co-ordinates at Pakiri, Auckland:
NZTM2000 Projection NZGD2000 Projection1751204 59937341751413 59939341751900 59934791752079 59937421751719 59940971750052 59969351747801 60008911746958 60029611746424 60025371746240 60023441746633 60018461746710 60015411746871 60013241746942 60010921747184 60006731747394 60003841747545 59999881747622 59999211748103 59989511748165 59987131748335 59985871748731 59979741748900 59979431749415 59973461749443 59972461749881 59968501749599 59963471749810 5995843

Assessment of Effects on the Environment
IZ111900-EP-RPT-002 2
NZTM2000 Projection NZGD2000 Projection1750064 59955011750339 59950181750825 59942851750946 59941541751077 5993917
Assessment of Effects on the Environment
In accordance with the Fourth Schedule of the RMA, an assessment of effects on the environment is provided inSection 6 of this report comprising detail that corresponds with the scale and significance of the actual andpotential effects that the proposed activity may have on the environment.
Contact details
Shayne Elstob – Chief Operating Officer
PO Box 71031, Rosebank, AUCKLAND 1348
Assessment of Effects on the Environment
IZ111900-EP-RPT-002 3
PART B: ASSESSMENT OF EFFECTS ON THE ENVIRONMENT
Assessment of Effects on the Environment
IZ111900-EP-RPT-002 4
LIST OF ABBREVIATIONSAcronym Meaning
AEE Assessment of Effects on the EnvironmentADCP Acoustic Doppler Current Profiler
ANZG (2018) Australian and New Zealand Guidelines for Freshwater and MarineWater Quality
AUP(OP) Auckland Unitary Plan (Operative in Part)
CMA Coastal Marine AreaCMT Customary Marine Title
CO2 Carbon DioxideCTD Conductivity, temperature and depth
CVA Cultural Values AssessmentDSAS GIS Digital Shoreline Analysis System
HNC High Natural Character
Inshore Between 5 and 16 m deep contours
KL Kaipara Excavators LimitedM MillionMBL McCallum Brothers Ltd
mgs Mean Grain Size
MHWS Mean High Water SpringMid-shore Proposed Extraction Area between 16m and 25m contours
MPSS Mangawhai-Pakiri Sand Study
MSL Mean Sea LevelNZCPS New Zealand Coastal Policy StatementONL Outstanding Natural Landscape
PAHs Polycyclic Aromatic Hydrocarbons
PCBs Total Polychlorinated Biphenyls
RMA Resource Management Act 1991RUB Rural Urban Boundary
SEA Significant Ecological AreaSQGs Sediment Quality Guidelines
TSHD Trailing Suction Hopper DredgerTSS Total Suspended Solids
WETlabs WETlabs WQM

Assessment of Effects on the Environment
IZ111900-EP-RPT-002 5
1. IntroductionThis Assessment of Effects on the Environment (AEE) has been prepared to support the resource consentapplication by McCallum Brothers Ltd ® (MBL) to undertake sand extraction from the CMA at Pakiri, NorthAuckland.
Currently, MBL operate vessels within an inshore area at Pakiri to extract up to 76,000m3/year of sand, takenfrom a depth of between 5 m and 10 m (Figure 1-1). This activity was approved by the Environment Court in2006 (ARC28165, ARC228172, ARC28173 & ARC28174), with the consents having expired on 6th September2020. MBL lodged an application to renew extraction with the existing inshore area in late February 2020(Council References: BUN60352951, CST60352952 and DIS60347549).
Figure 1-1: Location of existing and proposed extraction areas(Source: Jacobs)
Assessment of Effects on the Environment
IZ111900-EP-RPT-002 6
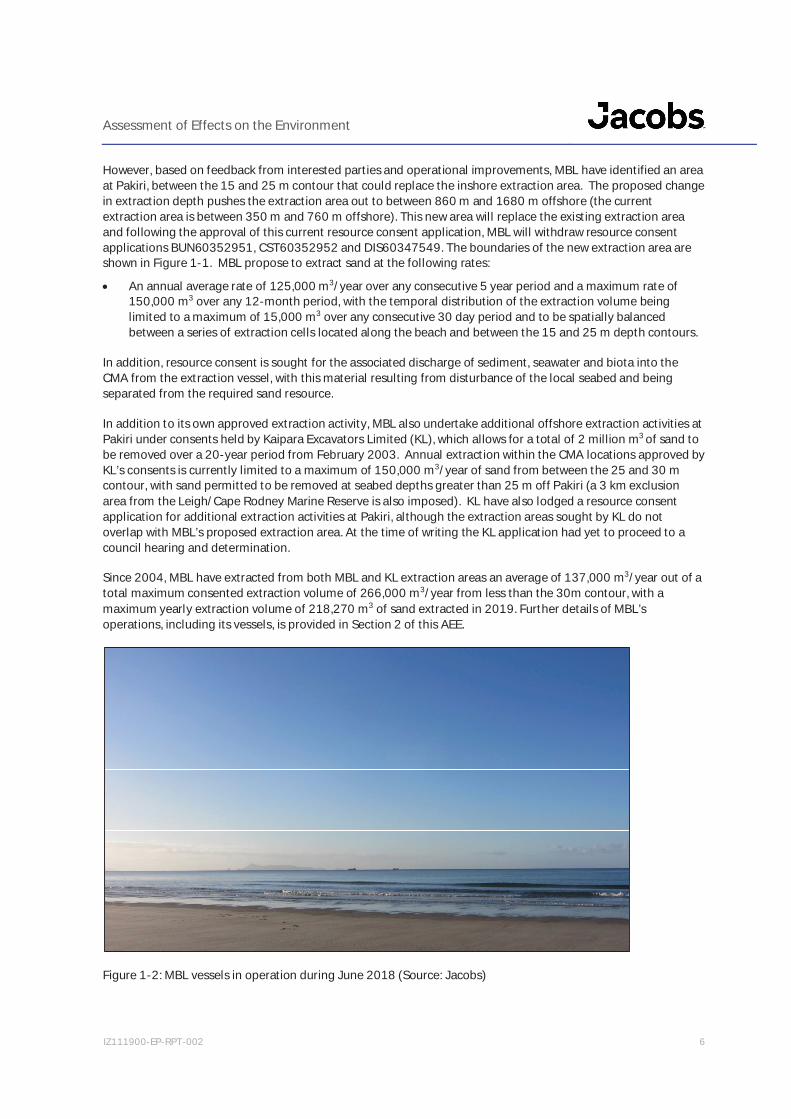
However, based on feedback from interested parties and operational improvements, MBL have identified an areaat Pakiri, between the 15 and 25 m contour that could replace the inshore extraction area. The proposed changein extraction depth pushes the extraction area out to between 860 m and 1680 m offshore (the currentextraction area is between 350 m and 760 m offshore). This new area will replace the existing extraction areaand following the approval of this current resource consent application, MBL will withdraw resource consentapplications BUN60352951, CST60352952 and DIS60347549. The boundaries of the new extraction area areshown in Figure 1-1. MBL propose to extract sand at the following rates:
An annual average rate of 125,000 m3/year over any consecutive 5 year period and a maximum rate of150,000 m3 over any 12-month period, with the temporal distribution of the extraction volume beinglimited to a maximum of 15,000 m3 over any consecutive 30 day period and to be spatially balancedbetween a series of extraction cells located along the beach and between the 15 and 25 m depth contours.
In addition, resource consent is sought for the associated discharge of sediment, seawater and biota into theCMA from the extraction vessel, with this material resulting from disturbance of the local seabed and beingseparated from the required sand resource.
In addition to its own approved extraction activity, MBL also undertake additional offshore extraction activities atPakiri under consents held by Kaipara Excavators Limited (KL), which allows for a total of 2 million m3 of sand tobe removed over a 20-year period from February 2003. Annual extraction within the CMA locations approved byKL’s consents is currently limited to a maximum of 150,000 m3/year of sand from between the 25 and 30 mcontour, with sand permitted to be removed at seabed depths greater than 25 m off Pakiri (a 3 km exclusionarea from the Leigh/Cape Rodney Marine Reserve is also imposed). KL have also lodged a resource consentapplication for additional extraction activities at Pakiri, although the extraction areas sought by KL do notoverlap with MBL’s proposed extraction area. At the time of writing the KL application had yet to proceed to acouncil hearing and determination.
Since 2004, MBL have extracted from both MBL and KL extraction areas an average of 137,000 m3/year out of atotal maximum consented extraction volume of 266,000 m3/year from less than the 30m contour, with amaximum yearly extraction volume of 218,270 m3 of sand extracted in 2019. Further details of MBL’soperations, including its vessels, is provided in Section 2 of this AEE.
Figure 1-2: MBL vessels in operation during June 2018 (Source: Jacobs)

Assessment of Effects on the Environment
IZ111900-EP-RPT-002 7
The sand resource at Pakiri is of regional significance to Auckland given its role as a construction material and itsease of transport to Central Auckland. Auckland is projected to experience significant growth over the coming 30years, with an additional 720,000 residents requiring 313,000 homes over this time2. As discussed in Section 3,this population growth will be focused within the existing urban core, driving an increased demand for concreteas a building material for new homes, business premises, transport assets, social infrastructure and networkutilities. Without a secure and reliable source of sand for concrete manufacturing, the ability of the constructionsector to meet Auckland’s needs will be compromised, with subsequent negative consequences for Aucklanders’quality of life and housing affordability. The importance of the sand resource and the benefits of the activity areelaborated on in Sections 3 and 6.2.
Regardless, MBL is cognisant of the high natural, social and cultural values at Pakiri (as identified in Section 4).Considering this, a range of technical reports have been commissioned to investigate the effects of theextraction activity and what, if any, mitigation is required. This has included consideration of potential effects onmarine ecology, avifauna, coastal process, cultural effects, landscape values and water quality.
In addition, a new vessel has recently been commissioned, the William Fraser. This vessel has been designed tobe quieter and with its extra loading capacity, it requires less time on station at Pakiri to undertake sandextraction than previous MBL vessels. The William Fraser has been designed to improve the overallenvironmental performance of MBL’s operation at Pakiri and was commissioned specifically for MBL. In addition,MBL propose to switch to greater reliance on night-time extraction and will seek to limit any extraction onweekends and public holidays (although some extraction may be required during those times given demand andweather constraints). The benefits of both the new vessel (as opposed to the historically employed vessels) andthe altered extraction schedule are discussed further in Section 6 and Appendix B.
Section 9, in conjunction with Appendix B of the AEE addresses statutory matters under sections 104, 104B, 105and 107 of the Resource Management Act 1991 (the RMA). This assessment includes consideration of theAuckland Unitary Plan (Operative in Part) (AUP(OP)), the Hauraki Gulf Marine Park Act, the New Zealand CoastalPolicy Statement (NZCPS), the Auckland Plan 2050 (the Auckland Plan) and the Hauraki Gulf Marine SpatialPlan.
Lastly, MBL is aware of the significant public interest in sand extraction at Pakiri. MBL has consulted widely withinterested parties, all of whom preferred extraction further offshore. Based on this feedback and to makeimprovements to the operational capability of MBL, a decision was made to apply for a new consent more than500 m further offshore than the existing consented extraction area, based on the shift of the inner boundary ofboth consent applications. It is envisaged that if this consent should be granted to MBL’s satisfaction, thecurrent consent would be surrendered. Given this interest, MBL request that this application undergoes publicnotification.
2 Auckland Plan 2050, Auckland Council
Assessment of Effects on the Environment
IZ111900-EP-RPT-002 8
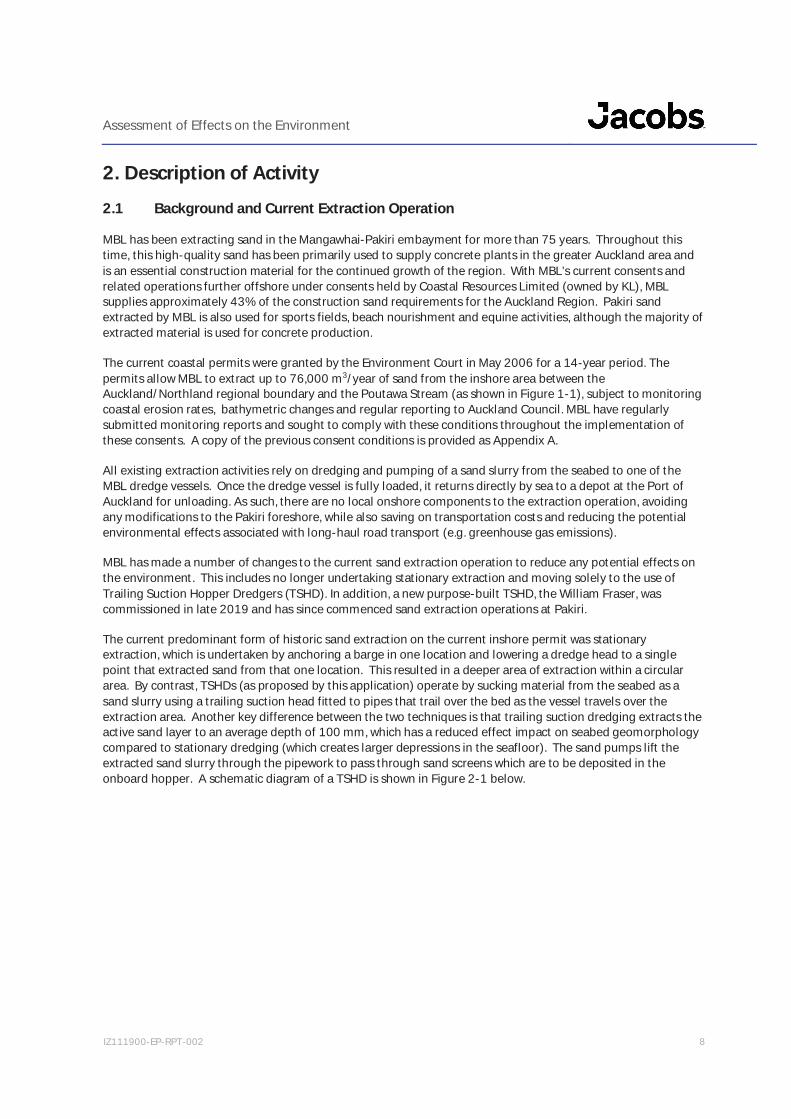
2. Description of Activity2.1 Background and Current Extraction Operation
MBL has been extracting sand in the Mangawhai-Pakiri embayment for more than 75 years. Throughout thistime, this high-quality sand has been primarily used to supply concrete plants in the greater Auckland area andis an essential construction material for the continued growth of the region. With MBL’s current consents andrelated operations further offshore under consents held by Coastal Resources Limited (owned by KL), MBLsupplies approximately 43% of the construction sand requirements for the Auckland Region. Pakiri sandextracted by MBL is also used for sports fields, beach nourishment and equine activities, although the majority ofextracted material is used for concrete production.
The current coastal permits were granted by the Environment Court in May 2006 for a 14-year period. Thepermits allow MBL to extract up to 76,000 m3/year of sand from the inshore area between theAuckland/Northland regional boundary and the Poutawa Stream (as shown in Figure 1-1), subject to monitoringcoastal erosion rates, bathymetric changes and regular reporting to Auckland Council. MBL have regularlysubmitted monitoring reports and sought to comply with these conditions throughout the implementation ofthese consents. A copy of the previous consent conditions is provided as Appendix A.
All existing extraction activities rely on dredging and pumping of a sand slurry from the seabed to one of theMBL dredge vessels. Once the dredge vessel is fully loaded, it returns directly by sea to a depot at the Port ofAuckland for unloading. As such, there are no local onshore components to the extraction operation, avoidingany modifications to the Pakiri foreshore, while also saving on transportation costs and reducing the potentialenvironmental effects associated with long-haul road transport (e.g. greenhouse gas emissions).
MBL has made a number of changes to the current sand extraction operation to reduce any potential effects onthe environment. This includes no longer undertaking stationary extraction and moving solely to the use ofTrailing Suction Hopper Dredgers (TSHD). In addition, a new purpose-built TSHD, the William Fraser, wascommissioned in late 2019 and has since commenced sand extraction operations at Pakiri.
The current predominant form of historic sand extraction on the current inshore permit was stationaryextraction, which is undertaken by anchoring a barge in one location and lowering a dredge head to a singlepoint that extracted sand from that one location. This resulted in a deeper area of extraction within a circulararea. By contrast, TSHDs (as proposed by this application) operate by sucking material from the seabed as asand slurry using a trailing suction head fitted to pipes that trail over the bed as the vessel travels over theextraction area. Another key difference between the two techniques is that trailing suction dredging extracts theactive sand layer to an average depth of 100 mm, which has a reduced effect impact on seabed geomorphologycompared to stationary dredging (which creates larger depressions in the seafloor). The sand pumps lift theextracted sand slurry through the pipework to pass through sand screens which are to be deposited in theonboard hopper. A schematic diagram of a TSHD is shown in Figure 2-1 below.

Assessment of Effects on the Environment
IZ111900-EP-RPT-002 9
Figure 2-1: Schematic Diagram of Trailing Suction Hopper Dredge (note not an actual MBL vessel)
2.2 Proposed Consent Area and Volumes
This consent application proposes sand extraction from a new mid-shore area between 15 m and 25 m depth (asshown in Figure 1-1) and will replace the current inshore extraction areas. A duration of 35 years3 is sought andwill involve the following rate of extraction:
An average rate of 125,000 m3/year over any consecutive 5 year period and a maximum rate of 150,000m3 over any 12-month period, with the temporal distribution of the extraction volume being limited to amaximum of 15,000 m3 over any consecutive 30 day period and to be spatially balanced between aseries of extraction cells located along the beach and between the 15 and 25 m depth contours.
3 A duration of 35 years is also sought for the associated discharges from the extraction vessel.
Assessment of Effects on the Environment
IZ111900-EP-RPT-002 10
Table 2-1: Co-ordinates of new extraction area (NZTM projection)
NZTM2000 Projection NZGD2000 Projection1751204 59937341751413 59939341751900 59934791752079 59937421751719 59940971750052 59969351747801 60008911746958 60029611746424 60025371746240 60023441746633 60018461746710 60015411746871 60013241746942 60010921747184 60006731747394 60003841747545 59999881747622 59999211748103 59989511748165 59987131748335 59985871748731 59979741748900 59979431749415 59973461749443 59972461749881 59968501749599 59963471749810 59958431750064 59955011750339 59950181750825 59942851750946 59941541751077 5993917
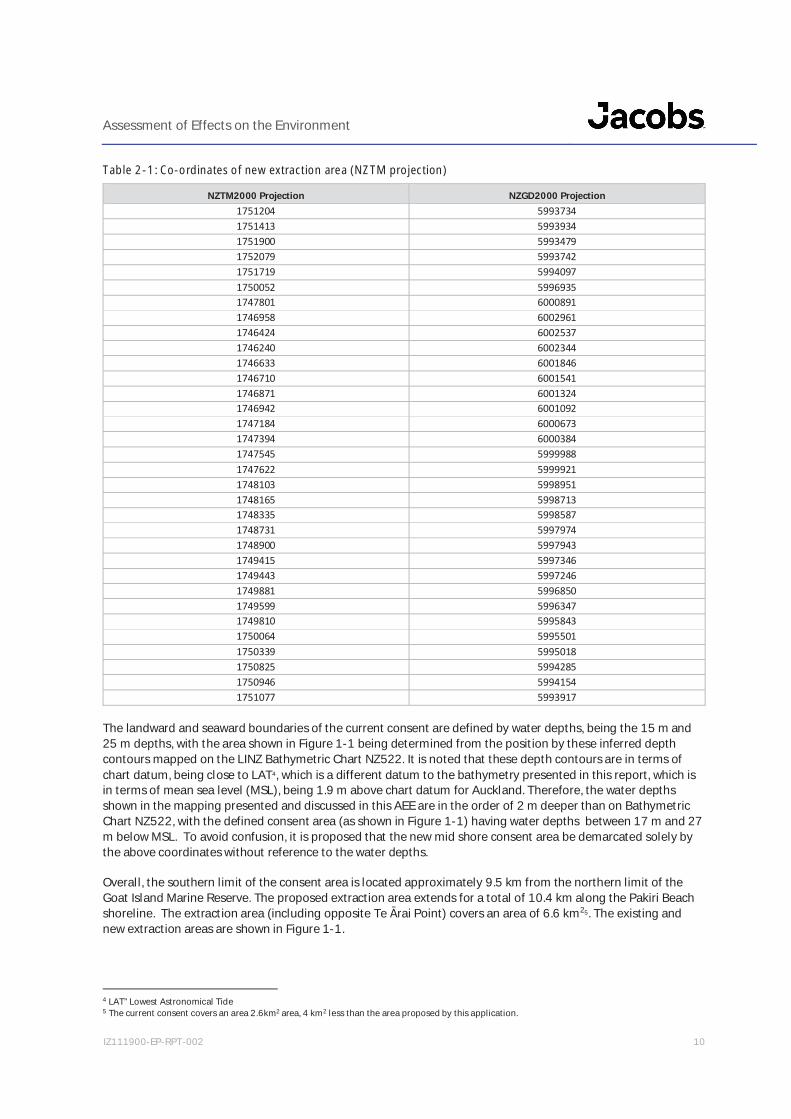
The landward and seaward boundaries of the current consent are defined by water depths, being the 15 m and25 m depths, with the area shown in Figure 1-1 being determined from the position by these inferred depthcontours mapped on the LINZ Bathymetric Chart NZ522. It is noted that these depth contours are in terms ofchart datum, being close to LAT4, which is a different datum to the bathymetry presented in this report, which isin terms of mean sea level (MSL), being 1.9 m above chart datum for Auckland. Therefore, the water depthsshown in the mapping presented and discussed in this AEE are in the order of 2 m deeper than on BathymetricChart NZ522, with the defined consent area (as shown in Figure 1-1) having water depths between 17 m and 27m below MSL. To avoid confusion, it is proposed that the new mid shore consent area be demarcated solely bythe above coordinates without reference to the water depths.
Overall, the southern limit of the consent area is located approximately 9.5 km from the northern limit of theGoat Island Marine Reserve. The proposed extraction area extends for a total of 10.4 km along the Pakiri Beachshoreline. The extraction area (including opposite Te rai Point) covers an area of 6.6 km25. The existing andnew extraction areas are shown in Figure 1-1.
4 LAT” Lowest Astronomical Tide5 The current consent covers an area 2.6km2 area, 4 km2 less than the area proposed by this application.

Assessment of Effects on the Environment
IZ111900-EP-RPT-002 11
2.3 Dredging Vessels and Equipment
As indicated above, sand extraction will be undertaken by TSHDs. The current vessel, the William Fraser, hasbeen in operation since late 2019 and features the following characteristics:
Table 2-2: William Fraser Characteristics
Photograph
Commissioned 2019
Length 68 m
Beam 16 m
Deck Size 43 m x 10 m
Hopper Capacity 900 m3
Loaded Draft 4.2 m
Vessel extraction speed 1.5 – 2.5 knots
Draghead Width 1.5 m
Sand pump capacity 400 mm
Sand screen size 2.5 mm
The William Fraser is designed to be able to operate in swells up to 2.5 m in height, although it is unlikely tooperate in such conditions given the risk of damage to the dredgehead. It has wind operating limits of 25 knotsfrom the NW to SE (clockwise) and 40 knots from west to south (anti-clockwise). Based on wave and windhindcast data presented by MetOcean (2019), the William Fraser should be able to operate for 99% of days onan annual basis, with the lowest workability during July, when winter conditions prevail.
While it is proposed that all sand extraction under this proposed consent will be by TSHD and that initially thiswill be undertaken by the William Fraser, MBL do not wish to limit the operation of the consent to only thisvessel. The use of similar types of vessels in the future may be possible, with the potential effects on theenvironment from the use of alternative dredge vessels anticipated to also be better than the existing dredgeoperation currently carried out by the William Fraser. In addition, unforeseen circumstances (such asmaintenance) may also require the use of a different vessel.
2.4 Sand Extraction OperationOnce the dredge vessel arrives in the extraction location, speed is reduced to 1.5 to 2.5 knots and the generatoris started to power the davits for lowering the pipes and the sand pump. The drag-head is unsecured from thevessel, the davits extend the pump and dredge pipework over the side and they are slowly lowered to theseabed. The pump is started as the drag head descends to the seabed and water will start coming on board the
Assessment of Effects on the Environment
IZ111900-EP-RPT-002 12
vessel through the pipework and screen gear. Once the drag head reaches the seabed, pumping of the sandslurry begins and continues as the vessel moves forward along a pre-determined dredge track. With the WilliamFraser, the extraction process utilises recent advances in international industry best practice allowing a greatersand to water ratio to be drawn into the drag-head, more efficient screening systems and moon pools to reducedischarge turbidity. These practices increase the overall efficiency of the extraction operation when comparedwith earlier vessels.
The optimum operation involves the dredger staying on the same extraction track for as long as possible,starting at southern or northern boundary of the extraction area and then staying on the same track to the otherend. Once a dredge run reaches the end of the extraction area, the drag-head is lifted off the seabed and thevessel turns back and then resumes extraction in the reverse direction on another dredge track. When thedredge hopper is full, the drag-head is lifted and the pump pushes water through the flumes to clear the systemof any sand. The pumps and generator units are shut down, the pipes are lifted back into their storage place(s)and secured to the cradle on the vessel. The vessel then returns with a full hopper to the depot (at the Port ofAuckland) for unloading. The round-trip time for the William Fraser from the Port of Auckland and a completeddredge operation is in the order of 16 hours. Most of this time (i.e. 12-14 hours) is in transit to and from thePakiri extraction area.
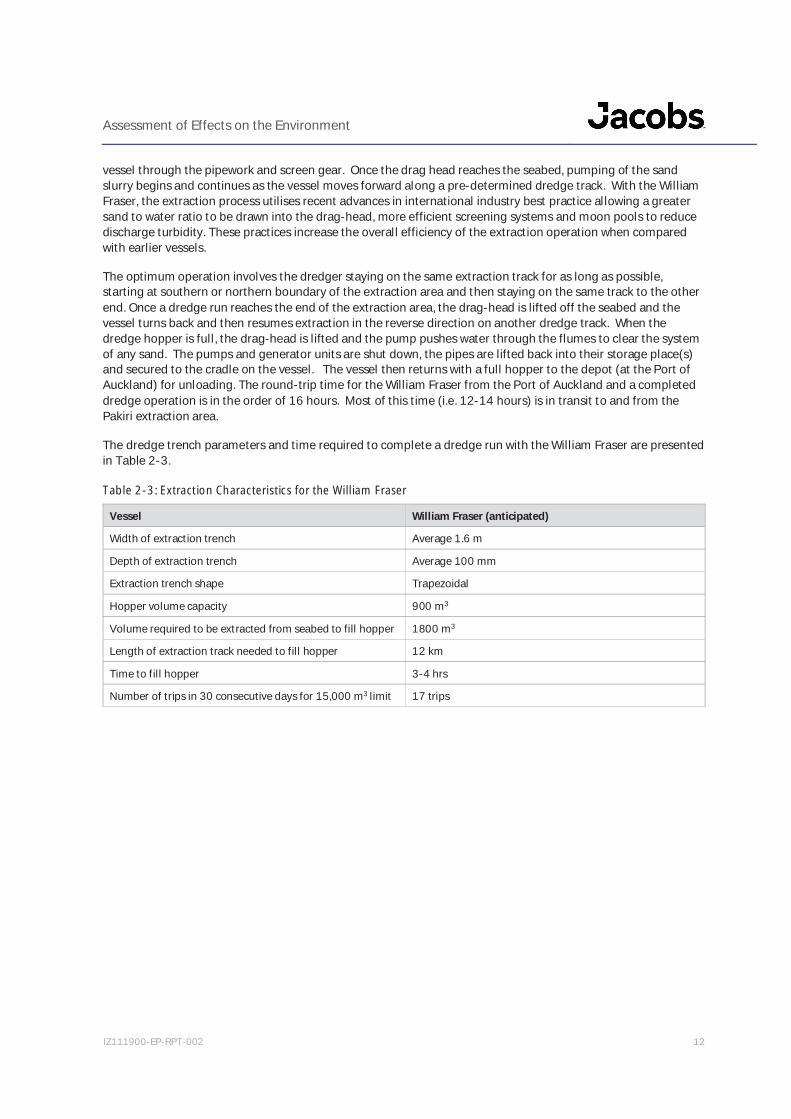
The dredge trench parameters and time required to complete a dredge run with the William Fraser are presentedin Table 2-3.
Table 2-3: Extraction Characteristics for the William Fraser
Vessel William Fraser (anticipated)
Width of extraction trench Average 1.6 m
Depth of extraction trench Average 100 mm
Extraction trench shape Trapezoidal
Hopper volume capacity 900 m3
Volume required to be extracted from seabed to fill hopper 1800 m3
Length of extraction track needed to fill hopper 12 km
Time to fill hopper 3-4 hrs
Number of trips in 30 consecutive days for 15,000 m3 limit 17 trips
Assessment of Effects on the Environment
IZ111900-EP-RPT-002 13
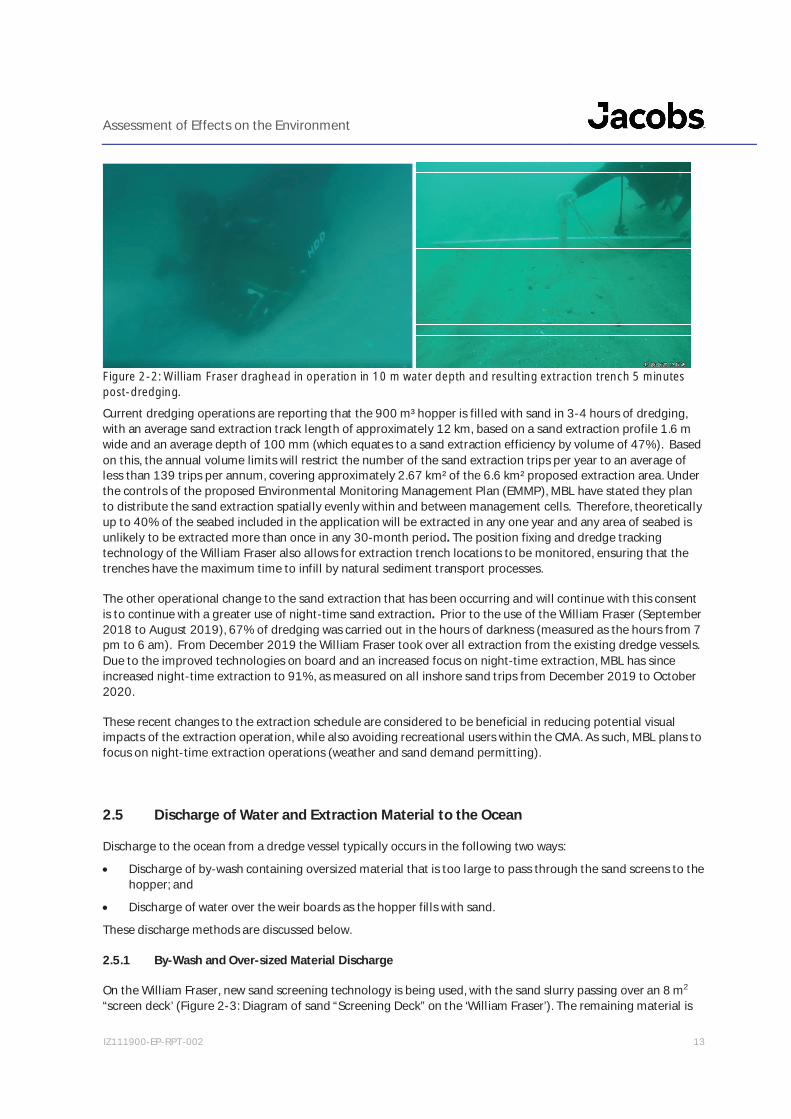
Figure 2-2: William Fraser draghead in operation in 10 m water depth and resulting extraction trench 5 minutespost-dredging.Current dredging operations are reporting that the 900 m³ hopper is filled with sand in 3-4 hours of dredging,with an average sand extraction track length of approximately 12 km, based on a sand extraction profile 1.6 mwide and an average depth of 100 mm (which equates to a sand extraction efficiency by volume of 47%). Basedon this, the annual volume limits will restrict the number of the sand extraction trips per year to an average ofless than 139 trips per annum, covering approximately 2.67 km² of the 6.6 km² proposed extraction area. Underthe controls of the proposed Environmental Monitoring Management Plan (EMMP), MBL have stated they planto distribute the sand extraction spatially evenly within and between management cells. Therefore, theoreticallyup to 40% of the seabed included in the application will be extracted in any one year and any area of seabed isunlikely to be extracted more than once in any 30-month period. The position fixing and dredge trackingtechnology of the William Fraser also allows for extraction trench locations to be monitored, ensuring that thetrenches have the maximum time to infill by natural sediment transport processes.
The other operational change to the sand extraction that has been occurring and will continue with this consentis to continue with a greater use of night-time sand extraction. Prior to the use of the William Fraser (September2018 to August 2019), 67% of dredging was carried out in the hours of darkness (measured as the hours from 7pm to 6 am). From December 2019 the William Fraser took over all extraction from the existing dredge vessels.Due to the improved technologies on board and an increased focus on night-time extraction, MBL has sinceincreased night-time extraction to 91%, as measured on all inshore sand trips from December 2019 to October2020.
These recent changes to the extraction schedule are considered to be beneficial in reducing potential visualimpacts of the extraction operation, while also avoiding recreational users within the CMA. As such, MBL plans tofocus on night-time extraction operations (weather and sand demand permitting).
2.5 Discharge of Water and Extraction Material to the Ocean
Discharge to the ocean from a dredge vessel typically occurs in the following two ways:
Discharge of by-wash containing oversized material that is too large to pass through the sand screens to thehopper; and
Discharge of water over the weir boards as the hopper fills with sand.
These discharge methods are discussed below.
2.5.1 By-Wash and Over-sized Material Discharge
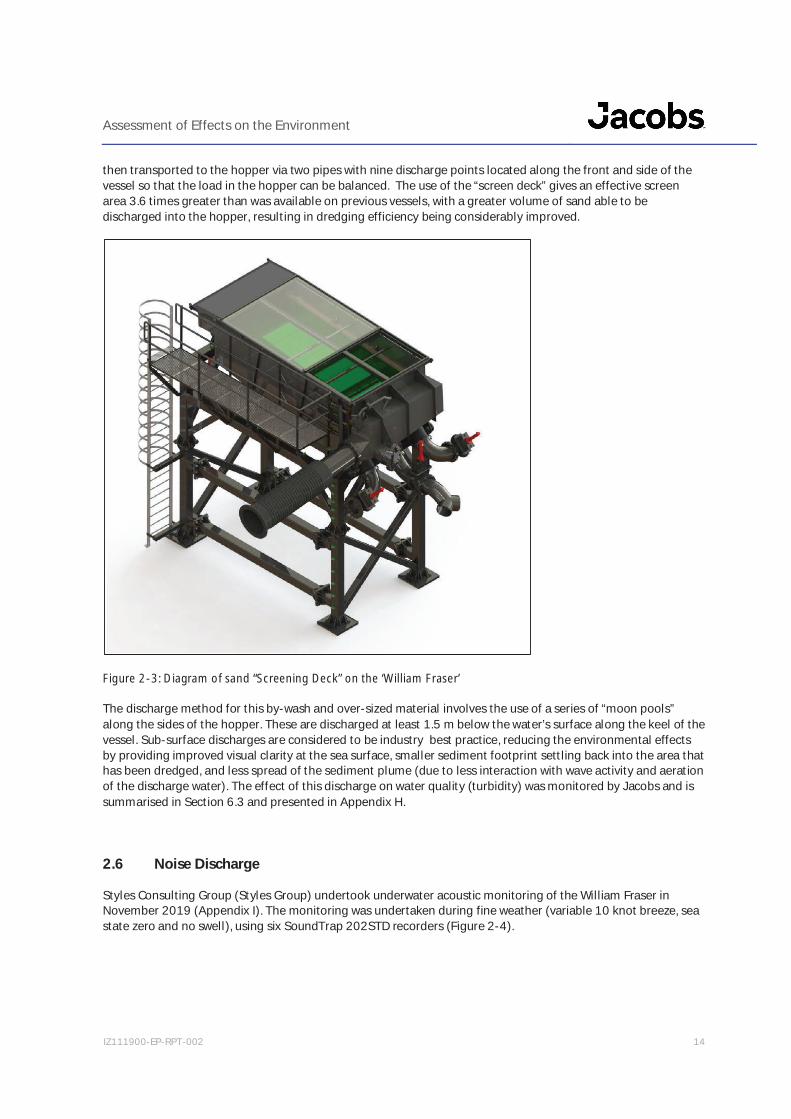
On the William Fraser, new sand screening technology is being used, with the sand slurry passing over an 8 m2
“screen deck’ (Figure 2-3: Diagram of sand “Screening Deck” on the ‘William Fraser’). The remaining material is
Assessment of Effects on the Environment
IZ111900-EP-RPT-002 14
then transported to the hopper via two pipes with nine discharge points located along the front and side of thevessel so that the load in the hopper can be balanced. The use of the “screen deck” gives an effective screenarea 3.6 times greater than was available on previous vessels, with a greater volume of sand able to bedischarged into the hopper, resulting in dredging efficiency being considerably improved.
Figure 2-3: Diagram of sand “Screening Deck” on the ‘William Fraser’
The discharge method for this by-wash and over-sized material involves the use of a series of “moon pools”along the sides of the hopper. These are discharged at least 1.5 m below the water’s surface along the keel of thevessel. Sub-surface discharges are considered to be industry best practice, reducing the environmental effectsby providing improved visual clarity at the sea surface, smaller sediment footprint settling back into the area thathas been dredged, and less spread of the sediment plume (due to less interaction with wave activity and aerationof the discharge water). The effect of this discharge on water quality (turbidity) was monitored by Jacobs and issummarised in Section 6.3 and presented in Appendix H.
2.6 Noise Discharge
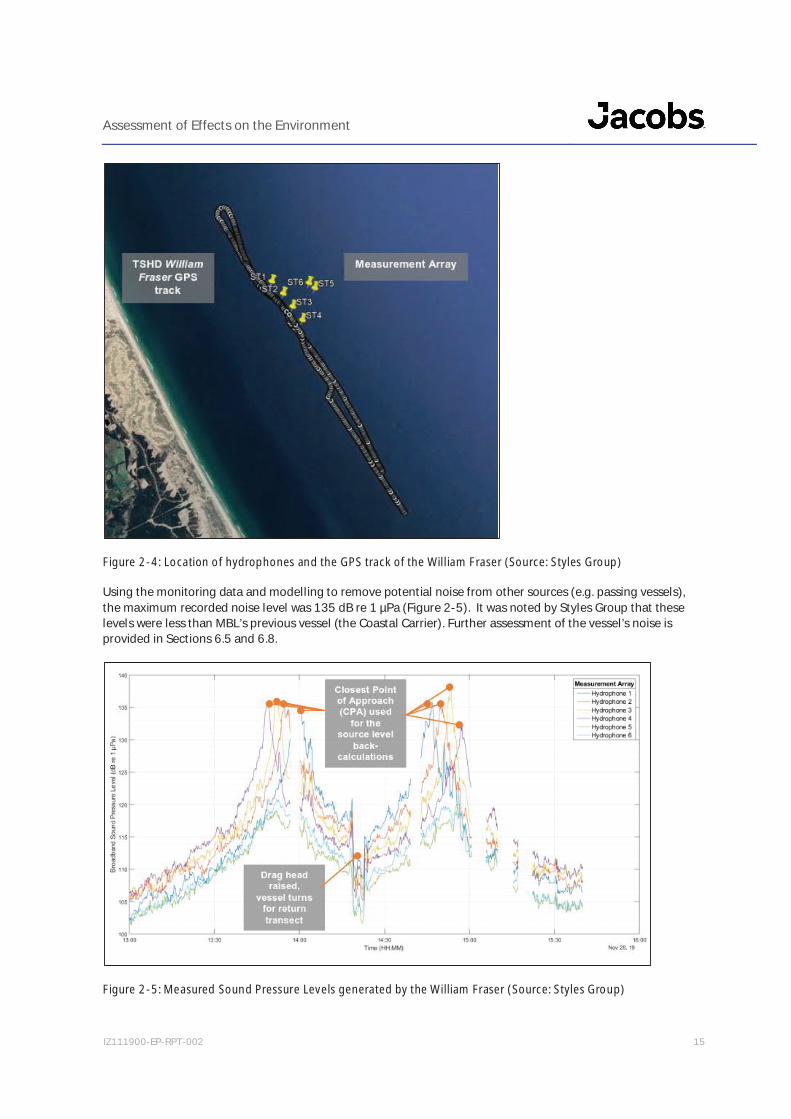
Styles Consulting Group (Styles Group) undertook underwater acoustic monitoring of the William Fraser inNovember 2019 (Appendix I). The monitoring was undertaken during fine weather (variable 10 knot breeze, seastate zero and no swell), using six SoundTrap 202STD recorders (Figure 2-4).
Assessment of Effects on the Environment
IZ111900-EP-RPT-002 15
Figure 2-4: Location of hydrophones and the GPS track of the William Fraser (Source: Styles Group)
Using the monitoring data and modelling to remove potential noise from other sources (e.g. passing vessels),the maximum recorded noise level was 135 dB re 1 µPa (Figure 2-5). It was noted by Styles Group that theselevels were less than MBL’s previous vessel (the Coastal Carrier). Further assessment of the vessel’s noise isprovided in Sections 6.5 and 6.8.
Figure 2-5: Measured Sound Pressure Levels generated by the William Fraser (Source: Styles Group)

Assessment of Effects on the Environment
IZ111900-EP-RPT-002 16
3. The Pakiri Sand Resource and its Strategic Importance toAuckland
The underlying purpose of this application is to allow MBL to continue the extraction of sand in the Mangawhai-Pakiri embayment but undertaking this further offshore than the current inshore area of Pakiri. This sand is avital resource for the ongoing sustainable growth and development of the Auckland region, not least because ofits importance to the construction sector. In light of this, the following section details both the regionalsignificance of the sand resource at Pakiri, but also its role in addressing the strategic growth and economicpressures facing Auckland.
Figure 3-1: Sand Delivery at the Port of Auckland during June 2018 (Source: Jacobs)
3.1 The Pakiri Sand Resource
Sand is a ubiquitous resource in modern life. It is the key component in the manufacture of concrete and glass. Itis used for the restoration of eroding beaches and as a surface treatment in many of Auckland’s parks. However,not all sand is created equal. Given its origins from weathered rock and ground shells, the chemistry, grain sizeand sediment content of sand can differ greatly between marine, freshwater or land-based locations. Thesedifferences affect the usefulness and overall importance of sand resources for the construction sector.
As noted in the Concrete Industry Report by Brett Beatson (Appendix E), East Coast sands (i.e. Pakiri sand) areideal for concrete production and the construction sector. Mr Beatson states that coastal sand is:
“very clean, has consistent grading, good particle shape, is strong and durable and contains very few ultra-fineparticles; these characteristics greatly reduce the risk of early plastic shrinkage or long-term drying shrinkageissues.”
In comparison, sand extracted from the Waikato is less useful for concrete production given its chemical andphysical properties. These sands contain a number of minerals which are of a volcanic origin and consequentlyhave a higher reactivity to cement alkalis. This has resulted in cases of Alkali Silica Reaction (ASR), leading tosignificant damage in structures. The potential adverse outcomes of using high alkali reactive sands is reflectedin construction standards (NZS 3104:2003), which places a maximum limit of 2.5 kg/m³ of total alkali in
Assessment of Effects on the Environment
IZ111900-EP-RPT-002 17
concrete when potentially reactive aggregate or sand is used6. Therefore, complying with this standard can bequite challenging where Waikato sourced sands are used.
The Kaipara Harbour is also used as a source of sand for Auckland. However, given the ecological importance ofthe harbour (including to West Coast fisheries), its largely undeveloped nature and high cultural values, thefuture of continued sand extraction within the Kaipara Harbour is uncertain. This uncertainty in its long-termavailability increases the strategic importance of other sand resources to ensure continuity of supply.
Furthermore, the location of the Mangawhai-Pakiri resource on Auckland’s East Coast assists in the transport ofthis bulk commodity to market. Given that sand is a low value, high volume commodity, its transport andhandling costs must be kept to a minimum to make extraction economically viable. Extraction on the East Coastcan be undertaken by sea vessel and then easily transported to the Port of Auckland. Other sand resources, suchas those on the Kaipara Harbour, Tomorata or from the Waikato, require additional handling and road transportof a significant distance to reach Central Auckland and the region’s urban growth hubs. The closest resource toAuckland is from the Kaipara Harbour, which has a travel distance of 55 km one way to Central Auckland. Otherresources are located even further from Auckland’s urban core.
Having undertaken a wider assessment of the regional marine sand resource, Market Economics (Appendix D)have identified that sand extraction at Pakiri supplies at least 43% of all sand to the Auckland market, with theremaining supply mainly coming from operations in the Kaipara Harbour. This figure highlights the importanceof the Pakiri sand resource to the Auckland region and the importance of continued access for its extraction,especially given the technical difficulties and environmental sensitivities associated with extraction in the KaiparaHarbour, as well as the reduced usefulness and travel distance required from the Waikato and other relict dunesourced sand for the construction industry.
3.2 Auckland’s Sand Demand
The second strand to the importance of this sand resource is Auckland’s high demand for low cost buildingmaterials as the city grows. As noted by the Auckland Plan, one of the key challenges facing the region ispopulation growth7. From an existing population of 1.66 million, this growth is expected to generate apopulation increase of 720,000 people over 30 years, with Auckland reaching 2.4 million residents. Theseadditional residents need new homes (313,000 extra dwellings), workplaces, schools, roads, rail lines, hospitalsand utilities8. All of these features of modern urban life will require concrete and as such, a steady and reliablesource of sand.
Underlying this future urban growth is the Auckland Council’s strategic direction for a quality compact urbanform9. This direction is reflected in the Auckland Plan’s development strategy, which details that the majority ofgrowth is to occur within the existing Rural Urban Boundary (RUB). While some greenfield locations exist withinthe urban area (e.g. Flatbush, Red Hills and Whenuapai), most development within the RUB is categorised as“brownfield” (including development in metropolitan and town centres). Regardless of this brownfield andgreenfield split, in order to accommodate the required extra dwellings, there will be a move to higher densityhousing typologies.
This move towards more multi-storey multi-unit residential building types is reinforced by the AUP(OP)’s ownurban zonings. For instance, within the Residential – Terrace Housing and Apartment Buildings Zone, a maximumbuilding height of 16m is provided for. Underpinning the new higher density urban form will be concrete. Whilesome new buildings may use other materials such as steel or wood for their structures, almost all buildings willrely on concrete for foundations, their utility connections and the transport networks which serve them.
6 NZS 3104:2003 - Specification for concrete production7 Page 13, Auckland Plan 2050.8 Page 13. Ibid.9 Page 89, Ibid.
Assessment of Effects on the Environment
IZ111900-EP-RPT-002 18
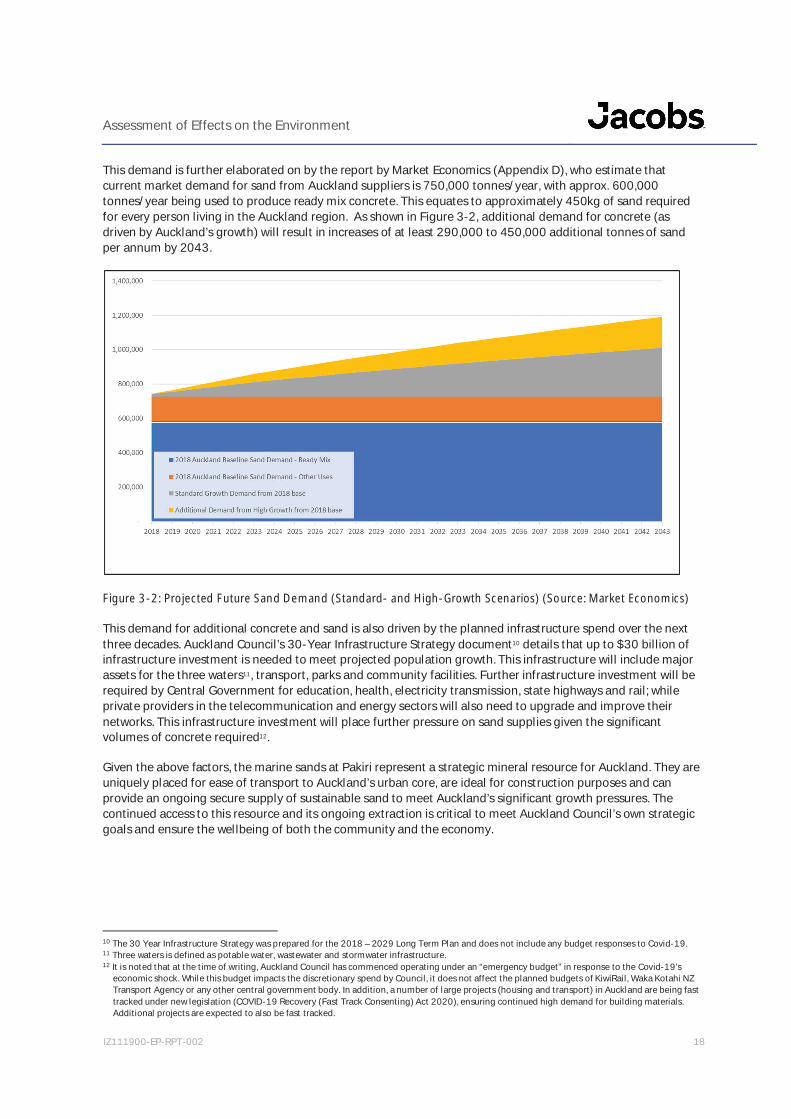
This demand is further elaborated on by the report by Market Economics (Appendix D), who estimate thatcurrent market demand for sand from Auckland suppliers is 750,000 tonnes/year, with approx. 600,000tonnes/year being used to produce ready mix concrete. This equates to approximately 450kg of sand requiredfor every person living in the Auckland region. As shown in Figure 3-2, additional demand for concrete (asdriven by Auckland’s growth) will result in increases of at least 290,000 to 450,000 additional tonnes of sandper annum by 2043.
Figure 3-2: Projected Future Sand Demand (Standard- and High-Growth Scenarios) (Source: Market Economics)
This demand for additional concrete and sand is also driven by the planned infrastructure spend over the nextthree decades. Auckland Council’s 30-Year Infrastructure Strategy document10 details that up to $30 billion ofinfrastructure investment is needed to meet projected population growth. This infrastructure will include majorassets for the three waters11, transport, parks and community facilities. Further infrastructure investment will berequired by Central Government for education, health, electricity transmission, state highways and rail; whileprivate providers in the telecommunication and energy sectors will also need to upgrade and improve theirnetworks. This infrastructure investment will place further pressure on sand supplies given the significantvolumes of concrete required12.
Given the above factors, the marine sands at Pakiri represent a strategic mineral resource for Auckland. They areuniquely placed for ease of transport to Auckland’s urban core, are ideal for construction purposes and canprovide an ongoing secure supply of sustainable sand to meet Auckland’s significant growth pressures. Thecontinued access to this resource and its ongoing extraction is critical to meet Auckland Council’s own strategicgoals and ensure the wellbeing of both the community and the economy.
10 The 30 Year Infrastructure Strategy was prepared for the 2018 – 2029 Long Term Plan and does not include any budget responses to Covid-19.11 Three waters is defined as potable water, wastewater and stormwater infrastructure.12 It is noted that at the time of writing, Auckland Council has commenced operating under an “emergency budget” in response to the Covid-19’s
economic shock. While this budget impacts the discretionary spend by Council, it does not affect the planned budgets of KiwiRail, Waka Kotahi NZTransport Agency or any other central government body. In addition, a number of large projects (housing and transport) in Auckland are being fasttracked under new legislation (COVID-19 Recovery (Fast Track Consenting) Act 2020), ensuring continued high demand for building materials.Additional projects are expected to also be fast tracked.
Assessment of Effects on the Environment
IZ111900-EP-RPT-002 19
4. Site Location and Existing Environment4.1 Location and Surrounding Development
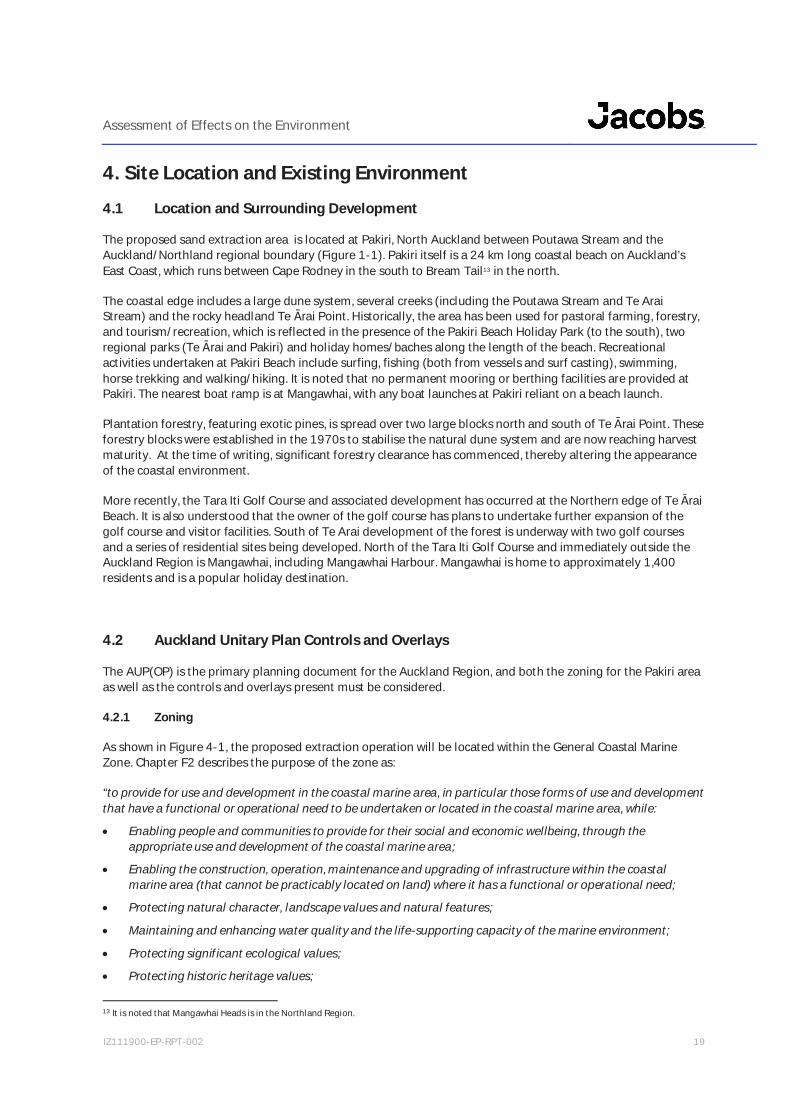
The proposed sand extraction area is located at Pakiri, North Auckland between Poutawa Stream and theAuckland/Northland regional boundary (Figure 1-1). Pakiri itself is a 24 km long coastal beach on Auckland’sEast Coast, which runs between Cape Rodney in the south to Bream Tail13 in the north.
The coastal edge includes a large dune system, several creeks (including the Poutawa Stream and Te AraiStream) and the rocky headland Te rai Point. Historically, the area has been used for pastoral farming, forestry,and tourism/recreation, which is reflected in the presence of the Pakiri Beach Holiday Park (to the south), tworegional parks (Te rai and Pakiri) and holiday homes/baches along the length of the beach. Recreationalactivities undertaken at Pakiri Beach include surfing, fishing (both from vessels and surf casting), swimming,horse trekking and walking/hiking. It is noted that no permanent mooring or berthing facilities are provided atPakiri. The nearest boat ramp is at Mangawhai, with any boat launches at Pakiri reliant on a beach launch.
Plantation forestry, featuring exotic pines, is spread over two large blocks north and south of Te rai Point. Theseforestry blocks were established in the 1970s to stabilise the natural dune system and are now reaching harvestmaturity. At the time of writing, significant forestry clearance has commenced, thereby altering the appearanceof the coastal environment.
More recently, the Tara Iti Golf Course and associated development has occurred at the Northern edge of Te raiBeach. It is also understood that the owner of the golf course has plans to undertake further expansion of thegolf course and visitor facilities. South of Te Arai development of the forest is underway with two golf coursesand a series of residential sites being developed. North of the Tara Iti Golf Course and immediately outside theAuckland Region is Mangawhai, including Mangawhai Harbour. Mangawhai is home to approximately 1,400residents and is a popular holiday destination.
4.2 Auckland Unitary Plan Controls and Overlays
The AUP(OP) is the primary planning document for the Auckland Region, and both the zoning for the Pakiri areaas well as the controls and overlays present must be considered.
4.2.1 Zoning
As shown in Figure 4-1, the proposed extraction operation will be located within the General Coastal MarineZone. Chapter F2 describes the purpose of the zone as:
“to provide for use and development in the coastal marine area, in particular those forms of use and developmentthat have a functional or operational need to be undertaken or located in the coastal marine area, while:
Enabling people and communities to provide for their social and economic wellbeing, through theappropriate use and development of the coastal marine area;
Enabling the construction, operation, maintenance and upgrading of infrastructure within the coastalmarine area (that cannot be practicably located on land) where it has a functional or operational need;
Protecting natural character, landscape values and natural features;
Maintaining and enhancing water quality and the life-supporting capacity of the marine environment;
Protecting significant ecological values;
Protecting historic heritage values;
13 It is noted that Mangawhai Heads is in the Northland Region.

Assessment of Effects on the Environment
IZ111900-EP-RPT-002 20
Recognising and providing for mana whenua values in accordance with tikanga M ori;
Maintaining and enhancing public access, open space, recreational use, amenity values, and access to andalong the coastal marine area;
Not increasing the risk of subdivision, use and development being adversely affected by coastal hazards; and
Managing conflicts between activities within the coastal marine area.14”
It is noted that the zone recognises the importance of enabling social and economic wellbeing and theoperational or functional need for certain activities (e.g. mineral extraction) to take place in this zone.
Figure 4-1: AUP(OP) Coastal Zoning – shown as light blue colouring (Source: Auckland Council GeoMaps)
4.2.2 Significant Ecological Areas
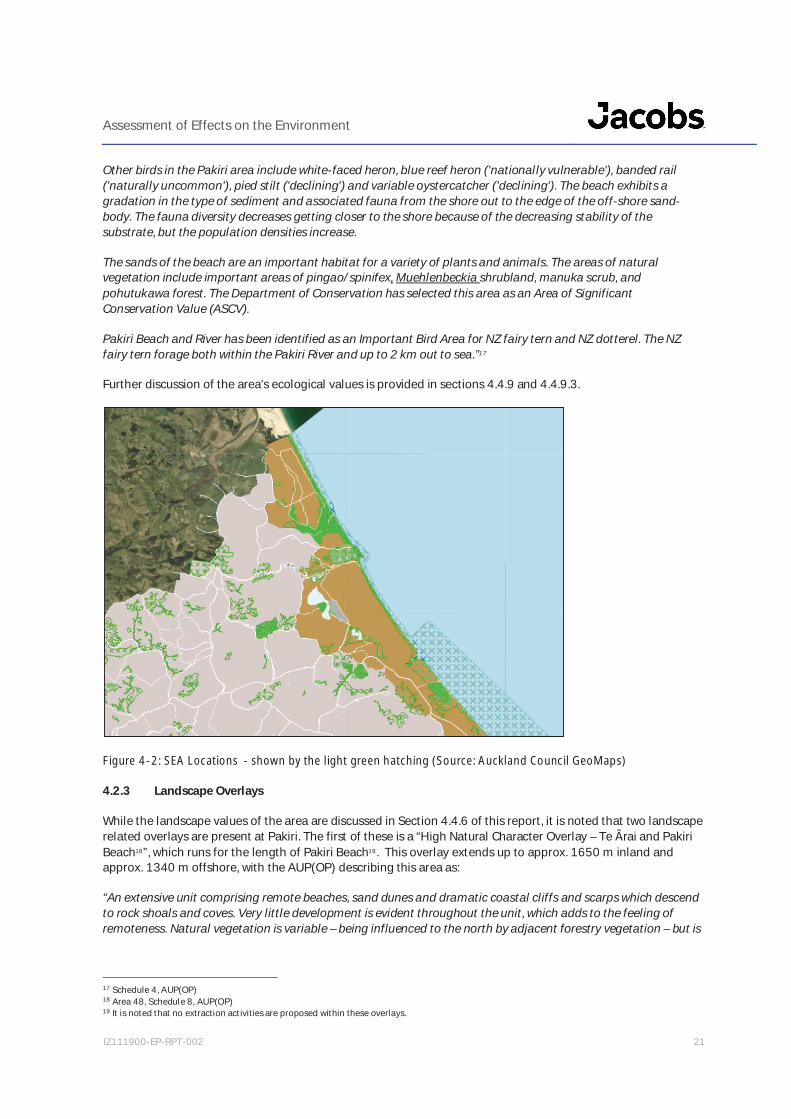
Four marine Significant Ecological Areas (SEAs) are present within the Pakiri Area (Figure 4-2Figure 4-2: SEALocations - shown by the light green hatching (Source: Auckland Council GeoMaps)15. These are identified bythe AUP(OP) as:
SEA-M2-87a (Pakiri Beach);
SEA-M2-87b;
SEA-M2-87c (Poutawa stream mouth); and
SEA-M1-87d (Te rai Stream Mouth).
The largest of these SEAs is SEA-M2-87a, which is described by the AUP(OP) as:
“Pakiri Beach is the only exposed mainland east coast surf beach free of housing and backed by extensive sanddunes and dune lakes and is of regional significance. The endemic threatened sedge, pingao (Ficinia spiralis)('relict'), is found on the dunes along the Pakiri coast.
Regionally significant populations of the threatened sand coprosma (Coprosma acerosa) ('Declining') are alsopresent on the back dunes. Mangawhai is a breeding area for the largest flock of New Zealand dotterels('nationally vulnerable') in the Auckland Region and is one of only three nesting sites in the country for the'nationally critical' New Zealand fairy tern16.
14 Chapter F2, AUP(OP)15 No extraction activities are proposed within these SEAs.16 It is noted that that there are actually four such nesting sites - Waipu, Papakanui Spit, Mangawhai and Pakiri River Mouth
Assessment of Effects on the Environment
IZ111900-EP-RPT-002 21
Other birds in the Pakiri area include white-faced heron, blue reef heron ('nationally vulnerable'), banded rail('naturally uncommon'), pied stilt ('declining') and variable oystercatcher ('declining'). The beach exhibits agradation in the type of sediment and associated fauna from the shore out to the edge of the off-shore sand-body. The fauna diversity decreases getting closer to the shore because of the decreasing stability of thesubstrate, but the population densities increase.
The sands of the beach are an important habitat for a variety of plants and animals. The areas of naturalvegetation include important areas of pingao/spinifex, Muehlenbeckia shrubland, manuka scrub, andpohutukawa forest. The Department of Conservation has selected this area as an Area of SignificantConservation Value (ASCV).
Pakiri Beach and River has been identified as an Important Bird Area for NZ fairy tern and NZ dotterel. The NZfairy tern forage both within the Pakiri River and up to 2 km out to sea.”17
Further discussion of the area’s ecological values is provided in sections 4.4.9 and 4.4.9.3.
Figure 4-2: SEA Locations - shown by the light green hatching (Source: Auckland Council GeoMaps)
4.2.3 Landscape Overlays
While the landscape values of the area are discussed in Section 4.4.6 of this report, it is noted that two landscaperelated overlays are present at Pakiri. The first of these is a “High Natural Character Overlay – Te rai and PakiriBeach18”, which runs for the length of Pakiri Beach19. This overlay extends up to approx. 1650 m inland andapprox. 1340 m offshore, with the AUP(OP) describing this area as:
“An extensive unit comprising remote beaches, sand dunes and dramatic coastal cliffs and scarps which descendto rock shoals and coves. Very little development is evident throughout the unit, which adds to the feeling ofremoteness. Natural vegetation is variable – being influenced to the north by adjacent forestry vegetation – but is
17 Schedule 4, AUP(OP)18 Area 48, Schedule 8, AUP(OP)19 It is noted that no extraction activities are proposed within these overlays.
Assessment of Effects on the Environment
IZ111900-EP-RPT-002 22
extensive in the upper reaches of the Pakiri River, with the regenerating native forest on the ridges above PakiriRoad and the remnant native forests on the coastal scarps between Leigh and Pakiri.”20
The other landscape overlay present is an “Outstanding Natural Landscape Overlay – Pakiri Beach21. This overlayruns the length of Pakiri Beach and extends approximately 130 m inland to approximately 1340 m offshore. TheAUP(OP) describes the area within the boundaries of this overlay as:
“Coastal Wild nature (coastal) - Pakiri Ocean Beach extending into dune system for most of its length togetherwith some coastal terrace landforms at the southern end near Pakiri Stream22.”
It is noted that mineral extraction is currently undertaken within these overlays, but this application would meanthe activity moves to be outside of these overlays. In addition, forestry clearance, house construction and theestablishment of the golf course has occurred within these overlays. A number of these recent dwellings are of asignificant size, occupying a footprint greater than found with historical bach development.
4.2.4 Surf Breaks
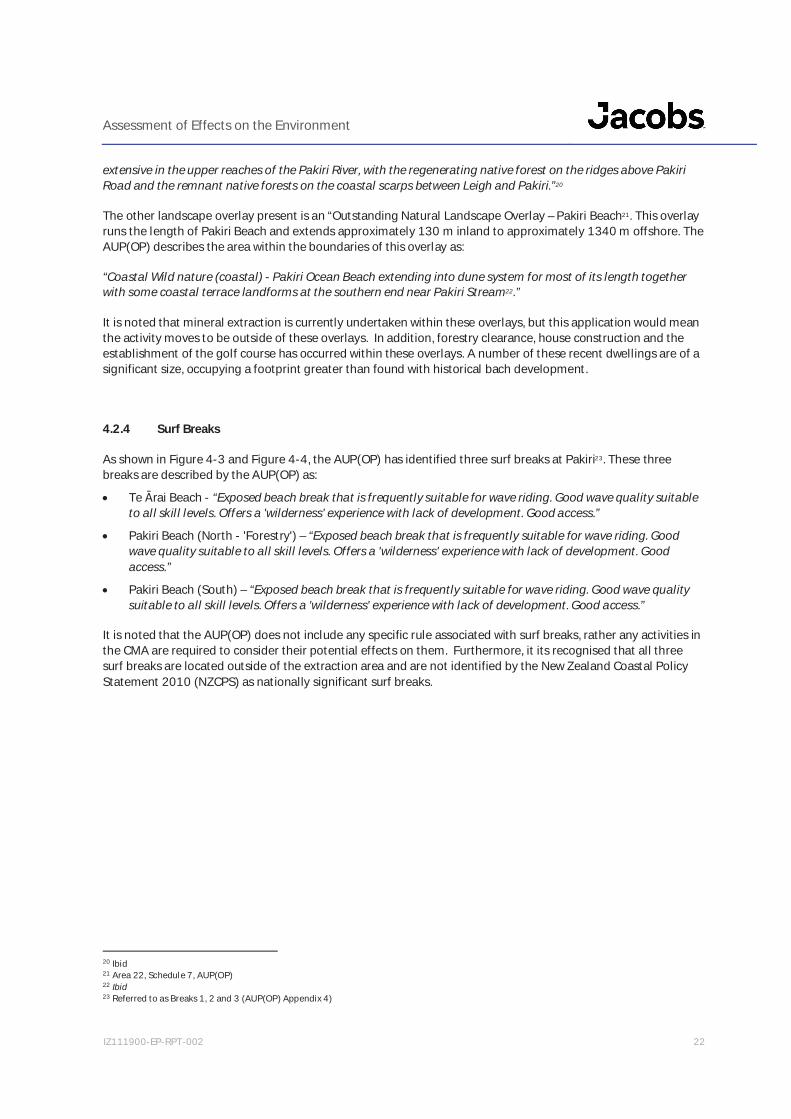
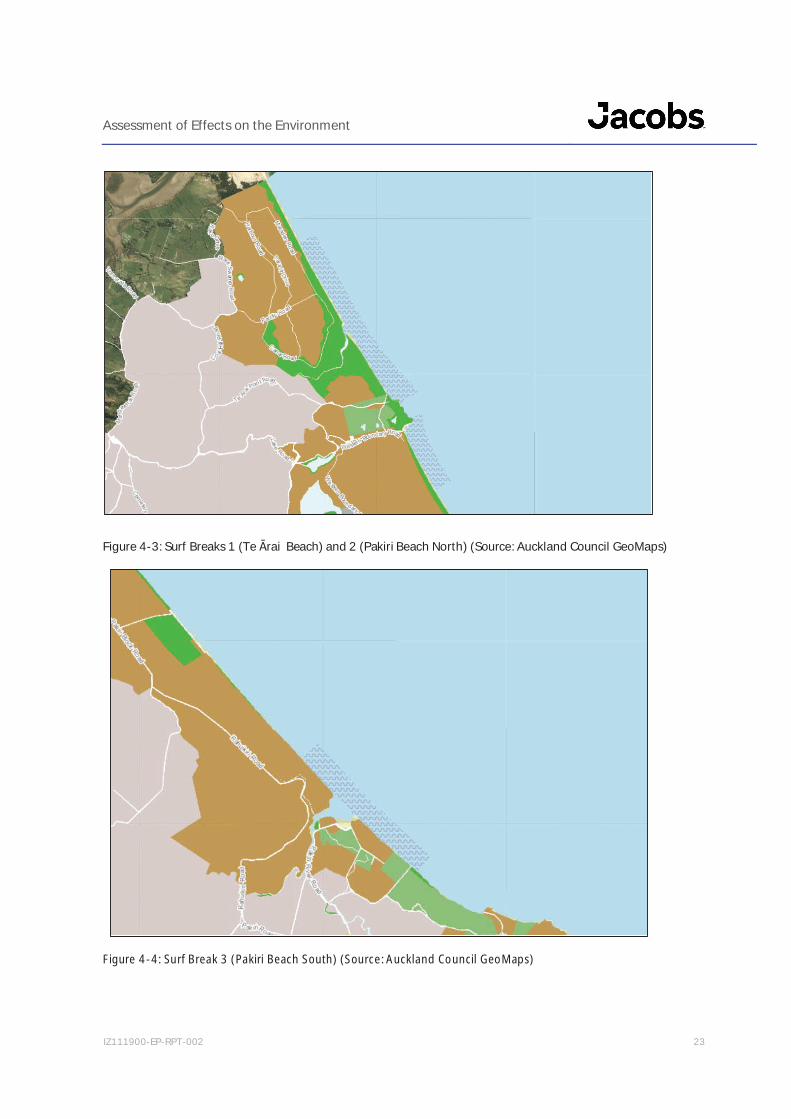
As shown in Figure 4-3 and Figure 4-4, the AUP(OP) has identified three surf breaks at Pakiri23. These threebreaks are described by the AUP(OP) as:
Te rai Beach - “Exposed beach break that is frequently suitable for wave riding. Good wave quality suitableto all skill levels. Offers a 'wilderness' experience with lack of development. Good access.”
Pakiri Beach (North - 'Forestry') – “Exposed beach break that is frequently suitable for wave riding. Goodwave quality suitable to all skill levels. Offers a 'wilderness' experience with lack of development. Goodaccess.”
Pakiri Beach (South) – “Exposed beach break that is frequently suitable for wave riding. Good wave qualitysuitable to all skill levels. Offers a 'wilderness' experience with lack of development. Good access.”
It is noted that the AUP(OP) does not include any specific rule associated with surf breaks, rather any activities inthe CMA are required to consider their potential effects on them. Furthermore, it its recognised that all threesurf breaks are located outside of the extraction area and are not identified by the New Zealand Coastal PolicyStatement 2010 (NZCPS) as nationally significant surf breaks.
20 Ibid21 Area 22, Schedule 7, AUP(OP)22 Ibid23 Referred to as Breaks 1, 2 and 3 (AUP(OP) Appendix 4)
Assessment of Effects on the Environment
IZ111900-EP-RPT-002 23
Figure 4-3: Surf Breaks 1 (Te rai Beach) and 2 (Pakiri Beach North) (Source: Auckland Council GeoMaps)
Figure 4-4: Surf Break 3 (Pakiri Beach South) (Source: Auckland Council GeoMaps)
Assessment of Effects on the Environment
IZ111900-EP-RPT-002 24
4.3 Cultural Aspects
An examination of Auckland Council GeoMaps records for the Pakiri area show the following iwi and hap ashaving an interest in the Pakiri onshore and/or offshore areas (in no particular order):
Ng ti Manuhiri;
Ng i Tai ki T maki;
Ng ti Maru;
Ng ti Te Ata;
Ng ti Wai;
Ng ti Whanaunga;
Ng ti Wh tua o Kaipara; and
Ng ti Wh tua r kei.
4.3.1 Treaty Settlements and Other Claims
It is noted that the Pakiri area has been subject to claims under the Treaty of Waitangi and the Marine andCoastal Area (Takutai Moana) Act 2011. As a result of these processes (noting that the Marine and Coastal Area(Takutai Moana) Act 2011 claims are ongoing), the following mana whenua interests have been identified in thePakiri Area:
Coastal Statutory Acknowledgement Areas for Ng ti Manuhiri, Ng i Tai ki T maki, and Te Kawerau a Maki;
Commercial redress settlement land at the South Mangawhai Forest for Ng ti Manuhiri;
Financial and commercial redress settlement land at the Mangawhai Forest for Te Uri O Hau; and
27 applicants for customary marine title over some or all of the proposed extraction area24.
Cultural Values
MBL have engaged with mana whenua and have requested the preparation of CVAs. Copies of these CVAs will beprovided to Council once they become available.
24 At the time of writing, no customary marine titles have been issued for any area of the CMA at Pakiri.
Assessment of Effects on the Environment
IZ111900-EP-RPT-002 25
4.4 Existing Environment
4.4.1 Introduction
This section provides a summary of the bio-physical characteristics of the existing environment. This informationis obtained through field work, literature reviews and laboratory testing. The methodologies associated with eachsubject area are also detailed in the respective technical reports attached to this AEE. Areas considered anddescribed include:
Wave climate and currents;
Sediment and sand quality;
Geomorphology and bathymetry;
Landscape and visual;
Marine ecology;
Water quality; and
Noise (underwater and terrestrial).
4.4.2 Wave Climate and Currents
As an exposed coastal location, Pakiri features a marine climate with frequent sea breezes that influence thelocal wave climate. Sea breezes most frequently occur between November and March, on approximately 20% ofsummer days. According to NIWA:
“Between 8 am and 10 am, breezes are initiated from the harbours in the region (Waitemata, Manukau, Kaipara)and along Auckland’s east coast, and in the late morning these ‘elementary’ breezes are augmented by ‘mature’breezes from the main water bodies surrounding the region (Tasman Sea and outer Hauraki Gulf).”25
The effect of these sea breezes on the wave climate are augmented by sea swells. NIWA’s summary of Auckland’swave climate states:
“On the east coast of Auckland, swells from an easterly or north-easterly direction tend to predominate. Thesecan originate from tropical cyclones well to the north of New Zealand or from anticyclones far to the east. Of allswells observed on the east coast the frequency of those less than one metre is about 40%, while for those greaterthan two metres is 8%. The islands in the Hauraki Gulf form a buffer to large swells for the majority of theregion.”26
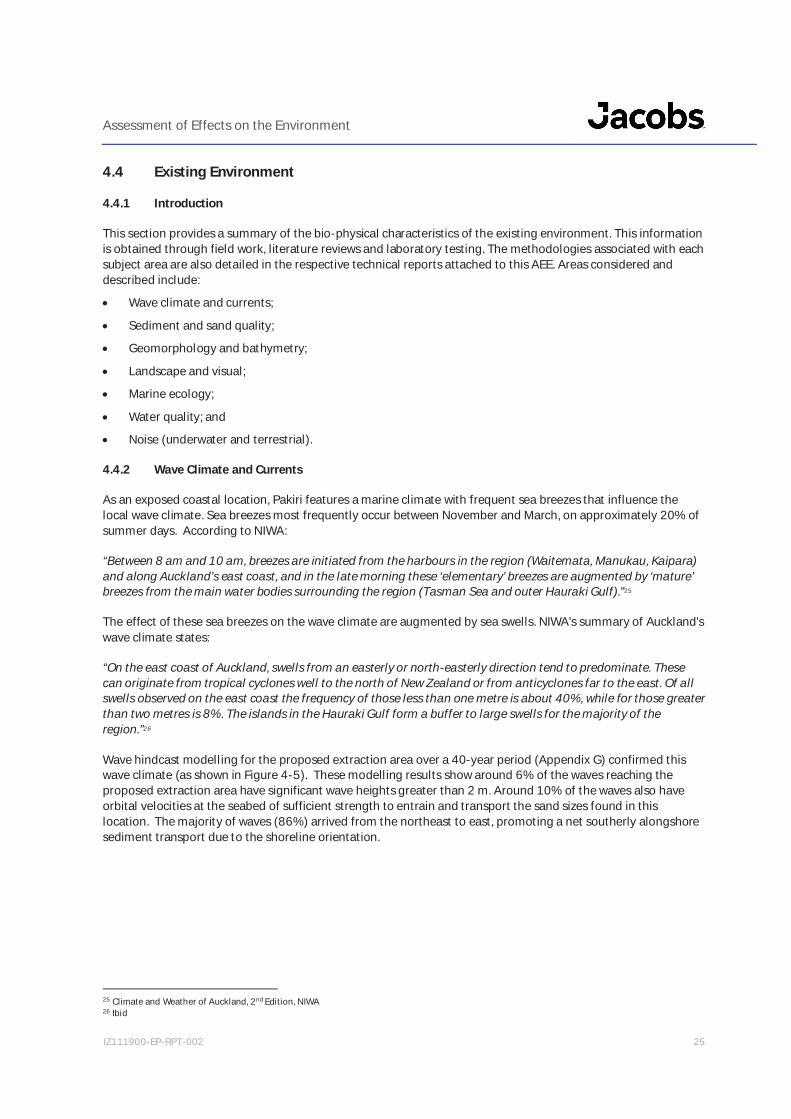
Wave hindcast modelling for the proposed extraction area over a 40-year period (Appendix G) confirmed thiswave climate (as shown in Figure 4-5). These modelling results show around 6% of the waves reaching theproposed extraction area have significant wave heights greater than 2 m. Around 10% of the waves also haveorbital velocities at the seabed of sufficient strength to entrain and transport the sand sizes found in thislocation. The majority of waves (86%) arrived from the northeast to east, promoting a net southerly alongshoresediment transport due to the shoreline orientation.
25 Climate and Weather of Auckland, 2nd Edition, NIWA26 Ibid
Assessment of Effects on the Environment
IZ111900-EP-RPT-002 26
Figure 4-5:: Wave direction-height roses for sites P1 and P2 from modelling of wave climate 1979-2018 (SourceMetOcean Solutions (2019) .
There is also the potential of the Pakiri area to be affected by severe storm events, which can cause changes toshoreline topography (e.g beach and dune erosion) and nearshore geomorphology bathymetry of theembayment. As detailed in the coastal processes report, wave bouy records from Marsden Point show 70 stormevents over a 13 year period (2007-2020) with significant wave heights above 2.5 m for three or moreconsective hours. Of these, 6 events had significant wave heights above 5 m (with a max recorded significantwave height of 6.37 m in July 2014). The 40-year modelled hindcast data for the extraction area predictedproduced the same max modelled wave heights of up to 6.37 m. Although coastal storms may occur at any timeof the year, the majority (62%) recorded occurred during winter months. It is noted that similar wave heightshave also been recorded further north at Marsden Point (using a wave buoy).
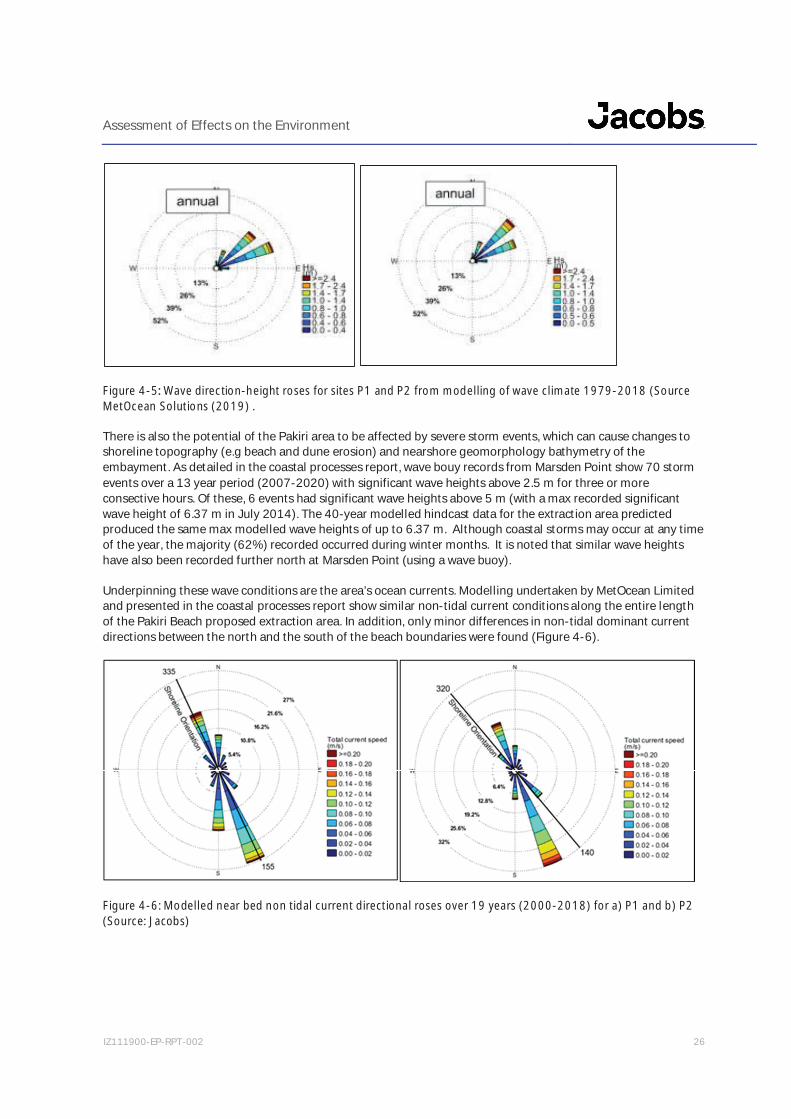
Underpinning these wave conditions are the area’s ocean currents. Modelling undertaken by MetOcean Limitedand presented in the coastal processes report show similar non-tidal current conditions along the entire lengthof the Pakiri Beach proposed extraction area. In addition, only minor differences in non-tidal dominant currentdirections between the north and the south of the beach boundaries were found (Figure 4-6).
Figure 4-6: Modelled near bed non tidal current directional roses over 19 years (2000-2018) for a) P1 and b) P2(Source: Jacobs)
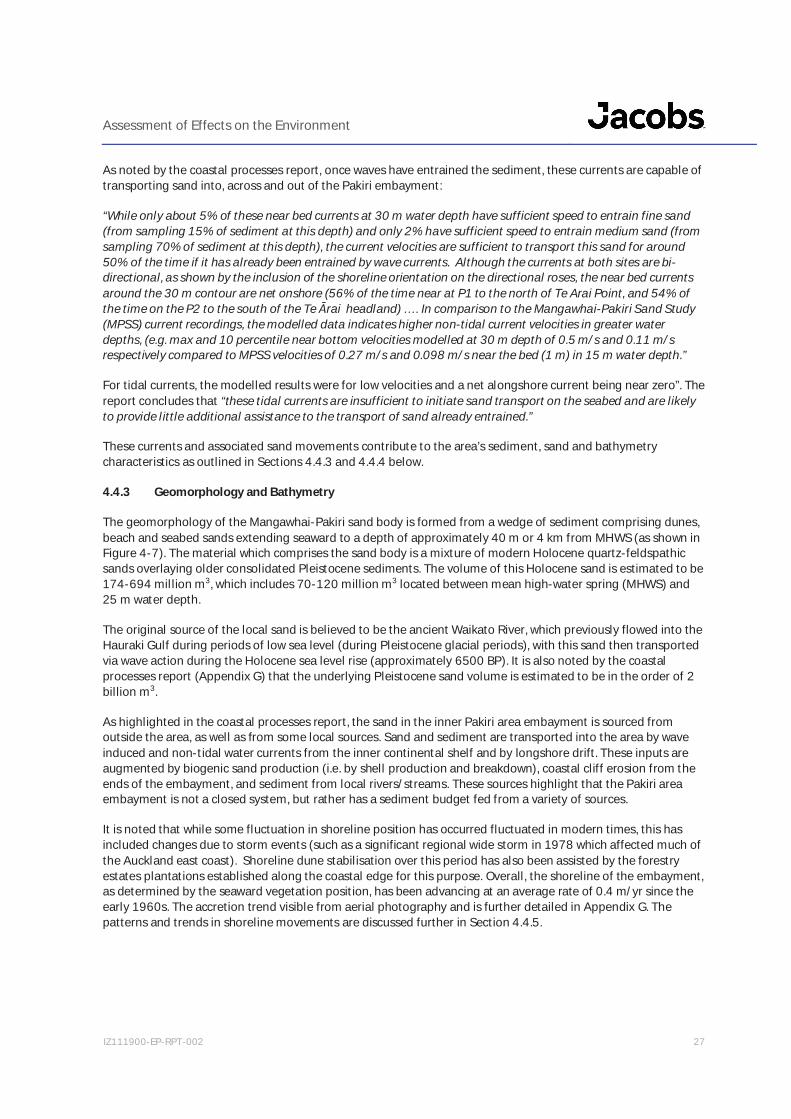
Assessment of Effects on the Environment
IZ111900-EP-RPT-002 27
As noted by the coastal processes report, once waves have entrained the sediment, these currents are capable oftransporting sand into, across and out of the Pakiri embayment:
“While only about 5% of these near bed currents at 30 m water depth have sufficient speed to entrain fine sand(from sampling 15% of sediment at this depth) and only 2% have sufficient speed to entrain medium sand (fromsampling 70% of sediment at this depth), the current velocities are sufficient to transport this sand for around50% of the time if it has already been entrained by wave currents. Although the currents at both sites are bi-directional, as shown by the inclusion of the shoreline orientation on the directional roses, the near bed currentsaround the 30 m contour are net onshore (56% of the time near at P1 to the north of Te Arai Point, and 54% ofthe time on the P2 to the south of the Te rai headland) …. In comparison to the Mangawhai-Pakiri Sand Study(MPSS) current recordings, the modelled data indicates higher non-tidal current velocities in greater waterdepths, (e.g. max and 10 percentile near bottom velocities modelled at 30 m depth of 0.5 m/s and 0.11 m/srespectively compared to MPSS velocities of 0.27 m/s and 0.098 m/s near the bed (1 m) in 15 m water depth.”
For tidal currents, the modelled results were for low velocities and a net alongshore current being near zero”. Thereport concludes that “these tidal currents are insufficient to initiate sand transport on the seabed and are likelyto provide little additional assistance to the transport of sand already entrained.”
These currents and associated sand movements contribute to the area’s sediment, sand and bathymetrycharacteristics as outlined in Sections 4.4.3 and 4.4.4 below.
4.4.3 Geomorphology and Bathymetry
The geomorphology of the Mangawhai-Pakiri sand body is formed from a wedge of sediment comprising dunes,beach and seabed sands extending seaward to a depth of approximately 40 m or 4 km from MHWS (as shown inFigure 4-7). The material which comprises the sand body is a mixture of modern Holocene quartz-feldspathicsands overlaying older consolidated Pleistocene sediments. The volume of this Holocene sand is estimated to be174-694 million m3, which includes 70-120 million m3 located between mean high-water spring (MHWS) and25 m water depth.
The original source of the local sand is believed to be the ancient Waikato River, which previously flowed into theHauraki Gulf during periods of low sea level (during Pleistocene glacial periods), with this sand then transportedvia wave action during the Holocene sea level rise (approximately 6500 BP). It is also noted by the coastalprocesses report (Appendix G) that the underlying Pleistocene sand volume is estimated to be in the order of 2billion m3.
As highlighted in the coastal processes report, the sand in the inner Pakiri area embayment is sourced fromoutside the area, as well as from some local sources. Sand and sediment are transported into the area by waveinduced and non-tidal water currents from the inner continental shelf and by longshore drift. These inputs areaugmented by biogenic sand production (i.e. by shell production and breakdown), coastal cliff erosion from theends of the embayment, and sediment from local rivers/streams. These sources highlight that the Pakiri areaembayment is not a closed system, but rather has a sediment budget fed from a variety of sources.
It is noted that while some fluctuation in shoreline position has occurred fluctuated in modern times, this hasincluded changes due to storm events (such as a significant regional wide storm in 1978 which affected much ofthe Auckland east coast). Shoreline dune stabilisation over this period has also been assisted by the forestryestates plantations established along the coastal edge for this purpose. Overall, the shoreline of the embayment,as determined by the seaward vegetation position, has been advancing at an average rate of 0.4 m/yr since theearly 1960s. The accretion trend visible from aerial photography and is further detailed in Appendix G. Thepatterns and trends in shoreline movements are discussed further in Section 4.4.5.

Assessment of Effects on the Environment
IZ111900-EP-RPT-002 28
Figure 4-7: Morphological components of the Mangawhai-Pakiri embayment (Hilton, 1990)
Regarding bathymetry, hydrographic surveys undertaken by MBL during March and October of 2019 found thatthe shoreface bathymetry profiles along Pakiri Beach are largely similar along its entire length, with littlelongshore variation in seabed slopes. The results of these surveys are detailed in the coastal processes report(Appendix G). Finally, depths on the beach side of the existing extraction area were found to generally rangefrom -6 to -8 m below MSL and on the seaward side from -14 m to -16 m.
4.4.4 Sediment and Sand Quality
The characteristics of marine sediment and sands at Pakiri were investigated in by sampling undertaken for theMPSS in the 1990’s and by further sampling undertaken by MBL and Bioresearches Limited (Bioresearches) forthe development of this application (an additional 421 samples were taken at water depth bands of 0-15 m, 15-25 m, 30 m and 40 m). From this sampling, the seabed sediment distribution can be described as:
0 m to -15 m contour (27 MBL samples), which includes the MBL inshore extraction area: Very well sortedFine to Medium sand with sample mean grain sizes (mgs) in the range 0.22 mm to 0.48 mm and averagemgs across all samples of 0.26 mm. The fine sand samples are scattered along the embayment, with a smallconcentration in the vicinity of Te rai Stream. No samples contained material finer than 0.075 mm, or hadmore than 5% coarser than 1.18 mm. The average medium grain size (D50) was 0.25 mm. There does notappear to be any differences in the sediment size distributions between the extraction areas and thesouthern control area;
-15 m to -25 m contour (49 MBL samples): Still a very well sorted sand but with a slightly coarser mgs ofpredominantly medium sand (38 samples) with areas of fine sand off the mouths of Te rai and PoutawaStreams (combined 11 samples). Across all samples in this contour band the mgs had a similar range (0.22mm to 0.47 mm) but with a slightly higher average mgs of 0.32 mm. Again, no samples contained materialfiner than 0.075 mm, or had more than 5% coarser than 1.18 mm. The average medium grain size (D50)was 0.33 mm;
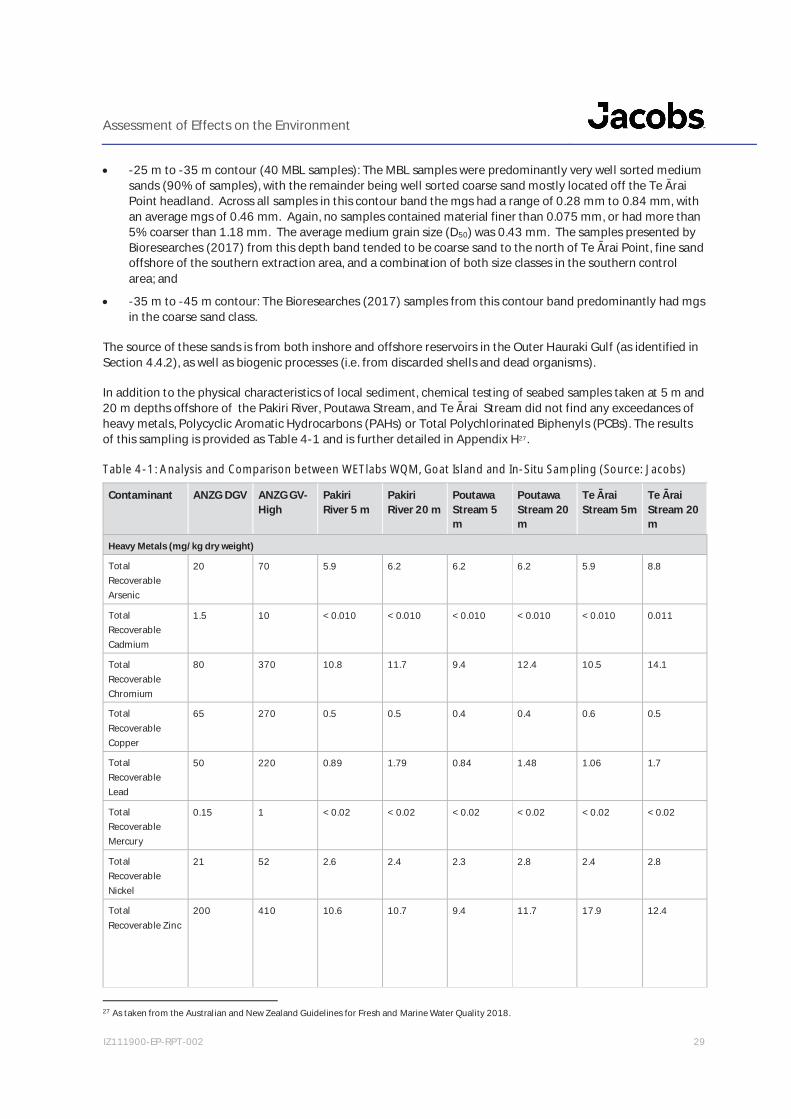
Assessment of Effects on the Environment
IZ111900-EP-RPT-002 29
-25 m to -35 m contour (40 MBL samples): The MBL samples were predominantly very well sorted mediumsands (90% of samples), with the remainder being well sorted coarse sand mostly located off the Te raiPoint headland. Across all samples in this contour band the mgs had a range of 0.28 mm to 0.84 mm, withan average mgs of 0.46 mm. Again, no samples contained material finer than 0.075 mm, or had more than5% coarser than 1.18 mm. The average medium grain size (D50) was 0.43 mm. The samples presented byBioresearches (2017) from this depth band tended to be coarse sand to the north of Te rai Point, fine sandoffshore of the southern extraction area, and a combination of both size classes in the southern controlarea; and
-35 m to -45 m contour: The Bioresearches (2017) samples from this contour band predominantly had mgsin the coarse sand class.
The source of these sands is from both inshore and offshore reservoirs in the Outer Hauraki Gulf (as identified inSection 4.4.2), as well as biogenic processes (i.e. from discarded shells and dead organisms).
In addition to the physical characteristics of local sediment, chemical testing of seabed samples taken at 5 m and20 m depths offshore of the Pakiri River, Poutawa Stream, and Te rai Stream did not find any exceedances ofheavy metals, Polycyclic Aromatic Hydrocarbons (PAHs) or Total Polychlorinated Biphenyls (PCBs). The resultsof this sampling is provided as Table 4-1 and is further detailed in Appendix H27.
Table 4-1: Analysis and Comparison between WETlabs WQM, Goat Island and In-Situ Sampling (Source: Jacobs)
Contaminant ANZG DGV ANZG GV-High
PakiriRiver 5 m
PakiriRiver 20 m
PoutawaStream 5m
PoutawaStream 20m
Te raiStream 5m
Te raiStream 20m
Heavy Metals (mg/kg dry weight)
TotalRecoverableArsenic
20 70 5.9 6.2 6.2 6.2 5.9 8.8
TotalRecoverableCadmium
1.5 10 < 0.010 < 0.010 < 0.010 < 0.010 < 0.010 0.011
TotalRecoverableChromium
80 370 10.8 11.7 9.4 12.4 10.5 14.1
TotalRecoverableCopper
65 270 0.5 0.5 0.4 0.4 0.6 0.5
TotalRecoverableLead
50 220 0.89 1.79 0.84 1.48 1.06 1.7
TotalRecoverableMercury
0.15 1 < 0.02 < 0.02 < 0.02 < 0.02 < 0.02 < 0.02
TotalRecoverableNickel
21 52 2.6 2.4 2.3 2.8 2.4 2.8
TotalRecoverable Zinc
200 410 10.6 10.7 9.4 11.7 17.9 12.4
27 As taken from the Australian and New Zealand Guidelines for Fresh and Marine Water Quality 2018.
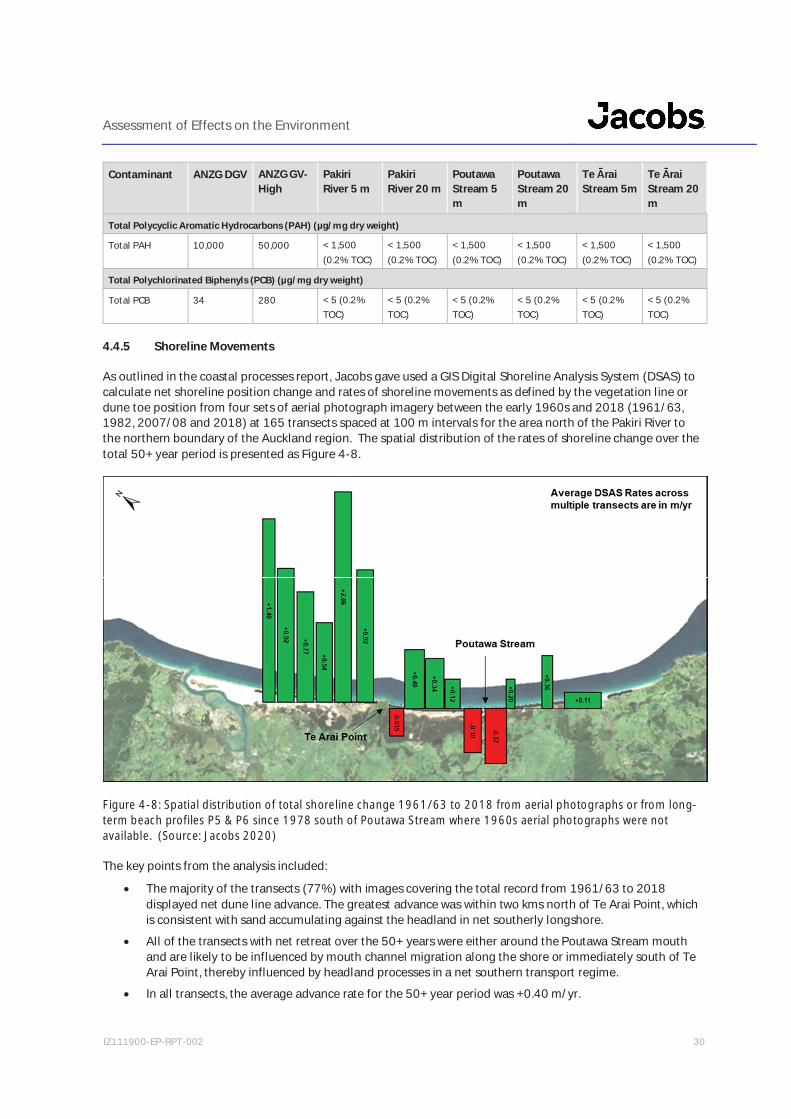
Assessment of Effects on the Environment
IZ111900-EP-RPT-002 30
Contaminant ANZG DGV ANZG GV-High
PakiriRiver 5 m
PakiriRiver 20 m
PoutawaStream 5m
PoutawaStream 20m
Te raiStream 5m
Te raiStream 20m
Total Polycyclic Aromatic Hydrocarbons (PAH) (µg/mg dry weight)
Total PAH 10,000 50,000 < 1,500(0.2% TOC)
< 1,500(0.2% TOC)
< 1,500(0.2% TOC)
< 1,500(0.2% TOC)
< 1,500(0.2% TOC)
< 1,500(0.2% TOC)
Total Polychlorinated Biphenyls (PCB) (µg/mg dry weight)
Total PCB 34 280 < 5 (0.2%TOC)
< 5 (0.2%TOC)
< 5 (0.2%TOC)
< 5 (0.2%TOC)
< 5 (0.2%TOC)
< 5 (0.2%TOC)
4.4.5 Shoreline Movements
As outlined in the coastal processes report, Jacobs gave used a GIS Digital Shoreline Analysis System (DSAS) tocalculate net shoreline position change and rates of shoreline movements as defined by the vegetation line ordune toe position from four sets of aerial photograph imagery between the early 1960s and 2018 (1961/63,1982, 2007/08 and 2018) at 165 transects spaced at 100 m intervals for the area north of the Pakiri River tothe northern boundary of the Auckland region. The spatial distribution of the rates of shoreline change over thetotal 50+ year period is presented as Figure 4-8.
Figure 4-8: Spatial distribution of total shoreline change 1961/63 to 2018 from aerial photographs or from long-term beach profiles P5 & P6 since 1978 south of Poutawa Stream where 1960s aerial photographs were notavailable. (Source: Jacobs 2020)
The key points from the analysis included:
The majority of the transects (77%) with images covering the total record from 1961/63 to 2018displayed net dune line advance. The greatest advance was within two kms north of Te Arai Point, whichis consistent with sand accumulating against the headland in net southerly longshore.
All of the transects with net retreat over the 50+ years were either around the Poutawa Stream mouthand are likely to be influenced by mouth channel migration along the shore or immediately south of TeArai Point, thereby influenced by headland processes in a net southern transport regime.
In all transects, the average advance rate for the 50+ year period was +0.40 m/yr.
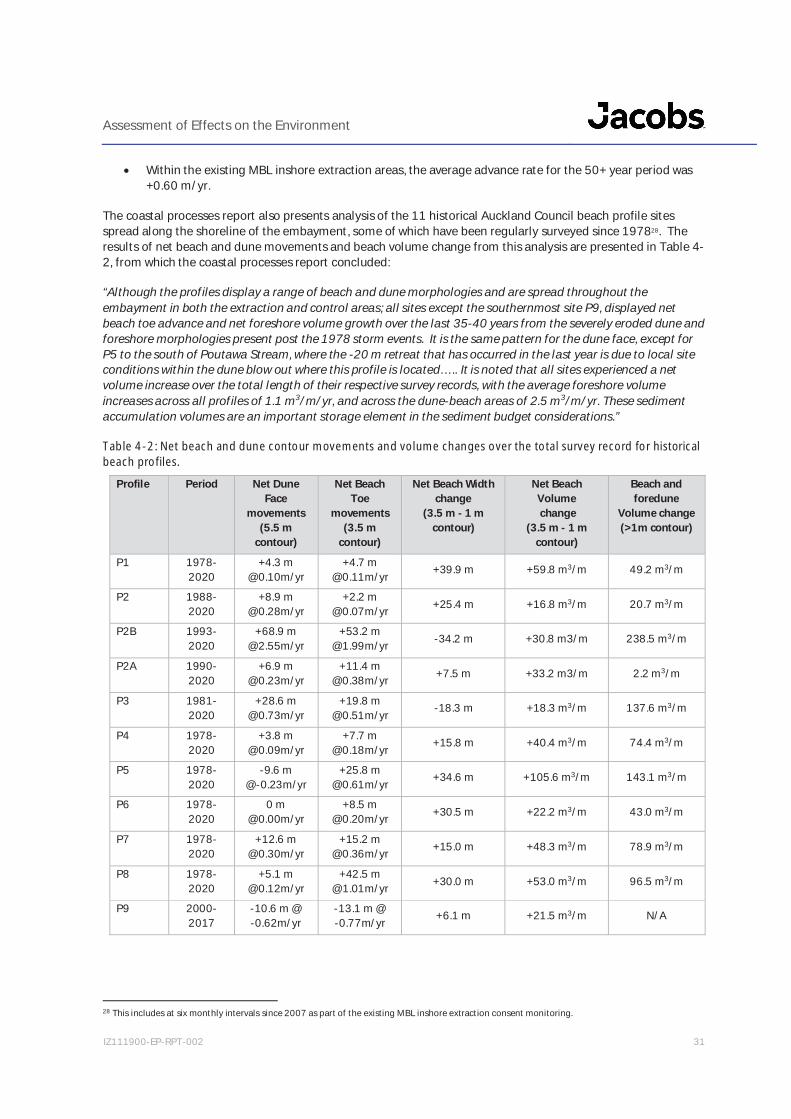
Assessment of Effects on the Environment
IZ111900-EP-RPT-002 31
Within the existing MBL inshore extraction areas, the average advance rate for the 50+ year period was+0.60 m/yr.
The coastal processes report also presents analysis of the 11 historical Auckland Council beach profile sitesspread along the shoreline of the embayment, some of which have been regularly surveyed since 197828. Theresults of net beach and dune movements and beach volume change from this analysis are presented in Table 4-2, from which the coastal processes report concluded:
“Although the profiles display a range of beach and dune morphologies and are spread throughout theembayment in both the extraction and control areas; all sites except the southernmost site P9, displayed netbeach toe advance and net foreshore volume growth over the last 35-40 years from the severely eroded dune andforeshore morphologies present post the 1978 storm events. It is the same pattern for the dune face, except forP5 to the south of Poutawa Stream, where the -20 m retreat that has occurred in the last year is due to local siteconditions within the dune blow out where this profile is located….. It is noted that all sites experienced a netvolume increase over the total length of their respective survey records, with the average foreshore volumeincreases across all profiles of 1.1 m3/m/yr, and across the dune-beach areas of 2.5 m3/m/yr. These sedimentaccumulation volumes are an important storage element in the sediment budget considerations.”
Table 4-2: Net beach and dune contour movements and volume changes over the total survey record for historicalbeach profiles.
Profile Period Net DuneFace
movements(5.5 m
contour)
Net BeachToe
movements(3.5 m
contour)
Net Beach Widthchange
(3.5 m - 1 mcontour)
Net BeachVolume change
(3.5 m - 1 mcontour)
Beach andforedune
Volume change(>1m contour)
P1 1978-2020
+4.3 [email protected]/yr
+4.7 [email protected]/yr +39.9 m +59.8 m3/m 49.2 m3/m
P2 1988-2020
+8.9 [email protected]/yr
+2.2 [email protected]/yr +25.4 m +16.8 m3/m 20.7 m3/m
P2B 1993-2020
+68.9 [email protected]/yr
+53.2 [email protected]/yr -34.2 m +30.8 m3/m 238.5 m3/m
P2A 1990-2020
+6.9 [email protected]/yr
+11.4 [email protected]/yr +7.5 m +33.2 m3/m 2.2 m3/m
P3 1981-2020
+28.6 [email protected]/yr
+19.8 [email protected]/yr -18.3 m +18.3 m3/m 137.6 m3/m
P4 1978-2020
+3.8 [email protected]/yr
+7.7 [email protected]/yr +15.8 m +40.4 m3/m 74.4 m3/m
P5 1978-2020
-9.6 [email protected]/yr
+25.8 [email protected]/yr +34.6 m +105.6 m3/m 143.1 m3/m
P6 1978-2020
0 [email protected]/yr
+8.5 [email protected]/yr +30.5 m +22.2 m3/m 43.0 m3/m
P7 1978-2020
+12.6 [email protected]/yr
+15.2 [email protected]/yr +15.0 m +48.3 m3/m 78.9 m3/m
P8 1978-2020
+5.1 [email protected]/yr
+42.5 [email protected]/yr +30.0 m +53.0 m3/m 96.5 m3/m
P9 2000-2017
-10.6 m @-0.62m/yr
-13.1 m @-0.77m/yr +6.1 m +21.5 m3/m N/A
28 This includes at six monthly intervals since 2007 as part of the existing MBL inshore extraction consent monitoring.

Assessment of Effects on the Environment
IZ111900-EP-RPT-002 32
4.4.6 Sediment Budget
The coastal processes report has undertaken a detailed assessment regarding the sources of sediment and theoverall sediment volumes present for production of a sediment budget (as shown in Table 4-3 and Figure 4-9). Arange of sediment sources contribute to the embayment including:
Biogenic (i.e. biological) sources;
Long and cross-shore movement from the inner continental shelf;
From north of Bream Tail via longshore drift;
Sediment discharges from local rivers/streams; and
Cliff erosion from headlands at either end of the embayment.
Regarding biogenic sources, Bioresearches were commissioned to determine the volumes of sediment/sandproduced by organisms (i.e. biogenic production). Using the results of Bioresearches work, 4,600 – 7,400 m3/yrof biogenic sand production should be included in the sediment budget inputs for shell production within the- 25 m CD contour, with an additional 4,000 - 5,400 m³/yr being part of the cross-shore transport from the innercontinental shelf.
Long and cross-shore movement is also a major source of sediment, as material is carried by wave action andcurrents from the inner continental shelf into the embayment. This is due in part to the grain size of sediment,which is small enough to be picked and carried towards shore by wave induced and ocean currents on a frequentbasis. This pattern of sediment source is reinforced by observations of the seabed, with numerous sand ripplesfound across the embayment in water depths of greater than 25 m CD. These ripples are formed from wavedisturbance of the seabed, which produces repeated cycles of transport and deposition before it arrives onshoreas beach sand. It is estimated from balancing the sediment budget, that up to 145,000 m³/yr arrives in theembayment via this source.
Longshore drift of sand from around Bream Tail into the embayment is another source of sediment. Thepresence of sand sized sediment out to 30 m water depths, large sand ripples on the seabed, and the occurrenceof current velocities capable of transporting sand all indicate the viability of this sediment supply route, involvingmaterial moving from Bream Bay in the north, around Bream Tail and then into the embayment. The 2006Environment Court decision estimated that 25,000 m³/yr of material arrives in the Mangawhai-Pakiriembayment from this source.
Finally, there is sediment feed into the embayment via both the discharges of rivers/streams and the erosion ofcoastal cliffs at the ends of the embayment. Both sources were previously identified in the 2006 EnvironmentCourt decision and respectively provide 17,000 m³/yr and 6,000 m³/yr.
It is noted that there are several sediment sinks (i.e. losses) to the local system. These include losses fromonshore winds and currents transporting suspended sediments out of the embayment.
Another sink, or more correctly a storage of sand within the system, is the dune/beach accretion, which the aerialphotography interpretation indicates has been occurring at an average rate of 0.4 m/yr since the early 1960s.The storage volume associated with this rate of shoreline advance over the 21 km of sand beaches from theMangawhai Inlet to the Pakiri River was calculated to range from 90,000 to 135,000 m3/yr, with 122,000 m3/yradopted as a best estimate for the sediment budget.
Overall, the sediment budget highlights the open and dynamic nature of local coastal processes. Significantvolumes of sediment enter the embayment and while some is lost to both natural and man-made processes, theremaining sediment contributes to the ongoing accretion of the beach’s dune system. It also highlights the largevolume of sand available for extraction.
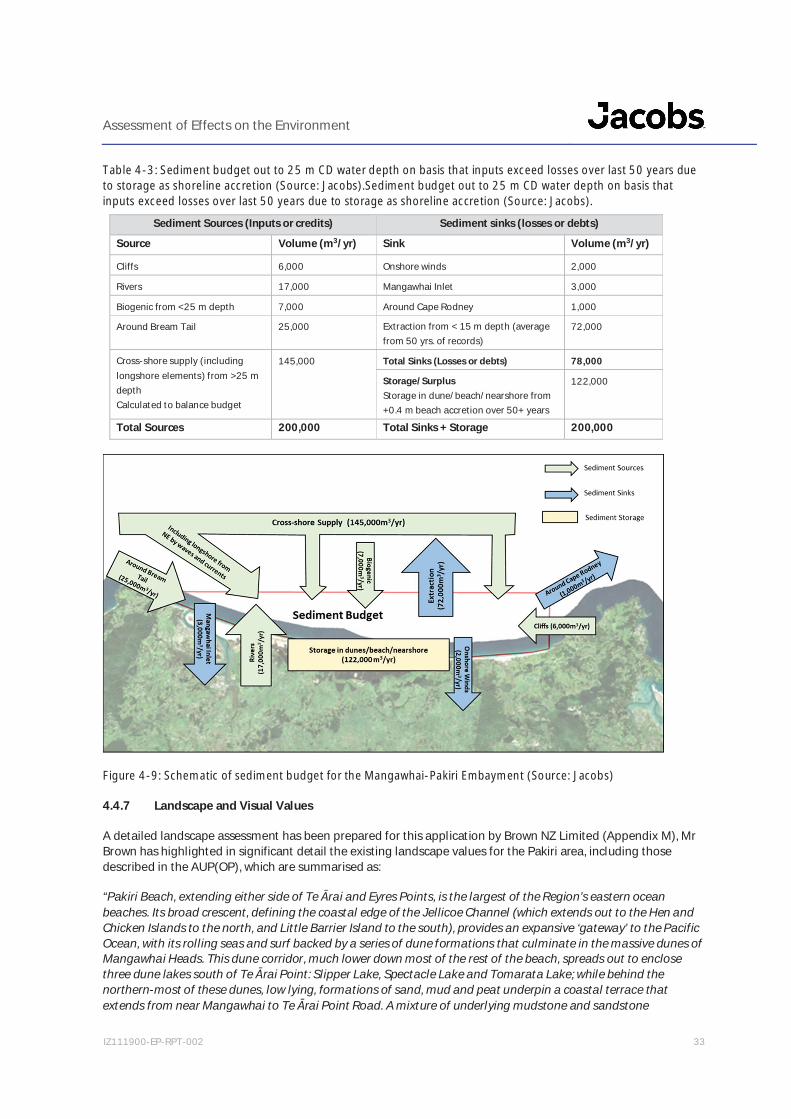
Assessment of Effects on the Environment
IZ111900-EP-RPT-002 33
Table 4-3: Sediment budget out to 25 m CD water depth on basis that inputs exceed losses over last 50 years dueto storage as shoreline accretion (Source: Jacobs).Sediment budget out to 25 m CD water depth on basis thatinputs exceed losses over last 50 years due to storage as shoreline accretion (Source: Jacobs).
Sediment Sources (Inputs or credits) Sediment sinks (losses or debts)
Source Volume (m3/yr) Sink Volume (m3/yr)
Cliffs 6,000 Onshore winds 2,000
Rivers 17,000 Mangawhai Inlet 3,000
Biogenic from <25 m depth 7,000 Around Cape Rodney 1,000
Around Bream Tail 25,000 Extraction from < 15 m depth (averagefrom 50 yrs. of records)
72,000
Cross-shore supply (includinglongshore elements) from >25 mdepthCalculated to balance budget
145,000 Total Sinks (Losses or debts) 78,000
Storage/SurplusStorage in dune/beach/nearshore from+0.4 m beach accretion over 50+ years
122,000
Total Sources 200,000 Total Sinks + Storage 200,000
Figure 4-9: Schematic of sediment budget for the Mangawhai-Pakiri Embayment (Source: Jacobs)
4.4.7 Landscape and Visual Values
A detailed landscape assessment has been prepared for this application by Brown NZ Limited (Appendix M), MrBrown has highlighted in significant detail the existing landscape values for the Pakiri area, including thosedescribed in the AUP(OP), which are summarised as:
“Pakiri Beach, extending either side of Te rai and Eyres Points, is the largest of the Region’s eastern oceanbeaches. Its broad crescent, defining the coastal edge of the Jellicoe Channel (which extends out to the Hen andChicken Islands to the north, and Little Barrier Island to the south), provides an expansive ‘gateway’ to the PacificOcean, with its rolling seas and surf backed by a series of dune formations that culminate in the massive dunes ofMangawhai Heads. This dune corridor, much lower down most of the rest of the beach, spreads out to enclosethree dune lakes south of Te rai Point: Slipper Lake, Spectacle Lake and Tomarata Lake; while behind thenorthern-most of these dunes, low lying, formations of sand, mud and peat underpin a coastal terrace thatextends from near Mangawhai to Te rai Point Road. A mixture of underlying mudstone and sandstone
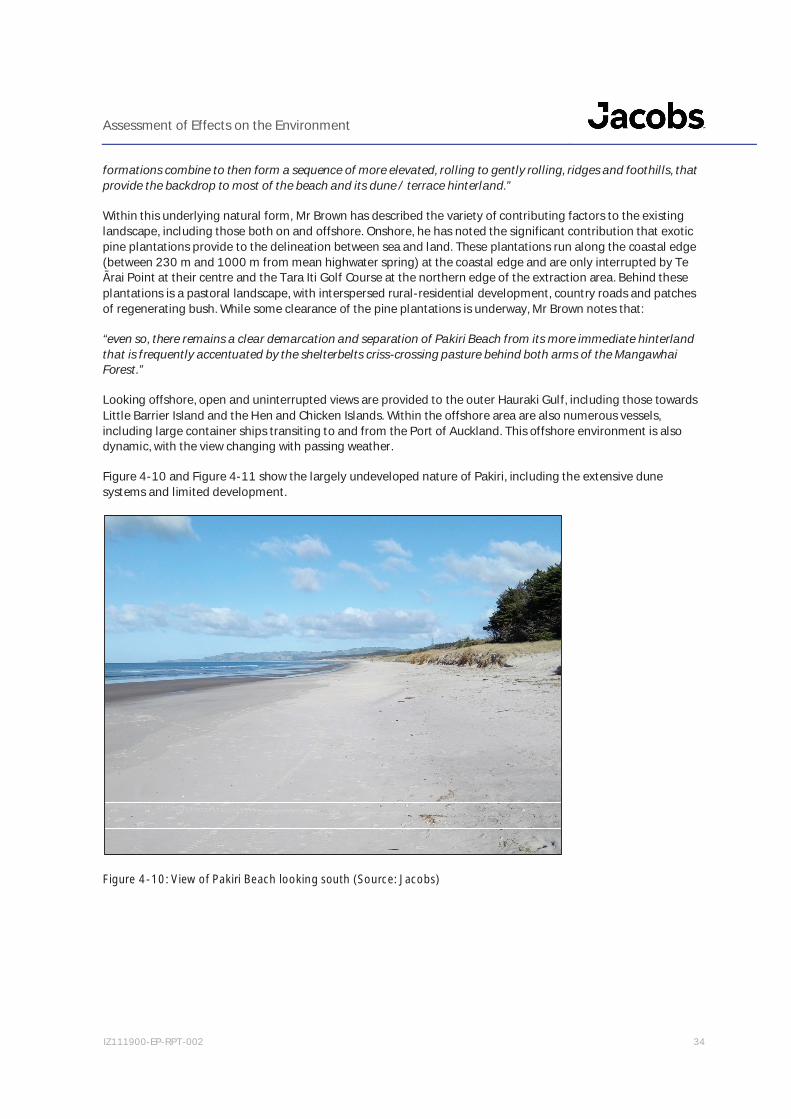
Assessment of Effects on the Environment
IZ111900-EP-RPT-002 34
formations combine to then form a sequence of more elevated, rolling to gently rolling, ridges and foothills, thatprovide the backdrop to most of the beach and its dune / terrace hinterland.”
Within this underlying natural form, Mr Brown has described the variety of contributing factors to the existinglandscape, including those both on and offshore. Onshore, he has noted the significant contribution that exoticpine plantations provide to the delineation between sea and land. These plantations run along the coastal edge(between 230 m and 1000 m from mean highwater spring) at the coastal edge and are only interrupted by Te
rai Point at their centre and the Tara Iti Golf Course at the northern edge of the extraction area. Behind theseplantations is a pastoral landscape, with interspersed rural-residential development, country roads and patchesof regenerating bush. While some clearance of the pine plantations is underway, Mr Brown notes that:
“even so, there remains a clear demarcation and separation of Pakiri Beach from its more immediate hinterlandthat is frequently accentuated by the shelterbelts criss-crossing pasture behind both arms of the MangawhaiForest.”
Looking offshore, open and uninterrupted views are provided to the outer Hauraki Gulf, including those towardsLittle Barrier Island and the Hen and Chicken Islands. Within the offshore area are also numerous vessels,including large container ships transiting to and from the Port of Auckland. This offshore environment is alsodynamic, with the view changing with passing weather.
Figure 4-10 and Figure 4-11 show the largely undeveloped nature of Pakiri, including the extensive dunesystems and limited development.
Figure 4-10: View of Pakiri Beach looking south (Source: Jacobs)
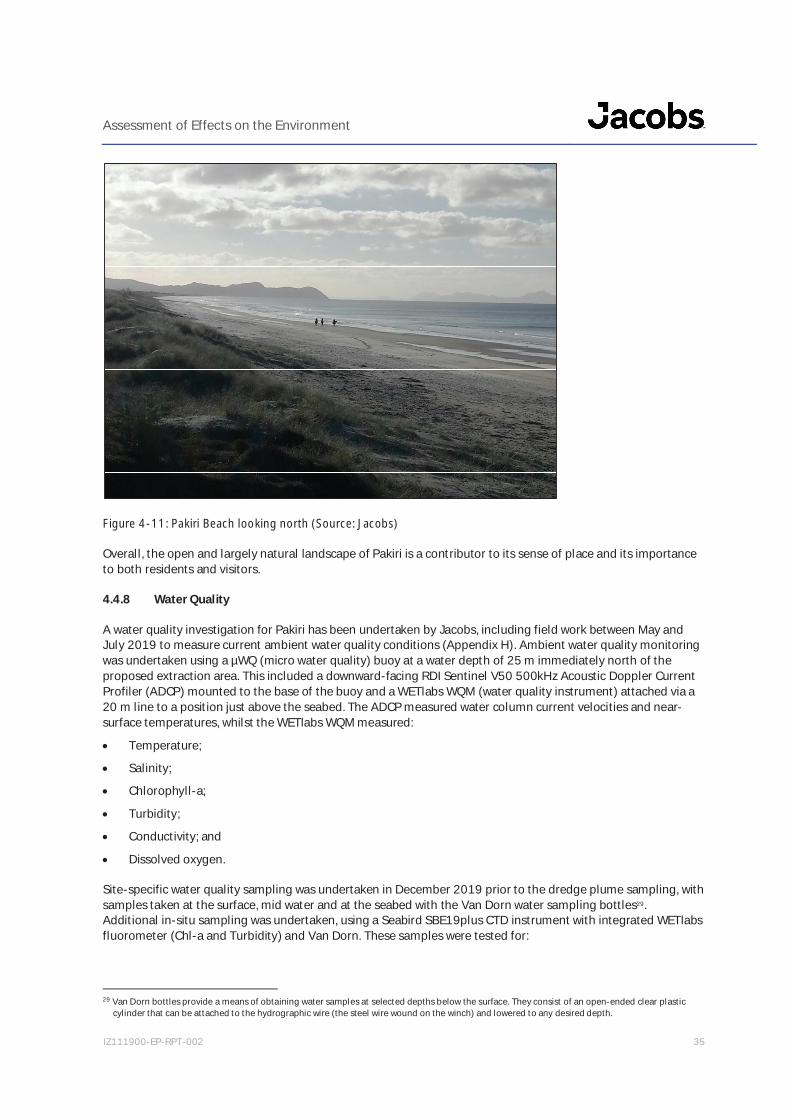
Assessment of Effects on the Environment
IZ111900-EP-RPT-002 35
Figure 4-11: Pakiri Beach looking north (Source: Jacobs)
Overall, the open and largely natural landscape of Pakiri is a contributor to its sense of place and its importanceto both residents and visitors.
4.4.8 Water Quality
A water quality investigation for Pakiri has been undertaken by Jacobs, including field work between May andJuly 2019 to measure current ambient water quality conditions (Appendix H). Ambient water quality monitoringwas undertaken using a µWQ (micro water quality) buoy at a water depth of 25 m immediately north of theproposed extraction area. This included a downward-facing RDI Sentinel V50 500kHz Acoustic Doppler CurrentProfiler (ADCP) mounted to the base of the buoy and a WETlabs WQM (water quality instrument) attached via a20 m line to a position just above the seabed. The ADCP measured water column current velocities and near-surface temperatures, whilst the WETlabs WQM measured:
Temperature;
Salinity;
Chlorophyll-a;
Turbidity;
Conductivity; and
Dissolved oxygen.
Site-specific water quality sampling was undertaken in December 2019 prior to the dredge plume sampling, withsamples taken at the surface, mid water and at the seabed with the Van Dorn water sampling bottles29.Additional in-situ sampling was undertaken, using a Seabird SBE19plus CTD instrument with integrated WETlabsfluorometer (Chl-a and Turbidity) and Van Dorn. These samples were tested for:
29 Van Dorn bottles provide a means of obtaining water samples at selected depths below the surface. They consist of an open-ended clear plasticcylinder that can be attached to the hydrographic wire (the steel wire wound on the winch) and lowered to any desired depth.
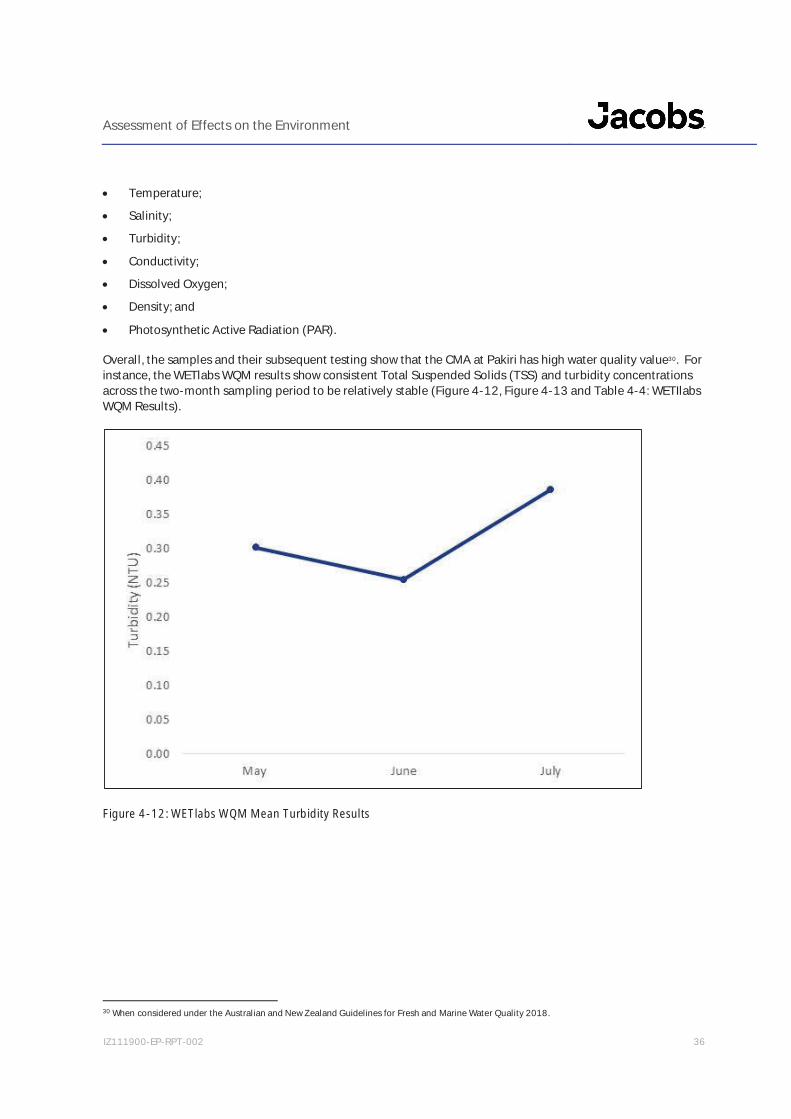
Assessment of Effects on the Environment
IZ111900-EP-RPT-002 36
Temperature;
Salinity;
Turbidity;
Conductivity;
Dissolved Oxygen;
Density; and
Photosynthetic Active Radiation (PAR).
Overall, the samples and their subsequent testing show that the CMA at Pakiri has high water quality value30. Forinstance, the WETlabs WQM results show consistent Total Suspended Solids (TSS) and turbidity concentrationsacross the two-month sampling period to be relatively stable (Figure 4-12, Figure 4-13 and Table 4-4: WETIlabsWQM Results).
Figure 4-12: WETlabs WQM Mean Turbidity Results
30 When considered under the Australian and New Zealand Guidelines for Fresh and Marine Water Quality 2018.
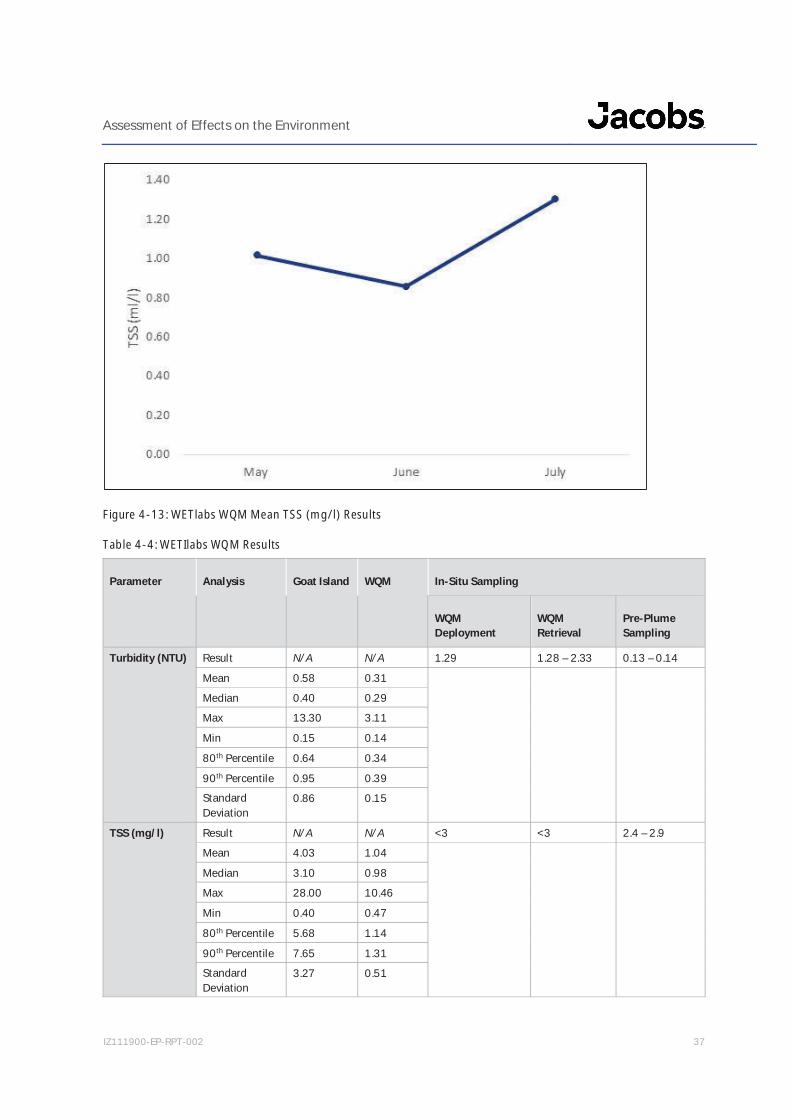
Assessment of Effects on the Environment
IZ111900-EP-RPT-002 37
Figure 4-13: WETlabs WQM Mean TSS (mg/l) Results
Table 4-4: WETIlabs WQM Results
Parameter Analysis Goat Island WQM In-Situ Sampling
WQMDeployment
WQMRetrieval
Pre-PlumeSampling
Turbidity (NTU) Result N/A N/A 1.29 1.28 – 2.33 0.13 – 0.14
Mean 0.58 0.31Median 0.40 0.29Max 13.30 3.11
Min 0.15 0.14
80th Percentile 0.64 0.34
90th Percentile 0.95 0.39StandardDeviation
0.86 0.15
TSS (mg/l) Result N/A N/A <3 <3 2.4 – 2.9Mean 4.03 1.04
Median 3.10 0.98Max 28.00 10.46
Min 0.40 0.47
80th Percentile 5.68 1.14
90th Percentile 7.65 1.31StandardDeviation
3.27 0.51
Assessment of Effects on the Environment
IZ111900-EP-RPT-002 38
While some variation in samples did exist, these are naturally occurring and are like other test locations on theEast Coast (e.g. Goat Island), as determined by the literature review that was undertaken. In addition, thesediment testing did not indicate any local sources for heavy metals, PABs or PAHs which could contaminatecoastal waters.
4.4.9 Marine Ecology
The marine ecology values of the extraction area have been considered by the assessment of ecological effectsby Bioresearches (Appendix K), the marine mammal assessment by the Cawthron Institute (Cawthron) (AppendixL) and the assessment of effects on coastal birds by NIWA (Appendix N).
4.4.9.1 Invertebrate and Benthic Ecology
In order to assess the current ecological values, Bioresearches undertook analysis of the field work (including towdredging and box dredge sampling) in the proposed extraction areas and a control, as well as a literature reviewof earlier surveys undertaken by Dr Roger Grace31.
With regard to sampling techniques, both towed and box dredging was undertaken to ascertain the benthiccommunities present both within the extraction areas and control locations in 2019 and 2020. In addition,macrofauna sampling was undertaken from the extraction vessels to determine survivorship after passingthrough the pump and screening systems.
Box Dredging Results
A total of 118 box dredge samples were collected across the Pakiri area, with each of these samples taken from aseabed area of 180 mm wide, 0.9 m long and 75 mm deep, providing up to 4.5 L of sand and sediment32.Following each sample collection, a 200 mL subsample was taken and screened through a 1 mm mesh, while theremaining sample was passed through a 3.15 mm mesh. Any benthic organisms found in the screened materialwere then preserved in methylated spirits and stored for later taxonomic identification.
The box dredging found a total of 181 identified species/taxa and a total of 3683 individuals. Of those samplestaken in the proposed mid-shore extraction area, 150 species were identified, with 1440 individuals countedfrom both the 1mm and 3.15mm screens. Analysis showed distinctive groupings based on water depth, with inshore samples showing significantly different species to mid shore samples. In addition, mid-shore samplesshowed species overlap with offshore samples. Analysis revealed that the dissimilarity between inshore andmid-shore was driven by the wheel shell (Zethalia), the sand dollar Fellaster, the Lancelet Epigonichthys hectoriand the clams Myadora and Dosinia, which were found to be abundant in the inshore samples. Taxacharacteristics of the mid-shore samples were the presence of polychaetes (Maldanidae), the speckled whelkCominella quoyana and the amphipods Phoxocephalidae being more prevalent in mid-shore and offshoresamples.
Tow Dredging Results
Tow dredging was employed to collect larger epibenthic macrofauna that may have been missed by using thebox dredge, with each tow being undertaken for a distance of approximately 300 m. The 650 mm wide dredgehead utilised a 15 mm square mesh bag, with dredge tows undertaken at the 5, 10, 15, 20 and 25 m bathymetriccontours. All species captured during each tow were removed and immediately sorted, photographed, identified,measured and then returned to the sea alive.
Within the proposed mid-shore extraction area, the combined fauna samples showed the biota was numericallydominated by hermit crabs Paguristes, the gastropods Striacolpus and Cominella, and the starfish Astropecten.
31 Dr Grace undertook field work in 1990 and 2005 for earlier extraction applications.32 Any sample with less than 3.75 L of material was discarded and the sample retaken.
Assessment of Effects on the Environment
IZ111900-EP-RPT-002 39
Macrofauna Survivorship Sampling Results
This field work involved the collection of replicate samples in February 2020, with the sand extraction dredgeWilliam Fraser operating along the offshore edge of the inshore consent area, in similar locations to thosecollected in May 201933. Another set of five replicate samples were collected the same day along the inshoreedge of the KL offshore sand extraction area. The sampling method involved running the sand extraction intakepump at normal operating rates and collecting the discharged unwanted material through a 1m wide box net34.
The results of this sampling found that while there were a higher number of individual organisms at 10 m depthwhen compared to 25 m, there was greater diversity in species present at 25 m. The most common taxum foundat both depths was the surf clam Dosinia sp., while other taxa included gastropods, a few crabs and shrimps,annelids, fish and echinoderms35.
Summary
The samples taken found that the benthic ecology of the proposed extraction area is dominated by largepopulations of polychaete worms (Maldanidae and Capitellidae), hermit crabs, Phoxocephalidae amphipods, thebivalves Nucula and Myadora, the gastropods Striacolpus and Cominella, and the Lancelet Epigonichthyshectori.
No reefs or any coral were identified in the study area. Furthermore, no unique or endangered benthic specieswere found to inhabit the extraction areas. As such, the benthic ecology within the proposed mid-shoreextraction area is typical of similar coastal locations and features species that are able to survive in a dynamic,exposed marine environment.
Overall, the Pakiri benthic community is comprised of 30 species of polychaetes, 10 species of amphipods, 10species of decapods, with 16 additional crustacea, 22 gastropods, 27 bivalves, 7 echinoderms, 4 sponges and 12other species from a range of taxa groupings (making total diversity of 139 species or taxa). It is also noted thatamong these species, some variation was found along the mid-shore dredging transects. For instance, scallopswere only found in the northern sections of the mid-shore, whereas Hermit crabs, starfish, and Cominella weremore common in the southern sections.
4.4.9.2 Fin Fish
In regard to fin fish, it is noted that only limited surveys have historically been undertaken in the Pakiri area.However, species that are known to inhabit further offshore or are likely to occupy parts of the proposedextraction area include:
Snapper (Pagrus auratus);
Red gurnard (Chelidonichthys kumu)
Blue cod (Parapercis colias);
Sole (Peltorhamphus novaezeelandiae);
Tarakihi (Nemadactylus macropterus);
Kahawai (Arripis trutta);
John Dory (Zeus faber); and
Yellowtail Kingfish (Seriola lalandi).
33 The May 2019 sampling was undertaken to support the resource consent application to renew the existing inshore resource consents.34 This sampling method differs from that used for the renewal resource consent application given the design of the William Fraser and the inability to
safely access the discharge point in the moon pool.35 The shrimps, annelids, fish and echinoderms were only found in samples taken at 25 m depth.
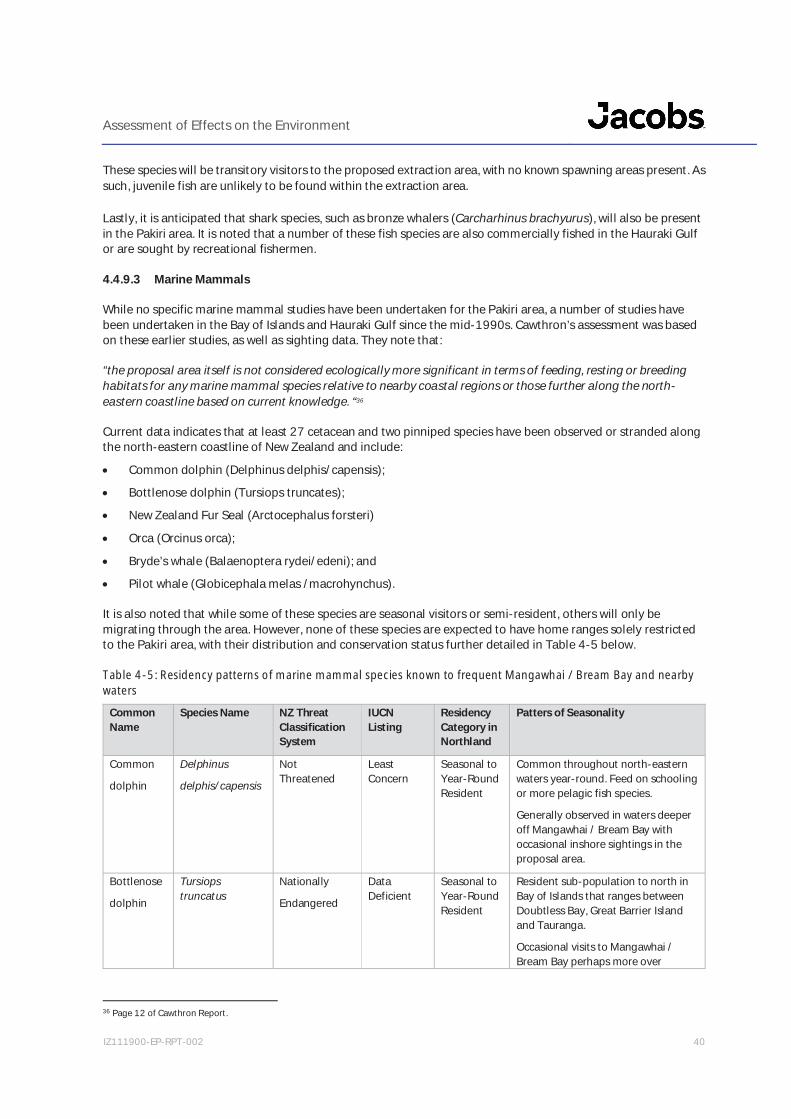
Assessment of Effects on the Environment
IZ111900-EP-RPT-002 40
These species will be transitory visitors to the proposed extraction area, with no known spawning areas present. Assuch, juvenile fish are unlikely to be found within the extraction area.
Lastly, it is anticipated that shark species, such as bronze whalers (Carcharhinus brachyurus), will also be presentin the Pakiri area. It is noted that a number of these fish species are also commercially fished in the Hauraki Gulfor are sought by recreational fishermen.
4.4.9.3 Marine Mammals
While no specific marine mammal studies have been undertaken for the Pakiri area, a number of studies havebeen undertaken in the Bay of Islands and Hauraki Gulf since the mid-1990s. Cawthron’s assessment was basedon these earlier studies, as well as sighting data. They note that:
“the proposal area itself is not considered ecologically more significant in terms of feeding, resting or breedinghabitats for any marine mammal species relative to nearby coastal regions or those further along the north-eastern coastline based on current knowledge. “36
Current data indicates that at least 27 cetacean and two pinniped species have been observed or stranded alongthe north-eastern coastline of New Zealand and include:
Common dolphin (Delphinus delphis/capensis);
Bottlenose dolphin (Tursiops truncates);
New Zealand Fur Seal (Arctocephalus forsteri)
Orca (Orcinus orca);
Bryde’s whale (Balaenoptera rydei/edeni); and
Pilot whale (Globicephala melas /macrohynchus).
It is also noted that while some of these species are seasonal visitors or semi-resident, others will only bemigrating through the area. However, none of these species are expected to have home ranges solely restrictedto the Pakiri area, with their distribution and conservation status further detailed in Table 4-5 below.
Table 4-5: Residency patterns of marine mammal species known to frequent Mangawhai / Bream Bay and nearbywaters
CommonName
Species Name NZ ThreatClassificationSystem
IUCNListing
ResidencyCategory inNorthland
Patters of Seasonality
Common
dolphin
Delphinus
delphis/capensis
NotThreatened
LeastConcern
Seasonal toYear-RoundResident
Common throughout north-easternwaters year-round. Feed on schoolingor more pelagic fish species.
Generally observed in waters deeperoff Mangawhai / Bream Bay withoccasional inshore sightings in theproposal area.
Bottlenose
dolphin
Tursiopstruncatus
Nationally
Endangered
DataDeficient
Seasonal toYear-RoundResident
Resident sub-population to north inBay of Islands that ranges betweenDoubtless Bay, Great Barrier Islandand Tauranga.
Occasional visits to Mangawhai /Bream Bay perhaps more over
36 Page 12 of Cawthron Report.

Assessment of Effects on the Environment
IZ111900-EP-RPT-002 41
CommonName
Species Name NZ ThreatClassificationSystem
IUCNListing
ResidencyCategory inNorthland
Patters of Seasonality
summer months. Generalist feeders.Currently in decline.
NZ fur seal Arctocephalusforsteri
NotThreatened
LeastConcern
Seasonal toYear-RoundResident
Present year-round with multiplehaul-out sites and breeding coloniesin the Hauraki Gulf and regularsightings on offshore islands and Bayof Islands.
More susceptible to human effects inbreeding colonies. Feed mainly overshelf waters but inshore regions aswell.
Orca (killerwhale)
Orcinus orca NationallyCritical
DataDeficient
Seasonal toSemi-Resident
Frequent north-eastern waters year-round, more common in late winter /early spring.
Forage in harbours, estuaries andsandy beaches on rays, fish and othermarine mammal species.
Bryde’swhale
Balaenopterabrydei/edeni
NationallyCritical
DataDeficient
Seasonal toSemi-Resident
Most commonly observed whalespecies in north-eastern waters year-round. Feed on small schooling fishand sometimes krill.
Regularly move through Mangawhai /Bream Bay travelling between Bay ofIslands and Hauraki Gulf.
Pilot whale Globicephala
melas /macrohynchus
NotThreatened toData Deficient
DataDeficient
OffshoreSemi-Resident
While a more offshore species,inshore sightings occur mainly oversummer months.
Forages off shelf waters. Known forfrequent and mass strandings inBream Bay and surrounding waters.
Southernright whale
Eubalaena
australis
At Risk –Recovering
LeastConcern
SeasonalMigrant
Frequent more inshore, shallowregions of Northland during seasonalmigration periods, particularly withnew-born calves. Once present, theycan remain in the Northland regionfor several days to weeks. Most oftenseen between August and November.
Humpback
whale
Megaptera
novaeangliae
Migrant Endangered SeasonalMigrant
Pass by Mangawhai / Bream Bay onboth north and south migrations butmore prevalent and closer to shoreon southern return migration whenwith calves (mainly Oct to late Dec).
Spermwhale
Physeter
macrocephalus
NotThreatened
Vulnerable OffshoreVisitor
Increased sightings along the north-eastern coasts, mainly over summerand autumn months. Taonga species.
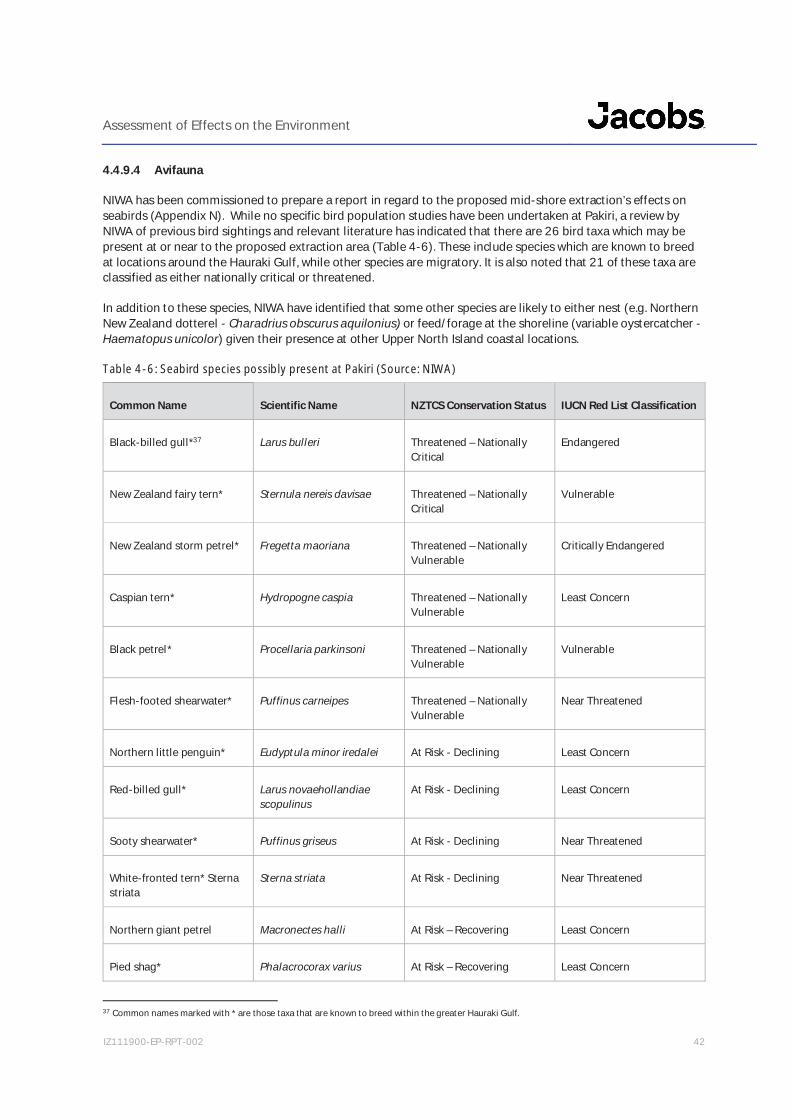
Assessment of Effects on the Environment
IZ111900-EP-RPT-002 42
4.4.9.4 Avifauna
NIWA has been commissioned to prepare a report in regard to the proposed mid-shore extraction’s effects onseabirds (Appendix N). While no specific bird population studies have been undertaken at Pakiri, a review byNIWA of previous bird sightings and relevant literature has indicated that there are 26 bird taxa which may bepresent at or near to the proposed extraction area (Table 4-6). These include species which are known to breedat locations around the Hauraki Gulf, while other species are migratory. It is also noted that 21 of these taxa areclassified as either nationally critical or threatened.
In addition to these species, NIWA have identified that some other species are likely to either nest (e.g. NorthernNew Zealand dotterel - Charadrius obscurus aquilonius) or feed/forage at the shoreline (variable oystercatcher -Haematopus unicolor) given their presence at other Upper North Island coastal locations.
Table 4-6: Seabird species possibly present at Pakiri (Source: NIWA)
Common Name Scientific Name NZTCS Conservation Status IUCN Red List Classification
Black-billed gull*37 Larus bulleri Threatened – NationallyCritical
Endangered
New Zealand fairy tern* Sternula nereis davisae Threatened – NationallyCritical
Vulnerable
New Zealand storm petrel* Fregetta maoriana Threatened – NationallyVulnerable
Critically Endangered
Caspian tern* Hydropogne caspia Threatened – NationallyVulnerable
Least Concern
Black petrel* Procellaria parkinsoni Threatened – NationallyVulnerable
Vulnerable
Flesh-footed shearwater* Puffinus carneipes Threatened – NationallyVulnerable
Near Threatened
Northern little penguin* Eudyptula minor iredalei At Risk - Declining Least Concern
Red-billed gull* Larus novaehollandiaescopulinus
At Risk - Declining Least Concern
Sooty shearwater* Puffinus griseus At Risk - Declining Near Threatened
White-fronted tern* Sternastriata
Sterna striata At Risk - Declining Near Threatened
Northern giant petrel Macronectes halli At Risk – Recovering Least Concern
Pied shag* Phalacrocorax varius At Risk – Recovering Least Concern
37 Common names marked with * are those taxa that are known to breed within the greater Hauraki Gulf.

Assessment of Effects on the Environment
IZ111900-EP-RPT-002 43
Common Name Scientific Name NZTCS Conservation Status IUCN Red List Classification
Pycroft’s petrel* Pterodroma pycrofti At Risk - Recovering Vulnerable
Fairy prion Pachyptila turtur At Risk - Relict Least Concern
White-faced storm petrel* Pelagodroma marinamaoriana
At Risk - Relict Least Concern
Northern diving petrel* Pelecanoides urinatrix At Risk - Relict Least Concern
Cook’s petrel* Pterodroma cookii At Risk - Relict Vulnerable
Fluttering shearwater* Puffinus gavia At Risk - Relict Least Concern
Black shag Phalacrocorax carbonovaehollandiae
At Risk – NaturallyUncommon
Least Concern
Little black shag Phalacrocorax sulcirostris At Risk – NaturallyUncommon
Least Concern
Buller’s shearwater* Puffinus bulleri At Risk – NaturallyUncommon
Vulnerable
Arctic skua Stercorarius parasiticus Migrant Least Concern
Southern black-backedgull*
Larus dominicanus Not Threatened Least Concern
Australasian gannet* Morus serrator Not Threatened Least Concern
Little shag* Phalacrocoraxmelanoleucos brevirostris
Not Threatened Least Concern
Black-winged petrel* Pterodroma nigripennis Not Threatened Least Concern
Specific note is made regarding the New Zealand fairy tern, which is New Zealand’s rarest native breeding birdand is known to have approximately 45 individuals present in the wild. It is also ranked as a critically endangeredspecies and carries a 'Category A' priority for conservation action. Its only nesting locations are located on theeast coast between Auckland and Whangarei at Waipu, Mangawhai, Pakiri and the South Kaipara Head. The NIWAreport notes that fairy terns do appear to prefer estuarine and very nearshore habitats for foraging, given theirdiet of small/juvenile fish and crustaceans (i.e. locations unlike the proposed extraction area). This is supportedby recent field studies which found that out of 598 recorded dives, only 29 or 4.8% occurred at nearshorecoastal locations.
Assessment of Effects on the Environment
IZ111900-EP-RPT-002 44
4.4.10 Terrestrial Noise Conditions
Terrestrial noise conditions were measured and recorded for this application by Styles Group (Appendix I). Asnoted in that assessment, noise measurements were undertaken in a range of swell and weather conditions toenable an accurate dataset of existing noise conditions. In all instances, noise measures were taken from eitherthe top of the dune system or grassed areas above the beach with a Bruel & Kjaer 2250 or 2270 sound levelmeter on a tripod and with wind screens employed38.
The measurements taken showed that ambient noise levels can vary considerably depending on local weatherand swell conditions, with the assessment stating:
“In the calmest of the conditions measured, the LAeq(15min) levels are typically around 50 dB, with backgroundLA90 levels typically between 40 dB and 45 dB. The lowest LAeq(1sec) levels are between 30 dB and 35 dB. By ourobservations, the lowest noise levels are observed over very short periods of time (1-2 seconds) when there is alull between the breaking waves.
On days when the wind is blowing on shore, the LAeq(15min) noise levels are typically as high as 65 dB, withbackground LA90 levels generally around 60 dB. The LAeq(1sec) noise level typically stays above 60 dB on thewindy days. The breaking waves are constant along the beach and there are no ‘lulls’ or quiet periods.”
In summary, there are few human generated noises in the Pakiri area, with most noise generated by either windor waves.
4.4.11 Underwater Noise Conditions
As with surface noise conditions, Styles Group have also been employed to undertake measurements andrecordings of the ambient underwater noise conditions (Appendix J). These measurements utilised fourSoundTrap 300HF recorders (two arrays, providing sampling redundancy) at the locations shown in Figure 4-15.The sampling rates were at 96 kHz, while the click detectors operated at the full sampling rate of 576 kHz. Thearrays were deployed along the 30m depth contour between 19 March and 25 April 2019, and then againbetween 9 May and 10 June 2019.
In addition to the above monitoring and in recognition that the existing environment includes the currentextraction activity, underwater noise measurements of the William Fraser were also undertaken in November201939. This involved the use of a measurement array comprising six SoundTrap 202STD recorders as shown inFigure 4-15. Using GPS tracking, the William Fraser undertook a sand extraction run through the KL offshoreconsent area and was recorded by the array, with any noise contamination (e.g. from other vessels) excludedfrom the subsequent assessment by Styles Group.
Further contributing to the noise environment is the area’s bathymetry, its sea-floor composition (i.e. sedimentand sand types), water temperature and density (salinity). With the on-site monitoring and measurementscollected and the technical data available regarding the physical attributes of Pakiri, Styles Group was able todetermine that the existing noise conditions are those typical of a sandy beach habitat with limited vesselpassage. While some noise level increases did occur due to vessel traffic, these were infrequent enough to havelimited impact on the averaged and median sound levels. These underwater noise results were also shared withCawthron to assist them in undertaking a marine mammals effects assessment (Appendix L and Section 6.5.4 ofthis AEE).
38 All noise measurements were performed in accordance with NZS6801:2008.39 The monitoring was undertaken in fine weather conditions (i.e. variable 10 knot breeze, sea state zero and no swell).
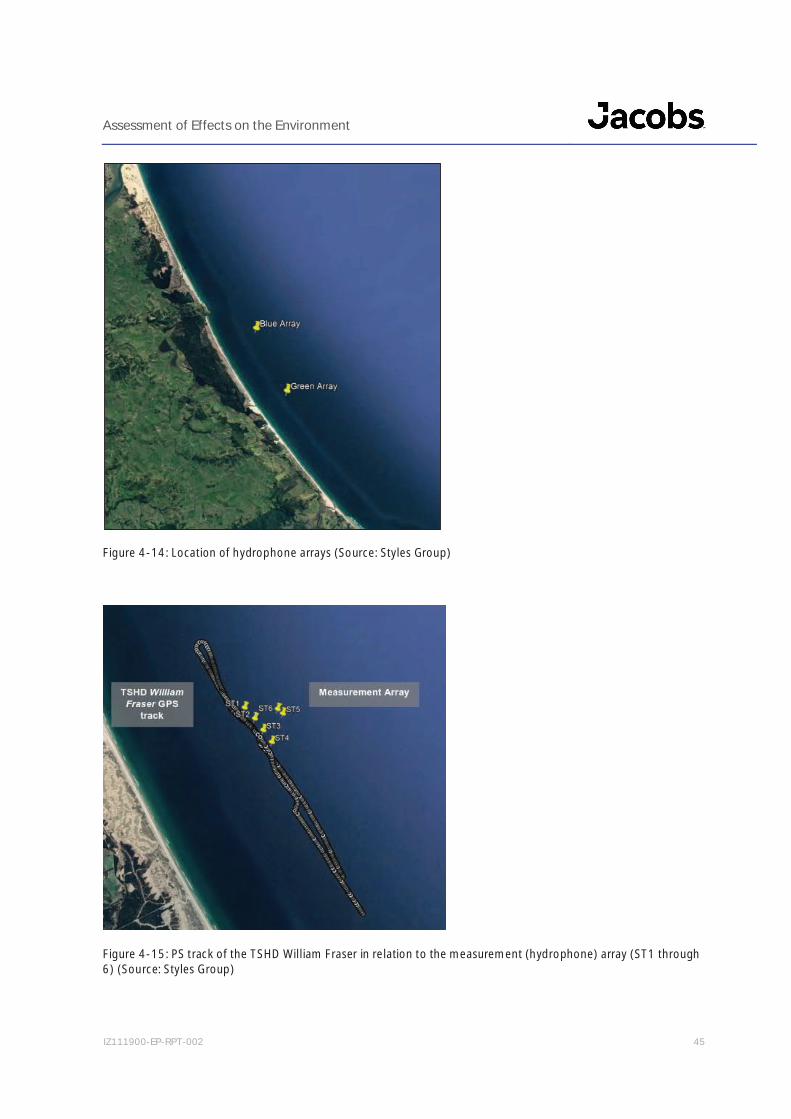
Assessment of Effects on the Environment
IZ111900-EP-RPT-002 45
Figure 4-14: Location of hydrophone arrays (Source: Styles Group)
Figure 4-15: PS track of the TSHD William Fraser in relation to the measurement (hydrophone) array (ST1 through6) (Source: Styles Group)

Assessment of Effects on the Environment
IZ111900-EP-RPT-002 46
4.5 Other marine activities
Further to MBL’s own activities in the CMA, there are a number of other commercial operations undertaken in thecoastal environment of the Outer Hauraki Gulf. These include fishing, scallop dredging, aquaculture, shippingand the sand extraction performed by MBL on-behalf of KL.
Species commercially fished in the Hauraki Gulf include snapper, John Dory, scallops and crayfish using a varietyof fishing methods. Within the Pakiri area seasonal exclusions of trawl of Danish seine nets are imposed, whilepermanent bans on such fishing techniques from vessels larger than 20 m are also imposed.
The outer Hauraki Gulf is also the main transit point for commercial vessels entering and exiting the Port ofAuckland. Such vessels must remain at least 5 nautical miles offshore upon entering the Hauraki Gulf and theJellicoe Channel. No anchorages or permanent moorings are provided at Pakiri Beach.
Lastly, KL is also engaged in sand extraction at Pakiri Beach, although this extraction is currently undertaken on-behalf of KL by MBL (as noted in Section 2). KL’s consented extraction regime allows for a total of 2 million m3 ofsand to be removed over a 20-year period (having started in February 2003)40. Annual extraction is limited to amaximum of 150,000 m3/year inside the 30 m bathymetric contour (with further extraction allowed outside thatdepth), with sand permitted to be removed at seabed depths greater than 25 m and within the area off Pakirishown in Figure 1-1, which includes a 3 km exclusion area from the Leigh/Cape Rodney Marine Reserve.
40 It is noted that KL are currently in the process of obtaining resource consent to continue this extraction activity.
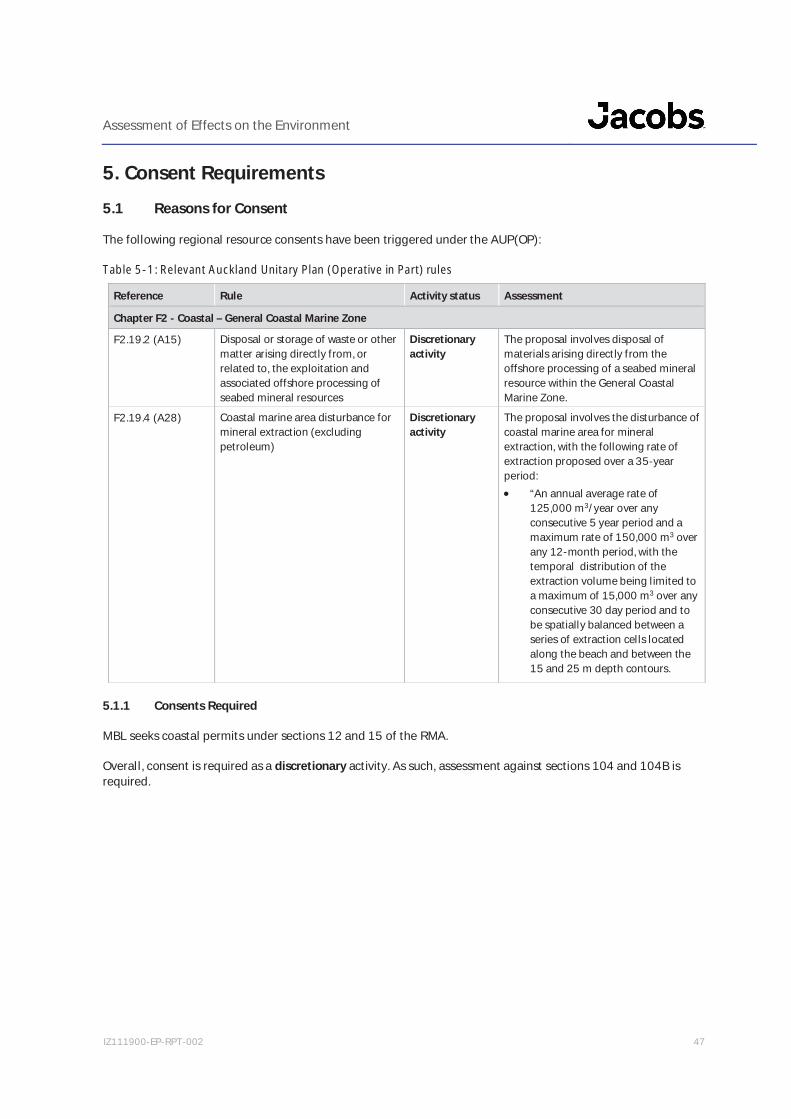
Assessment of Effects on the Environment
IZ111900-EP-RPT-002 47
5. Consent Requirements5.1 Reasons for Consent
The following regional resource consents have been triggered under the AUP(OP):
Table 5-1: Relevant Auckland Unitary Plan (Operative in Part) rules
Reference Rule Activity status Assessment
Chapter F2 - Coastal – General Coastal Marine Zone
F2.19.2 (A15) Disposal or storage of waste or othermatter arising directly from, orrelated to, the exploitation andassociated offshore processing ofseabed mineral resources
Discretionaryactivity
The proposal involves disposal ofmaterials arising directly from theoffshore processing of a seabed mineralresource within the General CoastalMarine Zone.
F2.19.4 (A28) Coastal marine area disturbance formineral extraction (excludingpetroleum)
Discretionaryactivity
The proposal involves the disturbance ofcoastal marine area for mineralextraction, with the following rate ofextraction proposed over a 35-yearperiod: “An annual average rate of
125,000 m3/year over anyconsecutive 5 year period and amaximum rate of 150,000 m3 overany 12-month period, with thetemporal distribution of theextraction volume being limited toa maximum of 15,000 m3 over anyconsecutive 30 day period and tobe spatially balanced between aseries of extraction cells locatedalong the beach and between the15 and 25 m depth contours.
5.1.1 Consents Required
MBL seeks coastal permits under sections 12 and 15 of the RMA.
Overall, consent is required as a discretionary activity. As such, assessment against sections 104 and 104B isrequired.
Assessment of Effects on the Environment
IZ111900-EP-RPT-002 48
6. Assessment of Effects on the EnvironmentThe following sections present an assessment of the actual and potential environmental effects of the proposedworks. The following effects are considered relevant to the current application41:
Positive effects;
Water quality effects;
Coastal erosion effects;
Ecological effects;
Cultural effects;
Biosecurity effects;
Surface and underwater noise effects;
Effects on recreation; and
Landscape and visual effects.
The assessment of effects42 has taken into account the existing environment as detailed in Section 4 andincludes:
The presence of marine SEAs and a terrestrial SEA outside the proposed extraction area;
An outstanding natural landscape and high natural character area overlays adjacent to the proposedextraction area; and
Active resource consents held by MBL and KL for sand extraction.
Furthermore, consideration has been given to the permitted baseline, which is considered appropriate to theapplication. The permitted baseline includes:
The passage of vessels through the General Coastal Marine Zone; and
The noise standards of Chapter E25 for the General Coastal Marine Zone.
Reference should also be made to the assessment methodology utilised for the attached technical assessments.This methodology details how each technical specialist was to approach determining effects and a description ofthis methodology is provided as 0.
6.1 Crown Minerals Act
It is noted that Section 5(2)(a) of the RMA excludes the sustainable management of minerals from the purposeof the Act. In principle, this means that the long-term depletion of a mineral43 resource is not an effect or matterfor consideration under the Act and as such, has been excluded from the following assessment and is not amatter for Auckland Council to consider when processing the current resource consent application.
41 Where relevant, the assessments also address the cumulative effects of both MBL and KL’s consented activities.42 The assessment of a proposal’s adverse effects against the existing environment is an established principle in law (Hawthorn Estate LimitedNZRMA 424). Under this case, the existing environment may include unimplemented resource consents and utilisation of rights to carry outpermitted activities under a district or regional plan. It does not include future possible resource consents or the ecological potential ofwaterbodies.43 “Mineral” is defined under section 2 of the Crown Minerals Act 1991 as “a naturally occurring inorganic substance beneath or at the surface of the
earth, whether or not under water; and includes all metallic minerals, non-metallic minerals, fuel minerals, precious stones, industrial rocks andbuilding stones, and a prescribed substance within the meaning of the Atomic Energy Act 1945”. As such, sand is a mineral.
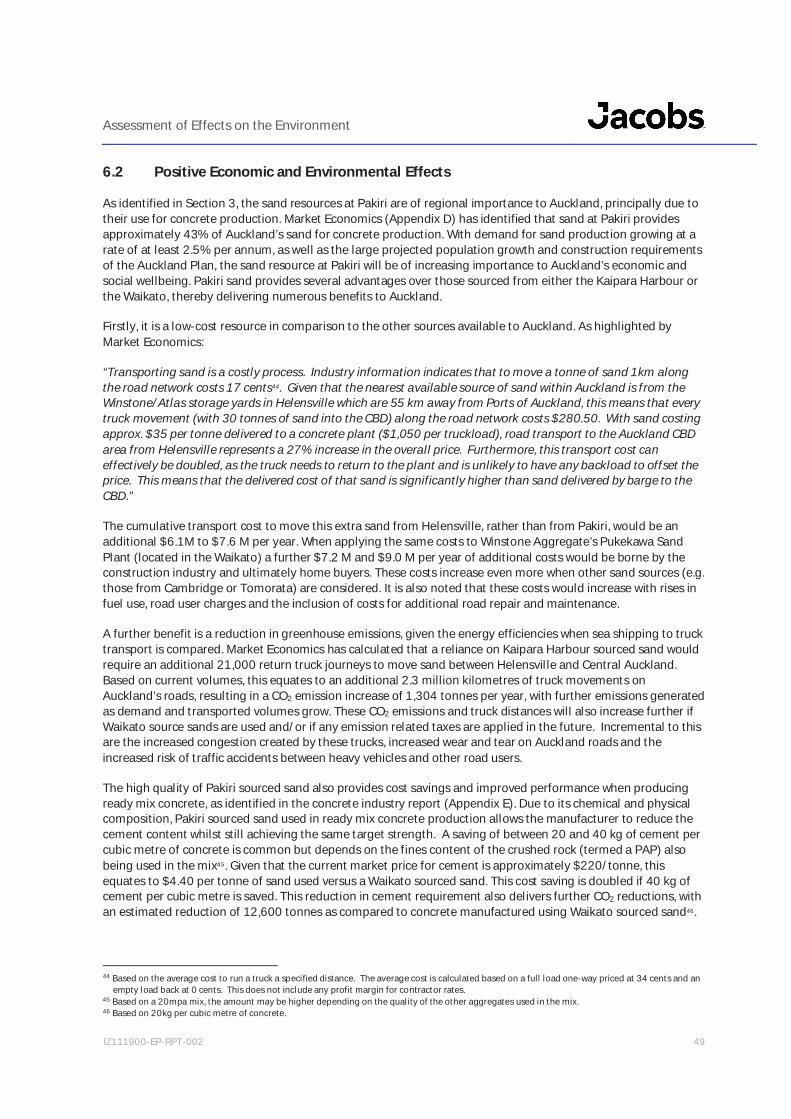
Assessment of Effects on the Environment
IZ111900-EP-RPT-002 49
6.2 Positive Economic and Environmental Effects
As identified in Section 3, the sand resources at Pakiri are of regional importance to Auckland, principally due totheir use for concrete production. Market Economics (Appendix D) has identified that sand at Pakiri providesapproximately 43% of Auckland’s sand for concrete production. With demand for sand production growing at arate of at least 2.5% per annum, as well as the large projected population growth and construction requirementsof the Auckland Plan, the sand resource at Pakiri will be of increasing importance to Auckland’s economic andsocial wellbeing. Pakiri sand provides several advantages over those sourced from either the Kaipara Harbour orthe Waikato, thereby delivering numerous benefits to Auckland.
Firstly, it is a low-cost resource in comparison to the other sources available to Auckland. As highlighted byMarket Economics:
“Transporting sand is a costly process. Industry information indicates that to move a tonne of sand 1km alongthe road network costs 17 cents44. Given that the nearest available source of sand within Auckland is from theWinstone/Atlas storage yards in Helensville which are 55 km away from Ports of Auckland, this means that everytruck movement (with 30 tonnes of sand into the CBD) along the road network costs $280.50. With sand costingapprox. $35 per tonne delivered to a concrete plant ($1,050 per truckload), road transport to the Auckland CBDarea from Helensville represents a 27% increase in the overall price. Furthermore, this transport cost caneffectively be doubled, as the truck needs to return to the plant and is unlikely to have any backload to offset theprice. This means that the delivered cost of that sand is significantly higher than sand delivered by barge to theCBD.”
The cumulative transport cost to move this extra sand from Helensville, rather than from Pakiri, would be anadditional $6.1M to $7.6 M per year. When applying the same costs to Winstone Aggregate’s Pukekawa SandPlant (located in the Waikato) a further $7.2 M and $9.0 M per year of additional costs would be borne by theconstruction industry and ultimately home buyers. These costs increase even more when other sand sources (e.g.those from Cambridge or Tomorata) are considered. It is also noted that these costs would increase with rises infuel use, road user charges and the inclusion of costs for additional road repair and maintenance.
A further benefit is a reduction in greenhouse emissions, given the energy efficiencies when sea shipping to trucktransport is compared. Market Economics has calculated that a reliance on Kaipara Harbour sourced sand wouldrequire an additional 21,000 return truck journeys to move sand between Helensville and Central Auckland.Based on current volumes, this equates to an additional 2.3 million kilometres of truck movements onAuckland’s roads, resulting in a CO2 emission increase of 1,304 tonnes per year, with further emissions generatedas demand and transported volumes grow. These CO2 emissions and truck distances will also increase further ifWaikato source sands are used and/or if any emission related taxes are applied in the future. Incremental to thisare the increased congestion created by these trucks, increased wear and tear on Auckland roads and theincreased risk of traffic accidents between heavy vehicles and other road users.
The high quality of Pakiri sourced sand also provides cost savings and improved performance when producingready mix concrete, as identified in the concrete industry report (Appendix E). Due to its chemical and physicalcomposition, Pakiri sourced sand used in ready mix concrete production allows the manufacturer to reduce thecement content whilst still achieving the same target strength. A saving of between 20 and 40 kg of cement percubic metre of concrete is common but depends on the fines content of the crushed rock (termed a PAP) alsobeing used in the mix45. Given that the current market price for cement is approximately $220/tonne, thisequates to $4.40 per tonne of sand used versus a Waikato sourced sand. This cost saving is doubled if 40 kg ofcement per cubic metre is saved. This reduction in cement requirement also delivers further CO2 reductions, withan estimated reduction of 12,600 tonnes as compared to concrete manufactured using Waikato sourced sand46.
44 Based on the average cost to run a truck a specified distance. The average cost is calculated based on a full load one-way priced at 34 cents and anempty load back at 0 cents. This does not include any profit margin for contractor rates.
45 Based on a 20mpa mix, the amount may be higher depending on the quality of the other aggregates used in the mix.46 Based on 20kg per cubic metre of concrete.

Assessment of Effects on the Environment
IZ111900-EP-RPT-002 50
The reduced costs associated with using Pakiri sand are of significant benefit to Auckland and its economy.Without access to this sand resource or a greater reliance on more distant/less useful sand, the increased costsassociated with concrete production will be passed onto the consumer, while any disruptions to concrete supplywould affect the stability of the construction sector. These factors would impact on the affordability of concreteand subsequently on the cost of home ownership and infrastructure investment. This would be harmful to boththe social and economic wellbeing of the community, not least due to the projected demand for new homes,business premises and related infrastructure projects. Given that 313,000 new homes are required, as well as thecurrent concerns regarding affordability and ownership, the sand resource at Pakiri is needed to avoid both adisruption to concrete supply and the availability of new homes in Auckland47.
In summary, the continued extraction of sand from Pakiri will deliver significant economic and environmentalbenefits to Auckland. Pakiri sourced sand is critical for the delivery of housing, infrastructure and otherconstruction projects planned for Auckland over the coming decades. It provides a reliable low-cost buildingmaterial, which if removed from market supply, would have detrimental effects on construction costs anddelivery timeframes. Furthermore, the use of sea transport helps remove 2.3 million kilometres of truckmovements of Auckland’s roads, with the delivery of the sand directly to the Port of Auckland. This reduction oftruck movements limits the wear and tear of roads, helps improve road safety, and CO2 savings of 1,306 tonnesper year. It is also noted that Pakiri sourced sand is a high-quality material, reducing the need for cement inconcrete manufacturing and providing further CO2 savings of 12,600 tonnes per year when compared to othersand sources.
6.3 Water Quality Effects
As discussed in Section 4.4.8, Jacobs has undertaken an assessment of the extraction activity’s water qualityeffects (Appendix H). The ambient water quality monitoring undertaken shows that Pakiri has high water qualityvalue, due in part to the sandy seabed and lack of contaminants. In addition, the receiving environment has agood capacity to absorb the proposed changes and a negligible sensitivity to discharges.
The fieldwork for the water quality assessment involved two techniques. The first of these involved the collectionof water samples from the immediate discharge point (i.e. from the weir boards on the William Fraser as samplescould not be collected form the moon pools which is the ultimate discharge source). These samples representedthe “worse-case” scenario for total suspended solids concentrations (TSS) and a baseline to understanddischarge plume dispersion/content. While the overall TSS results are shown in Table 6-1 and Table 6-2 detailsthe breakdown of TSS between silts and sand, the sampling shows that the majority (between 70% to 76%) ofthe TSS is formed by either fine sands or coarse silts.
Table 6-1: TSS (mg/l) Concentrations for Weir Board Sampling Locations
Weir Board 1 Weir Board 2 Weir Board 3
TSS (mg/l) 450 1,010 1,240
Table 6-2: PSD Results from Weir Board Samples
Sample Mean particle size µm Percentage (%) of Silts(10.0 – 62.5 µm)
Percentage (%) of Sands(62.5 – 500 µm)
Weir Board 1 93.50 29.94 70.06Weir Board 2 115.42 26.46 73.53
Weir Board 3 125.40 23.63 76.37
47 The requirement for an additional 313,000 dwellings is taken from the Auckland Plan.
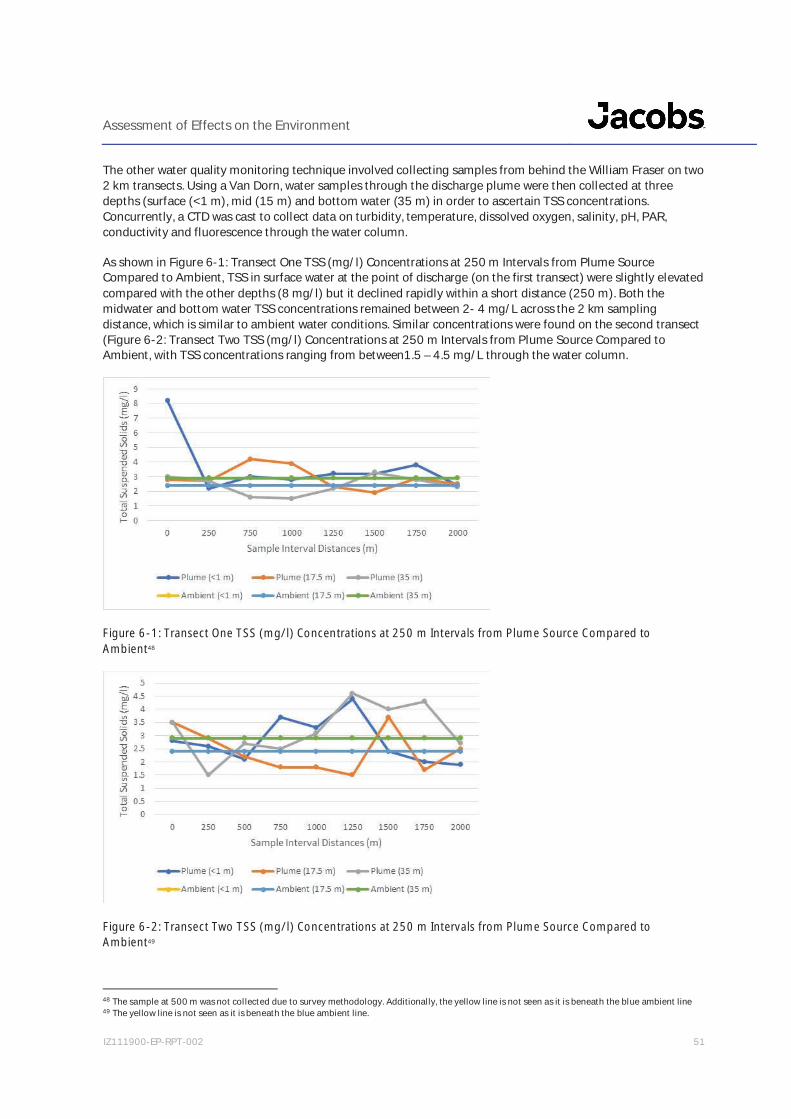
Assessment of Effects on the Environment
IZ111900-EP-RPT-002 51
The other water quality monitoring technique involved collecting samples from behind the William Fraser on two2 km transects. Using a Van Dorn, water samples through the discharge plume were then collected at threedepths (surface (<1 m), mid (15 m) and bottom water (35 m) in order to ascertain TSS concentrations.Concurrently, a CTD was cast to collect data on turbidity, temperature, dissolved oxygen, salinity, pH, PAR,conductivity and fluorescence through the water column.
As shown in Figure 6-1: Transect One TSS (mg/l) Concentrations at 250 m Intervals from Plume SourceCompared to Ambient, TSS in surface water at the point of discharge (on the first transect) were slightly elevatedcompared with the other depths (8 mg/l) but it declined rapidly within a short distance (250 m). Both themidwater and bottom water TSS concentrations remained between 2- 4 mg/L across the 2 km samplingdistance, which is similar to ambient water conditions. Similar concentrations were found on the second transect(Figure 6-2: Transect Two TSS (mg/l) Concentrations at 250 m Intervals from Plume Source Compared toAmbient, with TSS concentrations ranging from between1.5 – 4.5 mg/L through the water column.
Figure 6-1: Transect One TSS (mg/l) Concentrations at 250 m Intervals from Plume Source Compared toAmbient48
Figure 6-2: Transect Two TSS (mg/l) Concentrations at 250 m Intervals from Plume Source Compared toAmbient49
48 The sample at 500 m was not collected due to survey methodology. Additionally, the yellow line is not seen as it is beneath the blue ambient line49 The yellow line is not seen as it is beneath the blue ambient line.
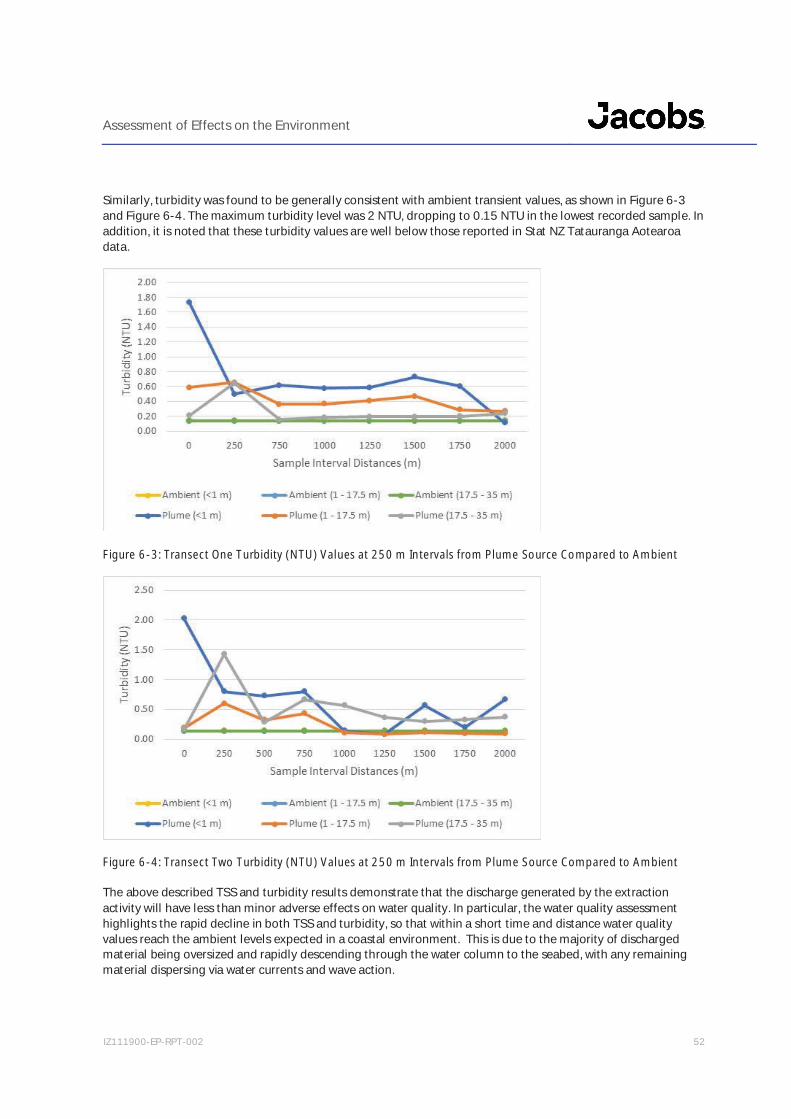
Assessment of Effects on the Environment
IZ111900-EP-RPT-002 52
Similarly, turbidity was found to be generally consistent with ambient transient values, as shown in Figure 6-3and Figure 6-4. The maximum turbidity level was 2 NTU, dropping to 0.15 NTU in the lowest recorded sample. Inaddition, it is noted that these turbidity values are well below those reported in Stat NZ Tatauranga Aotearoadata.
Figure 6-3: Transect One Turbidity (NTU) Values at 250 m Intervals from Plume Source Compared to Ambient
Figure 6-4: Transect Two Turbidity (NTU) Values at 250 m Intervals from Plume Source Compared to Ambient
The above described TSS and turbidity results demonstrate that the discharge generated by the extractionactivity will have less than minor adverse effects on water quality. In particular, the water quality assessmenthighlights the rapid decline in both TSS and turbidity, so that within a short time and distance water qualityvalues reach the ambient levels expected in a coastal environment. This is due to the majority of dischargedmaterial being oversized and rapidly descending through the water column to the seabed, with any remainingmaterial dispersing via water currents and wave action.
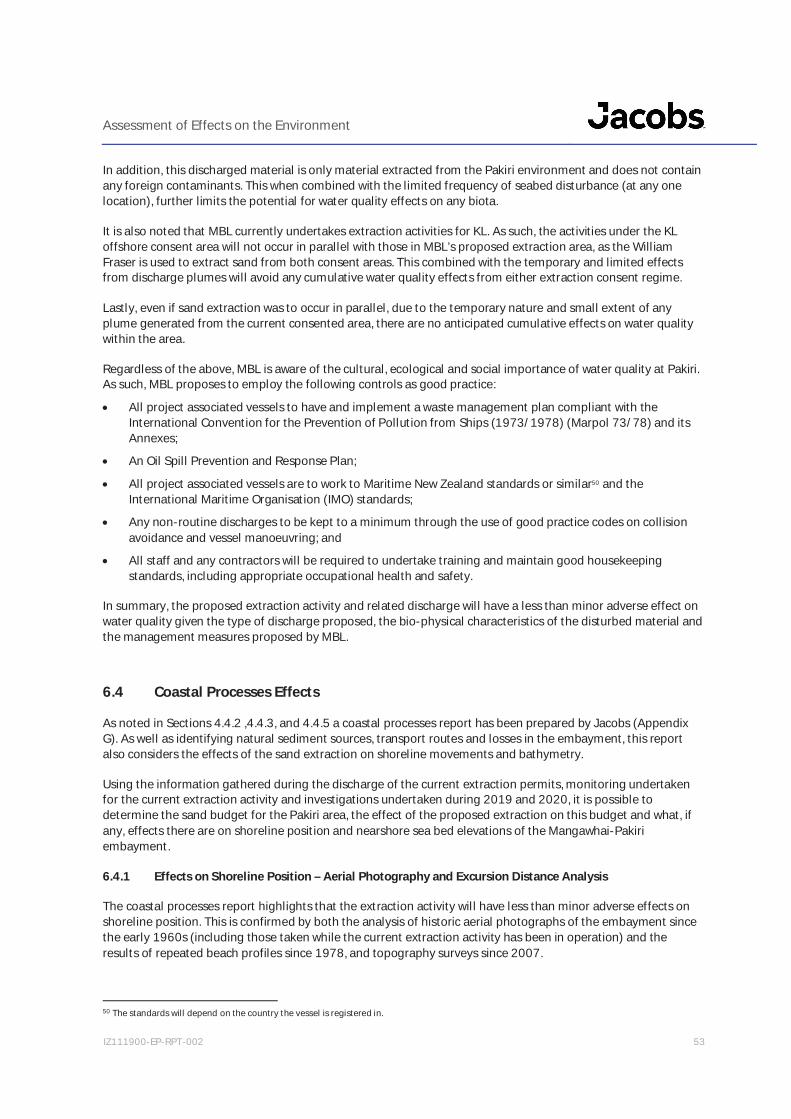
Assessment of Effects on the Environment
IZ111900-EP-RPT-002 53
In addition, this discharged material is only material extracted from the Pakiri environment and does not containany foreign contaminants. This when combined with the limited frequency of seabed disturbance (at any onelocation), further limits the potential for water quality effects on any biota.
It is also noted that MBL currently undertakes extraction activities for KL. As such, the activities under the KLoffshore consent area will not occur in parallel with those in MBL’s proposed extraction area, as the WilliamFraser is used to extract sand from both consent areas. This combined with the temporary and limited effectsfrom discharge plumes will avoid any cumulative water quality effects from either extraction consent regime.
Lastly, even if sand extraction was to occur in parallel, due to the temporary nature and small extent of anyplume generated from the current consented area, there are no anticipated cumulative effects on water qualitywithin the area.
Regardless of the above, MBL is aware of the cultural, ecological and social importance of water quality at Pakiri.As such, MBL proposes to employ the following controls as good practice:
All project associated vessels to have and implement a waste management plan compliant with theInternational Convention for the Prevention of Pollution from Ships (1973/1978) (Marpol 73/78) and itsAnnexes;
An Oil Spill Prevention and Response Plan;
All project associated vessels are to work to Maritime New Zealand standards or similar50 and theInternational Maritime Organisation (IMO) standards;
Any non-routine discharges to be kept to a minimum through the use of good practice codes on collisionavoidance and vessel manoeuvring; and
All staff and any contractors will be required to undertake training and maintain good housekeepingstandards, including appropriate occupational health and safety.
In summary, the proposed extraction activity and related discharge will have a less than minor adverse effect onwater quality given the type of discharge proposed, the bio-physical characteristics of the disturbed material andthe management measures proposed by MBL.
6.4 Coastal Processes Effects
As noted in Sections 4.4.2 ,4.4.3, and 4.4.5 a coastal processes report has been prepared by Jacobs (AppendixG). As well as identifying natural sediment sources, transport routes and losses in the embayment, this reportalso considers the effects of the sand extraction on shoreline movements and bathymetry.
Using the information gathered during the discharge of the current extraction permits, monitoring undertakenfor the current extraction activity and investigations undertaken during 2019 and 2020, it is possible todetermine the sand budget for the Pakiri area, the effect of the proposed extraction on this budget and what, ifany, effects there are on shoreline position and nearshore sea bed elevations of the Mangawhai-Pakiriembayment.
6.4.1 Effects on Shoreline Position – Aerial Photography and Excursion Distance Analysis
The coastal processes report highlights that the extraction activity will have less than minor adverse effects onshoreline position. This is confirmed by both the analysis of historic aerial photographs of the embayment sincethe early 1960s (including those taken while the current extraction activity has been in operation) and theresults of repeated beach profiles since 1978, and topography surveys since 2007.
50 The standards will depend on the country the vessel is registered in.
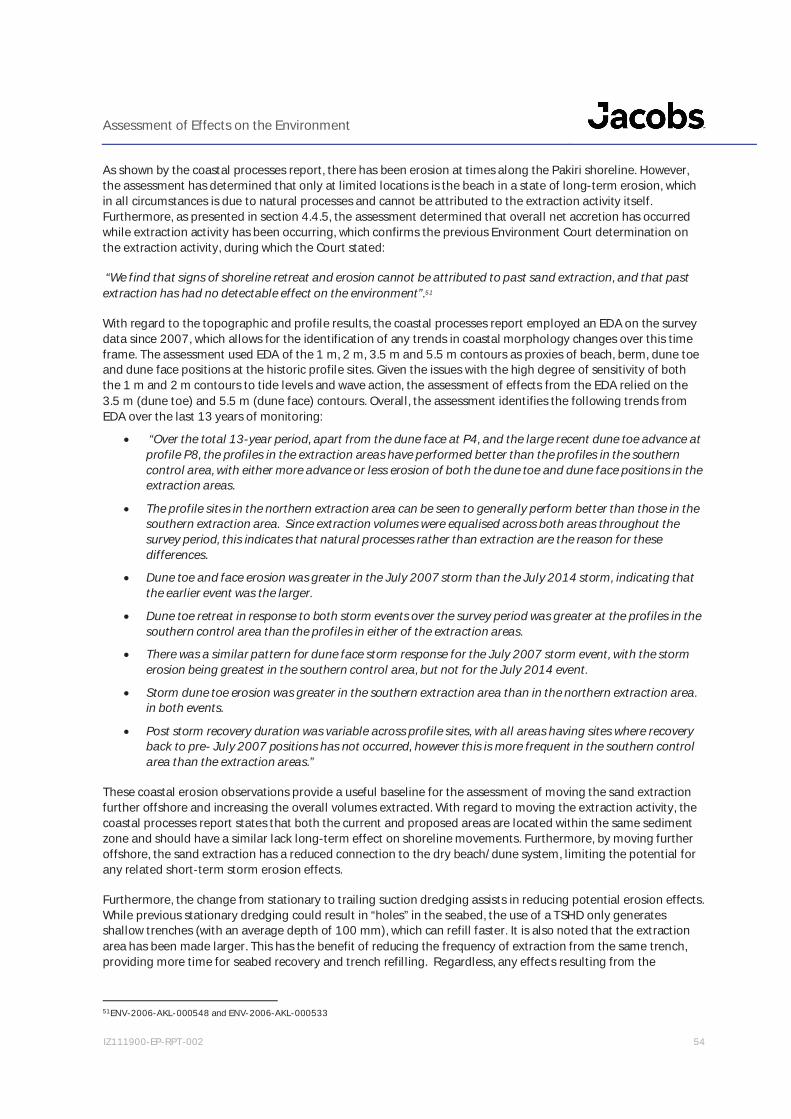
Assessment of Effects on the Environment
IZ111900-EP-RPT-002 54
As shown by the coastal processes report, there has been erosion at times along the Pakiri shoreline. However,the assessment has determined that only at limited locations is the beach in a state of long-term erosion, whichin all circumstances is due to natural processes and cannot be attributed to the extraction activity itself.Furthermore, as presented in section 4.4.5, the assessment determined that overall net accretion has occurredwhile extraction activity has been occurring, which confirms the previous Environment Court determination onthe extraction activity, during which the Court stated:
“We find that signs of shoreline retreat and erosion cannot be attributed to past sand extraction, and that pastextraction has had no detectable effect on the environment”.51
With regard to the topographic and profile results, the coastal processes report employed an EDA on the surveydata since 2007, which allows for the identification of any trends in coastal morphology changes over this timeframe. The assessment used EDA of the 1 m, 2 m, 3.5 m and 5.5 m contours as proxies of beach, berm, dune toeand dune face positions at the historic profile sites. Given the issues with the high degree of sensitivity of boththe 1 m and 2 m contours to tide levels and wave action, the assessment of effects from the EDA relied on the3.5 m (dune toe) and 5.5 m (dune face) contours. Overall, the assessment identifies the following trends fromEDA over the last 13 years of monitoring:
“Over the total 13-year period, apart from the dune face at P4, and the large recent dune toe advance atprofile P8, the profiles in the extraction areas have performed better than the profiles in the southerncontrol area, with either more advance or less erosion of both the dune toe and dune face positions in theextraction areas.
The profile sites in the northern extraction area can be seen to generally perform better than those in thesouthern extraction area. Since extraction volumes were equalised across both areas throughout thesurvey period, this indicates that natural processes rather than extraction are the reason for thesedifferences.
Dune toe and face erosion was greater in the July 2007 storm than the July 2014 storm, indicating thatthe earlier event was the larger.
Dune toe retreat in response to both storm events over the survey period was greater at the profiles in thesouthern control area than the profiles in either of the extraction areas.
There was a similar pattern for dune face storm response for the July 2007 storm event, with the stormerosion being greatest in the southern control area, but not for the July 2014 event.
Storm dune toe erosion was greater in the southern extraction area than in the northern extraction area.in both events.
Post storm recovery duration was variable across profile sites, with all areas having sites where recoveryback to pre- July 2007 positions has not occurred, however this is more frequent in the southern controlarea than the extraction areas.”
These coastal erosion observations provide a useful baseline for the assessment of moving the sand extractionfurther offshore and increasing the overall volumes extracted. With regard to moving the extraction activity, thecoastal processes report states that both the current and proposed areas are located within the same sedimentzone and should have a similar lack long-term effect on shoreline movements. Furthermore, by moving furtheroffshore, the sand extraction has a reduced connection to the dry beach/dune system, limiting the potential forany related short-term storm erosion effects.
Furthermore, the change from stationary to trailing suction dredging assists in reducing potential erosion effects.While previous stationary dredging could result in “holes” in the seabed, the use of a TSHD only generatesshallow trenches (with an average depth of 100 mm), which can refill faster. It is also noted that the extractionarea has been made larger. This has the benefit of reducing the frequency of extraction from the same trench,providing more time for seabed recovery and trench refilling. Regardless, any effects resulting from the
51ENV-2006-AKL-000548 and ENV-2006-AKL-000533

Assessment of Effects on the Environment
IZ111900-EP-RPT-002 55
movement of the extraction area will also be addressed through the use of an EMMP, with the requirement forthe EMMP included in the draft conditions (Appendix F).
6.4.2 Effects on Sediment Budget
The potential effects on shoreline position can also be assessed by the use a sediment budget, which was aconceptual tool accepted by the Environment Court during the previous consenting process. As discussed insection 4.4.6, the sediment budget for the embayment was calculated using information from a range ofsources52. To reiterate, the calculated sand budget demonstrates the open system character of sand movementsat Pakiri, the large volumes of sediment/sand entering the embayment and the volumes available for extraction(above that which MBL is seeking). This reinforces observations made during the monitoring of the currentconsents, which have not identified any significant erosion which can be attributed to sand extraction.
Table 6-3 below presents the adjusted sediment budget for the proposed increase in extraction rate to 125,000m3/yr under this application.
Table 6-3: Sediment budget out to 25 m CD water depth on basis that inputs exceed losses over last 50 years dueto storage as shoreline accretion (Source: Jacobs).
Sediment Sources (Inputs or credits) Sediment sinks (losses or debts)Source Volume (m3/yr) Sink Volume (m3/yr)
Cliffs 6,000 Onshore winds 2,000
Rivers 17,000 Mangawhai Inlet 3,000
Biogenic from <25 m depth 7,000 Around Cape Rodney 1,000Around Bream Tail 25,000 Extraction from < 25 m depth 125,000
Cross-shore supply (includinglongshore elements) from >25m depthCalculated to balance budget
145,000 Total Sinks (Losses or debts) 131,000Storage/SurplusStorage in dune/beach/nearshorefrom +0.4 m beach accretion over50+ years
69,000
Total Sources 200,000 Total Sinks + Storage 200,000
The sediment budget highlights that there is a broad range of sediment sources into the embayment, includingfrom the inner continental shelf and from around the Bream Tail. The sand grain size in these sources is suchthat it can be transported by wave action and ocean currents (as confirmed by observations of the seabed) intothe proposed extraction area, therefore ensuring the replacement of any sediment removed from the system. Toput this volume into perspective, if there were no inputs of sand into or across the proposed 6.6km2 extractionarea, the annual depth of sand taken at the maximum levels applied for would be approximately 19mm perannum. Based on the known sediment pathways and total size of the embayment, the change in depth will beimmeasurable, although the EMMP will be used to ensure this is the case.
Overall, the sediment budget shows that there is potential extra storage and supply routes in the local system tosuggest that a total source volume of 200,000 m3/yr is possible, with natural losses of 6,000 m3/yr. Regardless,MBL have implemented a precautionary approach and have limited their proposed extraction to 125,000 m3/yron a five-year average, with the use of an EMMP to monitor any erosion effects. Leaving the remainder ofmaterial continues to provide storage volume to address short-term shoreline erosion and beach volumeexchange to the nearshore in storms.
To reiterate, the calculated sand budget demonstrates the open system character of sand movements at Pakiri,the large volumes of sediment/sand entering the embayment and the volumes available for extraction (above
52 These sources included previous Environment Court evidence, a biogenic sand supply assessment by Bioresearchers and modelling data byMetOcean Solutions.
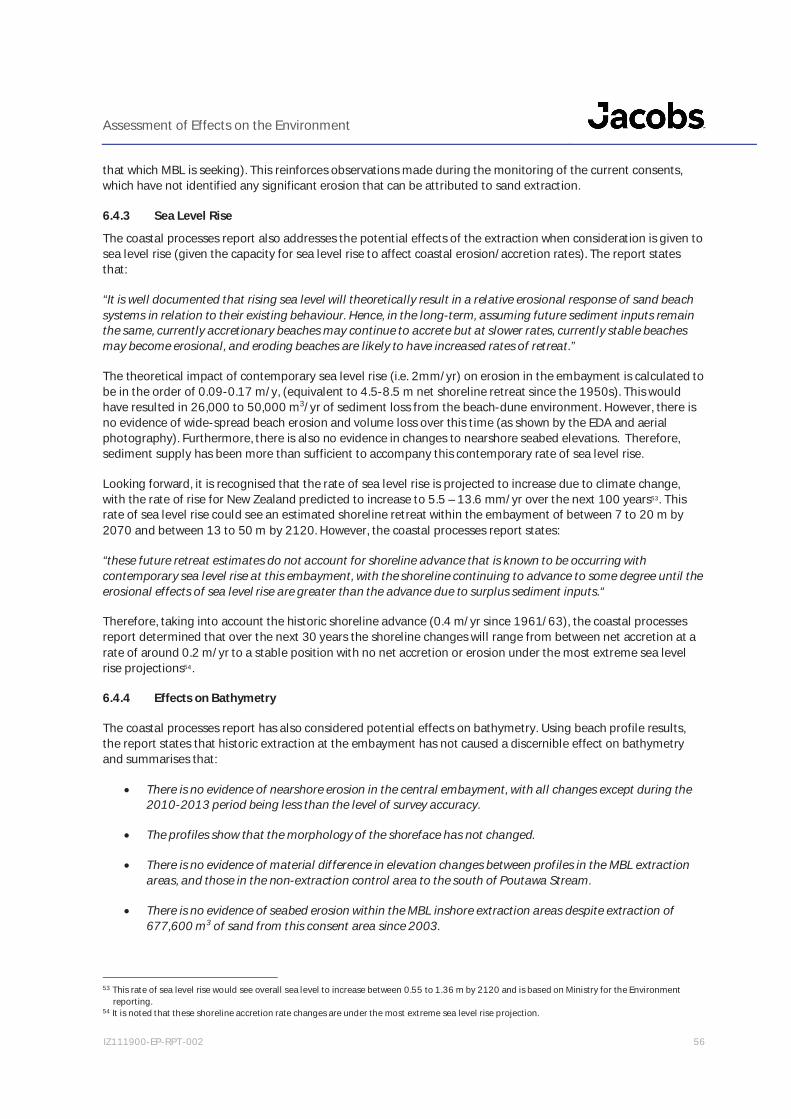
Assessment of Effects on the Environment
IZ111900-EP-RPT-002 56
that which MBL is seeking). This reinforces observations made during the monitoring of the current consents,which have not identified any significant erosion that can be attributed to sand extraction.
6.4.3 Sea Level Rise
The coastal processes report also addresses the potential effects of the extraction when consideration is given tosea level rise (given the capacity for sea level rise to affect coastal erosion/accretion rates). The report statesthat:
“It is well documented that rising sea level will theoretically result in a relative erosional response of sand beachsystems in relation to their existing behaviour. Hence, in the long-term, assuming future sediment inputs remainthe same, currently accretionary beaches may continue to accrete but at slower rates, currently stable beachesmay become erosional, and eroding beaches are likely to have increased rates of retreat.”
The theoretical impact of contemporary sea level rise (i.e. 2mm/yr) on erosion in the embayment is calculated tobe in the order of 0.09-0.17 m/y, (equivalent to 4.5-8.5 m net shoreline retreat since the 1950s). This wouldhave resulted in 26,000 to 50,000 m3/yr of sediment loss from the beach-dune environment. However, there isno evidence of wide-spread beach erosion and volume loss over this time (as shown by the EDA and aerialphotography). Furthermore, there is also no evidence in changes to nearshore seabed elevations. Therefore,sediment supply has been more than sufficient to accompany this contemporary rate of sea level rise.
Looking forward, it is recognised that the rate of sea level rise is projected to increase due to climate change,with the rate of rise for New Zealand predicted to increase to 5.5 – 13.6 mm/yr over the next 100 years53. Thisrate of sea level rise could see an estimated shoreline retreat within the embayment of between 7 to 20 m by2070 and between 13 to 50 m by 2120. However, the coastal processes report states:
“these future retreat estimates do not account for shoreline advance that is known to be occurring withcontemporary sea level rise at this embayment, with the shoreline continuing to advance to some degree until theerosional effects of sea level rise are greater than the advance due to surplus sediment inputs.“
Therefore, taking into account the historic shoreline advance (0.4 m/yr since 1961/63), the coastal processesreport determined that over the next 30 years the shoreline changes will range from between net accretion at arate of around 0.2 m/yr to a stable position with no net accretion or erosion under the most extreme sea levelrise projections54.
6.4.4 Effects on Bathymetry
The coastal processes report has also considered potential effects on bathymetry. Using beach profile results,the report states that historic extraction at the embayment has not caused a discernible effect on bathymetryand summarises that:
There is no evidence of nearshore erosion in the central embayment, with all changes except during the2010-2013 period being less than the level of survey accuracy.
The profiles show that the morphology of the shoreface has not changed.
There is no evidence of material difference in elevation changes between profiles in the MBL extractionareas, and those in the non-extraction control area to the south of Poutawa Stream.
There is no evidence of seabed erosion within the MBL inshore extraction areas despite extraction of677,600 m3 of sand from this consent area since 2003.
53 This rate of sea level rise would see overall sea level to increase between 0.55 to 1.36 m by 2120 and is based on Ministry for the Environmentreporting.
54 It is noted that these shoreline accretion rate changes are under the most extreme sea level rise projection.
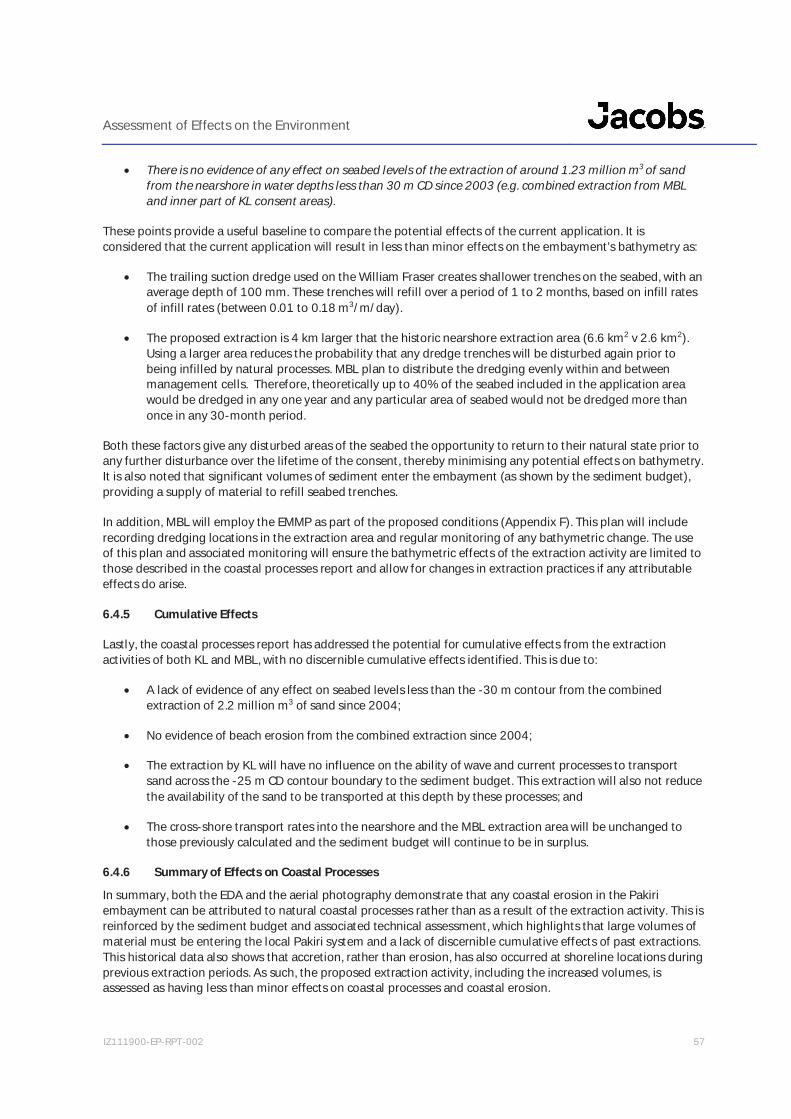
Assessment of Effects on the Environment
IZ111900-EP-RPT-002 57
There is no evidence of any effect on seabed levels of the extraction of around 1.23 million m3 of sandfrom the nearshore in water depths less than 30 m CD since 2003 (e.g. combined extraction from MBLand inner part of KL consent areas).
These points provide a useful baseline to compare the potential effects of the current application. It isconsidered that the current application will result in less than minor effects on the embayment’s bathymetry as:
The trailing suction dredge used on the William Fraser creates shallower trenches on the seabed, with anaverage depth of 100 mm. These trenches will refill over a period of 1 to 2 months, based on infill ratesof infill rates (between 0.01 to 0.18 m3/m/day).
The proposed extraction is 4 km larger that the historic nearshore extraction area (6.6 km2 v 2.6 km2).Using a larger area reduces the probability that any dredge trenches will be disturbed again prior tobeing infilled by natural processes. MBL plan to distribute the dredging evenly within and betweenmanagement cells. Therefore, theoretically up to 40% of the seabed included in the application areawould be dredged in any one year and any particular area of seabed would not be dredged more thanonce in any 30-month period.
Both these factors give any disturbed areas of the seabed the opportunity to return to their natural state prior toany further disturbance over the lifetime of the consent, thereby minimising any potential effects on bathymetry.It is also noted that significant volumes of sediment enter the embayment (as shown by the sediment budget),providing a supply of material to refill seabed trenches.
In addition, MBL will employ the EMMP as part of the proposed conditions (Appendix F). This plan will includerecording dredging locations in the extraction area and regular monitoring of any bathymetric change. The useof this plan and associated monitoring will ensure the bathymetric effects of the extraction activity are limited tothose described in the coastal processes report and allow for changes in extraction practices if any attributableeffects do arise.
6.4.5 Cumulative Effects
Lastly, the coastal processes report has addressed the potential for cumulative effects from the extractionactivities of both KL and MBL, with no discernible cumulative effects identified. This is due to:
A lack of evidence of any effect on seabed levels less than the -30 m contour from the combinedextraction of 2.2 million m3 of sand since 2004;
No evidence of beach erosion from the combined extraction since 2004;
The extraction by KL will have no influence on the ability of wave and current processes to transportsand across the -25 m CD contour boundary to the sediment budget. This extraction will also not reducethe availability of the sand to be transported at this depth by these processes; and
The cross-shore transport rates into the nearshore and the MBL extraction area will be unchanged tothose previously calculated and the sediment budget will continue to be in surplus.
6.4.6 Summary of Effects on Coastal Processes
In summary, both the EDA and the aerial photography demonstrate that any coastal erosion in the Pakiriembayment can be attributed to natural coastal processes rather than as a result of the extraction activity. This isreinforced by the sediment budget and associated technical assessment, which highlights that large volumes ofmaterial must be entering the local Pakiri system and a lack of discernible cumulative effects of past extractions.This historical data also shows that accretion, rather than erosion, has also occurred at shoreline locations duringprevious extraction periods. As such, the proposed extraction activity, including the increased volumes, isassessed as having less than minor effects on coastal processes and coastal erosion.
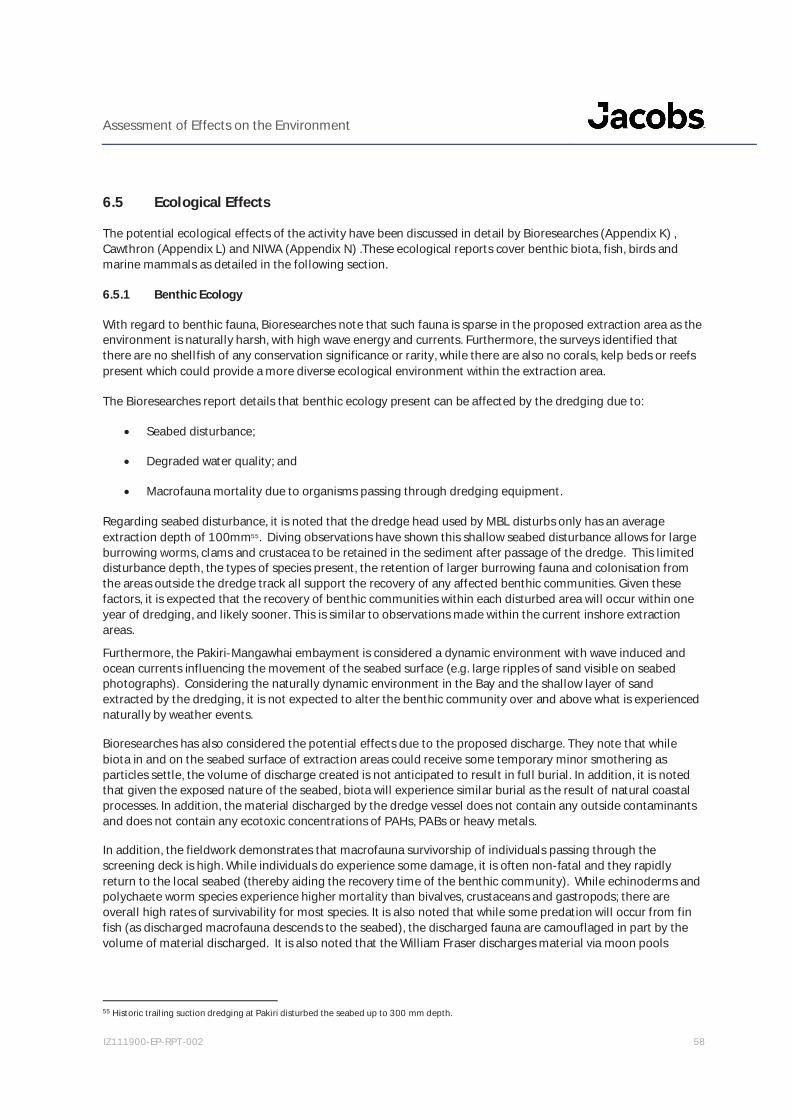
Assessment of Effects on the Environment
IZ111900-EP-RPT-002 58
6.5 Ecological Effects
The potential ecological effects of the activity have been discussed in detail by Bioresearches (Appendix K) ,Cawthron (Appendix L) and NIWA (Appendix N) .These ecological reports cover benthic biota, fish, birds andmarine mammals as detailed in the following section.
6.5.1 Benthic Ecology
With regard to benthic fauna, Bioresearches note that such fauna is sparse in the proposed extraction area as theenvironment is naturally harsh, with high wave energy and currents. Furthermore, the surveys identified thatthere are no shellfish of any conservation significance or rarity, while there are also no corals, kelp beds or reefspresent which could provide a more diverse ecological environment within the extraction area.
The Bioresearches report details that benthic ecology present can be affected by the dredging due to:
Seabed disturbance;
Degraded water quality; and
Macrofauna mortality due to organisms passing through dredging equipment.
Regarding seabed disturbance, it is noted that the dredge head used by MBL disturbs only has an averageextraction depth of 100mm55. Diving observations have shown this shallow seabed disturbance allows for largeburrowing worms, clams and crustacea to be retained in the sediment after passage of the dredge. This limiteddisturbance depth, the types of species present, the retention of larger burrowing fauna and colonisation fromthe areas outside the dredge track all support the recovery of any affected benthic communities. Given thesefactors, it is expected that the recovery of benthic communities within each disturbed area will occur within oneyear of dredging, and likely sooner. This is similar to observations made within the current inshore extractionareas.
Furthermore, the Pakiri-Mangawhai embayment is considered a dynamic environment with wave induced andocean currents influencing the movement of the seabed surface (e.g. large ripples of sand visible on seabedphotographs). Considering the naturally dynamic environment in the Bay and the shallow layer of sandextracted by the dredging, it is not expected to alter the benthic community over and above what is experiencednaturally by weather events.
Bioresearches has also considered the potential effects due to the proposed discharge. They note that whilebiota in and on the seabed surface of extraction areas could receive some temporary minor smothering asparticles settle, the volume of discharge created is not anticipated to result in full burial. In addition, it is notedthat given the exposed nature of the seabed, biota will experience similar burial as the result of natural coastalprocesses. In addition, the material discharged by the dredge vessel does not contain any outside contaminantsand does not contain any ecotoxic concentrations of PAHs, PABs or heavy metals.
In addition, the fieldwork demonstrates that macrofauna survivorship of individuals passing through thescreening deck is high. While individuals do experience some damage, it is often non-fatal and they rapidlyreturn to the local seabed (thereby aiding the recovery time of the benthic community). While echinoderms andpolychaete worm species experience higher mortality than bivalves, crustaceans and gastropods; there areoverall high rates of survivability for most species. It is also noted that while some predation will occur from finfish (as discharged macrofauna descends to the seabed), the discharged fauna are camouflaged in part by thevolume of material discharged. It is also noted that the William Fraser discharges material via moon pools
55 Historic trailing suction dredging at Pakiri disturbed the seabed up to 300 mm depth.
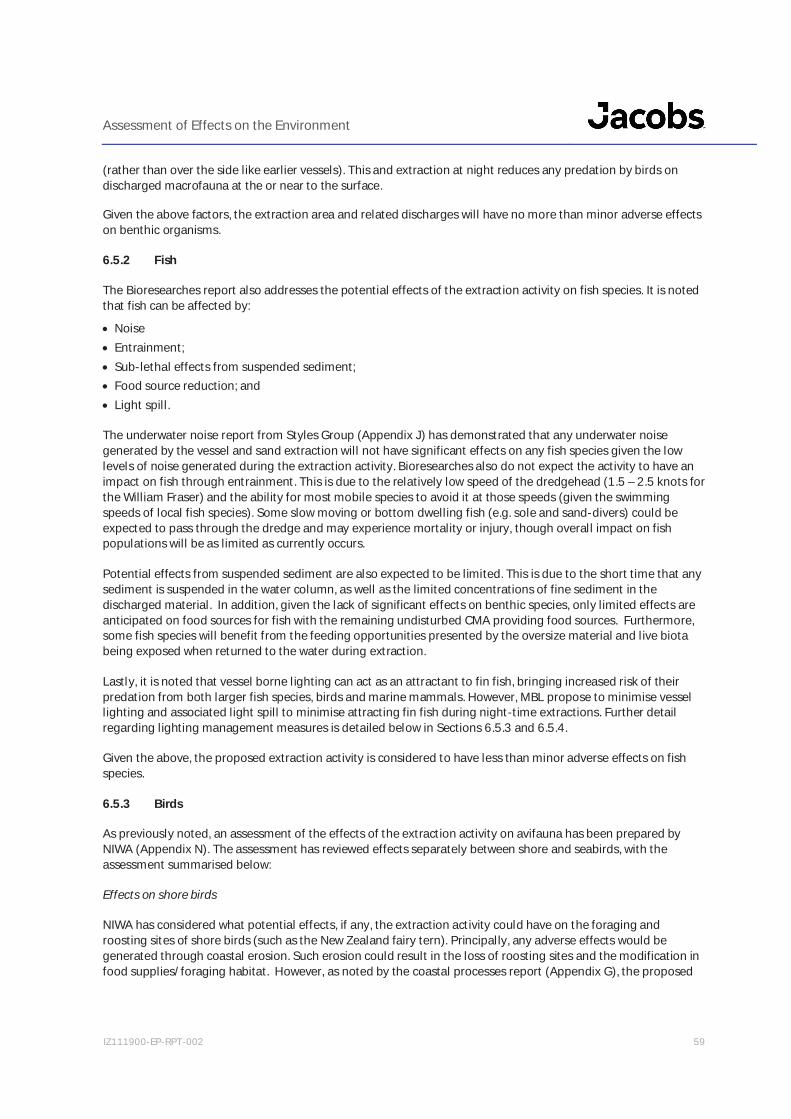
Assessment of Effects on the Environment
IZ111900-EP-RPT-002 59
(rather than over the side like earlier vessels). This and extraction at night reduces any predation by birds ondischarged macrofauna at the or near to the surface.
Given the above factors, the extraction area and related discharges will have no more than minor adverse effectson benthic organisms.
6.5.2 Fish
The Bioresearches report also addresses the potential effects of the extraction activity on fish species. It is notedthat fish can be affected by:
Noise Entrainment; Sub-lethal effects from suspended sediment; Food source reduction; and Light spill.
The underwater noise report from Styles Group (Appendix J) has demonstrated that any underwater noisegenerated by the vessel and sand extraction will not have significant effects on any fish species given the lowlevels of noise generated during the extraction activity. Bioresearches also do not expect the activity to have animpact on fish through entrainment. This is due to the relatively low speed of the dredgehead (1.5 – 2.5 knots forthe William Fraser) and the ability for most mobile species to avoid it at those speeds (given the swimmingspeeds of local fish species). Some slow moving or bottom dwelling fish (e.g. sole and sand-divers) could beexpected to pass through the dredge and may experience mortality or injury, though overall impact on fishpopulations will be as limited as currently occurs.
Potential effects from suspended sediment are also expected to be limited. This is due to the short time that anysediment is suspended in the water column, as well as the limited concentrations of fine sediment in thedischarged material. In addition, given the lack of significant effects on benthic species, only limited effects areanticipated on food sources for fish with the remaining undisturbed CMA providing food sources. Furthermore,some fish species will benefit from the feeding opportunities presented by the oversize material and live biotabeing exposed when returned to the water during extraction.
Lastly, it is noted that vessel borne lighting can act as an attractant to fin fish, bringing increased risk of theirpredation from both larger fish species, birds and marine mammals. However, MBL propose to minimise vessellighting and associated light spill to minimise attracting fin fish during night-time extractions. Further detailregarding lighting management measures is detailed below in Sections 6.5.3 and 6.5.4.
Given the above, the proposed extraction activity is considered to have less than minor adverse effects on fishspecies.
6.5.3 Birds
As previously noted, an assessment of the effects of the extraction activity on avifauna has been prepared byNIWA (Appendix N). The assessment has reviewed effects separately between shore and seabirds, with theassessment summarised below:
Effects on shore birds
NIWA has considered what potential effects, if any, the extraction activity could have on the foraging androosting sites of shore birds (such as the New Zealand fairy tern). Principally, any adverse effects would begenerated through coastal erosion. Such erosion could result in the loss of roosting sites and the modification infood supplies/foraging habitat. However, as noted by the coastal processes report (Appendix G), the proposed
Assessment of Effects on the Environment
IZ111900-EP-RPT-002 60
extraction is not expected to generate any coastal erosion beyond that expected by natural processes56. As such,little or no effects are anticipated through the loss of roosting and foraging habitat.
The NIWA report also notes that adverse effects could also be caused through the unplanned loss of diesel or oilfrom MBL’s vessels. The scale of such effects would depend on the volumes spilled, weather conditions, distancefrom shore and season. However, it is noted that such events are rare and the exposed nature of the Pakiri-Mangawhai embayment would assist with fuel disbursement. In addition, MBL do not propose to undertake anyat-sea refuelling of their vessels, while an Oil Spill Prevention and Response Plan will be employed during alloperations to ensure that any accidental discharges of hydrocarbons are addressed appropriately and asrequired by Maritime New Zealand.
Effects on seabirds
The NIWA report notes the following regarding seabirds:
“Sand extraction could potentially affect seabirds negatively in several ways, both directly and indirectly.Potential effects include disturbance from routine sand extraction activity, interaction with sand extractionvessels, reduced prey abundance or prey availability within and around the extraction area, exclusion fromhabitat within the extraction area and effects of spilled fuel or oil from sand extraction vessel(s).”
While disturbance effects are possible, the NIWA report highlights that the activity is proposed to occur primarilyat night, when most seabirds are roosting. In addition, the nearest seabird colonies are located some distanceaway at Mangawhai, Goat Island, Little Barrier Island and several islands to the north. Birds nesting at thesecolonies are unlikely to hear and be disturbed by the vessel while it is operating.
It is noted by the NIWA report that the vessel lights used during night-time operations can act as an attractor toseabirds, causing birds to collide with vessels. While any collisions with more common bird species would havenegligible effects on their populations and conservation status, it is recognised that the New Zealand stormpetrel (which is considered nationally vulnerable) is particularly attracted to bright lights. Given the potential foradverse effects on seabirds and in particular the storm petrel, MBL propose to employ the following controls tominimise potential ship light related effects:
The use of minimal deck lighting (other than that required for safe operations and navigation);
Directing lights downwards wherever possible; and
Employing screens or blackout drapes on portholes and windows to minimise light spill.
A condition limiting light spill from extraction vessels has been included with the draft conditions (Appendix F).
A further potential effect arises from reductions in bird prey populations, both through disturbing the seabedand affecting water quality. However, as noted by Bioresearches (Appendix K) and Jacobs (Appendix H), theextraction activity has minimal effects on benthic/fin fish communities by either seabird disturbance or waterquality reductions. Furthermore, the NIWA report highlights that the spatial extent of both seabed disturbanceand related discharges are small in comparison to the wider area used by seabirds for foraging. As such, anyeffects on bird prey accessibility or foraging exclusion are considered to be minimal.
Lastly, as with shore birds, there is the potential for adverse effects due to accidental fuel or oil spills. However,as previously discussed, the exposed nature of the extraction area, the rarity of such events, the lack of any at-sea refuelling and the use of spill management plans mitigates any related effects.
Given the above, the effects of the proposal on avifauna is less than minor.
56 It is noted that historically the shoreline within the embayment has experienced long-term accretion and not erosion.
Assessment of Effects on the Environment
IZ111900-EP-RPT-002 61
6.5.4 Marine Mammals
The assessment by Cawthron (Appendix L) has identified four potential sources of adverse effects on marinemammals:
Underwater noise; Vessel lighting; Entanglement; and Indirect effects due to habitat disruption.
With regard to underwater noise effects, Cawthron have relied on the underwater noise monitoring andassociated modelling undertaken by Styles Group (Appendix J). Cawthron note that any effects from underwaternoise will be transitory and non-injurious based on the findings of the operational noise assessment andmeasurements of the William Fraser’s underwater noise. This is due to the limited noise generated by the vesseland its dredge, the presence of other louder vessels in the area (such as cargo and naval vessels),the likelylimited population of marine mammals in the Pakiri area and the limited importance of the area as marinemammal habitat. Cawthron summarises any noise effects to be limited to the following:
“effects will be predominantly limited to the temporary masking of some noise signals when animals are withinseveral kilometres of the dredge and a range of potential behavioural responses at closer proximity (< 400 m).”
While Cawthron acknowledges that the effects of artificial lighting on marine mammals is relatively unknown(given a lack of research), it is noted that any light spill from the vessel is likely to be confined to within a fewhundred metres at both the surface and sub-surface. Such lighting has the potential to attract small marinespecies (e.g. bait fish and larvae) and consequently mammal species which would feed on them. Given this, MBLwill seek to minimise the volume of lighting used on its vessels during night-time extraction activities (notingthat navigation compliant lighting must still be used).
Cawthron also note that marine debris can pose a risk to mammals due to entanglement. However, such high-risk debris is typically loose and/or thin fishing lines and nets. No such equipment is proposed for the extractionvessels given the need to keep the dredgehead free of debris. In addition, MBL employ NZ Maritime compliantwaste management procedures onboard their vessels, thereby avoiding the accidental release of debris into theHauraki Gulf.
While resource consent is not required for the passage of the extraction vessels through the Hauraki Gulf, it isalso noted that the risk of a collision between vessels and marine mammals is low. This is based on the path ofthe vessels to and from the extraction ground plus the slower speed of the William Fraser which travels at nomore than 9.5 knots. This is less than the 10 knots recommended by the Ports of Auckland in its MarineMammal Protocol for Shipping in the Hauraki Gulf. Regardless, the passage of the William Fraser through theHauraki Gulf is a permitted activity under the AUP(OP).
With regard to indirect effects, the extraction activity will have less than minor effects on water quality andecology as previously discussed. As a consequence of these limited effects, Cawthron have not identified anypossible effects due to habitat disruption. Marine mammals will still have access to food sources in the Pakiriarea, and they will also not be exposed to harmful contaminants due to seabed disturbance.
Further to the above, MBL will also employ a range of measures to avoid any potential conflicts between theextraction activity and mammals. These will be based on the following three management goals:
Minimise the risk of dredge vessel collisions with any marine mammal and aim for zero injury/mortality(noting that the passage of MBL’s vessels between Pakiri and the Port of Auckland is a permitted activityunder the AUP(OP));
Minimise the avoidance (attraction) or potential for injury of marine wildlife to dredging activities; and

Assessment of Effects on the Environment
IZ111900-EP-RPT-002 62
Aim to minimise entanglement with a goal of zero mortality.
Given the above, the activity will have less than minor adverse effects on marine mammals.
6.6 Cultural Effects
As identified in Section 4.3, the Pakiri area has a number of iwi owned sites, statutory acknowledgement areasand CMT applicants.
With regard to the physical effects of the extraction activity, it is noted that it will not affect the ability of iwi toundertake customary fishing. This is due to the no more than minor effects on marine ecology and the limitedtime that the extraction vessels are present. Important customary fish species, such as snapper and terakihi, willremain available to customary fishermen despite the proposed sand extraction.
Iwi onshore sites will also be unaffected by the proposal, including the two forestry blocks owned by Ng tiManuhiri and Te Uri o Hau, as well as any undisturbed archaeological sites within the local dune system. This isdue to the lack of erosion effects of the sand extraction and the lack of any onshore facilities needed by MBL toundertake the sand extraction. As such, the continued use of these sites and the preservation of their culturalvalues will be maintained.
Regardless of the above, MBL have engaged with mana whenua, as highlighted in Section 8. Through thisengagement, MBL has commissioned CVAs for extraction from the new area and these will be provided to theCouncil once they are available. In addition, MBL are aware that Ng ti Manuhiri, Ng i Tai ki T maki, and TeKawerau a Maki all have statutory management areas within the CMA and have been consulted with accordingly.
6.7 Biosecurity Effects
Given the frequent movement of MBL’s vessels between the Port of Auckland and Pakiri, MBL is aware of itsduties to avoid the transfer of pest marine species via its vessels. The potential for such a biosecurity incident isminimised by MBL undertaking regular cleaning of its vessels’ hulls (this is also undertaken to maintain thevessels’ performance and stay within Maritime NZ regulatory requirements) and avoiding the discharge of bilgewater at Pakiri. As such, the likelihood of MBL’s vessels introducing new pests to the Pakiri area is consideredvery low and the potential adverse biosecurity effects are therefore considered to be less than minor.
6.8 Surface Noise Effects
While the effects of underwater noise have been addressed in Section 4.4.9.3, the amenity effects arising fromsurface vessel noise has also been assessed. As discussed in the technical report from Styles Group (Appendix I),the highest noise levels that can be experienced by beach users will be between 20 dB and 35 dB. These noiselevels are associated with no or close to no wind conditions. However, it is noted that recorded ambient noiselevels do not drop below 30 dB (even for short periods) and the calm conditions required for noise to travel fromthe vessel to beach users are rare, particularly during daytime when the beach is mostly used). Furthermore, themodelling undertaken by Styles Group demonstrates that noise from the William Fraser will be inaudible inlandfrom the shoreline, with maximum noise limits of 20-25dB LAeq generated.
Overall, the Styles Group monitoring and modelling demonstrates that the extraction activity is compliant withAUP(OP) noise standards. As such, the activity will have nil surface noise effects.

Assessment of Effects on the Environment
IZ111900-EP-RPT-002 63
6.9 Recreational Effects
The potential adverse effects on recreational activities and beach users have also been considered by MBL. Theseeffects include those on surfing and fishing/boating.
6.9.1 Effects on Surf Breaks
As identified in the coastal processes report (Appendix G), the extraction activity does not affect the three surfbreaks at Pakiri Beach. In addition, no changes to the bathymetry or location of the breaks can be attributed tosand extraction activities, while no extraction occurs directly within the areas occupied by the three breaks. It isalso noted that no impacts on the surf breaks have been observed during the 70-year operation by MBL.
Furthermore, given the lack of extraction within the surf breaks, MBL’s vessels will not present a safety issue tosurfers, with access to the surf breaks remaining unobstructed. It is also noted that with a greater reliance onnight-time operations and reduced extraction times even less conflict between surfing and extraction activitieswill occur.
As such, the activity has nil effects on surfing.
6.9.2 Effects on Recreational Fishing and Boating
Pakiri Beach is a popular recreational fishing and boating location given its proximity to the Whangateau andMangawhai Harbours, as well as two regional parks. However, the extraction activity is not anticipated to haveany significant impacts on either recreational fishing and boating given its less than minor adverse effects on fishstock and the short duration that is required to extract sand from the seabed. Furthermore, the increasedreliance on night-time and weekday extraction activities will ensure that MBL’s vessels avoid operating whenpublic use of the Pakiri area is highest.
As such, the activity is considered to have less than minor effects on recreational fishing and boating.
6.10 Landscape Effects
As noted in Section 4.2.3, the proposed extraction area is located outside any AUP(OP) landscape overlays.Regardless, a landscape effects assessment has been prepared in support of this application (Appendix M). Thisassessment by Mr Brown is based on observations of the extraction vessel made from five critical viewpoints:
Viewpoint 1 - Te rai Regional Park Car Park Viewpoint 2 – Pakiri Beach North (near the Tara Iti Golf Course) Viewpoint 3 – Eyres Point Track Viewpoint 4 – Pakiri River Mouth; and Viewpoint 5 – M Greenwood Road and Pakiri Regional Park
Using these viewpoints, Mr Brown has assessed the landscape effects of the proposed extraction activity basedon existing values, legibility, landscape and natural character. The effects of the activity, as assessed by MrBrown are summarised below:
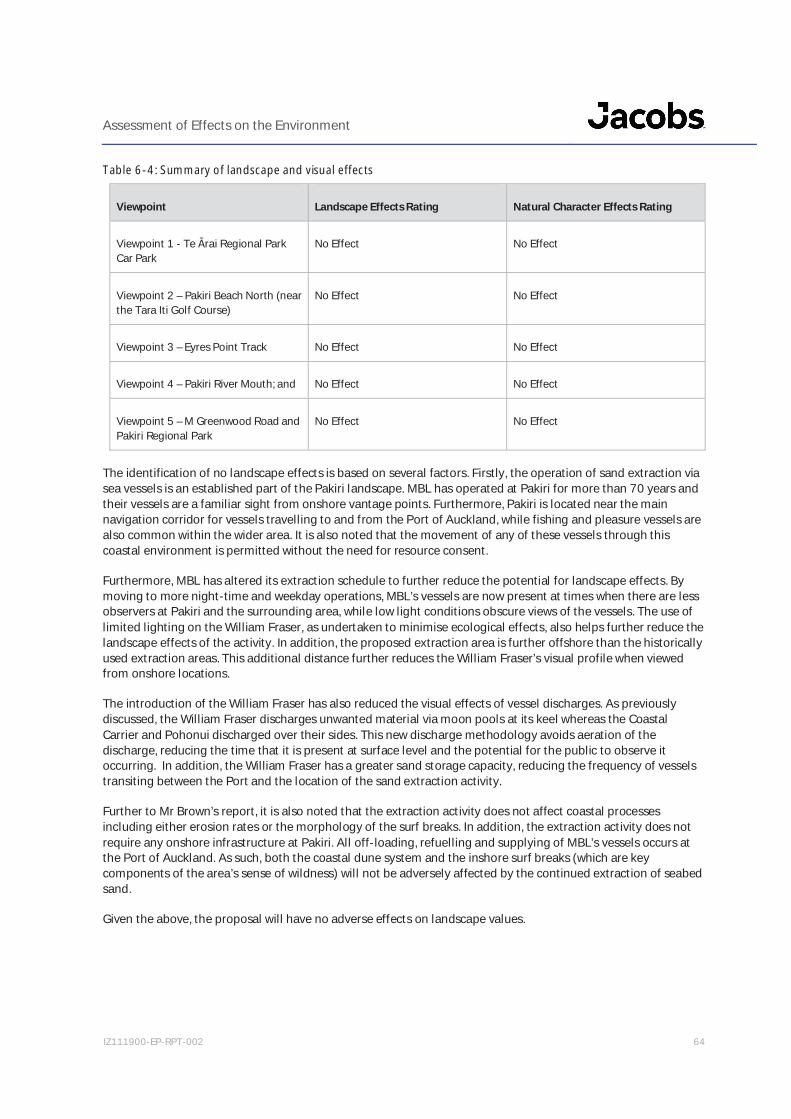
Assessment of Effects on the Environment
IZ111900-EP-RPT-002 64
Table 6-4: Summary of landscape and visual effects
Viewpoint Landscape Effects Rating Natural Character Effects Rating
Viewpoint 1 - Te rai Regional ParkCar Park
No Effect No Effect
Viewpoint 2 – Pakiri Beach North (nearthe Tara Iti Golf Course)
No Effect No Effect
Viewpoint 3 – Eyres Point Track No Effect No Effect
Viewpoint 4 – Pakiri River Mouth; and No Effect No Effect
Viewpoint 5 – M Greenwood Road andPakiri Regional Park
No Effect No Effect
The identification of no landscape effects is based on several factors. Firstly, the operation of sand extraction viasea vessels is an established part of the Pakiri landscape. MBL has operated at Pakiri for more than 70 years andtheir vessels are a familiar sight from onshore vantage points. Furthermore, Pakiri is located near the mainnavigation corridor for vessels travelling to and from the Port of Auckland, while fishing and pleasure vessels arealso common within the wider area. It is also noted that the movement of any of these vessels through thiscoastal environment is permitted without the need for resource consent.
Furthermore, MBL has altered its extraction schedule to further reduce the potential for landscape effects. Bymoving to more night-time and weekday operations, MBL’s vessels are now present at times when there are lessobservers at Pakiri and the surrounding area, while low light conditions obscure views of the vessels. The use oflimited lighting on the William Fraser, as undertaken to minimise ecological effects, also helps further reduce thelandscape effects of the activity. In addition, the proposed extraction area is further offshore than the historicallyused extraction areas. This additional distance further reduces the William Fraser’s visual profile when viewedfrom onshore locations.
The introduction of the William Fraser has also reduced the visual effects of vessel discharges. As previouslydiscussed, the William Fraser discharges unwanted material via moon pools at its keel whereas the CoastalCarrier and Pohonui discharged over their sides. This new discharge methodology avoids aeration of thedischarge, reducing the time that it is present at surface level and the potential for the public to observe itoccurring. In addition, the William Fraser has a greater sand storage capacity, reducing the frequency of vesselstransiting between the Port and the location of the sand extraction activity.
Further to Mr Brown’s report, it is also noted that the extraction activity does not affect coastal processesincluding either erosion rates or the morphology of the surf breaks. In addition, the extraction activity does notrequire any onshore infrastructure at Pakiri. All off-loading, refuelling and supplying of MBL’s vessels occurs atthe Port of Auckland. As such, both the coastal dune system and the inshore surf breaks (which are keycomponents of the area’s sense of wildness) will not be adversely affected by the continued extraction of seabedsand.
Given the above, the proposal will have no adverse effects on landscape values.
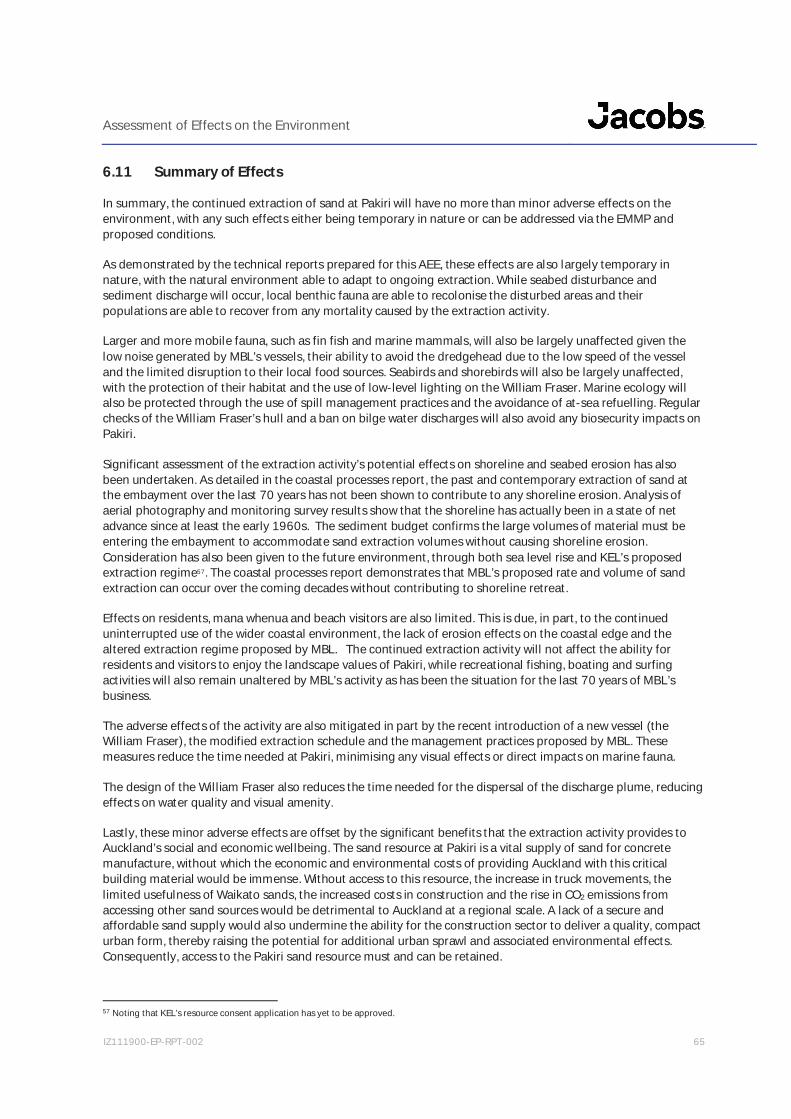
Assessment of Effects on the Environment
IZ111900-EP-RPT-002 65
6.11 Summary of Effects
In summary, the continued extraction of sand at Pakiri will have no more than minor adverse effects on theenvironment, with any such effects either being temporary in nature or can be addressed via the EMMP andproposed conditions.
As demonstrated by the technical reports prepared for this AEE, these effects are also largely temporary innature, with the natural environment able to adapt to ongoing extraction. While seabed disturbance andsediment discharge will occur, local benthic fauna are able to recolonise the disturbed areas and theirpopulations are able to recover from any mortality caused by the extraction activity.
Larger and more mobile fauna, such as fin fish and marine mammals, will also be largely unaffected given thelow noise generated by MBL’s vessels, their ability to avoid the dredgehead due to the low speed of the vesseland the limited disruption to their local food sources. Seabirds and shorebirds will also be largely unaffected,with the protection of their habitat and the use of low-level lighting on the William Fraser. Marine ecology willalso be protected through the use of spill management practices and the avoidance of at-sea refuelling. Regularchecks of the William Fraser’s hull and a ban on bilge water discharges will also avoid any biosecurity impacts onPakiri.
Significant assessment of the extraction activity’s potential effects on shoreline and seabed erosion has alsobeen undertaken. As detailed in the coastal processes report, the past and contemporary extraction of sand atthe embayment over the last 70 years has not been shown to contribute to any shoreline erosion. Analysis ofaerial photography and monitoring survey results show that the shoreline has actually been in a state of netadvance since at least the early 1960s. The sediment budget confirms the large volumes of material must beentering the embayment to accommodate sand extraction volumes without causing shoreline erosion.Consideration has also been given to the future environment, through both sea level rise and KEL’s proposedextraction regime57. The coastal processes report demonstrates that MBL’s proposed rate and volume of sandextraction can occur over the coming decades without contributing to shoreline retreat.
Effects on residents, mana whenua and beach visitors are also limited. This is due, in part, to the continueduninterrupted use of the wider coastal environment, the lack of erosion effects on the coastal edge and thealtered extraction regime proposed by MBL. The continued extraction activity will not affect the ability forresidents and visitors to enjoy the landscape values of Pakiri, while recreational fishing, boating and surfingactivities will also remain unaltered by MBL’s activity as has been the situation for the last 70 years of MBL’sbusiness.
The adverse effects of the activity are also mitigated in part by the recent introduction of a new vessel (theWilliam Fraser), the modified extraction schedule and the management practices proposed by MBL. Thesemeasures reduce the time needed at Pakiri, minimising any visual effects or direct impacts on marine fauna.
The design of the William Fraser also reduces the time needed for the dispersal of the discharge plume, reducingeffects on water quality and visual amenity.
Lastly, these minor adverse effects are offset by the significant benefits that the extraction activity provides toAuckland’s social and economic wellbeing. The sand resource at Pakiri is a vital supply of sand for concretemanufacture, without which the economic and environmental costs of providing Auckland with this criticalbuilding material would be immense. Without access to this resource, the increase in truck movements, thelimited usefulness of Waikato sands, the increased costs in construction and the rise in CO2 emissions fromaccessing other sand sources would be detrimental to Auckland at a regional scale. A lack of a secure andaffordable sand supply would also undermine the ability for the construction sector to deliver a quality, compacturban form, thereby raising the potential for additional urban sprawl and associated environmental effects.Consequently, access to the Pakiri sand resource must and can be retained.
57 Noting that KEL’s resource consent application has yet to be approved.
Assessment of Effects on the Environment
IZ111900-EP-RPT-002 66
7. Notification assessmentMBL is aware of the significant public interest in this application and given the recent public notification of KL’sown resource consent application, MBL request that this application for mid-shore sand extraction undergoespublic notification pursuant to section 95B(3)(a).
Assessment of Effects on the Environment
IZ111900-EP-RPT-002 67
8. ConsultationThe purpose of the consultation undertaken to date is to assist interested persons to understand the ongoingoperational extraction of marine sands, gather their potential concerns and where possible, minimise anyadverse effects from MBL’s operation. In addition, MBL is aware of its duties under the RMA to engage withstakeholders and in particular with iwi. A summary of this consultation is provided in the following section withfurther details provided in Appendix O.
8.1 Auckland Council
8.1.1 Regulatory Services
Meetings were held with resource consents department staff in September 2018, October 2019, June 2020 andOctober 2020 to discuss MBL’s proposed continued extraction operation at Pakiri. Matters discussed withAuckland Council’s planners, coastal specialists and landscape architect included the technical reports requiredand the confirmation of the methodologies employed for data gathering.
8.2 Mana Whenua
8.2.1 Local Mana Whenua Groups
MBL has engaged with the following mana whenua groups given the location of the activity within recognisedrohe:
Ng ti Manuhiri;
Te Uri O Hau; and
Ng ti Wai.
This engagement has involved e-mails to these parties, as well as follow up meetings and the sharing ofdocumentation with those groups who have expressed an interest in the application. In addition, Ng ti Manuhiriand Te Uri O Hau were commissioned to produce CVAs and these will be provided to Auckland Council once theyare available.
8.2.2 Customary Marine Title Applicants
In addition to the mana whenua groups identified in Section 8.2.1, MBL has also contacted the CMT claimantsidentified in Table 8-1. The majority of claimants have not responded to MBL’s consultation within the required15-day timeframe, but MBL will advise Council if any further correspondence is received.
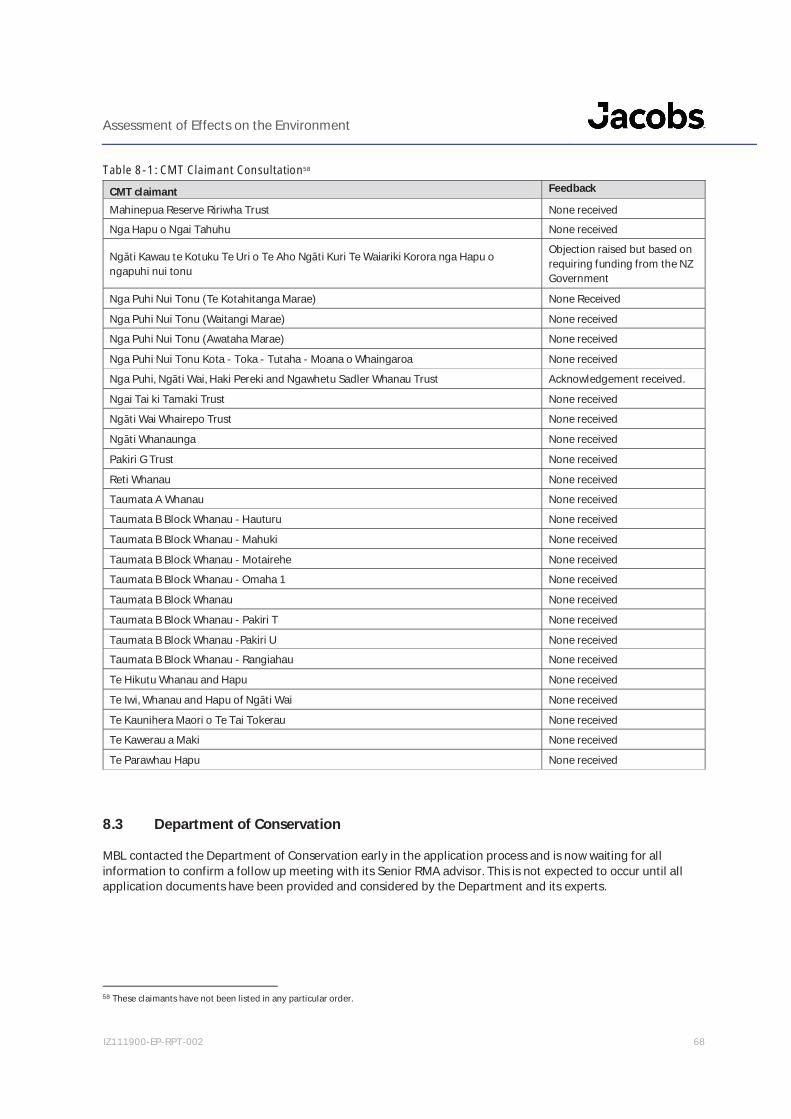
Assessment of Effects on the Environment
IZ111900-EP-RPT-002 68
Table 8-1: CMT Claimant Consultation58
8.3 Department of Conservation
MBL contacted the Department of Conservation early in the application process and is now waiting for allinformation to confirm a follow up meeting with its Senior RMA advisor. This is not expected to occur until allapplication documents have been provided and considered by the Department and its experts.
58 These claimants have not been listed in any particular order.
CMT claimant Feedback
Mahinepua Reserve Ririwha Trust None receivedNga Hapu o Ngai Tahuhu None received
Ng ti Kawau te Kotuku Te Uri o Te Aho Ng ti Kuri Te Waiariki Korora nga Hapu ongapuhi nui tonu
Objection raised but based onrequiring funding from the NZGovernment
Nga Puhi Nui Tonu (Te Kotahitanga Marae) None Received
Nga Puhi Nui Tonu (Waitangi Marae) None receivedNga Puhi Nui Tonu (Awataha Marae) None received
Nga Puhi Nui Tonu Kota - Toka - Tutaha - Moana o Whaingaroa None receivedNga Puhi, Ng ti Wai, Haki Pereki and Ngawhetu Sadler Whanau Trust Acknowledgement received.
Ngai Tai ki Tamaki Trust None receivedNg ti Wai Whairepo Trust None received
Ng ti Whanaunga None received
Pakiri G Trust None received
Reti Whanau None receivedTaumata A Whanau None receivedTaumata B Block Whanau - Hauturu None received
Taumata B Block Whanau - Mahuki None received
Taumata B Block Whanau - Motairehe None receivedTaumata B Block Whanau - Omaha 1 None received
Taumata B Block Whanau None received
Taumata B Block Whanau - Pakiri T None received
Taumata B Block Whanau -Pakiri U None receivedTaumata B Block Whanau - Rangiahau None received
Te Hikutu Whanau and Hapu None received
Te Iwi, Whanau and Hapu of Ng ti Wai None received
Te Kaunihera Maori o Te Tai Tokerau None receivedTe Kawerau a Maki None received
Te Parawhau Hapu None received
Assessment of Effects on the Environment
IZ111900-EP-RPT-002 69
8.4 NZ Fairy Tern Trust
The NZ Fairy Tern Trust was contacted in February 2019 with an offer to discuss the proposed continuedextraction activity at Pakiri and any potential effects on the local fairy tern colonies. Since this initial contact, theTrust has advised that they wish to be kept informed of the proposal but that they would be unlikely to getformally involved in the RMA process.
8.5 Friends of Pakiri
Initial contact regarding this application was made with the Friends of Pakiri in February 2019. Contact betweenMBL and the Friends of Pakiri is ongoing and any matters in these discussions will be addressed by MBL.
8.6 Other groups
MBL has also engaged with Forest and Bird, the Environmental Defence Society (EDS), the Mangawhai HarbourRestoration Society, Surf break Protection Society, Te rai Preservation Society and Pelco NZ Fisheries abouttheir activities in the Mangawhai-Pakiri embayment at various points through the application process. This hasinvolved providing copies of application documents to these parties (where requested). It also is noted that theEDS expressed that they were unlikely to wish further involvement in the application process.
Assessment of Effects on the Environment
IZ111900-EP-RPT-002 70
9. Statutory ConsiderationsThe following assessment is provided in accordance with the relevant sections under the RMA applicable to thisproposal.
9.1 Part 2 (Purposes and Principles) - Sections 5, 6, 7, and 8
Part 2 provides a common set of principles to be applied to the management of all resources.
9.1.1 Section 5 assessment
The RMA has a single overarching purpose: to promote the sustainable management of natural and physicalresources. Sustainable management is defined in Section 5 as:
...managing the use, development, and protection of natural and physical resources in a way, or at a rate,which enables people and communities to provide for their social, economic, and cultural wellbeing and fortheir health and safety while –
(a) Sustaining the potential of natural and physical resources (excluding minerals) to meet the reasonablyforeseeable needs of future generations; and
(b) Safeguarding the life-supporting capacity of air, water, soil, and ecosystems; and
(c) Avoiding, remedying, or mitigating any adverse effects of activities on the environment.
Assessment
As highlighted throughout this AEE, the sand resource at Pakiri is vital for the continued sustainabledevelopment of the Auckland Region. This includes the delivery of a quality compact urban core and a lowcarbon future. Pakiri is the source of at least 43% of the sand for Auckland’s concrete production and withoutaccess to this resource the cost of concrete in Auckland would increase, while the availability of sand to themarket would become critically short with a likely shortfall in availability. These increased costs would haveadverse effects on the economic wellbeing of Auckland, as well as on the supply of affordable housing withsubsequent negative impacts on social wellbeing.
Furthermore, the sand resource at Pakiri is the most efficient sand resource to transport, given its ability to beshipped directly into Central Auckland. Alternative sources in the Kaipara Harbour and Waikato require long-distance road transport, increasing transport costs, contributing to road congestion and generating additionalCO2 emissions. Also, Pakiri sand requires less cement than Waikato sourced sand (per cubic metre of concreteproduced), improving the cost efficiency and minimising CO2 generation during concrete production.
The proposed sand extraction will also be undertaken in a manner which protects the social and cultural valuesof Pakiri. The vessel operated by MBL will not obstruct the continued use of the CMA for other commercial andrecreational activities, including surfing and fishing. In addition, no culturally important features will be affectedand access to kaimoana will also be retained.
It has also been demonstrated that sand extraction can be undertaken while safe-guarding the life-supportingcapacity of water and local ecosystems. The assessments undertaken for this AEE have detailed the limitedeffects on water quality and ecological values. The biodiversity of the Pakiri area will be retained and the foodsources for fish, birds and marine mammals will be largely unaffected. Lastly, while the extraction activity willrequire the discharge of some sediment into the CMA, it has been shown that this discharge will not significantlyaffect water quality, is free of any noticeable contaminants and any effects generated will only be of a shortduration, leaving benthic organisms, fish, birds and marine mammals largely unaffected.
Given these factors, the proposal is consistent with section 5 of the RMA.
Assessment of Effects on the Environment
IZ111900-EP-RPT-002 71
9.1.2 Section 6 Assessment
In achieving the purpose of the RMA, all persons exercising functions and powers under it, in relation tomanaging the use, development, and protection of natural and physical resources, shall recognise and providefor the matters of national importance as set out in Section 6 of the Act.
Matters of national importance relevant to this application include:
(a) the preservation of the natural character of the coastal environment (including the coastal marine area),wetlands, and lakes and rivers and their margins, and the protection of them from inappropriatesubdivision, use, and development.
(b) (the protection of outstanding natural features and landscapes from inappropriate subdivision, use, anddevelopment.
(c) the protection of areas of significant indigenous vegetation and significant habitats of indigenous fauna.
(d) the maintenance and enhancement of public access to and along the coastal marine area, lakes, andrivers.
(e) The relationship of Maori and their culture and traditions with their ancestral lands, water, sites, w hitapu, and other taonga.
(g) the protection of protected customary rights:
(h) the management of significant risks from natural hazards.
Assessment
As detailed in this AEE, the natural character of the Pakiri area will be preserved. This is due to the limitedduration needed on-station for extraction, the added distance off-shore from the existing extraction areas, thealteration to a weekday and night-time focused extraction schedule and the lack of any visual disruption causedby MBL’s vessels. Furthermore, no boat handling facilities are required onshore nor are any permanent mooringsrequired in the CMA.
It is also noted that the extraction activity will not affect the accretion or erosion of the coastal dune system orthe bathymetry of the surf breaks. As such, the contributions that these features make to natural character of thelandscape will be unaffected and retained for the ongoing enjoyment of residents and visitors.
The ecological assessments by Bioresearches, NIWA and Cawthron have not identified any significant marinehabitats for native flora and fauna or significant effects on benthic, fin fish, marine mammal or seabirdcommunities. Furthermore, the lack of erosion effects ensures that any adverse effects on terrestrial ecologicalvalues are avoided.
Furthermore, the short duration of each extraction period and the distance of MBL’s vessels offshore allows forthe continued access of the public to Pakiri. This includes continued enjoyment of its surf breaks, recreationalfishing and boating. The lack of erosion effects also ensures that access to the beach remains available to thegeneral public.
MBL is also cognisant of the area’s cultural values and the relationship of Maori with this landscape. It has beendemonstrated that kaimoana or other customary rights will be unaffected by the extraction activity, while themauri of coastal waters will be protected given the limited effects associated with sediment disturbance and
Assessment of Effects on the Environment
IZ111900-EP-RPT-002 72
discharge. Furthermore, the lack of erosion effects allows for the protection of any w hi tapu and other taongawhich may be present in the coastal dune system.
Lastly, the extraction activity will not exacerbate any natural hazard risks in the Pakiri area. The lack of erosioneffects attributable to the activity ensures that any risks from coastal storms or climate change are not amplifiedby the continued extraction of sand.
Given these factors, the proposal is consistent with section 6 of the RMA.
9.1.3 Section 7 Assessment
Other matters that shall have particular regard to when managing the use, development and protection ofnatural and physical resources include;
(a) kaitiakitanga:
(aa) the ethic of stewardship:
(b) the efficient use and development of natural and physical resources
(c) the maintenance and enhancement of amenity values
(d) intrinsic values of ecosystems:
(f) maintenance and enhancement of the quality of the environment:
(i) the effects of climate change:
Assessment
MBL is aware of the importance of kaitiakitanga and has engaged with mana whenua throughout thedevelopment of the current proposal. This includes developing strong relationships with mana whenuarepresentatives to ensure that cultural values were considered in the proposed operation of the extractionactivity, while also ensuring that the ongoing access to culturally important resources is not impinged by MBL’soperation.
As identified in Sections 3 and 6.2, the continued access to this sand resource is critical to the delivery ofaffordable housing and the quality-compact urban growth model sought by Auckland Council’s strategicplanning documents. By delivering a high-quality and affordable source of concrete, the proposed extractionactivity will assist in the efficient use and development of resources across the Auckland region. As identified bythe Auckland Plan and AUP(OP), the quality compact urban development of Auckland will help protect valuablesoils, reduce congestion, help mitigate climate change, assist economic growth and provide housing choice.However, the ability to meet these efficient resource uses will be more difficult and expensive if the proposedextraction is not allowed for.
At a local level it is also considered that amenity values will be maintained. The extraction activity does not affectthe rate of any erosion of the coastal dune system or the quality and appearance of the surf breaks. As such, boththese landscape elements will continue to contribute to the high amenity values at Pakiri, while public access tothe coast will also remain unaffected.
The extraction activity also recognises the intrinsic values of ecosystems and will not affect local biodiversityvalues. The food sources for marine mammals and fish species will also be largely unaffected, while the lack of

Assessment of Effects on the Environment
IZ111900-EP-RPT-002 73
erosion protects any onshore species’ habitat. It is also noted that benthic species are able to recolonisedisturbed areas quickly, returning the seabed to its natural condition.
Overall, the activity will maintain the current quality of the environment, with no discernible effects beyond theexisting extraction activity. The altered extraction regime, including the use of increased night-time and weekdayoperations, will also assist with the enhancement of amenity values. Public enjoyment of Pakiri will also remainuninterrupted, with the ability for the public to enjoy surfing, fishing and boating in the CMA continuing evenwhile extraction is occurring.
Lastly, the effects of climate change, including coastal erosion have been considered in the development of thisapplication. The extraction activity does not affect the rate of sand loss at Pakiri and MBL propose to continue toundertake regular monitoring of the dunes and foreshore for the duration of the consented activity.
Given the above, the application is consistent with section 7 of the RMA.
9.1.4 Section 8 Assessment
The principles of the Treaty of Waitangi shall be taken into account when managing the use, development, andprotection of natural and physical resources.
Assessment
As previously discussed, MBL are aware of mana whenua’s rights and roles in resource management, havingengaged with a number of mana whenua through the development of the current proposal. This has includedcontacting CMT applicants, the iwi identified by Auckland Council as having an interest in the area and the threeiwi with statutory acknowledgment areas at Pakiri.
Furthermore, it is recognised that the proposed extraction will not impact on the physical characteristics of localcultural resources. Access will still be retained to kaimoana and the wider CMA, while erosion of the dune systemand the subsequent disturbance of any undiscovered taonga is not anticipated.
Lastly, CVAs were commissioned from Ng ti Manuhiri and Te Uri o Hau. These will be provided once they arecompleted.
9.2 Section 104(1)(a)
This section of the Act requires that regard is given to any actual and potential effects on the environment ofallowing the activity.
A detailed assessment of the actual and potential environmental effects is included in Section 6 of this report. Insummary, the extraction activity and associated discharge will have no more than minor adverse effects on theenvironment. However, these effects are largely transitory and will be reduced with the introduction of theWilliam Fraser and the altered extraction regime.
In addition, the proposal has significant benefits for the social and economic wellbeing of Auckland. The sandresource at Pakiri is a vital resource for the production and supply of concrete, providing at least 43% of thesand used for Auckland’s concrete production. Without access to this resource, more expensive, less appropriateand less secure sources of sand would be required. This would have subsequent adverse effects on the region’stransport networks, housing affordability, housing supply, infrastructure delivery and regional climate changemitigation measures.

Assessment of Effects on the Environment
IZ111900-EP-RPT-002 74
9.3 Section 104(1)(b)(i)
This section of the Act requires that regard is given to any relevant provisions of a national environmentalstandard.
Assessment
There are no national environmental standards relevant to the application.
9.4 Section 104(1)(b)(ii)
This section of the Act requires that regard is given to any relevant provisions of any other regulations.
Assessment
No other regulations are considered to be relevant to the application.
9.5 Section 104(1)(b)(iii)
This section of the Act requires that regard is given to any relevant provisions of a national policy statement(NPS).
Assessment
Section 9(4) of the Hauraki Gulf Marine Park Act 2000 requires consent authorities to have regard to sections 7and 8 of that Act as if they were a National Policy Statement.
Section 7 of the Act states:
“(1) The interrelationship between the Hauraki Gulf, its islands, and catchments and the ability of that interrelationship to sustain the life-supporting capacity of the environment of the Hauraki Gulf and its islands are matters of national significance.
(2) The life-supporting capacity of the environment of the Gulf and its islands includes the capacity—
(a) to provide for—
(i) the historic, traditional, cultural, and spiritual relationship of the tangata whenua of the Gulf with the Gulf and its islands; and
(ii) the social, economic, recreational, and cultural well-being of people and communities:
(b) to use the resources of the Gulf by the people and communities of the Gulf and New Zealand for economic activities and recreation;
(c) to maintain the soil, air, water, and ecosystems of the Gulf.”
The proposal is consistent with Section 7 of the Act as it will not adversely affect the life-supporting capacity ofthe Hauraki Gulf nor the matters raised in section 7(2). No more than minor adverse effects will be generated,with the majority of these effects temporary in nature. The water quality of Pakiri will be maintained, as will theexisting biodiversity values. Cultural values will also be protected, via uninterrupted access to kaimoana and the

Assessment of Effects on the Environment
IZ111900-EP-RPT-002 75
wider CMA, while the lack of erosion effects will avoid the disturbance on any onshore sites of culturalsignificance.
Furthermore, MBL’s operation is vital for the social and economic wellbeing of the community given theimportance of the sand resource to the construction sector. The high quality of the sand resource and theefficiency of its transport to Central Auckland make it vital to the delivery of affordable homes, businesspremises and infrastructure.
Section 8 of the Act states:
“To recognise the national significance of the Hauraki Gulf, its islands, and catchments, the objectives of themanagement of the Hauraki Gulf, its islands, and catchments are—
(a) the protection and, where appropriate, the enhancement of the life-supporting capacity of theenvironment of the Hauraki Gulf, its islands, and catchments:
(b) the protection and, where appropriate, the enhancement of the natural, historic, and physical resourcesof the Hauraki Gulf, its islands, and catchments:
(c) the protection and, where appropriate, the enhancement of those natural, historic, and physicalresources (including kaimoana) of the Hauraki Gulf, its islands, and catchments with which tangatawhenua have an historic, traditional, cultural, and spiritual relationship
(d) the protection of the cultural and historic associations of people and communities in and around theHauraki Gulf with its natural, historic, and physical resources:
(e) the maintenance and, where appropriate, the enhancement of the contribution of the natural, historic,and physical resources of the Hauraki Gulf, its islands, and catchments to the social and economic well-being of the people and communities of the Hauraki Gulf and New Zealand:
(f) the maintenance and, where appropriate, the enhancement of the natural, historic, and physicalresources of the Hauraki Gulf, its islands, and catchments, which contribute to the recreation andenjoyment of the Hauraki Gulf for the people and communities of the Hauraki Gulf and New Zealand.”
The extraction operation is consistent with section 8 of the Hauraki Gulf Marine Park Act 2000 Act given that itwill have no more than minor adverse effects on the Hauraki Gulf’s environment, including its natural resources,communities and cultural values. Both the ecological and landscape values of the Hauraki Gulf will be largelyunaltered by the sand extraction, while public access to the CMA and their enjoyment of the wider coastalenvironment will remain uninterrupted by the activity. MBL have also engaged with mana whenua to ensurecultural values have been taken into account during the development of this application and commissionedCVAs will be provided to Auckland Council once they become available.
9.6 Section 104(1)(b)(iv)
This section of the Act requires that regard is given to any relevant provisions of a National Coastal PolicyStatement (NZCPS).
Assessment of Effects on the Environment
IZ111900-EP-RPT-002 76
Assessment
Given the activity’s location, the NZCPS is relevant. In particular, the following objectives and policies areconsidered relevant to the current application:
Objectives 1, 2, 3, and 6;
Policies:
o Policy 1: Extent and characteristics of the coastal environment;
o Policy 2: The Treaty of Waitangi, tangata whenua and M ori;
o Policy 3: Precautionary approach;
o Policy 4: Integration;
o Policy 6: Activities in the coastal environment;
o Policy 11: Indigenous biological diversity (biodiversity);
o Policy 13: Preservation of natural character;
o Policy 15: Natural features and natural landscapes; and
o Policy 23: Discharge of contaminants.
Firstly, the proposal is consistent with the objectives and policies of the NZCPS given that the integrity, form,functioning and resilience of the coastal environment and its ecosystems are maintained. As detailed in Section6 of this AEE, the extraction activity has limited effects on biodiversity and the natural landscape at Pakiri. Whileseabed disturbance and sediment discharge does occur, these are temporary, and the local ecosystem is resilientto these activities in the CMA. There are no significant attributable effects of the existing activity on biodiversityor the wellbeing of fin fish, marine mammals or seabirds, including any at-risk or declining species.
In addition, the physical effects of the extraction on coastal forms and processes is also limited. Historicallycollected data shows that the extraction does not impact the coastal dune system, while the form and function ofthe surf breaks remain unaffected. Significant effects are avoided, while any effects caused by the presence ofMBL’s vessels or the discharge of sediment are limited to the short duration of each extraction period. Theseeffects have been further reduced and mitigated from their historical level by the introduction of the WilliamFraser. This is due to its improved efficiency in extraction (i.e. shorter and fewer times on-station at Pakiri), aswell as the change to more night-time and weekday operations. In addition, sand extraction at Pakiri has beenoccurring for more than seven decades, with the vessels operating during this time becoming part of theaccepted landscape. It is also noted that numerous other vessels transit the area, as they enter and leave the Portof Auckland or undertake commercial/recreational fishing.
MBL also recognise the cultural relationship that mana whenua have in the Pakiri area and have engaged withvarious iwi to discuss any concerns or issues associated with the extraction activity. No customary fisheries will beaffected by the activity, while access to the CMA will be maintained. Furthermore, the extraction activity will notcause any erosion of the dune system which could expose taonga or w hi tapu.
The Pakiri area is also important to the general public and local residents given its landscape and recreationalvalues. MBL’s operation does not obstruct the public’s access or enjoyment of the coastal environment, with thecontinued ability for the public to surf, fish and boat in the CMA. The extraction activity is also not a permanentactivity, with only limited time needed at Pakiri to undertake the sand extraction. Effects are further limited as noonshore facilities are needed by MBL to undertake the activity.
Assessment of Effects on the Environment
IZ111900-EP-RPT-002 77
Lastly, the extraction activity does not introduce new contaminants or human waste products into theenvironment. The discharge from MBL’s vessels is limited to sediment, biota and seawater extracted from Pakiriitself. It is processed onboard the vessels and rapidly discharged without the addition of any other material orcontaminants. On-site monitoring and testing have also shown that this discharge rapidly dissipates and doesnot affect local biodiversity.
Given the above, the proposal is consistent with the NZCPS.
9.7 Section 104(1)(b)(v)
This section of the Act requires that regard is given to any relevant provisions of a regional policy statement(RPS) or proposed regional policy statement.
Assessment
An assessment of the proposal against the RPS objectives and policies of the AUP(OP) is provided as Appendix B.In summary, the proposal is consistent with the RPS given the scale of effects generated and the importance ofthe sand resource to Auckland’s social and economic wellbeing.
9.8 Section 104(1)(b)(vi)
This section of the Act requires that regard is given to any relevant provisions of a plan or proposed plan.
Assessment
An assessment of the proposal against the relevant objectives and policies of the AUP(OP) is provided asAppendix B. In summary, the proposal is consistent with these objectives and policies, including thoseassociated with the General Coastal Marine Zone.
9.9 Section 104(1)(c)
This section of the Act requires consent authority to consider any other matter relevant and reasonablynecessary to determine the application.
9.9.1 Auckland Plan 2050
As highlighted in Section 3.2, Auckland is predicted to experience significant population growth over the next 30years, with an additional 720,000 residents living in the region at the end of this period. These residents willrequire an additional 313,000 homes based on the Auckland Plan’s focus on achieving quality compact urbanform. In order to meet this housing demand, while also achieving the desired urban form, an affordable andsecure supply of concrete is needed.
Pakiri is an appropriate source for construction sand and it can be provided without the adverse effects ontransport networks and the Auckland Plan’s climate change objectives which other sources have. Furthermore,the proposed extraction activity can be undertaken in a manner which avoids significant effects on the naturalenvironment or cultural values, thereby recognizing the Auckland Plan’s wider environmental objectives.
Given these factors, the proposal is consistent with the Auckland Plan.

Assessment of Effects on the Environment
IZ111900-EP-RPT-002 78
9.9.2 Hauraki Gulf Marine Spatial Plan
It is noted that the proposal is consistent with the desired outcomes of the Hauraki Gulf Marine Spatial Plan. Inparticular, it does not affect the biodiversity of the wider Hauraki Gulf, with limited effects on marine species andthe provision of adequate food sources for seabirds, fish and marine mammals. As such, both commercial andrecreational fish populations will be largely unaffected, while the conservation status of at risk, endangered ordeclining species will also be unaffected.
Minimal habitat disturbance will be caused, with local benthic populations readily able to recolonise any dredgedareas. This disturbance and associated surface discharge will have limited temporary effects, with any plumesrapidly dispersing back in the receiving environment. Any discharges will not contain significant concentrationsof contaminants and do not pose a risk to local fauna.
Lastly, engagement with mana whenua has also been undertaken in recognition of the cultural values or Pakiriand in the spirit of kaitiakitanga. This has included the commissioning of CVAs, as well as recognising the Treatyclaims and CMT applications present in the area.
9.10 Consent duration
Given the no more than minor adverse effects generated by the extraction activity as demonstrated by thesupporting technical assessments, the use of standard consent conditions and the strategic importance of thesand resource to Auckland, MBL seek consent durations of 35 years for both the coastal permit and dischargepermit.
MBL has demonstrated that the extraction activity can occur for this duration without generating significanteffects on the local environment, with the use of regular monitoring to ensure that the effects of the activity donot exceed those described in the application. Furthermore, MBL agree to the imposition of a condition undersection 128 which allows Auckland Council to review the consents should any issues arise during the duration ofthe consents. Such a condition has been included in the draft conditions set (Appendix F).
9.11 Sections 105 and 107
It is also noted that s105 and s107 of the RMA address discharge applications. In particular, s105 states that adischarge permit under s15 of the RMA must have regard to:
(a) the nature of the discharge and the sensitivity of the receiving environment to adverse effects; and
(b) the applicant’s reasons for the proposed choice; and
(c) any possible alternative methods of discharge, including discharge into any other receiving environment.
As addressed by this AEE and the associated water quality assessment, the discharge associated with the sandextraction does not contain any noticeable levels of contaminants. The ecological assessments by Cawthron,NIWA and Bioresearches further note that the local environment can receive this discharge without significanteffects given its transitory nature and the lack of contaminants.
Lastly, no practicable alternatives exist for the discharge. Without undertaking a discharge directly afterdredging, a much larger vessel would be required to carry the volume of target sand, unwanted material andseawater which is collected during the extraction process.
Section 107 states that a discharge shall not generate the following effects:
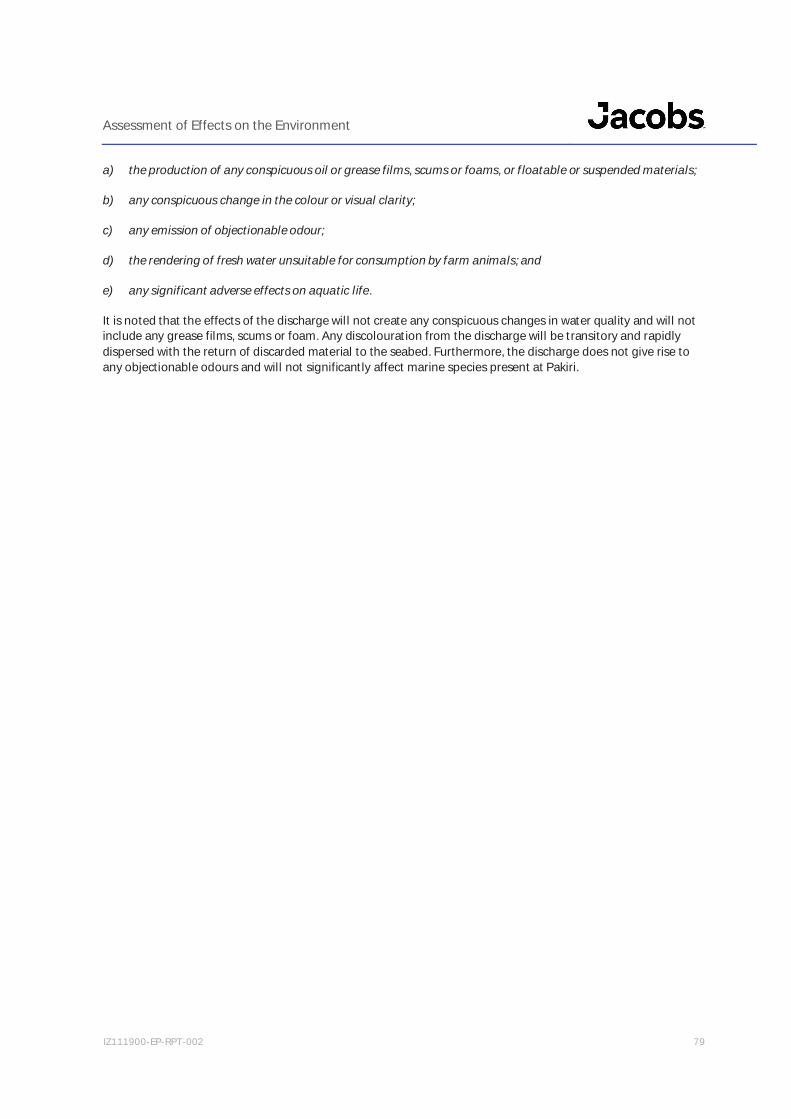
Assessment of Effects on the Environment
IZ111900-EP-RPT-002 79
a) the production of any conspicuous oil or grease films, scums or foams, or floatable or suspended materials;
b) any conspicuous change in the colour or visual clarity;
c) any emission of objectionable odour;
d) the rendering of fresh water unsuitable for consumption by farm animals; and
e) any significant adverse effects on aquatic life.
It is noted that the effects of the discharge will not create any conspicuous changes in water quality and will notinclude any grease films, scums or foam. Any discolouration from the discharge will be transitory and rapidlydispersed with the return of discarded material to the seabed. Furthermore, the discharge does not give rise toany objectionable odours and will not significantly affect marine species present at Pakiri.
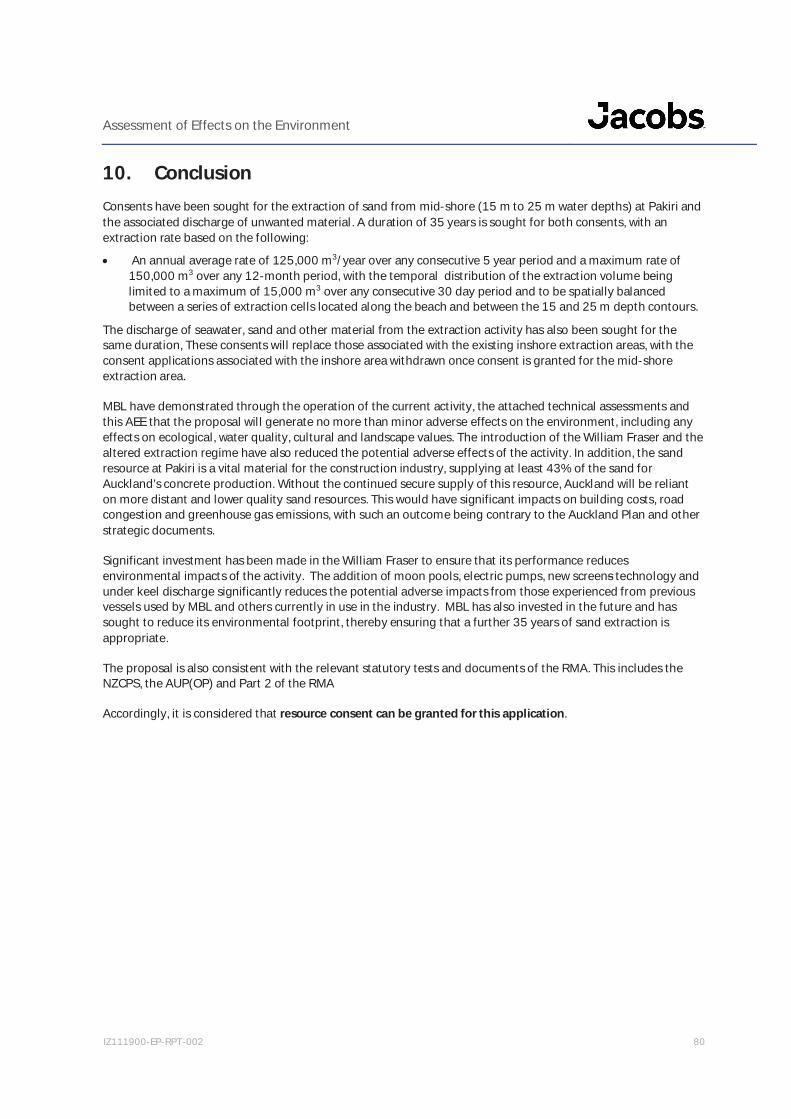
Assessment of Effects on the Environment
IZ111900-EP-RPT-002 80
10. ConclusionConsents have been sought for the extraction of sand from mid-shore (15 m to 25 m water depths) at Pakiri andthe associated discharge of unwanted material. A duration of 35 years is sought for both consents, with anextraction rate based on the following:
An annual average rate of 125,000 m3/year over any consecutive 5 year period and a maximum rate of150,000 m3 over any 12-month period, with the temporal distribution of the extraction volume beinglimited to a maximum of 15,000 m3 over any consecutive 30 day period and to be spatially balancedbetween a series of extraction cells located along the beach and between the 15 and 25 m depth contours.
The discharge of seawater, sand and other material from the extraction activity has also been sought for thesame duration, These consents will replace those associated with the existing inshore extraction areas, with theconsent applications associated with the inshore area withdrawn once consent is granted for the mid-shoreextraction area.
MBL have demonstrated through the operation of the current activity, the attached technical assessments andthis AEE that the proposal will generate no more than minor adverse effects on the environment, including anyeffects on ecological, water quality, cultural and landscape values. The introduction of the William Fraser and thealtered extraction regime have also reduced the potential adverse effects of the activity. In addition, the sandresource at Pakiri is a vital material for the construction industry, supplying at least 43% of the sand forAuckland’s concrete production. Without the continued secure supply of this resource, Auckland will be relianton more distant and lower quality sand resources. This would have significant impacts on building costs, roadcongestion and greenhouse gas emissions, with such an outcome being contrary to the Auckland Plan and otherstrategic documents.
Significant investment has been made in the William Fraser to ensure that its performance reducesenvironmental impacts of the activity. The addition of moon pools, electric pumps, new screens technology andunder keel discharge significantly reduces the potential adverse impacts from those experienced from previousvessels used by MBL and others currently in use in the industry. MBL has also invested in the future and hassought to reduce its environmental footprint, thereby ensuring that a further 35 years of sand extraction isappropriate.
The proposal is also consistent with the relevant statutory tests and documents of the RMA. This includes theNZCPS, the AUP(OP) and Part 2 of the RMA
Accordingly, it is considered that resource consent can be granted for this application.

Assessment of Effects on the Environment
IZ111900-EP-RPT-002
Appendix A. Previous Consent Conditions

Assessment of Effects on the Environment
IZ111900-EP-RPT-002
Appendix B. Objectives and Policies

Assessment of Effects on the Environment
IZ111900-EP-RPT-002
CHAPTER B – REGIONAL POLICY STATEMENT
Reference Objective/Policy Is theProposalConsistent?
Comment
B4 – Natural Heritage
Objective B4.2.1 (1) Outstanding natural features and landscapes areidentified and protected from inappropriatesubdivision, use and development.(2) The ancestral relationships of Mana Whenua andtheir culture and traditions with the landscapes andnatural features of Auckland are recognised andprovided for.
Yes As demonstrated by the landscape assessment (Appendix M) and discussed in theAEE (Section 6.10), the proposal is considered to have no adverse effects on thelandscape values at Pakiri, noting that the proposed mid-shore extraction area islocated outside of both the ONL and HNC overlays.This assessment of landscape effects is supported by MBL’s proposal to move theextraction operations towards more night-time and weekday periods, which limitsthe potential audience for the activity. Furthermore, the efficiency of the WilliamFraser (as opposed to earlier vessels) reduces the time needed at Pakiri tocomplete dredging.Further to the immediate visual effects associated with the operation of theextraction vessels in the inshore environment, the onshore landscape will also belargely unaffected by the activity. As discussed in the coastal processes report(Section 6.4), the proposed extraction levels will not accelerate natural coastalerosion at Pakiri. This will ensure that the coastal dune system and surf breaks willcontinue to contribute to the natural character of Pakiri and retain their own form.Lastly, it is also recognised that no onshore facilities are required at Pakiri for MBLto continue sand extraction.Ongoing erosion monitoring is also proposed to ensure that effects on landscapevalues from erosion are avoided.Finally, MBL have commissioned two CVAs and these will be provided oncecomplete. It is also noted that the lack of physical effects on the landscape willavoid the disturbance of any culturally significant sites within the dune system orfurther onshore.
Policy B4.2.2 (8) Manage outstanding natural landscapes andoutstanding natural features in an integratedmanner to protect and, where practicable andappropriate, enhance their values.

Assessment of Effects on the Environment
IZ111900-EP-RPT-002
CHAPTER B – REGIONAL POLICY STATEMENT
Reference Objective/Policy Is theProposalConsistent?
Comment
B6 – Mana Whenua
Objective B6.3.1 (1) Mana Whenua values, m tauranga and tikangaare properly reflected and accorded sufficientweight in resource management decision-making.
(2) The mauri of, and the relationship of ManaWhenua with, natural and physical resourcesincluding freshwater, geothermal resources, land, airand coastal resources are enhanced overall.
(3) The relationship of Mana Whenua and theircustoms and traditions with natural and physicalresources that have been scheduled in the UnitaryPlan in relation to natural heritage, natural resourcesor historic heritage values is recognised andprovided for.
Yes MBL has engaged with mana whenua, including those iwi who have statutoryacknowledgement areas at Pakiri and those who have an interest in the arearegistered with Auckland Council. In addition, MBL have contacted the CMTapplicants for the Pakiri area.It is acknowledged that the Hauraki Gulf is culturally significant to mana whenua,including its importance for food gathering and as a traditional transport route.However, the extraction activity will not affect kaimoana resources at Pakiri, whileuninterrupted access to the CMA will continue.As discussed above, the lack of coastal erosion effects will also avoid impacts onany onshore culturally significant sites or taonga. Both forestry blocks (as owned bytwo iwi) will also be unaffected by the extraction activity.In recognition of the broader cultural values associated with Pakiri, two CVAs havebeen commissioned. Any assessment of effects on the mauri of Pakiri and othercultural aspects will be undertaken once the CVAs for extraction from the new areaare received.
Policy B6.3.2 (1) Enable Mana Whenua to identify their valuesassociated with all of the following:(a) ancestral lands, water, air, sites, w hi tapu, andother taonga;(b) freshwater, including rivers, streams, aquifers,lakes, wetlands, and associated values;(c) biodiversity;(d) historic heritage places and areas; and
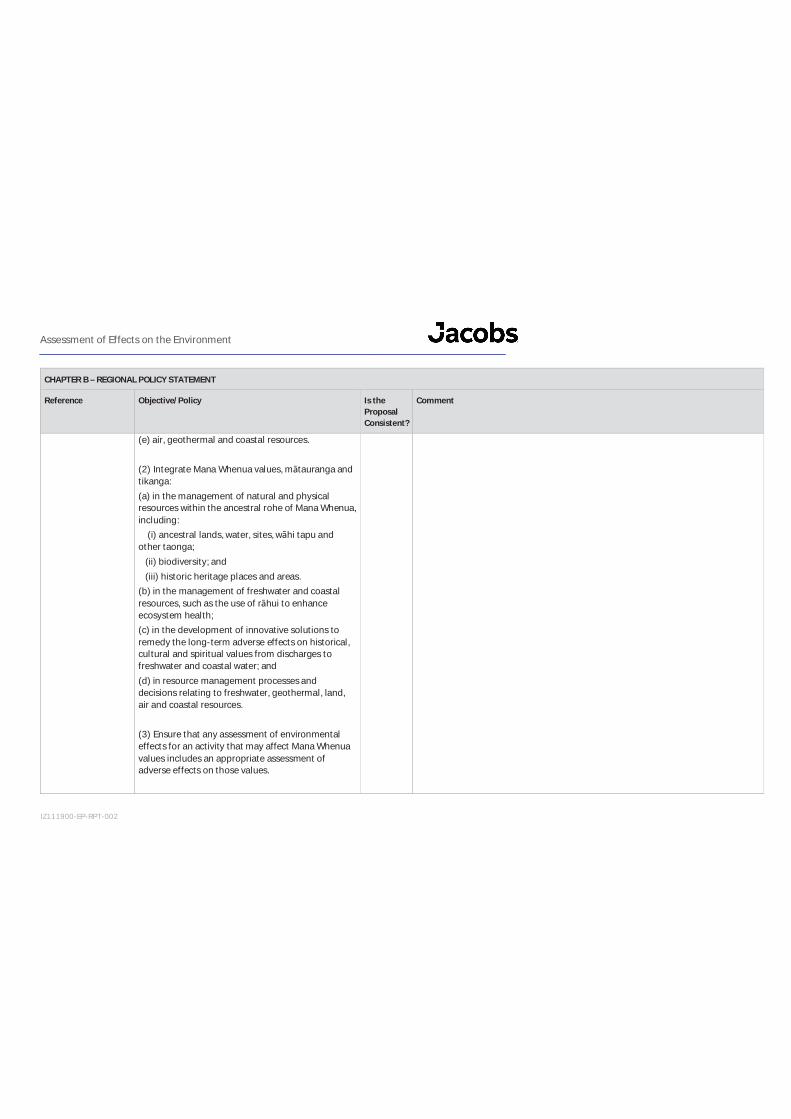
Assessment of Effects on the Environment
IZ111900-EP-RPT-002
CHAPTER B – REGIONAL POLICY STATEMENT
Reference Objective/Policy Is theProposalConsistent?
Comment
(e) air, geothermal and coastal resources.
(2) Integrate Mana Whenua values, m tauranga andtikanga:(a) in the management of natural and physicalresources within the ancestral rohe of Mana Whenua,including: (i) ancestral lands, water, sites, w hi tapu andother taonga; (ii) biodiversity; and (iii) historic heritage places and areas.(b) in the management of freshwater and coastalresources, such as the use of r hui to enhanceecosystem health;(c) in the development of innovative solutions toremedy the long-term adverse effects on historical,cultural and spiritual values from discharges tofreshwater and coastal water; and(d) in resource management processes anddecisions relating to freshwater, geothermal, land,air and coastal resources.
(3) Ensure that any assessment of environmentaleffects for an activity that may affect Mana Whenuavalues includes an appropriate assessment ofadverse effects on those values.
Assessment of Effects on the Environment
IZ111900-EP-RPT-002
CHAPTER B – REGIONAL POLICY STATEMENT
Reference Objective/Policy Is theProposalConsistent?
Comment
(4) Provide opportunities for Mana Whenua to beinvolved in the integrated management of naturaland physical resources in ways that do all of thefollowing:(a) recognise the holistic nature of the ManaWhenua world view;(b) recognise any protected customary right inaccordance with the Marine and Coastal Area(Takutai Moana) Act 2011; and(c) restore or enhance the mauri of freshwater andcoastal ecosystems.
(6) Require resource management decisions to haveparticular regard to potential impacts on all of thefollowing:(a) the holistic nature of the Mana Whenua(b) the exercise of kaitiakitanga;(c) mauri, particularly in relation to freshwater andcoastal resources;(d) customary activities, including mahinga kai;(e) sites and areas with significant spiritual orcultural heritage value to Mana Whenua; and(f) any protected customary right in accordance withthe Marine and Coastal Area (Takutai Moana) Act2011.

Assessment of Effects on the Environment
IZ111900-EP-RPT-002
CHAPTER B – REGIONAL POLICY STATEMENT
Reference Objective/Policy Is theProposalConsistent?
Comment
B7 – Natural Resources
Objective B7.2.1 (1) Areas of significant indigenous biodiversity valuein terrestrial, freshwater, and coastal marine areasare protected from the adverse effects ofsubdivision, use and development.
(2) Indigenous biodiversity is maintained throughprotection, restoration and enhancement in areaswhere ecological values are degraded, or wheredevelopment is occurring.
YesIt is noted that the proposed mid-shore extraction area is located outside any SEAsidentified by the AUP(OP). Furthermore, no reefs or any coral were identified in thestudy area. Additionally, no unique or endangered benthic species were found toinhabit the extraction areas.
The assessments undertaken by Bioresearches, Cawthron and NIWA (Appendix K,Appendix L and Appendix N) have identified that the proposed activity will have nomore than minor effects on ecological values.The seabed within the extraction areas is a rapidly changing environment, givencurrents and wave energy, with populations of mobile marine fauna. While somebenthic organisms and seabed dwelling fin fish species may experience increasedmortality due to capture within the draghead, overall biodiversity remains largelyunaffected through the relatively rapid re-colonisation of disturbed areas.Larger marine species, such as sharks and mammals, are also largely unaffectedgiven their own transitory behaviour, the low noise levels emitted by MBL’s vesselsand the retention of adequate food sources within the extraction areas.Local bird populations are also largely unaffected by the extraction activity. With amove to more night-time operations, effects on daytime feeding bird species willbe avoided, while lighting controls will limit effects on any night-time activespecies.It is also noted that the lack of coastal erosion effects avoids effects on onshorefeeding and roosting habitats, while the limited effects on benthic and fin fishspecies also ensures that adequate food sources are retained in the Pakiri for theselarger animal species.
Policy B7.2.2 (5) Avoid adverse effects on areas listed in theSchedule 3 of Significant Ecological Areas –Terrestrial Schedule and Schedule 4 SignificantEcological Areas – Marine Schedule.
Objective B7.4.1 (1) Coastal water, freshwater and geothermal waterare used within identified limits while safeguarding
Yes During the extraction activity, excess seawater and unwanted extracted materials(e.g. silt) will be discharged back into coastal waters. These discharges will not
Assessment of Effects on the Environment
IZ111900-EP-RPT-002
CHAPTER B – REGIONAL POLICY STATEMENT
Reference Objective/Policy Is theProposalConsistent?
Comment
the life-supporting capacity and the natural, socialand cultural values of the waters.
(2) The quality of freshwater and coastal water ismaintained where it is excellent or good andprogressively improved over time where it isdegraded.
(6) Mana Whenua values, m tauranga and tikangaassociated with coastal water, freshwater andgeothermal water are recognised and provided for,including their traditional and cultural uses andvalues.
include any materials that are not already present at Pakiri (e.g. no fuels or foreignsediments).The water quality assessment (Appendix H) has demonstrated that this materialreadily disperses and settles on the seabed within a short period of time anddistance from MBL’s vessels.This discharge does not degrade the water quality values of Pakiri nor cause anysignificant effects on the area’s ecological values.
Policy B7.4.2 (7) Manage the discharges of contaminants intowater from subdivision, use and development toavoid where practicable, and otherwise minimise, allof the following:(b) adverse effects on the quality of freshwater andcoastal water;(c) adverse effects from contaminants, includingnutrients generated on or applied to land, and thepotential for these to enter freshwater and coastalwater from both point and non-point sources;(d) adverse effects on Mana Whenua valuesassociated with coastal water, freshwater andgeothermal water, including w hi tapu, w hi taongaand mahinga kai;
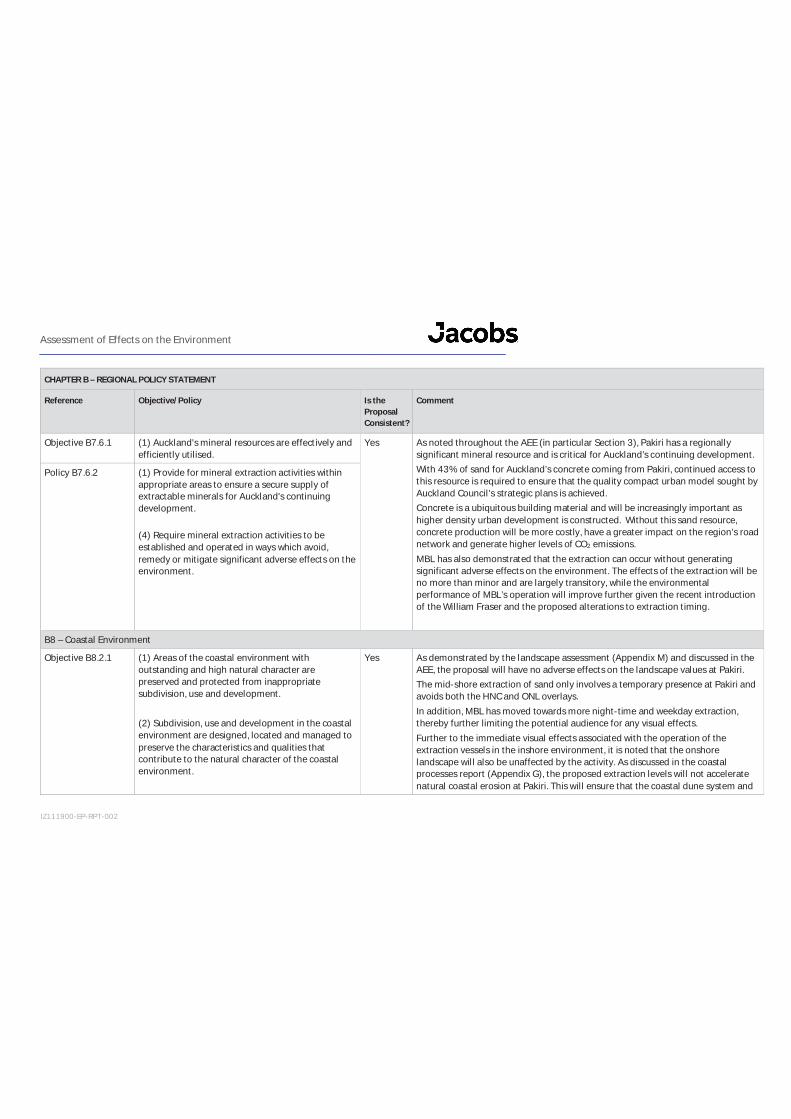
Assessment of Effects on the Environment
IZ111900-EP-RPT-002
CHAPTER B – REGIONAL POLICY STATEMENT
Reference Objective/Policy Is theProposalConsistent?
Comment
Objective B7.6.1 (1) Auckland's mineral resources are effectively andefficiently utilised.
Yes As noted throughout the AEE (in particular Section 3), Pakiri has a regionallysignificant mineral resource and is critical for Auckland’s continuing development.With 43% of sand for Auckland’s concrete coming from Pakiri, continued access tothis resource is required to ensure that the quality compact urban model sought byAuckland Council’s strategic plans is achieved.Concrete is a ubiquitous building material and will be increasingly important ashigher density urban development is constructed. Without this sand resource,concrete production will be more costly, have a greater impact on the region’s roadnetwork and generate higher levels of CO2 emissions.MBL has also demonstrated that the extraction can occur without generatingsignificant adverse effects on the environment. The effects of the extraction will beno more than minor and are largely transitory, while the environmentalperformance of MBL’s operation will improve further given the recent introductionof the William Fraser and the proposed alterations to extraction timing.
Policy B7.6.2 (1) Provide for mineral extraction activities withinappropriate areas to ensure a secure supply ofextractable minerals for Auckland's continuingdevelopment.
(4) Require mineral extraction activities to beestablished and operated in ways which avoid,remedy or mitigate significant adverse effects on theenvironment.
B8 – Coastal Environment
Objective B8.2.1 (1) Areas of the coastal environment withoutstanding and high natural character arepreserved and protected from inappropriatesubdivision, use and development.
(2) Subdivision, use and development in the coastalenvironment are designed, located and managed topreserve the characteristics and qualities thatcontribute to the natural character of the coastalenvironment.
Yes As demonstrated by the landscape assessment (Appendix M) and discussed in theAEE, the proposal will have no adverse effects on the landscape values at Pakiri.The mid-shore extraction of sand only involves a temporary presence at Pakiri andavoids both the HNC and ONL overlays.In addition, MBL has moved towards more night-time and weekday extraction,thereby further limiting the potential audience for any visual effects.Further to the immediate visual effects associated with the operation of theextraction vessels in the inshore environment, it is noted that the onshorelandscape will also be unaffected by the activity. As discussed in the coastalprocesses report (Appendix G), the proposed extraction levels will not acceleratenatural coastal erosion at Pakiri. This will ensure that the coastal dune system and
Assessment of Effects on the Environment
IZ111900-EP-RPT-002
CHAPTER B – REGIONAL POLICY STATEMENT
Reference Objective/Policy Is theProposalConsistent?
Comment
(3) Where practicable, in the coastal environmentareas with degraded natural character are restoredor rehabilitated and areas of high and outstandingnatural character are enhanced.
surf breaks will continue to contribute to the natural character of Pakiri and retaintheir own form. It is also recognised that no onshore facilities are required at Pakirifor MBL to continue sand extraction.Lastly ongoing erosion monitoring is proposed to ensure that effects on landscapevalues from erosion are avoided.Policy B8.2.2 (3) Preserve and protect areas of outstanding
natural character and high natural character frominappropriate subdivision, use and development by:(a) avoiding adverse effects of activities on naturalcharacter in areas of the coastal environmentscheduled as outstanding natural character; and(b) avoiding significant adverse effects and avoid,remedy or mitigate other adverse effects of activitieson natural character in all other areas of the coastalenvironment.
(4) Avoid significant adverse effects and avoid,remedy or mitigate other adverse effects on naturalcharacter of the coastal environment not identifiedas outstanding natural character and high naturalcharacter from inappropriate subdivision, use anddevelopment.
Objective B8.3.1 (1) Subdivision, use and development in the coastalenvironment are located in appropriate places andare of an appropriate form and within appropriatelimits, taking into account the range of uses andvalues of the coastal environment.
Yes MBL’s operation has a functional and operational requirement to operate in thecoastal environment. This is where the sand resource is most easily accessed, is of ahigh quality and can be transported to market with the least environmental effects.
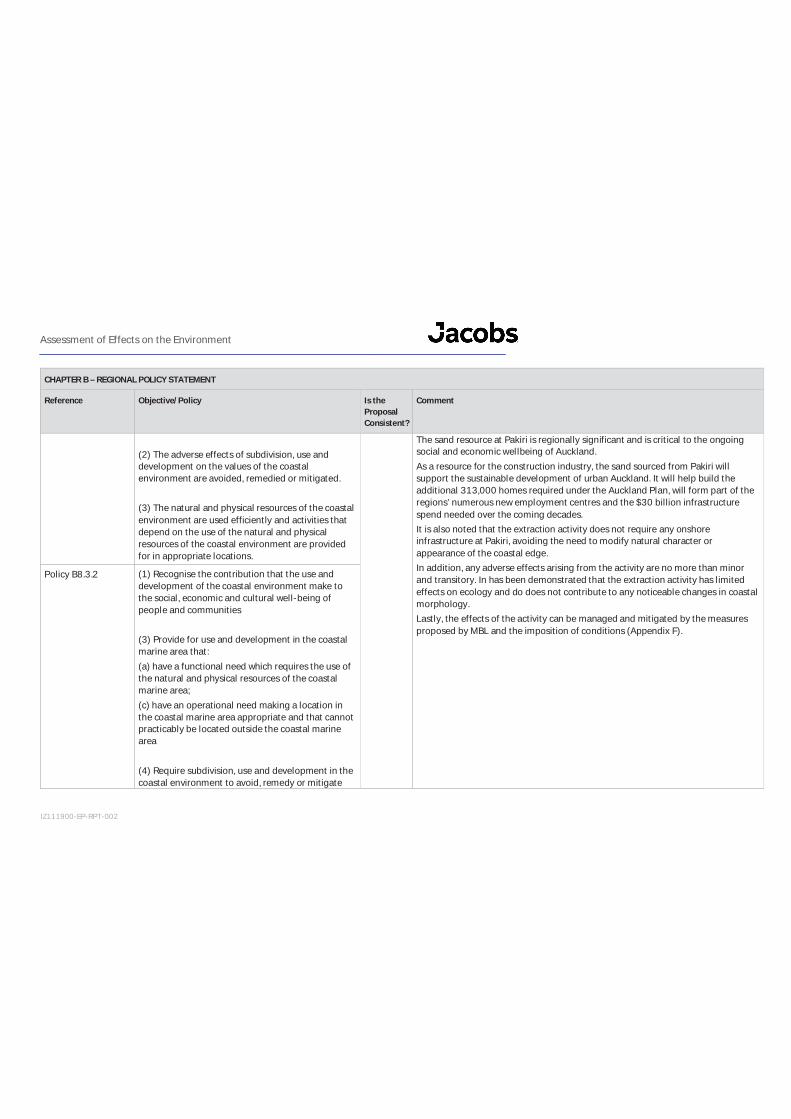
Assessment of Effects on the Environment
IZ111900-EP-RPT-002
CHAPTER B – REGIONAL POLICY STATEMENT
Reference Objective/Policy Is theProposalConsistent?
Comment
(2) The adverse effects of subdivision, use anddevelopment on the values of the coastalenvironment are avoided, remedied or mitigated.
(3) The natural and physical resources of the coastalenvironment are used efficiently and activities thatdepend on the use of the natural and physicalresources of the coastal environment are providedfor in appropriate locations.
The sand resource at Pakiri is regionally significant and is critical to the ongoingsocial and economic wellbeing of Auckland.As a resource for the construction industry, the sand sourced from Pakiri willsupport the sustainable development of urban Auckland. It will help build theadditional 313,000 homes required under the Auckland Plan, will form part of theregions’ numerous new employment centres and the $30 billion infrastructurespend needed over the coming decades.It is also noted that the extraction activity does not require any onshoreinfrastructure at Pakiri, avoiding the need to modify natural character orappearance of the coastal edge.In addition, any adverse effects arising from the activity are no more than minorand transitory. In has been demonstrated that the extraction activity has limitedeffects on ecology and do does not contribute to any noticeable changes in coastalmorphology.Lastly, the effects of the activity can be managed and mitigated by the measuresproposed by MBL and the imposition of conditions (Appendix F).
Policy B8.3.2 (1) Recognise the contribution that the use anddevelopment of the coastal environment make tothe social, economic and cultural well-being ofpeople and communities
(3) Provide for use and development in the coastalmarine area that:(a) have a functional need which requires the use ofthe natural and physical resources of the coastalmarine area;(c) have an operational need making a location inthe coastal marine area appropriate and that cannotpracticably be located outside the coastal marinearea
(4) Require subdivision, use and development in thecoastal environment to avoid, remedy or mitigate
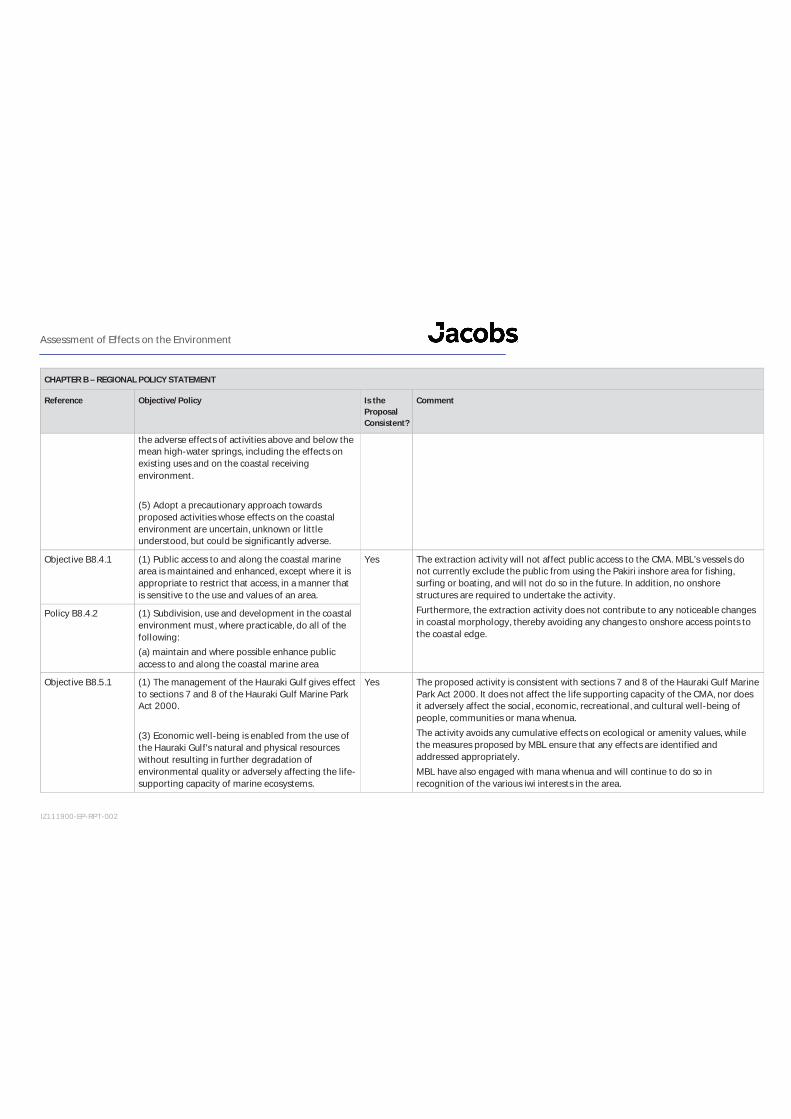
Assessment of Effects on the Environment
IZ111900-EP-RPT-002
CHAPTER B – REGIONAL POLICY STATEMENT
Reference Objective/Policy Is theProposalConsistent?
Comment
the adverse effects of activities above and below themean high-water springs, including the effects onexisting uses and on the coastal receivingenvironment.
(5) Adopt a precautionary approach towardsproposed activities whose effects on the coastalenvironment are uncertain, unknown or littleunderstood, but could be significantly adverse.
Objective B8.4.1 (1) Public access to and along the coastal marinearea is maintained and enhanced, except where it isappropriate to restrict that access, in a manner thatis sensitive to the use and values of an area.
Yes The extraction activity will not affect public access to the CMA. MBL’s vessels donot currently exclude the public from using the Pakiri inshore area for fishing,surfing or boating, and will not do so in the future. In addition, no onshorestructures are required to undertake the activity.Furthermore, the extraction activity does not contribute to any noticeable changesin coastal morphology, thereby avoiding any changes to onshore access points tothe coastal edge.
Policy B8.4.2 (1) Subdivision, use and development in the coastalenvironment must, where practicable, do all of thefollowing:(a) maintain and where possible enhance publicaccess to and along the coastal marine area
Objective B8.5.1 (1) The management of the Hauraki Gulf gives effectto sections 7 and 8 of the Hauraki Gulf Marine ParkAct 2000.
(3) Economic well-being is enabled from the use ofthe Hauraki Gulf's natural and physical resourceswithout resulting in further degradation ofenvironmental quality or adversely affecting the life-supporting capacity of marine ecosystems.
Yes The proposed activity is consistent with sections 7 and 8 of the Hauraki Gulf MarinePark Act 2000. It does not affect the life supporting capacity of the CMA, nor doesit adversely affect the social, economic, recreational, and cultural well-being ofpeople, communities or mana whenua.The activity avoids any cumulative effects on ecological or amenity values, whilethe measures proposed by MBL ensure that any effects are identified andaddressed appropriately.MBL have also engaged with mana whenua and will continue to do so inrecognition of the various iwi interests in the area.
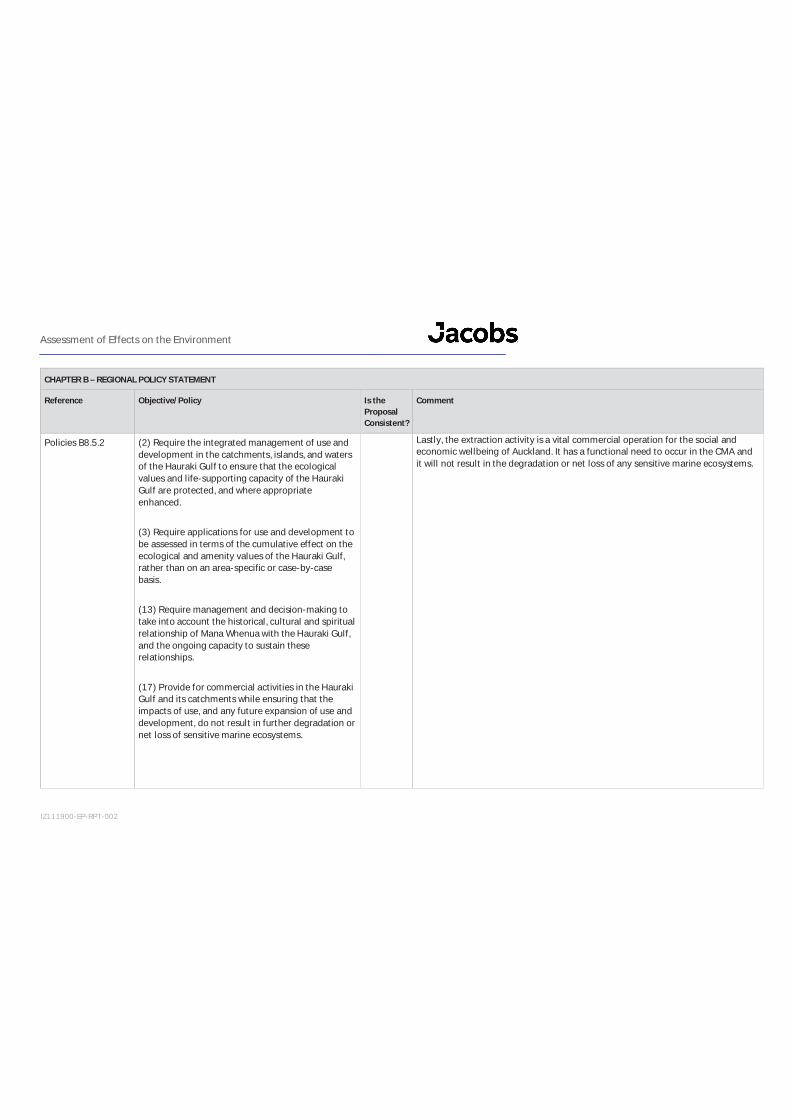
Assessment of Effects on the Environment
IZ111900-EP-RPT-002
CHAPTER B – REGIONAL POLICY STATEMENT
Reference Objective/Policy Is theProposalConsistent?
Comment
Policies B8.5.2 (2) Require the integrated management of use anddevelopment in the catchments, islands, and watersof the Hauraki Gulf to ensure that the ecologicalvalues and life-supporting capacity of the HaurakiGulf are protected, and where appropriateenhanced.
(3) Require applications for use and development tobe assessed in terms of the cumulative effect on theecological and amenity values of the Hauraki Gulf,rather than on an area-specific or case-by-casebasis.
(13) Require management and decision-making totake into account the historical, cultural and spiritualrelationship of Mana Whenua with the Hauraki Gulf,and the ongoing capacity to sustain theserelationships.
(17) Provide for commercial activities in the HaurakiGulf and its catchments while ensuring that theimpacts of use, and any future expansion of use anddevelopment, do not result in further degradation ornet loss of sensitive marine ecosystems.
Lastly, the extraction activity is a vital commercial operation for the social andeconomic wellbeing of Auckland. It has a functional need to occur in the CMA andit will not result in the degradation or net loss of any sensitive marine ecosystems.

Assessment of Effects on the Environment
IZ111900-EP-RPT-002
CHAPTER B – REGIONAL POLICY STATEMENT
Reference Objective/Policy Is theProposalConsistent?
Comment
B10 – Environmental Risk
B10.2.1 (2) The risks to people, property, infrastructure andthe environment from natural hazards are notincreased in existing developed areas.
(3) New subdivision, use and development avoid thecreation of new risks to people, property andinfrastructure.
(4) The effects of climate change on natural hazards,including effects on sea level rise and on thefrequency and severity of storm events, isrecognised and provided for.
Yes As noted by the coastal processes assessment, the activity will not increase the riskof natural hazards (i.e. erosion or storm surge) affecting either the landscapefeatures that contribute to the area’s natural character or the risks to dwellings andinfrastructure.Any potential issues with increased beach erosion (due to the increased frequencyand severity of storm events) will be captured through regular erosion monitoringand the ability to modify the parameters of the activity via a review conditionimposed under s128 of the RMA.
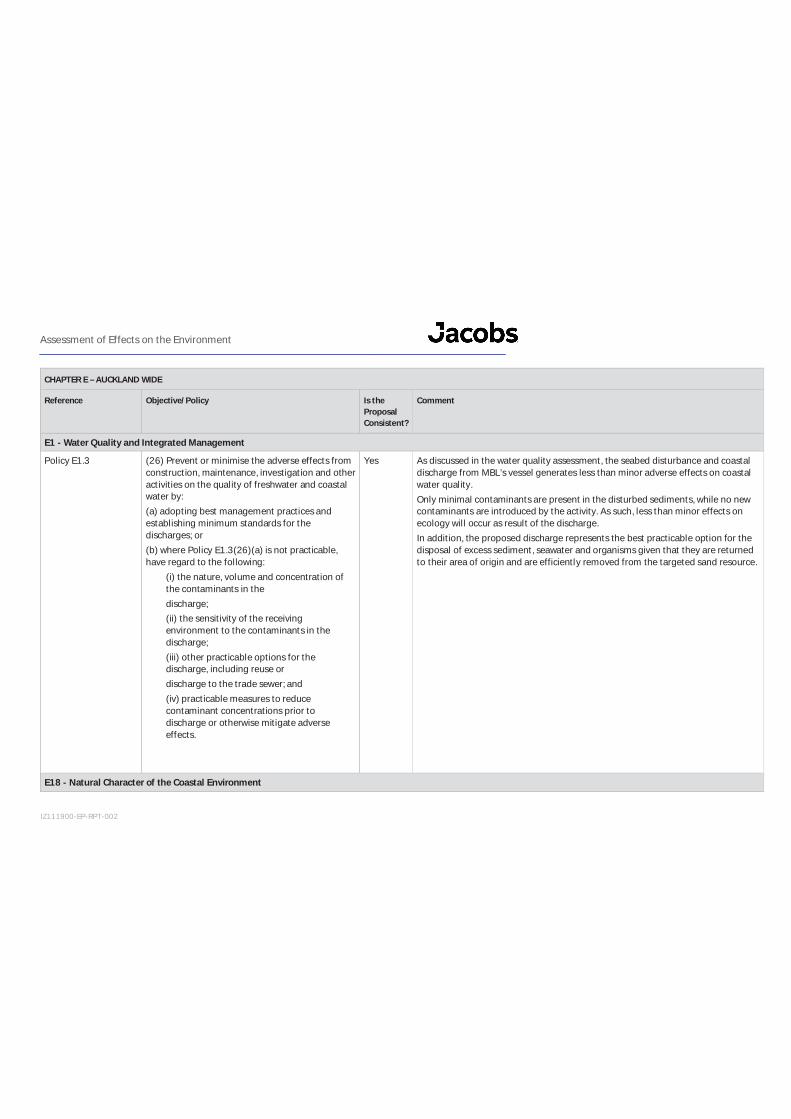
Assessment of Effects on the Environment
IZ111900-EP-RPT-002
CHAPTER E – AUCKLAND WIDE
Reference Objective/Policy Is theProposalConsistent?
Comment
E1 - Water Quality and Integrated Management
Policy E1.3 (26) Prevent or minimise the adverse effects fromconstruction, maintenance, investigation and otheractivities on the quality of freshwater and coastalwater by:(a) adopting best management practices andestablishing minimum standards for thedischarges; or(b) where Policy E1.3(26)(a) is not practicable,have regard to the following:
(i) the nature, volume and concentration ofthe contaminants in thedischarge;(ii) the sensitivity of the receivingenvironment to the contaminants in thedischarge;(iii) other practicable options for thedischarge, including reuse ordischarge to the trade sewer; and(iv) practicable measures to reducecontaminant concentrations prior todischarge or otherwise mitigate adverseeffects.
Yes As discussed in the water quality assessment, the seabed disturbance and coastaldischarge from MBL’s vessel generates less than minor adverse effects on coastalwater quality.Only minimal contaminants are present in the disturbed sediments, while no newcontaminants are introduced by the activity. As such, less than minor effects onecology will occur as result of the discharge.In addition, the proposed discharge represents the best practicable option for thedisposal of excess sediment, seawater and organisms given that they are returnedto their area of origin and are efficiently removed from the targeted sand resource.
E18 - Natural Character of the Coastal Environment
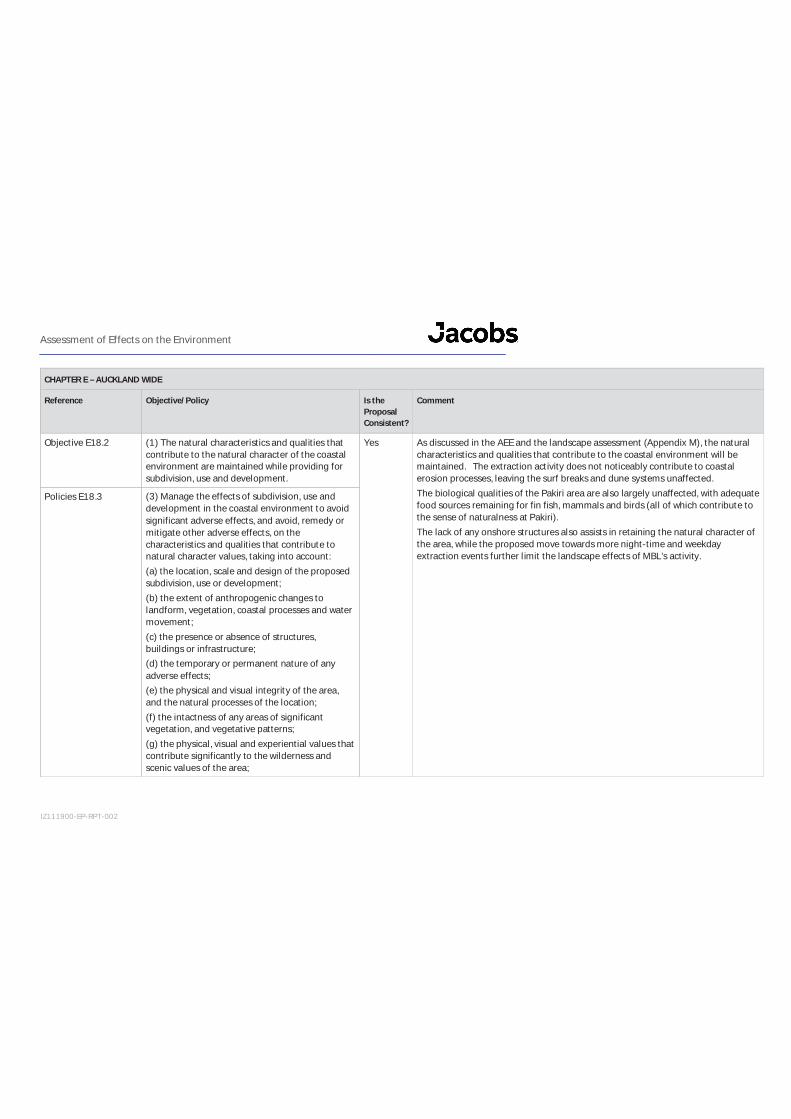
Assessment of Effects on the Environment
IZ111900-EP-RPT-002
CHAPTER E – AUCKLAND WIDE
Reference Objective/Policy Is theProposalConsistent?
Comment
Objective E18.2 (1) The natural characteristics and qualities thatcontribute to the natural character of the coastalenvironment are maintained while providing forsubdivision, use and development.
Yes As discussed in the AEE and the landscape assessment (Appendix M), the naturalcharacteristics and qualities that contribute to the coastal environment will bemaintained. The extraction activity does not noticeably contribute to coastalerosion processes, leaving the surf breaks and dune systems unaffected.The biological qualities of the Pakiri area are also largely unaffected, with adequatefood sources remaining for fin fish, mammals and birds (all of which contribute tothe sense of naturalness at Pakiri).The lack of any onshore structures also assists in retaining the natural character ofthe area, while the proposed move towards more night-time and weekdayextraction events further limit the landscape effects of MBL’s activity.
Policies E18.3 (3) Manage the effects of subdivision, use anddevelopment in the coastal environment to avoidsignificant adverse effects, and avoid, remedy ormitigate other adverse effects, on thecharacteristics and qualities that contribute tonatural character values, taking into account:(a) the location, scale and design of the proposedsubdivision, use or development;(b) the extent of anthropogenic changes tolandform, vegetation, coastal processes and watermovement;(c) the presence or absence of structures,buildings or infrastructure;(d) the temporary or permanent nature of anyadverse effects;(e) the physical and visual integrity of the area,and the natural processes of the location;(f) the intactness of any areas of significantvegetation, and vegetative patterns;(g) the physical, visual and experiential values thatcontribute significantly to the wilderness andscenic values of the area;

Assessment of Effects on the Environment
IZ111900-EP-RPT-002
CHAPTER E – AUCKLAND WIDE
Reference Objective/Policy Is theProposalConsistent?
Comment
(h) the integrity of landforms, geological featuresand associated natural processes, includingsensitive landforms such as ridgelines, headlands,peninsulas, cliffs, dunes, wetlands, reefs,freshwater springs, streams, rivers and surf breaks;(i) the natural characteristics and qualities thatexist or operate across mean high-water springand land in the coastal environment, includingprocesses of sediment transport, patterns oferosion and deposition, substrate composition andmovement of biota, including between marine andfreshwater environments.
E19 - Natural Features and Natural landscapes in the Coastal Environment
Objective E19.2 (1) The characteristics and qualities of naturallandscapes and natural features which haveparticular values, provide a sense of place oridentity, or have high amenity value, aremaintained while providing for subdivision, useand development in the coastal environment.
Yes As noted in the assessment of Objective E18.2 and Policies E18.3, thecharacteristics and qualities of the natural landscape will be maintained.No onshore changes to landforms are proposed, either from the extraction activityitself or the construction of any related infrastructure. The lack of related effectsassists in maintaining the ecological linkages between the sea and the shore,including protecting the breeding and feeding areas of seabirds and shore birds.The ongoing extraction will also be monitored, via the EMMP, to ensure that anychanges to coastal features are identified and modifications to the extractionactivity undertaken to prevent effects on landscape values.In addition, the use of a modified extraction schedule and the improved efficiencyof the William Fraser will assist in the protection of Pakiri’s natural character.
Policies E19.3 (1) Manage subdivision, use and development inthe coastal environment adjoining scheduledoutstanding natural landscapes or outstandingnatural features to:(a) protect visual and biophysical linkagesbetween the site and outstanding naturallandscapes or outstanding natural features; and
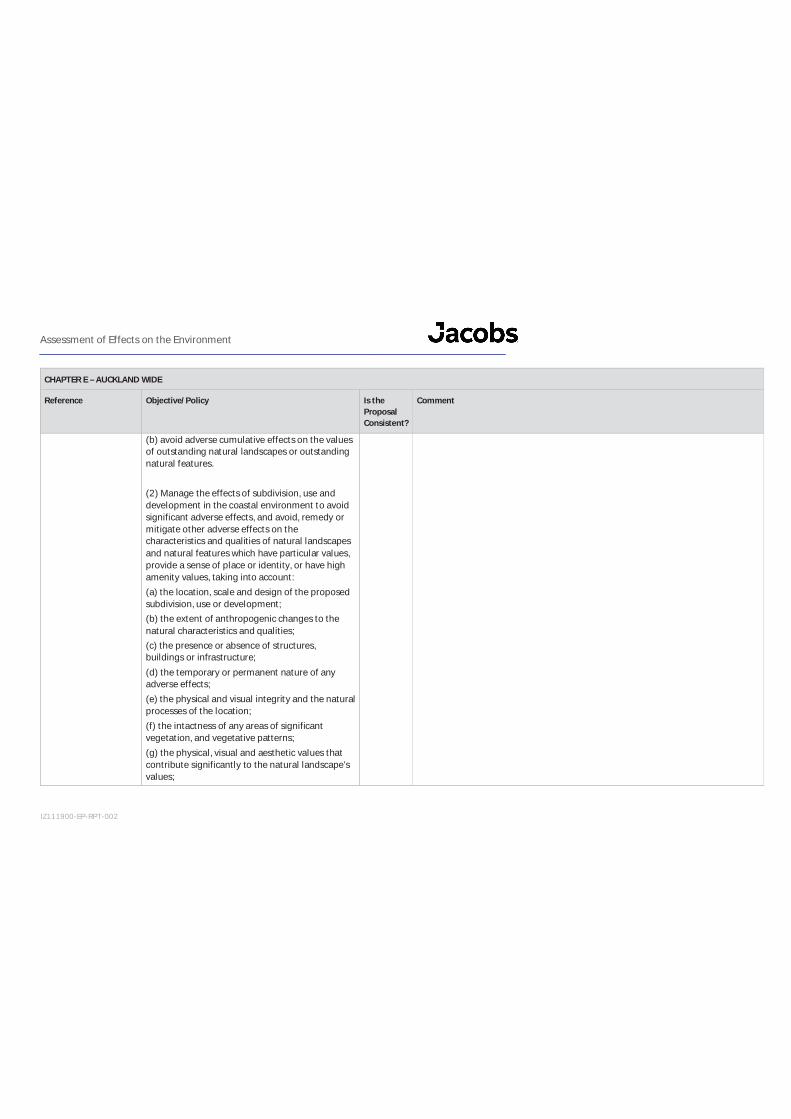
Assessment of Effects on the Environment
IZ111900-EP-RPT-002
CHAPTER E – AUCKLAND WIDE
Reference Objective/Policy Is theProposalConsistent?
Comment
(b) avoid adverse cumulative effects on the valuesof outstanding natural landscapes or outstandingnatural features.
(2) Manage the effects of subdivision, use anddevelopment in the coastal environment to avoidsignificant adverse effects, and avoid, remedy ormitigate other adverse effects on thecharacteristics and qualities of natural landscapesand natural features which have particular values,provide a sense of place or identity, or have highamenity values, taking into account:(a) the location, scale and design of the proposedsubdivision, use or development;(b) the extent of anthropogenic changes to thenatural characteristics and qualities;(c) the presence or absence of structures,buildings or infrastructure;(d) the temporary or permanent nature of anyadverse effects;(e) the physical and visual integrity and the naturalprocesses of the location;(f) the intactness of any areas of significantvegetation, and vegetative patterns;(g) the physical, visual and aesthetic values thatcontribute significantly to the natural landscape’svalues;
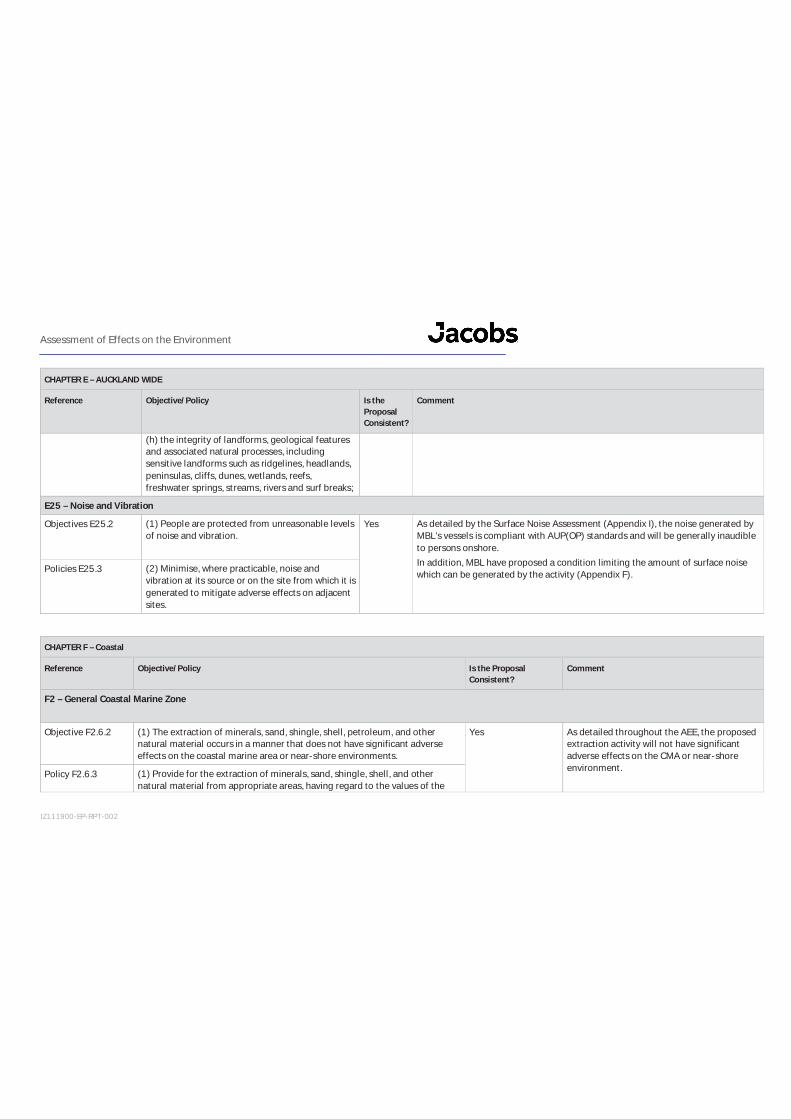
Assessment of Effects on the Environment
IZ111900-EP-RPT-002
CHAPTER E – AUCKLAND WIDE
Reference Objective/Policy Is theProposalConsistent?
Comment
(h) the integrity of landforms, geological featuresand associated natural processes, includingsensitive landforms such as ridgelines, headlands,peninsulas, cliffs, dunes, wetlands, reefs,freshwater springs, streams, rivers and surf breaks;
E25 – Noise and Vibration
Objectives E25.2 (1) People are protected from unreasonable levelsof noise and vibration.
Yes As detailed by the Surface Noise Assessment (Appendix I), the noise generated byMBL’s vessels is compliant with AUP(OP) standards and will be generally inaudibleto persons onshore.In addition, MBL have proposed a condition limiting the amount of surface noisewhich can be generated by the activity (Appendix F).Policies E25.3 (2) Minimise, where practicable, noise and
vibration at its source or on the site from which it isgenerated to mitigate adverse effects on adjacentsites.
CHAPTER F – Coastal
Reference Objective/Policy Is the ProposalConsistent?
Comment
F2 – General Coastal Marine Zone
Objective F2.6.2 (1) The extraction of minerals, sand, shingle, shell, petroleum, and othernatural material occurs in a manner that does not have significant adverseeffects on the coastal marine area or near-shore environments.
Yes As detailed throughout the AEE, the proposedextraction activity will not have significantadverse effects on the CMA or near-shoreenvironment.Policy F2.6.3 (1) Provide for the extraction of minerals, sand, shingle, shell, and other
natural material from appropriate areas, having regard to the values of the

Assessment of Effects on the Environment
IZ111900-EP-RPT-002
CHAPTER F – Coastal
Reference Objective/Policy Is the ProposalConsistent?
Comment
area and the natural rate of sediment being deposited over sediment lost fromthe area where extraction is proposed.
(2) Adopt a precautionary approach to applications for petroleum explorationand for mineral extraction within the coastal marine area, which may includeusing an adaptive management approach in terms of the following:(a) staging the operation;(b) the location of the activity;(c) the maximum volume of minerals, sand, shingle, shell and other naturalmaterial to be extracted;(d) the term of consent; or(e) environmental monitoring.
This sand resource is vital for the social andeconomic wellbeing of Auckland and can beextracted at a rate which does not exceed thenatural rate of sediment supply to the coastalsystem. As such, the proposed rate of sandextraction can be accommodated for a periodof 35 years and managed by the proposedconsent conditions (Appendix F).
Objectives F2.11.2 (1) Water and sediment quality in the coastal marine area is maintained whereit is excellent or good and progressively improved over time in degradedareas.(2) The life-supporting capacity and resources of the Hauraki Gulf areprotected and, where appropriate, enhanced.
Yes As detailed in the water quality assessment(Appendix H) and the AEE, the proposeddischarge from the extraction activity will notdetract from the life-supporting capacity ofthe Hauraki Gulf, while water and sedimentquality will also be largely unaffected.Any effects from the disturbance of theseabed and the discharge of material fromMBL’s vessels are temporary, with the rapiddispersal and deposition of material assistingin minimising the effects of the activity.The proposed discharge is also the bestpracticable option available for disposal ofunwanted sediment, biota and seawater. Theimmediate discharge of these substances and
Policies F2.11.3 (1) Avoid the discharge of contaminants where it will result in significantmodification of, or damage to any areas identified as having significant values.
(2) Require any proposal to discharge contaminants or water into the coastalmarine area to adopt the best practicable option to prevent or minimiseadverse effects on the environment, having regard to all of the following:(a) whether it is practicable or appropriate to discharge to land above meanhigh water springs;

Assessment of Effects on the Environment
IZ111900-EP-RPT-002
CHAPTER F – Coastal
Reference Objective/Policy Is the ProposalConsistent?
Comment
(b) whether there is a wastewater network in place that should be used; (c)whether the receiving environment has the capacity to assimilate thedischarged contaminants after reasonable mixing, particularly within areasidentified as degraded or as having significant ecological value;(d) the extent to which present or foreseeable future adverse effects havebeen avoided, remedied or mitigated on:
(i) areas of high recreational use;(ii) relevant initiatives by Mana Whenua established under regulationsrelating to the conservation or management of fisheries;(iii) the collection of fish and shellfish for consumption
(e) high ecological values;(f) cleaner production methods are used where practicable to minimise thevolume and level of contaminants being discharged; and(g) the discharge after reasonable mixing, does not either by itself or incombination with other discharges results in any or all of the following effects:
(i) oil or grease films, scums or foams, or floatable or suspendedmaterials;(ii) conspicuous change in the colour or visual clarity;(iii) any emission of objectionable odour;(iv) any significant adverse effects on aquatic life; or(v) any significant effects of aesthetic or amenity values.
(3) Provide for discharges that are unavoidable but intermittent, where:(a) the discharge occurs infrequently;(b) there are technical and practical difficulties which prevent measures beingtaken to avoid, remedy or mitigate adverse effects of the discharge;
material allows it to be returned to its source,preventing any cross-contamination andassisting with the re-colonisation of disturbedseabed.Effects are also avoided on recreationalactivities, with no risks presented to humanhealth (such as recreational fisheries, contactactivities or traditional food gathering)Lastly, the discharge is consistent with therequirements of sections 105 and 107 of theRMA, including avoiding any odours, greasyfilms or significant amenity effects.

Assessment of Effects on the Environment
IZ111900-EP-RPT-002
CHAPTER F – Coastal
Reference Objective/Policy Is the ProposalConsistent?
Comment
Objective F2.18.2 (1) Underwater noise from identified activities is managed to maintain thehealth and well-being of marine fauna and users of the coastal environment.
Yes As detailed in the underwater noise andmarine mammal reports (Appendix J andAppendix L), the extraction activity producesminimal underwater noise. This noise does willhave less than minor effects on marinemammals or fish species and is only transitoryin nature.
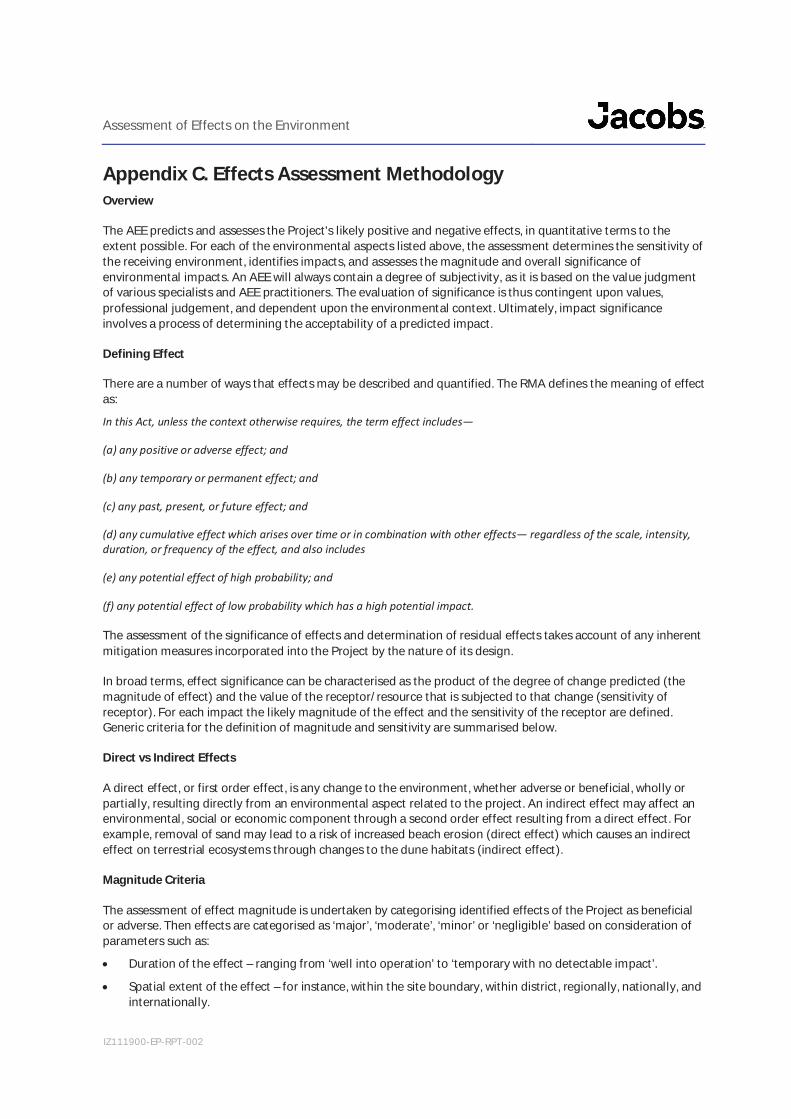
Assessment of Effects on the Environment
IZ111900-EP-RPT-002
Appendix C. Effects Assessment MethodologyOverview
The AEE predicts and assesses the Project's likely positive and negative effects, in quantitative terms to theextent possible. For each of the environmental aspects listed above, the assessment determines the sensitivity ofthe receiving environment, identifies impacts, and assesses the magnitude and overall significance ofenvironmental impacts. An AEE will always contain a degree of subjectivity, as it is based on the value judgmentof various specialists and AEE practitioners. The evaluation of significance is thus contingent upon values,professional judgement, and dependent upon the environmental context. Ultimately, impact significanceinvolves a process of determining the acceptability of a predicted impact.
Defining Effect
There are a number of ways that effects may be described and quantified. The RMA defines the meaning of effectas:
In this Act, unless the context otherwise requires, the term effect includes—
(a) any positive or adverse effect; and
(b) any temporary or permanent effect; and
(c) any past, present, or future effect; and
(d) any cumulative effect which arises over time or in combination with other effects— regardless of the scale, intensity,duration, or frequency of the effect, and also includes
(e) any potential effect of high probability; and
(f) any potential effect of low probability which has a high potential impact.
The assessment of the significance of effects and determination of residual effects takes account of any inherentmitigation measures incorporated into the Project by the nature of its design.
In broad terms, effect significance can be characterised as the product of the degree of change predicted (themagnitude of effect) and the value of the receptor/resource that is subjected to that change (sensitivity ofreceptor). For each impact the likely magnitude of the effect and the sensitivity of the receptor are defined.Generic criteria for the definition of magnitude and sensitivity are summarised below.
Direct vs Indirect Effects
A direct effect, or first order effect, is any change to the environment, whether adverse or beneficial, wholly orpartially, resulting directly from an environmental aspect related to the project. An indirect effect may affect anenvironmental, social or economic component through a second order effect resulting from a direct effect. Forexample, removal of sand may lead to a risk of increased beach erosion (direct effect) which causes an indirecteffect on terrestrial ecosystems through changes to the dune habitats (indirect effect).
Magnitude Criteria
The assessment of effect magnitude is undertaken by categorising identified effects of the Project as beneficialor adverse. Then effects are categorised as ‘major’, ‘moderate’, ‘minor’ or ‘negligible’ based on consideration ofparameters such as:
Duration of the effect – ranging from ‘well into operation’ to ‘temporary with no detectable impact’.
Spatial extent of the effect – for instance, within the site boundary, within district, regionally, nationally, andinternationally.

Assessment of Effects on the Environment
IZ111900-EP-RPT-002
Reversibility – ranging from ‘permanent thus requiring significant intervention to return to baseline’ to ‘nochange’.
Likelihood – ranging from ‘occurring regularly under typical conditions’ to ‘unlikely to occur’.
Compliance with legal standards and established professional criteria – ranging from ‘substantially exceedsnational standards or international guidance’ to ‘meets the standards’ (i.e. effects are not predicted toexceed the relevant standards) presents generic criteria for determining effect magnitude (for adverseimpacts). Each detailed assessment in this AEE will define effect magnitude in relation to its environmentalor social aspect.
Any other effect characteristics of relevance.
Table C1 below presents generic criteria for determining effect magnitude (for adverse effects). Each detailedassessment will define effect magnitude in relation to its environmental or social aspect.
Table C1: General criteria for determining effect magnitude
Category Description
Major Fundamental change to the specific conditions assessed resulting in long term or permanent change,typically widespread in nature and requiring significant intervention to return to baseline; would violatenational standards or Good International Industry Practice (GIIP) without mitigation.
Moderate Detectable change to the specific conditions assessed resulting in non-fundamental temporary or permanentchange.
Minor Detectable but small change to the specific conditions assessed.
Negligible No perceptible change to the specific conditions assessed.
Sensitivity Criteria
Sensitivity is specific to each aspect and the environmental resource or population affected, with criteriadeveloped from baseline information. Using the baseline information, the sensitivity of the receptor isdetermined – factoring in proximity, number exposed, vulnerability and the presence of receptors on site or thesurrounding area. Generic criteria for determining sensitivity of receptors are outlined in Table C2 below. Eachdetailed assessment will define sensitivity in relation to its environmental or social aspect.
Table C2: General criteria for determining effect sensitivity
Category Description
High Receptor (human, physical or biological) with little or no capacity to absorb proposed changes
Medium Receptor with little capacity to absorb proposed changes
Low Receptor with some capacity to absorb proposed changes
Negligible Receptor with good capacity to absorb proposed changes
Effect Evaluation
The determination of effect significance involves making a judgment about the importance of project impacts.This is typically done at two levels:
The significance of project effects factoring in the mitigation inherently within the design of the project;and
The significance of project effects following the implementation of additional mitigation measures.
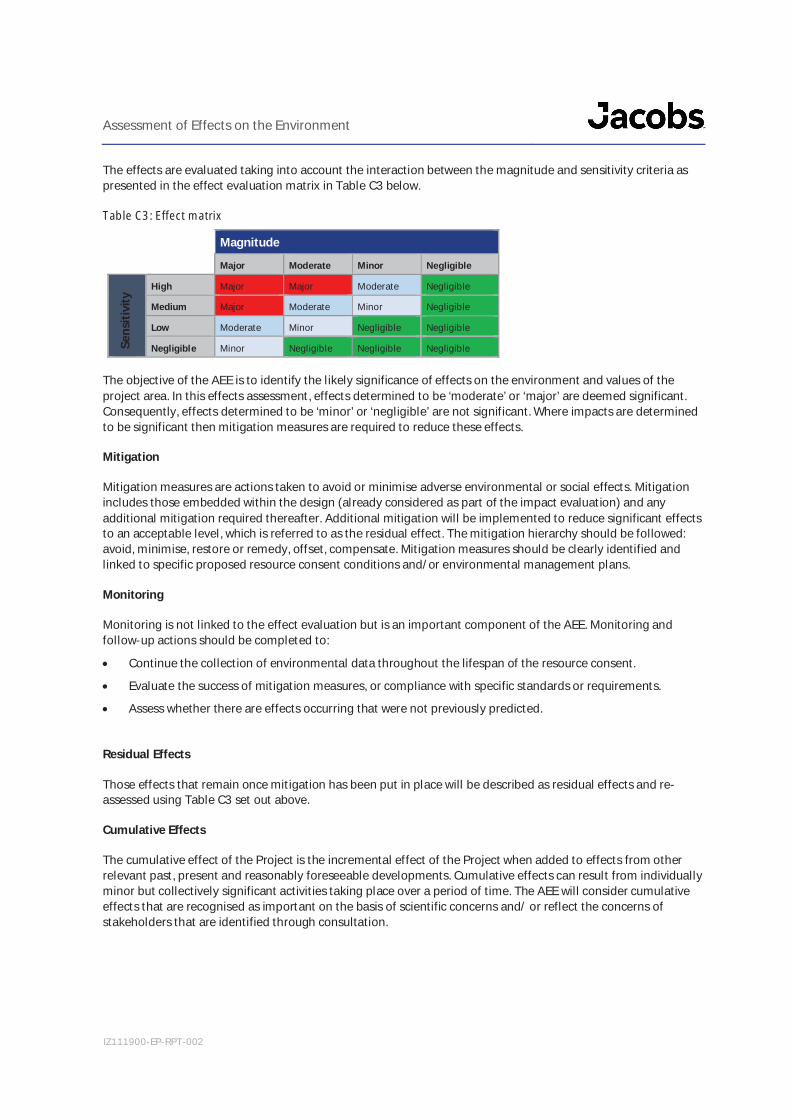
Assessment of Effects on the Environment
IZ111900-EP-RPT-002
The effects are evaluated taking into account the interaction between the magnitude and sensitivity criteria aspresented in the effect evaluation matrix in Table C3 below.
Table C3: Effect matrix
Magnitude
Major Moderate Minor Negligible
Sens
itivi
ty
High Major Major Moderate Negligible
Medium Major Moderate Minor Negligible
Low Moderate Minor Negligible Negligible
Negligible Minor Negligible Negligible Negligible
The objective of the AEE is to identify the likely significance of effects on the environment and values of theproject area. In this effects assessment, effects determined to be ‘moderate’ or ‘major’ are deemed significant.Consequently, effects determined to be ‘minor’ or ‘negligible’ are not significant. Where impacts are determinedto be significant then mitigation measures are required to reduce these effects.
Mitigation
Mitigation measures are actions taken to avoid or minimise adverse environmental or social effects. Mitigationincludes those embedded within the design (already considered as part of the impact evaluation) and anyadditional mitigation required thereafter. Additional mitigation will be implemented to reduce significant effectsto an acceptable level, which is referred to as the residual effect. The mitigation hierarchy should be followed:avoid, minimise, restore or remedy, offset, compensate. Mitigation measures should be clearly identified andlinked to specific proposed resource consent conditions and/or environmental management plans.
Monitoring
Monitoring is not linked to the effect evaluation but is an important component of the AEE. Monitoring andfollow-up actions should be completed to:
Continue the collection of environmental data throughout the lifespan of the resource consent.
Evaluate the success of mitigation measures, or compliance with specific standards or requirements.
Assess whether there are effects occurring that were not previously predicted.
Residual Effects
Those effects that remain once mitigation has been put in place will be described as residual effects and re-assessed using Table C3 set out above.
Cumulative Effects
The cumulative effect of the Project is the incremental effect of the Project when added to effects from otherrelevant past, present and reasonably foreseeable developments. Cumulative effects can result from individuallyminor but collectively significant activities taking place over a period of time. The AEE will consider cumulativeeffects that are recognised as important on the basis of scientific concerns and/ or reflect the concerns ofstakeholders that are identified through consultation.

Assessment of Effects on the Environment
IZ111900-EP-RPT-002
Appendix D. Economic Assessment

Assessment of Effects on the Environment
IZ111900-EP-RPT-002
Appendix E. Concrete Industry Report

Assessment of Effects on the Environment
IZ111900-EP-RPT-002
Appendix F. Draft Conditions

Assessment of Effects on the Environment
IZ111900-EP-RPT-002
Appendix G. Coastal Processes Assessment

Assessment of Effects on the Environment
IZ111900-EP-RPT-002
Appendix H. Water Quality Assessment

Assessment of Effects on the Environment
IZ111900-EP-RPT-002
Appendix I. Terrestrial Noise Assessment

Assessment of Effects on the Environment
IZ111900-EP-RPT-002
Appendix J. Underwater Noise Assessment

Assessment of Effects on the Environment
IZ111900-EP-RPT-002
Appendix K. Ecological Effects Assessment

Assessment of Effects on the Environment
IZ111900-EP-RPT-002
Appendix L. Marine Mammal Assessment

Assessment of Effects on the Environment
IZ111900-EP-RPT-002
Appendix M. Landscape Assessment

Assessment of Effects on the Environment
IZ111900-EP-RPT-002
Appendix N. Avifauna Assessment

Assessment of Effects on the Environment
IZ111900-EP-RPT-002
Appendix O. Consultation Summary