Embed Size (px)
Citation preview

ASSESSMENT OF CUMULATIVE COST
IMPACT FOR THE STEEL INDUSTRY
FINAL REPORT
CONTRACTOR
Centre for European Policy Studies
Prof. Dr. Andrea Renda (Project Coordinator)
Prof. Dr. Jacques Pelkmans
Prof. Christian Egenhofer
Andrei Marcu
Dr. Lorna Schrefler
Dr. Giacomo Luchetta
Dr. Felice Simonelli
Dr. Diego Valiante
Federica Mustilli
Federico Infelise
Wijnand Stoefs
Jonas Teusch
Julian Wieczorkiewicz
Alessandro Fumagalli
PARTNER
Economisti Associati
Roberto Zavatta
Enrico Giannotti
Giulia Maria Stecchi
Done in Brussels, 10 June 2013

Page 2 of 259
SPECIFIC CONTRACT
NO. SI2.648823 30-CE-0558235/00-06
IMPLEMENTING THE FRAMEWORK CONTRACT
NO ENTR/2008/006 LOT 4
DISCLAIMER The information and views set out in this study are those of the authors and do not necessarily reflect the official opinion of the Commission. The Commission does not guarantee the accuracy of the data included in this study. Neither the Commission nor any person acting on the Commission’s behalf may be held responsible for the use which may be made of the information contained therein.
Page 3 of 259
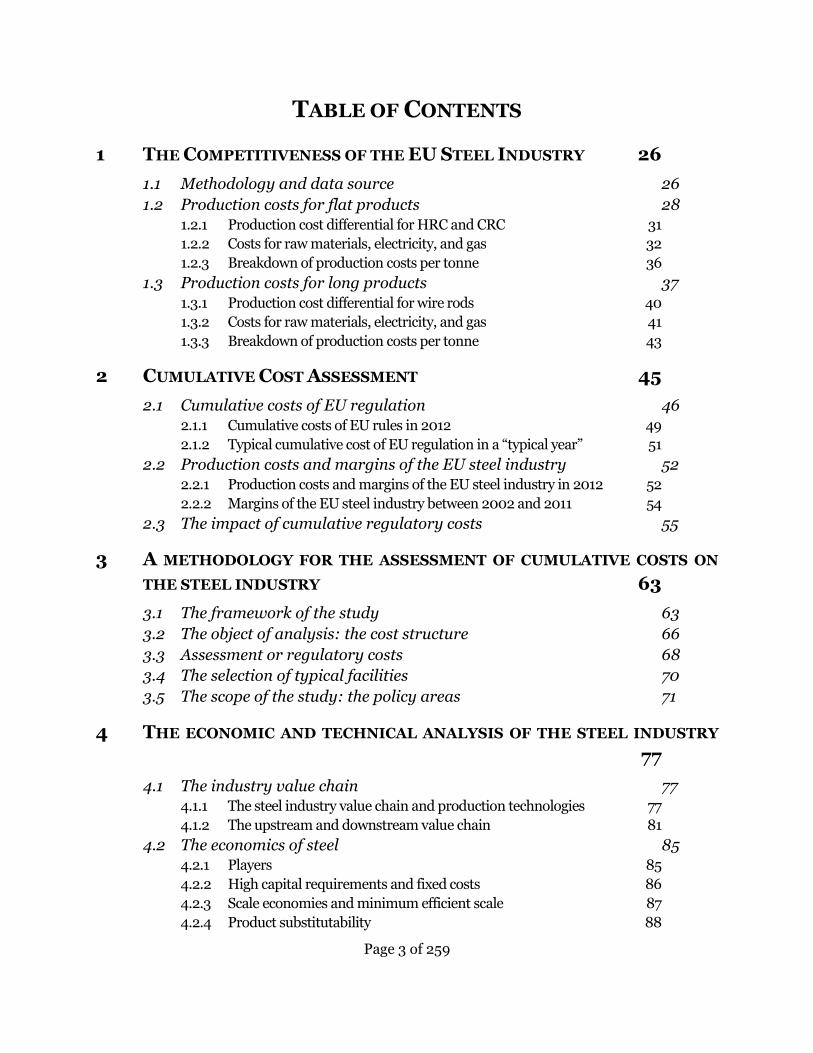
TABLE OF CONTENTS
1 THE COMPETITIVENESS OF THE EU STEEL INDUSTRY 26
1.1 Methodology and data source 26
1.2 Production costs for flat products 28
1.2.1 Production cost differential for HRC and CRC 31
1.2.2 Costs for raw materials, electricity, and gas 32
1.2.3 Breakdown of production costs per tonne 36
1.3 Production costs for long products 37
1.3.1 Production cost differential for wire rods 40
1.3.2 Costs for raw materials, electricity, and gas 41
1.3.3 Breakdown of production costs per tonne 43
2 CUMULATIVE COST ASSESSMENT 45
2.1 Cumulative costs of EU regulation 46
2.1.1 Cumulative costs of EU rules in 2012 49
2.1.2 Typical cumulative cost of EU regulation in a ―typical year‖ 51
2.2 Production costs and margins of the EU steel industry 52
2.2.1 Production costs and margins of the EU steel industry in 2012 52
2.2.2 Margins of the EU steel industry between 2002 and 2011 54
2.3 The impact of cumulative regulatory costs 55
3 A METHODOLOGY FOR THE ASSESSMENT OF CUMULATIVE COSTS ON
THE STEEL INDUSTRY 63
3.1 The framework of the study 63
3.2 The object of analysis: the cost structure 66
3.3 Assessment or regulatory costs 68
3.4 The selection of typical facilities 70
3.5 The scope of the study: the policy areas 71
4 THE ECONOMIC AND TECHNICAL ANALYSIS OF THE STEEL INDUSTRY
77
4.1 The industry value chain 77
4.1.1 The steel industry value chain and production technologies 77
4.1.2 The upstream and downstream value chain 81
4.2 The economics of steel 85
4.2.1 Players 85
4.2.2 High capital requirements and fixed costs 86
4.2.3 Scale economies and minimum efficient scale 87
4.2.4 Product substitutability 88

Page 4 of 259
4.2.5 Barriers to entry and barriers to exit 88
4.2.6 Intra-sectoral competitive dynamics 89
4.3 The European Steel Market 90
4.3.1 Industry definition 90
4.3.2 Supply 91
4.3.3 Demand 102
4.4 International trade of steel 107
4.4.1 World production and trade flows 107
4.4.2 EU trade flows 110
5 GENERAL POLICIES 115
6 FINANCIAL MARKETS (COMMODITY DERIVATIVES AND OTHER
FINANCIAL INSTRUMENTS) 123
6.1 Markets in Financial Instruments Directive and Regulation
(MiFID and MiFIR) 124
6.2 The European Market Infrastructure Regulation (EMIR) 126
6.3 Market Abuse Regulation and Directive 128
7 CLIMATE CHANGE 129
7.1.1 What is the EU ETS 129
7.1.2 Phase 1 (2005 – 2007) 130
7.1.3 Phase 2 (2008 – 2012) 130
7.1.4 Phase 3 (2012 – 2020) 130
7.1.5 Scope of the study 131
7.2 Costs 132
7.2.1 Compliance or direct costs 132
7.2.2 Indirect costs 132
7.2.3 Administrative costs 132
7.3 Quantification of Cumulative Costs 133
7.3.1 Results 137
8 COMPETITION POLICY 148
8.1 State aid and the steel industry 148
8.1.1 The regime of state aid in the EU 148
8.1.2 State aid rules for the steel industry 150
8.1.3 State aid granted to the steel industry between 2002 and 2012 in the
EU 154
8.2 Antitrust law and the steel sector 158
8.2.1 Antitrust law in the EU: agreements/concerted practices, abuse of
dominant positions, and merger control 158

Page 5 of 259
8.2.2 Agreements, abuses of dominant position, and notified mergers in the
steel industry between 2002 and 2012 in the EU 159
8.2.3 Long-term contracts for electricity 161
9 ENERGY POLICY 165
9.1 Comparison of electricity prices 165
9.1.1 Fundamentals of electricity price formation 166
9.1.2 International comparison of industrial electricity prices 168
9.1.3 Intra-EU comparison of industrial electricity prices 170
9.2 Comparison of natural gas prices for industry 176
9.3 Impact of EU regulation 177
9.3.1 Third Energy Market Package 177
9.3.2 Renewables 181
9.3.3 Energy Infrastructures 183
9.3.4 Energy Efficiency 184
9.3.5 Energy Taxation 185
10 ENVIRONMENTAL POLICY 186
10.1 Introduction 186
10.2 Review of relevant legislation 186
10.2.1 Prevention and control of industrial emissions 186
10.2.2 Waste Prevention and Recycling 189
10.2.3 Other Environmental Policy Measures 191
10.3 Assessment of Compliance Costs 193
10.3.1 Introduction 193
10.3.2 Investment Costs 193
10.3.3 Financial Costs 199
10.3.4 Operating Costs 200
10.3.5 Compliance Costs related to EU Legislation 202
10.4 Assessment of Administrative Costs 204
10.4.1 Introduction 204
10.4.2 Estimate of Administrative Costs 205
10.5 Assessment of Indirect Costs 208
11 TRADE POLICY 210
11.1.1 Trade Defence Instruments: their impact on the EU Economy 211
11.1.2 Chinese subsidies to the steel industry 225
11.1.3 The Generalised Scheme of Preferences (GSP) 230
12 PRODUCT POLICY 232
12.1 Introduction 232
12.2 Review of Relevant Legislation 233

Page 6 of 259
12.2.1 Eco-Labeling and Eco-Design 233
12.2.2 Green Public Procurement 234
12.2.3 Life-Cycle Assessment Methodologies 236
12.2.4 Chemical Products 237
12.2.5 Construction Products 239
12.3 Assessment of Compliance Costs 240
12.3.1 Introduction 240
12.3.2 Compliance Costs Linked to the REACH Regulation 240
12.3.3 Compliance Costs Linked to the Construction Products Regulation 242
12.4 Assessment of Administrative Costs 243
12.4.1 Introduction 243
12.4.2 Administrative Costs Linked to the REACH Regulation 243
12.5 Assessment of Indirect Costs 247
12.5.1 Introduction 247

Page 7 of 259
LIST OF TABLES
TABLE 1 PROTOTYPICAL PLANTS ........................................................................................................................... 26
TABLE 2 COST DIFFERENTIAL BETWEEN EU STEEL MAKERS AND LEAST COST PRODUCERS IN ABSOLUTE VALUE FOR
HRCS ($ 2012) .......................................................................................................................................... 32
TABLE 3 COST DIFFERENTIAL BETWEEN EU STEEL MAKERS AND LEAST COST PRODUCERS IN ABSOLUTE VALUE FOR
CRCS ($ 2012) ........................................................................................................................................... 32
TABLE 4 COST DIFFERENTIAL BETWEEN EU STEEL MAKERS AND LEAST COST PRODUCERS FOR WIRE ROD ($ 2012)
................................................................................................................................................................... 41
TABLE 5 CUMULATIVE REGULATORY COSTS IN 2012 (€/TONNE) ........................................................................... 50
TABLE 6 CUMULATIVE REGULATORY COSTS IN A TYPICAL YEAR (€/TONNE) ........................................................... 51
TABLE 7 CUMULATIVE REGULATORY COSTS IN A TYPICAL YEAR – NON-TECHNOLOGY SPECIFIC PLANT (€/TONNE) 52
TABLE 8 PRODUCTION COSTS AND MARGINS OF THE EU STEEL INDUSTRY (2012 - €/TONNE) .............................. 54
TABLE 9 MARGINS OF THE EU STEEL INDUSTRY (% OVER MARKET PRICE) ............................................................ 54
TABLE 10 MARGINS OF THE EU STEEL INDUSTRY (€/TONNE AT CONSTANT 2012 PRICES)..................................... 55
TABLE 11 THE IMPACT OF CUMULATIVE REGULATORY COSTS – 2012 ..................................................................... 55
TABLE 12 THE IMPACT OF TYPICAL CUMULATIVE REGULATORY COSTS – 2002 – 2012 .......................................... 58
TABLE 13 THE IMPACT OF CUMULATIVE REGULATORY COSTS ON COST DIFFERENTIALS – 2012 ............................. 60
TABLE 14 LIST OF LEGISLATION IN SCOPE OF THE STUDY ....................................................................................... 72
TABLE 15 OPERATION MODELS OF STEEL INTERMEDIARIES IN THE EU ................................................................ 84
TABLE 16 LARGEST STEEL COMPANIES ................................................................................................................ 86
TABLE 17 PRODUCTION OF IRON AND STEEL, NACE REV.2.0 CLASSIFICATION ..................................................... 90
TABLE 18 NUMBER OF PERSONS EMPLOYED IN THE EU IRON AND STEEL INDUSTRY -NACEREV.2 24.1 .............. 102
TABLE 19 EU27 EXPORTS, IMPORTS AND NET POSITIONS IN IRON AND STEEL BY SELECTED DESTINATION
COUNTRIES - 2001 AND 2012 (THOUSAND TONNES) ...................................................................................112
TABLE 20: AVERAGE YEARLY PRICES PER TON OF CO2 (€) ................................................................................. 134
TABLE 21: EMISSIONS AND ALLOCATIONS (TONNES OF CO2) ............................................................................... 138
TABLE 22: DIRECT COSTS (€ MLN) ..................................................................................................................... 139
TABLE 23: DIRECT COSTS PER TONNE PRODUCED (€/TONNE) ............................................................................. 140
TABLE 24: INDIRECT COST PER TON OF STEEL (€/TONNE), USING MAXIMUM REGIONAL CARBON INTENSITY ....... 140
TABLE 25: INDIRECT COST PER TON OF STEEL (€/TONNE), USING AVERAGE NATIONAL CARBON INTENSITY ......... 141
TABLE 26: ADMINISTRATIVE COST PER TONNE OF STEEL (€/TONNE) .................................................................. 141
TABLE 27: TOTAL COSTS OF THE EU ETS SCHEME (€/TONNE) ........................................................................... 142
TABLE 28 STATE AID GRANTED IN THE EU BETWEEN 2002 AND 2011 (€ MLN AT CONSTANT 2011 PRICES) ......... 155
TABLE 29 LIST OF STATE AID NOTIFIED TO/REGISTERED BY THE COMMISSION OVER THE PERIOD 2002-2012 .... 156
TABLE 30 LIST OF MERGER NOTIFIED TO THE COMMISSION OVER THE PERIOD 2002-2012 ................................ 159
TABLE 31 EFFECT OF PRICE MARGINAL INCREASES ............................................................................................. 165
TABLE 32: RES SUPPORT SCHEME COST COMPARISON FOR 680,000MWH USERS (2012) .................................. 175
TABLE 33 PRICES OF GAS FOR INDUSTRIAL USERS – 2012 (€/MWH) ................................................................. 177
TABLE 34 TRADE VOLUMES AT POWER EXCHANGES AS A PERCENTAGE OF NATIONAL DEMAND AND ANNUAL
AVERAGE DAY-AHEAD BASE LOAD POWER PRICES (€/MWH) ..................................................................... 181
TABLE 35 FOCUS OF BATS CONCERNING THE VARIOUS STAGES OF THE PRODUCTION PROCESS ........................... 189

Page 8 of 259
TABLE 36 SUMMARY OF CUMULATED ENVIRONMENT PROTECTION COSTS, 2003 – 2010 (€/TONNE)............... 202
TABLE 37 SUMMARY OF CUMULATED COMPLIANCE COSTS OF EU ENVIRONMENTAL LEGISLATION (€/TONNE) . 203
TABLE 38 GUESS ESTIMATE OF CUMULATED COMPLIANCE COSTS INCURRED BY BOF AND EAF PRODUCERS
(€/TONNE) .............................................................................................................................................. 204
TABLE 39 ESTIMATE OF AVERAGE CUMULATED COMPLIANCE COSTS (€/TONNE) .............................................. 204
TABLE 40 SUMMARY OF CUMULATED ADMINISTRATIVE COSTS LINKED TO IEP AND INSPECTIONS (€ MILLION) .207
TABLE 41 EU CASES ON ANTI-DUMPING AND ANTI-SUBSIDY IN THE STEEL INTERNATIONAL MARKET, FROM 2003
................................................................................................................................................................. 213
TABLE 42 EU DUMPING MARGINS, AD DUTIES AND EFFECT OF LESSER DUTY RULE BY SECTOR, (2000-2010).... 217
TABLE 43 ANTI-DUMPING MEASURES IN FORCE FROM 2003 ............................................................................. 218
TABLE 44 COUNTERVAILING DUTIES IN FORCE SINCE 2003. ............................................................................... 219
TABLE 45 ENERGY SUBSIDIES TO THE CHINESE STEEL INDUSTRY - 2002-2007 ($ MLN, CURRENT PRICE) .......... 227
TABLE 46 SUBSIDIES ON CHINESE STEEL INDUSTRIES, 2002-2007 .................................................................. 228
TABLE 47 SUMMARY OF CUMULATED ADMINISTRATIVE COSTS LINKED TO THE REACH REGULATION (€ MLN) 246

Page 9 of 259
LIST OF FIGURES
FIGURE 1 PRODUCTION COSTS PER TONNE OF LIQUID STEEL ($ 2012) .................................................................. 29
FIGURE 2 PRODUCTION COSTS PER TONNE OF SLABS ($ 2012) ............................................................................. 30
FIGURE 3 PRODUCTION COSTS PER TONNE OF HOT ROLLED COILS ($ 2012) ......................................................... 30
FIGURE 4 PRODUCTION COSTS PER TONNE OF COLD ROLLED COILS ($ 2012) ........................................................ 31
FIGURE 5 RAW MATERIAL COSTS PER TONNE OF HOT ROLLED COILS ($ 2012) ...................................................... 33
FIGURE 6 RAW MATERIAL COSTS PER TONNE OF COLD ROLLED COILS ($ 2012) ..................................................... 34
FIGURE 7 ELECTRICITY COSTS PER TONNE OF HOT ROLLED COILS ($ 2012) ........................................................... 34
FIGURE 8 ELECTRICITY COSTS PER TONNE OF COLD ROLLED COILS ($ 2012) ........................................................ 35
FIGURE 9 NATURAL GAS COSTS PER TONNE OF HOT ROLLED COILS ($ 2012) ......................................................... 35
FIGURE 10 NATURAL GAS COSTS PER TONNE OF COLD ROLLED COILS ($ 2012) ..................................................... 36
FIGURE 11 BREAKDOWN OF PRODUCTION COST PER TONNE OF COLD ROLLED COILS ($ 2012) ............................... 37
FIGURE 12 PRODUCTION COSTS PER TONNE OF LIQUID STEEL ($ 2012) ................................................................ 39
FIGURE 13 PRODUCTION COSTS PER TONNE OF BILLETS ($ 2012) ......................................................................... 39
FIGURE 14 PRODUCTION COSTS PER TONNE OF WIRE ROD ($ 2012) ..................................................................... 40
FIGURE 15 RAW MATERIAL COSTS PER TONNE OF WIRE ROD ($ 2012)................................................................... 42
FIGURE 16 ELECTRICITY COSTS PER TONNE OF WIRE ROD ($ 2012) ...................................................................... 42
FIGURE 17 NATURAL GAS COSTS PER TONNE OF COLD ROLLED WIRE ROD ($ 2012) ............................................... 43
FIGURE 18 BREAKDOWN OF PRODUCTION COST PER TONNE OF WIRE ROD ............................................................. 44
FIGURE 19 CUMULATIVE REGULATORY COSTS VS. MARGINS AND PRODUCTION COSTS – WIRE ROD (2012,
€/TONNE) ................................................................................................................................................... 56
FIGURE 20 CUMULATIVE REGULATORY COSTS VS. MARGINS AND PRODUCTION COSTS – HRC (2012, €/TONNE) .. 57
FIGURE 21 CUMULATIVE REGULATORY COSTS VS. MARGINS AND PRODUCTION COSTS – HRC (2012, E/TONNE) ... 57
FIGURE 22 TYPICAL CUMULATIVE REGULATORY COST VS. STEEL EBITDA (2002-2011) ....................................... 59
FIGURE 23 TYPICAL CUMULATIVE REGULATORY COST VS. HRC PRICE-RAW MATERIALS MARGINS (2002-2011) . 59
FIGURE 24 THE IMPACT OF CUMULATIVE REGULATORY COSTS ON COST DIFFERENTIALS - 2012 ............................ 61
FIGURE 25 PRODUCTION OF CRUDE STEEL IN THE EU (THOUSAND TONNES) ........................................................ 91
FIGURE 26 SHARE OF CRUDE STEEL PRODUCTION IN THE EU BY MEMBER STATE – 2012 ...................................... 92
FIGURE 27 PRODUCTION OF CRUDE STEEL IN SELECTED MEMBER STATES (THOUSAND TONNES) ........................... 92
FIGURE 28 VARIATION IN PRODUCTION OF CRUDE STEEL – 2002-2012 ............................................................... 93
FIGURE 29 PRODUCTION OF CRUDE STEEL BY STEEL-MAKING TECHNOLOGY (THOUSAND TONNES) ....................... 94
FIGURE 30 PRODUCTION OF CRUDE STEEL BY STEEL-MAKING TECHNOLOGY IN SELECTED MEMBER STATES - 2011
(THOUSAND TONNES) .................................................................................................................................. 95
FIGURE 31 PRODUCTION OF CRUDE STEEL BY CASTING PROCESS (THOUSAND TONNES) ......................................... 95
FIGURE 32 PRODUCTION OF CRUDE STEEL BY CASTING PROCESS IN SELECTED MEMBER STATES - 2011 (THOUSAND
TONNES) ..................................................................................................................................................... 96
FIGURE 33 PRODUCTION OF HOT ROLLED PRODUCTS IN THE EU (THOUSAND TONNES) ........................................ 97
FIGURE 34 PRODUCTION OF HOT ROLLED PRODUCTS IN SELECTED MEMBER STATES – 2011 (THOUSAND TONNES)97
FIGURE 35 PRODUCTION OF STEEL PRODUCTS OF SECOND TRANSFORMATION IN THE EU – 2009 (THOUSAND
TONNES) .................................................................................................................................................... 98
FIGURE 36 AGGREGATE TURNOVER IN THE EU IRON AND STEEL INDUSTRY – NACE REV.2 24.1 (MLN €) .......... 100
FIGURE 37 TURNOVER OF THE STEEL AND IRON INDUSTRY OVER GDP– NACE REV.2 24.1 ................................ 100
FIGURE 38 VALUE ADDED OVER SALES AND GROSS OPERATING SURPLUS OVER SALES VALUE IN THE EU IRON AND
STEEL INDUSTRY – NACE REV.2 24.1 ........................................................................................................ 101
FIGURE 39 APPARENT STEEL USE IN THE EU (THOUSAND TONNES) .................................................................... 104
FIGURE 40 COUNTRY SHARE OF TOTAL EUROPEAN APPARENT STEEL USE – 2011 ............................................... 104
FIGURE 41 VARIATION IN APPARENT STEEL USE - 2002-2011 ............................................................................. 105
Page 10 of 259
FIGURE 42 APPARENT STEEL USE AND PRODUCTION OF CRUDE STEEL IN THE EU (THOUSAND TONNES) ............. 105
FIGURE 43 TOTAL TURNOVER IN THE EU MOTOR VEHICLE INDUSTRY – ENTERPRISES INCLUDED IN NACE REV.2
DIVISION 29 (MLN €) ................................................................................................................................ 106
FIGURE 44 TOTAL TURNOVER IN THE EU CONSTRUCTION SECTOR – ENTERPRISES INCLUDED IN NACE REV.2
SECTION F (MLN €) ................................................................................................................................... 107
FIGURE 45 CRUDE STEEL PRODUCTION (THOUSAND TONNES) ........................................................................... 108
FIGURE 46 NET FLOWS OF SEMI-FINISHED AND FINISHED STEEL PRODUCTS – 2001-2011 (THOUSAND TONNES) 109
FIGURE 47 MARKET SHARES OF EXPORTS OF SEMI-FINISHED AND FINISHED STEEL PRODUCTS – 2001 AND 2011.
................................................................................................................................................................. 110
FIGURE 48 INTRA AND EXTRA-EU TRADE OF IRON AND STEEL - 2001-2012 (THOUSAND TONNES) .................... 111
FIGURE 49 NATURAL GAS AND OIL PRICES, 1993-2012 ...................................................................................... 167
FIGURE 50 COAL PRICES, 1993-2012................................................................................................................. 168
FIGURE 51: INDICES OF REAL ENERGY PRICES FOR INDUSTRY (2005 = 100) ....................................................... 169
FIGURE 52 PRICES OF ELECTRICITY FOR LARGE INDUSTRIAL CONSUMERS EXCLUDING TAXES - 2012 (€/MWH) .. 171
FIGURE 53 PRICES OF ELECTRICITY FOR STEEL OPERATORS - (€/MWH) ............................................................. 172
FIGURE 54 TRANSMISSION TARIFFS IN SELECTED EU MEMBER STATES - 2009-2012 (2011-€/MWH) .............. 173
FIGURE 55 COSTS OF RES SUPPORT SCHEMES FOR 150,000MWH USERS - CALCULATED, 2011 (€/MWH)........ 174
FIGURE 56 PRICES OF ELECTRICITY FOR LARGE INDUSTRIAL CONSUMERS - 2012 (€/MWH) .............................. 176
FIGURE 57: SIMULATION RESULTS: GROSS WELFARE BENEFITS FROM CROSS0-BORDER TRADE AND INCREMENTAL
GAIN PER BORDER – 2011 (€ MLN PER YEAR)............................................................................................. 180
FIGURE 58: EFFECTS OF WIND POWER AT DIFFERENT TIMES OF THE DAY ............................................................ 182
FIGURE 59 ENVIRONMENTAL PROTECTION INVESTMENTS – EU 27, 2003-2010 (€ MLN) .................................. 196
FIGURE 60 BREAKDOWN OF ENVIRONMENTAL PROTECTION INVESTMENTS PER TYPOLOGY OF INVESTMENT –
SELECTED COUNTRIES, 2003-2010 .......................................................................................................... 197
FIGURE 61 BREAKDOWN OF ENVIRONMENTAL PROTECTION INVESTMENTS PER ENVIRONMENTAL DOMAIN –
SELECTED COUNTRIES, 2003-2010 .......................................................................................................... 198
FIGURE 62 ANNUAL AND CUMULATED INVESTMENT COSTS - EU27, 2003-2010 (€/TONNE) ............................. 199
FIGURE 63 ANNUAL AND CUMULATED FINANCIAL COSTS - EU27, 2003-2010 (€/TONNE) ................................ 200
FIGURE 64 ANNUAL AND CUMULATED OPERATING COSTS - EU27, 2003-2010 (€/TONNE) ............................... 202
FIGURE 65 ANNUAL AVERAGE ADMINISTRATIVE COSTS OF IEP AND INSPECTIONS (€/TONNE) ..........................207
FIGURE 66 AVERAGE ANTI-DUMPING AD VALOREM DUTY LEVELS BY YEAR OF IMPOSITION .................................. 216
FIGURE 67 IMPORTS OF CERTAIN ORGANIC COATED STEEL PRODUCTS FROM CHINA AND THE WORLD (HUNDRED
KG) ...........................................................................................................................................................222
FIGURE 68 EXPORTS AND IMPORTS OF CERTAIN SEAMLESS TUBES AND PIPES ..................................................... 223
FIGURE 69 CHINESE EXPORTS: WIRE RODS (JAN 2006 = 100) .......................................................................... 228
FIGURE 70 CHINESE EXPORTS: METALLIC COATED SHEET AND STRIP WIDTH >600MM (JAN 2006 = 100) .........229
FIGURE 71 CHINESE EXPORTS POLICIES, EXPORTS VOLUMES AND PRICE MOVEMENTS FOR BILLETS .................... 230
FIGURE 72 ANNUAL AVERAGE ADMINISTRATIVE COSTS OF REACH REGULATION (€/TONNE) ........................... 247

Page 11 of 259
LIST OF ABREVIATIONS
ACER Agency for the Cooperation of Energy Regulators
AD Anti-dumping Duties
ARM Approved Reporting Mechanism
BAT Best Available Techniques
BAU Business-As-Usual
BDEW Bundesverband der Energie- und Wasserwirtschaft
BOF Basic Oxygen Furnace
BREF BAT Reference Documents
CAGR Compound Annual Growth Rate
CAPEX Capital Expenditures
CCS Carbon Capture and Storage
CIF Cost Insurance and Freight
CIS Commonwealth of Independent State
CISA China Iron and Steel Association
CRC Cold Rolled Coils
DG ENTR Directorate-General of Enterprise and Industry
DG TRADE Directorate-General for Trade
DRI Direct Reduced Iron
EAF Electric Arc Furnaces
EBIT Earnings Before Interest and Taxes
EBITDA Earnings Before Interest, Taxes, Depreciation and Amortization
ECHA European Chemicals Agency
ECSC European Coal and Steel Community
EDF Electricité de France
EFTA European Free Trade Association
EIB European Investment Bank
EIP European Innovation Partnership
ELV Emission Limit Values
ELVD End of Life Vehicles Directive
EMAS Eco-Management and Audit Scheme
EMIR European Market Infrastructure Regulation
ENTSO-E European Network of Transmission System Operators For Electricity
EPA Environmental Protection Agency
EPE Environmental Protection Expenditures
ERU Emission Reduction Units
ESMA European Securities and Markets Authority
ETS European Emission Trading System
EU TL EU Transaction Log
EUA European Emission Allowances
FC Financial Costs
GAINS Greenhouse gas - Air pollution Interactions and Synergies
GATT General Agreement on Tariffs and Trade
GBER General Block Exemption Regulation
GDP Gross Domestic Product
GHG Greenhouse Gas

Page 12 of 259
GPP Green Public Procurement
GSF Global Steel Financial Reports
GSIS Global Steel Information System
GSP Generalised Scheme of Preferences
HRC Hot Rolled Coils
IC Investment Costs
IED Industrial Emission Directive
IEP Integrated Environmental Permits
IIASA International Institute for Applied Systems Analysis
IMPEL EU Network for the Implementation and Enforcement of Environmental Law
IO Information Obligations
IPP Integrated Product Policy
IPPC Integrated Pollution Prevention and Control
IPPCD IPPC Directive
ISIDP Iron and Steel Industry Development Policies
LCA Life Cycle Assessment
LCP Large Combustion Plants
LDR Lesser Duty Rule
LNG Liquefied Natural Gas
MAD Market Abuse Directive
MAR Market Abuse Regulation
MARPOL International Convention for Preventing Pollution from Ships
MES Minimum Efficient Scale
MiFID Markets in Financial Instruments Directive
MiFIR Markets in Financial Instruments Regulation
MO Monetary Obligations
MRV Monitoring Reporting and Verification
MTF Multilateral Trading Facilities
NAP National Allocation Plans
NDCR National Development and Reform Commission
NER New Entrance Reserve
NRA National Regulatory Authorities
OC Operating Costs
OECD Organisation for Economic Co-operation and Development
OHF Open Heart Furnaces
OPEX Operating Expenditures
OTC Over The Counter
OTF Organised Trading Facility
REACH Registration, Evaluation, Authorisation and Restriction of Chemicals
RES Renewable Energy Sources
RFCS Research Fund on Coal and Steel
RM Regulated Markets
SASAC State-owned Assets Supervision and Administration Commission of the State Council
SBS Structural Business Statistics
SDS Safety Data Sheets
SES Safety Information Sheets
SHEC Safety, Health, Environmental and Consumer
Page 13 of 259
SIEF Substantial Information Exchange Forum
SME Small Medium Enterprise
SO Substantive Obligations
SPIRE Sustainable Process Industry through Resource and Energy Efficiency
SVHC Substances of Very High Concerns
TDI Trade Defence Instruments
TFEU Treaty on the Functioning of the European Union
TRG Top Gas Recycling
TSO Transmission System Operator
ULCOS Ultra-Low Carbon dioxide (CO2) Steelmaking
UNFCCC United Nations Framework Convention on Climate Change
VAT Value Added Tax
WFD Waste Framework Directive
WR Wire Rods
WSD World Steel Dynamics
WSR Waste Shipment Regulation
WTO World Trade Organization

Page 14 of 259
ASSESSMENT OF CUMULATIVE COST
IMPACT FOR THE STEEL INDUSTRY
ABSTRACT
This study contains an assessment of the cumulative costs of EU legislation on the
European steel industry, as well as an evaluation of how these costs affect the
competitiveness of this industry from an international standpoint. Cumulative costs are
compared to production costs and current margins of the European steel industry, as
well as to the production costs of international steel competitors.
Cumulative regulatory costs represent approximately 3% of the total cost of production
of EAF wire rods, and less than 2% of the total cost of producing HRCs and CRCs for
BOF producers. As far as the price-raw material margin is concerned, in 2012 regulatory
costs represent about 7% of this margin for EAF products and less than 5% of the
margin for BOF products. For EAF producers regulatory costs represent about a quarter
of their EBITDA; whereas for BOF producers, regulatory costs represent between 15%
and 33% of the EBITDA.
As far as margins for the period 2002-2011 are concerned, it becomes clear that the steel
industry has the typical features of a pro-cyclical industry: the significance – and thus
the impact – of regulatory costs changes accordingly to the cycle. Specifically,
cumulative regulatory costs over EBITDA were in the area of 7% in the boom years;
while in times of crisis, regulatory costs may be even higher than EBITDA (e.g. in 2009),
and more generally fall in the area of 20% to 30% of the EBITDA.

Page 15 of 259
ASSESSMENT OF CUMULATIVE COST
IMPACT FOR THE STEEL INDUSTRY
KEY FINDINGS
Blast Oxygen Furnace (BOF) and Electric Arc Furnace (EAF) producers
faced different breakdowns of regulatory costs in 2012, and ultimately
EAF producers face a higher cost per tonne of finished products. This is
due to the higher impact that the electricity-related costs, that are indirect ETS
costs, transmission tariffs and RES support, have on electro-intensive EAF
producers, and to the fact that the latter did not benefit from ETS over allocation
as much as BOFs. Differently, investment costs generated by environmental
legislation represent a significant burden for BOF producers, which also have to
bear higher administrative costs across all policy areas.
In 2012, for BOF producers, regulatory costs amount to 7.7 – 9.7
€/tonne of finished product. The largest burden is due to compliance with
environmental protection legislation, mostly implying significant operational
costs; the cost of energy inputs is also relevant, in particular for CRC, whose
production process is more energy intensive. Climate change legislation did not
impose any cost in 2012 on BOFs, due to the over allocation of emission allowances
(EUAs), which more-than-compensated indirect costs passed-on in the form of
higher electricity prices.
In 2012, for EAF producers, regulatory costs amount to 14.2 €/tonne of
finished product. The largest costs arise from the energy area, due to high
electricity intensity of the production process, followed by investments in
environmental protection triggered by legislation. Legislation related to climate
change featured in 2012 a cost of about 2.6 €/tonne.
Typical regulatory costs in the period 2002-2012 amount to 10.66
€/tonne for BOF producers; and 13.37 €/tonne for EAF producers.
Again, costs are higher for EAF compared to BOF producers due to higher
electricity costs, and also due to the fact that so far the ETS did not impose any
direct cost on steel makers.

Page 16 of 259
Cumulative regulatory costs represent approximately 3% of the total
cost of production of EAF wire rods, and less than 2% of the total cost
of producing HRCs and CRCs for BOF producers.
As far as the price-raw material margin is concerned, in 2012
regulatory costs represent about 7% of this margin for EAF products
and less than 5% of the margin for BOF products.
In 2012, for EAF producers regulatory costs represent about a quarter
of their EBITDA; whereas for BOF producers, regulatory costs
represent between 15% and 33% of the EBITDA.
As far as margins for the period 2002-2011 are concerned, it becomes clear that the
steel industry has the typical features of a pro-cyclical industry: the significance –
and thus the impact – of regulatory costs changes accordingly to the cycle.
Specifically:
o Cumulative regulatory costs over EBITDA were in the area of 7%
in the boom years, i.e. from 2006 to 2008. Such a share of regulatory
costs over EBITDA is unlikely to jeopardize the sustainability and the
international competitiveness of EU steel makers;
o In times of crisis, regulatory costs may be even higher than
EBITDA (e.g. in 2009), and more generally fall in the area of 20%
to 30% of the EBITDA. At this level, they may endanger the viability of the
industry, as the EBITDA needs to cover financial expenditures, depreciation
and amortization, that is the cost of capital. The same reasoning goes for the
share of regulatory costs over the price-raw materials margin. The
competitive position of the EU steel industry is sharply different if 3% to 4%
of actionable costs are spent to comply with EU regulation, as in the boom
years, or whether this share reaches up to almost 10%, as it was the case in
2002 or 2011.
As for the cost differentials with the least cost producer, our results show the
following:
o For EAF wire rods, regulatory costs account for a significant
share (33.8%) of the cost differential with the least cost producers (the US
EAF plants).
o For BOF producers, the impact of regulatory costs is much
smaller (5.3% for CRC and 5.8% for HRC). The least cost producers in this
case are Russian steel makers.
Page 17 of 259
ASSESSMENT OF CUMULATIVE COST
IMPACT FOR THE STEEL INDUSTRY
EXECUTIVE SUMMARY1
A. Scene Setter
This study aims at understanding if and how much the costs of EU regulation impact on
the cost structure of the European steel industry and on its international
competitiveness. It does so by identifying and where possible quantifying the cumulative
cost of selected EU legislation on the sector. The study followed an approach similar to a
"fitness check". The study however is not an assessment of the costs compared to the
benefits of the legislation considered and as such differs from the a fully-fledged
"Fitness check" which would identify, quantify and assess the benefits of relevant
legislation for a sector and compare them to burden and costs.
The following regulatory costs were analysed in the study:
1. Administrative costs: costs incurred by firms to provide information to public
authorities and third parties;
2. Compliance costs: costs stemming from a requirement for the firm to take actions
to adapt its productive process to comply with the legal act.
3. Indirect costs: costs of regulation which have an impact on steel producers not as
direct addressees, but as counterparts of direct addressees.
The following policy areas were analysed in the study: : i) general policies (such as, e.g.
the Europe2020 strategy); ii) the commodity market regulation; iii) legislation related
to climate change; iv) competition policy; v) energy policy; vi) environmental legislation;
vii) trade policy; viii) product regulation and life-cicle assessment (LCA).
1 The information and views set out in this summary are those of the authors and do not necessarily
reflect the official opinion of the Commission. The Commission does not guarantee the accuracy of the
data included in this study. Neither the Commission nor any person acting on the Commission‘s behalf
may be held responsible for the use which may be made of the information contained therein.

Page 18 of 259
B. Key Conclusions
1. Cumulative regulatory costs: these are low compared to the overall cost of
steel production. For Electric Arc Furnaces (EAF) wire rods, they represent about
3% of total costs. For Basic Oxygen Furnace (BOF) producers, they represent less
than 2% of the cost of producing Hot Rolled Coils (HRCs) and Cold Rolled Coils
(CRCs).
2. In order to provide an indication of the relative importance of the impact of EU
legislation on the steel industry‘s operations, regulatory costs per unit of output
were compared with key performance indicators, such as price-cost margin, EBIT
and EBITDA.
The steel industry is a pro-cyclical industry. Cumulative regulatory costs
over EBITDA were in the area of 9-14% in the boom years, i.e. from 2006 to 2008.
Such a share of regulatory costs over EBITDA is unlikely to put EU steel makers in
a dangerous competitive position.
However in times of crisis, regulatory costs may be even higher than EBITDA, such
as was the exceptional case of 2009, or, more often, fall in the area of 28% to 35%
of the EBITDA. At this level, they may endanger the viability of the industry, as the
EBITDA needs to cover financial expenditures, depreciation and amortization, that
is the cost of capital.
The year 2012 has been a bad year for the steel industry, with low margins, tight
competition and a situation of overcapacity due to the economic cycle. Hence, the
cumulative regulatory costs, albeit low in absolute terms, could have bitten
away profitability. And indeed this is confirmed by the share of regulatory costs
over EBITDA. For EAF producers, regulatory costs measured in this study
represented about a quarter of their EBITDA for 2012; for BOF producers,
regulatory costs represent between 15% and 33% of their EBITDA for 2012.
3. BOF and EAF producers faced different regulatory costs in 2012.
EAFs bear the higher cost per tonne of finished products. This is due
to the higher impact that the electricity-related costs, that are indirect ETS
costs, transmission tariffs and RES support, have on electro-intensive
EAFs, and to the fact that they did not benefit from ETS over allocation as
much as BOFs.

Page 19 of 259
BOF producers also have to bear marginally higher administrative costs.
Across the different policy areas, for BOF producers the largest burden is
due to environmental protection, with a large share of environmental
costs due to operational costs; energy costs are also relevant for BOF plants,
and more so for CRC, whose production process is more energy intensive.
Climate change legislation did not impose any cost in 2012 on BOFs, due to
the over allocation of EUAs, which more than compensated indirect costs
passed on through electricity prices.
4. Price-raw material margin: in 2012 regulatory costs represented about 7% of
this margin for EAF products and less than 5% of the margin for BOF products.
5. Cost differentials for European steel makers compared to other world
areas are mainly due to prices for iron ore, electricity, and gas. Natural
gas and electricity prices are the main drivers of competitive advantage for US
producers. In some cases, e.g. compared to Russia and Ukrainian producers, part
of the cost differential is compensated by the higher efficiency of European steel
plants.
6. It is worth stressing that the national turnover of the steel industry has a crucial
role in the economic system of several EU member states, even when the quantities
produced are limited in absolute value.
C. Typical cumulative cost of regulation
- For Basic Oxygen Furnace (BOF) plants (which generally produce high value-
added products) the largest burden is due to the operational costs related to
environmental protection measures. Due to over-allocation of carbon permits,
climate legislation did not impose any cost on BOF plants in 2012.
- For Electric Arc Furnace (EAF) plants (which generally produce low value-
added products) the cost of electricity and energy regulation (indirect ETS costs,
transmission tariffs and renewable energy support) represent a major share of the
cumulative cost of regulation.

Page 20 of 259
Table A. Cumulative cost of regulation (€/tonne)
BOF HRC
EAF WR
Steel Industry
ETS 0.74 5.85 2.79
Energy 3.67 8.12 5.46
Environment 6.15 3.39 5.04
Product (REACH) 0.10 0.05 0.08
Total 10.66 17.41 13.37
Depending on future EUA prices, the scenario analysis therein reported for a single
plant seems to indicate that the regulatory cost advantage of BOFs is likely to disappear.
D. Cost comparison
The production cost comparison for flat products focuses on fully integrated BOF steel
making plants delivering both Hot Rolled Coils (HRC) and Cold Rolled Coils (CRCs) as
finished products. Western European companies incur the highest costs per tonnes of
HRC and CRC, followed by US plants which are slightly less competitive than Central
Eastern European facilities. Russian steel makers are the least cost producers, their cost
advantage, with a cost differential of 165-171$ for CRC and 216-240$ for HRC.
The production cost comparison for long products is mainly centred on EAF steel
making plants delivering wire rods as finished products, as well as on Chinese and
Ukrainian BOFs. A tonne of wire rods costs in European EAF plants less than in Chinese
EAFs. Wire rods made in Ukrainian BOFs are the least cost output, while US and
Russian companies are the least cost EAF producers.

Page 21 of 259
ANNEX
Assessment of the cumulative cost impact for the steel industry
A. Some methodological notes
Not all relevant areas are included in the cost assessment (e.g. labour);
The study quantified costs stemming from 4 policy areas: climate change, energy,
environmental and product policy (REACH) and assessed 3 typologies of costs:
compliance, administrative and indirect costs;
The study was conceived as a backward looking stock-taking exercise and does not
include estimates of future costs;
The study only looked at steel makers stricto sensu, thus excluding non-integrated
players which operate in the industry value chain without producing crude steel.
Figures need to be interpreted knowing that there are different types of steel
producers on which different policies have different impacts.
B. Detail of breakdown
Table B. Types of Plants
BOF (Basic Oxygen Furnace) EAF (Electric Arc Furnace)
High value-added products Low value-added products
Produce HRC (Hot Rolled Coils) and CRC (Cold Rolled Coils)
Produce bars and wired rods (WR)
Figure A. BOF Production costs 2012 (in $)
BOF - HRC BOF - CRC

Page 22 of 259
For BOF plants Western European companies incur the highest production costs per
tonnes of HRC and CRC, followed by US plants which are slightly less competitive than
Central Eastern European facilities. Russian steel makers are the least cost producers,
their cost advantage, with a cost differential of 165-171$ for CRC and 216-240$ for HRC.
Figure B. EAF Production costs 2012 (in $)
Concerning EAF plants a tonne of wire rods costs in European EAF plants less than in
Chinese EAFs. Wire rods made in Ukrainian BOFs are the least cost output, while US
and Russian companies are the least cost EAF producers. In general, the cost curve is
flatter compared to flat products, i.e. cost differentials for long products are narrower.
Table C. Cumulative cost of regulation 2012: breakdown per policy area (€/tonne)
BOF CRC
BOF HRC
EAF WR
ETS
Direct -2.69 -2.69 -0.54
Indirect 0.45 0.29 3.06
Administrative 0.13 0.13 0.10
Sub-Total -2.12 -2.27 2.62
Energy
Transmission 2.40 1.58 3.48
RES 3.18 2.09 4.65
Sub-Total 5.58 3.67 8.12
Environment
Direct
Investment 1.35 1.35 0.74
Financial 0.73 0.73 0.40
Operational 4.05 4.05 2.21
Administrative 0.01 0.01 0.04
Sub-Total 6.15 6.15 3.39
Product Administrative – REACH 0.10 0.10 0.05
Sub-Total 0.10 0.10 0.05
Total 9.72 7.65 14.18
Wire Rods
Page 23 of 259
BOF and EAF producers faced different regulatory costs in 2012:
For BOF producers the largest burden is due to environmental protection, with a
large share of environmental costs due to operational costs. Energy costs are also
relevant for BOF plants, and more so for CRC, whose production process is more
energy intensive. Climate change legislation did not impose any cost on BOFs in
2012, due to the over-allocation of emission allowances, which more than
compensated indirect costs passed on through electricity price.
EAFs bear the higher cost per tonne of finished products due to the higher impact
of the electricity-related costs (indirect ETS costs, transmission tariffs and RES
support) on electro-intensive EAFs, and to the fact that they did not benefit from
ETS over-allocation as much as BOFs. Climate change legislation imposed on EAFs
has a cost of about 2.6 €/tonne due to indirect ETS costs.
C. The impact of cumulative regulatory costs 2002-2012
The steel industry is a pro-cyclical industry. Results thus need to be interpreted in
relation to the economic circumstances:
Relative to EBITDA:
o From 2006 to 2008 cumulative regulatory costs only accounted for 9-14%
of EBITDA, which seems like a "fair price" to pay to enjoy the benefits of
Europe, such as proximity to high value-added costumers and a skilled labour
force.
o In times of crisis regulatory costs may present 28-35% of EBITDA. In the
case of 2009 they were even higher than EBITDA. At this level they may
endanger the viability of the industry, as the EBITDA needs to cover for the
cost of capital (i.e. financial expenditures, depreciation and amortization).
Relative to Price-Materials margin:
o The same reasoning goes for the share of regulatory costs over the price-raw
materials margin. The competitive position of the EU steel industry is sharply
different if 3% to 4% of actionable costs are spent to comply with EU
regulation, as in the boom years, or whether this share reaches up to more
than 8%, as it was the case in 2002 or 2011.

Page 24 of 259
Table D. The impact of cumulative regulatory costs – 2002-2011
2002 2003 2004 2005 2006 2007 2008 2009 2010 2011
EBITDA 28.1% 18.9% 13.4% 17.3% 9.4% 12.2% 14.5% -53.9% 35.0% 30.9%
Price-Raw Mat. (HRC) 8.1% 6.1% 3.4% 3.9% 4.3% 4.0% 3.4% 7.3% 5.5% 8.2%
Price-Raw Materials (or margin over raw materials) is the difference between market
prices and cost incurred by BOF producers to purchase the required amount of coal,
coke, iron ore, and scrap; and by EAF ones for scrap, pig iron, and Direct Reduced Iron.
Price-raw materials margins are important, and according to many interviewees are
customarily kept under control by both steel makers and customers, and constitute a
fair proxy of the value added generated by the industry, especially for BOF producers
(which are characterized by relatively lower costs for electricity and gas and higher
efficiency in energy recovery).

Page 25 of 259
PART I
THE CUMULATIVE COST
ASSESSMENT

Page 26 of 259
1 The Competitiveness of the EU Steel Industry
1.1 Methodology and data source
This section compares production costs for steel making businesses on a worldwide
basis, and accordingly assesses the current competitiveness of EU producers vis-à-vis
their international competitors. The following countries/regions are included in the
comparison: i) Brazil; ii) Central Eastern Europe; iii) China; iv) Russia; v) Turkey; vi)
Ukraine; vii) US; viii) Western Europe. In particular, Brazil is selected due to its large
availability of raw materials (especially iron ore); China for the high installed capacity;
Russia, Turkey, and Ukraine based on their geographical proximity to Europe; and the
US due to its similarity to Europe in term of economic fundamentals. All of these
countries represent important commercial partners for the EU in terms of steel trade
volumes.2
As explained in more detail in Section 4 below, steel making plants can be broadly
classified in two different groups: integrated plants adopting Basic Oxygen Furnace
(BOF) technology; and minimills, smelting scrap in Electric Arc Furnaces (EAFs). A
twofold classification is also made for steel making final output, where ―long‖ and ―flat‖
products are distinguished as two separated markets. Whereas the former are rolled in
bars and wire rods from blooms and billets and are considered low added value
products, the latter are rolled in sheets and coils from slabs and are deemed high added
value outputs. The combination of these two dimensions enables classifying up to 4
categories of steel making plants (see Table 1).
Table 1 Prototypical plants
In what follows, cost production comparison is centred only on two categories, i.e. BOFs
making flat products and EAFs making long. This selection is based on the evidence that
EAF producers usually are specialized in long products, while BOF producers are
focused on flat ones. Indeed, tramp metals contained in scrap usually lower the
2 See below, Table 19 and accompanying text.
Market Flat products Long products
Production technology
BOF BOFs making flat products BOFs making long products
EAF EAFs making flat products EAFs making long products

Page 27 of 259
metallurgical quality of steel produced in minimills, thus resulting in a competitive
disadvantage for EAF flat products and discouraging to a large extent this kind of
production. For these two categories a prototypical plant was selected for each country
included in the analysis. In addition, for Ukraine – where in 2010 only 4.5% of total
steel production was made in EAFs3 – and for China – where 10.4% of total steel
production was made in EAFs4 – prototypical BOF plants are also included when
comparing production costs for long products, being their production more frequently
performed in integrated plants in these two countries. To ensure homogeneity,
prototypical plants do not represent producers of specialty steel, thus focusing
exclusively on commodity grades.
The analysis is carried out at three different stages of the production process, thus
comparing the cost per tonne of liquid steel, semi-finished products (slabs for flat steel
and billets for long) and finished products (hot rolled coils and cold rolled coils for flat
steel; wire rods for long). Furthermore, the main cost components are investigated to
single out sources of competitive advantage/disadvantage.
The comparison relies on data referred to December 2012 and mainly drawn from the
Global Steel Information System (GSIS), an interactive platform provided by World
Steel Dynamics (WSD) comprising, inter alia, two comprehensive databases:
- ―World Cost Curve for Steel Sheet Producers‖, with cost models for steel flat
products; and
- ―World Cost Curve for Billet and Wire Rod Producers‖, with cost models for steel
long products.
These tools offer a cost estimation for a large number of steel making plants located all
over the world as well as for several typical plants in specific regions. Prototypes
adopted in the analysis are based on WSD typical plants or, whenever a WSD general
model is not available, on cost models for real facilities deemed representative for a
given country. Furthermore, in order to ensure consistency with the analysis on cost of
regulation of EU energy policies included in the study, cost models for EU plants are
customized by changing the price parameters for electricity and natural gas. For gas, a
weighted average annual price paid by the largest industrial customers - relying on data
provided by EUROSTAT - has been included in the models.5 Similarly, weighted
3 World Steel, 2012.
4 Id.
5 National prices (2012) for energy intensive industrial customers - included in the higher consumption
band available - provided by EUROSTAT are averaged adopting as weights the total production of
crude steel (in tonnes) for each EU countries in 2012 (data provided by World Steel, 2013). Separate

Page 28 of 259
averages based on EUROSTAT data have been used to customize electricity prices. For
BOF producers, the weighted average of electricity prices also reflects the prices
reported during the interviews.6
1.2 Production costs for flat products
As mentioned above, production cost comparison for flat products focuses on fully
integrated BOF steel making plants delivering both Hot Rolled Coils (HRC) and Cold
Rolled Coils (CRCs) as finished products.7
The following prototypical plants have been selected and compared:
- Brazil HRC/CRC BOF;
- Central Eastern Europe HRC/CRC BOF;
- China HRC/CRC BOF;
- Russia HRC/CRC BOF;
- Turkey HRC/CRC BOF;
- Ukraine HRC/CRC BOF;
- USA HRC/CRC BOF;
- Western Europe HRC/CRC BOF.
As for liquid steel, the first steel making production stage considered (see Figure 1), EU
companies register the highest costs per tonne. One tonne of liquid steel costs 507$ in
Western European plants and 505$ in Central Eastern European ones. These costs are
comparable with those incurred by US (504$) and Ukrainian (503$) producers, while
are about 28% higher than costs of Russian BOF plants (396$). By contrast, the highest
costs per tonne of slab (see Figure 2) are incurred by Ukrainian plants (570$), followed
by US (551$), Western European (550$), and Central Eastern European (549$) steel
makers. European slabs cost about 29% more than Russian ones (426$). A closer look to
finished products (see Figure 3 and Figure 4) shows that Western European companies
averages have been computed for Central Eastern Europe (BG, CZ, HU, LV, PL, RO, SK, and SI) and
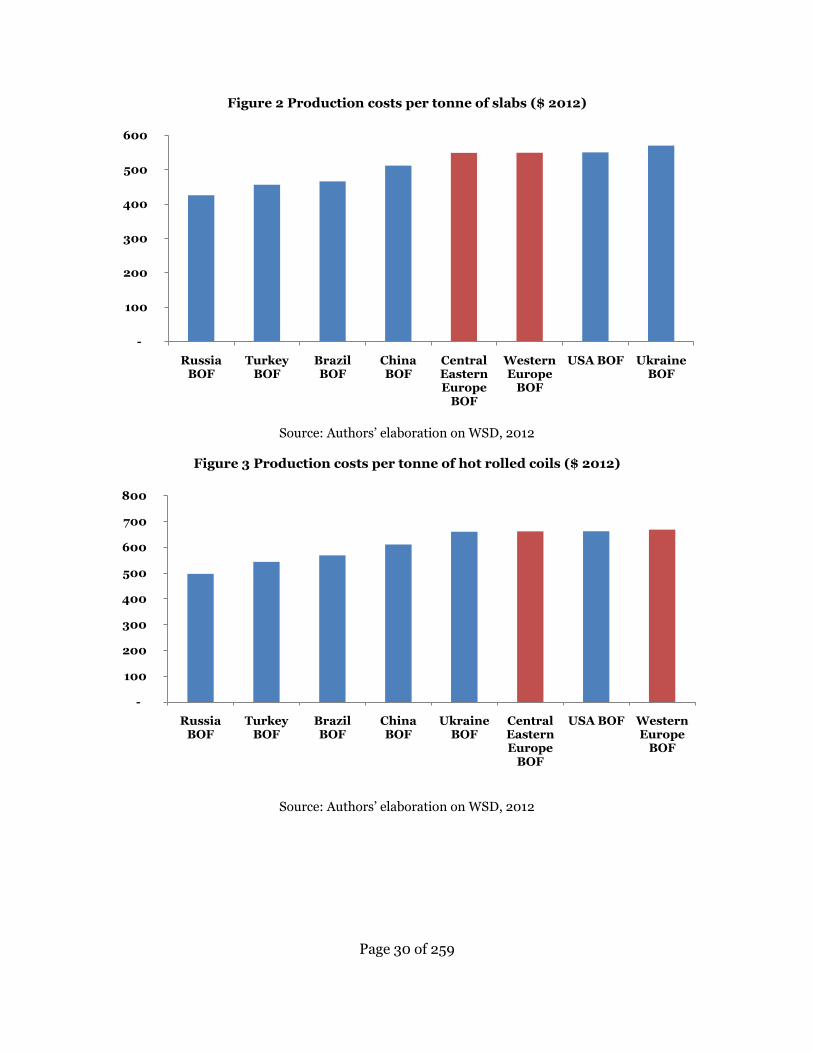
for Western Europe (AT, BE, FI, FR, DE, GR, IT, NL, PT, ES, SE, and UK).
6 Eurostat prices in countries were the interviewed plant operator is based are substituted by the prices
reported in the interviews. Prices reported by companies have been validated by the consultants.
7 Production costs are ex works costs.

Page 29 of 259
incur the highest costs per tonnes of HRC (669$) and CRC (808$), followed by US
plants (respectively 663$ and 786$) which are slightly less competitive than Central
Eastern European facilities (662$ and 784$). Russian steel makers (497$ and 569$)
confirm their cost advantage, with a gap of 171$ per tonne of HRC (+34%) and 240$ per
tonne of CRC (+42%) when compared to Western Europe finished products and of 165$
per tonne of HRC (+33%) and 216$ per tonne of CRC (+38%) compared to Central
Eastern European production. These values are consistent with the aggressive price
strategies of CIS steelmakers in Central and Eastern Europe, where thanks to these cost
differentials, they are able to undercut European producers‘ prices by about 30 to 40
€/tonne.
Figure 1 Production costs per tonne of liquid steel ($ 2012)
Source: Authors‘ elaboration on WSD, 2012
-
100
200
300
400
500
600
Russia BOF
Turkey BOF
Brazil BOF
China BOF
Ukraine BOF
USA BOF Central Eastern Europe
BOF
Western Europe
BOF
Page 30 of 259
Figure 2 Production costs per tonne of slabs ($ 2012)
Source: Authors‘ elaboration on WSD, 2012
Figure 3 Production costs per tonne of hot rolled coils ($ 2012)
Source: Authors‘ elaboration on WSD, 2012
-
100
200
300
400
500
600
Russia BOF
Turkey BOF
Brazil BOF
China BOF
Central Eastern Europe
BOF
Western Europe
BOF
USA BOF Ukraine BOF
-
100
200
300
400
500
600
700
800
Russia BOF
Turkey BOF
Brazil BOF
China BOF
Ukraine BOF
Central Eastern Europe
BOF
USA BOF Western Europe
BOF

Page 31 of 259
Figure 4 Production costs per tonne of cold rolled coils ($ 2012)
Source: Authors‘ elaboration on WSD, 2012
1.2.1 Production cost differential for HRC and CRC
The cost differentials in the production of HRCs between European steel makers and the
least cost producers, i.e. Russian BOFs plants (see Table 3), are mainly due to the cost of
procuring raw materials, hiring labour, the supply of natural gas, and electricity. In
relative terms, the natural gas share of costs is almost treble, and the electricity price
share of costs is 35% higher in Western Europe and 82% higher in Central Eastern
Europe.8 Similar findings emerged for the most advanced production stage (CRC): here
too, differentials with Russia are mostly due to raw materials, labour, natural gas, and
electricity. However, labour costs, albeit higher in nominal terms, do not emerge as a
clear source of competitive disadvantage, considering that these comparisons do not
follow a purchasing power parity approach which would be crucial to analyse wage
differentials. All in all, raw materials and energy costs constitute the most significant
factors that hamper the competitiveness of EU steel makers vis-à-vis their international
competitors. It is worth noticing that European BOFs are very efficient in recovering
energy and scrap, thus explaining the negative differential when compared to Russian
plants9.
8 Cost differentials are the combination of different prices and different efficiency.
9 Benchmarks for the iron and steel industry are reported in Methodology for the free allocation of
emission allowances in the EU ETS post 2012. Sector report for the iron and steel industry. Study for
-
100
200
300
400
500
600
700
800
900
Russia BOF
Turkey BOF
Brazil BOF
China BOF
Ukraine BOF
Central Eastern Europe
BOF
USA BOF Western Europe
BOF

Page 32 of 259
Table 2 Cost differential between EU steel makers and least cost producers in absolute
value for HRCs ($ 2012)10
Central Eastern Europe BOF Western Europe BOF
Raw materials 120 112
Labour 36 49
Electricity 12 5
Natural Gas 34 29
Other energy 9 7
Other costs 13 -0
Energy/Scrap Credit -44 -34
TOTAL 179 168
Source: Authors‘ elaboration on WSD, 2012
Table 3 Cost differential between EU steel makers and least cost producers in absolute
value for CRCs ($ 2012)
Central Eastern Europe BOF Western Europe BOF
Raw materials 125 116
Labour 53 88
Electricity 20 10
Natural Gas 55 46
Other energy 9 7
Other costs 18 3
Energy/Scrap Credit -48 -35
Overheads, depreciation, and interest
-17 5
TOTAL 216 240
Source: Authors‘ elaboration on WSD, 2012
1.2.2 Costs for raw materials, electricity, and gas
As anticipated in the previous section, EU companies face the highest production costs
per tonne of both HRC and CRC in terms of raw materials (respectively 432$ and 451$
for Western plants, 439$ and 461$ for Central Eastern, see Figure 5 and Figure 6
the European Commission by Ecorys; Fraunhofer Institute for Systems and Innovation Research; and
Öko-Institut. Available at: http://ec.europa.eu/clima/policies/ets/cap/allocation/docs/bm_study-
iron_and_steel_ en.pdf
10 Production cost differentials for HRC do not include overheads, depreciation, and interest.

Page 33 of 259
below). Looking at electricity (see Figure 7 and Figure 8 below), Ukrainian producers
pay 53$ per tonne of HRC and 68$ per tonne of CRC, followed by Central Eastern
European ones (26$ and 44$), Chinese (23$ and 38$) and Western European ones (19$
and 33$). Also for natural gas (see Figure 9 and Figure 10), costs incurred by BOF
located in Ukraine (87$ per tonne of HRC and 114$ per tonne of CRC) are larger than
those of Central Eastern (48$ and 77$) and Western European (43$ and 68$)
integrated plants.
While cost differentials between Central Eastern and Western producers as well as
between them and Ukrainian BOFs – which incur the highest energy expenditures –
stem to a large extent from an existing gap in plant efficiency, differentials with other
regions are mainly due to prices of iron ore, electricity, and gas. Natural gas and
electricity prices are the main drivers of competitive advantage for US producers.
Indeed, if US producers were to pay the energy prices paid by Western European
industrial customers – something which was almost the case before the shale gas
revolution – the US CRCs would cost about 822$ per tonne, i.e. 14$ more than Western
European coils.
Figure 5 Raw material costs per tonne of hot rolled coils ($ 2012)
Source: Authors‘ elaboration on WSD, 2012
-
50
100
150
200
250
300
350
400
450
500
Russia BOF
Brazil BOF
USA BOF China BOF
Turkey BOF
Ukraine BOF
Western Europe
BOF
Central Eastern Europe
BOF

Page 34 of 259
Figure 6 Raw material costs per tonne of cold rolled coils ($ 2012)
Source: Authors‘ elaboration on WSD, 2012
Figure 7 Electricity costs per tonne of hot rolled coils ($ 2012)
Source: Authors‘ elaboration on WSD, 2012
-
50
100
150
200
250
300
350
400
450
500
Russia BOF
Brazil BOF
USA BOF China BOF
Turkey BOF
Ukraine BOF
Western Europe
BOF
Central Eastern Europe
BOF
-
10
20
30
40
50
60
Russia BOF
Brazil BOF
USA BOF Turkey BOF
Western Europe
BOF
China BOF
Central Eastern Europe
BOF
Ukraine BOF

Page 35 of 259
Figure 8 Electricity costs per tonne of cold rolled coils ($ 2012)
Source: Authors‘ elaboration on WSD, 2012
Figure 9 Natural gas costs per tonne of hot rolled coils ($ 2012)
Source: Authors‘ elaboration on WSD, 2012
-
10
20
30
40
50
60
70
80
Russia BOF
Brazil BOF
USA BOF Turkey BOF
Western Europe
BOF
China BOF Central Eastern Europe
BOF
Ukraine BOF
-
10
20
30
40
50
60
70
80
90
100
Russia BOF
USA BOF Turkey BOF
Brazil BOF
China BOF
Western Europe
BOF
Central Eastern Europe
BOF
Ukraine BOF
Page 36 of 259
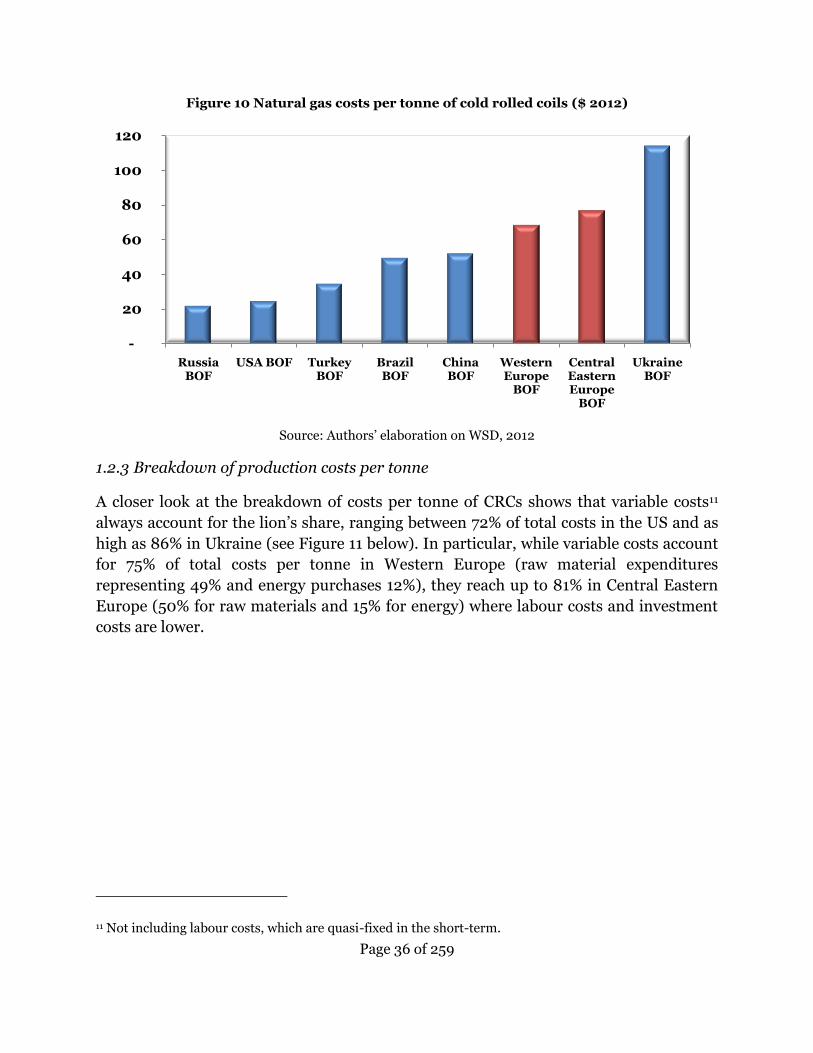
Figure 10 Natural gas costs per tonne of cold rolled coils ($ 2012)
Source: Authors‘ elaboration on WSD, 2012
1.2.3 Breakdown of production costs per tonne
A closer look at the breakdown of costs per tonne of CRCs shows that variable costs11
always account for the lion‘s share, ranging between 72% of total costs in the US and as
high as 86% in Ukraine (see Figure 11 below). In particular, while variable costs account
for 75% of total costs per tonne in Western Europe (raw material expenditures
representing 49% and energy purchases 12%), they reach up to 81% in Central Eastern
Europe (50% for raw materials and 15% for energy) where labour costs and investment
costs are lower.
11 Not including labour costs, which are quasi-fixed in the short-term.
-
20
40
60
80
100
120
Russia BOF
USA BOF Turkey BOF
Brazil BOF
China BOF
Western Europe
BOF
Central Eastern Europe
BOF
Ukraine BOF

Page 37 of 259
Figure 11 Breakdown of production cost per tonne of cold rolled coils ($ 2012)
Source: Authors‘ elaboration on WSD, 2012
1.3 Production costs for long products
Production cost comparison for long products is mainly centred on EAF steel making
plants delivering wire rods as finished products. The sample has been constructed by
considering only commodity steel, with an average quality score based on WSD
classification. As explained above, for China and Ukraine also fully integrated BOF
plants have been included in the analysis, considering that the BOF technology has a
predominant role in these countries. Nonetheless, data for BOF plants have been used
only in the aggregate cost comparison to assess the relative competitiveness of EU
producers vis-à-vis their international competitors. When breaking down costs, a
comparison among BOF and EAF steel makers becomes of course meaningless, due to
structural differences between these two production processes.
The following prototypical plants have been selected and compared:
- Brazil wire rod EAF;
- Central Eastern Europe wire rod EAF;
- China wire rod BOF;
- China wire rod EAF;
0%
10%
20%
30%
40%
50%
60%
70%
80%
90%
100%
Russia BOF
Turkey BOF
Brazil BOF
China BOF
Ukraine BOF
Central Eastern Europe
BOF
USA BOF
Western Europe
BOF
Overheads, depreciation, and interest
Labor
Other costs
Other energy
Natural Gas
Electricity
Raw materials
Page 38 of 259
- Russia wire rod EAF;
- Turkey wire rod EAF;
- Ukraine wire rod BOF;
- USA wire rod EAF;
- Western Europe wire rod EAF.
At the liquid steel production stage (see Figure 12), Western European companies are
the highest cost producers, one tonne costing 522$. This cost figure is comparable with
expenditures incurred by Chinese (521$) and Turkish (519$) EAFs and 19% higher than
Brazilian production costs. Central Eastern European plants register a cost per tonne
equal to 510$, 16% higher than Brazilian ones. As for the intermediate production stage
(see Figure 13), both Western (555$) and Central Eastern European (555$) steel makers
have a cost advantage over billets made in Turkish (558$) and Chinese EAFs (580$) and
BOFs (556$). European billets cost 14% more than Ukrainian BOF semi-finished
products (486$) and 11% more than US EAF ones (501$). Focusing on the last
production stage (see Figure 14), a tonne of wire rods costs 623$ in Western European
plants and 630$ in Central Eastern ones, which is lower than the production costs
incurred by Chinese EAFs (652$). As mentioned above for BOF plants, these values are
consistent with the aggressive price strategies of CIS steelmakers in Central Eastern
Europe, where thanks to these cost differentials, they are able to undercut European
producers‘ prices by about 30 to 40 €/tonne. While wire rods made in Ukrainians BOFs
are the least cost output (549$), US (570$) and Russian (571$) companies are the least
cost EAF producers. In general, cost differentials for long products are narrower.

Page 39 of 259
Figure 12 Production costs per tonne of liquid steel ($ 2012)
Source: Authors‘ elaboration on WSD, 2012
Figure 13 Production costs per tonne of billets ($ 2012)
Source: Authors‘ elaboration on WSD, 2012
-
100
200
300
400
500
600
Brazil EAF
Ukraine BOF
USA EAF Russia EAF
Central Eastern Europe
EAF
China BOF
Turkey EAF
China EAF
Western Europe
EAF
-
100
200
300
400
500
600
700
Ukraine BOF
USA EAF
Brazil EAF
Russia EAF
Western Europe
EAF
Central Eastern Europe
EAF
China BOF
Turkey EAF
China EAF

Page 40 of 259
Figure 14 Production costs per tonne of wire rod ($ 2012)
Source: Authors‘ elaboration on WSD, 2012
1.3.1 Production cost differential for wire rods
Cost differentials for European long products compared to the least cost EAF producers,
i.e. US plants (see Table 4), are less marked than those registered for flat products.
Central European wire rods cost 60$ more than US production (+10%), while Western
European ones cost 53$ more (+9%). The existing differential mainly stems from
expenditures for raw materials and electricity, confirming the burdens hampering EU
steel making which emerged in the analysis for flat steel. Labour cost in the US is quite
high, mainly due to differences in purchasing power parity, in particular compared with
Central Eastern European countries.
-
100
200
300
400
500
600
700
Ukraine BOF
USA EAF Russia EAF
Brazil EAF
China BOF
Turkey EAF
Western Europe
EAF
Central Eastern Europe
EAF
China EAF

Page 41 of 259
Table 4 Cost differential between EU steel makers and least cost producers for wire rod ($
2012)
Central Eastern Europe EAF Western Europe EAF
Raw materials 39 41
Labour -37 -13
Electricity 39 32
Natural Gas 6 3
Other energy -0 -0
Other costs 3 20
Energy/Scrap Credit -4 -2
Overheads, depreciation, and interest
14 -28
TOTAL 60 53
Source: Authors‘ elaboration on WSD, 2012
1.3.2 Costs for raw materials, electricity, and gas
Western European (411$) steel makers and Central Eastern ones (410$) incur in similar
costs per tonne of wire rods with regard to raw materials (see Figure 37), whereas
Central Eastern companies have higher expenditure for electricity (78$, see Figure 38)
and natural gas (15$, see Figure 39), also due to a higher energy intensity per tonne of
output. The lowest costs for raw materials are incurred in Brazil (301$), with a
differential higher than 100$ when compared to European production costs. Russian
steel makers incur in the lowest costs per tonne both for electricity (37$, less than half of
the Central Eastern European levels) and for gas (3$, one fifth of Central Eastern
European costs). It is worth stressing that US and Brazilian facilities include production
of Direct Reduced Iron (DRI), which is a gas-intensive process, thus explaining large
costs for natural gas incurred by Brazilian EAF producers; indeed this effect is less
immediate for US EAF producers, due to availability of low cost shale gas.

Page 42 of 259
Figure 15 Raw material costs per tonne of wire rod ($ 2012)
Source: Authors‘ elaboration on WSD, 2012
Figure 16 Electricity costs per tonne of wire rod ($ 2012)
Source: Authors‘ elaboration on WSD, 2012
-
50
100
150
200
250
300
350
400
450
500
Brazil EAF USA EAF Russia EAF Central Eastern
Europe EAF
Western Europe EAF
China EAF Turkey EAF
-
10
20
30
40
50
60
70
80
90
Russia EAF USA EAF Brazil EAF Turkey EAF China EAF Western Europe EAF
Central Eastern
Europe EAF
Page 43 of 259
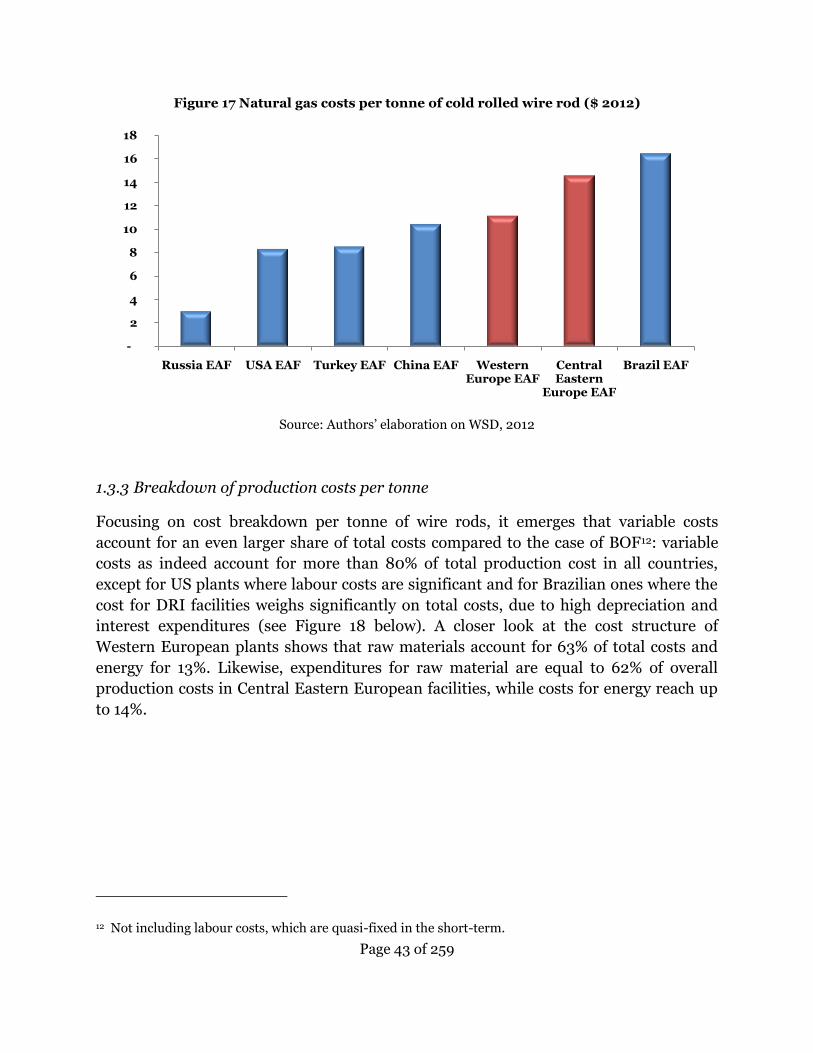
Figure 17 Natural gas costs per tonne of cold rolled wire rod ($ 2012)
Source: Authors‘ elaboration on WSD, 2012
1.3.3 Breakdown of production costs per tonne
Focusing on cost breakdown per tonne of wire rods, it emerges that variable costs
account for an even larger share of total costs compared to the case of BOF12: variable
costs as indeed account for more than 80% of total production cost in all countries,
except for US plants where labour costs are significant and for Brazilian ones where the
cost for DRI facilities weighs significantly on total costs, due to high depreciation and
interest expenditures (see Figure 18 below). A closer look at the cost structure of
Western European plants shows that raw materials account for 63% of total costs and
energy for 13%. Likewise, expenditures for raw material are equal to 62% of overall
production costs in Central Eastern European facilities, while costs for energy reach up
to 14%.
12 Not including labour costs, which are quasi-fixed in the short-term.
-
2
4
6
8
10
12
14
16
18
Russia EAF USA EAF Turkey EAF China EAF Western Europe EAF
Central Eastern
Europe EAF
Brazil EAF

Page 44 of 259
Figure 18 Breakdown of production cost per tonne of wire rod
Source: Authors‘ elaboration on WSD, 2012
0%
10%
20%
30%
40%
50%
60%
70%
80%
90%
100%
USA EAF Russia EAF
Brazil EAF
Turkey EAF
Western Europe
EAF
Central Eastern Europe
EAF
China EAF
Overheads, depreciation, and interestLabor
Other costs
Other energy
Natural Gas
Electricity
Raw materials

Page 45 of 259
2 Cumulative Cost Assessment
This section provides an overview of the cumulative regulatory costs borne by the EU
steel industry as a result of EU legislation. This assessment is based on the analysis
included in Part IV of the present report, where the acts for each policy area are
analysed and the methodology for each quantification is reported.
The analysis covers, to a varying degree, three typologies of costs, namely: (i)
compliance costs (or direct costs), i.e. the costs incurred for fulfilling the substantive
obligations spelled out in EU legislation (e.g. the respect of certain emission limits); (ii)
administrative costs, comprising the costs incurred to fulfil the administrative
obligations stipulated in the legislation (e.g. the costs for obtaining certain permits or
authorizations); and (iii) indirect costs, which refer to the costs incurred by steelmakers
as a result of regulatory measures that affect other operators along the value chain.
While the study analyzed the effects in no less than eight EU policy areas, regulatory
costs were identified and could be quantified in four areas, namely: (i) climate change
policy, (ii) energy policy, (iii) environmental policy, and (iv) product policy. The
cumulative cost exercise covers the 2002–2012 period. In some cases (e.g.
environmental policy, climate change policy) it was possible to compute estimates for all
(or most of) the years. In other cases (e.g. energy policy), reference was made to 2012.
Different estimation methodologies were used, making use of a combination of primary
and secondary sources. In some cases, estimates were based on information retrieved at
plant level from both public databases and interviews with plant operators. In other
cases, reference was made primarily to sector statistics, complemented as needed with
information derived from interviews with selected steel makers. In other still, data were
provided by industry associations, other stakeholders, published research or national
regulations.
Estimated cumulative costs are presented in terms of cost per unit of output
(€/tonne of steel). In order to provide an indication of the relative importance of the
impact of EU legislation on the steel industry‘s operations, regulatory costs per unit of
output were compared with key performance indicators, such as price-cost margin,
EBIT and EBITDA. Also, whenever feasible, separate estimates were derived for the two
main categories of steel makers, i.e. integrated plants (―BOF producers‖) and electric
mills (―EAF producers‖), as well as for a selection of steel products.
Two points are worth highlighting at the outset. First, the analysis inevitably suffers
from some limitations. In particular, some regulatory costs are likely to have been
incurred by the steel industry also in areas not covered by this study (e.g. labour
Page 46 of 259
regulation) and/or for which no meaningful quantification was possible (e.g. some
administrative costs linked to product regulation). In this respect, the figures presented
here may under estimate the actual burden placed by EU legislation on the steel
industry. At the same time, there are areas (namely, energy and environmental policies)
where the separate impacts of EU policy and national policies are difficult to
disentangle. In those cases, most of the effects were attributed to EU policy, which
therefore leads to an overestimate of impact of EU regulation. Overall, as the different
biases work in opposite directions, the figures presented here are believed to provide a
reasonably accurate picture of the burden for the steel industry.
Secondly, no attempt was made to provide a comprehensive view of regulatory costs that
might be incurred in the future. Some indications regarding future costs could be
derived in some policy areas (e.g. climate change, environmental policy). Nevertheless,
in most cases, estimating future costs requires a set of assumption and forecast which
would force this study to depart from its hard-fact approach.
The section proceeds as follows. First, the cumulative regulatory costs are quantified;
then, the production costs and margins for the EU steel industry are accounted for; and
finally, cumulative regulatory costs are compared against a set of margin indicators and
of production costs.
2.1 Cumulative costs of EU regulation
Here below, the categories of regulatory costs which could undergo quantification are
listed:
1. Climate Change. Costs due to the ETS legislation have been quantified, in terms
of:
a. Direct Costs. These refer to the cost of purchasing CO2 permits under the ETS
system on top of the free allocations. The proceeds from the sale of ETS
permits are regarded as negative costs. The cost estimate does not include the
investment, financial and operating costs incurred by steel makers to reduce
the CO2 emissions, as these costs are not easily separable from measures to
reduce environmental impacts. These costs are considered below under the
heading Environmental Policy;
b. Indirect Costs. These refer to the higher electricity prices paid as a result of
the price of CO2 permits passed on through electricity price, assuming that
these costs were entirely passed on to steel makers. Indirect costs have been
calculated based on the electricity intensity of steel production, the carbon

Page 47 of 259
intensity of electricity generation and the price of EUAs. Differently from the
analysis reported in Section 7, which focuses on crude steel, electricity
intensity has been increased to reflect the higher amount of electricity
required to produce finished products. Electricity intensity of finished
products has been retrieved from WSD prototypical plants data. The
following values have been estimated, as an average between Western and
Central Eastern European steel makers, weighted by 2011 production
volumes:
i. CRC: 0.433 MWh/tonne;
ii. HRC: 0.285 MWh/tonne;
iii. WR: 0.647 MWh/tonne.13
c. Administrative Costs. These refer to the one-off costs incurred by steel
makers for setting up the infrastructure for the measurement of CO2
emissions as well as the recurrent costs for monitoring, reporting and
verification.
For direct, indirect and administrative ETS costs, a weighted average of the values
for the plants in the sample has been calculated based on production (BOFs) and
capacity where, production was not available (EAFs).
2. Energy. Two components of the electricity tariffs have been decomposed and
quantified:
a. Transmission Costs. Although the general organization of the electricity
market depends on the EU acquis, the amount of transmission tariffs charged
to large industrial customers depends on national policies. It should also be
noted that in every world area, albeit different policies may result in a
different burden sharing between large industrial customers and other
market segments, either the customers or the public finances must bear
transmission costs. To estimate average transmission costs, national values
have been estimated based on ENTSO-E data and information retrieved from
the interviews (as reported in Section 9). For three countries, direct
information from interviewees was available. Reported data have been
validated through official sources and information provided by other
industrial customers; furthermore, they have made consistent, by considering
only transmission costs and not other charges. For five countries, information
from ENTSO-E was relied upon. Based on these data, a weighted average of
national values has been calculated based on 2011 production volumes. There
13 Average electricity intensity for crude steel: 0.179 MWh/tonne for BOF; 0.536MWh/tonne for EAF

Page 48 of 259
is a certain variance among national transmission costs, but not as
pronounced as for RES support. The average transmission costs are in the
area of 7-7.5 €/MWh,14 and five countries out of eight fall in a ±1.5% range.
Two countries impose a transmission costs about 50% lower.
b. RES support. Although the EU has set mandatory targets for the national
share of electricity generated through renewable sources, EU policies do not
specify the amount of support for RES, nor how this burden is shared among
different segments of customers, including large industrial customers. These
decisions, which eventually determine if and how much steel makers pay for
RES support, fall within the sphere of competence of member states.
Combining information retrieved from interviews and estimates from
secondary sources, the amount of RES support for steel makers has been
estimated for six out of the eight countries in the scope of the study, as
reported in Section 9.15 These countries represent 69% of crude steel
production in 2011. A weighted average of national values has been calculated
based on 2011 production volumes. It should be noted that the average hides
a large variance, where the difference between least and the most costly
countries amounts to an order of magnitude. Although the weighted average
is in the area of 5-5.5 €/MWh,16 in the sample there are countries where RES
costs are in the area of 1€/MWh; countries close to the average; and countries
in the area of €10/MWh;
Energy taxes have not been included, as they cannot be attributed to any extent to
the EU regulation on electricity taxation (see Section 9.3.5).
3. Environment. In the case of environmental policy, the analysis covered two
typologies of regulatory costs:
a. Direct costs refer to the costs incurred by steel makers to comply with the
substantive obligations of EU legislation in terms of pollution prevention and
control. Direct costs are further subdivided into three sub-categories, namely:
(a) investment costs (i.e. the money spent on pollution abatement measures
depreciated over the estimated life of assets), (b) financial costs (i.e. the
interest charges linked to investment outlays), and (c) operating costs (i.e. the
14 The weighted average varies for BOFs and EAFs, depending on country production volumes for each
techonology.
15 Missing value for HU and PT.
16 The weighted average varies for BOFs and EAFs, depending on country production volumes for each
techonology.

Page 49 of 259
incremental expenses for personnel, raw materials, consumables, etc.
associated with environmental protection interventions). The estimate of
direct costs is subject to a certain margin of variability due to two (i) the
existence of different estimates of environmental protection investments, and
(ii) the concurrence of EU and national legislation.
b. Administrative costs refer to the expenses incurred by steel makers in
connection with the issuance/renewal of the integrated environmental
permits and with inspections for compliance checking.
Steel makers also sustained some indirect costs, in the form of higher electricity
prices resulting from the expenses incurred by power producers in order to
conform to emission limits. However, these indirect costs, conceptually analogous
to those identified above in the case of climate change policy, could not be
estimated due to lack of data.
4. Products and LCA. In the case of product policy, the analysis focused on the
administrative costs related to the REACH Regulation. These encompass five sub-
categories of costs, namely: (i) the registration of substances, (ii) the updating of
registrations, (iii) the pre-registration of substances, (iv) the requirement to
provide information to downstream users, and (v) the submission of
documentation as part of the authorization/restriction process for dangerous
substances.
Cumulative regulatory costs have been estimated for the year 2012 and for a typical
year, as discussed in the section below.
2.1.1 Cumulative costs of EU rules in 2012
For some regulatory costs, as in the case of ETS, the availability of public information
complemented by sound assumptions allowed to carry out a diachronic analysis, i.e.
throughout the whole period of application of the legislation. For some other categories
of costs, the analysis is synchronic. In some cases, this is the outcome of the
methodology adopted. For example, for environmental cost a cumulated approach was
chosen as the most correct; however, this also means that a realistic cost estimate is
possible only for the last year of the period under analysis. In other cases, problems
were linked to data availability. E.g., in case of RES support, it has already proven
extremely difficult to retrieve information about the actual tariffs from secondary
sources and interviewees, let alone digging back in the past. For this reason, first the
cumulative regulatory costs are assessed for 2012, as this estimation for all cost
categories is available. Costs expressed in tonne of finished products are reported in
Table 5 for three finished products, HRCs, CRCs, and wire rods.

Page 50 of 259
Table 5 Cumulative regulatory costs in 2012 (€/tonne)
BOF HRC
BOF CRC
EAF WR
ETS
Direct -2.69 -2.69 -0.54
Indirect 0.29 0.45 3.06
Administrative 0.13 0.13 0.10
Sub-Total -2.27 -2.12 2.62
Energy
Transmission 1.58 2.40 3.48
RES 2.09 3.18 4.65
Sub-Total 3.67 5.58 8.12
Environment
Direct
Investment 1.35 1.35 1.13
Financial 0.73 0.73 0.61
Operational 4.05 4.05 3.39
Administrative 0.01 0.01 0.04
Sub-Total 6.15 6.15 3.39
Product Administrative – REACH 0.10 0.10 0.05
Sub-Total 0.10 0.10 0.05
Total 7.65 9.72 14.18
Source: Authors‘ elaboration
BOF and EAF producers face different regulatory costs in 2012, and EAFs bear the
higher cost per tonne of finished products. This is due to the higher impact that the
electricity-related costs, that are indirect ETS costs, transmission tariffs and RES
support, have on electro-intensive EAFs, and to the fact that they did not benefit from
ETS over allocation as much as BOFs. On the contrary, environmental investments
represent a significantly burden for BOF producers, which also have to bear marginally
higher administrative costs.
Across the different policy areas, for BOF producers the largest burden is due to
environmental protection, with a large share of environmental costs due to operational
costs; energy costs are also relevant for BOF plants, and more so for CRC, whose
production process is more energy intensive. Climate change legislation did not impose
any cost in 2012 on BOFs, due to the over allocation of EUAs, which more than
compensated indirect costs passed on through electricity price. As recalled, for EAF
producers, the largest costs arise from the energy area, due to high electricity intensity,
followed by investments in environmental protection. Climate change legislation
imposed on EAFs a cost of about 2.6 €/tonne due to indirect ETS costs.
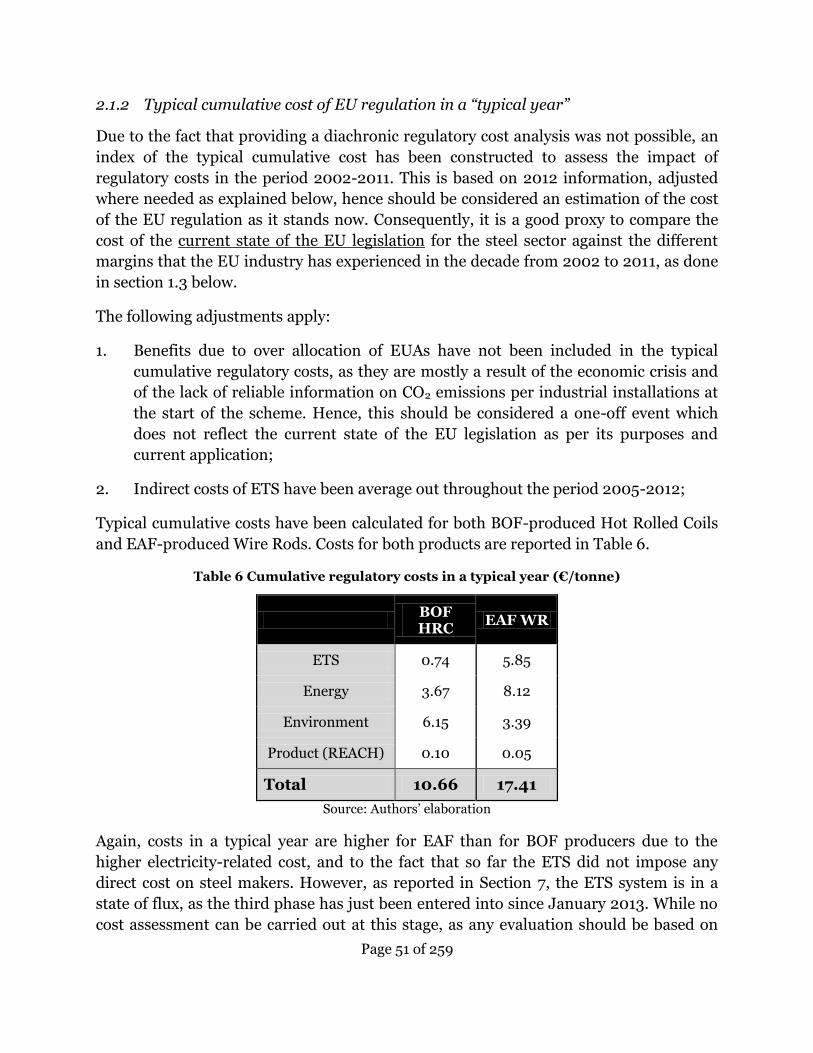
Page 51 of 259
2.1.2 Typical cumulative cost of EU regulation in a “typical year”
Due to the fact that providing a diachronic regulatory cost analysis was not possible, an
index of the typical cumulative cost has been constructed to assess the impact of
regulatory costs in the period 2002-2011. This is based on 2012 information, adjusted
where needed as explained below, hence should be considered an estimation of the cost
of the EU regulation as it stands now. Consequently, it is a good proxy to compare the
cost of the current state of the EU legislation for the steel sector against the different
margins that the EU industry has experienced in the decade from 2002 to 2011, as done
in section 1.3 below.
The following adjustments apply:
1. Benefits due to over allocation of EUAs have not been included in the typical
cumulative regulatory costs, as they are mostly a result of the economic crisis and
of the lack of reliable information on CO2 emissions per industrial installations at
the start of the scheme. Hence, this should be considered a one-off event which
does not reflect the current state of the EU legislation as per its purposes and
current application;
2. Indirect costs of ETS have been average out throughout the period 2005-2012;
Typical cumulative costs have been calculated for both BOF-produced Hot Rolled Coils
and EAF-produced Wire Rods. Costs for both products are reported in Table 6.
Table 6 Cumulative regulatory costs in a typical year (€/tonne)
BOF HRC
EAF WR
ETS 0.74 5.85
Energy 3.67 8.12
Environment 6.15 3.39
Product (REACH) 0.10 0.05
Total 10.66 17.41
Source: Authors‘ elaboration
Again, costs in a typical year are higher for EAF than for BOF producers due to the
higher electricity-related cost, and to the fact that so far the ETS did not impose any
direct cost on steel makers. However, as reported in Section 7, the ETS system is in a
state of flux, as the third phase has just been entered into since January 2013. While no
cost assessment can be carried out at this stage, as any evaluation should be based on

Page 52 of 259
forecasts rather than on actual data, and thus not in line with the analysis presented
above, the future direct costs of ETS will increase and become positive. Depending on
future EUA prices, the scenario analysis therein reported for a single plant seems to
indicate that the regulatory cost advantage of BOFs is likely to disappear.
Given that margins for the period 2002-2011 are available for the steel industry as a
whole, rather than for specific products,17 the typical cumulative cost has also been
calculated for a non-technology specific plant. This value results from the average of the
BOF and EAF costs weighted by the EU cumulated production through both routes in
the period 2002-2011; it is reported in Table 7 below.
Table 7 Cumulative regulatory costs in a typical year – Non-technology specific plant
(€/tonne)
Typical
Year
ETS 2.79
Energy 5.46
Environment 5.04
Product (REACH) 0.08
Total 13.37
Source: Authors‘ elaboration
2.2 Production costs and margins of the EU steel industry
2.2.1 Production costs and margins of the EU steel industry in 2012
Production costs
Per-tonne production costs incurred by steel makers have been estimated in Section 1 by
relying on data provided by WSD and updated to December 2012. In particular, costs for
EAF wire rods and for HRC and CRC made in integrated plants have been detected. In
order to account for the existing differences in terms of input prices and technical
efficiency between plants located in old member states and those located in new
member states, cost were separately estimated for Western Europe and Central Eastern
Europe. Here, to ensure comparability with cumulative costs of EU regulation
17 This is also the custom comparison in this industry, as reported by Eurometal.
Page 53 of 259
summarized in the previous section, per-tonne costs for a typical European BOF
producer as well as for a typical EAF plant have been estimated, as an average between
production costs incurred by Western and Central Eastern European steel makers,
weighted by their 2011 production volumes (see last row in Table 8).18 In addition, costs
have been converted in Euro.19
Margins
The assessment of margins registered by the EU steel industry is not an easy task.
Indeed it is very hard to retrieve meaningful information from companies‘ balance sheet
data, since many companies – especially the largest ones accounting for very high share
of EU steel production – are involved in several business lines, thus making it complex
to single out balance sheet indicators such as profits/losses, EBIT, or EBITDA
representative of steel making activities and, even worse, on particular production
segments.
One way to estimate margins is to consider the price-cost mark-up, by computing the
differential between market prices and production costs for finished products,
differentiating between full production costs, capital costs, financial costs and the costs
of raw materials. Average market prices per tonne of wire rod, HRC, and CRC registered
in 2012 are drawn from MEPS.20 Table 8 shows a set of margin proxies calculated for
each finished product in scope of this Section:
1. Price-cost margin, i.e. the difference between market price and overall production
costs;
2. EBIT, i.e. the difference between market price and production costs, excluding
interest and taxes;
3. EBITDA, i.e. the difference between market price and production costs, excluding
interest and depreciation;
4. Margin over raw materials, i.e. the difference between market prices and cost
incurred by BOF producers to purchase the required amount of coal, coke, iron
ore, and scrap; and by EAF ones for scrap, pig iron, and DRI.
In 2012 margins for integrated plants making flat products are very narrow and even
negative when looking at price-cost margins and EBIT for CRC. On the contrary, EAFs
18 Production volumes by country and production process are provided by World Steel (2012).
19 USD/EUR exchange rate: 1.285 (2012 annual exchange rate, source: ECB).
20 MEPS EU Carbon steel prices with individual product forecasts, available online at
http://www.meps.co.uk/EU%20price.htm, last accessed on 31 May 2013.

Page 54 of 259
making long steel enjoyed better results. EBITDA figures for HRC made in BOF and
wire rod made in EAF are comparable, in line with the higher capital intensity of
integrated producers. The largest differential between market price and raw material is
registered by CRC, representing the most energy intensive production as well as the
highest added value output (see Table 9).
Table 8 Production costs and margins of the EU steel industry (2012 - €/tonne)
Wire rod (EAF) HRC (BOF) CRC (BOF)
Price-Cost margin 38 -3 -34
EBIT 43 9 -20
EBITDA 58 50 30
Price-Raw Materials 203 179 240
Production costs 485 519 626
Source: Authors‘ elaboration on WSD, 2012; and MEPS, 2013.
Table 9 Margins of the EU steel industry (% over market price)
Wire rod (EAF) HRC (BOF) CRC (BOF)
Price-Cost margin 7.2% -0.6% -5.7%
EBIT 8.2% 1.7% -3.3%
EBITDA 11.2% 9.6% 5.0%
Price-Raw Materials 38.9% 34.8% 40.5%
Source: Authors‘ elaboration on WSD, 2012; and MEPS, 2013.
2.2.2 Margins of the EU steel industry between 2002 and 2011
Margins registered by the EU steel makers in 2012 might not be representative for the
average profitability of the European steel industry, as they are largely affected by the
overall economic downturn started in 2009.21 For such a reason, an estimate of industry
margins over the period 2002-2011 has been provided (see Table 10). Data on EBITDA
per tonne of steel shipped by EU producers are reported in the ―Global Steel Financial
Reports‖ (GSFR) database, included in the GSIS platform compiled by WSD. GSFR
includes per-tonne EBITDA for a sample of producers accounting for 22% of the total
production capacity installed in the EU in 2010 (34% of total BOF capacity and 4% of
total EAF).22 In order to increase the representativeness of the sample, balance sheet
data for 69 European steel makers – including both BOF and EAF producers and
covering 17 member states - have been taken into account. Margins registered by these
companies have been used to adjust the estimates provided by WSD, thus computing an
21 EU steel production in 2012 was lower than in 2002 and experienced a decrease when compared to
2011 levels.
22 Steel Business Briefing & EuroStrategy Consultants, 2010.

Page 55 of 259
average annual EBITDA for the EU steel industry. As a result, over the period 2002-
2011, EBITDA went from – 25 €/tonne of steel in 2009 to 142 €/tonne in 2006.
With regards to HRC, figures for margin over raw materials have been estimated on data
kindly provided by Eurometal. In the same period this margin went from € 132 per
tonne in 2002 to € 315 per tonne in 2008.
Table 10 Margins of the EU steel industry (€/tonne at constant 2012 prices)
2002 2003 2004 2005 2006 2007 2008 2009 2010 2011
EBITDA* 48 71 99 77 142 110 92 -25 38 43
Price-Raw Materials (HRC)**
132 174 312 275 248 266 315 147 194 130
Source: *Authors‘ elaboration on WSD, 2012;**Eurometal, 2013.
2.3 The impact of cumulative regulatory costs
This section presents the impact of the cumulative costs due to EU legislation on the
margins and costs of the steel industry. Table 11 reports the comparison against costs
and margins for 2012.
Table 11 The impact of cumulative regulatory costs – 2012
Wire Rod (EAF) HRC (BOF) CRC (BOF)
Price-Cost margin
37.3% -255.0% -28.6%
EBIT 33.0% 85.0% -48.6%
EBITDA 24.4% 15.3% 32.4%
Price-Raw Materials
7.0% 4.3% 4.1%
Production costs
2.9% 1.5% 1.6%
Source: Authors‘ elaboration
Cumulative regulatory costs are low compared to the overall cost of steel production.
For EAF wire rods, they represent about 3% of total costs. For BOF producers, they
represent less than 2% of the cost of producing HRCs and CRCs. As far as the price-raw
material margin is concerned, in 2012 regulatory costs represent about 7% of this
margin for EAF products and about 4% of the margin for BOF products. Raw materials
costs are largely exogenous for European steel makers, given that they have almost no
grasp on raw materials worldwide resources and thus price. Price-raw materials margins
are important, and according to many interviewees are customarily kept under control

Page 56 of 259
by both steel makers and customers, and constitute a fair proxy of the value added
generated by the industry, especially for BOF producers (which are characterized by
relatively lower costs for electricity and gas and higher efficiency in energy recovery).
As 2012 has been a bad year for the steel industry, with low margins, tight competition
and a situation of overcapacity due to the economic cycle, the cumulative regulatory
costs, albeit low in absolute terms, can bite away profitability. And indeed this is
confirmed by the share of regulatory costs over EBITDA. For EAF producers, regulatory
costs measured in this study represent about a quarter of their EBITDA; for BOF
producers, regulatory costs represent between 15% and 33% of the EBITDA. At smaller
margin proxies, that is the EBIT and the price-cost margin, the share of regulatory costs
obviously increases.
Impacts of cumulative regulatory costs on production costs and margins are shown in
Figure 19, Figure 20 and Figure 21 below.
Figure 19 Cumulative regulatory costs vs. margins and production costs – Wire rod (2012,
€/tonne)
Source: Authors‘ elaboration
0
50
100
150
200
250
300
350
400
450
0
50
100
150
200
250
300
350
400
450
Price-Cost margin
EBIT EBITDA Price-Raw Materials
Production costs
Wire rod (EAF)
Regulatory costs

Page 57 of 259
Figure 20 Cumulative regulatory costs vs. margins and production costs – HRC (2012,
€/tonne)
Source: Authors‘ elaboration
Figure 21 Cumulative regulatory costs vs. margins and production costs – HRC (2012,
e/tonne)
Source: Authors‘ elaboration
-50
50
150
250
350
450
-50
50
150
250
350
450
Price-Cost margin
EBIT EBITDA Price-Raw Materials
Production costs
HRC (BOF)
Regulatory costs
-50
50
150
250
350
450
550
-50
50
150
250
350
450
550
Price-Cost margin
EBIT EBITDA Price-Raw Materials
Production costs
CRC (BOF)
Regulatory costs

Page 58 of 259
The steel industry is a pro-cyclical industry. Hence, to have a fuller picture, typical
cumulative regulatory costs are compared with two proxies of the industry margins in
the period 2002-2011. Here, it becomes clear as the significance, and thus the impact, of
regulatory costs changes accordingly to the cycle. As shown in Table 12, Figure 22, and
Figure 23, cumulative regulatory costs over EBITDA23 were in the area of 9 to 15% in the
boom years. Such a share of regulatory costs over EBITDA is unlikely to put EU steel
makers in a dangerous competitive position. Actually, many would consider it a ―fair
price‖ to pay to enjoy the benefits of Europe, such as proximity to high-added value
customers or the access to a skilled labour force. However in times of crisis, regulatory
costs may be even higher than EBITDA, such as this was the exceptional case of 2009,
or, more often, fall in the area of 28% to 35% of the EBITDA. At this level, they may
endanger the viability of the industry, as the EBITDA needs to cover financial
expenditures, depreciation and amortization, that is the cost of capital.
The same reasoning goes for the share of regulatory costs over the price-raw materials
margin.24 The competitive position of the EU steel industry is sharply different if 3% to
4% of actionable costs are spent to comply with EU regulation, as in the boom years, or
whether this share reaches up to more than 8%, as it was the case in 2002 or 2011.
Table 12 The impact of typical cumulative regulatory costs – 2002 – 2012
2002 2003 2004 2005 2006 2007 2008 2009 2010 2011
EBITDA 28.1% 18.9% 13.4% 17.3% 9.4% 12.2% 14.5% -53.9% 35.0% 30.9%
Price-Raw Mat. (HRC) 8.1% 6.1% 3.4% 3.9% 4.3% 4.0% 3.4% 7.3% 5.5% 8.2%
Source: Authors‘ elaboration
23 Regulatory costs: typical cumulative costs for the EU steel industry (13.37 €/tonne of finished
product).
24 Regulatory costs: typical cumulative costs for HRC (10.66 €/tonne of HRC).

Page 59 of 259
Figure 22 Typical cumulative regulatory cost vs. steel EBITDA (2002-2011)
Source: Authors‘ elaboration
Figure 23 Typical cumulative regulatory cost vs. HRC Price-Raw Materials margins (2002-
2011)
Source: Authors‘ elaboration
-40
-20
0
20
40
60
80
100
120
140
160
2002 2003 2004 2005 2006 2007 2008 2009 2010 2011
EBITDA
Regulatory costs
0
50
100
150
200
250
300
350
2002 2003 2004 2005 2006 2007 2008 2009 2010 2011
Price-Raw Materials (HRC)
Regulatory costs

Page 60 of 259
Finally, Table 13 and presents the comparison of cumulative regulatory costs in 2012
with the cost differentials with the least cost producer, as reported in Section 1 above.25
Both cost differentials including and excluding raw materials are compared to. The
latter is important as the cost of raw materials is, for most European steel makers, an
exogenous factor. However, what determines the relative competitiveness of the EU
steel industry is the former, i.e. the total cost differential including raw materials.
Importantly, the comparison has a certain degree of spuriousness. Indeed, in some cases
EU producers are the only ones bearing certain categories of costs (e.g. REACH); in
some other cases, European producers bear higher costs but other world areas have
implemented or are going to implement similar regulations (e.g. RES support, carbon
price mechanisms); in some other cases European producers are not at all at a
measurable disadvantage (e.g. US steel makers, the least cost producers for wire rods,
face comparable environmental protection standards). However, the following
comparison provides an idea of how much regulatory costs impact on the EU
international competitiveness.
Table 13 The impact of cumulative regulatory costs on cost differentials – 2012
Wire Rod
(EAF, US)
HRC
(BOF, RUS)
CRC
(BOF, RUS )
Cost Differential 35.60% 6.80% 6.00%
Cost Differentials w/o Raw Materials
109.08% 13.66% 8.24%
Source: Authors‘ elaboration
25 Average cost differentials for Western and Central Eastern European producers, weighted by relative
share of EAF and BOF production volumes in 2011. USD/EUR exchange rate: 1.285 (2012 annual
exchange rate, source: ECB).

Page 61 of 259
Figure 24 The impact of cumulative regulatory costs on cost differentials - 2012
Source: Authors‘ elaboration
Results are not straightforward. On one side, the share of cumulative regulatory costs is
relatively higher for EAF wire rods, for which they represent more than a third of the
overall cost differential, and are slightly higher than this differential excluding raw
materials. However, this is the finished product for which the cost gap is narrower,
hence for which the competitiveness disadvantage of EU producers is smaller. In a
nutshell, for EAF producers cumulative regulatory costs represent a large share of a
small differential. Furthermore, given that the least cost producers are US EAFs, the
regulatory cost differential would most likely be significantly smaller if a detailed
analysis of US regulatory costs were included. On the contrary, for BOF products, where
the least cost producers are Russian steel makers, and for which the regulatory cost
differentials as reported above is likely to be a fairer proxy of reality, it appears that the
causes of the cost differentials cannot be attributed, if not to a small extent, to EU
regulatory costs, even when considering cost differentials without raw materials (on
which the share of regulatory costs is obviously higher).
0
20
40
60
80
100
120
140
160
180
200
Wire Rod (EAF: EU vs. US)
HRC (BOF: EU vs. Russia)
CRC (BOF: EU vs. Russia)
Regulatory costs
Cost differential
Cost differential (raw materials excluded)
Page 62 of 259
PART II
A METHODOLOGY FOR
THE CUMULATIVE COST
ASSESSMENT

Page 63 of 259
3 A methodology for the assessment of cumulative
costs on the steel industry
3.1 The framework of the study
The objective of the study is to identify, assess, and where possible quantify, the
cumulative costs imposed by EU legislation on the steel sector. This study is part of a
broader assessment of the cumulative cost of EU legislation in two industrial sectors in
the EU, namely aluminium and steel.
Specifically, it is worth recalling the importance of a full assessment of the other and
equally important side of the coin with respect to cumulative costs, i.e. cumulative
benefits. Regardless of their specific area, policies are adopted because they are expected
to deliver a set of specific benefits. Overall, benefits of adopted policies are expected to
justify the costs generated by the policy under examination, although those affected by
the costs and benefits do not always coincide. This is often the case for the so-called
regulatory policies, which tend to have concentrated costs and more diffuse benefits.26
EU policy in particular includes the following provisions:
1. Safety, Health, Environmental and Consumer (SHEC) regulation on different
sectors, including the steel industry. These rules supposedly deliver social
benefits; however, while such benefits mostly occur for society at large, the
corresponding costs normally remain, if not passed on downstream in the form of
higher prices, with the addressees, including steel makers;
2. The EU also adopts a free trade policy which makes the EU Single Market fully
open to extra-EU steel products. A free trade policy is capable of delivering
benefits to the society at large which more than compensate its costs. EU industry
benefits directly from a free trade policy by getting broader access to third
countries markets. A free trade policy does of course not preclude the possibility of
resorting to trade defence means (anti-dumping and countervailing duties), when
the necessary conditions are met in order to counter unfair trading practices;
3. Competition and state aid rules, such that (with limited exceptions, i.e. aid in
restructuring, environmental aid)27 the EU steel industry operates in a competitive,
26 While discussing the benefit-cost features of different types of policies (regulatory, distributive, etc.) falls beyond the scope of this study, for a classic contribution on the topic see, M. Olson (1965), The Logic of Collective Action, Cambridge, MA: Harvard University Press.
27 By way of example, see the OECD inventory of fossil fuels subsidies and other support at http://www.oecd.org/site/tadffss/.

Page 64 of 259
non-subsidised market. This approach is normally associated with wider benefits
for society at large, as resources are free to flow towards the most productive
sectors, rather than being artificially allocated to certain industries (so-called
―allocative efficiency‖). However, the same market approach is not always
prevalent in other areas/regions of the world and, as a result, EU steel makers may
find themselves at a comparative disadvantage.
As briefly explained, these policies are supposed to deliver benefits. However, when
considered together, they present possible trade-offs. In a globalised world, if an
economic area pursues these three policies at the same time and in isolation (and we are
not claiming that the EU is doing so), its industry - in this case the steel sector - may be
at risk of losing competitiveness. In particular, SHEC regulations create additional costs
for the industry located within that economic area. At the same time, the lack of direct
support prevents societal resources to compensate for these costs; and a free trade
policy prevents price differentials with international competitors to be established,
which would again compensate for SHEC costs. If SHEC regulatory costs are significant
enough to overcome the benefits of proximity - transport cost savings, as well as less
quantifiable benefits stemming from trust, close relationships with customers, and
external network economies – producers will find it rational to invest in and import
from other areas of the world, where SHEC regulation is partly or fully lacking.
This report does not only look at the mere effect of EU policies on the competitiveness of
the EU steel sector, and looks also at other factors that affect the cost structure of the
steel industry, and thereby its international competitiveness. In particular, we consider
energy costs not attributable to regulation, and the costs of access to raw materials at
the global level. These factors play a role in creating positive or negative cost
differentials, and therefore need to be taken into account in the analysis. However, it is
important to point out that these costs do not result directly from existing EU policies,
and these policies as such cannot fully explain the current evolution of competitiveness
in the EU steel sector. However, the fact that these costs do not stem directly from
specific EU policies does not mean that EU policy cannot be changed in order to address
them: for example, the absence of a fully integrated energy market in Europe can be
considered as a cause of high energy prices.
Finally, it should be noted that the EU is not the only tier of government with the power
to regulate the steel industry. Although trade policy is an exclusive competence of the
EU, both SHEC regulations as well as direct subsidies fall within the EU and Member
States‘ sphere of competence. In the study, national policies will be taken into account
where appropriate (e.g. regarding the differences in the costs of electricity), but should
be considered as another exogenous factor from the perspective of the EU policymakers.
Against this background, the aim of this study is:

Page 65 of 259
To identify, assess, and where possible quantify, the cumulative costs of EU
legislation in the steel sector;
Compare these costs with the costs of international steel competitors, and
Understand if and how much the costs of EU regulation impact on the cost
structure of the European steel industry and on its competitiveness.
Once the aim of the study has been identified, it is also worth clarifying what this study
does not do. In particular, this study does not contain an assessment of the
overall costs and benefits of the legislation analyzed. As explained above, we
assess only the costs of legislation, and only for the steel industry. For example, this
study does not assess whether the ETS system delivers net benefits to the EU society, or
whether the net impact of the ETS system on the steel industry, if any, is positive or
negative. It only aims at calculating the costs borne by the steel industry due to the ETS
system. Any assessment of the appropriateness, effectiveness and efficiency of the
legislations as such falls out of the remit of this study.
More specifically, while in terms of scope this study follows an approach similar to a
―fitness check‖, in the meaning of the 2012 European Commission Communication on
Regulatory Fitness28 (as it considers several legislative acts rather than a single act, and
it adopts an ex post perspective, rather than an ex ante one), in reality its scope is more
limited. Fitness checks assess the fitness, effectiveness, burdensomeness and coherence
of the EU legislation in a given policy area or sector; conversely, this study only focuses
on the third evaluation criterion, i.e. burdensomeness, as its goal is to assess the
cumulative cost of EU legislation on the steel industry.
In more methodological terms, the assessment of regulatory costs, can be performed by
a top-down or a bottom-up approach. In the former case, regulatory costs would be
assessed on the whole sector; in the latter, on a set of typified facilities. In principle This
study opts for a bottom-up approach, because of its advantages in terms of accuracy,
relevance, and actionability thanks to the higher level of granularity of the information
obtained. As the aim of the study is to assess competitiveness and the impacts on
investment decisions, overall impacts are likely to be less relevant and actionable for
policymakers. Competition and investment decisions depend on the impact of
regulation on each firm, rather than on the sector as a whole. Furthermore, a micro
analysis of certain typified facilities is likely to ensure a higher degree of accuracy, and of
comparability with foreign installations, as it requires a narrower set of assumptions
(e.g. on the validity of certain findings for the whole firm population). To ensure the
external validity of the study, defining a sample of ―representative‖ steel facilities
28 Communication from the Commission, EU Fitness, COM(2012)746, 12.12.2012.
Page 66 of 259
becomes a key factor. Only when costs for certain typologies of plants are assessed,
estimation for the whole sector can be carried out.
However, as the analysis proceeded, it became clear that the bottom-up approach is not
suitable for all the policy areas. This is due mainly to two reasons:
1. Heterogeneity. For compliance with environmental standards, and in particular
with the Industrial Emission Directive, the sampling strategy could not be
successful, as the heterogeneity of steel plants in terms of status quo is both too
high and impossible to comprehend ex ante based on secondary sources. A full-
fledged bottom-up analysis would require access to detailed engineering data for
each single plant, which is not feasible for the more than 200 EU plants currently
in operations. Thereby, quantification of compliance costs in this policy area is
based on a top-down survey of investments in environmental protection measures,
complemented with interviews with plant operators;
2. Data availability. In some cases, granular data from plants will not possibly be
retrieved, due to issues of confidentiality and timing of cooperation with industry
representatives and operators. Where retrieval of data from primary sources is not
possible, secondary sources, which in some cases adopt a top-down (i.e. sector-
comprehensive) approach, are resorted to.
3.2 The object of analysis: the cost structure
The study considers the costs borne by the firms falling within the class 24.10 of the
NACEv2 classification: manufacture of iron and steel and ferro-alloys (see Table 2
above).29 This section includes steel makers stricto sensu, excluding ―non-integrated‖
players which operate in the industry value chain without producing crude steel.
Namely, the following entities are excluded: upward, manufactures of coke oven
product; downward, companies transforming intermediate and semi-finished steel
products into finished manufactures. Focusing on this class allows the study to treat
similar entities, thereby increasing the degree of internal validity.
Within the steel industry, as defined above, the consultants study the cost structures of a
set of typical plants. These cost structures are the core units of analysis of the study.
Once defined, it is possible to assess the impact of regulatory costs on these structures,
both in terms of operating expenditures and annualised capital expenditures.
29 Manufacture of tubes, pipes, hollow profiles and related fittings, of steel (NACEv2 24.20) is considered
only if integrated, i.e. plants which also produce crude steel.

Page 67 of 259
Furthermore, these cost structures can be compared with the cost structures of
comparable international firms.
To define the cost structure of European steel makers, the consultants resort to a
commercial data provider. Commercial providers maintain bases of data at plant level
for several hundred worldwide facilities. The following providers were identified as
suitable, and their respective coverage, methodology and data quality has been assessed
in details to make a choice:
1. World Steel Dynamics;
2. Metal Bulletin; and
3. CRU.
World Steel Dynamics provided the most suitable data for this study, and hence was
chosen. This provider makes available the following data for 60 steel plants in Europe
(including both BOF and EAF routes) and about 200 plants worldwide:
1. Cost of production of flat rolled steel;
2. Cost of production of billets and wire rods.
In addition, it also provides the following complementary information:
3. Trade statistics;
4. Financial data of steel companies.
Focusing on cost structure, World Steel Dynamics provides a detailed breakdown the
following categories of costs: i) different raw materials; ii) different energy sources; iii)
labour; iv) depreciation; v) overheads; and vi) financial costs. Costs of production are
provided for each phase of the steel production process, i.e. coke making, pig iron, liquid
steel, and the different semi finished products. Importantly, World Steel Dynamics
allows varying the cost parameters to perform a sensitivity analysis.
Once the cost structures have been defined, the consultants perform an analysis based
on the quantification of regulatory costs due to European legislation, which means:
1. Quantifying the costs due to the European legislation. This important step is
discussed in details in the section 3.3 below;
2. Highlighting these costs in the steel maker cost structures and assess how they
impact on the industry competitiveness (e.g. on the production costs, margins, and
international cost differentials).
Page 68 of 259
In order to assess the effects on international competitiveness, the costs borne by
European steel makers are compared against the costs of typical facilities located in the
following areas: United States, Turkey, China, Brazil, Russia, and Ukraine. These
locations are among the top destinations for EU imports and exports (see Table 19
below), and represent a balanced mix of proximate and distant locations.
3.3 Assessment or regulatory costs
The study cannot resort to a consolidated methodology to assess the cumulative cost
impact of all the EU legislation on a given industry. In uncharted waters, the consultants
intend to combine three different approaches:
1. Measurement of administrative costs;
2. Measurement of compliance costs;
3. Measurement of indirect costs.
Administrative costs are those costs incurred by firms to provide information to public
authorities and third parties. They are generated by Information Obligations (IOs)
included in the legislative acts. Administrative costs are measured through the Standard
Cost Model. The standard cost model methodology requires the identification of the
annual cost of each IO. To do so, consultants quantify the time devoted to comply with
the IO by a ―normally efficient firm‖; multiply this value by the salary rate of the
personnel figure(s) carrying out the IO; and by the number of yearly occurrences
(frequency) of the IO. Once the cost per IO is identified, it is possible to calculate
aggregate costs for the whole industry, by multiplying the annual cost per IO by the
number of firms affected (the population).
Administrative costs, even when significant for some policy areas, represent only a
relatively small share compared to the category of compliance costs. The measurement
of compliance costs can be done along the same steps; however, its scope is larger.
Compliance costs include not only costs due to IOs, but also to Substantive Obligations
(SOs) and Monetary Obligations (MOs). SOs are provisions which require the firm to
take actions to adapt its productive process to comply with the legal act. The most
common example would be the installation of anti-pollution filters to comply with
emission limits. MOs are provisions which require the firm to bear monetary costs, such
as costs of allowances, fees, taxes and levies.
Still, the methodology to assess compliance costs remains similar. Hence, the
consultants will attempt to quantify the cost per occurrence for each SOs and MOs. This
requires identifying the following categories of costs: i) Investment Costs (ICs); ii)

Page 69 of 259
Operating Costs (OCs); and iii) Financial Costs (FCs). Once this is done, the annual cost
is obtained by either multiplying the cost per occurrence by the annual frequency for
recurring obligations; or by annualising the cost per occurrence in case of one-off
obligations. As for IOs, once the cost per SO or MO is identified, it is possible to
calculate aggregate costs for the whole industry by multiplying it by the number of firms
affected (the population).
Administrative costs and compliance costs, which include investment, operating and
financial costs, cover the set of direct costs imposed by the EU legislation on the steel
industry.
Despite its apparent simplicity, the main challenge in the proposed methodology is
estimating the cost per single occurrence, especially in the case of investment costs.
Depending on the complexity of the regulatory provisions, and their burdensomeness,
the consultants intend to resort to the following approaches:
1. Standardised estimates. These can be resorted to when obligations are relatively
simple and do not represent a significant burden;
2. Desk research, retrieving from various sources estimates of administrative or
compliance costs stemming from a specific act or provision. For example, the cost
of certain provisions could have been estimated in Impact Assessments or external
preparatory studies;
3. Consultation with stakeholders, in line with the standard methodologies for the
assessment of administrative and compliance costs;
To produce a fair picture of the costs of EU regulation, the Business-As-Usual (BAU)
factor and is to be taken into account. The BAU factor represents the share of regulatory
costs which a firm would bear even absent a regulation. E.g., a steel maker must comply
with certain energy efficiency limits; however, it would undertake some investments in
energy efficiency even if there were no regulations, up to the point in which the marginal
cost of investments equals marginal energy savings. Determining the BAU factor can
sometimes result in establishing a challenging counterfactual, but it is important
because it allows distinguishing between instances in which a regulation is only
―consolidating‖ industry practices, and instances in which a regulation creates a truly
additional burden. To provide an estimate of the BAU factor where relevant, the
consultants resort to the same methods used to determine regulatory costs. The same
reasoning applies concerning the legal origin of the regulatory costs, e.g. whether a cost
is the result of international, EU or national policies. Given that disentangling these
three effects on investment and operating expenditures is hardly possible, sensitivity
logic is adopted when needed.

Page 70 of 259
Finally, the issue of indirect costs needs to be unfolded. Indirect costs can be defined as
costs of regulation which have an impact on steel producers not as direct addressees, but
as counterparts of direct addressees. An example can be energy policies, whose
addressees are i.a. electricity producers, which are suppliers of the steel industry; or
product regulation, whose addressees are e.g. appliance producers, which are customers
of the steel industry.
In this respect, clear boundaries need to be set to ensure that the study does not end up
being too broad. First of all, the causation link between the act and the effects must be
reasonably proximate. This means that only indirect effects originating from the most
proximate counterparts of steel makers (such as suppliers) can be taken into account.
Secondly, the indirect effects must be significant, i.e. resulting in a measurable cost
differential for the steel industry.
3.4 The selection of typical facilities
As already recalled, the cost structures of typical European steel facilities are the objects
of analysis of the study. In this section, the relevant criteria to define the sample of
typical facilities are listed.
The first criterion to define the sample is the technology adopted. The following
technologies are relevant in the EU market:
1. Integrated BOF producers;
2. Partially integrated BOF producers (i.e. without coke ovens and/or without blast
furnace);
3. EAF producers.
For each technology, plants may have different capacity. The sample is then to reflect a
distribution of capacity similar to that of the steel making universe (as retrieved from
The World Steel Capacity Book and other sources).
Technology and capacity could already allow characterizing a set of typical facilities.
However, other criteria need to be taken into account to ensure that the sample provides
an appropriate geographical coverage. The application of these criteria, as well as the
exact capacity, is kept confidential, in order for facilities not to be singled out. Indeed,
there are few hundred facilities in Europe, and if the geographical criteria were made
public, each sampled facility could be directly identified. As regards the geographical
coverage, the following criteria are applied.

Page 71 of 259
1. Steel production per member state. As the most important steel producing
member states (Germany, Italy, Spain, France, United Kingdom, Poland, Belgium,
Austria, and the Netherlands), as identified in Figure 26 below, represent 76% of
crude steel production, a comparable share of sampled facilities will be located
therein;
2. Large vs. small member states. Facilities from both large member states, i.e. with
population larger than 30 mln inhabitants (representing about 70% of EU citizens
and 64% of the crude steel production), and small member states, with population
smaller than 30 mln inhabitants, will be included in the sample according to the
relative weight.
3. South. Vs. East. Vs. West/North. Facilities will reflect the relative weight of the
following geographical areas:
a. Southern European member states (Italy, Spain, Portugal, Greece, Malta,
Cyprus), which represent 27% of crude steel production in 2011;
b. Central Eastern European member states (Poland, Slovenia, Hungary,
Romania, Bulgaria, Czech Republic, Slovak Republic, Estonia, Latvia,
Lithuania), which represent 15% of crude steel production;
c. Western and Northern European Member States, which represent 58% of
production.
4. Coastal vs. Landlocked. Facilities should be located in both coastal and landlocked
areas (taking into account landlocked locations which are served by inland
waterways).
5. Owner. The sample will include facilities from Global Players, Regional Champions
and Niche Specialists.
3.5 The scope of the study: the policy areas
Eight policy areas and 52 EU legislative acts and non-legislative polices fall within the
scope of the study. They are listed in the Table 14 below. For commodity markets, 4 acts
have been added compared to the list included in the Terms of Reference; they are shon
in italic in the table below.

Page 72 of 259
Table 14 List of legislation in scope of the study
Policy Area Legislative acts and other policies
1. General Policies Europe 2020 A strategy for smart, sustainable and inclusive growth,
COM(2010)2020
An Integrated industrial policy for the globalisation era - Putting
competitiveness and sustainability at centre stage, COM(2010) 614
Roadmap to a resource efficient Europe, COM(2011) 571
2050 low carbon roadmap, (COM(2011) 112)
2050 energy roadmap, (COM(2011) 885)
Soil thematic strategy, COM/2006/0231
Innovation Union - Europe 2020 flagship initiative, COM(2010) 546
2. Climate Change Carbon leakage list (Decision 24/12/2009)
Directive 2003/87/EC establishing a scheme for greenhouse gas emission
allowance trading within the Community (ETS)
Directive 2009/29/EC - 3rd phase of ETS
Product-based benchmarks
Decision 2011/278/EU determining transitional Union-wide rules for
harmonised free allocation of emission allowances pursuant to Article 10a of
Directive 2003/87/EC of the European Parliament and of the Council
Regulation 601/2012 on monitoring and reporting
3. Commodity
Markets
Revision of directive on markets in financial instruments – MiFID
(2004/39/EC)
Proposal for a Regulation of the European Parliament and of the Council on
markets in financial instruments and amending Regulation [EMIR] on OTC
derivatives, central counterparties and trade repositories, COM(2011)652
Regulation (EU) No 648/2012 of the European Parliament and of the Council
on OTC derivatives, central counterparties and trade repositories
Directive 2003/6/EC of the European Parliament and of the Council on insider
dealing and market manipulation (market abuse), as amended by Directive
2008/26/EC and Directive 2010/78/EU [MAD]. MAD is currently under
review, cf. Proposal for a Directive of the European Parliament and of the
Council on criminal sanctions for insider dealing and market manipulation,
COM(2011)654
Proposal for a Regulation of the European Parliament and of the Council on
insider dealing and market manipulation (market abuse), COM(2011)651
[MAR]
4. Competition
Policy
Revised State aid guidelines (financial compensation for indirect emissions)
SWD(2012) 131
Environmental state aid guidelines 2008/C 82/01
Anti-trust Regulation (EC) No 1/2003
Merger Control Regulation (EC) No 139/2004
Guidelines on national regional aid FOR 2007-2013 (2006/C 54/08)
5. Energy Policy 3rd Energy Package:
Directive 2009/72/EC concerning common rules for the internal market in
electricity
Directive 2009/73/EC concerning common rules for the internal market in
natural gas

Page 73 of 259
Regulation (EC) No 714/2009 on conditions for access to the network for
cross-border exchanges in electricity
Regulation (EC) No 715/2009 on conditions for access to the natural gas
transmission networks
Making the internal energy market work , COM(2012) 663
Renewable Energy Directive (Directive 2009/28/EC)
Energy Efficiency Directive (Directive 2012/27/EC)
Energy Taxation Directive (Directive 2003/96/EC)
6. Environmental
Policy
REACH and related legislation
Industrial Emissions Directive (Directive 2010/75/EU)
Air quality framework Directive (Directive 96/62/EC)
Water Framework Directive (Directive 200/60/EC)
Waste Shipment Regulation 1013/2006/EC
End of life Directive 2008/98/EC (Waste Framework Directive)
Packaging and packaging waste directive (Directive 94/62/EC)
End-of-life Vehicles Directive 2000/53/EC
Council Directive 1999/31/EC on the Landfill of waste
7. Trade Policy Trade Defence Instruments (anti-dumping, anti-subsidy, safeguard measures)
package
Anti-dumping: Regulation (EC) No 1225/2009
Anti-subsidy: Regulation (EC) No 597/2009
Safeguards (against WTO members): Regulation (EC) No 260/2009
Safeguards (against non-WTO members): Regulation (EC) No 625/2009
Generalised Scheme of Preferences (GSP) Regulation 978/2012
8. Products and
Life Cycle
Assessment
Eco-design Directive 2009/125/EC and Ecodesign work plan 2013-2015
Eco-label regulation 66/2010
Energy Labelling Directive (Directive 2010/30/EU)
Green Public Procurement Criteria:
Directive 2004/18/EC
Directive 2004/17/EC
Construction Products Regulation No 305/2011 (CPR)
Energy performance Buildings Directive (Directive 2010/31/EU)
CO2 from cars and vans regulations (Regulations 443/2009 and 510/2011)
Existing diverging methodologies for LCA
Roadmap to a Single European Transport Area – Towards a competitive and
resource efficient transport system COM(2011) 144
Strategy for the sustainable competitiveness of the construction sector and its
enterprises COM(2012) 433
The acts listed in the table above are very different in nature and in their effects on steel
makers. Broadly speaking, the acts falling within the scope of the study can belong to
three different categories from the perspective of the mapping process:
1. Binding acts which create direct obligations for the steel industry, and thus impose
a direct cost;
Page 74 of 259
2. Binding acts which do not create a direct obligation for the steel industry, but may
create an indirect cost;
3. Non-binding acts and other policies, which may or may not create direct costs.
The mapping methodology varies across the different policy areas. The mapping process
can identify regulatory provisions which create obligations, and thus costs, for the steel
industry only for those acts falling within the first category. E.g., the Industrial Emission
Directive requires firms to conform to Best Available Techniques (BATs); this provision
imposes capital and operating expenditures on steel makers. For the other two
categories, the mapping process will result in a survey of the effects of the acts on the
steel industry. For example, the third gas and electricity package has no direct
consequences for steel facilities; however, as it determines the competitive conditions in
these two other markets, it may have an indirect effect on the steel sector via energy
prices. The mapping sheets are enclosed in Annex 1.
This distinction is very important to explain the twofold approach to the policy areas
and the related legislation. The consultants make a clear distinction between those acts
which cause costs, be they direct or indirect, on the steel industry, through a proximate
and clear causal relationship; and the acts which define the sectoral environment and
the internal and external competitive constrains. For example, while the ETS system
imposes a direct and indirect (via electricity prices) cost on steel industry, the trade
policy does not, as its aim is to define when safeguarding measures can be taken.
Climate change, commodity markets, energy policies and environmental legislation are
likely to belong to the first class of acts. On the contrary, general policies, trade and
competition policies are more likely to belong to the second class, as the causal linkage
between them and the costs for companies is not so strong, hence an excessively high
element of uncertainty and subjectivity in the quantification exercise would be
introduced. For the latter class of policies, a qualitative approach is preferred.
Calculation of regulatory costs is possible for the first category of acts. For the other, the
consultants carry out an analysis of the competitive constrains and opportunities that
they cause for steel makers, and the effects on investments decisions, in comparison
with international competitors, resorting to selected case studies, or to the full coverage
of the Commission decisions where feasible. Theoretically, it could be argued that e.g.
anti-dumping duties or subsidies to competitors have an impact on the cost
competitiveness of the EU steel industry. For instance, the decision to impose a lower
anti-dumping duty, possibly because of the application of the lesser duty rule, could be
represented as a cost. However, both subsidies, including subsidies to foreign
competitors and the EU state aid, and trade defence instruments are too specific to be
included in the cost structure of either the whole industry or the representative sample.
Indeed, trade defence measures always target a specific product in specific country(-ies),

Page 75 of 259
and the same goes for subsidies. Therefore, albeit certain measures may be very
significant for a subset of EU steel plants, they are too partial to have a clearly
identifiable causal effect on the overall cost structure and competitiveness of the EU
steel industry. The peculiarities of these two policy instruments are better taken into
account by adopting a qualitative case-by-base assessment, as said, either through case
studies or the evaluation of the universe of Commission decisions where feasible.
A separate analysis is devoted to two exogenous factors: energy costs and raw materials.
These inputs represent the bulk of operating expenditures for steel makers. The EU
legislation has an impact on these factors, albeit limited and indirect. For example, the
EU legislation has an impact on energy costs via competition in the gas and electricity
internal market and through environmental regulation. Taxation on energy is a shared
responsibility between the EU, fixing the minimum level of excises, and the member
states, which set excise duties and may impose other levies. However, energy prices
depend on several other non-policy factors, such as worldwide markets for fuels or
distribution of natural resources.
Although the costs of energy and raw materials are, strictly speaking, non-regulatory
costs, given their significance, the consultants provide an analysis of these costs for the
European industry and its competitors, identifying cost differentials even when they
cannot be attributed to the EU legislation.

Page 76 of 259
PART III
THE ECONOMICS OF THE
STEEL INDUSTRY
Page 77 of 259
4 The economic and technical analysis of the steel
industry
4.1 The industry value chain
The steel industry value chain includes all the processes required to transform raw
materials (mainly coal, iron ore, and scrap) into finished steel products. Generally, the
following infrastructures are required to produce steel (EPA, 1995):
- Coke ovens;
- Blast furnaces;
- Steel furnaces;
- Rolling and finishing mills.
Sinter and pellet plants are additional facilities which may be adopted in the steel
making industry.
Based on the degree of vertical integration, steel making plants can be broadly classified
in two different groups, i.e. integrated plants and minimills. The former group includes
fully integrated plants, where all the production stages are performed (from coke
making to product finishing), and partially integrated plants, where coke ovens are not
installed and coke making is outsourced. The latter group mostly includes plants
comprising only steel furnaces and rolling and finishing facilities. Minimills utilise
electric furnaces and mainly rely on scrap, and only partially on raw iron, which is
usually purchased as processed input. Nonetheless, some minimills are moving toward
upstream vertical integration, by adopting new iron-making technologies (e.g. direct
reduction iron making, smelting reduction) requiring relatively limited capital
investment and characterized by a minimum efficient scale lower than traditional blast
furnaces.
A broader definition of the industry value chain would include upstream the suppliers of
raw materials and, downstream, intermediaries (service centres, stockholding
companies, and so on) and final customers (producers of steel end products).
4.1.1 The steel industry value chain and production technologies
Coke making
Coke making is the first production stage in fully integrated plants. Coke is the fuel and
the carbon source adopted in iron making and is produced by processing low-ash low-

Page 78 of 259
sulphur bituminous coal. Pulverized coal is added in the coke oven through an opening
located in the top of the oven. When ports are sealed, the coal is heated, in the absence
of oxygen, at high temperature (1200-1300°C). The necessary heat is provided by
external combustion of fuels and recovered gases. Coke is the solid material remaining
in the oven. Coke making is an energy intensive and relatively pollutant process. Despite
coke is still essential in the production process, to increase cost effectiveness steel
makers are adopting new technologies which aim at reducing the quantity of coke
required. In particular, pulverized coal can be directly injected in blast furnaces rather
than in the coke oven, thus lessening coke consumption up to 40%. In some facilities
also waste plastic or other fuels, such as natural gas or oil, are injected (EPA, 1995;
Ogaki et al., 2001). Furthermore, new processes are progressively adopted to produce
iron using gas or coal rather than coke.
Iron making
In partially integrated plants, coke is purchased as a processed input and steel making
starts with the production of raw iron in blast furnaces. These furnaces are vertical
cylindrical vessels (up to 35 meters high and up to 15meters wide) where iron ore, coke
(the fuel), and limestone (the flux) are charged at the top and are subject to a smelting
process mainly aiming at removing impurities from iron ore as well as oxides resulting
from the reduction. Hot air, usually heated through recovered exhaust gases, is blown
into the base of the vessel, thus supplying heat and oxygen for combustion. At the
bottom of the furnace, molten iron and slag are collected as outputs. Molten iron may
either be casted into ingots (the so-called pigs) or transferred directly to a connected
steel furnace. Iron making in blast furnace is a continuous production process which
requires the progressive addition of raw materials at the top of the vessel. Modern blast
furnaces have 2,000 cubic meter capacities. The production of iron accounts for about
55% of the total cost per tonne of steel and constitute the largest cost category (Madar,
2009).
Also new technologies are being adopted for iron making. The Direct Reduction Iron
making (DRI) is a new process, using gas rather than coke as a fuel, being particularly
cheap in countries with access to low cost natural gas. DRI facilities are less capital
intensive than traditional blast furnaces, and are efficient at smaller production
volumes30. A slightly different technology, known as smelting reduction, replaces coal
for coke. DRI and similar processes can be used both in integrated plants31 and in
minimills to substitute scrap. For minimills, DRI and similar processes represent the
30 At larger volume, BOF installations are cheaper in term of capital cost per unit of output.
31 The use of DRI in integrated plants to substitute scrap as a cooling agent in the converter is very
limited in Europe.
Page 79 of 259
only viable technology to reduce their dependency on high quality scrap or pig iron
made by integrated producers.32 Nonetheless, there are still some factors limiting the
adoption of this technology: i) DRI needs particular iron ores as an input; ii) its output
(the so-called sponge iron) requires further processing to completely remove slag; and
iii) production costs, and thus profitability, are highly dependent on the price of gas
(BCG 2013).
In any case, blast furnaces are still deemed the best solution for integrated facilities,
considering both their efficiency improvement, and their significant economies of scale.
Furthermore, the availability of miniblast furnaces (whose capital investments is about
only 17-19 million dollars rather than 400-900 million dollars for traditional vessels)
constitute a viable alternative to DRI plants to contain capital expenditures (Madar,
2009).
Integrated mills may also install sinter and pellet plants, which are relatively common in
Europe. Sintering is a process to agglomerate iron ore fines with other small particles
(pollution control dusts, coke breeze, flux, and so on) at high temperature into a porous
mass (sinter agglomerates) that can be added in the blast furnace. A sinter plant enables
recycling of iron rich material, otherwise disposed as production waste (EPA, 1995).
Pelletizing is a process to transform iron ore into pellets by processing iron ore with
additional substances. Pellets are hard spheres which are preferred to lump ore in blast
furnaces because hot air can circulate more freely, thus improving the efficiency of the
iron making process.
Steel making
Steel making basically consists of a process to transform raw iron in steel by removing
impurities (mainly carbon, phosphorus, and sulphur). The remaining quantity of carbon
is crucial to determine the hardness of the steel. During the steel making process, other
metals (manganese, nickel, chromium, and vanadium) may be added to create alloys,
thus obtaining specific qualities of steel.
In steel making, the more production stages are integrated, the more production costs
per ton are reduced; therefore, the industry is moving towards a full automation and
continuous production flow.
Molten iron from blast furnaces is traditionally refined in Basic Oxygen Furnaces (BOF)
which are cylindrical vessels lined with refractories where high purity oxygen is blown
under pressure. To eliminate impurities, limestone and other flux are added in the BOF
32 As mentioned in the next paragraph, to improve the quality of their production EAFs have to rely on
high purity input, i.e. high quality scrap, molten (or solid) pig iron, and/or DRI.

Page 80 of 259
process, thus producing slag that is removed from molten steel. In BOFs, scrap iron and
steel can be combined with molten iron up to 30%. Modern BOFs can take a charge of
iron up to 350 tonnes per cycle (Ecorys, 2008).33
The Electric Arc Furnace (EAF) is a completely different technology for steel making; it
is usually adopted in minimills. The main inputs for the EAF are scrap and electricity.
Electrodes installed within the furnace melt scrap through the heat created by an
electric arc. Limestone and other flux are added in the EAF to remove impurities from
molten steel. When scrap contains other metal residuals (the so-called tramp metals),
pig or sponge iron is also charged in the furnace to dilute them. Tramp metals usually
lower the metallurgical quality of steel produced in minimills. The EAF has a cycle time
of about 50 minutes to one hour. The size of EAFs ranges from very small units of one
ton of capacity per cycle, to large facilities that can charge up to 400 tonnes (Ecorys,
2008). An EAF processing only scrap uses 10% of the energy needed by blast furnaces
and BOFs. New technologies are enabling further reduction in energy consumption by
pre-heating scrap with recovered hot gases. EAFs are economic and efficient at relatively
small volumes of production compared to BOFs, in particular because they can be easily
shut down and restarted.
In the 1950s, the continuous casting technology was introduced. Through this
technology, molten steel is directly and continuously formed into blooms, billets, and
slabs.34 Molten steel is poured into a container (the so-called ―tundish‖) from which it is
released into the water cooled moulds of the casting machine. The metal is cooled as it
descends through the moulds, thus a thick solid shell is formed. Progressively, on the
run-out table, which operates at a constant speed and is cooled by water, also the centre
solidifies, thus allowing cutting the cast shape into lengths (EPA, 1995). In term of
efficiency improvements, continuous casting has been second only to BOF. In the 1980s,
thin slab continuous casting was introduced, thus also eliminating several stages in the
hot rolling process. This technology eased the entry of minimills in the hot-rolled
product business, even though metal quality is still a limitation, as high-quality coiled
sheets have to be free of tramp metals.
33 A different and older production process adopts Open-Hearth Furnaces (OHF) where impurities are
removed from molten iron by blowing alternatively flames and heated air in alternating sequence on a
pool of molten iron. The OHF process has been progressively abandoned since the 1950s, when BOF
technology was introduced as it is more efficient at all levels of production.
34 Previously, the steel-making process needed an additional intermediate stage (the so-called ingot
teeming), where molten steel was poured into ingot moulds, thus allowing steel to cool and solidify.
Ingots were then transformed in primary mills into blooms, billets, and slabs.

Page 81 of 259
Rolling and finishing
Blooms, billets, and slabs are transformed into finished steel products in rolling
facilities. A traditional distinction is made between ―long‖ and ―flat‖ products. Long
products are rolled from blooms and billets. Blooms (characterized by a rectangular
cross-section of 16cm or more) are rolled into structural beams. Billets (characterized by
a square cross-section of 4 to 14 cm) are rolled into bars, rods, and wire. Long products
have relatively limited production costs, and are to comply with lower standards (mainly
strength requirements); hence, they are considered low added value products.
Slabs (flat cross-section) are rolled into steel plates and coiled sheets, which are
produced in rolls. Coiled sheets are the most largely used steel product, automotive and
appliance producers being the bigger customers. Rolling facilities form these products in
a succession of stages where the steel passes through rollers characterized by narrower
and narrower clearances. Two different types of rolling are possible: hot rolling (heated
steel) producing coiled sheet with a rough surface; and cold rolling (unheated steel)
adding strength to the metal and making the surface smooth and shiny. Flat products
have relatively higher production costs and comply with higher standards (e.g. in terms
of lightness, strength, corrosion resistance, flawless surface, special coatings, and so on)
required by more demanding customers, thus being high added value products.
One of the most crucial aspects of a finished product is the quality of the surface. In
particular, to avoid corrosion, a protective coating has to be applied. Common coating
processes include: galvanizing (zinc coating), tin coating, chromium coating,
aluminizing, and terne coating (lead and tin). Coated products may also be painted to
further prevent corrosion (EPA, 1995).
Finished products also include tubes and pipes. The pipe and tube industry includes two
main production processes: i) seamless pipes, which are made through hot rolling
starting from billets; ii) and welded pipes, which are made through cold rolling starting
from plates (large pipes) or coiled sheet (small pipes). Seamless pipes require special
billets as inputs; hence, they are usually made in vertically integrated plants, comprising
either an EAF or, less frequently, a BOF (mostly in Central Eastern Europe). On the
contrary, welded pipes are usually made by companies buying steel on the market.
4.1.2 The upstream and downstream value chain
Upstream
The production of steel relies on the supply of three specific raw materials: iron ore,
coking coal (or coke), and scrap. In addition, for steel makers adopting the EAF
technology, electricity is a crucial input as well.

Page 82 of 259
The iron ore industry is highly concentrated. 60% of production originates from
Australia, Brazil, and China. Three global companies dominate the mining industry:
Vale SA (Brazil), Rio Tinto PLC (UK/Australia), and BHP Billiton Limited & PLC
(UK/Australia). These players control about the 75% of the world trade (Ecorys, 2008).
Iron ore is sold to steel makers on the basis of long-term contracts based on quarterly
prices (Datamonitor, 2011). Customarily, the price negotiated by Japanese steel makers
was the benchmark for contracts worldwide. Since the second quarter of 2012, contract
pricing has been reportedly shifting towards an index-based mechanism (based on spot
price in China). Consequently, a growing tendency toward monthly pricing mechanisms
would be unfolding. European steel makers depend exclusively on overseas supply.
Costs for iron ore are a relevant share of variable costs of production; hence, being
independent of the iron ore global cartel can be crucial. As a result, upstream vertical
integration and pursuing of mining investments have a pivotal role in growth strategies
of steel makers, albeit this strategy is difficult to implement under the current economic
and financial conditions (Madar, 2009; Datamonitor, 2011; Ernst and Young 2012).
European steel makers rely heavily on coal imports too. Although Germany and Poland
have reserves of coking coal amounting to 5% and 6% of the total world reserves
(Ecorys, 2008), the European coal production is expected to cease due to the
termination of subsidies. Coal prices are negotiated; however the price set between
Japanese steel makers and Australian coal suppliers is the beacon for all other contracts.
Steel makers are starting to follow expansion strategies aiming at purchasing coal mines
and processing facilities (Madar, 2009; Ernst and Young, 2012).
Scrap may have three different sources: leftovers from steel making process; ―new
scrap‖ from steel processing industries; ―old scrap‖ from recycling of steel end products
(Ecorys, 2008). Prices of scrap are increasing due to a growing demand (growth in
production by EAFs) and a decreasing supply (both end product manufacturers and
steel makers are becoming more efficient, thus reducing leftovers), albeit the price level
has become more stable since 2011.
While electricity prices do not affect traditional integrated producers, they are the
largest variable cost category for non-integrated steel makers adopting EAF. Hence, the
access to a stable supply of low cost electricity becomes a crucial locational factor for
minimills.
Downstream
Steel is an intermediate good, characterized by a derived demand which is inelastic in
the short run, so that changes in price affect only marginally the overall amount of steel
that can be sold worldwide. Nonetheless, the demand for end products which contain
Page 83 of 259
steel strongly affects demand for steel and fluctuations in demand can have significant
effects on prices and on profit margins of steel makers, whose individual demand is very
elastic, being steel to a large extent a commodity. The end markets for steel products
mainly comprise automotive, construction, packaging, durable consumer goods, and
mechanical engineering industries (Ecorys, 2008). While it is very unlikely that steel
buyers can undertake upstream vertical integration, some steel makers may integrate
downstream; for instance, Nippon Steel operates also in the mechanical engineering and
construction business (Datamonitor, 2011).
High-volume end users, such as automakers, usually purchase steel directly from steel
makers on the basis of negotiated contracts. These large buyers demand high added
value steel (mostly cold rolling products) for their production processes and may have
enough bargaining power to obtain price discounts (Ernst and Young, 2012), due to
their dimensions, to the competition intensity in their industries, and to the importance
for steel makers of preserving long-term relations with these customers. Nonetheless,
steel makers and large buyers have reciprocal incentives to cooperate in new product
development, and to coordinate production schedule and supply chains. Thus, the
location of steel making facilities - in terms of both proximity to the customers‘ plants
and worldwide production to supply global customers in several markets - becomes a
competitive advantage factor.
On the contrary, low-volume customers buy from steel intermediaries based on spot
prices. While small buyers do not benefit from bargaining power, they may take
advantage from a stronger competition among producers of standardized low added
value steel products (Datamonitor, 2011).
Intermediaries operate in the value chain between rolling mills and end users. In the EU
steel distribution includes seven typical operational models, grouped into two main
categories (see Table 15): i) typical steel stocking (beam and profile centres and general
stockists: reinforcing services; distribution of tubular products, stainless steel service
centres, and high carbon and alloy steel stockists); and ii) flat steel services centres
(strip mill products service centres; plate processors; and stockists).

Page 84 of 259
Table 15 Operation models of steel intermediaries in the EU
Operational Models Products and Services
Beam and profile
centres and general
stockists
Products
Beams & profiles, hollow sections, angles, wide flats, commercial sheets
Processing services
Cut-to-length, shot blasting, primering, edging, bending, drilling, marking
Reinforcing services
Products
Rebars, deformed rods, wire mesh, expanders
Processing services
Cut-to-length, decoiling, bending, fabricating, all-in service offers
Stainless steel service
centres
Products
Long stainless, flat stainless, stainless tubes
Processing services
Sawing, polishing, plasma-, waterjet and laser cutting
High carbon and alloy
steel stockists
Products
Tool steels, free cutting steel, engineering steel, special steel
Processing services
Sawing, bevelling, centring, drilling, milling, cutting, shearing, bending, edging, brushing,
grinding
Distribution of tubular
products
Products
Welded tubes, seamless tubes, fittings
Processing services
Cut-to-length, shot blasting, primering, drilling, profiling, bending, markings, stamping
Strip mill products
service centres
Products
Hot rolled flats, cold rolled flats, galvanized & other coated flats
Processing services
Coil cleaning & pickling, customized cut to length, slitting, blanking, stamping, re-rolling,
punching, shearing, folding
Plate processors and
stockists
Products
Quarto plates, hr flats, profiling and processing
Processing services
Shot blasting, primering, plasma- & flame cutting, drilling, punching, marking, stamping,
bending,
Source: Eurometal, 2013
Several mismatches exist between producers and customers of steel. Steel makers
produce in big volumes and long runs to achieve economies of scale. Customers want
small orders, short lead times, and additional processing. Intermediaries work as
matchmakers, thus creating value for the industry. One the one hand, towards the steel
mills, they cluster and simplify orders, absorb mill lead times, and receive deliveries by
rails or boats. On the other, towards customers, steel distributors ensure availability of a
wide range of products, accept multiproduct orders, and provide further processing and

Page 85 of 259
fast deliveries (the average lead time of distribution is between 24 to 48 hours). It is
worth noticing that the distribution chain has been affected by the current economic
crisis, thus re-shaping relationships among players. In particular, since 2008, while
several intermediaries have been facing financial problems and poor liquidity, the EU
demand for steel product has been weak and less predictable; hence, a tendency toward
reducing stock levels and buying smaller lots has been registered. Hence, steel makers
have reported that the supply risk has been increasingly shifted to them.
In the EU, about two thirds of the steel sales are direct to intermediaries (Ecorys, 2008;
Eurometal, 2013). Most of large steel makers (such as ThyssenKrupp, Tata, Voestalpine,
ArcelorMittal, and Ssab) are integrated downstream in steel distribution.
4.2 The economics of steel
4.2.1 Players
Boston Consulting Group (2007) classifies three different categories of players in the
steel industry:
- Global players, which own a global network of facilities, provide a full range of
steel products, are vertical integrated (even in the mining sector), and produce
more than 50 million tonnes per year (the only example being ArcelorMittal);
- Regional champions, which produce between 5 to 50 million tonnes per year, have
a strong regional presence, and can be divided into two sub-categories:
o Type 1 includes companies which have access to low-cost countries and
provide high added value products (technology leaders, such as
ThyssenKrupp and Riva);
o Type 2 includes companies which are based in low-cost countries and provide
steel commodities (for instance steel makers located in new member states);
- Niche specialists, which provide only a narrow range of products, usually very
specialized, are present in few locations, and produce less than 5 million tonnes.
The 25 largest steel companies in 2010 is reported in Table 16 (EU companies in bold).

Page 86 of 259
Table 16 Largest Steel Companies
Source: World Steel, 2012
4.2.2 High capital requirements and fixed costs
Facilities required to produce steel, from coke ovens to rolling mills, are large, highly
specialized, complex and durable assets which require huge capital outlays leading to
significant fixed production costs. As a result, break-even point is achieved only at very
high capacity utilization. In particular, integrated plants need to produce more than 2
million tonnes per year to be profitable (Ecorys, 2008).

Page 87 of 259
The introduction of new technologies had a twofold effect:
Capital requirements for integrated mills increased, due to larger Minimum
Efficient Scale (MES) and to the rising complexity and indivisibility stemming
from the higher level of automation and integration among the infrastructures
included in the value chain;35
Continuous casting facilities, and, to a greater extent, EAFs lessened capital
expenditures.
Hence, cost structures vary broadly between integrated plants and minimills; as well as
among larger plants with different degrees of vertical integration. Capital expenditures
for an integrated plant can reach up to 10 billion dollars, while a minimill can be
installed for about 350 million dollar (Madar, 2009).
4.2.3 Scale economies and minimum efficient scale
The steel industry is characterized by significant economies of scale, i.e. production
costs per unit fall as capacity increases. From an engineering standpoint, all the vessels
required for coke making, iron making, and steel making comply with the so-called
―square-cube law‖ (Carlton & Perloff, 2005). As the volume of these facilities grows
faster than their surface, capacity grows faster than investment costs. This rule applies
also to maintenance costs such as re-lining of refractories. Furthermore, efficiency gains
(in particular savings generated by lower energy consumption for re-heating molten iron
and molten steel) can be achieved through a stronger integration of all production
stages in a single plant, thus enlarging the overall production scale because of the
combination of adjoining facilities. From an organizational perspective, a single
company is better suited to manage such a complex and continuous production flow and
to exploit synergies.
The effect of scale economies and high fixed costs - indeed saturation of the installed
capacity enables spreading fixed costs over a larger quantity of output, thus cutting total
costs per tonnes as production grows - results in very large MES in steel making. While
BOFs are characterized by a MES between 3 and 5 million tonnes per year, EAFs can be
efficient at a scale ranging between 0.3 and 3.0 million tonnes. In integrated facilities,
the overall MES is determined by the component with the highest MES. While cost
efficiency in continuous casting facilities is achieved at 0.5 million tonnes per year (thus
being compatible with minimill production), rolling mills require processing between 2
and 5 million tonne to be efficient. In integrated plants, traditional blast furnaces for
35 In particular, new investments to modernize parts of existing facilities often require costly changes to
the adjoining infrastructures.

Page 88 of 259
iron making set the MES between 3 and 7, even if in new mills MES can reach up to 10
million tonnes per year (Barnett and Crandall, 1986; O‘Brien, 1992; Madar, 2009; Sato,
2009).
4.2.4 Product substitutability
When excluding highly specialized finished products, steel is a commodity complying
with common global standards. Therefore, analogous steel products of different
companies are almost perfect substitutes. Some quality differences still exist between
steel produced by BOFs and steel produced by EAFs, due to the presence of tramp
metals in the scrap processed by the latter, even if technology improvements are
progressively bridging this gap.
Focusing on products of other industries, for instance aluminium and fibreglass (or
other plastic materials) might substitute steel in motor vehicles and appliance
production. Although substitutability is possible in the long run, switching costs might
be very high due to the changes required in the downstream production process
(Datamonitor, 2011). Furthermore, steel industry is following an innovation path aiming
at meeting the new production needs of end users in order to retain customers. In a
green economy, the threat from substitute products is also lowered by the particular
environmental sustainability of steel, being 100% recyclable.
4.2.5 Barriers to entry and barriers to exit
High capital requirements to invest in a new installation or to add new facilities to
existing plants constitute a structural barrier to entry, especially for BOF technology. As
mentioned above, formidable capital expenditures are required to steel makers and the
break-even point is achieved only at considerable production levels. Hence, a strong
financial effort is required from potential newcomers, and this is of course particularly
risky when price fluctuations are marked. Scale economies may further discourage
entrance because the minimum yearly output to compete on the market can be even
higher than the break-even quantity, larger competitors having a significant cost
advantage. Technology specialisation may also prevent the entry in a different product
range by incumbents, due to technical limitation in shifting part of mill facilities from
one production to another.
Strategic barriers raised by incumbents are even higher, thus constituting a strong
deterrence to entry. First, an increase in demand for steel can be easily met by existing
facilities due to worldwide excess capacity, thus narrowing the room for new entries.
Then, the strategy of expansion in terms of both horizontal and vertical integration
increases entry costs. Indeed, to serve global customers, new competitors may have to
enter multiple regional markets; besides, the access to mining is increasingly becoming

Page 89 of 259
a competitive advantage factor, thus penalizing newcomers which have to purchase raw
materials in an oligopolistic market.
Capital intensity is also the main barrier to exit, considering that investment in steel
making facilities cannot be converted into any different use, and that scaling back of the
output volume is not always economically sustainable in integrated plants using blast
furnaces and BOFs. As a result, capital outlays results in very high sunk costs.
Furthermore, in this industry the salvage value might also be negative, due to
considerable dismantling costs. Also national policies aiming at protecting employment
can result in institutional barriers to exit, discouraging plant shutdowns.
Both barriers to entry and to exit are considerably lowered by new technologies, whose
impact can possibly advantage newcomers twofold:
some technologies, such as EAFs adopted in minimills, may require smaller capital
expenditures, be efficient at a smaller scale and enable a more flexible
management of the production volume;
other technologies, such as BOF and continuous casting, when compared to older
processes such as OHF and ingot teeming, have led to a formidable reduction in
production costs, thus allowing newcomers to benefit from a competitive
advantage, being more efficient than incumbents, which were tied to sunk costs
and depreciation time of existing plants.
4.2.6 Intra-sectoral competitive dynamics
As mentioned above, steel is an intermediate good whose market demand is quite
inelastic, especially in the short run when the threat from substitute products is not
significant. Hence, as demand grows, producers can increase output volume and prices,
benefiting from the existing barriers to entry. Conversely, each steel firm‘s demand
curve is usually very elastic due to high substitutability of steel products belonging to the
same category. Therefore, rivalry among competitors become fierce during downturns,
and steel makers are compelled to cut price rather than to scale back production, due to
high barriers to exit. In particular, to cover high fixed costs (which become sunk costs in
case of shutdown) steel makers keep on producing until prices are higher than variable
costs, thus bearing losses. This issue is of key importance in this industry, where
variable costs are significantly lower than average costs, due to huge capital outlays.
Inevitably, as demand declines, less efficient producers with weaker financial positions
are progressively expelled from the industry and consolidation occurs.
BOF plants are also facing a growing competition from more flexible EAF facilities, in
particular in long product markets. As new technologies will provide efficient
alternatives to blast furnaces, reducing minimill dependency on iron makers and scrap

Page 90 of 259
supply and increasing the quality of scrap based molten iron, EAF producers will
increase competitive pressure across the whole steel market.
4.3 The European Steel Market
4.3.1 Industry definition
According to the NACE (rev.2.0) statistical classification of economic activities in the
European Community, steel makers are included in the class 24.10, comprising
manufacturers of iron and steel and ferro-alloys (see Table 17).
Table 17 Production of iron and steel, NACE rev.2.0 classification36
Sub-sector NACE Definition
Manufacture
of iron and
steel and
ferro-alloys
Section: C
Division: 24
Group: 24.1
Class: 24.10
This class includes:
operation of blast furnaces, steel converters, rolling and finishing
mills;
production of pig iron and spiegeleisen in pigs, blocks or other
primary forms;
production of ferro-alloys;
production of ferrous products by direct reduction of iron and other
spongy ferrous products;
production of iron of exceptional purity by electrolysis or other
chemical processes;
re-melting of scrap ingots of iron or steel;
production of granular iron and iron powder;
production of steel in ingots or other primary forms;
production of semi-finished products of steel;
manufacture of hot-rolled and cold-rolled flat-rolled products of
steel;
manufacture of hot-rolled bars and rods of steel;
manufacture of hot-rolled open sections of steel;
manufacture of sheet piling of steel and welded open sections of
steel;
manufacture of railway track materials (unassembled rails) of steel.
This class excludes:
cold drawing of bars (included in NACE rev2.0 24.31).
Source: EUROSTAT, 2008
36 Manufacture of tubes, pipes, hollow profiles and related fittings, of steel (NACEv2 24.20) is also
considered, as long as integrated pipes producers are concerned (i.e. those producing crude steel as
well).

Page 91 of 259
4.3.2 Supply
Production of crude steel
After a steady growth between 2002 and 2007 (+12%), over the period 2007-2009 the
production of crude steel in the EU fell by 34% (see Figure 25). The partial recovery
shown in 2010 (+24%) and in 2011 (+3%) is threatened by a new reduction recorded in
2012 (-5%). The Compound Annual Growth Rate (CAGR) over a 10-year period (2002-
2012) amounts to -1%. Trends are similar in both EU-15 countries and new EU member
states, with a 10-year CAGR respectively of -1.1% and -0.8%.
Crude steel production is concentrated in a relatively limited number of EU countries.
In 2012, 9 countries, which are Germany, Italy, France, Spain, United Kingdom, Poland,
Belgium, Austria, and the Netherlands accounted for 82% of the total EU production
(see Figure 26). Among these countries, Austria (CAGR +1.8%), Italy (CAGR +0.4%),
and the Netherlands (CAGR +1.2%) experienced a production growth between 2002 and
2012, while Belgium (CAGR -4.2%), France (CAGR -2.6%), Poland (CAGR -0.003%),
and the United Kingdom (CAGR -1.7%) recorded a decline (see Figure 27).
Few member states registered a positive variation in crude steel production over the
period 2002-2012 (see Figure 6): Austria (+1.2 million tonnes), Italy (+1.2 million
tonnes), the Netherlands (+749,000 tonnes), Slovak Republic (+128,000 tonnes) and
Slovenia (+151,000 tonnes). Also Portugal (+951,000 tonnes) and Latvia (+48,000
tonnes) experienced a growth between 2002 and 2011.
Figure 25 Production of crude steel in the EU (thousand tonnes)37
Source: Authors‘ elaboration on World Steel, 2012; World Steel Association Data 2013
37 *Missing value for DK, LV, and PT; estimated value for GR, LU, NL, RO, and other EU.
0
50.000
100.000
150.000
200.000
250.000
2002 2003 2004 2005 2006 2007 2008 2009 2010 2011 2012*
EU-15
Other EU
EU-27

Page 92 of 259
Figure 26 Share of crude steel production in the EU by member state – 201238
Source: Authors‘ elaboration on World Steel Association Data 2013
Figure 27 Production of crude steel in selected member states (thousand tonnes)39
Source: Authors‘ elaboration on World Steel, 2012; World Steel Association Data 2013
38 Estimated value for NL.
39 *Estimated value for NL.
Germany25%
Italy16%
France9%
Spain8%United Kingdom
6%
Poland5%
Austria5%
Belgium4%
The Netherlands4%
Other EU-2718%
0
10.000
20.000
30.000
40.000
50.000
60.000
2002 2003 2004 2005 2006 2007 2008 2009 2010 2011 2012*
Germany
Italy
Spain
France
United Kingdom
Poland
Belgium
Austria
The Netherlands
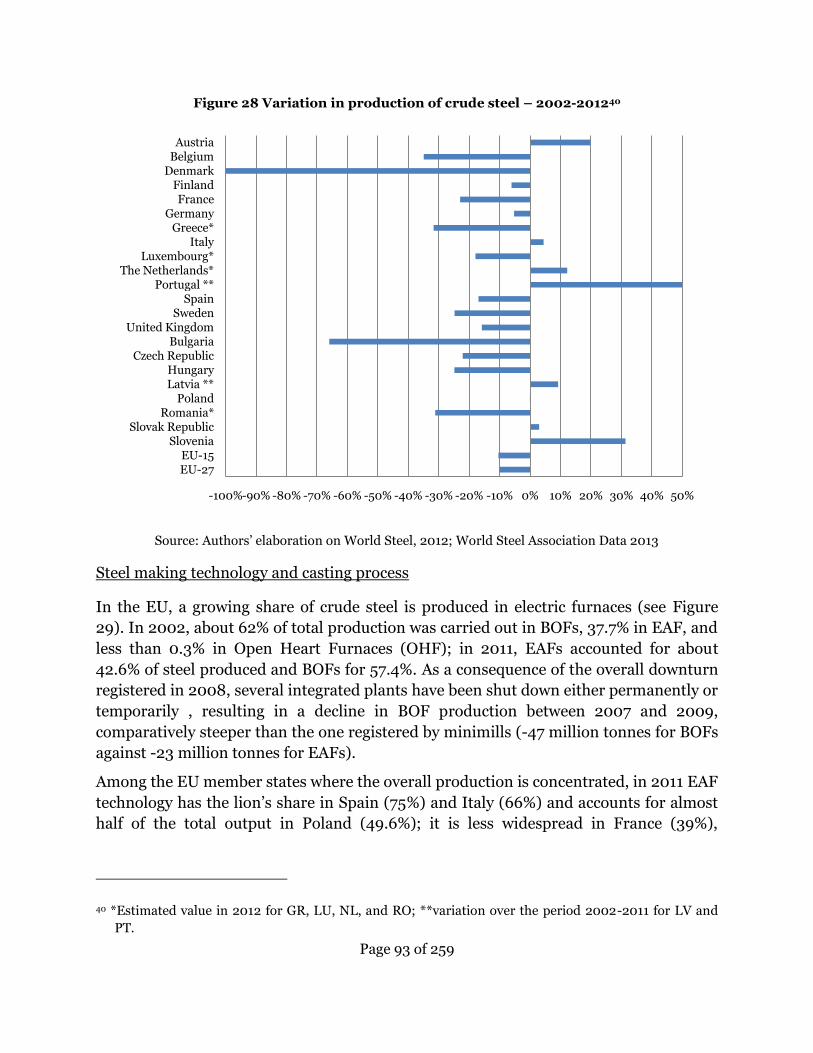
Page 93 of 259
Figure 28 Variation in production of crude steel – 2002-201240
Source: Authors‘ elaboration on World Steel, 2012; World Steel Association Data 2013
Steel making technology and casting process
In the EU, a growing share of crude steel is produced in electric furnaces (see Figure
29). In 2002, about 62% of total production was carried out in BOFs, 37.7% in EAF, and
less than 0.3% in Open Heart Furnaces (OHF); in 2011, EAFs accounted for about
42.6% of steel produced and BOFs for 57.4%. As a consequence of the overall downturn
registered in 2008, several integrated plants have been shut down either permanently or
temporarily , resulting in a decline in BOF production between 2007 and 2009,
comparatively steeper than the one registered by minimills (-47 million tonnes for BOFs
against -23 million tonnes for EAFs).
Among the EU member states where the overall production is concentrated, in 2011 EAF
technology has the lion‘s share in Spain (75%) and Italy (66%) and accounts for almost
half of the total output in Poland (49.6%); it is less widespread in France (39%),
40 *Estimated value in 2012 for GR, LU, NL, and RO; **variation over the period 2002-2011 for LV and
PT.
-100%-90% -80% -70% -60% -50% -40% -30% -20% -10% 0% 10% 20% 30% 40% 50%
AustriaBelgium
DenmarkFinlandFrance
GermanyGreece*
ItalyLuxembourg*
The Netherlands*Portugal **
SpainSweden
United KingdomBulgaria
Czech RepublicHungaryLatvia **
PolandRomania*
Slovak RepublicSlovenia
EU-15EU-27

Page 94 of 259
Belgium (35%), Germany (32%), and United Kingdom (27%); and it has a modest role in
Austria (9%) and the Netherlands (3%) (see Figure 30).
Continuous casting is the predominant casting process all over the EU, accounting for
more than 94% of the total output in 2002 and for about 96% in 2011 (see Figure 31).
When considering the larger producers, the share of continuous casting production goes
from 95% for Italy and France to 100% for Belgium (see Figure 32). Indeed, the EU steel
makers have completed the transition to the most cost efficient casting process.
Figure 29 Production of crude steel by steel-making technology (thousand tonnes)
Source: Authors‘ elaboration on World Steel, 2012
2002 2003 2004 2005 2006 2007 2008 2009 2010 2011
OHF 525 518 660 686 688 696 635 692 655 0
EAF 71.054 72.194 77.257 74.987 82.957 84.626 82.223 61.156 71.014 75.683
BOF 116.66 119.80 124.41 119.83 123.27 124.85 115.33 77.518 101.11 101.99
0
50.000
100.000
150.000
200.000
250.000
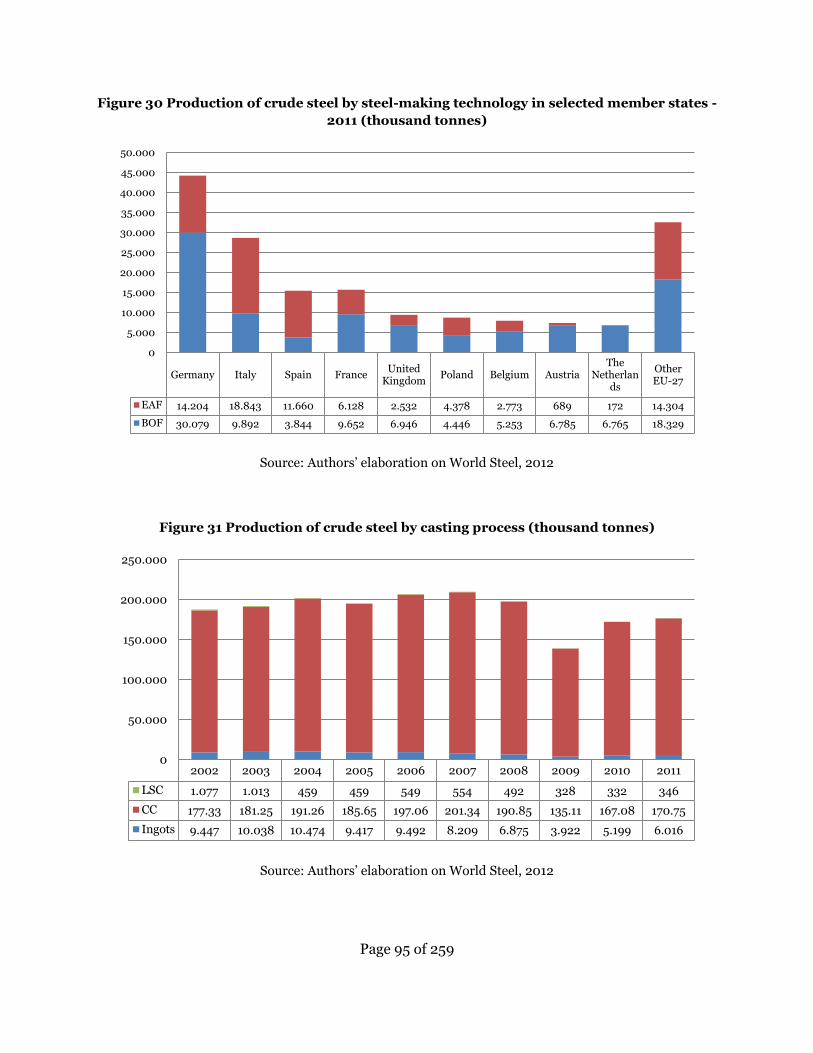
Page 95 of 259
Figure 30 Production of crude steel by steel-making technology in selected member states -
2011 (thousand tonnes)
Source: Authors‘ elaboration on World Steel, 2012
Figure 31 Production of crude steel by casting process (thousand tonnes)
Source: Authors‘ elaboration on World Steel, 2012
Germany Italy Spain FranceUnited
KingdomPoland Belgium Austria
The Netherlan
ds
Other EU-27
EAF 14.204 18.843 11.660 6.128 2.532 4.378 2.773 689 172 14.304
BOF 30.079 9.892 3.844 9.652 6.946 4.446 5.253 6.785 6.765 18.329
0
5.000
10.000
15.000
20.000
25.000
30.000
35.000
40.000
45.000
50.000
2002 2003 2004 2005 2006 2007 2008 2009 2010 2011
LSC 1.077 1.013 459 459 549 554 492 328 332 346
CC 177.33 181.25 191.26 185.65 197.06 201.34 190.85 135.11 167.08 170.75
Ingots 9.447 10.038 10.474 9.417 9.492 8.209 6.875 3.922 5.199 6.016
0
50.000
100.000
150.000
200.000
250.000
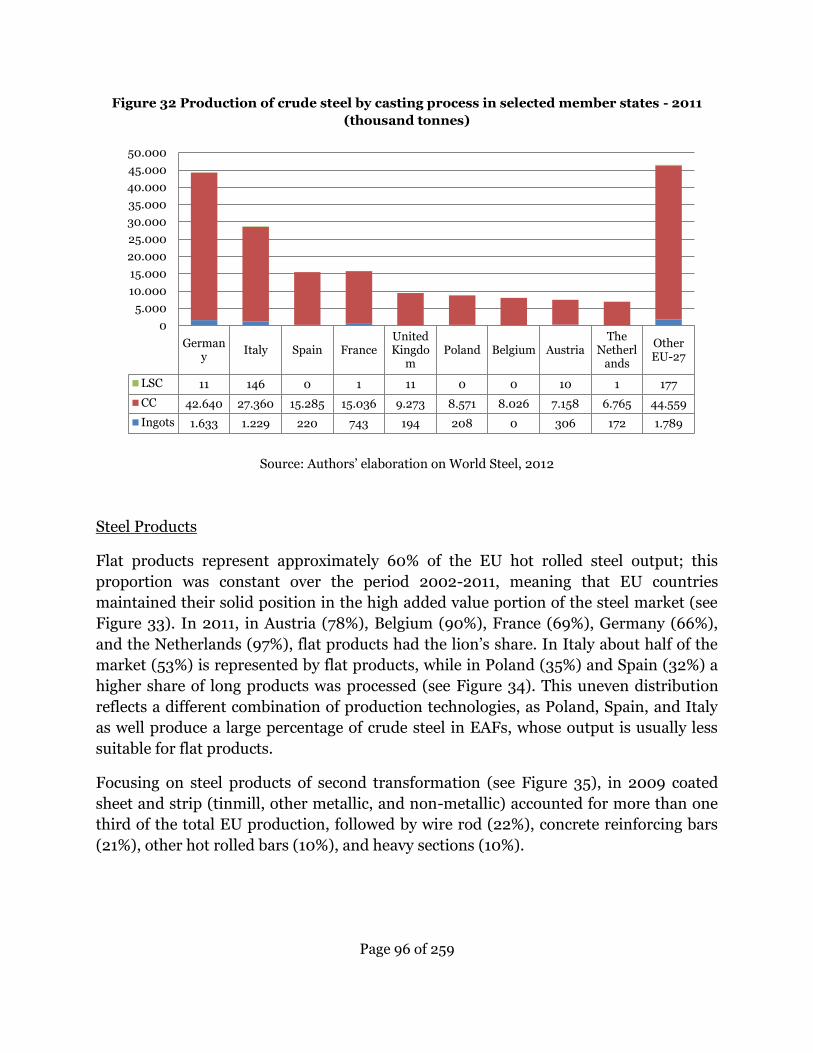
Page 96 of 259
Figure 32 Production of crude steel by casting process in selected member states - 2011
(thousand tonnes)
Source: Authors‘ elaboration on World Steel, 2012
Steel Products
Flat products represent approximately 60% of the EU hot rolled steel output; this
proportion was constant over the period 2002-2011, meaning that EU countries
maintained their solid position in the high added value portion of the steel market (see
Figure 33). In 2011, in Austria (78%), Belgium (90%), France (69%), Germany (66%),
and the Netherlands (97%), flat products had the lion‘s share. In Italy about half of the
market (53%) is represented by flat products, while in Poland (35%) and Spain (32%) a
higher share of long products was processed (see Figure 34). This uneven distribution
reflects a different combination of production technologies, as Poland, Spain, and Italy
as well produce a large percentage of crude steel in EAFs, whose output is usually less
suitable for flat products.
Focusing on steel products of second transformation (see Figure 35), in 2009 coated
sheet and strip (tinmill, other metallic, and non-metallic) accounted for more than one
third of the total EU production, followed by wire rod (22%), concrete reinforcing bars
(21%), other hot rolled bars (10%), and heavy sections (10%).
Germany
Italy Spain FranceUnited Kingdo
mPoland Belgium Austria
The Netherl
ands
Other EU-27
LSC 11 146 0 1 11 0 0 10 1 177
CC 42.640 27.360 15.285 15.036 9.273 8.571 8.026 7.158 6.765 44.559
Ingots 1.633 1.229 220 743 194 208 0 306 172 1.789
0
5.000
10.000
15.000
20.000
25.000
30.000
35.000
40.000
45.000
50.000
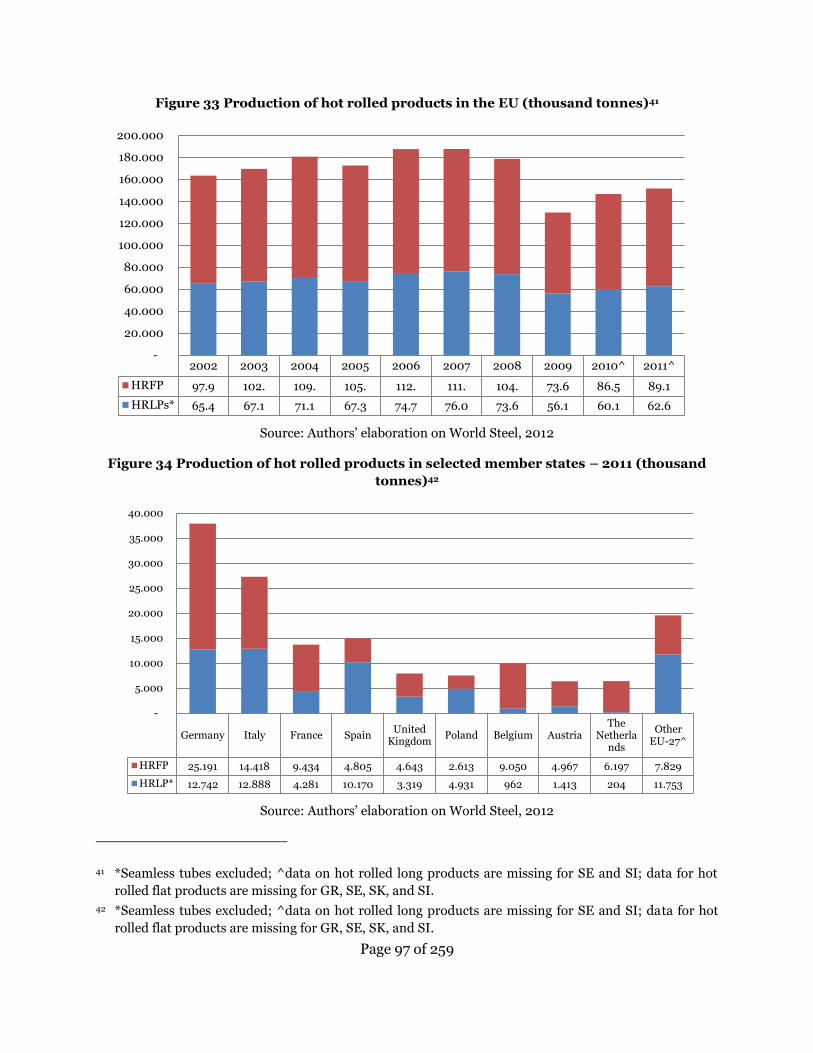
Page 97 of 259
Figure 33 Production of hot rolled products in the EU (thousand tonnes)41
Source: Authors‘ elaboration on World Steel, 2012
Figure 34 Production of hot rolled products in selected member states – 2011 (thousand
tonnes)42
Source: Authors‘ elaboration on World Steel, 2012
41 *Seamless tubes excluded; ^data on hot rolled long products are missing for SE and SI; data for hot
rolled flat products are missing for GR, SE, SK, and SI.
42 *Seamless tubes excluded; ^data on hot rolled long products are missing for SE and SI; data for hot
rolled flat products are missing for GR, SE, SK, and SI.
2002 2003 2004 2005 2006 2007 2008 2009 2010^ 2011^
HRFP 97.9 102. 109. 105. 112. 111. 104. 73.6 86.5 89.1
HRLPs* 65.4 67.1 71.1 67.3 74.7 76.0 73.6 56.1 60.1 62.6
-
20.000
40.000
60.000
80.000
100.000
120.000
140.000
160.000
180.000
200.000
Germany Italy France SpainUnited
KingdomPoland Belgium Austria
The Netherla
nds
Other EU-27^
HRFP 25.191 14.418 9.434 4.805 4.643 2.613 9.050 4.967 6.197 7.829
HRLP* 12.742 12.888 4.281 10.170 3.319 4.931 962 1.413 204 11.753
-
5.000
10.000
15.000
20.000
25.000
30.000
35.000
40.000

Page 98 of 259
Figure 35 Production of steel products of second transformation in the EU – 2009
(thousand tonnes)43
Source: Authors‘ elaboration on World Steel, 2012
Turnover, production value, value added, and gross operating surplus
The turnover of the EU steel industry experienced a sharp increase between 2002 and
2008 (+104% in absolute terms, CAGR +12.6%), followed by a dramatic decline between
2008 and 2009 (-41%) and by a partial recovery in 2010 (+27%) (see Figure 36). In
particular, over the period 2002-2007 revenues grew faster than production (+101% in
absolute terms against +12% registered in production of crude steel); revenues slightly
grew also in 2009 (+1.8%) although output already started to decline. Analogously, the
2008-2009 downturn of turnover was steeper than in terms of output, thus signalling
the high volatility of steel prices. The impressive growth in revenues, which was largely
determined by a sharp increase in steel prices, did not lead to the expected positive
effect in term of economic results for steel makers. It is worth stressing that national
turnover of the steel industry has a crucial role in the economic system of several EU
member states, even when quantity produced are limited in absolute value (see Figure
43 Data for 2010 and 2011 are scattered and fragmented.
Railway track material2% Heavy Sections
(>80mm) 10%
Light Sections (<80mm) 1%
Concrete Reinforcing Bars 21%
Other hot rolled bars 10%
Wire rod 22%
Electrical sheet and strip1%
Tinmill products3%
Other metallic coated sheet and strip
26%
Non-metallic coated sheet and strip
4%
Page 99 of 259
37). In 2010, steel maker turnover accounted for 6.0% of GDP in Slovakia, for 3.7% in
Luxembourg, for 3.2% in Latvia, for 3% in Czech Republic, for 2.9% in Finland and for
2.6% in Belgium. As a back of the envelope estimates, considering that in the same year
valued added over sales for the EU steel industry was about 15%, steel making is worth 1
point of GDP in Slovakia and about 0.5 in the other mentioned countries.
Valued added44 over sales went from 20.0% in 2002 to 22.3% in 2007, then falling in
2008 (18.6%) and reaching 15.3% in 2010 (see Figure 38). Considering that the negative
difference between turnover and value added is mainly explained by the cost of goods
and services, variable production costs (raw materials and energy) sharply increased
over the period 2002-2010. According to Crompton & Lesourd (2004, cited in Ecorys,
2008), price of iron ore are the main driver of variable production costs. Therefore, it
can be supposed that raw material suppliers, which benefit from a strong bargaining
power, drained a significant share of the value generated in the industry. Indeed, iron
ore price went from 12.68 US$ per dry tonne in January 2002 to 125.91 US$ in January
2010 (+893% in absolute terms, CAGR +33%).45
The ratio between gross operating surplus46 (an indicator which is comparable to the
EBITDA) and sales experienced a sharper fluctuation, swinging from 4.5% in 2002 to
13% in 2007 and back to 4.3% in 2010 (with a minimum of 0.4% in 2009). This trend,
when compared to the one registered in value added over sales, indicates a certain
degree of rigidity in labour cost in the EU steel industry.
44 "Value added at factor cost is the gross income from operating activities after adjusting for operating
subsidies and indirect taxes. It can be calculated as the total sum of items to be added (+) or subtracted
(-): turnover (+); capitalized production (+); other operating income (+); increases (+) or decreases (-)
of stocks; purchases of goods and services (-); other taxes on products which are linked to turnover but
not deductible (-); duties and taxes linked to production (-)" (EUROSTAT, Glossary, 2013,
http://epp.eurostat.ec.europa.eu/statistics_explained/index.php/Glossary:Value_added_at_factor_c
ost)
45 Index Mundi, Iron ore monthly price, (http://www.indexmundi.com/commodities/?commodity=iron-
ore&months=180).
46 Gross operating surplus is calculated from the value added at factor costs by subtracting personnel
costs.

Page 100 of 259
Figure 36 Aggregate turnover in the EU iron and steel industry – NACE rev.2 24.1 (mln €)47
Source: Authors‘ elaboration on EUROSTAT
Figure 37 Turnover of the steel and iron industry over GDP– NACE rev.2 24.148
Source: Authors‘ elaboration on EUROST
47 Data estimated for BE in 2002; for CZ in 2002, 2005, and 2007-2010; for DK over the whole period;
for GR in 2002, 2008, and 2010; for IE in 2002; for LV over the whole period; for LT in 2002 and
2005-2008; for LU in 2005-2010; for MT in 2002-2004, 2006, and 2008-2010; for PT in 2004 and
2007; for RO in 2008; for SK over the whole period; for SI in 2003 and 2004; for NL in 2002-2008
and 2010.
48 Data estimated for CZ, DK, GR, LT, LU, MT, NL, and SK; GDP at current prices.
0
50.000
100.000
150.000
200.000
250.000
2002 2003 2004 2005 2006 2007 2008 2009 2010
EU-27
EU-15
Other EU
0%
1%
2%
3%
4%
5%
6%
7%
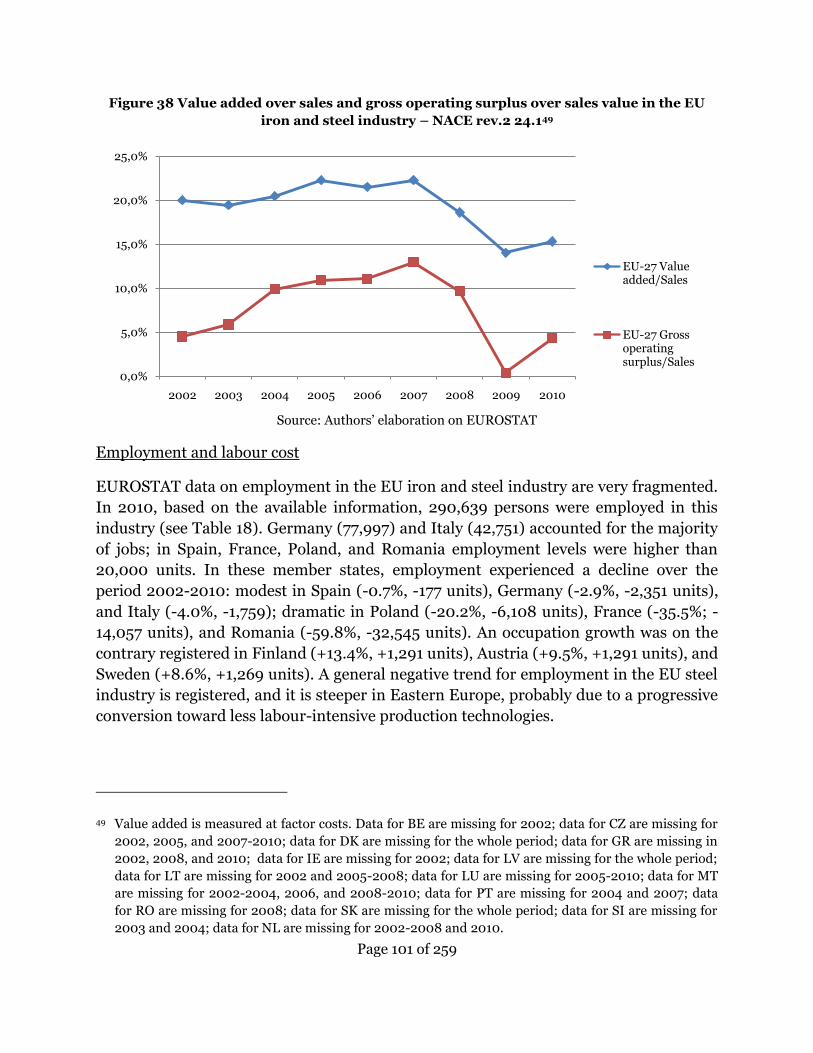
Page 101 of 259
Figure 38 Value added over sales and gross operating surplus over sales value in the EU
iron and steel industry – NACE rev.2 24.149
Source: Authors‘ elaboration on EUROSTAT
Employment and labour cost
EUROSTAT data on employment in the EU iron and steel industry are very fragmented.
In 2010, based on the available information, 290,639 persons were employed in this
industry (see Table 18). Germany (77,997) and Italy (42,751) accounted for the majority
of jobs; in Spain, France, Poland, and Romania employment levels were higher than
20,000 units. In these member states, employment experienced a decline over the
period 2002-2010: modest in Spain (-0.7%, -177 units), Germany (-2.9%, -2,351 units),
and Italy (-4.0%, -1,759); dramatic in Poland (-20.2%, -6,108 units), France (-35.5%; -
14,057 units), and Romania (-59.8%, -32,545 units). An occupation growth was on the
contrary registered in Finland (+13.4%, +1,291 units), Austria (+9.5%, +1,291 units), and
Sweden (+8.6%, +1,269 units). A general negative trend for employment in the EU steel
industry is registered, and it is steeper in Eastern Europe, probably due to a progressive
conversion toward less labour-intensive production technologies.
49 Value added is measured at factor costs. Data for BE are missing for 2002; data for CZ are missing for
2002, 2005, and 2007-2010; data for DK are missing for the whole period; data for GR are missing in
2002, 2008, and 2010; data for IE are missing for 2002; data for LV are missing for the whole period;
data for LT are missing for 2002 and 2005-2008; data for LU are missing for 2005-2010; data for MT
are missing for 2002-2004, 2006, and 2008-2010; data for PT are missing for 2004 and 2007; data
for RO are missing for 2008; data for SK are missing for the whole period; data for SI are missing for
2003 and 2004; data for NL are missing for 2002-2008 and 2010.
0,0%
5,0%
10,0%
15,0%
20,0%
25,0%
2002 2003 2004 2005 2006 2007 2008 2009 2010
EU-27 Value added/Sales
EU-27 Gross operating surplus/Sales

Page 102 of 259
Table 18 Number of persons employed in the EU iron and steel industry -NACErev.2 24.150
2002 2003 2004 2005 2006 2007 2008 2009 2010
EU-27 369,009 414,449 391,292 380,165 378,485 346,821 305,897 296,970 290,639
EU-15 263,466 291,510 279,051 269,860 270,593 269,362 229,425 230,198 230,531
EU-12 123,735 100,380 105,543 122,939 112,241 110,305 107,892 77,459 76,472
Austria 13,169 13,534 13,815 14,141 14,361 14,547 14,967 15,127 14,459
Belgium NA 18,316 18,057 18,175 17,053 18,446 18,164 16,472 15,351
Bulgaria 10,954 10,957 9,830 9,299 9,332 8,728 7,351 5,871 2,769
Cyprus 0 0 0 0 0 0 0 0 0
Czech Republic NA 26,751 25,060 23,970 23,188 NA NA NA NA
Denmark NA NA NA NA NA NA NA NA NA
Estonia 0 0 0 0 0 0 0 0 0
Finland 9,953 9,637 10,376 11,450 11,273 11,239 NA 11,280 11,244
France 39,648 39,794 36,525 34,688 33,315 30,315 NA NA 25,591
Germany 80,348 81,677 81,819 79,702 78,964 78,250 80,556 79,600 77,997
Greece NA 3,379 3,530 3,503 3,831 3,863 NA 2,822 NA
Hungary 7,147 7,725 6,689 7,582 6,999 6,886 7,564 7,125 6,009
Ireland NA 522 625 809 1,027 1,308 1,308 959 1,003
Italy 44,510 46,843 44,176 42,418 44,997 44,605 45,680 44,273 42,751
Latvia 0 2,881 2,869 2,818 2,731 2,682 2,655 2,423 2,394
Lithuania NA 109 0 NA NA NA NA 0 0
Luxembourg 4,372 6,032 5,786 NA NA NA NA NA NA
Malta NA NA NA 0 NA 0 NA NA NA
The Netherlands NA NA NA NA NA NA NA NA NA
Poland 30,187 29,511 27,830 25,568 28,264 24,840 25,742 23,157 24,079
Portugal 1,404 1,406 NA 1,338 1,271
1,180 1,113 1,099
Romania 54,409 45,005 39,963 38,290 34,481 31,310 29,639 25,116 21,864
Slovakia NA NA NA NA NA NA NA NA NA
Slovenia 2,846 NA NA 2,778 2,897 3,013 3,521 3,080 2,993
Spain 26,501 27,028 26,918 25,644 25,657 27,191 27,683 25,426 26,324
Sweden 13,443 14,709 15,867 14,381 15,735 16,191 16,237 13,620 14,712
United Kingdom 30,118 28,633 21,557 23,611 23,109 23,407 23,650 19,506 NA
Source: Authors‘ elaboration on EUROSTAT
4.3.3 Demand
Demand for steel finished products
Demand for finished steel products in the EU (see Figure 39) fell between 2007 and
2009 by 41% after a remarkable growth experienced over the period 2005-2007 (+21%),
which in turn followed a period of relative stability in 2002-2005 (+2%). Signs of
recovery were registered in 2010 (+24% on yearly basis) and 2011 (+5%), but total
50 EU-27, EU-15 and EU-12 totals reflect the missing data points in the national series. Therefore, year to
year variation can also depend on different data coverage.

Page 103 of 259
demand is still below the 2007 level (about 50 million tonnes lower). Overall, trends
registered in the EU-15 member states are comparable to those registered across new
member states; nevertheless between 2002 and 2011 demand in EU-15 slightly
decreased (CAGR -1.2%; -14 million tonnes), while a growth was registered in the new
member states (CAGR +2.9%; +6 million tonnes).
In 2011, demand for finished steel products in the EU was geographically concentrated:
Germany, Italy, France, Spain, Poland, United Kingdom, Czech Republic, Belgium
(including data for Luxembourg), and Austria accounted for more than 84% of the total
demand (see Figure 40). Demand variation diverged across EU member States over the
period 2002-2011. Eleven countries out of 27 experienced an increase in demand (see
Figure 41), namely Austria (+823 thousand tonnes), Belgium and Luxembourg (+40
thousand tonnes), Germany (+4.6 million tonnes), Sweden (+596 thousand tonnes),
Czech Republic (+1.8 million tonnes), Estonia (+8 thousand tonnes), Latvia (+330
thousand tonnes), Lithuania (+102 thousand tonnes), Poland (+3.2 million tonnes),
Romania (+460 thousand tonnes), and Slovak Republic (+473 thousand tonnes). A
strong decline in absolute terms was registered in Spain (-6.5 million tonnes), the
United Kingdom (-3.5 million tonnes), Italy (-2.5 million tonnes), Greece (-2 million
tonnes), and France (-2 million tonnes).
Between 2002 and 2011, crude steel production in the EU is always higher than the
entire demand for steel finished products (see Figure 42). Quantity produced did not
experience the same sharp increase which characterized demand between 2005 and
2007, growing only by 11% in the period 2002-2007. On the contrary, a comparable and
sharp decline was registered both for supply and demand between 2007 and 2009.

Page 104 of 259
Figure 39 Apparent steel use in the EU (thousand tonnes)51
Source: Authors‘ elaboration on World Steel, 2012.
Figure 40 Country share of total European apparent steel use – 201152
Source: Authors‘ elaboration on World Steel, 2012
51 Apparent steel use of finished steel products is expressed in volume terms as deliveries of finished steel
minus net exports of steel industry goods.
52 Apparent steel use of finished steel products is expressed in volume terms as deliveries of finished steel
minus net exports of steel industry goods.
0
50.000
100.000
150.000
200.000
250.000
EU-15
Other EU
EU-27

Page 105 of 259
Figure 41 Variation in apparent steel use - 2002-201153
Source: Authors‘ elaboration on World Steel, 2012.
Figure 42 Apparent steel use and production of crude steel in the EU (thousand tonnes)54
Source: Authors‘ elaboration on World Steel, 2012.
53 Apparent steel use of finished steel products is expressed in volume terms as deliveries of finished steel
minus net exports of steel industry goods.
54 Demand measures apparent steel use of finished steel products, expressed in volume terms as
deliveries of finished steel minus net exports of steel industry goods; supply measures total production
of crude steel.
-100% -50% 0% 50% 100% 150%
Austria
Belgium-Luxembourg
Denmark
Finland
France
Germany
Greece
Ireland
Italy
Netherlands
Portugal
Spain
Sweden
United Kingdom
Bulgaria
Cyprus
Czech Republic
Estonia
Hungary
Latvia
Lithuania
Malta
Poland
Romania
Slovak Republic
Slovenia
EU-15
EU-27
0
50.000
100.000
150.000
200.000
250.000
2002 2003 2004 2005 2006 2007 2008 2009 2010 2011
EU-27 Supply
EU-27 Demand

Page 106 of 259
Demand for steel end products
Automotive and construction sectors have usually been the two largest steel end users.
Therefore, fluctuations in turnover in these industries significantly affect steel demand.
As expected, trend in the EU motor vehicle industry revenues are comparable to the one
registered in demand for finished steel products (see Figure 43). A strong growth
between 2005 and 2007 (+18%), preceded by a more stable period between 2002 and
2005 (+1.5%), was followed by a remarkable decline by 25% over the period 2007-2009.
As for steel demand, a new increase was registered in 2010 (+18% on a yearly basis).
Analogous fluctuations affected the construction sector (see Figure 44), where a
comparable downturn was experienced one year later and no sign of recovery could be
noticed in 2010.
Figure 43 Total turnover in the EU motor vehicle industry – enterprises included in NACE
rev.2 Division 29 (mln €)55
Source: Authors‘ elaboration on EUROSTAT
55 Data for BE are missing for 2002; data for GR are missing for 2002, 2008, and 2010; data for LU are
missing for the whole period; data for MT are missing for 2006 and 2008-2010; data for PT are
missing for 2006 and 2007.
0
100.000
200.000
300.000
400.000
500.000
600.000
700.000
800.000
900.000
2002 2003 2004 2005 2006 2007 2008 2009 2010
EU-27
EU-15
Other EU

Page 107 of 259
Figure 44 Total turnover in the EU construction sector – enterprises included in NACE
rev.2 Section F (mln €)56
Source: Authors‘ elaboration on EUROSTAT
4.4 International trade of steel
4.4.1 World production and trade flows
The production trend of the steel industry has been subject to structural change over the
last twelve years, mainly due to the increase in the Asian production. As this section will
show later, this shift in relative market shares, together with the economic crisis, has
modified the directions and volumes of trade flows. Figure 45 shows that, against a flat
trend characterizing the production of crude steel in the historical locations such as the
EU and the US, production of Asia and Oceania has increased at a steep pace, reaching
almost 1 billion tonnes in 2012. The upward trend is led by the Chinese performance,
fuelled by growing internal consumption and external demand of cheaper steel
products. Beside, the Asian position as global leader, the EU-27 is the second biggest
player, followed by North America and CIS, with an average of 200 million tonnes until
2008. In 2009, the production dropped by 24% in the EU-27, North America and CIS,
and underwent a weak recovery in the three following years. These three regions,
together with Asian countries, cover more than 90 percent of the world production.
56 Data for BE are missing for 2002; data for GR are missing for 2002, 2008, and 2010; data for MT are
missing for 2006 and 2008-2010.
0
200.000
400.000
600.000
800.000
1.000.000
1.200.000
1.400.000
1.600.000
1.800.000
2.000.000
2002 2003 2004 2005 2006 2007 2008 2009 2010
EU-27
EU-15
Other EU

Page 108 of 259
Figure 45 Crude Steel Production (thousand tonnes)57
Source: Authors‘ elaboration on World Steel Association Data (2013)
The dynamics of the global steel production provides the background to analyze the net
positions of semi-finished and finished products. As shown by Figure 46, EU-27, that
used to be a net exporter, has turned into a net importer from 2006 to 2009 due to a
marked increase of the imports volume; finally, the EU-27 turned back into a net
exporter in 2010 and 2011. Since 2006, while the European countries reduced their steel
production, Asian countries, mostly China, increased enormously their capacity, to
satisfy both the internal and external demand. As a result, Figure 47 shows that exports
market shares of semi-finished and finished steel products shift mainly from EU27 to
Asia. From 2001 to 2011, the EU export share58 decreased from 41% to 35% while for
Asia and Oceania increased from 24% to 36%. Again, China played the lion‘s share in
this shift, by increasing its exports share from 2%, in 2001, to 12% in 2011. Export
shares for Japan, for instance, remained unchanged (10%), while for South Korea
increased by 2% (from 5% to 7%).
57 * Estimates by World Steel Association.
58 It is worth to notice that these data also include intra-EU trade. This could lead in Figure 25 to an
overestimation of the EU export share compared to other exporting countries. However, this should
not cause any problems in Figure 24, where intra-EU flows (imports and exports) balance each other
out.
0
100.000
200.000
300.000
400.000
500.000
600.000
700.000
800.000
900.000
1.000.000
2001 2002 2003 2004 2005 2006 2007 2008 2009 2010* 2011* 2012*
EU27 Other Europe C.I.S.
North America South America Africa and MiddleEast

Page 109 of 259
The CIS, led by Russia and Ukraine, has been a net exporter of semi-finished and
finished steel products over the whole period, with a net balance slightly decreasing over
time, on average equal to about 50 million tonnes, and an extremely low level of
imports. As for Africa and Middle East, they are increasingly becoming net importers,
mainly due to the rising dependence from production of Iran, Saudi Arabia and UAE.
North America is on the contrary switching from its position of net importer due to a
reduction of imports since 2006 (from 64 million tonnes in 2006 to around 29 million
in 2009) and to a slow improvement of the export (the level of export was 25.5 million
tonnes in 2011 compared to 15.3 in 2001). In 2010, South America (mainly Brazil,
Argentina and Venezuela) turned into a net importer due to drop an imports‘ increase in
almost all the countries (although Brazil remaining a net exporter), though reducing its
negative balance to -442 thousand tonnes in 2011. Finally, Other Europe, mainly due to
increasing exports volume of Turkey, has improved its net position by reporting a
surplus of around 4.8 million tonnes in 2011.
Figure 46 Net flows of semi-finished and finished steel products – 2001-2011
(thousand tonnes)59
Source: Authors‘ elaboration on World Steel 2011; 2012
59 Data for 2010: estimates by World Steel Association.
-60.000
-40.000
-20.000
0
20.000
40.000
60.000
2001 2002 2003 2004 2005 2006 2007 2008 2009 2010 2011
EU27 Other Europe C.I.S.North America South America Africa and MiddleEastAsia and Oceania

Page 110 of 259
Figure 47 Market shares of exports of semi-finished and finished steel products –
2001 and 2011.
Source: Authors‘ elaboration on World Steel Association Data (2013)
4.4.2 EU trade flows
The European market for iron and steel60 is mainly represented by intra-EU flows, as
confirmed by Figure 48. Indeed, in 2012, intra-EU trade accounted for 72% of the total,
while only 28% of trade was directed towards extra-EU economies. The same can be
noticed for imports, where 74% has come from EU member states and 26% from outside
EU borders. Based on COMEXT data, which disentangle between intra and extra-EU
trade, the EU was a net importer of iron and steel from 2004 to 2008 and again in 2011.
Finally, in 2012, EU recorded a positive net balance of 66.8 million tonnes.61
60 Iron and steel are here defined according to the category 67, SITC Rev. 3. The category includes: pig-
iron, spiegeleisen, sponge iron, iron or steel granules and powders and ferro-alloys (671); Ingots and
other primary forms, of iron or steel; semi-finished products of iron or steel (672); Flat-rolled products
of iron or non-alloy steel, not clad, plated or coated (673); Flat-rolled products of iron or non-alloy
steel, clad, plated or coated (674); Flat-rolled products of alloy steel (675); Iron and steel bars, rods,
angles, shapes and sections (including sheet piling) (676); Rails or railway track construction material,
of iron or steel (677); Wire of iron or steel(678); Tubes, pipes and hollow profiles, and tube or pipe
fittings, of iron or steel (678).
61 However, according to the data reported by ECORYS (2008), which take into account a smaller range
of products, in particular, semi-finished and finished steel products, EU extra-regional imports
overtook the exports in 2006, turning EU into a net importer back then.

Page 111 of 259
The relative weight of intra- and extra-EU traded did not change substantially across the
decade. In 2001 intra-EU imports and exports accounted for 78% and extra-EU for 21%
of the trade flows; in 2012, intra-EU imports and exports accounted for 75% and 73%
respectively while extra-EU imports and exports accounted for roughly 24% and 27%,
respectively. It is evident from Figure 48that, intra-EU trade flows and extra-EU
imports dramatically dropped in 2009 (the former by about one third, and the latter by
almost half on a year-to-year basis), while extra-EU exports showed a slow but steady
increase throughout the decade.
Figure 48 Intra and Extra-EU Trade of Iron and Steel - 2001-2012 (thousand
tonnes)
Source: COMEXT, 2013
0
20.000
40.000
60.000
80.000
100.000
120.000
140.000
2001 2002 2003 2004 2005 2006 2007 2008 2009 2010 2011 2012
EU27 EXTRA IMPORT EU27 EXTRA EXPORT
EU27 INTRA IMPORT EU27 INTRA EXPORT

Page 112 of 259
Table 19 EU27 exports, imports and net positions in iron and steel by selected
destination countries - 2001 and 2012 (thousand tonnes)
Source: Authors‘ elaboration on COMEXT, 2013
The destinations of extra-EU flows are diversified geographically, showing that the EU is
fairly integrated in the global trade dynamics. Table 19, selects top sixteen destination
economies of EU steel exports in 2012. It can be noticed that in 2012 almost 45% of EU
exports were directed to Turkey, US, Algeria and Switzerland. The same year, 53% of
total imports came from Russia (8,322 thousand tonnes), Ukraine (6,048), and China
(3,502). Top origin and destination countries are quite similar compared to 2001, where
more than 55% of total extra-EU exports were directed to US, Switzerland, Turkey, and
Norway, while almost 63% of extra-EU imports come from Russia (6,644 thousand
tonnes), Ukraine (4,190), Turkey (3,326), and South Africa (2,181).
Compared to 2001, when US and Russia were the first markets for EU exports and
imports respectively, it is worth to observe the new prominent role acquired by China
and India. In particular, Chinese exports to Europe grew eightfold in 12 years, while
Indian fivefold. Remarkably, South Korea doubled its exports to Europe, overcoming
Switzerland despite proximity, while Russia and Ukraine increased their exports volume
by about 50%. In the same period, EU imports from Turkey, Norway and South Africa
decreased by about one third to one half in terms of volume. As for EU exports, the most
remarkable spike is on trade flows towards Algeria, which increased eightfold from 2001
to 2012, making it the second importer of European steel. Exports towards India,
Total Extra-EU 27,048 29,573 -2,525 40,150 33,341 6,809
Turkey 1,7 41 3,326 -1,584 5,284 1,830 3,454
USA 6,312 334 5,97 8 5,237 509 4,7 28
Algeria 562 133 429 4,603 34 4,569
Switzerland 2,17 9 1,051 1,128 2,47 8 1,251 1,228
India 449 326 123 1,432 1,585 -154
Russia 438 6,644 -6,207 1,299 8,322 -7 ,023
China 7 58 449 309 1,160 3,502 -2,342
Mexico 668 307 362 1,142 31 1,111
Morocco 689 15 67 4 1,035 38 997
Norway 1,120 1,656 -536 891 1,118 -227
Canada 939 168 7 7 1 812 130 682
Brazil 435 1,302 -867 7 91 1,388 -597
South Korea 300 7 37 -437 462 1,331 -869
South Africa 17 8 2,181 -2,003 423 1,332 -910
Ukraine 115 4,190 -4,07 5 350 6,084 -5,7 34
Japan 123 433 -310 152 316 -164
Net
Destination
Countries
2001 2012
Export Import Net Export Import

Page 113 of 259
Russia, and Turkey almost trebled, while exports towards China ―only‖ increased by
50%.

Page 114 of 259
PART IV
LEGAL ANALYSIS AND
COST ASSESSMENT
Page 115 of 259
5 General Policies
Regularly, the European Commission releases non-binding communications which pave
the way for future policies. From the perspective of a regulatory cost analyst, these
communications are strange animals. Being non-binding, they do not represent a direct
or indirect cost for businesses. However, being released at the highest possible level of
EU policymaking, they are good indicators of the political climate and of the direction
which the EU intends to pursue in the following years, even decades. Given the
particular nature of policymaking in Brussels, general policies represent a sort of
consensus view within the Commission and among EU institutions. As such, although
non-binding, they cannot be underestimated by businesses. Hence, it can be argued that
they have a role in setting the business climate, even though they do not have an
immediate impact on business operations. In a nutshell, they represent a policy risk, or
policy opportunity.
Currently, the most important general policy, which should direct the EU action across
all policy areas in the current decade, is the so-called EU2020 strategy.62 The EU2020
strategy aims at ensuring that Europe achieves a smart, sustainable, and inclusive
growth. It acknowledges that ensuring that Europe keeps and improves its industrial
base and that its competitiveness is sustained through higher productivity is a pre-
condition to achieve any growth. A competitive industry requires, and the Commission
is committed to it, securing a better market access for EU businesses and a level playing
field vis-à-vis our external competitors. The EU2020 strategy is articulated through
seven so-called flagship initiatives, three of which have a specific relevance for the steel
sector, as well as any other manufacturing industry:
1. An Industrial Policy for the Globalisation Era;
2. Resource Efficient Europe;
3. Innovation Policy.
The Communication on industrial policy63 acknowledges that the manufacturing
industry is a key driver of the European economy and employment levels, and that a
―strong, competitive and diversified industrial manufacturing value chain‖ is of ―central
importance‖. The Commission undertakes to have a ―fresh approach‖ to Industrial
62 Communication from the Commission, Europe 2020. A strategy for smart sustainable and inclusive
growth, COM(2010)2020, 3.3.2010.
63 Communication from the Commission, An Integrated Industrial Policy for the Globalisation Era.
Putting Competitiveness and Sustainability at Centre Stage, COM(2010)614, 28.10.2010.

Page 116 of 259
Policy. The Commission commits itself to craft direct that have a beneficial impact on
costs, prices and innovation of industry in general and individual sectors in particular;
and to take into account the competiveness effects of all other policy initiatives,64
including transport, energy, environmental, social policies, consumer protection, single
market and trade policies. Not the whole Communication on industrial policy is relevant
for the steel industry, but several key points are touched upon: i) the completion of a
single market for network industries, especially energy and railways; ii) a better access
to financing and support for demonstration R&D projects; iii) the fight against trade
restrictions, including distortions in raw material markets; iv) ensuring predictability
and legal certainty of the energy and climate change EU strategies; v) helping the EU
manufacturing industry to restructure in case of structural excess capacity, especially
through the revision of the Rescue and Restructuring Aid Guidelines.
The 2010 industrial policy Communication was followed by and update in 2012,65 when
it is restated that ―a strong industrial base is essential for a wealthy and economically
successful Europe‖, so much that the Commission aims at ―reindustrialising‖ Europe,
raising the share of industry added value over GDP from 16% to 20%, and gross fixed
investments as a share of GDP from 18.6% to 23%. More attention is paid to the issue of
energy and raw material prices, which are higher than in most of other industrialised
countries. The Commission better defines what intends for ―industrial policy‖, stating
that it shall not substitute market mechanisms, as competition is deemed the only way
to ensure an efficient allocation of resources and a dynamic economy, and that public
intervention should be aimed at creating the right business environment and at
remedying to market failures. Among the six priorities, the steel industry is positioned
to benefit in particular from the intention to set up markets for advanced clean
technologies, including financing for demonstration of Carbon Capture and Storage
(CCS) projects; and from the attention paid to sustainable construction and raw
materials. The EIB, which has been endowed with an additional capital of €10bln by the
Member States, is expected to step up its line of financing to resource efficiency
investments, with up to €15-20bln of additional funding.
The steel industry is affected by resource efficiency policy in at least three respects: i)
efficiency in the use of raw materials; ii) energy efficiency; and iii) carbon efficiency. In
64 The European Commission further developed this commitment by issuing guidance on evaluating
competitiveness in Impact Assessments. See Commission Staff Working Document, Operational
Guidance for Assessing Impacts on Sectoral Competitiveness within the Commission Impact
Assessment System. A "Competitiveness Proofing" Toolkit for use in Impact Assessments,
SEC(2012)91, 27.1.2012
65 Communication from the Commission, A Stronger European Industry for Growth and Economic
Recovery. Industrial Policy Communication Update, COM(2012)582, 10.10.2012.

Page 117 of 259
all three respects, the challenge is to decouple output from use of natural resources that
is to produce the same quantity of steel by using fewer raw materials, less energy and
emitting less CO2.
Energy and carbon efficiency are usually tangled concepts for many industries: the
lower the energy consumed – usually burnt – the lower the carbon intensity. However,
steel is peculiar, as it uses its main source of energy that is coke, not because of its
thermal energy content, but as a reducing agent. Making steel through the BOF route
requires carbon, and coal is the source of carbon. The chemical reaction which takes
place in a blast furnace requires, at constant technology, a constant proportion of coke
and iron ore. Thus, energy efficiency plays a role in reducing CO2 emissions, but not as
straightforward as in other ―fuel-burning‖ energy intensive industries. It should be
noted that extracting chemical energy from coal is a more efficient process compared to
the production of thermal energy, up to twice efficient. However, the BOF steel making
process results in very high direct emissions, between 1.5 and 2 tonnes of CO2 per tonne
of steel. Consequently, EU steel makers represent between 4 and 7% of all EU
anthropogenic GHG emissions (JRC, 2012).
The EU has a very ambitious strategy to move to a competitive low carbon economy in
2050.66 It aims at cutting GHG emissions by 80% in 2050 compared to 1990 levels.
Current policies are estimated to lead to a 40% reduction, and additional efforts would
be needed to meet the 80% level. As for sector-specific burden sharing, the industry is
expected to cut emissions between 34 and 40% by 2030, and 83 to 87% by 2050. Such a
bold target will require more efficient processes and equipments, increased recycling
and abatement technologies. However, such targets would not be achievable through the
usual retrofitting, but would rather require the development of entirely new solutions.
Indeed, current technologies can lead the industrial sector only to cut emissions by
about half, according to Commission forecasts. On top of this reduction, only CCS will
be able to ensure such a level of decarbonisation. To ensure that EU competitiveness is
not damaged, the Commission analysis ―confirms earlier findings that the current
measures provide adequate safe-guards‖, concerning the measures against carbon
leakage – already in force – and, most notably, the possibility of including imports into
the ETS system.
The Energy Roadmap 205067 explores a similar path towards the decarbonisation of the
energy system. This is especially relevant for the EAF steel route, which uses no coke but
electricity as the source of energy for transforming raw materials (mainly scrap) into
66 Communication from the Commission, A Roadmap for moving to a competitive low carbon economy
in 2050, 8.3.2012, COM(2011)112.
67 Communication from the Commission, Energy Roadmap 2050, COM(2011)885.

Page 118 of 259
steel. Decarbonisation of the energy system will require substantial investments, both in
new capacity and grid equipments (estimated at €1.5-2.2 bln over four decades). This
will results in higher energy prices until 2030. According to the Commission, the
adverse effect of price spikes on EU competitiveness is to be addressed through
international policy coordination and the availability of sufficient safeguards for energy
intensive industries at risk of carbon leakage. Furthermore, as some investments in
energy have a public good character, the Commission considers that some support, e.g.
via the EIB or the EBRD, can be warranted to early movers, including industrial players.
All of the interviewees from both Commission services and the industry agreed on the
fact that the steel industry, as far as the BOF route is concerned, is close to its efficiency
limits, estimating possible additional reduction of about 10%. ESTEP (2003)
estimations come indeed close to these views, as it estimated that most efficient BOF
plants consume about 18 GJ/tonnes of hot rolled steel, and that an average plant
consumes 21 GJ/tonnes, i.e. between 15 and 20% more. The situation is different for the
EAF route, where most efficient plants consume about 3 GJ/tonne, while the higher
consumption range is in the area of 7 GJ/tonne, i.e. more than double. As dealt with
more in details in Section 7.3 below, most of CO2 emissions from EAF plants are
indirect, i.e. results of the electricity consumption. For EAFs, decarbonisation depends
on the underlying electricity decarbonisation, on top of their own efficiency investments.
For BOF producers, it is fair to say that to keep pace with Commission targets, a major
technological breakthrough is needed. For this to happen, demand-pull factors, such as
carbon price or public investments, are to be complemented with technology-push
factor, i.e. R&D&D support.
A major breakthrough, not yet ready but not too far from being mature for market
deployment (as reported in JRC, 2012, as well as by several interviewees), is the
combination of Top Gas Recycling (TGR) with CCS. This is one of the technologies
researched and developed by the ULCOS programme, co-financed by the EU.
TGR is a technology which can be applied to BFs in order to recovery energy, in the form
of chemical reducing power, from furnace waste gases. In very simple terms, recovery of
waste gases substitutes for part of the coke consumption, which decreases by about 25%
(Birat and Lorrain, 2009).68 Less coke means lower emissions, and a higher productivity
in terms of tonne of steel per tonne of raw materials, translating into higher raw
material efficiency and a significant cost reduction. Estimates reported by an
interviewee indicate that the investment costs may vary between €200 and 350 mln per
furnace, depending on the features of the BF on which TGR is to be applied. According
68 Total energy consumption decreased by about 10-12%, as part of coal is substituted by natural gas.

Page 119 of 259
to one interviewee, some European steel companies were allegedly considering such
investments on ground of productivity gains, but the crisis, with the consequent demand
fall and capital drought, forced these plans to be postponed.
CCS cuts CO2 emissions rather than increasing efficiency. It brings to steel makers no
benefits in terms of increased productivity, although it allows them to save the cost of
ETS allowances. The combination of TGR and CCS could bring about a reduction of
GHG emissions by about 70%, thus close to the targets included the Commission
decarbonisation plan. However, CCS is not yet a technology ready for market
deployment, as it still has to undergo the demonstration phase. The industry, under the
support of the instrument New Entrance Reserve (NER) 300, undertook to deploy a
demonstrator in Florange. The demonstrator is planned to have a capacity of 1.7MMT of
pig iron, and its cost reaches up to €650 mln. About €250 is expected to be covered by
the NER-300. However, payments will be conditional on the successful implementation
of the demonstrator over a certain number of years. Currently, the process was put o a
halt because of the unwillingness of the industry to bear such a risk in a context of
constrained capital resources and technical difficulties. EU innovation policies generally
require industry participation to funding and risk, not being 100% subsidies. The
question is how to strike the balance in terms of sharing costs and risks.
On top of the technological challenge of applying capturing carbon from the BF, the
storing of CO2 is another criticality, as this is an untested technology. Costs of setting up
storage sites (e.g. in depleted gas fields) and of the carbon ducts needed to bring CO2
from steel installations to underground deposits are very large, and acceptance by local
community may bring additional difficulties.
Given how natural resources are distributed across the world, non-energy resource
efficiency69 is crucial for Europe, as it is the world area with the highest net imports of
resources per capita. The Commission released in 2011 its roadmap,70 where an overall
strategy for raw materials is deployed to overcome what have been considered the four
most important barriers in this area: i) market prices, taxes and subsidies which do not
69 Land and soil are included among non-energy resources. The Commission launched a soil strategy in
2006, which is of relevance for the steel industry as it includes the duty to clean and restore industrial
sites. The Commission also proposed a Framework Directive on soil protection to harmonise national
standards, and introduce them where non-existing. However, the directive was never approved by the
Council of the EU and is still pending. Cf. Communication from the Commission, Thematic Strategy
for Soil Protection, COM(2006)231, 22.9.2006; and Proposal for a Directive of the European
Parliament and of the Council establishing a framework for the protection of soil and amending
Directive 2004/35/EC, COM(2006)232, 22.9.2006.
70 Communication from the Commission, Roadmap to a Resource Efficient Europe, COM(2011)571,
20.9.2011.

Page 120 of 259
reflect real costs of resource use; ii) innovation in resource use by businesses; iii) R&D
in resource efficiency; and iv) international competitiveness concerns. In the field of raw
materials, the EU had launched an initiative already in 2008,71 then updated in 2011.72
The two most important challenges, e.g. the marked price volatility – or better, the
sharp price increases – and export dependency, are to be tackled through:
1. Ensuring access to third countries mineral resources on an even and fair playing
field, especially in Africa, through a better the coordination of Commission and
EIB development policies; and ensuring that raw materials markets are not
distorted through trade policy;
2. Fostering and coordinating Member States to improve access to European
resources;
3. Developing efficiency in resource use, including boosting recycling of raw
materials.
Access to raw materials at a reasonable cost and efficiency in the use of resources is an
imperative for EU steel makers to remain competitive, as non-energy raw materials
represent about 50% of total costs of production for BOF steelmakers.73 At the same
time, recycling policies are very important for EAF plants, as non-energy raw materials,
mainly scrap, represent even a higher share, more than 60%, of total costs. Scrap is a
scarce resource, given that steel products have an average life-cycle of about 40 years.
This implies that today we are recycling, on average, steel produced 40 years ago, when
the levels of production were much lower than the current level. Not much more can be
recovered through increasing recycling, as recycling rates for steel in the EU are already
in between 80% and 90%.74 Scarcity of scrap is exacerbated by the exports of scrap
materials towards low-cost countries, where scrap is treated at a much lower cost due to,
among other reasons, lower requirements in terms of corporate social responsibility and
environmental regulation.
The European Innovation Partnership (EIP) on raw materials75 links policies on
resource efficiency with the EU 2020 innovation policy.76 An EIP, introduced by the
71 Communication from the Commission, The raw materials initiative — meeting our critical needs for
growth and jobs in Europe, COM(2008)699, 4.11.2008.
72 Communication from the Commission, Tackling the Challenges in Commodity Markets and on Raw
Materials, COM(2011)25, 2.2.2011
73 See Section 1 above.
74 See also BCG 2013.
75 Communication from the Commission, Making Raw Materials Available for Europe's Future Well-
Being Proposal for a European Innovation Partnership on Raw Materials, COM(2012)82, 29.2.2012

Page 121 of 259
Innovation Union Flagship Initiative, is a partnership launched ―in cases where the
combined strength of public and private efforts at regional, national and EU level in
innovation and R&D and demand-side measures are needed to achieve societal targets
quicker and more efficiently.‖ The Commission considered in 2012 that a secure and
sustainable supply of raw materials represents a challenge worth of being tackled
through an EIP. The EIP on raw materials aims at contributing to the mid- and long-
term security of sustainable supply of non-energy non-agricultural raw materials
(including metallic ores). This will be achieved through a reduction of imports
dependency which, in line with the raw materials initiative, requires increased levels of
EU production, increased recycling, and increased resource efficiency. The industry,
through ESTEP, participates to two of the five working groups within this EIP.
The EU innovation policies are of course not only relevant in terms of resource
efficiency. As already discussed, a lot of attention is devoted to R&D in the context of
energy and carbon efficiency. The iron and steel sector can also benefit from a dedicated
R&D fund, the Research Fund on Coal and Steel (RFCS). Financed with the interests
earned on ECSC liquidation fund, it provides about €55-58 mln per year to industrial
R&D, of which about 27% is spent for research on coal, and the rest on steel. The main
areas of intervention of the RFCS are coal extraction, coal utilisation, furnace
technology, steel making processes, steel quality, steel environmental impact, and safety
and health of steel workers. Finally, it is worth mentioning that the new Horizon 2020
programme,77 still under legislative procedure, includes a public-private partnership,
SPIRE, devoted to energy intensive industries, where the steel industry could benefit in
terms of financing carbon abatement projects.
As stated at the beginning of this Section, the general EU policies described above may
have a significant impact on the steel industry. They represent policy opportunities and
risks. The risk evoked by the industry is that the policies towards a resource efficient
Europe, especially as far as energy and carbon efficiency is concerned, discourage any
additional investment by steelmakers in our continent. To avoid misunderstanding, this
statement does not refer to investments in additional steel making facilities which, given
the current market conditions, are not on the table, as much as they have not been on
the table for the last 30 years. The investments at stake are those needed to continuously
refurbish existing installations, improving their efficiency, and thus productivity, and
increasing the quality, and thus the added value, of end products. Without
76 Communication from the Commission, Europe 2020 Flagship Initiative Innovation Union,
COM(2010)546, 6.10.2010
77 Communication from the Commission, Horizon 2020 - The Framework Programme for Research and
Innovation, COM(2011)808, 30.11.2011. For the full legislative package, cf.
http://ec.europa.eu/research/horizon2020/index_en.cfm?pg=h2020-documents.

Page 122 of 259
refurbishments, current installations will lose their competitiveness and die at the end
of their investment lifecycle. If the current policies give the message that steel making
will become too onerous, e.g. because of meeting greening targets, the industry claims
that steel makers will slowly but steadily disappear from Europe, as no one will be
making any further investments, whose utilisation will fall under the period for which
ambitious environmental targets are foreseen.
Albeit reasonable, it is difficult to assess empirically the validity of these claims. Any
investment decision is confronted with specific policy risks or opportunities. Pakistan
may have a booming market and very little environmental regulation, but it is at risk of
turmoil. Latin American countries, among emerging countries, may be very good
locations for investments but safety in terms of expropriation and capital movements
are surely not on par with the European standards. The US have shale gas, but building
steel plants there to re-import semi manufactured products into the EU, as some
companies are doing or planning to do, will be subject to the currency risk. What can be
fairly and clearly said is that if the EU intends to impose ambitious targets on its
manufacturing base, it should at the same provide the tools to achieve them, and that
this target should also be put in the current and foreseeable technological context. The
JRC (2012) clearly pointed out that only a combination of technological-push and
demand-pull factors, and among them both taxes, prices and caps as well as public
subsidies and investments, procurement strategies, standards and certification policies,
can meet the targets defined in the EU general policies.

Page 123 of 259
6 Financial markets (commodity derivatives and other
financial instruments)
This section presents a general overview of the legislation included in the list of relevant
legislation. Besides the Markets in Financial Instruments Directive (hereinafter
MiFID),78 which is therein comprised, it was considered necessary to cover also the new
proposed Markets in Financial Instruments Regulation (hereinafter MiFIR);79 the
European Market Infrastructure Regulation (hereinafter EMIR);80 the Market Abuse
Directive (MAD)81 and the new proposed Market Abuse Regulation (MAR),82 as all this
legislation is part of the financial regulation which may have an impact on steel makers,
both concerning trading of commodity derivates and financial instruments.
Most of the EU steel makers have their headquarters in the EU, and hence are most
likely subject to EU financial regulation. As legislation covered in this section is
horizontal by nature, an assessment of their cost effects on steel makers requires
consultation with operators. The use of secondary sources would be inappropriate, as
they focus in general on financial institutions. However, the section falls short of a
detailed cost assessment, since companies are reluctant to provide information about
underlying financial transactions due to the risks of unintended disclosure of their
commercial policies. An interview was set up with a steel producer, which could not
provide data about size of underlying business falling under financial markets
78 Directive 2004/39/EC of the European Parliament and of the Council on markets in financial
instruments amending Council Directives 85/611/EEC and 93/6/EEC and Directive 2000/12/EC of
the European Parliament and of the Council and repealing Council Directive 93/22/EEC, as amended
by Directive 2006/31/EC, Directive 2007/44/EC, Directive 2008/10/EC, and Directive 2010/78/EU.
MiFID is currently under review, cf. Proposal for a Directive of the European Parliament and of the
Council on markets in financial instruments repealing Directive 2004/39/EC, COM(2011)656,
20.10.2011.
79 Proposal for a Regulation of the European Parliament and of the Council on markets in financial
instruments and amending Regulation [EMIR] on OTC derivatives, central counterparties and trade
repositories, COM(2011)652, 20.10.2011
80 Regulation (EU) No 648/2012 of the European Parliament and of the Council on OTC derivatives,
central counterparties and trade repositories
81 Directive 2003/6/EC of the European Parliament and of the Council on insider dealing and market
manipulation (market abuse) [MAD], as amended by Directive 2008/26/EC and Directive
2010/78/EU. MAD is currently under review, cf. Proposal for a Directive of the European Parliament
and of the Council on criminal sanctions for insider dealing and market manipulation, COM(2011)654,
20.10.2011.
82 Proposal for a Regulation of the European Parliament and of the Council on insider dealing and
market manipulation (market abuse), COM(2011)651, 20.10.2011.

Page 124 of 259
regulation. Another interview has been carried out with the trading desk of a primary
aluminium producer; however, as the company is headquartered in the US, trading is
centralised on the trading book of the US company, hence the EU financial regulation is
only of marginal importance to it.
6.1 Markets in Financial Instruments Directive and Regulation
(MiFID and MiFIR)
Steel producing companies are commodities firms that shall enjoy a broad exemption
from the application of MiFID and the MiFIR.83
Information collected via interview suggests that steel companies trade commodity
derivatives and other financial instruments on their own account (with no high-
frequency algorithmic techniques) and do not provide intermediary services for other
steel companies as main business (art. 2.1(i)). As a result, cumulative exemptions from
the application of the Directive and Regulation specified in article 2.1(d), 2.1(i), and
2.1(o) MiFID apply to steel firms that deal on own account in commodity derivatives,
emission allowances and other financial instruments, perform investment activities as
ancillary to the main business (in commodities), or trade on behalf of electricity and
natural gas undertakings.84 An additional exemption (under article 2.1(p)) applies to
those firms providing investment services on emission allowances for the purpose of
hedging a commercial risk. Finally, intra-group transactions are exempted under art.
2.4(a). However, the inclusion of emission allowances among the list of financial
instruments (as per Annex I Section C) may create space for interpretation about the
application of the exemption in art. 2.1(i) as ‗ancillary activity‘ for customers or
suppliers of the main business. This is the case for some of the steel companies that
regularly trade the certificates on behalf of third companies. The exemption will be
applicable as long as these ‗third companies‘ are customers or suppliers of the main
business.
Two articles give rise to direct costs for the steel producers:
- Art.59 MiFID, on position limits and position management controls in commodity
derivatives. MiFID requires trading venues to monitor commodity derivatives
positions. Commodities firms may be required to: i) provide additional
information; ii) to reduce the size of their exposure; or even iii) to terminate it (on
a temporary or permanent basis), to prevent market abuse or support orderly
83 The text considered for the new MiFID and MiFIR is the Council compromise of April 15th.
84 As defined under indent 35 of art. 2 of Directive 2009/72/EC and indent 1 of art.2 of Directive
2009/73/EC).

Page 125 of 259
pricing and settlement conditions. Where the position is ascertained as
―dominant‖, the commodity firm may also be required to provide liquidity back to
the market at agreed price and volume on a temporary basis. Besides the
administrative costs to comply with these requirements, detailed disclosure of
positions may cause investment costs by revealing the companies‘ position to the
market. By disclosing this information to regulators on a confidential basis, costs
may be substantially lower, also depending on the harmonisation of reporting
standards across the different legislations.
- Art.35 MiFIR, on the obligation to trade on Regulated Markets (RMs), Multilateral
Trading Facilities (MTFs) or Organised Trading Facility (OTFs). MiFIR provides
that transactions in derivatives, which are not intra-group transactions as defined
by art. 3 of EMIR, pertaining to a class of derivatives that has been declared
subject to the trading obligation as a subset of derivatives that are subject to
mandatory clearing obligation (under art. 5.2 and 5.4 EMIR), should be traded on
RMs, MTFs or OTFs or third country's trading venues (in equivalent jurisdictions).
This could increase financial and operating costs for commodities firms that need
perhaps to unwind big OTC transactions and split in smaller transactions to be
executed on an open and transparent platform. It may also cause investment costs,
as liquidity in open markets may not be always favourable, especially when the
position is sufficiently high to cause market impact.
Nevertheless, there is room for indirect costs to arise from some of the new provisions
included in the legislative text. Immediate indirect costs will potentially come from the
inclusion of emission allowances among financial instruments, which will require firms
that trade allowances as main business (also on behalf of steel firms) to become a MiFID
investment firm. This can potentially increase the cost of trading of such instruments, in
particular for steel companies that provide trading services in emission allowances for
third parties that are not directly linked to their main business.
Additional indirect costs may also come from the removal of exemption for those
providing MiFID investment services (see annex I, section A) or dealing on own account
in commodity derivatives as main business. Spot trading venues for emission allowances
would also require MiFID authorisation as RM, MTF or OTF. This means that spot
trading venues would need to apply tight requirements on transparency and
supervision, which may increase cost of trading and produce exposure (in terms of
transparency of positions) to steel companies. Under article 31 of MiFIR, the European
Securities and Markets Authority (ESMA) or national competent authorities, which
need to receive a non-binding opinion from ESMA, can restrict or prohibit the
marketing, distribution or sale of a financial instrument (including commodity
derivatives) or an activity if there is a threat for the orderly functioning and integrity of
Page 126 of 259
the commodity markets. No distinction has been made between physical or derivatives
commodities markets. Under art.35 of MiFIR, ESMA can limit the ability to enter into a
commodity derivative to preserve stability of financial system and/or integrity of
commodities markets. Art. 23 of MiFID obliges all investment firms to report
transaction in financial instruments (or their underlying) listed on MiFID trading
venues to competent authorities through an Approved Reporting Mechanism (ARM).
Transactions that were not reported before are required now to be disclosed. This could
potentially increase administrative costs, which may indirectly impose additional
administrative burdens on commodities firms.
6.2 The European Market Infrastructure Regulation (EMIR)
Regulatory obligations for steel firms arise under EMIR, as steel and aluminium
companies typically have exposures towards Over The Counter (OTC) derivatives.
Under EMIR derivative contracts are defined as financial instrument as defined by
points (4) to (10) of Section C of Annex I to Directive 2004/39/EC as implemented in
Article 38 and 39 of Regulation (EC) No 1287/2006. OTC means a derivative contract
which execution does not take place on a regulated market as within the meaning of
Article 4.1(14) of Directive 2004/39/EC or on a third-country market considered as
equivalent to a regulated market in accordance with Article 19.6 of Directive
2004/39/EC. See art. 2.7 of EMIR.
Some exemptions from the application of EMIR apply. Intra-group transactions in
derivatives contracts (as per art. 3) are not subject to the clearing obligation.
Commodities firms will be exempted from the clearing obligation if the volume of the
OTC derivatives trades does not exceed a certain threshold over a predefined period of
time. These thresholds (of notional value for the whole group) are: €1 billion (each) for
credit and equity derivatives and €3 billion (each) for interest rate, foreign exchange
and commodity derivatives. When the amount for one class of OTC derivative contracts
is surpassed, the commodity firm exceeds the clearing threshold and needs to undergo
the clearing obligation. One additional exemption for non-financial counterparties
(including commodities firms) is that OTC derivatives contracts that are objectively
measurable as reducing risks directly related to the commercial or treasury financing
activity should not be taken into account when determining the volume of OTC
derivatives trades. This is also defined hedging exemption. More specifically, ESMA
clarified that hedging for EMIR means:
- OTC derivative contracts entered into for the purpose of ―proxy hedging‖ (i.e. risk
reduction through entering into a closely correlated instrument rather than an
instrument directly related to the exact risk);
Page 127 of 259
- Transactions that are defined as ―hedging‖ under IFRS (art.3 EC
Regulation1606/2002) or GAAP accounting standards;
- OTC derivative contracts entered into as part of a portfolio hedging arrangement;
- OTC derivative contracts concluded in order to offset hedging derivatives
contracts; stock options and OTC derivatives contracts related to employee
benefits;
- OTC derivative contracts that reduce risks related to the acquisition of a company;
and
- OTC derivative contracts that reduce credit risk.
Information gathered from steel companies confirm that trading in OTC derivatives
contracts is only limited to activities falling under the ‖hedging‖ definition, so it appears
unlikely that any of the European steel company will overcome the threshold for the
mandatory clearing obligation.
EMIR articles giving rise to direct costs for steel producers are:
- Art.4 on clearing obligations. EMIR provides that above clearing thresholds, OTC
derivatives contracts must be cleared through central counterparties (CCPs) if
available.
- Art.9 on reporting obligations. EMIR provides that counterparties and CCPs shall
ensure that the details of any derivative contract they have concluded and of any
modification or termination of the contract are reported to a trade repository.
- Art. 10 on non-financial counterparties. EMIR provides that when a non-financial
counterparty takes positions in OTC derivative contracts exceeding the clearing
threshold, the non-financial counterparty shall: i) notify ESMA; ii) become subject
to the clearing obligation (art. 4); and iii) clear all contracts within 4 months.
- Art.11 on risk-mitigation techniques for OTC derivative contracts not cleared by a
CCP, such as timely confirmation, portfolio compression, and reconciliation
services.
Interviews confirm that standardised reporting formats and key risk mitigation
techniques (e.g., portfolio reconciliation and compression) are not yet adopted by steel
companies. Costs are not quantifiable because information about derivatives positions,
number and details of contracts are not disclosed by the companies to protect
commercial strategies. In addition, fees for risk mitigation services are negotiated
bilaterally and vary with the characteristics of the transaction. Costs would be partially

Page 128 of 259
offset by the beneficial effects in terms of lower probability of litigation around the
terms of the contract due to a better management of derivatives exposures. Finally, an
alignment of reporting formats for disclosure under EMIR and REMIT may further
reduce costs of legal provisions.
6.3 Market Abuse Regulation and Directive
The revision of MAD and the new MAR may indirectly affect steel producers. The
Commission proposal extends the scope of MAD to any financial instrument admitted to
trading on a MTF or an OTF (on top of RMs), as well as to any related financial
instruments traded OTC that can have an effect on the covered underlying market.
The proposal will also cover commodity derivatives and the related spot commodity
contracts, which will be addressed in part under the REMIT regulation.85 The proposal
extends the definition of inside information to price sensitive information relevant to
the related spot commodity contract as well as to the derivative itself, to ensure
consistency of the application of the regulation to both markets. It introduces a specific
definition of inside information for emission allowances that reflects the new
classification as a financial instrument under MiFID. For the purpose of detecting cases
of insider dealing and market manipulation, competent authorities have to have the
possibility to access private premises and to seize documents of the company. The
definition of inside information therefore is applied for trading commodity derivatives
and emission allowances to individuals that are part of the company (art. 6 of MAR).
Overall, the legislation may increase administrative costs and investment costs if the
definition of inside information may discourage employees to undertake actions that are
in the best interest of the company, due to the risk that could fall under insider trading
or market manipulation activities.
85 Regulation (EU) No 1227/2011 of the European Parliament and the Council on wholesale energy
market integrity and transparency

Page 129 of 259
7 Climate Change
This chapter starts with a brief introduction to the EU Emissions Trading Scheme (EU
ETS), followed by a discussion on the different types of costs associated with it. Then
methodology, data and results are presented in Section 7.3. Given the intertwined
nature of investments, investment costs related i.a. to CO2 abatement technologies are
included in the costs calculated in Section 10 on environmental policy.
7.1.1 What is the EU ETS
The EU ETS is a cap-and-trade system first implemented in 2005, with the political and
environmental goal of providing a cost-effective tool to reach the greenhouse gas (GHG)
targets which the EU had committed to. The legislation setting up the ETS is Directive
2003/87/EC of the European Parliament and the Council Establishing a scheme for
GHG emission allowance trading within the Community (hereinafter the ETS Directive)
and its amendments.86 The EU ETS was extended to the non-EU members of the
European Economic Area, Lichtenstein, Norway and Iceland in 2007.
The EU ETS compliance is set at the installation level. More than 11,000 installations,
including steel plants, are covered by the scheme. Each year, each installation must
surrender a number of emission permits equal to its emissions during the past year.
The compliance units are European Union Allowances (EUA), which represent one
tonne of CO2-equivalent emissions. Other units that are good for compliance are
Emissions Reduction Units (ERUs, from Joint Implementation projects) and Certified
Emission Reductions (CERs, from Clean Development Mechanism projects). The total
cap is equal to the total amount of EUAs made available each year through free
allocation or auctioning. Underneath that cap, market participants, including covered
installations, are free to trade. The total cap for installations covered by the EU ETS is
set do decrease every year by 1.74%.
The EU ETS is now in its third phase. The characteristics of these different phases are
discussed below. Given their different characteristics, they have different cost impact on
the steel sector.
86 Amending acts were as follows: i) Directive 2004/101/EC of the European Parliament and of the
Council; ii) Directive 2008/101/EC of the European Parliament and of the Council; iii) Regulation
(EC) No 219/2009 of the European Parliament and of the Council; and iv) Directive 2009/29/EC of
the European Parliament and of the Council. The latter act is the most relevant, as it introduces the so-
called third phase of the ETS system.

Page 130 of 259
7.1.2 Phase 1 (2005 – 2007)
During the first phase, which was a pilot phase, caps were set at the national level
through the National Allocation Plans (NAPs), which had to be approved by the
European Commission. A maximum of 5% of the allowances could be auctioned; the rest
was allocated free of charge on the basis of estimates of historical emissions. Due to a
lack of good quality data and no banking provisions between phases, this resulted in a
sizable over-supply of EUAs, driving prices close to zero at the end of the phase.
Although being a pilot phase, Phase 1 resulted in significant outcomes. A price for
carbon was established. It helped create the necessary infrastructure for future phases:
at the installation level this included monitoring, reporting and verification (MRV);
while in the marketplace National Registries, the Community Independent Transaction
Log and carbon exchanges were founded.
7.1.3 Phase 2 (2008 – 2012)
In phase 2, allocations were granted on the basis of the reported emissions in the first
phase. This process of grandfathering was considered fit to solve the problem of over-
supply observed in Phase 1. However the economic crisis had a clear impact and
substantially decreased emissions in Phase 2. The European Commission estimates that
between 1.5 and 2 billion EUAs were carried over to Phase 3.87 The amount of
allowances that could be auctioned was also increased, to a maximum of 10% of the
total.
7.1.4 Phase 3 (2012 – 2020)
The functioning of the ETS saw some significant changes at the start of the third phase.
Auctioning was increased, and more than 40% of all allowances will be auctioned
(including full auctioning for the power sector).
Energy intensive industries will receive part of their allocation for free, but will have to
get the rest through auctions. Allocation to energy intensive industries is determined by
using benchmarks,88 established per product, according to Decision 2011/27/EU.89 The
87 Report from the Commission, The state of the European carbon market in 2012, 14.11.2012,
COM(2012)652.
88 Benchmarks for the iron and steel industry are reported in Methodology for the free allocation of
emission allowances in the EU ETS post 2012. Sector report for the iron and steel industry, Study
commissioned by the European Commission to Ecofys (project leader); Fraunhofer Institute for
Systems and Innovation Research; and Öko-Institut. Available at: http://ec.europa.eu/clima/
policies/ets/cap/allocation/docs/bm_study-iron_and_steel_en.pdf.
Page 131 of 259
average carbon-intensity of the 10% best performers represents the benchmark for
allocating free emissions. Those installations that meet the benchmark receive more
allowances for free than those installations that do not meet it. The latter are thereby
incentivized to catch up to their best-performing peers. Free allocations are granted at
the 80% level of the benchmark, a share which is set to decrease to 30% in 2020.
However, this provision does not include sectors deemed to be exposed to the risk of
carbon leakage, and which are listed in the carbon leakage Decision.90 These
installations received 100% of their benchmark free allowances. Steel making (NACE v.2
sector 24.10) and the casting of iron tubes (NACE v.2 sector 24.21) are included in the
carbon leakage list.
BOF steel makers are also entitled to receive free allowances for the electricity generated
through recycling of waste gases. Although free allocation of allowances for electricity
production is prohibited, an exception is provided for waste gas electricity (Art 10A.1 of
the ETS Directive). Allocation of allowances has been discounted by the energy content
of natural gas, in order to ensure an even playing field between electricity producers.
This decision has been contested by the industry federation before the Court of Justice
of the European Union, which negated the locus standi and dismissed the case.91
As a result of the lessons learned in Phases 1 and 2, several important EU ETS functions
have now been centralized. Member states registries were incorporated in the EU
registry, and allocation is done at the EU level. Electric utilities now have to effectively
buy all their allocations; measures have been included to compensate energy intensive
industries, especially those exposed to international competition, such as art. 10A.6,
which allows member states to compensate for the indirect costs of emissions passed
through electricity prices.92
7.1.5 Scope of the study
This study analyses the cost impact of the EU ETS over the period 2005-2012. It does
not contain a quantitative assessment of the impacts of Phase 3 for the steel industry.
This report does include a quantitative analysis for Phases 1 and 2, and a qualitative
discussion is undertaken for the 3rd phase based on regulatory changes. For Phase 3
89 Commission Decision determining transitional Union-wide rules for harmonised free allocation of
emission allowances pursuant to Article 10a of Directive 2003/87/EC of the European Parliament and
of the Council (2011/278/EU)
90 Commission Decision determining, pursuant to Directive 2003/87/EC a list of sectors and subsectors
which are deemed to be exposed to a significant risk of carbon leakage (2010/2/EU)
91 Order of The General Court (Seventh Chamber), 4 June 2012, In Case T‑381/11, Europäischer
Wirtschaftsverband der Eisen- und Stahlindustrie (Eurofer) v. European Commission
92 See Section 8.1.2.

Page 132 of 259
there is also a quantitative scenario for one installation under a number of Phase
scenarios for EUA prices.
7.2 Costs
This study identifies three types of costs: direct or compliance costs, indirect costs and
administrative costs.
7.2.1 Compliance or direct costs
At the end of each year, installations surrender EUAs to match their CO2 emissions in
that year (in tonnes). Any shortage of allowances can be purchased through auctioning
or in the secondary market.
Essentially, the cost of compliance is the difference between the amount of EUAs each
installation needs to surrender and the number of allowances allocated, multiplied by
the cost of the allowances purchased.
7.2.2 Indirect costs
Electric utilities face increased production costs through their ETS compliance cost.
They pass on those costs to their respective customers via higher energy rates. Industrial
consumers therefore face an extra cost because of the cost of CO2 embedded in
electricity prices. This is an additional cost, which they cannot pass on to the ultimate
consumers if they are active in a globally competitive sector.
The pass-on rate of the CO2 cost for producing electricity is a number that is contested
and may vary significantly between member states. In this report the pass-on rate is
assumed to be one, but this is a conservative assumption and may overestimate actual
indirect costs.
7.2.3 Administrative costs
Two kinds of administrative costs arise under the EU ETS: one-off costs for the start-up
of the process, and recurring Monitoring, Reporting and Verification (MRV) costs. The
start-up costs are caused by the investments necessary for monitoring compliance. For
illustrative purposes the infrastructure needed for the correct calculation of emissions
would represent a one-off start-up cost.93 MRV costs are the additional burdens placed
93 Detailed Information Obligations are spelled out in the Commission Regulation (EU) No 601/2012 on
the monitoring and reporting of greenhouse gas emissions pursuant to Directive 2003/87/EC. See
Mapping Sheets of the Climate Change Policy Area in Annex I.

Page 133 of 259
on installations for continued compliance with monitoring duties, for example the wages
of the staff dealing with the administrative aspects, or the cost of hiring a verifier.
7.3 Quantification of Cumulative Costs
The ultimate objective of this study is to provide the cost of ETS per tonne of crude steel
produced. The level of information is aggregated at the plant level.
The model for the cost of EU ETS is defined as:
Total ETS Cost (€/Tonne of steel) = Direct cost/Tonne (€/Tonne of steel)
+ Indirect cost (€/Tonne of steel)
+ Administrative costs (€/Tonne of steel)
Direct costs
Direct cost (€) = Emissions (Tonnes of CO2)
- Allocations (Tonnes of CO2)
* CO2Price (€/Tonne of CO2)
Where:
- Emissions are the verified emissions of the installation;
- Allocations are the EUAs freely allocated to each installation;
- CO2 Price is the average yearly market-price of CO2.
The sources used for this calculation are:
- Emissions: National Allocation Plans (NAPs), National Registries and the EU
Transaction Log;
- Allocations: NAPs, National Registries and the EU Transaction Log;
- CO2 Price:
o 2005: yearly average EUA spot prices, reported daily by the European
Environment Agency;
o 2006-2012: yearly averages of the daily settlement prices for Dec Future
contracts for delivery in that year. The daily settlement prices were reported
by the European Energy Exchange.

Page 134 of 259
The CO2 price used is a proxy and might (is likely that will) produce imperfect
results. To fully understand carbon prices and, further below, the exact impact of
the EU ETS, what would be needed would be a plant by plant analysis of transfers
and trading strategies. This data is only made available by the EU Transaction Log
(EU TL) with a five year time-lag.
Table 20: Average yearly prices per ton of CO2 (€)
Year 2005 2006 2007 2008 2009 2010 2011 2012
CO2
Price 21.82 18.62 0.74 23.03 13.31 14.48 13.77 7.56
- Total production (Tonnes of steel): this data is necessary for converting the price
per installation into a price per tonne of steel. These figures are not available for
each plant. For Plants 1and 4 the operators provided production figures for 2005 –
2012, Plant 2 has also provided figures, though only for 2010-2012. For other
plants and/or years, the data used is a proxy: production capacity data from the
World Steel Capacity Book. In order to ensure conservative assumptions, an 80%
of total capacity approximation is used.94
Indirect costs
Indirect cost (€/Tonne of steel) = Electricity intensity (kWh/Tonne of steel)
* Carbon intensity of electricity (CO2/Tonne of steel)
* BOF Discount factor (numeric multiplier)
* CO2 Price (€/Tonne of CO2)
Where:
- Electricity intensity of steel production: the amount of electricity used to produce
one tonne of steel. This amount is plant and technology specific;95
- Carbon intensity of electricity generation indicates the amount of tonnes of CO2
emitted by utilities to generate one kWh;
94 According to capacity and production data, BOF plants were utilised at a rate between 86% and 90%
between 2005 and 2008; utilisation rates dropped to about 56% in 2009, and came close to 80% for
2010 and 2011 (provisional data). Utilization rates in EAF plants were slightly lower, on average 1.5%,
but followed similar trends.
95 Only the electricity intensity of the crude steel production process is taken into account.

Page 135 of 259
- BOF Discount factor: a discount factor of 0.2 included to account for the fact that
BOF plants produce 80% of their own electricity consumption;
- CO2 Price is the average yearly market-price of CO2.
Sources:
- Electricity intensity of production; plants 1, 2 and 4 have reported their figures on
electricity intensity. For the rest of the sample estimates from World Steel
Dynamics are employed. A small correction was made for plant 3 to include the
electricity consumption of its sinter plant. As this data is only available starting in
2010, the same figures are used for 2005-2010.
- Carbon intensity of electricity generation: the maximum regional carbon intensity
of electricity is utilised, provided by the Commission‘s Guidelines on State aid
measures.96 Note that these figures are not national, as member states who are
highly interconnected or have electricity prices with very low divergences are
regarded as being part of a wider electricity market and so have the same
maximum intensity of generation (for example Spain and Portugal).
It must be noted that the figure used, which are the maximum regional carbon
intensity are much higher for certain jurisdictions than the national average (e.g.
for France it is a factor of 10)
In order to check that the data is in the correct range, the average national carbon
intensity was included in the analysis, determined as follows:
o Germany: data was acquired from BDEW, the national industry association
for energy and water sectors. Their national figures cover national carbon
intensity of electricity generation up till 2007. These figures have been
extended to the period 2008- 2012;
o Spain and Italy: Enerdata, an independent research and consulting firm,
provided a comprehensive data series;
o For all other member states another proxy is defined. The national emissions
data for the ‗public electricity and heat production sector‘ (source: UNFCCC)
is divided by ‗Total gross electricity generation‘ per country (source:
EUROSTAT) till 2010, for 2011 and 2012 figures for 2010 are used.
96 Communication from the Commission: Guidelines on certain State aid measures in the context of the
greenhouse gas emission allowance trading scheme post-2012 (2012/C 158/04)

Page 136 of 259
- CO2 Price: the same data is utilised as in the previous section to estimate a yearly
average price;
- BOF Discount factor: a discount factor for BOF plants is included to account for
differences in production processes between BOF and EAF plants. BOF plants
produce roughly 80% of the power they consume.97 Not including this discount
factor in the model would imply that installations pay both the direct and indirect
ETS price for electricity they generate. This is incorrect, as only the indirect costs
of the electricity they buy from utilities is to be considered. The BOF discount
factor is established at 0.2.
Administrative costs
Administrative cost (€/Tonne of steel) = Start-up costs (€/Tonne of steel)
+ MRV costs (€/Tonne of steel)
Where:
- Start-up costs are the costs for one-off investments to start compliance with the
EU ETS Directive;
- MRV costs are the recurring costs for an installation when it comes to monitoring,
reporting and verification obligations within the EU ETS directive.
Source:
- The only data available for these variables was provided by Eurofer. This data
includes an aggregate assessment of: staff, procedures, sampling and analyses for
monitoring and reporting purposes, verification costs and other administrative
costs such as managing the registry, purchases and sales of emission permits and
hedging activities (source: Eurofer). The Eurofer estimates result in an average
administrative costs of around 0.1 € per ton of steel.
Plants
The following plants have been included in the sample. As recalled in Section 3, only the
main features are described below, in order to prevent plant re-identification:
1. Plant 1 is a BOF producer with capacity >5 MMT located in Western Europe;
2. Plant 2 is a BOF producer with capacity >5 MMT located in Western Europe;
97 Cf. report for the Iron and Steel industry, (2009). Benchmark study, supra note 88.
Page 137 of 259
3. Plant 3 is a BOF producer with capacity <5 MMT located in Western Europe;
4. Plant 3 is a BOF producer with capacity <5 MMT located in Central Eastern
Europe;
5. Plant 5 is an EAF producer with capacity >0.8 MMT located in Southern Europe;
6. Plant 5 is an EAF producer with capacity >0.8 MMT located in Southern Europe;
7. Plant 5 is an EAF producer with capacity <0.8 MMT located in Southern Europe;
8. Plant 5 is an EAF producer with capacity <0.8 MMT located in Central Eastern
Europe
7.3.1 Results
Table 21 shows that, in general, these installations have been allocated enough free
allowances to cover their emissions during Phases 1 and 2. Only Plants 2 and 7
experienced a shortage in Phase 1. It is recognised that there was no carry over from
Phase 1 to Phase 2, but the total surplus of EUAs for Phase 1 and Phase 2 together for
this sample was still more than 34 million EUAs. The total surplus banked from Phase 2
to Phase 3 was 31,478,185 EUAs.
The discrepancies in allowances and emissions in Phase 1 and 2 can be attributed to the
lack of information on historical emission for Phase 1 allocation.
The percentages of total allocation that were oversupplied vary widely between plants,
from 6 percent to nearly 90 percent. For Plant 4 this is partly due to national
circumstances as steel producing installations in that country, on average, received free
allowances that were 46% higher than total emissions. One can also point to a drop of
30% in yearly emissions between 2008 and 2009. This was caused by downscaling in
production, to slightly more than 20% of total capacity in 2010. Production increased
steadily over the next two years, to more than 40% of plant capacity in 2012.

Direct Costs
Table 21: Emissions and allocations (tonnes of CO2)
Plant 1 BOF
Plant 2
BOF
Plant 3
BOF
Plant 4
BOF
Plant 5 EAF
Plant 6
EAF
Plant 7 EAF
Plant 8
EAF
Phase 1
Emissions 35,172,872 58,185,760 18,810,842 11,824,517 179,886 359,843 421,484 126,496
Allocations 36,734,937 54,957,843 18,919,890 14,324,206 193,599 527,859 411,762 180,009
Difference -1,562,065 3,227,917 -109,048 -3,925,783 -13,713 -168,016 9,722 -53,513
Phase 2
Emissions 52,500,037 90,728,684 11,635,144 14,324,206 504,280 443,783 645,864 135,134
Allocations 58,916,831 103,387,205 13,906,452 23,806,310 660,420 986,460 756,170 175,469
Difference -6,416,794 -12,658,521 -2,271,308 -9,482,104 -156,140 -542,677 -110,306 -40,335
Surplus Phase 1 and Phase 2
7,978,859 9,430,604 2,380,356 13,407,887 -169,853 -710,693 -100,584 -93,848
Surplus at the start of Phase 3
6,416,794 12,658,521 2,271,308 9,482,104 156,140 542,677 110,306 40,335
Oversupply as a % of total emissions 9.1% 6.3% 7.8% 51.3% 24.8% 88.4% 9.4% 35.9%
Oversupply as a % of total allocations
8.3% 6.0% 7.3% 33.9% 19.9% 46.9% 8.6% 26.4%

Plant 6 also saw a significant and permanent decrease in emissions from 2008 to 2009
by around 30%. It could be assumed that this is due to lower production levels, but as no
information on production levels was made available by the operators of Plant 6, this
cannot be confirmed. Plant 2 faced a significant shortage in Phase 1, as emissions were
more than 3 million tonnes higher that allocated allowances. However, in Phase 2 this
deficit was turned into a surplus of nearly 13 million EUAs.
An important observation is that the operator of Plant 2 experienced a large surplus in
Phase 2 due to the fact that that site faced a temporary closure in 2011, and practically
ceased production. Consequently, the analysis for that plant was limited to the period
2005-2010. Table 22 shows the total direct costs per plant, which is a weighted average
(by yearly EUA price) of the sum of yearly emissions minus allocations.
Table 22: Direct costs (€ mln)
BOF Plant 1 Plant 2 Plant 3 Plant 4
Phase 1 -28.09 38.58 -0.09 -58.07
Phase 2 -88.18 -151.26 -37.33 -123.78
TOTAL -116.27 -122.67 -37.42 -181.85
EAF Plant 5 Plant 6 Plant 7 Plant 8
Phase 1 -0.16 -2.38 0.14 -0.76
Phase 2 -2.19 -7.68 -1.52 -0.28
TOTAL -2.34 -10.06 -1.37 -10.04
In these tables, a negative number indicates that the installation is unlike to have faced
direct costs during the first two phases of the EU ETS. The values are however only
indicative.
Two other points have to be made.
- No mandate was given to either examine the possible benefits from ETS and/or
trading and compliance strategies used by firms. The valuation of the observed
surplus depends on whether any EUAs were sold and if so when. It is difficult to
obtain any insights into the strategies used by the various operators.
- Little data on transfers is available, as mentioned before: the EU TL releases this
information with a 5-year time lag.
Finally the results show a large divergence between BOF and EAF installations. The four
BOF plants in this sample have accumulated significantly larger numbers of EUAs over
this period. Table 23 below shows the direct cost per tonne of production per plant.
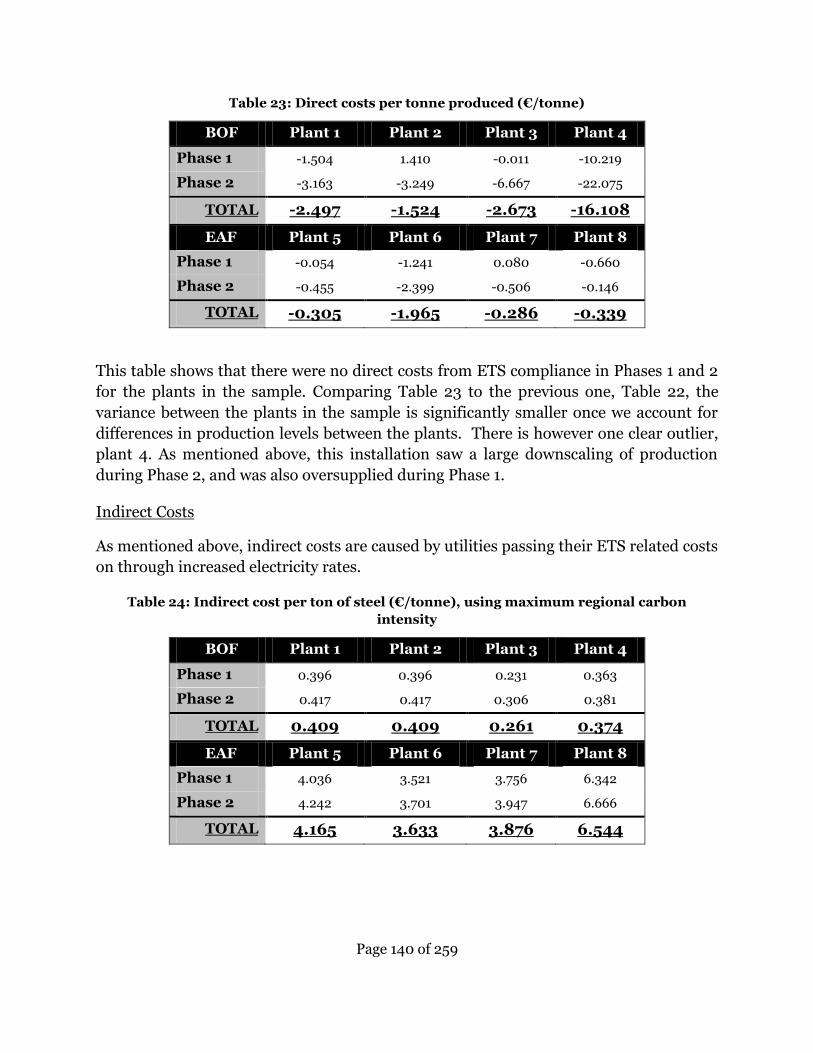
Page 140 of 259
Table 23: Direct costs per tonne produced (€/tonne)
BOF Plant 1 Plant 2 Plant 3 Plant 4
Phase 1 -1.504 1.410 -0.011 -10.219
Phase 2 -3.163 -3.249 -6.667 -22.075
TOTAL -2.497 -1.524 -2.673 -16.108
EAF Plant 5 Plant 6 Plant 7 Plant 8
Phase 1 -0.054 -1.241 0.080 -0.660
Phase 2 -0.455 -2.399 -0.506 -0.146
TOTAL -0.305 -1.965 -0.286 -0.339
This table shows that there were no direct costs from ETS compliance in Phases 1 and 2
for the plants in the sample. Comparing Table 23 to the previous one, Table 22, the
variance between the plants in the sample is significantly smaller once we account for
differences in production levels between the plants. There is however one clear outlier,
plant 4. As mentioned above, this installation saw a large downscaling of production
during Phase 2, and was also oversupplied during Phase 1.
Indirect Costs
As mentioned above, indirect costs are caused by utilities passing their ETS related costs
on through increased electricity rates.
Table 24: Indirect cost per ton of steel (€/tonne), using maximum regional carbon
intensity
BOF Plant 1 Plant 2 Plant 3 Plant 4
Phase 1 0.396 0.396 0.231 0.363
Phase 2 0.417 0.417 0.306 0.381
TOTAL 0.409 0.409 0.261 0.374
EAF Plant 5 Plant 6 Plant 7 Plant 8
Phase 1 4.036 3.521 3.756 6.342
Phase 2 4.242 3.701 3.947 6.666
TOTAL 4.165 3.633 3.876 6.544

Page 141 of 259
Table 25: Indirect cost per ton of steel (€/tonne), using average national carbon intensity
BOF Plant 1 Plant 2 Plant 3 Plant 4
Phase 1 0.045 0.298 0.179 0.446
Phase 2 0.045 0.329 0.229 0.455
TOTAL 0.045 0.317 0.199 0.451
EAF Plant 5 Plant 6 Plant 7 Plant 8
Phase 1 2.893 2.799 2.489 3.660
Phase 2 2.636 1.901 1.979 3.310
TOTAL 2.732 2.238 2.170 3.441
During the remainder of this chapter, maximum regional carbon intensity is
consistently used. These figures show a fundamental difference in cost structures
between the two technologies. The indirect costs for BOF plants (which are less electro-
intensive and rely on utilities for 20% of their electricity needs) are relatively low, with
figures between 0.23 and 0.42 Euros per tonne.
EAF installations use electricity as their primary energy input and indirect costs have a
far greater impact on their operations. The additional cost per tonne of steel is between
3.5 and nearly 7 Euros.
It must be noted that there is no great variability between the costs in the two phases,
due to proxies being used for total production and electricity intensity of production for
nearly all plants and periods. As mentioned above, plants 1, 2 and 4 did provide this
information for 2010 to 2012.
As mentioned above, a pass-on rate of one is assumed for all installations, even though
pass-on rates may vary significantly between member states. This conservative
assumption could result in an overestimation of the actual indirect costs.
Administrative Costs
Table 26: Administrative cost per tonne of steel (€/tonne)
Plant 1-4
BOF
Plant 5-8
EAF
Total 0.13 0.10
Administrative costs, as estimated by Eurofer, are not significant per tonne, but could
become a significant amount depending on the total production.

Page 142 of 259
Total Costs
Table 27: Total costs of the EU ETS Scheme (€/tonne)
Plant 1 BOF
Plant 2 BOF
Plant 3 BOF
Plant 4 BOF
Plant 5 EAF
Plant 6 EAF
Plant 7 EAF
Plant 8 EAF
Phase 1
Direct costs
-1.504 1.410 -0.011 -10.219 -0.054 -1.241 0.080 -0.660
Indirect costs
0.396 0.396 0.231 0.363 4.036 3.521 3.756 6.342
Admin costs
0.130 0.130 0.130 0.130 0.100 0.100 0.100 0.100
TOTAL COSTS
-0.977 1.937 0.350 -9.727 4.082 2.380 3.936 5.782
Phase 2
Direct costs
-3.163 -3.249 -6.667 -22.075 -0.455 -2.399 -0.506 -0.146
Indirect costs
0.417 0.417 0.306 0.381 4.242 3.701 3.947 6.666
Admin costs
0.130 0.130 0.130 0.130 0.100 0.100 0.100 0.100
TOTAL COSTS
-2.616 -2.702 -6.231 -21.564 3.886 1.401 3.541 6.620
Phase 1 and 2
Direct costs
-2.497 -1.524 -2.673 -16.108 -0.305 -1.965 -0.286 -0.339
Indirect costs
0.409 0.409 0.261 0.374 4.165 3.633 3.876 6.544
Admin costs
0.130 0.130 0.130 0.130 0.100 0.100 0.100 0.100
TOTAL COSTS
-1.958 -0.985 -2.283 -15.603 3.960 1.768 3.689 6.306
Page 143 out of 259
Table 27, on the previous page, shows the impact of the EU ETS per tonne of steel. Note
that ‗Phase 1 and 2‘ results represent a weighted average on the basis of production.
Four observations can be drawn from the table above:
1) There is a significant difference in costs between Phases 1 and 2. The data indicates
that the direct costs decreased from Phase 1 to Phase 2 for 7 out of 8 plants in the
sample. However, that can probably be attributed, at least in part, to the low EUA
price of 0.74€/Ton in 2007. This drove down substantially the average costs for Phase
1.
2) The choice of technology plays a dominant role. Indirect costs were high enough for
EAF plants to more than compensate for their over-allocation of EUAs. For all four
EAF plants in our sample, the high indirect costs wiped out the surplus of EUAs from
allocation. Indirect costs do present a significant burden for EAF plants.
3) On the other hand, BOF plants are not likely to have faced ETS related costs during
these two Phases. The accumulated surplus of allocations, together with lower
indirect cost due to using coke as primary energy input, led to an estimated negative
cost of EU ETS per tonne of product. While there is no data to verify this, it is likely
that the economic downturn played an important role.
Large differences exist between plants within the same technology. For instance, the over-
allocation Plant 4 received were slightly more than half that plant‘s emissions, compared
with 6-9% for the other three BOF plants. Among the EAF plants, plant 8 incurred
significantly higher indirect costs due to both lower electricity efficiency of production and
higher levels of carbon intensity of electricity used.
Phase 3
In Phase 3, auctioning plays a stronger role with more than 40% of all allowances being
auctioned. There are three different treatments:
- The power sector will essentially need to buy all its EUAs via auctions, increasing
their directs costs;
- The industrial sectors will start bearing direct costs. They will still receive free
allocation on their products benchmarks and 80% of its allowances will be free in
2013. However, that percentage will decrease to 30% in 2020; Product benchmarks
have been established, at the level of the carbon-intensity of production of the 10%
best performers. Installations that meet the benchmark receive 100% of the
benchmark-based free allowances,98 and are rewarded for their carbon-efficiency.
98 Which, as explained above, discounts the energy content of waste gases for the energy content of natural
gas.

Page 144 out of 259
Less-than-best performers receive a lower amount of free allocations and are thereby
incentivized to catch up to their best-performing peers.
- Industrial installation, in sectors deemed exposed to significant risk of carbon
leakage, receive a higher share of free allowances. In Phase 3 they receive 100% of
benchmarked allocations compared to 80% for the non-leakage exposed ones. The
risk of leakage is determined by the increase in productions costs caused by the ETS
and the trade intensity of the sector with countries outside the EU. This means that
industries facing both higher costs due to the EU ETS and international competition
are compensated for their loss of competitiveness.
Each of these three cases has implications for the steel industry. This sector not only faces
increased indirect costs due to higher direct costs for utilities, but also a drop in free
allowances for many installations. Only those that reach the benchmark for carbon-
efficiency will receive all their allocations for free. The others will need to supplement with
EUAs banked from Phase 2 or EUAs bought at auctions or in secondary markets, resulting
in higher direct costs.
Two measures, however imperfect, are in place to compensate energy intensive industries
for indirect costs. First, as mentioned above, free allocations are made available for sectors
that comply with the conditions for ‗significant risk for carbon leakage‘. As of now, this
―Leakage List‖ includes the ‗manufacturing of basic iron and steel‘. However, the outcome
of the review due in 2014 will decide the composition of the Leakage List going forward.
Secondly, member states can use state aid to compensate energy-intensive industries,
though state-aid provisions and guidelines need to be observed in this case.99
In addition, two other issues are worth mentioning:
- The EU ETS scheme itself is under review. The current discussion on a structural
reform to strengthen the scheme could still include changes that may affect the
treatment of industries, such as steel
- Around the globe, various cap-and-trade systems are emerging. EU installations will
no longer be the only ones facing ETS costs and competitive disadvantages. The
Californian scheme is up and running, several Chinese pilot projects will kick-off this
year and Australia‘s carbon pricing mechanism is in operation.
Though compensation mechanisms are discussed in other sections of the study, a brief
discussion of the measures in Australia and California follows:
The EU ETS has two mechanisms for compensating industries for loss of competitiveness:
the leakage list discussed above and the possibility for member states to financially
compensate their industries for indirect CO2 costs.
99 See Section 8.1.2.

Page 145 out of 259
The Californian scheme includes several compensation measures:
- Energy-intensive industries can opt to have the allocation/cap determined on the
basis of their energy consumption, instead of their production output;
- Sectors are labelled as low, medium or high risk of leakage and receive 30 – 100% of
their allowances for free, depending on how they are categorized;
- The proceeds of certain auctions of emission permits by private utilities are
earmarked to compensate the customers that face higher electricity rates.
Compensation under the Australian pricing mechanism focuses on ‗emissions-intensive
trade-exposed‘ activities, granting them free carbon permits and other assistance, based on
their total emissions and indirect costs. Certain sectors also receive public investment and
research grants to aid them in their transition to a low-carbon economy.
Box 1 A Case Study for Phase 3
One plant was selected and a number of scenarios were run to try and understand the
impact of P3 on the European steel industry. A number of assumptions were necessary in
due to lack of complete data series:
- Constant electricity intensity of steel production for 2012-2020
- Constant carbon intensity of electricity generation for 2012-2020
- Constant 100% pass-on rate for indirect costs
These three assumptions result in an indirect cost that depends only on the price of EUAs.
- Three price levels for EUAs were used: 10, 15 and 30 Euros per tonne of CO2.
- Production and emission forecasts for this particular plant were provided by the
operators and cannot be externally validated.
The operator also forwarded estimates for future free allocation, which is a function of
production levels between 2005 and 2008. These figures have not, as yet, been published
by the Commission.
- Carbon intensity of steel production (tonne of CO2/tonne of steel) for 2013-2020 was
assumed to stay unchanged and equal to the average carbon intensity in Phase 2.
- Two levels of production were used for the simulations.
1. The level of production that was used in the benchmarking exercise, which
translates into about a 94% capacity.
2. A slightly lower production level (at 88% of capacity), provided by the operators as
average yearly output for 2013-2020.
Page 146 out of 259
- Administrative costs were kept constant at 0.13 Euros per tonne of steel.
- The steel sector is assumed to stay on the leakage list
Due to benchmarking, only the most carbon efficient plants receive enough allowances to
cover their emissions. For this plant, producing at 94% capacity (benchmark level), leads
to free allocation of 80% of necessary EUAs, the additional 20% needs to be bought.
It must be also recognized that the costs were calculated as average cost per ton of steel but
that the marginal impact for steel production will play a significant role in the decision to
add new capacity or expand production. In this case the marginal costs would represent
the price of EUAs multiplied by the carbon intensity of the marginal tonne of steel.
The scenarios indicate that cost of Phase 3 of ETS varies significantly based on different
assumptions. At the bottom end of the scale, at a price of 10 Euros per EUA and low
production levels, the ETS cost is estimated at 4.16 Euros per tonne of steel. If the price of
EUAs would increase to 30 Euros, everything else is kept constant; the cost would rise to
12.21 Euros per tonne of steel. The highest potential ETS cost of 15.78 Euros per tonne
steel assumes both a carbon price of 30 Euros per tonne and high production levels.
However, these scenarios are based on a significant number of assumptions that need to be
taken into account when relying on them for making any decisions. Also, the free banked
allocation from P2, whatever that may be, was not accounted for, and it this could also be a
significant factor in understanding the impact of ETS on the steel industry in P3.
All in all, a forecast of the impact of EU ETS in P3 and beyond, including the very
important marginal cost of a tonne of steel, remains based on very imprecise and in some
cases extrapolated data which we cannot verify and in which we do not have a high level of
confidence.
As per our mandate, the costs associated with the EU ETS in Phases 1 and 2 have been
described and quantified. All sites in the sample experienced over-allocations, but EAF
installations faced sufficiently high indirect costs to wipe out the potential benefits of their
surpluses, discounting any compensation measures in place.
Plant specific characteristics, for example energy efficiency or historic production, and
national circumstances (such as the electricity production mix and NAPs) seem to have a
large impact on EU ETS-related costs. National compensation schemes were not taken into
account in this study, as it was not part of the mandate.
Phase 3 will be very different. The change in allocation method will result in direct costs for
energy intensive industries. However, as things stand currently the market is expected to
be long to 2020.100
100 Commission Report on the European Carbon Market, supra note 87.

Page 147 out of 259
One thing that can be said is that the results for P1 and P2 cannot be assumed to be a good
representation for the impact of ETS on the steel industry in P3. The ETS has changed in
2012, but it is also expected that it will further change leading to 2020.

Page 148 out of 259
8 Competition Policy
As stated in Section 3 above, this report addresses the cumulative cost of EU legislation on
the steel sector. Competition policy is one of the eight policy areas in scope of the report.
However, strictly speaking, competition policy creates no, or very little, regulatory costs for
steel makers. Rather, it is one of the factors which shape the competitive environment in
which the European steel industry operates. This section is not to assess EU competition
policy as such, which is by nature a horizontal policy, nor the purposes it serves or the
benefits it delivers. Nor should any part of this section be interpreted as an assessment of
e.g. the state aid regime or the rules on abuse of dominant position. The focus of the report
is sectoral, and hence the consultants only discuss the impacts of part of competition law
and policies on the steel industry.
This section proceeds as follows. Section 8.1 discusses the state aid regime with regards to
steel makers; Section 8.2 discusses antitrust law and policies. A general description of
competition policies and their application on the steel industry is provided; then a
qualitative assessment of any barriers to meeting the simplification and smart regulation
objectives and of the coherence of the legislation is carried out.
8.1 State aid and the steel industry
8.1.1 The regime of state aid in the EU
The legal regime of state aid in the EU aims at avoiding distortions of competition and
trade among member states, due to direct or indirect government interventions, thus
ensuring a level playing field among EU market players. The basic principles are laid down
in art. 107 TFEU. The first paragraph of this article provides a definition of state aid
incompatible with the EU internal market. In particular, aid measures granted by member
states which are able to distort competition and trade in the EU by favouring certain
undertakings or the production of certain goods are generally prohibited. The second
paragraph provides de jure derogations to the general principle of incompatibility, thus
allowing i) aid granted to consumers and having a social character; ii) aid aimed at
restoring damage caused by natural disasters; and iii) aid granted to the economy of
certain areas of the Federal Republic of Germany affected by the division of Germany, in so
far as such aid is required in order to compensate for the economic disadvantages caused
by this division. Finally, the third paragraph introduces cases of discretionary derogation,
when the aid purpose consists in i) fostering the economic development of relatively poor
areas; ii) enabling the execution of an important project of common European interest; iii)
facilitating the development of certain economic activities; or iv) promoting culture and
heritage. Based on art. 108 TFEU, to ensure that the general prohibition is respected and
exemptions are applied equally across the EU, the Commission is responsible for
monitoring the national state aid systems existing, and is entitled to ask member states to
abolish or revise aid measures which are deemed not to be compatible with the good

Page 149 out of 259
functioning of the internal market. The member states have to inform the Commission of
any plans to grant new aid or modify existing one, thus rendering the monitoring activity
more reliable.
State aid which is not targeted at proven market failure distorts the markets and there is a
little guarantee that it will improve the industry's capability to compete worldwide on its
own merits. This is why state aid policy looks at the design of the aid in order to prevent
overcompensation, not to hamper incentives, and to minimise distortions of competition.
Procedural rules are laid down in Council Regulation (EC) No 659/1999 - implemented by
Commission Regulation (EC) No 794/2004 - which sets the obligations of member states
to notify aid measures and to provide annual reports, as well as the powers of the
Commission to carry out investigations and make decisions.
While state interventions conferring an advantage to selected recipients are to undergo an
assessment by the Commission, general measures, i.e. not selective and applying to all
companies regardless of size, location, and sector, are not considered state aid stricto
sensu. Specific aid measures can be implemented only after the approval of the
Commission, which is also entitled to recover unlawful aid. All the interested parties have
the right to comment on Commission decisions; and to submit complaints reporting any
aid allegedly incompatible with the TFEU or any misuse of aid. With small exceptions (e.g.
for agricultural products), DG Competition is responsible to perform state aid control on
most of economic sectors.
Council Regulation (EC) No 994/1998 enables the Commission to adopt both group and de
minimis exemptions by means of a regulation. General block exemptions can apply to aid
favouring small and medium-sized enterprises (SMEs), research and development (R&D)
activities, environmental protection, employment and training, or complying with national
maps for the granting of regional aid. Commission Regulation (EC) No 800/2008 (the so-
called General Block Exemption Regulation or GBER) provides automatic approval
(without notification) under the conditions therein specified for a wide range of aid
measures (26 categories, including i.a. aid to SMEs, R&D aid to SMEs, aid for employment,
training aid, regional aid, environmental aid, innovation aid, R&D aid for large companies,
aid in the form of risk capital, and aid for enterprises newly created by female
entrepreneurs). De minimis exemptions are regulated by Commission Regulation (EC) No
1998/2006 which exempts aid measures not exceeding € 200,000 over three fiscal years
and loan guarantees for debt not exceeding € 1.5 million. To avoid abuses, this kind of
exemption cannot be applied to ―non-transparent‖ aid, i.e. when the total budget cannot be
calculated accurately in advance; or to aid granted to firms at risk of failure.
Based on art. 107(3), several horizontal non-binding guidelines are set to define the
Commission position towards certain categories of aid. Regional aid measures, aiming at
promoting the economic development of certain disadvantaged areas within the EU, are
currently covered by Guidelines on national regional aid for 2007-2013 (2006/C 54/08).
The Community framework for state aid for R&D and innovation (2006/C 323/01) governs

Page 150 out of 259
aid direct to strengthen the scientific and technological base of the EU industry. Horizontal
environmental aid measures are covered by Community guidelines on state aid for
environmental protection (2008/C 82/01) and by Guidelines on certain state aid measures
in the context of the greenhouse gas emission allowance trading scheme post-2012
(2012/C 158/04). Community guidelines on state aid for rescuing - i.e. providing
temporary and reversible assistance to firms that are working out a restructuring or
liquidation plan - and restructuring - i.e. providing assistance to firms implementing a
restructuring or liquidation plan - firms in difficulty (2004/C 244/02)101 are another
horizontal tool set on the basis of art. 107(3). Finally, also risk capital investment in SMEs
which may have insufficient access to capital markets, in particular at their earlier growth
stages, is governed by two ad hoc communications of the Commission (2006/C 194/02,
amended by 2010/C 329/05).
8.1.2 State aid rules for the steel industry
Historical background on the ECSC Treaty
Until 23 July 2002, the steel industry was governed by the Treaty establishing the
European Coal and Steel Community (ECSC). As a general provision, the ECSC prohibited
all subsidies or state assistance as incompatible with the common market for coal and steel
(art. 4). Nonetheless, the Commission Decision No 3855/91/ECSC authorized particular
categories of aid measures, such as R&D aid, environmental protection aid, social aid to
encourage closure of plants, and some exemptions regarding regional investment aid.
In compliance with the ECSC Treaty, the Commission Decision No 2496/96/ECSC (the
last Steel Aid Code)102 established new Community rules for direct and indirect state aid to
the steel industry, to be applied until the expiry of this Treaty. The decision confirmed the
possibility to grant R&D aid as well as aid for environmental protection, consistently with
provisions applied by the Commission in other industries not covered by the ECSC Treaty.
Furthermore, very detailed rules were set with regard to aid for closures, aiming at
reducing overcapacity in the steel industry (based on a lesson learned from the crisis
affecting the steel industry in the 80s). Any plans to grant or revise aid or to transfer state
resources to steel industry were required to be notified to the Commission, which was then
entitled to check the compatibility with the functioning of the internal market, thus
rejecting and recovering unlawful aid measures. It is worth stressing that, despite the state
aid rules, the ECSC was entitled to directly grant loans as well as to guarantee loans
contracted by companies with third parties (art. 54 ECSC Treaty).
101 The application of these guidelines has been extended by Communications 2009/C 156/02 and
2012/C 296/02 until new rules will be enacted following the ongoing discussions on the EU state aid
regime modernization.
102 With the first (1981) and the second (1982) Steel Aid Code, the Commission governed state aid to the
steel industry, by authorizing subsidies on the condition that production capacity would be reduced (CPS,
2011).

Page 151 out of 259
State aid rules after the expiry of the ECSC Treaty
The ECSC Treaty expired on 23 July 2002; from then on, sectors previously covered by
that Treaty were subject to the provisions governing the EC – and the EU (TFEU) - Treaty
and to all the procedural rules and other secondary legislation. As explained by the
Communication from the Commission concerning certain aspects of the treatment of
competition cases resulting from the expiry of the ECSC Treaty (2002/C 152/03), state aid
control in the steel industry did not undergo significant changes. In a nutshell, regional
and Rescue and Restructuring (R&R) aid measures are forbidden, while environmental,
R&D, de minimis, training, and employment aid measures are permitted.
Unlike art. 4 ECSC Treaty, art. 107 TFEU requires intra-EU cross-border trade to be
affected for the aid to be unlawful, but this requirement is very likely to be fulfilled in the
steel industry due to the intense intra-EU trade.103 Furthermore, aid granted to the
industry under schemes authorised by the Commission are not subject anymore to the
prior notification requirement established by the Steel Aid Code.
State aid prohibited
As from 24 July 2002 and up to 31 December 2009, the multi-sectorial framework on
regional aid for large investment projects (2002/C 70/04) provided a general prohibition
for regional aid to the steel industry (including large individual aid grants made to SMEs).
This prohibition has been confirmed by Guidelines on national regional aid for 2007-2013.
The aim is to avoid investment aid in an industry considered to be in overcapacity or in
structural decline, thus preventing subsidy races. In addition, until 31 December 2009,
also R&R aid for firms in difficulty in the steel sector were deemed incompatible with the
internal market (2002/C 70/05), thus providing strong incentives to steel makers to cut
costs and increase their competitiveness.104 Accordingly, Guidelines on state aid for
rescuing and restructuring firms in difficulty (2004/C 244/02) – whose application period
has been recently extended105 - do not apply to the steel sector, so that steel makers are
currently not entitled to receive R&R aid. The rationale behind this exclusion is that, in
view of the past experience and taking into account the features of the steel industry, R&R
aid is considered to have the most distortive effects on competition in the sector.
Indeed, the relatively high amount of aid granted to steel makers during 1980s and 1990s
in Western Europe and during the early 2000s in new member states106 led to today‘s
103 Communication from the Commission concerning certain aspects of the treatment of competition cases
resulting from the expiry of the ECSC Treaty (2002/C 152/03), section 2.3.
104 Communication from the Commission, R&R aid and closure aid for the steel sector (2002/C 70/05),
chapter 1.
105 See Note 101.
106 State aid for restructuring the steel industry in the new member states were granted on the basis of
several European Agreements and of special protocols to the Accession Treaties. These aid measures
aimed at achieving long-term viability - under normal market condition - of steel companies in new
member states, provided that aid intensity were as limited as possible, that the restructuring programme

Page 152 out of 259
restrictions on regional investment and R&R aid. However, this situation is now confined
to the past, and, in the case of Western European producers, almost twenty years have
elapsed from the end of the restructuring process. In these years, the steel industry faced
comparable competitive conditions to any other manufacturing sectors. Yet, the
prohibition of regional and R&R aid persists.
Over the last decades, the progressive downsizing of state aid to steel makers was rooted in
the acknowledgment that the viability of the industry required a reduction of
overcapacity107 (Lienemeyer, 2005). Nevertheless, in 2010 the total capacity installed in
the EU was equal to 242 million tonnes of crude steel,108 while in 2007 the production
reached a peak of 210 million tonnes,109 thus leading to a capacity utilisation rate of about
87%. Considering that a capacity utilization of about 85% is deemed close to full capacity
utilization (Ecorys, 2008), in 2007 overcapacity was not an issue in the EU. This statement
is further supported by the evidence that the EU demand for finished steel product reached
a peak of 201 million tonnes in that year,110 thus being able to absorb 83% of the installed
European capacity. Furthermore, it is worth stressing that between 2010 and 2013, about
20 million tonnes of production capacity have been permanently cut, and additional 14
million tonnes have been temporarily shut down.111
State aid permitted
Closure aid for the steel industry was permitted until 31 December 2009 in accordance
with the Commission Communication (2002/C 70/05), provided that production capacity
was cut. After that, steel makers can no longer access to this aid.
Under the existing state aid regime, the steel sector – like any other sector - may benefit
from state support measures that contribute to the EU 2020 objectives, e.g. R&D and
innovation, training and employment aid, SME aid, aid to increase environmental
protection. For instance, the steel sector has benefited in the past from exemptions from
national environmental and energy taxes, from state aid for energy efficiency measures,
and from aid to go beyond EU environmental standards.
In particular, based on rules established by Community guidelines on state aid for
environmental protection (2008/C 82/01), steel makers have the same right granted to all
sectors governed by the TFEU as for access to aid measures aiming at promoting
were as short as possible – usually within a 5-year grace period, subject to prolongation-, and that
inefficient production capacity were reduced. All restructuring programmes, which have led to successful
outcomes, have expired (Lienemeyer, 2005).
107 The overcapacity issue was officially acknowledged for the first time in the so-called Davignon plan in
1977.
108 Steel Business Briefing &EuroStrategy Consultants, 2010.
109 World Steel, 2012.
110 World Steel, 2012.
111 Data provided by industriAll – European Trade Union (May 2013).

Page 153 out of 259
environmental protection - without adversely affecting trade between member states to an
extent contrary to the EU common interest – which comprise among others:
- Aid for undertakings which go beyond community standards or which increase the
level of environmental protection in the absence of community standards;
- Aid for early adaptation to future community standards;
- Aid for energy saving;
- Aid for renewable energy sources;
- Aid for cogeneration;
- Aid for the relocation of undertakings;
- Aid involved in tradable permit schemes;
- Aid in the form of reductions of or exemptions from environmental taxes.
This approach fits well with the objectives of the EU state aid policy aiming at less but
better targeted aid measures. In particular, the possibility to grant relatively high amounts
of aid for research, development and innovation activities in the steel industry should
contribute to the increase of competitiveness of the EU economy as a whole. Furthermore,
the possibility to grant environmental aid allows balancing the requirements of
environmental protection with competition rules, thus promoting sustainable
development. Training aid can help steel makers to introduce their labour force to
innovative production techniques.
State aid to compensate for increases in electricity price due to ETS
The ETS Directive (Directive 2003/87/EC as subsequently amended)112 allows for special
and temporary aid measures: i) aid to compensate for increases in electricity prices
resulting from the inclusion of the costs of ETS allowances; ii) investment aid to highly
efficient power plants; iii) optional transitional free allowances in the electricity sector in
some member states; and iv) the exclusion of certain small installations from the EU ETS.
Detailed rules on state aid permissible under the ETS directive were laid down in the
Commission Guidelines on certain state aid measures in the context of the greenhouse gas
emission allowance trading scheme post 2012 (2012/C 158/04), generally applicable to
costs incurred by undertakings as from 1st of January 2013.
The first section of the Commission Guidelines, governing aid to companies in sectors
deemed to be exposed to a significant risk of carbon leakage due to EU ETS allowance costs
passed on in electricity prices, the so-called ―indirect ETS costs‖, applies i.a. to the steel
112 Directive 2003/87/EC has been amended by Directive 2004/101/EC, Directive 2008/101/EC, and
Directive 2009/29/EC, the so-called ―ETS third phase directive‖, through which the provisions on special
and temporary aid were added.

Page 154 out of 259
industry.113 The Commission aims at achieving three objectives: i) minimising the risk of
carbon leakage; ii) preserving the EU ETS price signal to spur cost-efficient
decarbonisation; iii) minimising competition distortions in the internal market. As a result,
aid measures can be granted, but do not fully compensate for the costs of ETS allowances
in electricity prices, being based on efficient benchmarks,114 and as the admissible amounts
decline over time.115 These two features are deemed pivotal to avoid aid dependency and
preserving both long-term incentives to internalize environmental externalities and short-
term incentives to switch to less polluting production technologies.
Despite the Commission guidelines are crafted to address the risk of carbon leakage and to
minimise distortions in the internal market, state aid to compensate ―indirect ETS costs‖
may have unintended consequences in terms of an even playing field. In the context of the
current sovereign-debt crisis (and of the related austerity measures), national finances may
have no room for compensation, thereby putting at risk the objective of fighting carbon
leakage and, based on which countries will be able to compensate for those costs,
distorting competition among EU producers located in different member states. Indeed,
electricity is a crucial input for steel makers and, in particular, for those adopting the EAF
technology; hence, these producers will be harmed to a larger extent by EU ETS allowance
costs passed on in electricity prices. In 2011, more than 45% of the total EU crude steel
production by EAFs was concentrated in Italy (25%), Spain (15%), Greece (3%), and
Portugal (2%),116 which are among the member states most affected by the crisis and by the
budget tightening.117 In case these countries were not able to fund state aid measures to
compensate indirect costs of ETS, their production of steel in EAFs would experience a
competitive disadvantage vis-à-vis other EU and third country steel makers.118 This is even
a more serious issue if it is considered that EAF outputs are usually of a lower quality (due
to tramp metals contained in scrap), which makes it the industry segment most affected by
price competition dynamics originating in low cost third countries.
8.1.3 State aid granted to the steel industry between 2002 and 2012 in the EU
In the EU, the majority of national state aid is granted under framework schemes, i.e.
either under schemes approved by the Commission or under schemes exempted from the
notification obligation in compliance with GBER. In 2011, state aid granted under the
113 For example, to manufacturers of basic iron and steel and of ferro-alloys, including seamless steel pipes
114 Special formulas to calculate the annual aid amount are provided in sub-section 3.1 (2012/C 158/04).
115 ―The aid intensity must not exceed 85% of the eligible costs incurred in 2013, 2014 and 2015, 80 % of the
eligible costs incurred in 2016, 2017 and 2018 and 75 % of the eligible costs incurred in 2019 and 2020‖
(2012/C 158/04, sub-section 3.1).
116 See Figure 30 above.
117 Sovereign-debt rating by Standard & Poor: Greece (B-); Italy (BBB+); Portugal (BB); Spain (BBB-) (data
available at http://www.standardandpoors.com/ratings/sovereigns/ratings-list/en/us/?sub Sector
Code=39, last accessed on 22 May 2013).
118 Indirect ETS costs amount to about 3 €/tonne of wire rod, that is about 20% of the total cumulative costs
estimated in this study.

Page 155 out of 259
block exemption and through notified schemes represented around 88% of total aid
granted.119 In general, framework schemes target aid to broad horizontal EU objectives,
e.g. R&D, innovation, transition to a low carbon economy, environmental protection,
employment, training, regional development.
According to the State Aid Scoreboard, between 2002 and 2011, in the EU non-crisis state
aid measures (excluding aid to railways) reached about € 753 bln (see Table 28). In
particular, € 411 bln (around 55% of the total) were channelled towards the manufacturing
sector. Over the same period, state aid granted to the steel industry equalled € 1 bln, i.e.
0.7% of the total aid earmarked for specific sectors (€ 141 bln).
Table 28 State aid granted in the EU between 2002 and 2011 (€ mln at constant 2011 prices)
2002 2003 2004 2005 2006 2007 2008 2009 2010 2011
Total State Aid 89,365 79,196 72,045 67,458 92,627 66,719 73,918 75,832 71,326 64,295
Aid to manufacturing sectors
27,793 32,674 39,978 40,427 45,653 40,940 49,294 49,905 47,642 36,926
State aid earmarked for specific sectors
32,121 28,503 17,778 11,319 10,057 8,296 9,530 9,367 8,734 5,473
State aid earmarked to the steel sector
88 107 95 149 156 208 145 112 15 17
Source: Authors‘ elaboration on Scoreboard - Data on State Aid Expenditure120 and on Report - State Aid
Scoreboard121.
119 Report from the Commission, State Aid Scoreboard - Report on State Aid Granted by the EU Member
States, COM(2012) 778 final.
120 Data for Total State Aid (2002-2011) are drawn from Scoreboard – Data on State aid Expenditure (Non-
crisis state aid by sector and objective, in million Euro -1992-2011-
http://ec.europa.eu/competition/state_aid/studies_reports/ws2_1.xls, last accessed 22 May 2013). Data
for aid to manufacturing sectors (2006-2011) are drawn from Scoreboard – Data on State aid Expenditure
(State aid by sector, in million Euro and as a percentage of total aid -2006-2011 -
http://ec.europa.eu/competition/state_aid/ studies_reports/ws2_10.xls, last accessed 22 May 2013).
Data for state aid earmarked for specific sectors are drawn from Scoreboard – Data on State aid
Expenditure (Sectoral aid by Member State, in million Euro - 1992 – 2011 -,
http://ec.europa.eu/competition/ state_aid/studies_reports/ws4_11.xls, last accessed on 22 May 2013).
121 Data for state aid earmarked for the steel sector (2002-2011) and aid to manufacturing sectors (2002-
2005) are based on: State Aid Scoreboard - spring 2003 update - COM(2003) 225 final; State Aid
Scoreboard - spring 2004 update - COM(2004) 256 final; State Aid Scoreboard- spring 2005 update -
COM(2005) 147 final; State Aid Scoreboard - autumn 2005 update - COM(2005) 624 final; State Aid
Scoreboard - autumn 2006 update - COM(2006) 761 final; State Aid Scoreboard - autumn 2007 update -
COM(2007) 791 final; State Aid Scoreboard - autumn 2008 update - COM(2008) 751 final; State Aid
Scoreboard - autumn 2009 update - Facts and figures on State aid in the EU Member States SEC(2009)
1638; State Aid Scoreboard - autumn 2010 update - Facts and figures on State aid in the Member States
SEC(2010) 1462 final; Commission Staff Working Paper - autumn 2011 update - SEC(2011) 1487 final;
Commission Staff Working Paper - autumn 2012 update - SEC(2012) 443 final.

Page 156 out of 259
Aid under scrutiny by the Commission
Based on the Commission online tool ―Search Competition Cases‖,122 it is possible to list
state aid cases under scrutiny by the Commission during the period 2002-2012. When
setting as search parameters i) state aid; ii) a decision date between 1 January 2002 and 31
December 2012; and iii) the NACE rev.2 code 24.1,123 37 cases are selected. After an in-
depth screening process, 4 of these cases have been discarded, as they concerned mining
facilities (which are not part of this study). Furthermore, an additional case - selected by
including NACE rev.2 codes 24.2, 24.3, and 24.52124 - has been included, as it concerns a
steel making facility. Therefore, over the period 2002-2012, 34 state aid measures
addressed to the steel and iron sector were registered by the Commission (see Table 29),
comprising 26 ad hoc cases (i.e. not granted on the basis of an already approved scheme),
five individual applications of an existing scheme, and three scheme applications.125
Focusing on the aid instrument, 16 cases provided companies with a direct grant, five with
a debt write-off, two with a soft loan, two with a guarantee, and two with a tax rate
reduction; the remaining seven resorted to a mix of instruments. While 19 cases were
notified, 22 required an investigation procedure to assess compatibility with the internal
market, leading to seven positive decisions – four of which only partial - and to nine
negative decisions (in eight cases, the recovery of the aid was mandated); the remaining
cases where closed before a formal decision was adopted (e.g. because of aid remittal).
Nineteen measures were finally granted, having as primary objective mainly
environmental protection (five out of 19) and restructuring of firms in difficulty (six out of
19) in new member states or in areas of the Federal Republic of Germany affected by the
division of Germany.
Table 29 List of state aid notified to/registered by the Commission over the period 2002-2012
# NACE Case
Number Member
State Last Decision
Date Title
1 C24.1 C10/2001 Italy 30/01/02 R&D aid to Lucchini SPA, ECSC steel
2 C24.1 C20/2001 Spain 30/01/02 R&D aids to several ECSC undertakings granted by the Basque government
3 C24.1 C30/2001 Germany 30/01/02 GothaerFahrzeugtechnik GmbH
4 24.1 NN131/200
0 Austria 12/03/02 Investment aid to BöhlerBlecheGmbh
5 C24.1
C19/2001 United
Kingdom 03/04/02 Climate change levy - ECSC steel
6 C24.1
C77/2001 Germany 05/06/02 CR77/01 - Aid in favour of EisengussTorgelowGmbh - EGT, Mecklenburg-
Vorpommern
7 C24.1
C12/2002 Italy 02/07/02 Acciaierie de Valbruna - Environment - ECSC steel
122 ―Search Competition Cases‖ by the European Commission is available online at:
http://ec.europa.eu/competition/elojade/isef/index.cfm?clear=1&policy_area_id=3 (last accessed on 25
April 2013).
123 NACE rev.2 24.1 - Manufacture of basic iron and steel and of ferro-alloys.
124 NACE rev.2 24.2 - Manufacture of tubes, pipes, hollow profiles and related fittings, of steel; 24.3 -
Manufacture of other products of first processing of steel; 24.52 - Casting of steel.
125 The Commission classifies five aid measures (C20/2001, C19/2001, C13/2001, N266/2006, SA.31349) as
schemes. Nevertheless, after an in-depth screening process, N266/2006 has been deemed an individual
application of an existing scheme and C13/2001 an ad hoc case.

Page 157 out of 259
8 C24.1
C9/2002 Italy 02/07/02 Duferdofin - Environment - ECSC steel
9 C24.1
C10/2002 Italy 17/07/02 ILVA - Environment - ECSC steel
10 C24.1
C27/2002 France 17/07/02 Aide à l'environnement en faveur de SOLLAC, acier CECA
11 C24.1
C8/2002 Italy 17/07/02 Acciaierie di Sicilia - Environment - ECSC steel
12 C24.1
NN13/2001 Germany 30/10/02 Investitionsbeihilfe der Firma Vallource und Mannesmann Tubes VUM
13 C24.1
N487/2002 Germany 13/11/02 NeueMaxhutteStahlwerke GmbH i.K. FreiwilligeSozialeLeistungen Bayern
14 C24.1
C8/2001 Italy 13/11/02 Aid to PertusolaSud S.P.A.
15 C24.1
C13/2001 Germany 01/10/03 CR13/01 - Aide en faveur de JahnkeStahlbau
16 C24.1
C25/2002 Belgium 15/10/03 Participationfinanciére de la RegionWallonnedans l'entreprise CARSID -
Acier CECA
17 C24.1
C31/2000 Germany 10/12/03 CR31/2000 - Aid to NeueHarzerWerke GmbH Blankenburg, Sachsen-
Anhalt
18 C24.1
C77/2003 Spain 30/06/04 Aid to Solmed (steel)
19 C24.1
N315/2004 Belgium 20/10/04 Participation à l'augmentation de capital d' O.C.A.S. NV
20 C24.1
C95/2001 Spain 20/10/04 CR95/01 - Siderurgica Anon
21 C24.1
N600/2004 Czech
Republic 02/03/05 Approval of capacity reductions for VPFM
22 C24.1
N186/2005 Poland 20/07/05 Mittal Steel Poland - change of IBP
23 C24.1
N274/2005 Poland 13/09/05 Rescue aid to HutaCynkuMiasteczkoSlaskie S.A.
24 C24.1
C20/2004 Poland 27/06/06 CR20/04 - Huta Czestochowa
25 C24.1
N266/2006 The
Netherlands 11/08/06 NijmeegscheIjzergieterij
26 C24.1
C45/2004 Czech
Republic 08/11/06 Restructuring aid to the steel producer TrineckeZelezarny
27 C24.1
C25/2000 Italy 16/07/08 Environmental aid to Lucchini
28 C24.1
N670/2009 Latvia 15/12/09 State guarantee in favour of JSC "LiepajasMetalurgs"
29 C24.1
N450/2009 Germany 09/03/10 Top Gas Recycling (TGR) Project - Aid to Arcelor Mittal Eisenhuttenstadt
GmbH
30 C24.52 N451/2009 Germany 14/04/10 Energy saving by strip casting technology for light steels of Salzgitter
Flachstahl GmbH
31 C24.1
C48/2007 Poland 06/07/10 Restructuring of the Polish tube sector
32 C24.1
C76/2003 Belgium 30/11/10 Reduction d'une dette TVA de la société UMICORE S.A.
33 C24.1
C37/2004 Finland 20/04/11 Alleged aid to Componenta
34 C24.1 - C24.42
SA.31349 United
Kingdom 04/04/12 Climate Change Levy reduction for metal recycling activities
Source: Authors‘ elaboration on ―Search Competition Cases‖ (data extracted on 25 April 2013).
For the sake of completeness, it is worth noticing that steel makers have also benefited of
non-sector specific state aid, such as that granted to energy intensive industries and to
pollutant production process emitting CO2 and NOx. Over the period 2002-2012,
according to the ―Search Competition Cases‖ engine, nine measures targeted on energy
intensive producers, five on NOx emitters, and 19 on CO2 emitters were under scrutiny by
the Commission. None of them was an ad hoc or individual application case direct to steel
makers, the majority being scheme applicable to all the relevant production processes.

Page 158 out of 259
8.2 Antitrust law and the steel sector
8.2.1 Antitrust law in the EU: agreements/concerted practices, abuse of dominant
positions, and merger control
Antitrust law in the EU is based on the provisions included in two articles of the TFEU, and
on the Merger Control Regulation:
- Art.101 TFEU covering agreements, concerted practices, and decisions by
associations of undertakings;
- Art.102 TFEU covering abuses of dominant position.
The enforcement of these articles is governed by Council regulation (EC) No 1/2003, which
entered into force on 1st May 2004. This regulation, inter alia, provides procedural rules
and defines powers of the Commission, of national courts, and of national competition
authorities, especially obliging national bodies to apply articles 101 and 102 whenever they
deal with cases which may affect trade between member states.
In addition, merger control in the EU is governed by Council regulation (EC) No 139/2004
which applies to mergers and acquisitions with a community dimension (based on
turnover thresholds) and aims at avoiding that concentrations between undertakings
hamper effective competition in the internal market or in a substantial part of it. Prior
notification of concentrations above the thresholds is required and the Commission is in
charge to assess the compatibility of the notified cases with the good functioning of the
common market. Concentrations below the thresholds are dealt with by national
competition authorities.
As explained before, since the expiry of the ECSC Treaty, the steel sector has been covered
by the rules included in the TFEU. Accordingly, as from 23 July 2002, EU steel makers are
subject to the same provisions on antitrust applied to all other undertakings and no special
rules exist for this industry. The transition from the previous to the current regime was
guided by the Communication from the Commission concerning certain aspects of the
treatment of competition cases resulting from the expiry of the ECSC Treaty (2002/C
152/03). Whereas under the ECSC Treaty national competition authorities and national
courts had no power on competition cases in the steel industry, they currently apply both
EU law and national competition law on this sector. Furthermore, steel makers are not
anymore obliged to notify price lists and conditions of sale to the Commission.
Nonetheless, authorisation for agreements/concerted practices granted under the ECSC
regime ceased with the expiry of the ECSC Treaty, thus the Commission is potentially
entitled to re-assess those agreements and practices.126 Moreover, while joint ventures
126 In the Communication 2002/C 152/03, the Commission informed undertakings not to intend to start
proceedings under art. 81 TEC (the new art. 101 TFEU) on agreements previously authorized, except for
factual or legal developments which affect their future implementation.
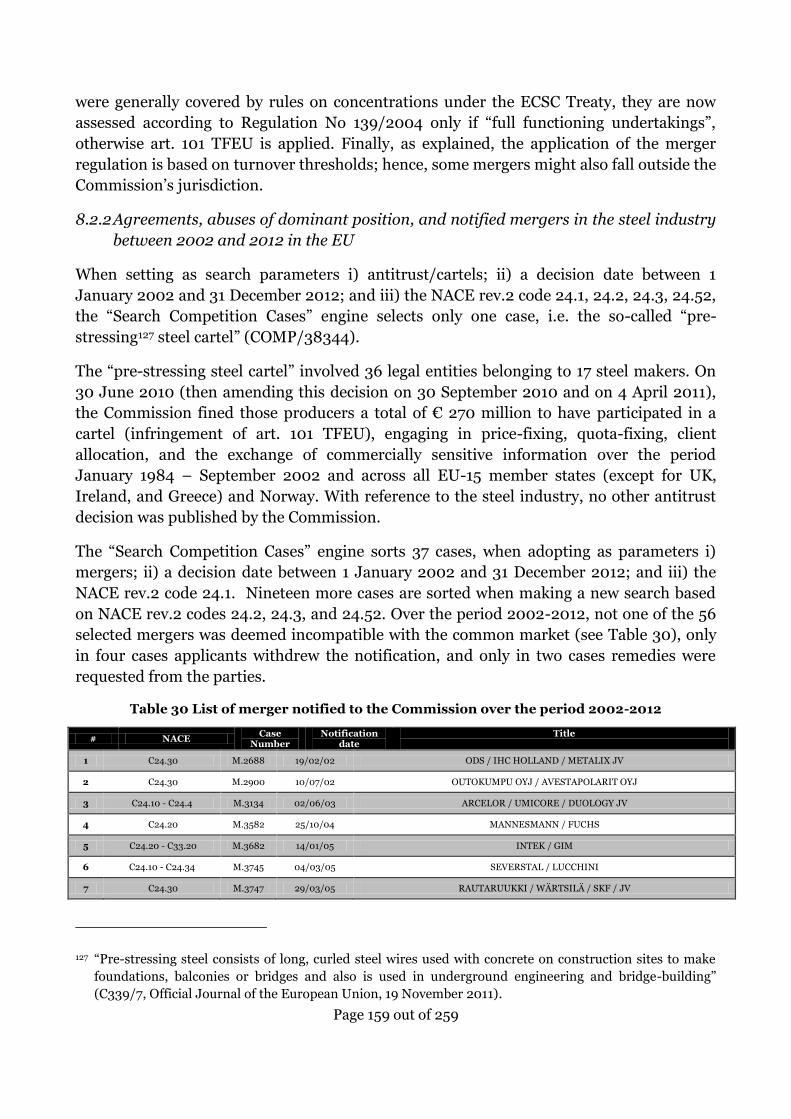
Page 159 out of 259
were generally covered by rules on concentrations under the ECSC Treaty, they are now
assessed according to Regulation No 139/2004 only if ―full functioning undertakings‖,
otherwise art. 101 TFEU is applied. Finally, as explained, the application of the merger
regulation is based on turnover thresholds; hence, some mergers might also fall outside the
Commission‘s jurisdiction.
8.2.2 Agreements, abuses of dominant position, and notified mergers in the steel industry
between 2002 and 2012 in the EU
When setting as search parameters i) antitrust/cartels; ii) a decision date between 1
January 2002 and 31 December 2012; and iii) the NACE rev.2 code 24.1, 24.2, 24.3, 24.52,
the ―Search Competition Cases‖ engine selects only one case, i.e. the so-called ―pre-
stressing127 steel cartel‖ (COMP/38344).
The ―pre-stressing steel cartel‖ involved 36 legal entities belonging to 17 steel makers. On
30 June 2010 (then amending this decision on 30 September 2010 and on 4 April 2011),
the Commission fined those producers a total of € 270 million to have participated in a
cartel (infringement of art. 101 TFEU), engaging in price-fixing, quota-fixing, client
allocation, and the exchange of commercially sensitive information over the period
January 1984 – September 2002 and across all EU-15 member states (except for UK,
Ireland, and Greece) and Norway. With reference to the steel industry, no other antitrust
decision was published by the Commission.
The ―Search Competition Cases‖ engine sorts 37 cases, when adopting as parameters i)
mergers; ii) a decision date between 1 January 2002 and 31 December 2012; and iii) the
NACE rev.2 code 24.1. Nineteen more cases are sorted when making a new search based
on NACE rev.2 codes 24.2, 24.3, and 24.52. Over the period 2002-2012, not one of the 56
selected mergers was deemed incompatible with the common market (see Table 30), only
in four cases applicants withdrew the notification, and only in two cases remedies were
requested from the parties.
Table 30 List of merger notified to the Commission over the period 2002-2012
# NACE Case
Number Notification
date Title
1 C24.30 M.2688 19/02/02 ODS / IHC HOLLAND / METALIX JV
2 C24.30 M.2900 10/07/02 OUTOKUMPU OYJ / AVESTAPOLARIT OYJ
3 C24.10 - C24.4 M.3134 02/06/03 ARCELOR / UMICORE / DUOLOGY JV
4 C24.20 M.3582 25/10/04 MANNESMANN / FUCHS
5 C24.20 - C33.20 M.3682 14/01/05 INTEK / GIM
6 C24.10 - C24.34 M.3745 04/03/05 SEVERSTAL / LUCCHINI
7 C24.30 M.3747 29/03/05 RAUTARUUKKI / WÄRTSILÄ / SKF / JV
127 ―Pre-stressing steel consists of long, curled steel wires used with concrete on construction sites to make
foundations, balconies or bridges and also is used in underground engineering and bridge-building‖
(C339/7, Official Journal of the European Union, 19 November 2011).

Page 160 out of 259
8 C24.10 M.3808 02/05/05 MITTAL / HUTA STALI CZESTOCHOWA
9 C24.30 M.3900 25/07/05 CVC / WAVIN
10 C24.10 M.3952 23/08/05 SYSTEM CAPITAL MANAGEMENT - METINVEST / LEMAN COMMODITIES
11 C24.10 M.4137 07/04/06 MITTAL / ARCELOR
12 C24.10 M.4231 16/05/06 ARCELOR / MITSUI / AMSA JV
13 C24.10 M.4211 24/05/06 SCHMOLZ + BICKENBACH / UGITECH
14 C24.10 M.4259 06/06/06 ARCELOR / SEVERSTAL
15 C24.10 M.4273 08/06/06 SUNGREBE / ARCELOR / SEVERSTAL
16 C24.10 M.4225 22/06/06 CELSA / FUNDIA
17 C24.20 M.4331 09/08/06 ARCELOR / BAMESA / BAMESA OTEL
18 C24.30 M.4291 14/08/06 VOESTALPINE / PROFILAFROID / SAP
19 C24.10 M.4382 01/09/06 TPG / ALERIS
20 C24.30 - C25.93 M.4384 04/10/06 HOMBERGH / DE PUNDERT / PIB / OVAKO
21 C24.10 M.4421 13/10/06 OJSC NOVOLIPETSK STEEL / DUFERCO / JV
22 C24.10 M.4408 20/11/06 TATA / CORUS
23 C24.10 M.4515 21/12/06 CSN / CORUS
24 C24.52 M.4524 23/01/07 NEMAK / HYDRO CASTINGS
25 C24.10 M.4499 20/02/07 HOLDING GONVARRI / ASSC / ASSC SLOVAKIA
26 C24.52 M.4500 28/02/07 NEMAK / TK ALUMINUM ―A‖
27 C24.20 M.4628 21/05/07 SALZGITTER / VALLOUREC
28 C24.30 M.4749 08/08/07 PSB / OVAKO
29 C24.52 M.4840 24/08/07 FIAT / TEKSID ALUMINIUM
30 B06 - C24.10 M.4890 16/10/07 ARCELOR / FERNGAS
31 C24.10 M.5000 03/12/07 METINVEST / TRAMETAL / SPARTAN
32 C24.10 M.4945 21/01/08 ARCELOR / OFZ
33 C24.52 M.4992 04/02/08 ARCELORMITTAL / GALVEX
34 C24.10 M.5072 04/03/08 AMSSC / BE GROUP / JV
35 C24.10 M.5101 01/04/08 OJSC NOVOLIPETSK STEEL / NOVEXCO / NOVEX TRADING
36 C24.10 M.5120 04/04/08 ARCELORMITTAL / GONVARRI / SSC BRAZIL
37 C24.10 M.5122 29/04/08 ARCELORMITTAL / BORUSAN
38 C24.10 M.5179 29/05/08 ERAMET / TINFOS
39 C24.10 M.5211 19/06/08 OUTOKUMPU / SOGEPAR
40 C24.10 M.5259 13/08/08 MITSUI / BAMESA CELIK / BAMI / JV
41 C24.10 M.5251 17/09/08 SYSTEM CAPITAL MANAGEMENT-ENERGEES / METINVEST
42 C24.30 M.5545 02/06/09 ARCELORMITTAL / NOBLE EUROPEAN HOLDING
43 C24.10 M.5582 31/07/09 GONVARRI / SEVERSTAL / JV
44 C24.10 M.5643 23/10/09 ARCELORMITTAL / MIGLANI / JV
45 C23.5 - C24.10 M.5771 14/01/10 CSN / CIMPOR
46 C24.10 M.5955 11/08/10 METINVEST BV / IISW
47 C24.20 - C24.30 M.5921 18/08/10 TRITON / OVAKO NON-WIRE BUSINESS
48 C19.1-C20.1-C24.10 M.6123 18/04/11 ARCELORMITTAL BREMEN / KOKEREI PROSPER / ARSOL AROMATICS
49 C24.10 M.6177 20/04/11 OJSC NOVOLIPETSK STEEL / STEEL INVEST & FINANCE
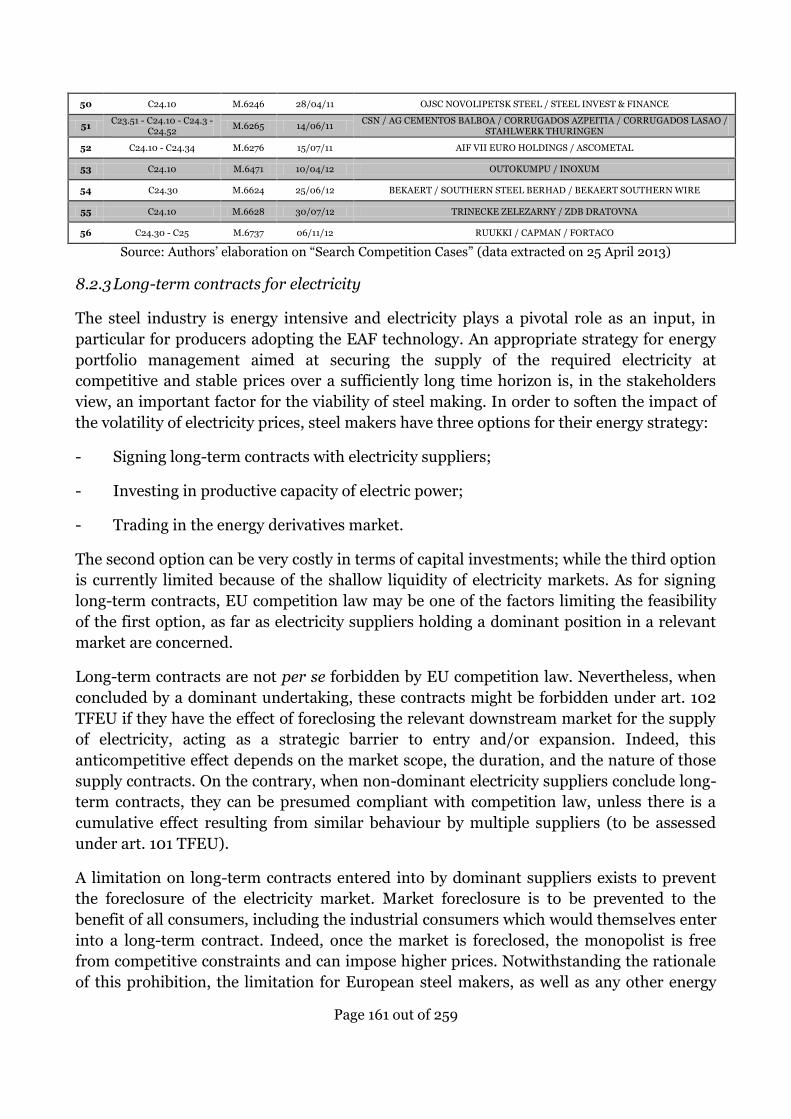
Page 161 out of 259
50 C24.10 M.6246 28/04/11 OJSC NOVOLIPETSK STEEL / STEEL INVEST & FINANCE
51 C23.51 - C24.10 - C24.3 -
C24.52 M.6265 14/06/11
CSN / AG CEMENTOS BALBOA / CORRUGADOS AZPEITIA / CORRUGADOS LASAO / STAHLWERK THURINGEN
52 C24.10 - C24.34 M.6276 15/07/11 AIF VII EURO HOLDINGS / ASCOMETAL
53 C24.10 M.6471 10/04/12 OUTOKUMPU / INOXUM
54 C24.30 M.6624 25/06/12 BEKAERT / SOUTHERN STEEL BERHAD / BEKAERT SOUTHERN WIRE
55 C24.10 M.6628 30/07/12 TRINECKE ZELEZARNY / ZDB DRATOVNA
56 C24.30 - C25 M.6737 06/11/12 RUUKKI / CAPMAN / FORTACO
Source: Authors‘ elaboration on ―Search Competition Cases‖ (data extracted on 25 April 2013)
8.2.3 Long-term contracts for electricity
The steel industry is energy intensive and electricity plays a pivotal role as an input, in
particular for producers adopting the EAF technology. An appropriate strategy for energy
portfolio management aimed at securing the supply of the required electricity at
competitive and stable prices over a sufficiently long time horizon is, in the stakeholders
view, an important factor for the viability of steel making. In order to soften the impact of
the volatility of electricity prices, steel makers have three options for their energy strategy:
- Signing long-term contracts with electricity suppliers;
- Investing in productive capacity of electric power;
- Trading in the energy derivatives market.
The second option can be very costly in terms of capital investments; while the third option
is currently limited because of the shallow liquidity of electricity markets. As for signing
long-term contracts, EU competition law may be one of the factors limiting the feasibility
of the first option, as far as electricity suppliers holding a dominant position in a relevant
market are concerned.
Long-term contracts are not per se forbidden by EU competition law. Nevertheless, when
concluded by a dominant undertaking, these contracts might be forbidden under art. 102
TFEU if they have the effect of foreclosing the relevant downstream market for the supply
of electricity, acting as a strategic barrier to entry and/or expansion. Indeed, this
anticompetitive effect depends on the market scope, the duration, and the nature of those
supply contracts. On the contrary, when non-dominant electricity suppliers conclude long-
term contracts, they can be presumed compliant with competition law, unless there is a
cumulative effect resulting from similar behaviour by multiple suppliers (to be assessed
under art. 101 TFEU).
A limitation on long-term contracts entered into by dominant suppliers exists to prevent
the foreclosure of the electricity market. Market foreclosure is to be prevented to the
benefit of all consumers, including the industrial consumers which would themselves enter
into a long-term contract. Indeed, once the market is foreclosed, the monopolist is free
from competitive constraints and can impose higher prices. Notwithstanding the rationale
of this prohibition, the limitation for European steel makers, as well as any other energy
Page 162 out of 259
intensive industries, to the freedom to enter into long-term contracts with certain clauses
and under certain market configurations is a competitive constraint, which is absent in
some other world regions. Acknowledged the rationale of this limitation, and according to
the methodology of this report, the analysis that follows addresses only the impacts of this
legal framework on steel makers, rather than on the whole economy.
The first case on long-term energy contracts concerns the Belgian gas market for large
industrial customers, the so-called Distrigaz case.128 In 2004, Distrigaz and its connected
undertakings controlled between 70 and 80% of the relevant market of high-calorific gas
for large industrial customers; hence it was considered as holding a dominant position. In
this market configuration, the concern of the European Commission was that ―the effect of
these long-term contracts could be to foreclose the market to alternative suppliers and
therefore hinder the development of competition following liberalisation of the gas
sector.‖129 Two practices were particularly sources of concern, i.e. the foreclosure of the
market and resale restrictions. The latter were unilaterally removed by Distrigaz before
receiving the Statement of Objections, and removal was subsequently confirmed through
remedies; the former was resolved through a series of remedies accepted by the
Commission. In a nutshell, Distrigaz committed to: i) ensure that each year on average
70% of the customers in the relevant market return to the market; ii) not to conclude
contracts longer than 5 years with industrial customers; iii) to amend existing contracts
longer than 5 years with industrial customers, including a free opt-out clause for the
customer.
Long-term electricity contracts were later dealt with in the so-called EDF case.130 EDF is
the incumbent operator in the French market for the supply of electricity to large industrial
and commercial customers. By investigating the supply contracts concluded by EDF with
some French industrial customers, the Commission identified a potential abuse of
dominant position (under art. 102 TFEU). In particular, contracts bound a significant part
of the relevant market, were long-term, and included de jure (exclusivity clauses) or de
facto (through a set of clauses, such as take-or-pay schemes) exclusivity, thus foreclosing
competition and preventing newcomers to enter or expand in the market for the supply of
electricity to large industrial customers. Furthermore, resale restrictions were added to the
contracts with a detrimental effect on the development of the wholesale electricity market.
In reply to the Commission‘s objections, EDF offered commitments: i) to give other
competitors a chance to conclude a contract with EDF‘s industrial customers; ii) to avoid a
cream-skimming strategy by the incumbent, i.e. to secure more profitable large industrial
customers; iii) to allow customers to purchase energy from two suppliers at the same
moment. Inter alia, EDF committed itself to limit the duration of contracts without opt-
out options for customers to 5 years. EDF also offered to delete resale restriction clauses
128 Case COMP/B-1/37966 – Distrigaz, 11.10.2007
129 Case COMP/B-1/37966 – Distrigaz, 11.10.2007, § 5.
130 Case COMP/39.386 – Long-term contracts France, 17.03.2010

Page 163 out of 259
and to provide support to customers who intend to resell the purchased electricity in the
wholesale market. Finally, the Commission accepted and made legally binding the
commitments submitted by EDF.
The EDF case shows the importance of a case-by-case evaluation of long-term contracts,
concluded by dominant electricity suppliers, based on the assessment of the scope, nature
and duration of the contract, as well as the underlying market structure. In light of this
case, it can be presumed that energy suppliers – even dominant – are generally allowed to
conclude long-term contracts up to 5 years and even longer, provided that these contracts
include free opt-outs for customers (at least every five years).
The question shifts then from competition law to business strategy, i.e. whether electricity
producers have any incentive to offer long-term contracts subject to the above mentioned
commitments. Long-term contracts for energy intensive industries present a
counterfactual dilemma which the consultants have not been able to solve, that is whether
in the absence of competition policies limitations electricity producer would offer long-
term contracts. Or, on the contrary, in the current regulatory and market framework for
electricity generation and sale, long-term contracts, which used to be the rule in the
regulated days, are de facto impossible because electricity producers cannot, or do not
want to, bear themselves the market and regulatory risks.
Contracts, be they long-term or short-term, are an instrument through which parties
allocates risks and rewards. How risks and rewards are allocated has an impact on the
value of the contracts for both parties. If the clauses required making a contract compliant
with competition law changes this allocation, this may change the incentives of the parties
to enter into such a contract. If some of the commitments prescribed by the ―EDF case‖
lower the economic value of such contracts, this is going to impact on the decision of
electricity producers to enter into long-term agreements. For example, unilateral opt-outs
are hardly juicy options for producers, as one of the main benefit of long-term deals that is
stability, is enjoyed by customers, but not by the producers themselves. At the same, the
prohibition of resale restrictions, which could prevent arbitrage, may make it more difficult
for the incumbent generator to carry out price discrimination.131 Hence, Competition
policies may be facing a trade-off between preventing market foreclosure and forcing
contractual parties into adding certain clauses which lower the value of the contract for one
of the two parties. Protecting customers, be they professionals or consumers, comes at a
131 Price discrimination is indeed what industrial customers want: as they are bulk base load consumers, they
would like to get consequently lower prices. However, in the absence of resale restrictions, large industrial
customers may, e.g. in times of low product demand or high (peak) electricity price, resell electricity, thus
competing with the electricity producer. Thereby, without the possibility of introducing a binding re-sale
prohibition, the producer might increase the price of electricity sold to industrial customers in order to
make the option to resell electricity in the wholesale market less attractive. Or, at one extreme, the
producer may charge all consumers the same price, to avoid arbitrage. Price discrimination is a ―strange
animal‖ in competition economics. On one side, it increases the monopolist‘s profits; on the other, it can
also increase social welfare.

Page 164 out of 259
cost, and this cost may result in higher electricity prices or less favourable contractual
conditions.132
Long-term contracts are clearly an issue for steel makers. On one side, these contracts are
possible under current EU law, under the conditions set out in the EDF and Distrigaz
cases, albeit only a case-by-case assessment is possible. Indeed, the Commission
acknowledged that ―[d]ownstream bilateral supply agreements provide an opportunity to
energy intensive industries to obtain more predictable prices‖ while at the same time they
―risk foreclosing the downstream market‖. To better explain as these two competing
interests may be balanced, in 2007 the Commission announced, in order ―to reduce
uncertainty in the market‖, that it would ―provide guidance in an appropriate form on the
compliance of downstream bilateral long-term supply agreements with EC competition
law.‖133 Most probably, guidelines could provide energy intensive industries and electricity
producers with a more solid legal basis to decide whether entering, or not, into long-term
electricity contracts. Indeed, they would clear out the dilemma whether electricity
producers resist long term contracts on their own business considerations, or because of a
cautious approach towards a competition-sensitive issue. This is especially important in
this moment, considering that these two cases concerned countries with a strong
concentration of energy markets; and that the additional grid interconnections among
formerly separated national electricity markets may result in a different assessment of the
geographic dimension of the relevant market (e.g. along the supra-national markets
considered by the Guidelines on compensation for indirect ETS costs).
132 See i.a. Van den Bergh, R.K. (1997) ‗Wer schützt die europäischen Verbraucher vor dem Brüsseler
Verbraucherschutz? Zu den möglichen adversen Effekten der europäischen Richtlinien zum Schutze des
Verbrauchers‘, in C. Ott and H.-B. Schäfer (eds.) Effiziente Verhaltenssteuerung un Kooperation im
Zivilrecht (Tübingen; Mohr Siebeck).

Page 165 out of 259
9 Energy Policy
This chapter first compares electricity and gas prices across the world and within Europe.
Then the impact of selected EU legislation on the energy prices paid by steelmakers is
discussed.
The focus of this chapter is on energy prices paid by steelmakers; household prices are not
reported. While natural gas prices are relevant for steelmakers as well, this chapter will
mainly focus on electricity prices and the impact of EU legislation on them. The reason is
that the consulted stakeholders from the steel industry generally indicated that this was
the area were the impact of EU legislation was most salient.
In this Section, electricity costs are expressed in €/MWh In the cumulative cost
assessment, costs are expressed in €/tonne of finished product. Given electricity intensity
of the prototypical plants in Western and Central Eastern Europe, for each additional
€/MWh, European producers incur in the following additional costs expressed in €/tonne
(see Table 31).
Table 31 Effect of price marginal increases
Plant Electricity: effect of an
additional €/MWh
Western European BOF – flat
products (HRC) 0.28 €/tonne
Central Eastern European BOF
– flat products (HRC) 0.31 €/tonne
Western European BOF – flat
products (CRC) 0.43 €/tonne
Central Eastern European BOF
– flat products (CRC) 0.47 €/tonne
Western European EAF – long
products (WR) 0.64 €/tonne
Central Eastern European EAF
– long products (WR) 0.70 €/tone
9.1 Comparison of electricity prices
This section first explains the fundamentals of electricity price formation. Then, it presents
the average price of electricity paid by the industry in the EU and compares it to the prices

Page 166 out of 259
paid by the industrial consumers in the U.S., Canada, Japan, and Turkey.134 The section
then takes a closer look at the EU, making an intra-EU comparison of electricity prices for
industrial consumers among the countries where the plants belonging to the selected
sample are located.135
9.1.1 Fundamentals of electricity price formation
Notably, the cost of generating electricity varies depending on which generation technology
is used. As the short-run marginal costs of fossil-fuel fired power plants often set the
electricity price in liberalised electricity markets,136 the cost of fossil fuels (generally coal or
gas) plays a key role in the price formation. As a consequence, the price of energy
commodities has a significant impact on the cost of electricity. Irrespective of country-
specific energy policies and market structures, regional differences in the price of energy
commodities thus lead to significant electricity price differentials across the world.137
The most relevant commodity prices are coal, natural gas and oil. Oil is no longer directly
relevant for electricity price formation in most developed countries as oil-fired generation
capacities are generally only used in emergency situations. However, as natural gas prices
are frequently (though decreasingly) indexed to the oil-price, this oil-gas price linkage
means that the oil price is still relevant.
Figure 49 shows natural gas price developments from 1993 to 2012, in comparison with
the oil price. From the 1990s to 2007/2008, prices for US, EU, and Japanese natural gas
were increasing almost in parallel, and also in line with the oil price. As prices are reported
in nominal US dollars, the general increasing trend is partly due to inflation. As a result of
the unexpected shale gas revolution in the US, US natural gas prices have since fallen to
1990 levels. Recall that these figures are in nominal terms, so in real terms US gas prices
134 In the competitiveness analysis, the energy prices of other countries such as China, Russia and Ukraine
are also considered. However, this comparison was only possible through WSD data, and not with the
international surveys of electricity costs.
135 These countries are: Portugal, Spain, Italy, France, the United Kingdom, Germany, Poland and Hungary.
136 In the energy-only market model, sources of power generation are dispatched according to their short-run
marginal costs. The most expensive generation unit needed to meet demand determines the market
clearing price. All dispatched generation units except the marginal power plant earn infra-marginal rents,
allowing producers to cover fixed costs and invest in new generation capacity. In most European power
markets, either coal or natural gas are generally the most expensive unit most of the time. At times when
other forms of generation with low short-run marginal costs (e.g. nuclear, hydro and especially solar and
wind) are able to meet demand, electricity prices are significantly lower and may even be negative (see
also: Box 2).
137 Commodity and electricity prices are not directly linked in countries with regulated or (cross-)subsidised
electricity prices. However, even in those situations the price of the commodities is non neglible as it
determines the extent to which subsidies (or other forms of government intervention) are needed. The
higher the cost of electricity generation, the less sustainable are support policies, especially in situations
when public budgets are constrained and ageing generation fleets require reinvestments. Also, steel
producers sometimes dispose of their own generation facilities, where electricity is produced out of waste
gases.

Page 167 out of 259
are even lower than 20 years ago. US have also decoupled from the oil price. In Europe, by
contrast, gas prices have been three to four times as high as in the US as of 2009, and are
not yet fully decoupled from the oil prices. Japanese LNG import prices are even higher
than in Europe and still linked to the oil price.
Figure 49 Natural gas and oil prices, 1993-2012
Source: World Bank Commodity Price Data (Pink Sheet)
Figure 50 provides an overview of coal price developments from 1993 to 2012. As CO2
prices are currently either non-existent (most of the world) or very low (EU),138 coal is a
currently a highly competitive source of power generation in many parts of the world,
despite its significant carbon footprint. An exception is the US where the low gas prices, in
connection with environmental regulation, imply that natural gas is increasingly replacing
coal in power generation. US coal producers are forced to export their coal to other
markets, putting downward pressure on the price of coal in other parts of the world. This
development is particularly visible in Europe, where spread between coal and gas prices,
and low CO2 prices, are increasingly pushing natural gas-fired power plants out of the
merit order.139
138 See Section 7.
139 Natural gas is about half as carbon intensive as coal.
0
20
40
60
80
100
120
0
2
4
6
8
10
12
14
16
18
Cr
ud
e o
il i
n n
om
ina
l $
/bb
l
Na
tur
al
ga
s i
n n
om
ina
l $
/mm
btu
Natural gas, US Natural gas, Europe
Liquefied natural gas, Japan Crude oil, average

Page 168 out of 259
Figure 50 Coal Prices, 1993-2012
Source: World Bank Commodity Price Data (Pink Sheet)
9.1.2 International comparison of industrial electricity prices
On a worldwide scale, industrial electricity price vary greatly. The price differences are due
to many elements. Among them there are the type of technology used for power
generation; costs of fuels, or in the case of renewables, the local climate; network costs,
and also the regulatory framework concerning fiscal, environmental and energy issues. It is
important to note that electricity prices are still subject to subsidies and/or price
regulations in many parts of the world, especially, but not only, outside of the OECD.
Making an international comparison of electricity prices paid by the steel industry is
challenging as electricity prices, especially for large industrial consumers are not very
transparent. Public sources have been thus complemented with the information provided
by steel operators and subsequently verified. Indeed, international comparison of very
large industrial consumers require access to the prices actually paid by the operators, as
international statistics usually focus on lower consumption bands. Furthermore, a proper
comparison requires the understanding of the amount of taxes actually by paid by specific
consumers in each jurisdiction, information which is extremely difficult to retrieve from
secondary sources.140
For the international comparison, the source is the International Energy Agency‘s Energy
Prices and taxes publication series. However, the publication only reports industrial energy
price for low consumption levels (i.e. below 20,000 MWh per year), while steel producers
consume more than 150,000 MWh per year. The prices can thus only serve as very rough
indication of the prevailing price differences.
140 Finally, it should be noted that so far data concerning Turkey, Brazil, Russia and Ukraine could not be
retrieved.
0
20
40
60
80
100
120
140
Na
tur
al
ga
s i
n n
om
ina
l $
/mt
Coal, Australian Coal, Colombian Coal, South Afican

Page 169 out of 259
Figure 51 illustrates the evolution of end-user electricity prices paid by the industry in key
OECD countries over the last nine years.141 The figure shows that since 2008, the prices of
electricity paid by the industrial users operating in North American countries have been
decreasing significantly. Inversely, electricity prices in other key OECD countries have
been rising in the same period of time. These differences are commonly attributed to
decrease in gas prices following the shale gas ‗revolution‘ discussed above. No significant
decoupling of price between US and Europe took place before 2008.
Figure 51: Indices of real energy prices for industry (2005 = 100)
Source: International Energy Agency, 2013
In 2011, the average end-user price of electricity for industrial consumers142 in the U.S.,
including taxes, was of € 49.6 per MWh.143 Thanks to the extraction of its domestic energy
sources, the US are a major producer of fossil fuels. In 2011, the following sources of
energy were responsible for the electricity production in the U.S.: (i) conventional thermal
(67%)144, (ii) nuclear (19%), (iii) hydro (8%) and (iv) 5% other RES145. The impact of shale
gas is reflected in the growing role of gas as a fuel for electricity generation. Additionally,
energy taxation in the U.S. is very limited. The rates of the taxes applied on electricity
consumption varied between 2 and 6% depending on the state.146
141 For a comparison of the cost of electricity in steel production with non-OECD countries, see Sections 1.2.2
and 1.3.2 above.
142 Band ID: 2,000 MWh < Consumption < 20,000 MWh.
143 International Energy Agency, Energy Prices and taxes, Quarterly Statistics, first quarter 2012.
144 Of which coal was responsible for 42%, and natural gas for 25% of power generation.
145 EIA data.
146 International Energy Agency, Energy Prices and taxes, Quarterly Statistics, first quarter 2012
80
90
100
110
120
130
140
2004 2005 2006 2007 2008 2009 2010 2011 2012
OECD Europe
USA
Canada
Japan
Turkey

Page 170 out of 259
In China, the prices of energy are regulated by the central government. By controlling the
prices of energy, the Chinese authorities can limit the effects of volatility and inflation, de
facto assuring the competitiveness of their industry.147 In 2011, the average price of
electricity for industrial consumers148 in China was of € 80.10 per MWh.149 Coal remained
the main fuel used for power generation in China followed by hydro, new RES and
nuclear.150 It is not clear how much these tariffs are compensated by public subsidies.151
In 2011, the average price of electricity for industrial consumers152 in the EU-27, including
taxes, was of € 120.4 per MWh153. This is actually much higher than what reported by
Western and Central Eastern European BOF steel producers. In 2011, the following
sources of energy were responsible for the EU‘s electricity production: (i) 55%
conventional thermal, (ii) 28% nuclear, (iii) 11%hydro, and (iv) 6% other RES.154 As the EU
is a big importer of fossil fuels, 52% of its energy need was covered by imports.155
9.1.3 Intra-EU comparison of industrial electricity prices
The prices of electricity vary not only throughout the world, but also among EU member
states. As mentioned above, understanding what steel producers actually pay for their
electricity consumption is difficult. To start with, Eurostat data were relied upon.
Unfortunately Eurostat data for industrial consumers with an annual consumption
superior to 150,000 MWh (i.e. the range relevant for steel makers) is only available for five
of the eight countries under scrutiny (Spain, Italy, Hungary, Poland and the UK). For
Germany, France and Portugal electricity prices for industrial consumers with an annual
consumption ranging from 70,000 to 150,000 MWh are hence reported. Electricity prices
before taxes are more suit for comparison for two main reasons. First, the extent to which
steelmakers actually have to pay taxes on their energy consumption is limited compared to
other sectors. Second, since the impact of the EU on the level of energy taxation in the case
of energy products and electricity use for metallurgical process is negligible (see Section
9.3.5), it falls outside the scope of this study. Consultants are aware of the limitations of
Eurostat data
147 Toff J. Edwars, China‘s Power Sector Restructuring and Electricity Price Reforms, [in] Asia Paper 6.2,
Brussels Institute of Contemporary China Studies.
148 Band ID: 2,000 MWh < Consumption < 20,000 MWh.
149 OECD Economic Surveys: China, OECD, 2013.
150 Unconventional Gas: Potential Energy Market Impacts, JRC Scientific and Policy Report, European
Commission, 2012
151 See Section 11.1.2 below.
152 Band ID: 2,000 MWh < Consumption < 20,000 MWh.
153 Based on Eurostat data.
154 Eurostat data.
155 Eurostat data.

Page 171 out of 259
Figure 52 shows Eurostat prices of electricity for large industrial consumers excluding
taxes for 2012.156 With 52 €/MWh and 56 €/MWh, Spain and France have relatively lower
industrial electricity prices; UK prices are the highest among the eight countries under
study, reaching 98 €/MWh.
Figure 52 Prices of electricity for large industrial consumers excluding taxes - 2012
(€/MWh)157
Source: Eurostat, 2012
Figure 53 below reports the price of energy including costs and levies but excluding taxes
as reported throughout the interviews. Plants A and B are Western European BOF plants;
plant C is a Central Eastern European BOF plant. For one plant, the price reported is in
line with Eurostat prices; for the other two plants, prices are lower, by 8 and 10 €/MWh,
i.e. about 15%.
156 Note that, according to Eurostat methodology, transmission and other tariffs are included in the prices of
electricity before taxation.
157 (p): provisional
0
20
40
60
80
100
120
EU-27 (p) Germany Spain (p) France (p)
Italy (p) Hungary Poland Portugal United Kingdom
Price (in €/MWh)

Page 172 out of 259
Figure 53 Prices of electricity for steel operators - (€/MWh)158
Source: interviews with operators; author‘s validation
To give a better idea where these differences come from, we now break down industrial
electricity prices into three components (i) the cost of electricity transmission, (ii) the costs
of the national RES support schemes and (iii) the level of taxation. The impacts of the
carbon price on electricity prices, which are another relevant factor for the industrial
customers‘ price structure, are discussed in the Section 7.
The cost of the transmission tariffs:
Figure 54 provides an overview of the evolution of tariffs for electricity transmission in
selected member states.159 Distribution tariffs can be ignored as steelmakers are usually
directly connected to the high-voltage grid. As shown in the bar graph, there is no
overarching increasing or decreasing trend in the level of transmission tariffs. The level of
these tariffs varies significantly from one country to another. In 2012, the member states
with the lowest tariffs are France and Poland160 (both 5.73 €/MWh). Inversely, the tariffs
imposed by Spain (8.64 €/MWh) and Italy (8.57 €/MWh) are the highest among the
selected countries. The tariff for electricity transmission represents 16.2% of the final price
of electricity without taxes charged to large industrial consumers based in Spain, and this
is the highest among the selected member states. The impact of the tariff for electricity
transmission on the final electricity price for large industrial consumers was the smallest in
Poland, amounting to 7.8%, of the pre-tax price.
158 (p): provisional
159 Considering transmission tariffs as a cost of regulation is debatable. Transmission tariffs are fixed by
energy regulators; still, transmission costs would exist (and would be charged to final customers at least
to a certain extent) even absent the regulation. Furthermore, all electrical systems in the world must bear,
and thus pass on to customers, electricity costs, regardless of the regulatory framework. However, how
these costs are shared among different classes of electricity customers depends on the regulatory
framework.
160 These prices do not include other regulatory charges not directly related to TSO activities. In Poland, these
include stranded costs i.e. cost resulting from compensation paid to energy producers for dissolving long
term energy sales contracts concluded in the past with a single buyer company. The long term contracts
obliged energy producers to modernize their production units, adjusting them to environmental
standards. Those costs are recovered by a transitory charge in the tariff (ENTSO-E 2012).
0
10
20
30
40
50
60
70
80
A B C
Price excluding taxes (€/MWh)

Page 173 out of 259
Figure 54 Transmission tariffs in selected EU member states - 2009-2012
(2011-€/MWh)
Source: ENTSO-E 2012
Data reported from plant operators are on average aligned with data from ENTSO-E.
However, in two cases transmission costs were significantly lower (between -23% and -
46%), probably reflecting the fact that the largest consumers face a digressive transmission
tariff, and in the remaining case the transmission costs reported by the operator was
significantly higher. This is most probably due to the inclusion of other regulatory costs in
the transmission tariffs.
Other regulatory charges, not directly related to TSO activities, might influence the final
cost of electricity. While in most of the member states selected for this study these costs
have a limited impact on the final price of energy (e.g. 0.50 €/MWh in Germany), their
impact is greater in Poland (2.67 €/MWh) and most importantly in Portugal (16.09
€/MWh).161
Costs of the RES Support Schemes
Information on the cost of RES support paid by industrial customers is very scarce in the
public domain. However, based on primary and secondary sources, it has been possible to
estimate costs for RES support in 6 out of the 8 countries in scope of this report; these
countries represent 69% of crude steel production in the EU 27 in 2012.162 Figure 55
161 In Poland these costs are mainly due compensations paid to energy producers for dissolving long term
energy sales contracts concluded in the past with a single buyer company. These long-term contracts
forced energy producers to upgrade their production units. Those costs are recovered by a transitory
charge in the tariff. In Portugal these additional costs are mainly generated by energy deviation and the
costs of the islands tariff convergence. For more details consult ENTSO-E (2012). 162 Missing data for HU and PT.
0
2
4
6
8
10
12
14
FR DE UK HU IT PL PT ES
2009
2010
2011
2012

Page 174 out of 259
reports the costs of RES support schemes for large industrial consumers consuming
150,000 MWh per year in selected EU member states. Steel makers consume more, and in
some case significantly more, electricity; hence, the data does not reflect the actual costs
for steel makers due to RES support schemes. With the exception of Italy, the figure is
based on an industry source, and may thus be interpreted as an upper bound estimate. As
shown by the figure, these costs are significantly different across member states.
Figure 55 Costs of RES Support Schemes for 150,000MWh users - calculated, 2011 (€/MWh)
Source: Industry (Bhagwat, 2012), Luiso (for Italy)
At higher levels of consumption (i.e. 680,000 MWh/year), thus closer to the steel
industry‘s actual consumption levels, the cost of RES support schemes is relatively lower,
as shown in Table 32.163 While the annual average for Italian consumers amounts to 5.9
€/MWh, in Germany it is merely 0.57 €/MWh; a difference of an order of magnitude.
French figures are slightly higher than Germany‘s, but this is because the French figures
also include other system charges and thus do not only measure direct RES support. As
matter of fact, the share of RES support scheme costs in total electricity supply costs also
varies – between 7.2% (Italy) and about 1% (Germany and France). Note that these figures
do not take the merit order effect into account.
163 Luiso (2013) only provides comparative data for Italy, Germany, and France.
0
5
10
15
20
25
Germany Spain France Italy United Kingdom
Cost (in €/MWh)

Page 175 out of 259
Table 32: RES support scheme cost comparison for 680,000MWh users (2012)
Italy Germany France
Annual average (in (€/MWh) 5.9 0.57 0.8
Annual cost (in €) 4,030,197 390,576 550,000
Share of total electricity supply cost (in %) 7.2% 1% 1.4%
Note: In France the figure includes other system charge in addition to RES support scheme costs (about 52
%); in Italy the figures are system charges as well, but 90% are related to RES support. For the precise definition of the considered system charges, please consult the original source.
Source: Luiso (2013)
Costs for RES support schemes have not been reported from all the operators. For plant A,
they are around 1 €/MWh. For plant B, the legal framework is unclear and it is not possible
to understand the exact share of RES support paid by large industrial consumers, but
triangulating several sources it is possible to infer a cost of about 5 €/MWh.164 For plant C,
the reported costs amount to about 9 €/MWh.
Besides RES levies, some member states also charge a levy for co-generation (CHP)
support. CHP charges are a substantial issue in some countries, e.g. Belgium or Romania,
while others do not impose such a charge or exempt industrial consumers.165 However,
they were not reported as a significant burden in the countries in scope of this exercise.
Taxation of electricity prices
Figure 56 illustrates the impact of taxes and levies on the final costs of electricity for
industrial consumers.166 However, the impact varies from sector to sector given the
existence of several specific exemptions. In most of the member states selected for this
study, taxes are responsible for a share of final prices paid by industrial consumers, which
ranges from 1.7% (United Kingdom) to 11.9% (Italy). Yet, according to the data published
by Eurostat, the share of taxes in the final price of electricity seems to be significantly
higher in Germany (43.1%) than in the other member countries. It should be noted that
Germany has high energy tax rates, but also rebates schemes for energy intensive and
manufacturing industries, which are possibly not fully reflected in the Eurostat data.167 In
any case, the total price of electricity paid by Italian (96.5 €/MWh) and British (99.7
164 See also Deloite, 2013.
165 For Belgium see Deloitte 2013. For Romania, this was confirmed through contacts with electricity
industrial customers. For both countries, CHP charges can reasonably be estimated in the area of 1-
5€/MWh. Industry stakeholders also reported that they expect an increase of these costs in the near
future.
166 VAT excluded.
167 E.g. the energy tax rate in Germany is 20.5 €/MWh, including on electricity used for metallurgical
purposes. Businesses enjoy a reduced tax rate of 15.37 €/MWh. However, for energy intensive industries
which meet several conditions laid out in the law, including energy efficiency targets, up to 90% of the tax
is rebated through lower social contributions (see art. 10 of the Stromsteuergesetz).

Page 176 out of 259
€/MWh) large industrial consumers is the highest among the countries compared in this
study. However,
Figure 56 Prices of electricity for large industrial consumers168 - 2012 (€/MWh)169
Source: Eurostat, 2013
From the interviews, it clearly appears that steel companies in some countries pay an
electricity tax, but that the amount, if any, is not as high as reported in Eurostat data. Plant
B reported an effective electricity tax rate of 2.4 €/MWh, while Plant C a tax rate of 4.78
€/MWh. However, as EU excise duty legislation does not apply to electricity use for
metallurgical purposes, these rates depend only on national policies.
9.2 Comparison of natural gas prices for industry
Gas markets have evolved significantly in the last decade. The sophistication of the
liquefaction technologies, the shale gas revolution in North America, and the development
of LNG infrastructures changed dramatically the functioning of gas markets. As described
in the Section on the Fundamentals of electricity price formation, the prices of gas in North
America have decreased following the unexpected shale gas revolution. Yet, despite this,
important volumes of gas are still being delivered under long-term contracts destined for
identified buyers. Like any other energy commodity, natural gas end-user prices are
168 The Eurostat data for industrial consumers with an annual consumption superior to 150 0000 MWh
[Band IG] is available for the following countries: Spain, Italy, Hungary, Poland and the UK. Due to the
lack of a reliable alternative source, the prices for industrial consumers based in Germany, France and
Portugal presented in the above figure originally belong to industrial consumers with an annual
consumption ranging from 70 000 to 150 0000 MWh [Band IF].
169 (p): provisional; *.According to the methodology applied by Eurostat, transmissions tariffs are included in
the prices of electricity before taxation.
0
20
40
60
80
100
120
Germany Spain France (p) Italy (p) Hungary Poland Portugal United Kingdom
Excluding VAT Excluding taxes *

Page 177 out of 259
shaped by many factors: the costs of its transportation from the producing region, the level
of taxation, the nature of the contract (long-term vs. spot market) and the context in which
the contract was agreed. These elements can help in understanding the differences in gas
prices throughout the world and within the EU.
The table below shows the differences in the price paid by industrial consumers for gas
consumption. Among the countries compared, the British industry has access to the lowest
prices of gas at 30.9 €/MWh. However, gas is subject to heavier taxation in Germany than
in the UK. It is worth noting that ex-tax, German industrial consumers benefit from the
lowest prices. Inversely, among the compared countries, the final prices of gas are
particularly high in Hungary 55.9 €/MWh, almost twice the UK price.
Table 33 Prices of gas for industrial users – 2012 (€/MWh)170
Taxes Excluded Taxes Included
Germany 24.0 33.3
Spain 29.3 36.6
France (provisional) 30.6 36.1
Italy (provisional) 33.6 36.9
Hungary 42.9 55.9
Poland 29.8 36.7
Portugal 34.7 42.8
United Kingdom 25.3 30.9
Source: Eurostat, 2013
9.3 Impact of EU regulation
9.3.1 Third Energy Market Package
The Electricity and Gas Directives from 2009171 establish common rules for the internal
market in electricity and gas, respectively. Together with a regulation establishing the
Agency for the Cooperation of Energy Regulators (ACER),172 and two regulations
170 The Eurostat data for industrial consumers with an annual consumption superior to 4 000 000 GJ [Band
I6] is available for the following countries: Germany, Spain, Italy and Hungary. Due to the lack of a
reliable alternative source, the prices for industrial consumers based in France, Poland, Portugal and in
the UK are presented in the above figure originally belong to industrial consumers with an annual
consumption between 1 000 000 and 4 000 000 GJ [Band I5].
171 Directive 2009/72/EC of the European Parliament and of the Council concerning common rules for the
internal market in electricity and repealing Directive 2003/54/EC; andDirective 2009/73/EC of the
European Parliament and of the Council concerning common rules for the internal market in natural gas
and repealing Directive 2003/55/EC.
172 Regulation (EC) No 713/2009 of the European Parliament and of the Council establishing an Agency for
the Cooperation of Energy Regulators .

Page 178 out of 259
determining the conditions for access to the network for cross-border exchanges in
electricity173 and natural gas,174 they constitute the Third Energy Market Package
(hereinafter Third Package). The Third Package provides for the legislative framework of
rules for generation, transmission, distribution, and wholesale and retail trade in
electricity and gas. The internal market in electricity and gas aims to deliver choice for all
consumers of the EU and create new business opportunities,175 thereby achieving
competitive prices and higher standards of service. Fostering cross-border trade shall
achieve efficiency gains. In electricity this means, for instance, that more efficient
generation capacities replace the less efficient ones, security of supply is increased, e.g.
through the pooling of backup capacities, and a sustainable electricity system is built, inter
alia through the integration of renewables.
As the steel industry is highly energy intensive, the liberalisation of energy markets, set to
bring about competitive energy prices for Europe, is very relevant to the industry. Hence,
the attention is turned to some of the main aspects of the market liberalisation agenda
their implications for industries are discussed. As there are generally no direct costs for
steel makers associated with the Third Package, the indirect effects resulting from its
implementation are rather discussed. The focus is on electricity as this is the area where
the consulted stakeholders from the steel industry felt that the impact of EU regulation was
particularly salient.
Regulated prices
In 2011 electricity prices for non-household consumers were still regulated in 12 EU
member states (ACER/CEER, 2012). In some countries, prices are regulated at levels
below market costs (European Commission, 2012). As regulated end-user prices prevent
suppliers from improving their services (e.g. developing pricing schemes that take the
individual characteristics of different consumer groups into account) and also discourage
new entrants that could challenge the incumbents, the Commission insists on phase-out
timetables for those countries that still have regulated end-user prices.
173 Regulation (EC) No 714/2009 of the European Parliament and of the Council on conditions for access to
the network for cross-border exchanges in electricity and repealing Regulation (EC) No 1228/2003.
174 Regulation (EC) No 715/2009 of the European Parliament and of the Council on conditions for access to
the natural gas transmission networks and repealing Regulation (EC) No 1775/2005.
175 In order to develop competition in the internal market in electricity, large non-household customers
should be able to choose their suppliers and enter into contracts with several suppliers to secure their
electricity requirements. Such customers should be protected against exclusivity clauses the effect of
which is to exclude competing or complementary offers. (To be monitored by NRAs, cf. art. 37.1.(k)).
Similarly for gas , in order to develop competition in the internal market in gas large non-household
customers should be able to choose their suppliers and enter into contracts with several suppliers to
secure their electricity requirements. Such customers should be protected against exclusivity clauses the
effect of which is to exclude competing or complementary offers. (To be monitored by NRAs, cf. art.
41.1.(k)).

Page 179 out of 259
While the deregulation of energy prices is important to ensure the functioning of
liberalised energy markets, in those countries where the steel industry used to
benefit from favourable ‗industrial tariffs‘, deregulation may lead to higher power
prices for the steel industry.
Network codes
Network codes are probably the most underestimated tool in the Third Package – some
stakeholders informally refer to them as the ―Fourth Energy Package‖. Network codes that
are of particular interest to the energy intensive industry include the balancing network
code as well as the network code on forward markets, both expected to enter the legislative
procedure in the first quarter of 2014. Improving the cross-border pooling of balancing
resources should bring down balancing costs, and thereby help to limit the costs stemming
from the integration of variable renewables into the electricity grid. A network code on
forward markets could help the energy-intensive industry to hedge the risk of energy price
increases and generally decrease uncertainty.176
Network codes are crucial to bring down energy system costs and are and finalising
their development by 2014 as targeted should be in the interest of the electricity-
intensive industry.
Trade
Trading electricity across borders brings social welfare benefits. By requiring the
development of proper market rules in the form of the above mentioned network codes –
in particular the network code on capacity allocation and congestion management
expected to be adopted through delegated acts still in 2013– the Third Package allows
cross-border trading to flourish in practice. According to a calculation performed by energy
regulators, the existing electricity interconnectors do already bring significant welfare
gains (see Figure 57, ACER/CEER 2012). For example, in 2011, the existing
interconnection capacity between Germany and France, both under study in this report,
brought social welfare benefits of some € 115 mln. If additional interconnector capacity of
100 MW had been available for trade on this border, social welfare would have increased
by an additional € 4 mln. Particularly striking is the example of the border between France
and Italy, also under study in the report, where an additional interconnector capacity of
100 MW would have increased social welfare by € 19 mln. It is important that the extra
capacity in this context does not need to come from new physical transmission
infrastructure (discussed below in the section on the Energy Infrastructure Package), but
can instead be the result of more efficient capacity calculation methods that are being
developed in the process of energy market integration.
176 Several stakeholders from energy-intensive industry have raised concerns of the current situation in
which they find it difficult to ener into long-term electricity supply contracts (i.e. > 5 years); see Section
8.2.3.

Page 180 out of 259
Generally, cross-border trading can thus make a contribution to increasing the
competiveness of EU energy prices, and therefore of the EU‘s energy intensive
industry such as steel.
Figure 57: Simulation results: gross welfare benefits from cross0-border trade and
incremental gain per border – 2011 (€ mln per year)177
Source: ACER/CEER 2012
Market liquidity
Due to their high consumption levels, large industrial electricity consumers need liquid
wholesale markets to be effectively free in choosing their suppliers. If markets are
fragmented on the supply-side, industrial consumers may not have a choice but to procure
electricity from the largest supplier, often the historical incumbent. Liquid markets are an
important prerequisite for entering into long-term contracts, which may otherwise be
problematic from a competition perspective as they would further decrease market
liquidity. Market liquidity is also important to get a first idea of how much wholesale
electricity prices say about the price paid by industry. In principle one would expect that in
countries where a greater share of the total electricity consumption is traded at a power
exchange end user prices better reflect the wholesale price.
Liquidity in EU electricity wholesale markets varies widely. Table 34 lists the liquidity of
the eight countries under study as well as day-ahead base load power prices, both for 2011.
In five out of the eight countries under scrutiny market liquidity was still less than or equal
177 For a detailed discussion of the methodology please consult the original source.

Page 181 out of 259
to 15%. Thus, while this data suggests that prices of electricity traded at power exchange
gives some indication of what large consumers have to pay for electricity in Germany
(40%), Spain, and Portugal (67%), in the other countries the volumes traded at power
exchanges were probably too small. As a consequence, in the intra-European price
comparison Eurostat data are relied upon. The relatively low levels of liquidity in a number
of member states also suggests that large industrial electricity consumers may sometimes
not really have a choice yet when it comes to choosing their electricity supplier.
The development of network codes and efforts to expand electricity infrastructures
should further increase market liquidity in the future, but, especially when it comes
to physical infrastructures, this is a time-consuming process. Yet, the success of
these efforts is crucial to ensure that large industrial electricity consumers can reap
the benefits of energy market liberalisation in practice. It should be noted that
power exchanges increase the transparency of electricity price formation and large
industrial consumers report to find it difficult to procure electricity below the prices
traded at power exchanges.
Table 34 Trade volumes at power exchanges as a percentage of national demand and annual
average day-ahead base load power prices (€/MWh)178
Country Market liquidity Day-ahead price (EUR/MWh)
2011 2011
France 13% 48.9
Germany 40% 51.1
Hungary n.a. 55.8
Italy 58% 72.2
Poland 13% 52.2
Portugal 67% 45.5
Spain 67% 50.8
UK 15% 56.9
Source: ACER/CEER 2012, EC 2012
9.3.2 Renewables
Directive 2009/28/EC on the promotion of the use of energy from renewable sources179 set
mandatory targets for RES (Art. 3.1). Member states shall ensure that the share of energy
from RES in gross final consumption of energy reaches the national overall targets.
Member states are free to devise national renewable energy action plans, and to decide
178 Market liquidity is measured by a proxy indicator, dividing the total quantity of electricity day-ahead
marketed on any power exchange of the corresponding market by the total quantity of power consumed
on the corresponding territory.
179 Directive 2009/28/EC of the European Parliament and of the Council on the promotion of the use of
energy from renewable sources and amending and subsequently repealing Directives 2001/77/EC and
2003/30/EC

Page 182 out of 259
how to fund them. National targets depend on the starting point and the economic
situation. As the support for renewable electricity is either passed on through electricity
prices or directly added to electricity bills, the costs of achieving the agreed objectives will
ultimately be borne by end-users. However, as noted above, in many member states steel
makers, as other energy intensive industries, only have to shoulder a relatively small
burden of these costs, as the main share in most member states falls on households.
When assessing the costs of RES support schemes for industry, it is crucial to also look at
the cost saving that materialise through the merit order effect that puts downward
pressure on wholesale electricity prices (Pöyry 2010). As explained earlier, in liberalised
electricity markets, the supply curve, also called ‗merit order curve‘, is based on the cost of
producing each additional unit, i.e. generally the fuel cost, from the range of available
generation technologies. Wind generation, as the largest-scale example of RES-E capacity
additions in recent years, has an additional unit cost close to zero (no fuel cost). When a
large wind-based generation capacity is added to the system as a result of the RES support,
the whole curve shifts to the right, thus reducing the unit price that utilities can charge and
the associated rent they would get (Figure 58). This benefits the customers to the
detriment of generators.180
Figure 58: Effects of wind power at different times of the day
Source: Pöyry 2010, p.11
180 As discussed in the Section on Climate Change, the added EU ETS allowance price has the opposite effect
on the merit order curve (Figure 27). When carbon prices are added on top of the marginal costs of each
fossil fuel, the curve as a whole is shifted upwards and the market price increases for any given demand
volume. The difference becomes windfall profits for the electricity producing sector and is covered by
higher prices for the consumers.

Page 183 out of 259
Estimates of the rents or wealth transfers reveal significant volumes for the merit order
effect from increased RES-E share, although depending on the electricity market structure
of specific countries. Sensfuß et al. ( 2008) estimates the effect at €5 billion in 2006 for
Germany, and compare this effect to the cost of incentives to RES of €5.6 billion. Thus, the
consumers have paid only €0.6 billion of net costs, while the generators have absorbed
€2.5 billion in reduced profits. Results for Ireland point to even bigger impacts: one study
by Clifford and Clancy (2011) estimates a merit order effect of €75 million. This balances
the €50 million in overall costs from the Irish variant of feed-in-tariffs (FiT) and thus the
cost of RES support is not felt by electricity customers.
Depending on the extent to which steelmakers actually share RES support scheme costs
and the level of the merit-order effect, the net costs of RES support schemes for steelmaker
may thus either be rather small or even negative, meaning that RES support schemes may,
somewhat counter intuitively, bring down electricity costs for steel makers in some
circumstances (see for the example of Germany).
Box 2 RES support costs vs. merit order effect. The case of Germany.
Reusler and Nestle (2012) estimate the net effect of RES support schemes on the so called privileged
electricity consumers (e.g. steel makers) in Germany, that do not have to share the full burden of the RES
support schemes. The maximum amount these consumers contribute to RES support schemes is capped at
0.50 EUR/MWh. At the same time, the industry benefits from RES support schemes through the merit-order
effect that puts downward pressure on electricity prices. The authors conclude that so far the privileged
industry has received a net benefit from RES support in Germany. More precisely, in 2010 the merit-order
effect decreased electricity prices by 5 EUR/MWh. According to estimates from the Germany Ministry of the
Environment reported by Reusler and Nestle (2012), in 2011 the effect increased to 8.7 EUR/MWh. It should
be noted that steelmakers may be affected by RES support scheme costs even if they are among the privileged
electricity consumers, as some parts of the steel value chain may not be covered by the exemption.
The costs of support schemes in general and for steelmakers in particular depend on
member states‘ implementation of the RES directive and the national context. It is
important to emphasise that RES support schemes do not necessarily lead to higher
costs for steelmakers, but may even lead to lower electricity supply costs due
exemptions and the merit-order effect. There is, however, a risk that steelmakers
will have to shoulder a greater burden of RES support scheme costs in the future if
politicians give in to public opinion which tends to see exemptions for industry
critically.
9.3.3 Energy Infrastructures
As mentioned in the section on the Third Package, expanding physical energy infrastructures of cross-border relevance is crucial to making the internal energy market work, as emphasised by the Commission Communication of the same name from November 2012:181
181 Communication from the Commission, Making the internal energy market work,COM(2012)663,
15.11.2012

Page 184 out of 259
Energy must be able to flow to where it is needed, without physical barriers at national
borders. This implies inter alia addressing the effects of unplanned power flows
("loop flows") on cross-border market integration. Serious investment in energy
networks is needed to enable certain areas of the EU to emerge from isolation5 and to
achieve our Europe 2020 targets”
Regulation (EU) No 347/2013182 provides guidelines for trans-European energy
infrastructure. At the heart of the new regulation are the so-called Projects of Common
Interest (PCIs), which will benefit from streamlined and faster permit-granting
procedures, improved cost-allocation procedures and access to (very limited) EU funding
through the ‖Connecting Europe‖ facility.
Originally, the main purpose of cross-border electricity interconnections was to contribute
to security of supply. Interconnectors were built to allow for mutual support in case of
supply disruptions, thereby ensuring the reliability of electricity supply. More recently,
their role in fostering competition and other efficiency gains related to cross-border
trading has received growing attention. Given the ambitious renewable-energy targets of
the EU, a new motive for interconnectors is emerging: the integration of electricity from
RES.
While expanding electricity infrastructures may lead to somewhat higher
transmission tariffs, they generally decrease electricity system costs and increase
social welfare. 183While transmission tariffs have been rather stable in recent years
(see Section 9.1.3), concerns about future increases are reportedly an issue for the
industry.
9.3.4 Energy Efficiency
The Energy Efficiency Directive184 includes some provisions that shall provide incentives
for large enterprises to make investments in energy efficiency improvements and may be
associated with some direct and indirect costs for steelmakers.
Direct costs
Art. 8.4 foresees energy audits, meaning that large enterprises (incl. steelmakers) must
undergo an independent energy audit. The energy audit should be carried out by Dec. 2015
and at least every four years afterwards; a higher frequency is possible. Companies
implementing an energy or environmental management system certified according to
182 Regulation (EU) No 347/2013 of the European Parliament and of the Council on guidelines for trans-
European energy infrastructure and repealing Decision No 1364/2006/EC and amending Regulations
(EC) No 713/2009, (EC) No 714/2009 and (EC) No 715/2009
183 Due to distributional effects associated with transmission expansion, increased interconnection capacity
may, while increasing overall social welfare, lead to higher prices for consumers located in the low price
area.
184 Directive 2012/27/EU of the European Parliament and of the Council on energy efficiency, amending
Directives 2009/125/EC and 2010/30/EU and repealing Directives 2004/8/EC and 2006/32/EC-

Page 185 out of 259
European or International Standards would be exempted (provided equivalence).
According to the accompanying impact assessments, an audit should cost a few hundred
thousand Euros. Art. 13 stipulates that member states shall lay down rules of penalties in
case on non-compliance with audit provisions – member states may decide the level of
penalty (if any), there is thus not necessarily a regulatory cost associated with this
provision. After 5 June 2014, Art. 14.5 requires that steelmakers, in case of refurbishment
of industrial installations generating waste heat at a useful temperature level with a total
thermal input >20MW, carry out a cost-benefit analysis assess the option of introducing
co-generation in heating. There is an exception for CCS.
Indirect Costs
Art. 7 contains an obligation for energy companies to achieve end-use energy savings of
1.5% of the annual energy sales to final customers. The provision is valid from 2014 to
2020. Member states have the option to exclude iron and steel manufacturing, hence at the
moment it is not possible to assess whether any indirect costs will materialise.
While there may be some (low) costs for steelmakers resulting from the energy
efficiency directive (depending on the member states‘ implementation), in aggregate
the provisions may well be beneficial for companies.
9.3.5 Energy Taxation
Energy taxation is generally determined at national level within EU bounds A Council
Directive (2003/96/EC)185 sets the Community framework for the taxation of energy
products and electricity. According the consolidated version of the Directive186 there are
minimum excise duties on fuels, such as coal, coke or natural gas. More precisely, coal and
coke for heating business use shall be subject to an excise of minimum 0.15 €/GJ of Gross
Calorific Value. However, the Directive also contains an exemption for dual use of coke and
coal (e.g. for use of coal and coke for chemical reduction and metallurgical processes),
hence steel makers are not imposed any lower bound for energy taxes at EU level.
In addition, electricity for business use shall be subject to an excise of minimum 0.5
€/MWh, but, again, there is an exemption for electricity used principally for the
purposes of chemical reduction and metallurgical processes. Importantly, Art. 17
provides member states the option to fully exempt energy-intensive industries. To
what extent (if at all) steelmakers are affected by energy taxation depends on the
member states. No energy taxes on fuels and electricity used for metallurgical
processes can be attributed to the EU framework.187
185 Council Directive (2003/96/EC) restructuring the Community framework for the taxation of energy
products and electricity
186 As amended by Council Directive 2004/74/EC and 2004/75/EC.
187 With the small exception of parts of the industry value chain which may be not considered as carrying out
metallurgical processes.

Page 186 out of 259
10 Environmental Policy
10.1 Introduction
EU environmental policy is embedded in a number of legislative measures covering a wide
range of aspects, from air quality to the management of solid waste and from water quality
to the prevention of noise pollution. EU environmental policy exerts a major influence on
the steel industry, with about ten main pieces of EU legislation having a more or less direct
impact on the operations of steel makers. This Section reviews the impact of EU
environmental legislation concerning (i) the prevention and control of industrial
emissions; and (ii) the prevention and recycling of waste, as well as the influence of (iii)
various other legislative and policy measures.
The analysis covers, with varying degree of detail, all the three categories of regulatory
costs considered in this Study, namely: (i) compliance costs, i.e. the costs incurred for
fulfilling the substantive obligations spelled out in EU legislation (e.g. the respect of certain
emission limits); (ii) administrative costs, comprising the costs incurred to fulfil the
administrative obligations stipulated in the legislation (e.g. the costs for obtaining an
environmental permit); and (iii) indirect costs, which refer to the costs incurred by
steelmakers as a result of environmental protection measures that affect other operators
along the value chain.
This Section is structured as follows: (i) Section 10.2 reviews the main pieces of relevant
legislation, with an assessment of the implications for the steel industry; (ii) Section 10.3
presents an estimate of compliance costs; (iii) Section 10.4 deals with administrative costs;
(iv) Section 10.5 elaborates on indirect costs.
10.2 Review of relevant legislation
10.2.1 Prevention and control of industrial emissions
Overview
The Industrial Emission Directive (IED)188 is currently the main piece of EU
legislation in the area of industrial emissions. IED applies an integrated pollution
prevention and control (IPPC) framework for industrial activities in the EU and
accordingly it ―lays down rules designed to prevent or, where that is not practicable, to
reduce emissions into air, water and land and to prevent the generation of waste, in order
to achieve a high level of protection of the environment taken as a whole‖ (art. 1). The IED
is the successor of the IPPC Directive of 1996 (IPPCD) which first introduced a set of
188 Directive 2010/75/EU of the European Parliament and of the Council on industrial emissions (integrated
pollution prevention and control).

Page 187 out of 259
common rules for the permitting and controlling of industrial installations.189 However, the
IED also recasts six other pieces of EU legislation concerning industrial emissions,190
thereby providing for a comprehensive regulatory framework applicable to all industrial
activities in the EU. The IED also applies to large combustion plants (LCP), i.e. thermal
power plants with a total rated capacity of 50 MW or more. Agreed in late 2010, the IED
entered into force on 6 January 2011 and was to be transposed into national legislation by
Member States by 7 January 2013.191 Upon transposition, IED provisions will become
applicable from 7 January 2014 for existing industrial installations and from 1 January
2016 minimum requirements for LCPs will come into effect.
Key Provisions
The IED (as well as the previous IPPCD) is based on the principle that operators of
industrial installations must obtain an integrated environmental permit from the
competent Member State authorities. Permits are to specify the applicable Emission Limit
Values (ELVs), based on the so called Best Available Techniques (BATs). The BATs and the
associate emission levels applicable to the various lines of business covered by the
Directive are to be specified in technical documents, the so called BAT Reference
Documents (BREF), whose conclusions are formally adopted by the Commission through
an Implementing Decision (the so called ―BAT Conclusions‖).192 The IED does provide for
some flexibility in the implementation of emission limits and national authorities are
allowed to set less strict ELVs under certain circumstances, notably when ―the achievement
of emission levels associated with the best available techniques as described in BAT
conclusions would lead to disproportionately higher costs compared to the environmental
benefits‖ (art. 15.4) as a result of the local environment, geographical location or technical
characteristics of the installation.193 However, the minimum ELV set directly in the
Annexes to the IED cannot be derogated. In order to ensure effective implementation, the
IED includes provisions regarding the monitoring of emission levels and the
carrying out of environmental inspections, to take place at least every one to three
years, depending upon the level of risk. Furthermore, in the case of plant closures, the IED
189 Council Directive 96/61/EC concerning integrated pollution prevention and control (IPPC).
190 The six recast Directives include (i) the three Titanium Dioxide Directives (78/176/EEC, 82/883/EEC and
92/112/EEC on waste from the titanium dioxide industry); (ii) the Volatile Organic Compounds (VOC)
Solvents Directive (99/13/EC); (iii) the Waste Incineration Directive (2000/76/EC); and (iv) the Large
Combustion Plants (LCP) Directive (2001/80/EC).
191 The majority of Member States did not transpose (or only partially transposed) the directive by the
deadline of 7 January 2013. For details, see
http://ec.europa.eu/environment/air/pollutants/stationary/ied/transposition.htm.
192 The BATs are to be developed through ―an exchange of information‖ involving all the stakeholders and
coordinated by the European IPPC Bureau of the Institute for Prospective Technology Studies (IPTS) at
the EU Joint Research Centre (JRC) in Seville (Spain).
193 Additional, temporary elements of flexibility are provided for the LCPs, in particular through the
application of Article 32 on Transitional National Plans and Article 33 concerning limited life derogations.
Page 188 out of 259
envisages the adoption of remediation measures in order to return the site to the
status quo ante.
Relevance for the Steel Industry
The IED applies to all the installations of the steel industry, irrespective of the
technology adopted (BOF or EAF), from the production or preparation of key inputs
(production of coke, sintering) through the production of finished products,194 as well as to
the power plants included in integrated steel mills. All these facilities are (i) required to
obtain a permit (or to renew the existing permit within specified deadlines) based on the
emission limits associated with the BATs (the so called BATAELs); (ii) subject to
monitoring and inspection requirements; and (iii) required to adopt the other measures
specified in the IED (e.g. on the closure of sites).
The main reference documents for the emission levels applicable to the steel industry are
the Iron and Steel Production BREF, which covers the preparation of raw materials
and the steel making process ―proper‖ (sinter plants, pelletisation plants, coke ovens, blast
furnaces, BOF/EAF mills, continuous casting)195 and the Ferrous Metals Processing
Industry BREF, which covers downstream processes (hot and cold rolling, wire plants,
coating, galvanization).196 Other BREFs partly applicable to the steel industry include the
BREF for LCP197 and the BREF for some cross-industry activities, such as the storage and
handling of materials and the cooling systems.
The BREF identify a series of BATs for the prevention or minimization of pollution
applicable to the various stages of the steel production process. These BATs concern the
introduction of certain technologies for pollution abatement (typically, in the form
of end-of-pipe devices) and/or the modification of production processes (e.g.
through a modification in the composition of inputs) and/or the adoption of enhanced
process control methods of a general (e.g. the implementation of environmental
194 According to Annex I, the Directive is applicable to (i) production of coke, (ii) metal ore (including sulphide ore) roasting or sintering (iii) production of pig iron or steel (primary or secondary fusion) including continuous casting, with a capacity exceeding 2,5 tonnes per hour, (iv) operation of hot-rolling mills with a capacity exceeding 20 tonnes of crude steel per hour, (v) application of protective fused metal coats with an input exceeding 2 tonnes of crude steel per hour, and (vi) surface treatment of metals using an electrolytic or chemical process where the volume of the treatment vats exceeds 30 m3.
195 European Commission, Best Available Techniques (BAT) Reference Document for Iron and Steel
Production, 2013. Adopted in 2012, this BREF replaces an earlier document developed in 2001 in the
framework of IPPC Directive.
196 European Commission, Reference Document on Best Available Techniques in the Ferrous Metals
Processing Industry, December 2001. This BREF, developed with reference to the IPPC Directive, is
currently under revision.
197 European Commission, Reference Document on Best Available Techniques for Large Combustion Plants,
July 2006. This BREF is also currently under revision, and the process started in early 2012. The LCP
associated with steel plants are different from other LCP, as they typically ran on gases recovered from the
steel production process. For this reason, the LCP BREF under revision is expected to devote a special
section on LCP in the steel industry.

Page 189 out of 259
management systems) or specific nature (e.g. the adoption of measures to control fugitive
emissions). Given the nature of the steel making process, the BATs largely focus on the
prevention and control of air emissions, with special emphasis on the emissions of dust
(particulate matter, PM), nitrogen oxides (NOx), sulphur oxides (SOx). However, in line
with the integrated approach inspiring the IED, the BATs also concern water consumption
and the treatment of effluent water, the minimization of waste generation, energy
consumption and re-utilization, and noise control. The techniques listed and described in
the BAT conclusions are neither prescriptive nor exhaustive and other techniques may be
used that ensure at least an equivalent level of environmental protection. The emphasis
placed on the various sources of pollution and environmental protection aspects varies
across the stages of production, as shown in Table 35 below.
Table 35 Focus of BATs concerning the various stages of the production process
Installations/Steps in the production process
Air Emissions Effluent water
Waste generation
Energy utilization
Noise control Dust NOx SOx Other
Sinter plant
Pelletisation plant
Coke oven plant
Blast furnace
Basic oxygen furnace (BOF)
Electric arc furnace (EAF)
Hot rolling mill
Cold rolling mill
Wire drawing mill
Hot dip coating line
Galvanizing line
10.2.2 Waste Prevention and Recycling
Overview
EU policy on waste is set out in the Thematic Strategy on Waste Prevention and
Recycling198 and is embodied in various pieces of horizontal and product/waste-specific
legislation. Legislation particularly relevant for this Study include: (i) the Landfill
Directive;199 (ii) the Waste Framework Directive;200 (iii) the Scrap Metal Regulation;201 (iv)
198 Communication from the Commission, Taking sustainable use of resources forward: A Thematic Strategy
on the prevention and recycling of waste, COM(2005)666-
199 Council Directive 1999/317EC of 26 April 1999 on the landfill of waste.
200 Directive 2008/98/EC of the European Parliament and of the Council on waste and repealing certain
Directives.

Page 190 out of 259
the Waste Shipment Regulation;202 and (v) the End of Life Vehicles Directive.203 Approved
in 1999 and amended in 2003 and 2008, the Landfill Directive is intended to prevent
or reduce the adverse effects of the landfill of waste on the environment. To this effect, the
Directive defines the various categories of waste and sets the requirements for the
establishment and operations of landfills. Approved in late 2008, the Waste
Framework Directive (WFD) sets the basic concepts and definitions related to waste
management and lays down basic waste management principles. It also sets recycling and
recovery targets for certain waste materials, to be achieved by 2020. To this effect, the
Directive requires Member States to adopt waste management plans and waste prevention
programs. The WFD was to be transposed by Member States by 12 December 2012, but
delays were experienced in several countries. Closely connected to the WFD is the Scrap
Metal Regulation, which, building upon provisions in the WFD (article 6), determines
the criteria under which scrap metal ceases to be regarded as a waste. The Waste
Shipment Regulation (WSR) seeks to prevent and control environmental and health
hazards in relation to shipments of waste both within the EU and between the EU and
third countries, strengthening the provisions of previous legislation dating back to the
early 1990s. Approved at the end of 2006, the WSR entered into force on 12 July 2007.
Finally, the End of Life Vehicles Directive (ELVD) aims at reducing the waste arising
from end-of-life vehicles and covers various aspects along the life cycle of vehicles as well
as aspects related to treatment operations (e.g. prevention of the use of certain heavy
metals, collection of vehicles at suitable treatment facilities, etc.). Approved in 2000, the
ELV was to be transposed by 21 April 2002.
Key Provisions
The Landfill Directive lays down the criteria for the permitting of landfill operations as
well as the waste acceptance procedures and, in line with the polluter pays principle,
requires that fees for landfilling adequately reflect investment and operating costs. The
WFD includes a number of provisions concerning the measures to be put in place by
Member States in order to achieve the recycling and recovery targets. Regarding operators,
the WFD reiterates earlier provisions regarding the permitting of waste management
operations and the registration of waste collectors, transporters and brokers and requires
Member States to strengthen inspection mechanisms so as to ensure compliance. The
Scrap Metal Regulation specifies the criteria under which scrap iron and steel may
benefit from the so called ―end-of-waste‖ status and sets the requirements that have to be
fulfilled by operators (statement of conformity and quality management system). The
WSR envisages a mechanism for the notification of shipments of waste and reiterates
earlier bans on the export of waste outside the EFTA countries as well as on the export of
hazardous waste to non-OECD countries. In order to ensure compliance, Member States
201 Council Regulation (EU) No 333/2011 establishing criteria determining when certain types of scrap metal
cease to be waste under Directive 2008/98/EC of the European Parliament and of the Council.
202 Regulation (EC) No 1013/2006 of the European Parliament and of the Council on shipments of waste.
203 Directive 2000/53/EC of the European Parliament and of the Council on end-of life vehicles.

Page 191 out of 259
are required to perform inspections of establishments and spot checks of shipments. The
ELVD sets targets for the re-use, recycling and other forms of recovery of end-of-life
vehicles. To this effect, the Directive: (i) establishes requirements for waste prevention and
for the collection of vehicles; (ii) sets environmental standards for treatment; and (iii)
requires Member States to establish a system for the permitting of treatment facilities
(with the possibility of derogation in certain cases).
Relevance for the Steel Industry
The piece of EU waste legislation having the most immediate impact on the steel industry
is the Scrap Metal Regulation. In fact, by effectively removing iron and steel scrap
from the list of materials regarded as waste, the Regulation frees operators from the
substantive and administrative obligations applicable under the WFD. This, together with
the provisions aimed at enhancing the re-use and recycling of end-of-life vehicles under
the ELVD, is meant to increase the availability of a crucially important raw material for the
steel industry. At the same time, the ―end-of-waste‖ status granted to iron and steel scrap
makes it possible to export scrap to third countries, which at times may have a negative
effect on the availability of scrap in the EU market (see Section 10.5 below).
10.2.3 Other Environmental Policy Measures
Overview
Other pieces of environmental legislation listed in the TOR for the study include (i) the Air
Quality Framework Directive;204 (ii) the Water Framework Directive;205 and (iii) the
Roadmap to a Single European Transport Area (Transport Roadmap)206. Approved in
2008, the Air Quality Framework Directive merged four directives and one Council
decision into a single measure, providing a coherent framework for the improvement of air
quality in the EU. To this effect, the Directive sets standards and target dates for reducing
concentrations of fine particles. Adopted in 2000, the Water Framework Directive
also consolidates previous EU legislation on water, with the aim of achieving the ‗good
ecological and chemical status‘ of ground and surface waters. Adopted in early 2011, the
Transport Roadmap is a strategic document proposing a series of initiatives aimed at
building a competitive transport system, capable of increasing mobility, supporting growth
and employment, and reducing environmental impacts of transport activities. With
reference to environmental policy, of particular relevance for this Study is the proposal to
cut shipping emissions that was the subject of a Communication on maritime
204 Directive 2008/50/EC of the European Parliament and of the Council of 21 May 2008 on ambient air
quality and cleaner air for Europe.
205 Directive 2000/60/EC of the European Parliament and of the Council of 23 October 2000 establishing a
framework for Community action in the field of water policy.
206 Commission White Paper - Roadmap to a Single European Transport Area – Towards a competitive and
resource efficient transport system, 28.3.2011, COM(2011)144.
Page 192 out of 259
emissions207 and was translated into a Commission Proposal for amending the 1999
Directive on the sulphur content of marine fuels.208
Key Provisions
The Air Quality Framework Directive and the Water Framework Directive
provide the general framework for environmental protection in the respective domains.
They include a number of provisions concerning the measures to be put in place by
Member States in order to achieve the intended objectives, including the development of
national plans or strategies and the establishment of appropriate surveillance and
enforcement mechanisms. In addition, as in the case of the Landfill Directive, the Water
Framework Directive requires the full cost recovery for water services, in line with the
polluter pays principle. The measures on shipping emissions envisaged by the Transport
Roadmap and subsequent Commission initiatives are largely linked to the
International Convention for the Prevention of Pollution from Ships (MARPOL),209 that
was amended in 2008 to introduce new international standards for marine diesel engines
and their fuels and more stringent emission requirements for ships that operate in
designated coastal areas where air quality problems are acute.210 In particular, the
Commission is proposing to cut maritime transport‘s CO2 emissions (―overall, the EU CO2
emissions from maritime transport should be cut by 40% (if feasible 50%) by 2050
compared to 2005 levels‖, Transport Roadmap, page 8) and to reduce air pollution at sea,
namely in terms of SO2 emissions.
Relevance for the Steel Industry
The Air Quality Framework Directive has limited direct relevance for the steel
industry, as the key parameters for air quality are incorporated in the legislation on the
prevention and control of industrial emissions. Similar considerations apply to the Water
Framework Directive, although in this case the relationship with the EU legislation on
industrial emissions is more intricate.211 As for the Transport Roadmap, the measures
207 Communication from the Commission on the review of the implementation of Directive 1999/32/EC
related to the Sulphur Content of Certain Liquid Fuels and on further pollutant emission reduction from
maritime transport, 15.7.2011, COM(2011)441.
208 Proposal for a Directive of the European Parliament and of the Council amending Directive 1999/32/EC
as regards the sulphur content of marine fuels, 15.7.2011, COM(2011)439.
209 For short presentation of the MARPOL, see http://www.imo.org/about/conventions/listofconventions/
pages/international-convention-for-the-prevention-of-pollution-from-ships-(marpol).aspx.
210 For a summary presentation of the 2008 amendments to MARPOL see Environmental protection Agency,
International Maritime Organization Adopts Program to Control Air Emissions from Oceangoing Vessels,
October 2008.
211 The coordination between the Water Framework Directive and the Industrial Emissions Directive is the
subject of the project ―Linking the Water Framework Directive and IPPC/IED Directive‖ managed by the
European Union Network for the Implementation and Enforcement of Environmental Law (IMPEL). For
more information, see http://impel.eu/projects/linking-the-water-framework-directive-and-ippcied-
directive-phase-3.

Page 193 out of 259
envisaged for maritime transport could have a more significant, albeit indirect, influence
on steel makers operating conditions, as the setting of more stringent limits to shipping
emissions is expected to reverberate on shipping rates and, therefore, on the cost of
imported raw materials.
10.3 Assessment of Compliance Costs
10.3.1 Introduction
Compliance costs refer to the costs incurred by steelmakers for fulfilling the substantive
obligations spelled out in EU legislation in terms of prevention and control of air
emissions, effluent waters, waste generation, etc. This Section provides an assessment of
compliance costs for the steel industry over the 2003 – 2010 period. Three categories of
compliance costs are considered, namely: (i) investment costs, i.e. the resources
invested in the retrofitting of plants (e.g. the installation of selective catalytic reduction
equipment to reduce NOx emissions in sinter plants) and/or in the adoption of more
environmentally-friendly technologies; (ii) financial costs, represented by the
opportunity cost of the capital invested or by the interest charges paid in case of
borrowing; and (iii) operating costs, which include the incremental expenses associated
with environmental protection investments (e.g. for the maintenance of new equipment or
facilities) and/or the implementation of other environmental protection measures (such as
the incremental expenses associated with the use of higher quality raw materials, e.g. the
use of more expensive low nitrogen content fuel or the replacement of coke breeze with
anthracite).
10.3.2 Investment Costs
Introduction
In principle, the assessment of investment costs would require the identification of capital
expenditures incurred by each steel maker (actually, by each steel making plant) in
connection with specific pieces of EU environmental legislation. In practice, this would
require the detailed review of investment plans of all EU steelmakers for the period under
consideration, as well as an appreciation of the influence of EU legislation on investment
and operational decisions. Such a detailed costing exercise is obviously impossible within
the stringent time limits for this study and, even if enough time were allowed, it would in
all likelihood be unfeasible because of confidentiality considerations. Useful elements were
collected during interviews with selected steelmakers, but the limited number of these
interviews and the considerable variation in operating conditions do not allow
extrapolating the findings to the universe of the EU steel industry. Therefore, following the
example of earlier studies,212 in order to provide a comprehensive picture of compliance
212 See VITO, Sectoral Costs of Environmental Policy, December 2007

Page 194 out of 259
costs it is necessary to adopt a more aggregate approach, with recourse to industry
statistics and other secondary sources.
There are two main sources of data on investments in environmental protection, namely:
(i) the Enquiry on Investments in the Iron and Steel Industry (―Steel Survey‖); and (ii) the
survey of Environmental Protection Expenditure by environmental domains (―EPE
Survey‖). Both surveys have been implemented by national statistical offices with the
coordination of Eurostat, but present significantly different features. In particular:
- The Steel Survey was carried out over the 2003 – 2008 period on the basis of an
EU Regulation adopted following the expiry of the ECSC Treaty.213 The survey focuses
exclusively on investments implemented by the steel industry narrowly defined (i.e.
defined as Group 27.1 of the NACE Rev. 1.1, which corresponds to the NACE Rev. 2
Group 24.1). The survey collected data on investments implemented at the various
stages of the production process (from coking plants through coating installations),
with an indication of investments on environmental protection;
- The EPE Survey is carried since the late 1990s, in the framework of the surveys on
Structural Business Statistics (SBS).214 The survey covers both investment and
operating expenses incurred by enterprises, subdivided in different environmental
domains (e.g. protection of ambient air and reduction of CO2 emissions, waste
management, etc.). Unlike the case of the Steel Survey, data from the EPE are
available at the NACE ―2-digit‖ level only, i.e. for the whole Manufacture of Basic
Metals (NACE Rev. 1.1 Group 27 and NACE Rev. 2 Group 24).
The following points are worth noting:
- Given the different sector coverage, the Steel Survey and the EPE Survey yield
different values for environmental protection investments, with EPE Survey values
typically greater (sometimes much greater) than those for the Steel Survey. For the
purpose of this exercise, Steel Survey data are used to develop a “lower
bound” estimate, while EPE Survey data are used to develop an “upper
bound” estimate;
213 Regulation (EC) No 48/2004 of the European Parliament and of the Council on the production of annual
Community statistics on the steel industry for the reference years 2003-2009. The Regulation also
required the collection of data on fuel and energy consumption, electricity use, iron scrap, and production
capacity. For an overall presentation of the data collected in the framework of Regulation 48/2004, see
http://epp.eurostat.ec.europa.eu/statistics_explained/index.php/Iron_and_steel_production_and_proc
essing_statistics_-_NACE_Rev._1.1.
214 The extension of SBS to encompass expenditure on environmental protection was stipulated by Council
Regulation (EC, EURATOM) No 58/97 concerning structural business statistics, subsequently replaced by
Regulation (EC) No 295/2008 of the European Parliament and of the Council concerning structural
business statistics (recast). For an overview of data from the EPE Survey see
http://epp.eurostat.ec.europa.eu/statistics_explained/index.php/Environmental_protection_expenditur
e#Environmental_protection_expenditure_by_industry.

Page 195 out of 259
- Survey data refer to environmental protection investments in all the environmental
domains, i.e. ambient air, waste prevention and treatment, noise reduction, etc.
including investments aimed at reducing CO2 emissions. Therefore, the
analysis presented here complements the analysis of the ETS presented in Section 7
above;
- Survey data include all environmental protection investments, irrespective of their
motivation, i.e. irrespective of whether they were undertaken: (i) independently by
steel makers based on cost savings considerations (as it is the case for certain energy
efficiency measures); (ii) in order to comply with EU legislation; or (iii) in order to
comply with national legislation. As a result, survey data structurally
overestimate the magnitude of compliance costs related to EU
environmental legislation. While it is often possible to qualitatively assess the
relative influence of EU legislation, it is impossible to precisely separate costs linked
to ―spontaneous‖ investment decisions from ―true‖ compliance costs and to apportion
compliance costs between EU and national legislation. As a result, the magnitude of
compliance costs linked to EU legislation was assessed under different hypothetical
scenarios, following a sort of ―sensitivity analysis‖ logic;
- In both surveys there are some gaps in the datasets, sometimes due to sheer lack of
data, sometimes because of confidentiality considerations (which, in turn, are linked
to the small number of steel makers in operation in some Member States). However,
it was possible to estimate the missing values and to extrapolate the
time series for a subset of seven Member States (Austria, Belgium, France,
Germany, Italy, Spain and the United Kingdom), that account for almost three
fourths (72-73%) of total EU steel output. 215 The values for these seven countries
were subsequently extrapolated to the whole EU steel sector, using data on
physical output (crude steel).
Box 3 Data Validation
Data from the Steel and EPE Surveys were compared with other available information in order to verify their
accuracy. In the case of Germany, EU largest steel producer, survey data were compared with figures on
environmental protection investments for the period 2003 - 2009 kindly provided by the Stahlinstitut
(VDEh).216 VDEh data do differ from the Steel and EPE survey data, but – with the exception of only one year
- they nonetheless fall between the lower and upper bounds retained for the analysis. In the case of Italy, the
EU second largest steel producer, the accuracy of the data used in the analysis is suggested by the fact that
the Steel Survey is carried out by ISTAT in close collaboration with Federacciai and, indeed, data from the
215 In some cases, gaps were filled through the use of national statistics. In other cases, values were estimated
through extrapolation/interpolation, taking into account the proportion between the relevant variable
(e.g. environmental protection investments) with some other related variable (e.g. total investments in the
industry, as derived from SBS).
216 Personal communication on 28 May 2013. VDEh data are presented in Annex 2.

Page 196 out of 259
Steel Survey figure prominently in Federacciai‘s publications.217 Survey data were also cross checked for
consistency with the information on investments retrieved during interviews with selected steelmakers.
While there are some variations, the values of environmental investments made by the individual companies
are usually compatible with survey data for the respective countries.218 Overall, while some margins of
uncertainty inevitably remain, the figures on environmental investments retrieved from the EUROSTAT
appear to provide a reasonably accurate picture of the level of effort made by the steel industry in the area on
environmental protection.
Main Trends in Environmental Protection Investments
Over the 2003 – 2010 period, the total value of environmental protection
investments made by the EU steel industry range between € 3.6 b in the Steel
Survey (lower bound estimate) and € 5.8 billion in the EPE Survey (upper bound
estimate). ―Lower bound‖ annual values range from a minimum of € 305 mln to a
maximum of € 640 mln while ―upper bound‖ figures range between € 540 mln and € 1,120
mln. Irrespective of the source used, environmental protection investments
account for 5-9% of total investments in the steel industry. A summary
presentation is provided in Figure 59 below.
Figure 59 Environmental protection investments – EU 27, 2003-2010 (€ mln)
Source: Authors‘ elaborations and estimates on EUROSTAT and national statistics
217 Federacciai, Rapporto Ambientale 2011, presented at the 2012 annual meeting (see in particular pages 25
and 36).
218 In practice, for each of the companies interviewed, the consistency check involved the comparison of two
ratios, i.e. the company share of national environmental investments and the company share of national
output expressed in tonnes of crude steel.
0
200
400
600
800
1,000
1,200
2003 2004 2005 2006 2007 2008 2009 2010
0%
1%
2%
3%
4%
5%
6%
7 %
8%
9%
10%
Lower Bound Upper Bound
Lower Bound - Share of Total Investment Upper Bound - Share of Total Investment

Page 197 out of 259
Regarding the nature of investments, according to data from the EPE Survey, the so called
“end-of-pipe” measures account for the bulk of capital expenditure, on average
about 73%, while investments linked to cleaner technology, the so called ―integrated
technology‖ investments, still play a marginal role. However, integrated technology
investments have progressively gained ground over time (27% in 2010, compared with
20% in 2003). In terms of environmental domains, the majority of investments
concern the protection of ambient air, including the reduction of CO2
emissions, which on average account for about 54% of the total, compared with 18% for
waste water management, 13% for waste management and 15% for other domains. A
summary presentation is provided in Figure 60 and Figure 61 below.
Figure 60 Breakdown of environmental protection investments per typology of investment –
Selected Countries, 2003-2010
Source: Authors‘ elaborations on EUROSTAT data (EPE Survey)
0%
1 0%
20%
30%
40%
50%
60%
7 0%
80%
90%
1 00%
2003 2004 2005 2006 2007 2008 2009 201 0
integrated
technology
end-of-pipe

Page 198 out of 259
Figure 61 Breakdown of environmental protection investments per environmental domain –
Selected Countries, 2003-2010
Source: Authors‘ elaborations on EUROSTAT data (EPE Survey)
Investment Costs per Unit of Output
In order to provide an idea of the impact of investments in environmental protection on
steelmakers‘ operating conditions, data on total investments were transformed in annual
values, considering an average life of the assets of 20 years, which is a fairly typical value in
the steel making industry, and then expressed in terms of value per unit of output. In the
―lower bound‖ scenario, annual investment costs (i.e. the value of the annual capital
charges in the form of depreciation values) range from € 0.08/tonne to € 0.19/tonne, with
a tendency to increase overtime. In the ―upper bound" scenario, annual values are more
than 50% higher, ranging between € 0.13/tonne and € 0.28/tonne. According to Steel
Survey data, average values for the period range are aligned around € 0.07-0.08/tonne for
Belgium, France and Germany, while significantly higher values (between € 020-
0.23/tonne) are found in the case of Austria, Italy and Spain. However, annual figures
provide only a partial indication of the impact of environmental investments on
steelmakers‘ operations, as investments made in previous years continue to affect financial
accounts until they are fully depreciated. Therefore, in order to provide a comprehensive
view of the effects, annual values for the eight years analyzed were cumulated. The
cumulated investment costs at the end of 2003 – 2010 period range between € 1.04/tonne
in the ―lower bound‖ scenario and € 1.68/tonne in the ―upper bound‖ scenario. A summary
presentation is provided in Figure 62 below.
0%
1 0%
20%
30%
40%
50%
60%
7 0%
80%
90%
1 00%
2003 2004 2005 2006 2007 2008 2009 201 0
Other domains
Waste management
Wastewater
management
Protection of ambient
air and climate

Page 199 out of 259
Figure 62 Annual and cumulated investment costs - EU27, 2003-2010 (€/tonne)
Source: Authors‘ elaborations and estimates on EUROSTAT and national statistics
10.3.3 Financial Costs
The financial costs incurred by steel makers in connection with
environmental protection investments depend upon a variety of factors, such
as the financing modalities adopted (i.e. the combination of debt and equity), the status
and financial conditions of the investor (in the case of bank lending, large corporations are
typically charged more favourable interest rates than SMEs) and the prevailing conditions
in the relevant financial markets (which vary across countries and overtime). In the
framework of this exercise, it is obviously impossible to take into account all the possible
influencing factors and it is therefore necessary to resort to some ―average‖ parameters.
Therefore, financial costs have been estimated assuming that environmental
protection investments were entirely financed through bank loans, carrying
an interest rate of 5% and with a maturity of 10 years. While certainly an
approximation, these parameters are aligned with available information regarding
prevailing conditions in the EU financial markets in the years covered by our analysis.219
As in the case of investment costs, the financial costs linked to the environmental
protection investments implemented in each of the eight years covered by the analysis
219 For instance, according to ECB data, over the 2003 – 2010 period, average lending rates in key steel
producing countries ranged between 4% in Spain and France and 4.6% in Germany, with Italian
borrowers paying 4.3%. Considering the less favourable credit conditions in other Member States
(especially New Member States), a 5% interest rate appears as a reasonable assumption. ECB data refer to
―loans other than revolving loans and overdrafts, convenience and extended credit card debt‖, with a
maturity of over 1 year, worth more than € 1 million, and irrespective of the presence of a guarantee or
collateral. Loans with longer durations (such as the 10 years envisaged in our exercise) were probably
more expensive (no data are available), but this was in all likelihood offset by the presence of collateral,
that steel makers do not seem to have problems in providing.
0.00
0.20
0.40
0.60
0.80
1.00
1.20
1.40
1.60
1.80
2003 2004 2005 2006 2007 2008 2009 2010 Cumulated
Costs
Lower Bound
Upper Bound

Page 200 out of 259
range were calculated per tonne of crude steel. Annual financial costs range from €
0.08/tonne to € 0.19/tonne in the ―lower bound‖ scenario and from € 0.13/tonne and €
0.28/tonne in the ―upper bound‖ scenario. The cumulated financial costs at the end
of the period are estimated at € 0.71/tonne in the “lower bound” scenario
and € 1.12/tonne in the “upper bound” scenario. A summary presentation of
results is provided in Figure 63 below.
Figure 63 Annual and cumulated financial costs - EU27, 2003-2010 (€/tonne)
Source: Authors‘ elaborations and estimates on EUROSTAT and national statistics
10.3.4 Operating Costs
Available statistical sources are of limited value for estimating the operating costs linked to
environmental protection measures. Data on environmental current expenditures are
collected though the EPE survey, but the dataset presents some peculiarities that limit its
usefulness for the purpose of the study. The same applies to data on environmental
expenditures calculated by some steel companies that appear to be based on very broad
definitions.220
Based on the above considerations, the operating costs (OPEX) of environmental
protection interventions implemented by steel makers were estimated ‗indirectly‘, as a
share of investment costs (CAPEX). The ratio OPEX/CAPEX retained for the
analysis is 15% and was estimated based on the three sources of information, namely (i)
operational data for a sample of abatement/control technologies applicable to various
stages of the steel making process, selected among the BATs included in the 2012 BREF;
(ii) data on operating costs for some abatement/control technologies incorporated in the
220 For a discussion of these issues please refer to Annex 2.
0.0
0.2
0.4
0.6
0.8
1.0
1.2
2003 2004 2005 2006 2007 2008 2009 2010 Cumulated
Costs
Lower Bound
Upper Bound

Page 201 out of 259
GAINS model;221 and (iii) information retrieved from selected steel makers during
interviews. In the case of BATs, the ratio OPEX/CAPEX varies significantly, from little
more than 2% to over 40%, but in the majority of cases the ratio is lower than 10%.222
Lower OPEX/CAPEX ratios, typically in the 4% to 6% range, were found in the case of
GAINS. However, this reflects the inclusion of only fixed operating and maintenance
expenditures, which obviously understates the total value of operating expenses.223 Higher
OPEX/CAPEX ratios, typically in the 10% to 20% range, were found in the case of specific
investments implemented over the last few years or currently under consideration by the
steel makers interviewed.224 More generally, interviewees indicated average OPEX/CAPEX
ratios in the 10% to 20% as realistic values (see Box 4 below), which eventually led to
retain the 15% midpoint value for our analysis.
Box 4 Excerpts from Interviews with Selected Steelmakers
―A 10% OPEX/CAPEX ratio is indeed a reasonable proportion, maybe on the lower side‖
―Environmental OPEX are difficult to estimate, as they depend on the installation, but they can be assessed
to represent 15-20% of CAPEX‖
―In general, annual OPEX represent between 10% and 15% of CAPEX‖
As in the case of other components of compliance costs, OPEX were expressed in terms of
unit of output. Annual operating costs range from € 0.24/tonne to € 0.56/tonne in the
―lower bound‖ scenario and from € 0.40/tonne to € 0.85/tonne in the ―upper bound‖
scenario. In order to assess the overall impact on steel makers‘ operating conditions,
operating costs also have to be cumulated over the period, as the operating costs related to
investments made in a certain year continue to be incurred also in subsequent years. The
cumulated operating costs at the end of the period are estimated at € 3.12/tonne in the
“lower bound” scenario and € 5.03/tonne in the “upper bound” scenario. A summary
presentation of results is provided in Figure 64 below.
221 The GAINS (Greenhouse gas - Air pollution Interactions and Synergies) model was developed by the
International Institute for Applied Systems Analysis (IIASA) and is used to assess the impact of
environmental policies. To this effect, the model incorporates cost data for a selection of control
technologies applicable to various sectors, including the steel industry.
222 For details, please refer to Annex 2.
223 See Klimont Z. and others, Modelling Particulate Emissions in Europe - A Framework to Estimate
Reduction Potential and Control Costs, Interim Report IR-02-076. Data refer only to control technologies
for particulate matter.
224 For details, please refer to Annex 2.

Page 202 out of 259
Figure 64 Annual and cumulated operating costs - EU27, 2003-2010 (€/tonne)
Source: Authors‘ elaborations and estimates on EUROSTAT and national statistics
10.3.5 Compliance Costs related to EU Legislation
The cumulated costs incurred by EU steelmakers for the implementation of environmental
protection measures over the 2003 – 2010 period are summarized in Table 36 below.
Table 36 Summary of Cumulated Environment Protection Costs, 2003 – 2010 (€/tonne)
Item Lower Bound Estimate Upper Bound Estimate
Investment Costs 1.04 1.68
Financial Costs 0.71 1.12
Operating Costs 3.12 5.03
Total 4.87 7.83
It is impossible to precisely determine the share of environmental protection costs directly
attributable to EU legislation as many factors are at play. On the one hand, there are clear
signals that EU legislation has been a major driver of environmental protection
investments in some countries. For instance, the higher than average (and raising
overtime) investment costs incurred by Spanish steelmakers can be largely linked to the
progressive implementation of the IPPC Directive, in a context where previous (national)
legislation on air emissions was fairly lax.225 On the other hand, some of the steelmakers
225 On this point, see the qualitative evidence presented in ifo Institute, Assessment of different approaches
to implementation of the IPPC Directive and their impacts on competitiveness, December 2006.
0.0
1.0
2.0
3.0
4.0
5.0
6.0
2003 2004 2005 2006 2007 2008 2009 2010 Cumulated
Costs
Lower Bound
Upper Bound

Page 203 out of 259
interviewed indicated that, at least until the approval of the 2012 BAT Conclusions, the
environmental protection standards implemented in their country were more stringent
than EU rules, which implies that an unknown but presumably significant share of costs
were linked to national legislation. Finally, the BATs adopted in 2001 include a number of
control measures that also have generally positive effects on the operations of steel plants
(e.g. through energy savings and/or lower use of certain materials), and therefore it
reasonable to assume that the environmentally beneficial investments made over the 2002
– 2010 were not exclusively motivated by regulatory compliance considerations.
Based on the above, compliance costs linked to EU environmental legislation can only be
assessed in an approximate manner. This was done by making reference to two scenarios.
In the first scenario, EU legislation is assumed to play a key role, accounting for 80% of
the costs incurred by steelmakers. In the second scenario, commercial considerations
(together, possibly, with national legislation) are assumed to play a comparatively greater
role in driving environmentally beneficial activities, and therefore only 50% of the costs
are considered to be linked to EU environmental (and climate change) legislation. The
results of this exercise are summarized in Table 37 below. In the case of the ―lower bound‖
estimate, cumulated compliance costs over the 2002 – 2010 period are in the order of €
2.4-3.9/tonne. The corresponding values for the ―upper bound‖ estimate are € 3.9-
6.3/tonne,
Table 37 Summary of Cumulated Compliance Costs of EU Environmental Legislation
(€/tonne)
Lower Bound Estimate Upper Bound Estimate
EU 50% EU 80% EU 50% EU 80%
Investment Costs 0.52 0.84 0.83 1.34
Financial Costs 0.35 0.56 0.57 0.90
Operating Costs 1.56 2.52 2.50 4.02
Total 2.44 3.92 3.90 6.26
Available sources do not allow assessing with any degree of precision the impact of EU
environmental legislation on steel producers using different technologies. However, there
are indications that BOF producers were comparatively more affected than their EAF
counterparts. Assuming that 70% of total environmental protection investments were
carried out in integrated plants, the cumulated compliance costs for BOF producers can be
‗guess estimated‘ to range between € 2.99/tonne (lower bound – EU 50% scenario) and €
7.70/tonne (upper bound – EU 80% scenario). The corresponding figures for EAF
producers are more than 40% lower, ranging between €1.70/tonne and € 4.37/tonne.

Page 204 out of 259
Table 38 Guess Estimate of Cumulated Compliance Costs incurred by BOF and EAF Producers
(€/tonne)
Lower Bound Estimate Upper Bound Estimate
EU 50% EU 80% EU 50% EU 80%
BOF Producers 2.99 4.81 4.79 7.70
EAF Producers 1.70 2.73 2.72 4.37
Overall Average 2.44 3.92 3.90 6.26
The above results clearly show that the magnitude of compliance costs varies significantly
depending upon the sources of data and the assumptions made about certain unobservable
factors. In order to allow for a comparison with the cost estimates derived in other policy
areas, average values have been calculated, taking the midpoint between the lower and
upper bound scenarios and assuming that EU legislation accounts for 65% of the costs.
Results were then extrapolated to 2012. The results of this exercise are summarized in
Table 39 below.
Table 39 Estimate of Average Cumulated Compliance Costs (€/tonne)
2003 – 2010 Period Extrapolation to 2012
Investment Costs 0.88 1.13
Financial Costs 0.59 0.61
Operating Costs 2.65 3.39
Total 4.13 5.13
BOF Producers 5.07 6.14
EAF Producers 2.88 3.35
10.4 Assessment of Administrative Costs
10.4.1 Introduction
Administrative costs are a fairly common occurrence in the area of environmental policy,
as many pieces of EU environmental legislation include provisions concerning the
registration, the notification or the permitting of certain activities, and the supply of data
or information for monitoring or policy making purposes. At the same time, the magnitude
of these administrative costs is often limited, especially when compared with key economic
variables of the steel industry, such as turnover or value added. Therefore, the analysis
presented here only focuses on focuses on the two areas that based on the mapping of
administrative obligations (see Annex 1), appear to be the main sources of administrative

Page 205 out of 259
costs for steel makers, namely: (i) the issuance/renewal of the Integrated Environmental
Permits (IEP) for steel plants; and (ii) the carrying out of inspections for checking
compliance with the conditions based on which the IEP was issued.
The following points are worth noting at the outset:
- Estimates of administrative costs show some variations across Member States, due to
structural differences in the regulatory approach adopted by competent authorities at
the national (sometimes, regional) levels as well as to widely different cost conditions.
Therefore, any analysis at the EU level inevitably involve an element of
approximation;
- In principle, the analysis of administrative costs should differentiate between costs
that are genuinely attributable to EU environmental legislation and costs that in all
likelihood would be incurred by enterprises in their normal course of business (the so
called ―business as usual‖ costs) and/or as a consequence of national legislation.
However, at the level of abstraction of this exercise, such a distinction is very difficult
to make and therefore all the administrative costs are attributed to EU legislation.
10.4.2 Estimate of Administrative Costs
Following standard practice, administrative costs incurred by steel makers were estimated
taking into account: (i) the number of operators required to fulfil the administrative
obligation (the ―population‖); (ii) the frequency of the relevant obligations (which can be
annual, semi-annual, etc.); and (iii) the expenses incurred for the relevant cost items (e.g.
personnel costs, fees, etc.). The parameters used in the analysis are presented in Box 5
below.226 All the values refer to the situation prevailing in the mid – late 2000s.
Box 5 Administrative Costs Linked to IEP and Inspections - Key Parameters
Issuance/Renewal of IEP
Population: the issuance/renewal of IEP concerns the whole steel industry, is estimated to include 25 BOF
plants and 150 EAF plants.
Frequency: the validity of IEP varies across Member States. In Italy, the duration ranges from 5 years to 8
years, the latter in the case of enterprises with EMAS certification. In Austria, Romania and The Netherlands,
the duration is 10 years and the same applies de facto to France. In Spain, Czech Republic and Slovakia, the
duration is 8 years. In Germany, Sweden, Poland and the United Kingdom, the duration is indicated in each
IEP, although in practice it appears to range between 6 and 10 years. In Belgium the duration is reportedly
between 15 to 20 years. Considering the duration of IEP in the main EU steel producing countries as well as
226 The parameters were derived from various secondary sources. The main sources utilized include ifo
Institute, Assessment of different approaches to implementation of the IPPC Directive and their impacts
on competitiveness, December 2006; VITO, Sectoral Costs of Environmental Policy, December 2007;
Confindustria, Valutazione comparativa della disciplina di Autorizzazione Integrata Ambientale a
livello europeo e nazionale: effetti sulla sviluppo industriale del paese, gennaio 2013; and DEFRA, Mid-
term review of the United Kingdom's implementation of the Pollution Prevention and Control
Regulations, April 2007.

Page 206 out of 259
the expected frequency in the revision of the BAT Conclusions, a duration of 8 years was assumed. In
practice, this means that over the 2003 – 2010 period analyzed, each steel plant had to renew its IEP.
Fees Payable to Competent Authorities: in Italy, fees for the issuance of IEP range from a minimum of
€ 5,000 for an EAF plant to more than € 150,000 for a BOF plant. In Germany, fees for EAF plants are in the
order of € 19,000, while in Spain fees for EAF plants range from € 1,500 to € 5,000. No fees are reportedly
charged in France. It is clear that in some MS fees constitute a non-negligible cost for steel makers. However,
EU legislation is totally silent in this respect and the level of fees is entirely determined by national
legislation. For this reason, fees payable to competent authorities are excluded from the calculation of
administrative costs.
Personnel Costs: personnel costs for the preparation and follow up of IEP applications vary considerably,
depending upon the national institutional setting and the organizational structure of applicants. Earlier
studies have found values ranging from € 5,000 up to more than € 100,000, with an average value of €
40,000. The latter value was retained for the analysis.
Consulting Fees: the preparation of applications for IEP often require the involvement of consultants for
the carrying out of studies. Again, values reported by firms vary considerably, from a few thousand Euros in
the case of basic technical services to more than € 200,000 for full fledged environmental impact analyses,
with an average of € 70,000. Considering the different complexity of authorization dossiers for EAF and BOF
plants, for the purpose of this exercise two different values were retained, namely € 70,000 for EAF plants
and € 150,000 for BOF plants.
Inspections for Compliance Checking
Population: inspections for compliance checking concern the whole steel industry. Data on the population
are the same as those used for the issuance of IEP, i.e. 25 BOF plants and 150 EAF plants.
Frequency: the frequency of inspections for checking compliance with the conditions specified in IEP
varies between one and four years, with some differences at the sub-national level (namely in Germany and
Italy) and with a tendency to increase overtime. For the purpose of the exercise, 1 inspection/year was
assumed in the case of BOF, while 1 inspection every two years were assumed in the case of EAF.
Personnel Costs: personnel costs incurred in the case of compliance inspections may vary significantly
depending upon the circumstances in which inspections take place (i.e. whether there are problems or not).
Considering an average duration of three days (plus a similar time for preparation and follow up) and the
involvement of four technical employees (costing an average € 60,000/year), personnel costs can be
estimated at some € 9,000 per inspection.
Based on the above parameters, administrative costs for an IEP issuance/renewal can be
estimated at about € 110,000 for an EAF and € 190,000 for a BOF. Costs connected to
inspections are estimated at some € 9,000 per inspection. Total administrative costs
incurred by the steel industry can be estimated at nearly € 25 mln, of which
little more than € 23 mln for the issuance/renewal of IEP and almost € 2 mln for
compliance inspections. Although BOF producers face higher unit costs for the
issuance/renewal of IEP, the more numerous EAF producers account for the largest share
of cumulated costs, about two thirds of the total.

Page 207 out of 259
Table 40 Summary of Cumulated Administrative Costs Linked to IEP and Inspections (€
million)
Cost Items BOF Producers EAF Producers Total
Issuance/Renewal of IEP 6.6 16.5 23.1
Compliance Inspections 1.4 0.3 1.7
Total 8.0 16.8 24.8
In order to facilitate the comparison with other costs related to environmental legislation,
administrative burdens were annualized using the frequency parameter and expressed in
terms of costs per tonne of crude steel output. As shown in Figure 47 below,
administrative costs can be estimated at about € 0.011 per tonne/year for
BOF producers and at € 0.037/tonne/year for EAF producers, while the
overall annual average is about € 0.022/tonne. Administrative costs related to the
issuance/renewal of IEP account for three quarters of the cost per tonne (€ 0.008/tonne
for BOF and € 0.028/tonne for EAF producers), while the cost of inspections is always
below one Euro cent per tonne (€ 0.003/tonne for BOF plants and € 0.009/tonne for EAF
plants). Overall, these are quite low values, with a limited impact on steelmakers‘
operations. Even assuming much less favourable parameters, i.e. higher unit costs and/or
a higher frequency, administrative costs per unit of output are estimated to remain quite
low. For instance, in the case of IEP, even assuming that permits have to be fully renewed
every four years and that costs are five times greater than the values indicated above, the
incidence of costs per unit of output would not exceed € 0.28/tonne for EAF plants and €
0.08/tonne for BOF plants.
Figure 65 Annual Average Administrative Costs of IEP and Inspections (€/tonne)
Source: Authors‘ elaborations on various data
0,000
0,005
0,010
0,015
0,020
0,025
0,030
0,035
0,040
BOF Producers EAF Producers Average Value
Inspections for Compliance Checking
Issuance/renewal of IEP

Page 208 out of 259
10.5 Assessment of Indirect Costs
Indirect costs are defined as costs borne by steel makers as consequence of regulatory
provisions not addressed to them but rather to their counterparts. In practice, indirect
costs arise in the form of higher costs paid by steelmakers as a result of the influence
exerted by EU environmental legislation on operators active at other stages of the value
chain, typically suppliers of key inputs.
In the case of EU environmental legislation, three instances of indirect costs can be
identified. The first has to do with the higher prices of electricity paid by
steelmakers as a result of the compliance costs incurred by power plants in
order to conform to emission limits stipulated in EU legislation (initially, under
the LCP Directive and, subsequently, under the IED). The ―passing on‖ of compliance costs
from power producers to their clients was noted by earlier studies, especially in the case of
energy-intensive industries, such as steel making.227 The phenomenon was mentioned in
discussions with steel makers and is privately confirmed by representatives of the power
industry. However, the magnitude of these indirect costs is hard to gauge, due to lack of
data.
The second instance of indirect costs is of a similar nature, as it relates to the proposed
setting of more stringent limits to shipping emissions which, in turn, is
expected to trigger an increase in shipping rates. As the bulk of raw materials
used by EU integrated steel makers are imported from distant sources, higher shipping
rates would certainly affect steelmakers‘ cost structure, with an increase in operating costs
and a deterioration of the competitive position of European producers vis-à-vis their
international competitors having a more direct access to raw materials. However, this is
subject to two qualifications. First, it should be noted that the proposal submitted by the
Commission for amending the 1999 Directive on the sulphur content of marine fuels seeks
to mitigate the negative consequences. In fact, the proposal envisages that lower emission
limits could be achieved not only through the use of more expensive low sulphur fuels but
also through the installation on ships of pollution abatement equipment, whose cost could
be recouped over a relatively short period of time, presumably with a less dramatic impact
on shipping rates.228 Second, regarding the impact on international competitiveness, the
anticipated higher shipping rates would also affect non-EU producers with easier access to
raw materials and trying to sell their steel products in the EU market. While higher
227 See VITO, Sectoral Costs of Environmental Policy, December 2007 (―As the electricity market is not
subject to open international competition, electricity suppliers can pass on any financial burden resulting
from environmental regulation onto their customers. Hence, while the [LCP and IPPC] Directives may not
cause a competitive distortion in the electricity market, they may very well lead to distortions in other,
energy-intensive sectors, such as steel and base metals.‖ page 88).
228 On this point, see the analysis included in Commission Staff Working Paper, Impact Assessment
Accompanying the document Proposal for a Directive of the European Parliament and of the Council
amending Directive 1999/32/EC as regards the sulphur content of marine fuels, Brussels, 15.7.2011,
SEC(2011) 918 final

Page 209 out of 259
shipping costs can be more easily absorbed by finished products than by raw materials, the
negative impact on EU steelmakers‘ international competitiveness would be somewhat
reduced. In any event, this source of indirect costs is still hypothetical and no information
on its possible magnitude is currently available.
Finally, it is sometimes claimed that the compliance costs incurred by the operators of
vehicles recycling facilities under the ELVD tend to encourage the export of old vehicles,
with a negative impact on the supply of scrap material and, hence, on the
price of scrap metal. However in this case, the causation link is definitely much more
tenuous than in the other cases mentioned above and the influence on prices (if any) is in
all likelihood very small.

Page 210 out of 259
11 Trade Policy
As noticed in Section 4.4, the world steel industry is facing a more competitive
environment compared to ten years ago. Moreover, the entry on the steel market of new
production countries in addition to the historical centres such as Europe and US to Asia
has shown the sector to be vulnerable on two sides: concerning the provision of raw
materials (on which the EU is strongly dependent) and, given that, downstream sectors
(i.e. automotive) have been showing a relative decline of demand. Safeguarding an
undistorted level of competition both upstream and downstream among the main global
players is an essential requirement for the EU steel industry to survive. Fair competition is
ensured in particular through the implementation of WTO commitments, the negotiations
of bilateral FTAs, actions against obstacles to trade introduced by third countries and the
fight against dumping and government subsidies that artificially support the export
performance of new global players.
After the Uruguay Round in 1994, the so-called ‗zero-for-zero’ agreement was applied by
abolishing import duties for almost all steel products. The zero-for-zero rule implies that
the EU does not impose any tariff on most steel products229. For non-WTO members, the
EU usually stipulates ad-hoc trade agreements on the specific trade conditions to apply.
This was the case of Russia,230 before it joined the WTO, and it is still the case for
Kazakhstan.231
The main concerns of industry players regard (Eurofer, 2010) the rising importance of
non-tariff barriers - i.e. domestic regulation, subsidies, export restrictions, safeguard
mechanisms, local content requirements - that, especially in time of crisis, can take the
form of protectionist measures. The industry stresses that the EU has a crucial role in
safeguarding undistorted trade principles including by pursuing anti-dumping and anti-
subsidy procedures where justified.
In this context, the paralysis of the Doha Round, forced the EU to take action bilaterally,
not only by launching trade negotiations with the relevant partners. The Commission also
229 The application of the zero-for-zero agrrement howeverhas been signed up only by some developed
countries while many others still impose tariffs on incoming steel products. Even if the scope of the report
is to evaluate onlt the EU perspective, it is worth to notice that tariffs imposed somewhereelse (as
safeguard measures that we will see later on) could have had an impcts on the export strategiy of European
steel exporters.
230 Before the accession of Russia, EU had stipulated an agreement on trade for certain products. Moreover,
restrictions on imports and quantitative limits on certain steel products have been regulated in the past by
Council Regulations (EC No 1342/2007 and EC No 1040/2010) and by a Council Decision (EC
No2007/739/EC) on quantitative limits; these regulations have automatically expired when the Russian
federation became part of the WTO.
231 Council Regulation (EC) No 1340/2008 on trade in certain steel products between the European
Community and the Republic of Kazakhstan.
Page 211 out of 259
monitors and deters any form of unfair trading practices on the global trade scene.232 The
Commission Market Access Database shows that there are currently two procedures in the
steel market against trade barriers on steel products. The first includes public procurement
in form of steel local content requirements applied by the USA, in particular at sub-federal
level. More importantly, also in the context of the ongoing negotiations, in 2011 the Indian
Government imposed export duties on iron ore and semi-finished steel products.233 As the
EU considers this as a key barrier, it is currently acting to gather more information on the
nature of this measure. The export restrictions were raised by the Commission during the
last bilateral Steel Contact Group meeting in December 2012 held with the Indian
authorities. This issue is also part of the ongoing negotiations between the EU and India.
11.1.1 Trade Defence Instruments: their impact on the EU Economy
A major concern of the steel industry, not only at the EU level, is that competition with
third countries is negatively affected by unfair trading practices, such as dumping and
subsidies that artificially make third country steel products more competitive. The difficult
recovery phase from the economic crisis is forcing the EU to better monitor the market,
without moving towards a protectionist approach. Trade Defence Instruments (TDIs) are
not instruments for ordinary protection, they are ―targeted, contingent and [...]
temporary‖.234 Hence, they are not a comprehensive tool to ensure a fair playfield;
furthermore, their (dynamic) effect over time is difficult to assess.
As pointed out during the interviews, (deep and comprehensive) trade agreements could
indeed ensure a fairer environment through a bilateral bargain of the competitive
conditions for companies that face the challenges of international trade. However, given
the state of ongoing and future negotiations, in many cases and in particular with some
commercial partners, TDIs are the only valid instruments to defend companies from unfair
trading practices.
The EU legal framework makes three instruments available: anti-dumping duties (AD),
anti-subsidy duties, and safeguards measures. They are all defined in EU binding acts. For
anti-dumping measures, the EU Regulation235 in compliance with the WTO Anti-dumping
Agreement236 applies. For subsidies, the anti-subsidy rules237 and the Regulation on
232 Relevant partners are the ones raising so-called key barriers. A trade barriers is indeed categorized as ―key
barrier‖ when it is included in a special list of barriers raised by the main commercial partners
(Conclusion of the Council of the European Union, December 2008).
233 According to the Market Access Database, the Indian government re-established a 5% duty on fines
(previously abolished following a stimulus package) and a 10% duty on lumps recently raised to 15%.
234 Evaluation of the European Union‘s Trade Defence Instruments (2012)
235 Council Regulation (EC) No 1225/2009 on protection against dumped imports from countries not
members of the European Community. .
236 Agreement on Implementation of Article VI of the General Agreement on Tariffs and Trade 1994.
237 Council regulation (EC) No 2026/97 on protection against subsidized imports from countries not
members of the European Community.

Page 212 out of 259
protection against subsidized imports from non–EU Member States238 provide the legal
basis to start a complaint. Recently, the Commission adopted a proposal to modernise the
regulation on protection against dumped and subsidised imports from third countries.
Finally, safeguard measures, aiming at temporarily protecting the industry under
extremely strict circumstances against sharp increase in imports, are regulated according
to the status of the importing counterpart (WTO239 and non-WTO members240).
Analyzing the impact on EU trade of the use of TDI against third countries may be
challenging. By definition, anti-dumping measures are imposed against imports of a
specific product originating in specific country (-ies) to restore an undistorted competitive
environment for thatspecific product .This implies that even if the impact on the bilateral
flows hit by dumping is not large, the effect on the specific product category is normally
positive as it should temporary reduce dumped imports. Moreover TDIs can affect entry
decisions of the firms and alter the probability of exit from the market since they ensure a
provisional protection against unfair competitors. As noticed in some interviews, the
effectiveness of TDIs is not only motivated by the possibility of restoring competitiveness,
but also in terms of threat. If TDIs are used in a credible and thorough way, the
commercial counterpart will have a higher incentive to abide by trade rules.
According to the Independent Evaluation Report published by DG Trade, there are at least
three reasons that make the impact of TDIs difficult to evaluate. First, due to
confidentiality reasons, the actual imports flows from the specific companies affected by
the investigation is not available;241 secondly, it is difficult to define counterfactual flows,
which would be needed to measure the effect of the non–application of the duty in. Finally,
at micro-level, the application of an AD duty creates uncertainty for those firms that
usually deal with foreign markets by increasing the costs incurred: this scenario can both
prevent some foreign firms to enter the EU market and deter their performance in terms of
innovation or productivity, without necessarily affecting existing trade flows.
Anti-dumping and anti-subsidy measures
Since 2003, the EU carried out 31 investigations in the steel sector, involving most of its
main commercial partners (Table 41). In particular, 24- concern only anti-dumping
procedures, and three investigations are still ongoing against countries such as China,
India and Russia. In general, according to WTO statistics, the EU imposed 125 AD duties
(until the end of 2010), 44% of them are against China, while India, Russia and Thailand
238 Council Regulation (EC) No 597/2009 on protection against subsidised imports from countries not
members of the European Community.
239 Council Regulation (EC) No 260/2009 of 26 February 2009 on the common rules for imports.
240 Council Regulation (EC) No 625/2009 of 7 July 2009 on common rules for imports from certain third
countries.
241 As it will also be shown in Table 43, trade flows can be proxied through the selections of HS codes, which
however results in an overestimation

Page 213 out of 259
accounted for 6% each. Regarding anti-subsidies measures, the EU has carried out seven
procedures, two of which are still ongoing against India.
Table 41 EU Cases on Anti-dumping and Anti-Subsidy in the steel international
market, from 2003
Product
Country Investigated
Measures
Anti- Dumping
Grain oriented flat-rolled products of silicon-electrical
steel (GOES)
Russia, USA Expired
Stainless steel fasteners
Vietnam, Taiwan, Indonesia, Malaysia, Philippines, China,
Thailand
Ad valorem duty until 2017 for China and Taiwan
Steel wire ropes Republic of Korea No
Seamless pipes and tubes (or iron or non-alloy steel)
Romania, Ukraine, Russia, Croatia
Ad valorem duty until 2017 for Russia and Ukraine
Welded tubes and pipes of iron or non-alloy steel
Belarus, Russian Federation, Bosnia and Herzegovina,
China
Ad valorem duty until 2013 for Belarus, China and
Russia
Steel fasteners (certain iron and
steel...) China Measures in force
Seamless steel pipes and tubes
- Expired
Seamless steel pipes and tubes
- Expired
Stainless steel big wire
- Expired
Steel wire ropes -
Ad valorem duty until 2017 for Morocco, China,
Republic of Korea, Republic of Moldova and Ukraine
Steel wire ropes Russia Ad valorem duty
(investigation ongoing)
Galvanized steel China No

Page 214 out of 259
Stainless steel cold-rolled flat products
China, Taiwan, Republic of Korea
No
PSC wires and strands (certain pre-and post-
stressing wires and wire strands of non-
alloy steel)
China Ad valorem duty until 2014
Seamless pipes and tubes, of iron or steel (certain)
China Ad valorem duty until 2014
Stainless steel fasteners and parts
thereof (certain) India, Malaysia Expired
Stainless steel bars (certain)
India No measure
Stainless steel seamless pipes and
tubes China Ad valorem duty until 2016
Stainless steel fasteners
India No measure
Seamless pipes and tubes of iron or steel (certain)
Belarus No measure
Tube and pipe fittings of iron or
steel (certain)
Turkey, Russian Federation
Ad valorem duty until 2018 for Russia and Turkey
Organic coated steel China Measures in force
Stainless steel wires (SSW)
India No measure (Investigation
ongoing)
Stainless steel fittings
China, Taiwan No measure (Investigation
ongoing)
Anti-subsidy Steel big wire - Expired
Steel fine wire - Expired
Stainless steel fasteners and parts
thereof (certain) India, Malaysia Expired
Stainless steel bars (certain)
India Ad valorem duty until 2016
(Investigation ongoing)

Page 215 out of 259
Stainless steel fasteners
India Expired
Organic coated steel products (certain)
China Ad valorem duty until 2018
Stainless steel wires (SSW)
India No measure (Investigation
ongoing)
Source: DG Trade
According to the current EU legislation, the EU can initiate an anti-dumping or anti-
subsidy investigation on the basis of a properly substantiated complaint from the relevant
EU industry or on an ex-officio basis
The Council Regulation 1225/2009 on protection against dumped imports, in compliance
with the WTO Anti-dumping agreement,242 allows the EU to set an ad valorem duty to
counteract dumping, once there is sufficient evidence that a dumped price has been
applied causing injury to the Union industry. There are additional elements to be proved,
such as the link between the dumping and the injury, and the fact that the potential anti-
dumping measure would not be against the interest of the Union.
The setting of the anti-dumping duty follows the ―lesser duty rule‖ (LDR), according to
which the duty applied to the importers does not always correspond to the dumping
margin (defined as difference between the normal value of the good imported and the
export prices applied) when the duty can cover the (lower) injury margin 243suffered by the
company. The injury margin is usually chosen to set the anti-dumping duty, so the
methodology behind its calculation is crucial to offset the effect caused by dumped
imports. The investigation period for AD cases usually lasts 15 months, (nine months after
initiation at the latest) provisional measures can be imposed and then definitively collected
at the end of the period, where the implementing regulation confirms or eventually
modifies the conditions set in the provisional act. Definitive measures can be in force for
five years, after which the measure may be reviewed and possibly prolonged.
The application of the LDR is considered a ―WTO plus‖ (art. VI of GATT and Anti-
Dumping Agreement) and is considered by some stakeholders the cause of a weaker trade
defence, especially compared to the US. Higher AD duties are not only important per se,
i.e. to counter specific dumping actions, but also because the existence of higher AD duties
in other countries can divert imports flows towards the EU.
242 See http://www.wto.org/english/docs_e/legal_e/19-adp.pdf.
243 To define the injury margin, the Commission has to verify the impact of the dumped imports on the
Community market shares. In order to prove this, they have to see to what extent the dumped price
undercuts the Community price. The analysis considers many other variables as output, profits,
productivity, return of investment etc. (DG Trade, also see art. 3 0f Regulation (EC) No 1225/2009.

Page 216 out of 259
In this respect, Figure 66 shows that from 1989 to 2009, EU average anti-dumping duties
have been constantly lower than the ones applied by US and Canada. As noticed by
Rovegno and Vandenbussche (2011), the US and Canadian duties show an increasing trend
overtime compared to the more stable EU average of 30%. Moreover, the variability of the
US average trend, due to a higher flexibility of adjusting the duty over time, creates
uncertainty for every long-term internationalization strategy of foreign companies.
Figure 66 Average anti-dumping ad valorem duty levels by year of imposition244
Source: Rovegno and Vandenbussche (2011) based on Global Antidumping Database (World Bank)
Disentangling the quantitative effect of the application of the LDR on the level of duties is
not straightforward. As shown by the Evaluation Report of EU Trade Defence
Instruments,245 the LDR indeed contributes to the lower and more stable trend of EU
duties, but it is not the only cause. The lowering effect of the rule on the average EU duties
has been estimated as equal to 9.3 percentage points, resulting in duties 28% lower than
the ones computed without the application of the rule. However, even the removal of the
LDR would not fill the gap existing between the EU and the US.
Table 42 quantifies the LDR effect across sectors and over time and compares the effect of
the rule on steel industry with the respect to other sectors and the EU average. The LDR
effect for iron and steel (HS code 72) is -37%; for articles of iron and steel (HS code 73) is -
18%. This means that on average duties have been 37 percent lower than in the absence of
the LDR, compared to the across sectors average of -26%. This effect has been particularly
strong during 2000-2004, with around 17 percentage points of difference between the
average dumping margin and the average final duty.
244 The dotted lines correspond to years when no antidumping duties were imposed.
245 See http://trade.ec.europa.eu/doclib/docs/2012/march/tradoc_149236.pdf.

Page 217 out of 259
Table 42 EU Dumping margins, AD duties and effect of lesser duty rule by sector, (2000-
2010)246
Source: Evaluation of the European Union‘s Trade Defence Instruments (2012)
Table 43 reports the main anti-dumping measures in force in the steel industry. The aim of
the Table is twofold: first, it gives a rough idea of the difference between the dumping and
the injury margin; then, it attempts to compare AD-affected imports flows to overall
imports flows. The limitations of this simple exercise are clear: i)the ad duty is company-
specific and what we show is just a range of duties set for different companies; and ii) most
importantly, due to confidentiality reasons it is difficult to have a clear understanding of
the actual flows imported that have been hit by the investigation. However, imports flows
have been estimated by estimating the flows of all the HS codes mentioned in each
investigation. This leads to an overestimation, as also imports originating from companies
not subject to the investigation are also included. Then, import flows are compared to total
EU imports for that HS code from all over the world. With these caveats in minds, in four
cases imports from countries subject to investigation represent more than 50% of EU
imports for the specific product. Moreover, in these four cases, China is the main exporter
involved.
246 The lesser duty effect is the difference between the final duty and the dumping margin in percent of the
dumping margin.
HS chapter and description
Avg def
dum ping
m argin
Avg
definitive
duty
Avg def
dum ping
m argin
Avg
definitive
duty
Avg def
dum ping
m argin
Avg
definitive
duty
LDR
Effect
20 Vegetable, fruit, nut etc. 9.05 7.95 9.05 7.95 -12%28 Inorganic chemicals, precious metals
compuond, isotope 27.16 26.56 35.32 22.76 30.56 24.98 -18%
29 Organic cvhemicals 7.64 7.58 29.49 21.89 21.08 16.38 -22%
31 Fertilisers 34.68 9.3 34.68 9.3 -73%
39 Plastic s and articles thereof 31.03 27.14 12.75 12.75 18.08 16.95 -6%
41 Raw hides and skins and leather 69.8 58.9 69.8 58.9 -16%44 Wood and articles of wood, wood
charcoal 14.15 14.15 25.18 25.18 2028 20.28 0%
54 Manmade filaments 11.27 6.87 7.1 7.1 8.66 7.01 -19%
55 Manmade staple fibres 34.47 19.37 34.47 19.37 -44%
64 Footwear, gaiters amd the like 39.9 9.85 39.9 9.85 -75%
7 2 Iron and steel 37.65 20.76 30.36 20.12 32.29 20.29 -37%
7 3 Articles of iron and steel 21.9 21.9 45.46 36.53 42.19 35.5 -18%
7 6 Aluminium and articles thereof 33.21 17.86 33.21 17.86 -46%81 Other base metals, cermets, articles
thereof 64.62 29.3 64.62 29.3 -55%
83 Miscellaneous articles of base metals 27.1 27.1 27.1 27.1 0%84 Nuclear reactors, boilers., machinert
etc. 41.84 41.84 41.84 41.84 0%
85 Electrical, electronic equipment 28.34 27.58 47.33 27.84 35.94 27.69 -23%
87 Vehicles other than railway , tramway 15.8 15.8 32.57 16.87 31.04 16.77 -46%90 Optical, photo, technical, medical, etc.
apparatus 38.8 34 38.8 34 -12%
95 Toy s, games, sports requisites 5.8 5.8 5.8 5.8 0%T otal average 36.17 20.23 33.63 24.3 31.35 23.05 -26%
2000-2004 2005-2010 2000-2010

Page 218 out of 259
Table 43 Anti-dumping Measures in force from 2003 247
Source: Council Regulations, authors‘ calculations on data from COMEXT.
247 Anti-circumvention investigations (AD384 and AD429 on Steel wire ropes) not considered. The duties
mentioned pertain only to the definitive implementing regulation. Finally, where injury margins are not
available (see AD490 and AD482, for instance), this is due to the fact that they are higher than dumping
margins: according to the LDR, these are the ones used to define AD duties. (*)Year of the beginning of
the investigation; (**) Percentage of CIF Union frontier price, duty unpaid; (***) Ratio between the
sectoral imports from the country/countries under investigations and the total imports of that sector.
Product Country Year*
Dum ping
m argin
(%)**
Injury
m argin
(%)
AD
Duty
(%)
Im ported
quantity
y ear
before
(country )
/tonnes
Im ported
quantity
y ear before
(extra
EU)/tonnes
Share of
sector
im ports
(%) ***
AD584
Organic
Coated
Steel
China 2011 48.9-68.1 1 3 .7 -44.7 0-26.1 464,582 91 5,598 50.7 4
AD529
PSC wire
and
strands
China 2008 26.8-49.8 0-31 .1 0-31 .1 48,381 96,490 50.14
Rom ania 1 1 .7 -1 7 .8 1 1 .7 -1 7 .8 85,927
Ukraine 1 2.3-25.7 1 2.3-25.7 1 1 0,887
Russia 35.8 35.8 227 ,91 7
Croatia 29.8 29.8 25,47 0
AD533
Seamless
pipes and
tubes
China 2008 7 3.1 -64.8 1 5.1 -24.2 1 7 .7 -39.2 449,1 82 81 1 ,825 55.33
Vietnam 7 .7 7 .7 2 ,7 69
Taiwan 1 1 .4-23.6 8.8-23.6 9,588
Indonesia 9.8-24.6 9.8-24.6 6,51 2
Malay sia 0 0 3 ,01 8
Philippines 0 0 5,1 96
China 1 2.2-27 .4 1 1 .4-27 .4 4 ,823
Thailand 1 0.8-1 4.6 1 0.8-1 4.6 3 ,47 6
AD565
Stainless
steel
seamless
pipes and
tubes
China 2010 62.6-83.7 48.3-7 1 .9 48.3-7 1 .9 21 ,548 56,530 38.12
AD525Steel
fasteners China 2007 63.1 -1 05.3 64.4-99 63.1 -85 488,063 853,862 57 .16
Turkey 2.9-1 6.7 2.9-1 6.7 2 ,360 25,297 16.27
Russia 23.8 23.8 1 ,7 55
Belarus
Russia 22.7 1 6.8-20.5 1 0.1 -20.5
China 90.6 90.6 1 1 0,922
548,7 80
50,1 80
41 1 ,935
Seamless
Pipes and
tubes
Stainless
steel
fasteners
38.1
AD523
AD579
AD482
AD490
38.1Welded
tubes and
pipes of
iron or
non-alloy
steel
Tube and
pipe
fittings of
iron or
steel
(certain)
15.66
5.52
43%
28,1 91
34,1 48
2005
2004
2011
2007

Page 219 out of 259
The procedure to impose an anti-subsidy measure is very similar to the one for anti-
dumping duties. A market distortion may arise when importers, thanks to subsidies
received, can set lower prices, thus acquiring new market shares to the detriment of the
other companies. The EU may open an anti-subsidy investigation on the basis of a
complaint from the EU industry concerned or also on an ex-officio basis in order to
address these distortions.
Anti-dumping and anti-subsidies procedures present different difficulties, but can be
initiated at the same time (see for instance the AD584 and AS587 on organic coated steel
products against China discussed below). As in the case of anti-dumping procedures, the
Commission, once having established the presence of a distortive subsidy creating an
injury, can set a countervailing measure that can take the form of a percentage of price or a
fixed amount (DG Trade, 2013). Table 44 below reports the two measures in force now
against China (very recent) and India. Every measure can be imposed for five years, with
an expiry review possible at the end of this period.
Table 44 Countervailing duties in force since 2003248.
Country Product Year* Subsidy margin
(%)** Countervailing duty (%)
AS587 China Organic
Coated Steel
2011 23.8-44.7 13.7-26.1
AS556 India Stainless
steel bars
2008 26.8-49.8 0-31.1
The two legislative acts regulating the action against dumped and subsidised imports from
non-member states are currently under review. In April 2013, a new proposal249 has been
made by the Commission to amend the two original regulations aiming at removing the
lesser duty rule in case of structural distortions in the raw material market and in case of
subsidisation; and also at improving the transparency about the imposition of provisional
measures. Moreover, the Commission proposes to reimburse duties to importers paid
during the period where an expiry review is conducted but which results in the termination
of the measure. Stakeholders welcome the Commission proposal, especially as for the
removal of the LDR in case of subsidies and structural distortions of the raw materials
markets. However, they also point out that these principles need to be properly defined in
order to be effective. For example, doubts persist, in the stakeholders‘ readings, concerning
the definition of raw materials structural distortions.
248 (*)Year of the beginning of the investigation (**)Percentage of CIF Union frontier price, duty unpaid
249 Proposal for a Regulation of the European Parliament and the Council amending Council Regulation (EC)
No 1225/2009 on protection against dumped imports from countries not members of the European
Community and Council Regulation (EC) No 597/2009 on protection against subsidized imports from
countries not members of the European Community; COM(2013)192.

Page 220 out of 259
According to all the interviewees and our own analysis, costs of compliance with TDI
regulation are not an issue. This is not to say that procedural costs are negligible, but that
benefits of trade protection outweigh them. As trade complaints are not an obligation, but
an opportunity, companies will undertake them only as far benefits outweigh costs in the
case at hand. Furthermore, no interviewees considered the burdens as irritating or
inappropriate.
A substantive part of the procedure is coordinated by trade association, that itself incurs in
compliance costs. According to the Evaluation report, the estimated average costs of
complaints for an association (across all sectors) is around € 60,000 (ranging from less
than € 10,000 to more than € 200,000). On top of internal costs, this amount may also
include external costs, e.g. the costs of external consultants or legal support. In particular
for the steel industry, the total costs of carrying out a complaint are on average higher
(around € 400,000) and can exceptionally reach € 1 million for unusual cases or those
requiring special expertise. The report also shows that the costs of making a complaint in
the EU are lower than the ones incurred by US and Canadian companies. Costs for
complaining companies can also be significant. Indeed, the investigation requires the
company to devote a team for collecting information and replying to the Commission‘s
requests (e.g. by filling the questionnaires). This team are usually to be kept in stand-by
also in-between investigations. Finally, it should be noted that the length of the procedure
can represent an indirect costs for companies. From the start of the data collection to the
imposition of provisional measures, companies may have to suffer alleged dumping for
about 15 months.
Below, two case studies are discussed. The former are the ―Organic Coated Steel‖ cases,
with measures recently imposed against China. These cases were chosen as significant
because they concern both anti-dumping and anti-subsidy measures. The latter is the case
on ―Seamless Pipes and Tubes‖, again against China, and is considered representative of
the tube industry, which, especially in its seamless segment, is among the branches of the
steel sectors most open to external trade. The decision to consider two cases against China
is justified by the fact, as mentioned above, that when Chinese companies are involved,
TDIs cover a larger share (up to more than 50%) of total EU imports for those products.
CASE 1: AD584/AS587 Organic Coated Steel
The case on dumped and subsidised imports of certain organic coated steel products from
China has been recently concluded in March 2013.250 It is a remarkable case as it found
evidence of subsidised Chinese imports and the casual link between those imports and the
injury suffered by the EU industry was established.
250 Council Implementing Regulation (EU) No 214/2013 of 11 March 2013 imposing a definitive anti-
dumping duty and collecting definitively the provisional duty imposed on imports of certain organic
coated steel products originating in the People‘s Republic of China

Page 221 out of 259
The complaint was received in 2010 from Eurofer representing 70% of European
producers of organic coated steel.251 The investigation period started in October 2010 and
ended in September 2011. Products included in the investigation are certain organic coated
steel products.252 The complainant considers the procedure to have worked in a smooth
way, and the Commission to have been supportive. The only comment – shared with the
general assessment of the EU TDI system – is that provisional measures would better
protect the affected sector if they could come at an earlier stage.
Figure 67 compares the imports of organic coated steel products from 2004 to 2012 from
both China and the world. As we can see, during the investigation period (2010-2011) the
imports increased forcefully compared to previous three years (which were strongly
affected by the economic crisis).
Just before the starting of the investigation period, the EU production volume dropped
from 4,447,780 tonnes in 2008 to 4,018,310 in 2011. In the meantime, the crisis had
spurred a sharp decrease in 2009 (3,514,956 tonnes) and 2010 (3,992,209). During the
same period, the production capacity remained quite stable while the capacity utilisation
shrunk by 8 percentage points.253 Sale decreased sharply from 2008 to 2009 (from
2,951,468 tonnes to 2,280,304), bouncing back to 2,592,540 tonnes during the
investigation period.
Dumping margins were in the range of 48.9% and 68.1% while subsidy margins in the
range of 23.8% and 44.7%. For both procedures, injury margins were calculated in the
range of 13.7% and 58.3%. The definitive collection of the provisional duties confirmed
that AD duties against the Chinese companies investigated goes from 0% to 26.1% while
countervailing duties are now in the range between 13.7% and 44.7%. It is too early to
judge the effectiveness of the double duties. However, interested parties are confident that
this action will reduce Chinese imports, something that can already be inferred from the
trade flows in 2012 (see Figure 67).
251 Art (1), Council Implementing Regulation No 241/2013.
252 Art. 19. The list includes ―…flat-rolled products of non-alloy and alloy steel (not including stainless steel)
which are painted, varnished or coated with plastics on at least one side, excluding so-called 'sandwich
panels' of a kind used for building applications and consisting of two outer metal sheets with a stabilising
core of insulation material sandwiched between them, excluding those products with a final coating of
zinc-dust (a zinc-rich paint, containing by weight 70 % or more of zinc), and excluding those products
with a substrate with a metallic coating of chromium or tin…‖. The list was amended compared to the
products covered by the Provisional Implementing Measure. See Council Regulation (EU) No 845/2012 of
18 September 2012 imposing a provisional anti-dumping duty on imports of certain organic coated steel
products originating in the People‘s Republic of China.
253 Art. 69 and 70, Regulation (EC) No 214/2013.

Page 222 out of 259
Figure 67 Imports of certain organic coated steel products from China and the
World (hundred Kg)
Source: COMEXT (2013)
CASE 2: AD533 Seamless tubes and pipes
As already recalled, the European segment of seamless tubes and pipes is more
internationalized than other parts of the steel sector. As shown in Figure 68, since 2007
extra-EU exports of seamless pipes and tubes exceed intra-EU exports. The high exposure
to international trade makes the sector more vulnerable to unfair practices, especially as
the main commercial partner, that is China, suffers from overcapacity.
The case at hand started in July 2008 against a group of Chinese importing companies of
certain seamless pipes and tubes254 and was first settled in April 2009 by imposing
provisional anti dumping-duties ranging from 17.7% to 39.2% (Regulation EC No
289/2009).
254 Regulation EC No 289/2009).
0
2,000,000
4,000,000
6,000,000
8,000,000
10,000,000
12,000,000
14,000,000
2004 2005 2006 2007 2008 2009 2010 2011 2012
PRC World

Page 223 out of 259
Figure 68 Exports and Imports of certain seamless tubes and pipes
Source: COMEXT, 2013
The definitive collection of the duties has been finally imposed in September 2009
(Regulation EC No 926/2009). A peculiarity of this case is the use of the ―threat of injury‖
concept. This means that EU companies are protected from the injury occurring after the
closure of the investigation, rather than from that suffered during the investigation period.
According to the data reported in the final Regulation, dumped imports of certain seamless
pipes and tube increased sharply at the end of the investigation, taking advantage of a
sudden increase in the EU consumption. The investigation concluded that an injury would
have occurred in the absence of provisional measures (Art. 114). In this way, the existence
of a threat of injury was proved and followed by the imposition of definitive AD duties. The
affected companies, together with ESTA – the representative federation of the tube
industry – was able to demonstrate that the injury was to be attributed to the imports from
China, rather than to the current economic crisis.
The effects of the crisis become apparent when considering the decrease of market size.
Indeed, the drop in absolute terms of Chinese imports after the investigation period
(ranging from 470,413 tonnes to 306,866), nevertheless resulted in an increase of market
share (from 14.9% to 17.8%).
Dumping margins both in the provisional and the definitive regulations were in the range
of 64.8% and 73.1% while injury margins from 15.1% to 24.2 %, much lower than the
dumping margins255. Final collected AD duties went from 17.7% 39.2%. The assessment of
255 The application of the lesser duty rule determined therefore a remarkable difference in
the antidumping duties that were lower of 33 - 47 percentage points compared to the
dumping margins equal to minus 46% - 73%, much higher than the average values in
Table 43
0%10%20%30%40%50%60%70%80%90%
100%
Imp
or
t
Ex
po
rt
Imp
or
t
Ex
po
rt
Imp
or
t
Ex
po
rt
Imp
or
t
Ex
po
rt
Imp
or
t
Ex
po
rt
Imp
or
t
Ex
po
rt
Imp
or
t
Ex
po
rt
Imp
or
t
Ex
po
rt
Imp
or
t
Ex
po
rt
Imp
or
t
Ex
po
rt
Imp
or
t
Ex
po
rt
2002 2003 2004 2005 2006 2007 2008 2009 2010 2011 2012
Extra-EU27 Intra-EU27

Page 224 out of 259
the effectiveness of anti dumping measures in this case is clearly effective. After the
definitive collection, imports from China did actually lower, and stakeholders tend to
directly attribute the reduction to the TDIs imposed, rather than to the overall economic
situation.
On safeguards measures
Safeguard measures can be imposed when the EU experiences a sharp increase of imports
from non-EU countries that cause a severe injury the domestic market. The Imposition of
safeguard measures is regulated by acts, distinguishing either WTO256 or non-WTO
countries.257 The investigation period usually lasts nine months, and afterwards the EU can
impose import or tariff quota for 200 days, and then for four years in case of definitive
measures. The import quota is generally equal to the average level of imports over the last
three representative years (EC 2013).258
Safeguard measures are protectionist restrictions that the EU has not been applying since
2005. In particular, in the steel sector there is a surveillance measure in place since 2002,
that, should problems be detected, may result in the imposition of short-term import
licensing.259 According to the Regulation ―[t]he situation on the steel market has
worsened considerably in 2001 under the combined impact of a number of factors, chief
among them being a marked downturn in the world economy‖. 260 The ―steel market has
also been unsettled by the uncertainty and hedging caused by the possibility of import
restrictions on the US market following the US administration's ‗Section 201‘ safeguard
investigation‖.261
The situation is different for EU exporters, as safeguard measures are in place in several
third countries, as emerged during the interviews. Currently, definitive measures are in
force in Ukraine (imports quotas for seamless pipes); Indonesia (for iron or steel wires,
steel wire ropes, iron wires zinc plated and wires of iron), Kazakhstan and Belarus (for
stainless steel pipes), Russia (for steel pipes) and a new case is under discussion now in
India (seamless tube).
256 Council Regulation (EC) No 260/2009 of 26 February 2009 on the common rule for imports.
257 Council Regulation (EC) No 625/2009 of 7 July 2009 on common rules for imports from certain third
countries.
258 See http://trade.ec.europa.eu/doclib/docs/2013/april/tradoc_151031.pdf.
259 WTO, Trade Policy Review on the European Union (2011).
260 Art. 2, Council Regulation (EC) No. 260/2009.
261 Art. 3, Council Regulation (EC) No. 260/2009

Page 225 out of 259
11.1.2 Chinese subsidies to the steel industry
The government will work out supporting policies, provide favourable taxation terms, subsidized loans and scientific research funds to support large iron and steel projects which are based on newly-developed home-made production equipment.262
According to WTO rules, members have to notify their subsidies. China, which acceded the
WTO in 2001, submitted a notification of subsidies in 2006 and 2011 with many countries
complaining that it was neither complete nor up to date, as reported in our interviews. This
led to the US to submit in 2011 a counter notification to the WTO, with all the subsidies of
which they have become aware.263 Secondary research and international trade defence
mechanisms found evidences about Chinese subsidy practice for the steel industry.
China is more likely to provide subsidies in those sectors formally defined as
―heavyweight‖ industries and therefore ―key pillars‖ of the Chinese development policy.264
The steel industry is one of those.
Haley and Haley (2012) consider that the Chinese steel industry has no discernible cost
advantage compared to the EU. However, the subsidies that they calculate create a 30%
cost differentials. Concerning cost advantages, data presented in Section 1 show that this is
true of EAFs, where Chinese steel makers have a higher cost than European companies;
however this is not true for BOFs, where Chinese producers have a cost advantage of about
10% compared to Central Eastern Europe, and of 15% compared to Western Europe.
Main actors of the Chinese steel policy
The Chinese steel policies are defined at central level by three governmental organs:
- National Development and Reform Commission (NDRC). NDRC is the successor of
the state planning commission. Currently, its role consists in administrating and
planning the macroeconomic and industrial development strategies. Representing
the most powerful economic policy entity in China, its legal authority allows directly
interventions on market processes to foster development. The NDRC drafted the Iron
and Steel Industry Development Policies (ISIDP) a comprehensive document of
objectives and plans about the Chinese steel sector;
- State-owned Assets Supervision and Administration Commission of the State Council
(SASAC). This is a special commission under the State Council, It is responsible for
the investments in state owned enterprises, acting as the public shareholder;265
262 Article 16―Iron and Steel Industry Development Policies‖ approved in 2005 by the Chinese state council
http://www.asianlii.org/cn/legis/cen/laws/pfdoiasi501/
263 See http://ia.ita.doc.gov/esel/files/china-counter-notification.pdf.
264 See http://origin.www.uscc.gov/sites/default/files/transcripts/5.24-25.07HearingTranscript.pdf and
http://www.cbsa-asfc.gc.ca/sima-lmsi/i-e/ad1371/ad1371-complaint-plainte-07-nc.pdf
265 Nine of the top 10 Chinese Steel industries where managed by the SASAC in 2007 (see footnote 264
above).

Page 226 out of 259
- China Iron and Steel Association (CISA). This is no-profit organization linking the
governmental institutions with the steel companies; among its duty, it manages the
trade qualifications needed for market access.266
Also local governments strongly influence the steel companies. Indeed, steel companies are
crucial to ensure employment level in the affected communities. In some cases, local
interests may collide with the central macroeconomic policy, generating coordination
problems and overcapacity.267
The companies are strongly linked with the states structures. The key positions in the top
enterprises are hold by members of the Chinese Communist Party, and usually had held
important positions in the bureaucracy. These managers are usually selected and
monitored by SASAC, as a shareholder would.268
Chinese steel policies are currently trying to address two main challenges: fragmentation
and value chain improvement. Given the political multilayered structure of China, the steel
industry was initially developed at local level through local incentives or plans, and hence
was fragmented. After the WTO accession, the NDRC has been promoting a policy of
industry consolidation. At the same time, NRDC and CISA are providing incentives and
direction for companies to engage in high added value production, hence moving the
industry up in the value chain.269
Below, different kinds of Chinese subsidies to the steel industries are described, as
reported in the Taube and in der Heiden (2008) and Haley and Haley (2012). They have
been split between general subsidies, i.e. subsidies which Chinese steel companies may
benefit from regardless of whether they produce for the internal or international markets;
and specific export subsidies (or taxes).
General subsidies
The Chinese companies reportedly enjoy the following supports regardless of whether their
products are for exports or imports:
- Input subsidies. Before China accession to the WTO, local governments used to grant
free or under-priced resources to key enterprises, such as:
o Land. In China the sale of land is not allowed, since the land is considered
property of the state; only commercial exploitation or usage rights are legally
266 OfficialCisa Site http://www.mmi.gov.cn/
267 Mark Taube and Peter Thomas in der HeidenThe State-Business Nexus in China‘s Steel Industry –
Chinese Market Distortions in Domestic and International Perspective. (2008) Report prepared on behalf
of Eurofer European Confederation of Iron and Steel Industries, Brussels.
268 For example, the former CEO and President of Baosteel Industries XieQihua had been was formerly a
Vice-Premier
269 Taube and in der Heiden, supra note 267.

Page 227 out of 259
recognised. During the time of central planning, government agencies simply
assigned parcels of land to certain steel plants to set up operations. Steel firms
are still enjoying advantages through lower depreciation in the income
statements;
o Water and energy. Chinese prices for water and energy are directly managed by
the government, with artificially low prices especially targeting ―heavyweight‖
industries, such as iron and steel.270 Table 45 below reports the amount of
subsidies to the Chinese steel industry as calculated by Haley and Haley 2013
for different kinds of energy inputs.
Table 45 Energy subsidies to the Chinese steel Industry - 2002-2007 ($ mln, current price)
Period Coking Coal Thermal Coal Electricity Natural Gas Total
2002 1,148 (604) 2 (31) 515
2003 964 (991) 2 (1) (26)
2004 1,359 3,423 3 10 4,795
2005 3,933 1,772 304 92 6,101
2006 4,702 731 385 25 5,843
2007 1,774 5,878 215 (28) 7,839
TOTAL 13,880 10,209 911 67 25,067
Source: Haley and Haley (2013)
- Unpaid dividends. Many of the SASAC-managed companies do not paid dividends to
its major shareholder: the Chinese government;
- Funds and grants. Chinese steel businesses enjoy a variety of available funds and tax
brackets, e.g. local development reasons, ―social security‖ concerns, or innovation
investments;
- Preferential lending policies. Subsidized loan facilities and preferential lending
arrangements are available for state-owned production companies. Indeed, as
reported by the IMF,271 the banking sector, even though it is no longer fully in the
hands of the central government, has still strong ties with it. Hence, commercial
decisions on loans and rates tend to be based more on government planning than
market considerations;
- Capital Market Measures. SASAC-managed steel firms have an easier access to capital
at lower costs. For example the biggest Chinese steel company Baosteel combined an
equity issue with a declaration from the Chinese government to protect the value of
270 ―Subsidies to Chinese Industry: State Capitalism, Business Strategy, and Trade Policy”Usha C.V. Haley and George T. Haley (2013)
271 Podpiera, R., 2006, Progress in China‘s Banking Sector Reform: Has Bank BehaviorChanged?, IMF Working Paper WP/06/71, p.4, http://www.imf.org/external/pubs/ft/wp/2006/wp0671.pdf

Page 228 out of 259
the newly issued shares, 60% of which were bought by another SASAC-managed
company. This operation triggered a leverage effect from international investors;
- Tax privileges. The Chinese tax system is based on a tax sharing model between
central and local governments. The latter possesses a complete fiscal control over
certain tax categories. Steel enterprises benefits from various local corporate tax
privileges. Another important branch of tax allowance is the rebate for domestic
equipment purchase i.e. if a steel Chinese firm buys equipment from a Chinese
supplier, it is entitled to a tax rebate.
Table 46 below reports the amount of subsidies to a sample of steel companies as
calculated by Taube and in der Heiden based on official documents and corporate
statements.
Table 46 Subsidies on Chinese Steel Industries, 2002-2007
Typology Sample Amount ($ mln)
Funds and grants Listed Corporations 264
Preferential Loans TOP 15 Steelmakers 15,951
Privileged taxes (corporate taxes) Listed Corporations 933
Privileged taxation (domestic purchases) Listed Corporations 411
Note: Exchange Rate 8.265 CNY/US. Source: Taube and in der Heiden (2008)
Trade Subsidies
The Chinese government, through NDRC directives, uses a series of market-based
instruments administrated by CISA to control the steel trade flows. The export of steel
goods is managed by granting or imposing by VAT rebates, export taxes and export quotas.
In general, Chinese trade measures promote exports of high end products, and discourage
the exports of low end product or raw materials.
A topical example is the coke export management. In 2005 China employed an export tax
of 5% on coke, which was raised to 15% in June 2007 and to 25% in January 2008;
meanwhile the export quota was capped at 14 million tonnes per year, which is less than
5% of the total Chinese output.
An example of management through export rebates / taxes is provided in the three figures
below. Figure 69 shows the exports of a low added value product: wire rods. Until April
2007, exports of wire rods enjoyed a VAT export rebate, and exports trebled between
January 2006 and April 2007. Once this was withdrawn, and later substituted with an
export tax, exports fell by two thirds in less than six months.
Figure 69 Chinese exports: wire rods (Jan 2006 = 100)

Page 229 out of 259
Source: Taube and in der Heiden (2008)
Figure 70 below shows the exports of a high added value product: large metallic coated
sheets and strips. Here again, the lowering of the Vat export rebates resulted of a decrease
of the index, from almost 600 to about 300.
Figure 70 Chinese exports: metallic coated sheet and strip width >600mm (Jan 2006 = 100)
Source: Taube and in der Heiden (2008)
Finally, Figure 71 shows the exports of a high semi finished manufacturing. As for low
added value finished products, the Chinese government u-turned its policies: from a VAT
exports rebate of 11%, to an export tax of 25%. Quite naturally, exports disappeared,
dropping from 1.5MMT in November 2006 to almost 0 at the beginning of 2008.

Page 230 out of 259
Figure 71 Chinese exports policies, exports volumes and price movements for billets
Source: Taube and in der Heiden (2008)
11.1.3 The Generalised Scheme of Preferences (GSP)
The legislative framework272 that regulates Generalized Scheme of Preferences (GSP) will
soon be replaced by a new regulation273, which will enter into force in January 2014.274
GSP is applied to developing countries and grants preferential trade conditions to support
growth and development. The countries are divided in three groups: i) Standard GSP
(standard generalized preference); ii) GSP+ (special preferences for countries which are
economically vulnerable and ratify and implement core conventions on labour and human
rights, environment and good governance); and iii) Everything but Arms (duty free quota
free exports with the exception of arms and ammunitions, for Least developed countries).
The main aim of the reform is to focus preferences on the countries most in need of it.
Countries that already enjoy special trade conditions due to bilateral trade agreements or,
according to World Bank classification, that are categorized as high or upper middle
income will no longer receive GSP preferences, since it is considered that they do not need
GSP to be competitive on the EU market. This will create more opportunities for poorer
economies, which will instead maintain preferences. The reformed scheme maintains the
―graduation system‖: it excludes from GSP these sectors performing well albeit located in a
272 Council Regulation (EC) No 732/2008 of 22 July 2008 applying a scheme of generalised tariff preferences
for the period from 1 January 2009 to 31 December 2011 and amending Regulations (EC) No 552/97, (EC)
No 1933/2006 and Commission Regulations (EC) No 1100/2006 and (EC) No 964/2007
273 Regulation (EU) No 978/2012 of the European parliament and of the Council of 25 October 2012 applying
a scheme of generalized tariff preferences and repealing Council regulation (EC) No 735/2008.
274 The Regulation will be rolled over by Council Regulation (EC) No 512/2011.
Page 231 out of 259
GSP country, based on the amount of exports, compared to exports from other GSP
beneficiary countries.
As for the main trading partners of the EU steel industry, several countries will exit the
GSP list, due to the existence of other market access arrangements – such as Algeria,
Morocco, Egypt, Tunisia, Mexico and South Africa. Other countries due their income
category will see their preferences deferred – such as Argentina, Brazil, and Kazakhstan –.

Page 232 out of 259
12 Product policy
12.1 Introduction
EU product policy pursues a dual objective. On the one hand, it aims at increasing the
efficient use of resources and at preventing negative consequences for the health of
consumers (e.g. in the case of chemicals) and/or for the environment (e.g. the generation
of waste). This objective is stated inter alia in the Commission‘s Green Paper on Integrated
Product Policy (IPP) adopted in 2001275, which led to the EC Communication on IPP of
June 2003.276 On the other hand, product policy aims at ensuring that information on the
characteristics of products is available to operators and users, so as to facilitate the
uniform assessment of performance. This is particularly the case for product policy in the
construction industry, where the theme of product performance is linked to that of
competitiveness of industry.
This Section reviews the influence of EU product policy in three “thematic areas”, i.e.
eco-labelling & eco-design, green public procurement, and life-cycle assessment
methodologies, and for two “product groups”, i.e. chemical substances and
construction products. The analysis focuses on the three ‗usual‘ categories of regulatory
costs, namely: (i) compliance costs, i.e. the costs incurred for fulfilling the substantive
obligations spelled out in EU legislation; (ii) administrative costs, comprising the costs
incurred to fulfil the administrative obligations stipulated in the legislation (e.g. the costs
for the registration of certain products); and (iii) indirect costs, which include the costs
incurred by steel makers as a result of legislative provisions affecting other entities (e.g.
operators at other stages of the production chain). It is important to note that, compared
with what done in other parts of this Report, in this Section the notions of compliance and
indirect costs have been somewhat broadened, to encompass the (potential) costs that may
be incurred by the steel industry as a result of changes in market developments (i.e.
substitution of steel with other materials) that may result from EU legislative and policy
measures.
This section is structured as follows: (i) Section 12.2 provides a review of the relevant
legislation and policy documents, with an assessment of the implications for the steel
industry; (ii) Section 12.3 analyzes compliance costs; (iii) Section 12.4 focuses on
administrative costs; (iv) Section 12.5 deals with indirect costs.
275 European Commission, Green Paper on Integrated Product Policy, Brussels, 07.02.2001, COM(2001)68.
276 Communication from the Commission, Integrated Product Policy - Building on Environmental Life-Cycle
Thinking, 18.6.2003, COM(2003)302.

Page 233 out of 259
12.2 Review of Relevant Legislation
12.2.1 Eco-Labelling and Eco-Design
Overview
Ecolabels are voluntary environmental labelling systems, enabling consumers to recognize
eco-friendly products. The EU Ecolabel system was set up in 1992: the general legal
framework is provided by the Ecolabel Regulation277 while the requirements that have
to be met by specific products are spelled out in subsequent Commission Decisions. Key
criteria for the award of the EU Ecolabel include: (i) the ecological impact of goods (with
reference to climate change, nature and biodiversity, energy and resource consumption,
generation of waste, pollution, emissions and the release of hazardous substances into the
environment); (ii) the substitution of hazardous substances by safer substances; and (iii)
the durability and reusability of products. A related piece of EU legislation is the Energy
Labelling Directive of 2010,278 which extends the scope of the energy labelling regime
introduced in 2001 and establishes new efficiency classes for the most energy-efficient
products. Eco-design aims at reducing environmental impacts of products by
incorporating environmental considerations since the earliest stage of design. In the EU
policy, so far the focus has been placed on improving product design with a view to reduce
energy consumption. The framework is set by the Eco-design Directive of 2009,279
which recast previous legislation on energy-using products280 and expanded the
application of eco-design to energy-related products. Implementing measures for specific
products or product groups are presented in the three-year Eco-design Working
Plans281 and put into action with subsequent Commission Regulations.
Relevance for the Steel Industry
Being entirely voluntary, eco-label systems do not impose any specific obligation on
operators and, therefore, they do not have any immediate impact on the steel industry.
However, being aimed at orienting consumers‘ preferences, they may nonetheless exert a
significant influence on market developments. This is particularly the case for the EU Eco-
label system, which, under certain conditions, may be used in green public procurement
277 Regulation (EC) No 66/2010 of the European Parliament and of the Council on the EU Eco-label.
278 Directive 2010/30/EU of the European Parliament and of the Council on the indication by labeling and
standard product information of the consumption of energy and other resources by energy-related
products.
279 Directive 2009/125/EC of the European Parliament and of the Council establishing a Framework for the
setting of eco-design requirements for energy-related products.
280 Directive 2005/32/EC of the European Parliament and of the Council establishing a framework for the
setting of eco-design requirements for energy-using products.
281 Commission Staff Working Document, Establishment of the Working Plan 2012-2014 under the
Ecodesign Directive, 7.12.2012, SWD(2012)434.

Page 234 out of 259
(see below)282 and, therefore, has the potential of affecting a substantial share of the
market. Therefore, in the case of the steel industry, eco-labelling legislation is relevant to
the extent that it may influence the replacement of steel with other materials. A more
direct impact on the steel industry may result from the eco-design legislation. In fact,
iron and steel furnaces are part of the product group ‗Industrial and laboratory furnaces
and ovens‘, which is covered by the Eco-design Working Plan for 2012 – 2014 and for
which an implementing measure is expected to be adopted by end 2014. The applicability
of the Eco-design Directive to industrial furnaces and kilns is currently challenged by the
steel industry (as well as by several other industrial sectors, such as the cement industry,
the glass industry, etc.) on grounds that the energy efficiency of these facilities cannot be
assessed in isolation (as it is the case for, say, a classical bakery oven) but only as part of a
whole production process. In addition, industrial furnaces and kilns are already subject to
other EU legislation, either directly (the Industrial Emissions Directive) or indirectly (via
the emission trading mechanism under the ETS Directive), and making them subject also
to the Eco-design Directive would result in the possibility of conflicting provisions.283 At
the time of writing, the issue is still under discussion.
12.2.2 Green Public Procurement
Overview
The concept of green public procurement (GPP) refers to the development of criteria that
minimize the negative externalities on the environment of public expenditure on goods
and services. At the EU level, an early reference to GPP can be found in the
Communication on Sustainable Europe of 2001, which encouraged Member States
to make better use of public procurement to favour environmentally-friendly products and
services.284 The first operational indications on how to implement GPP were provided by
an Interpretative Communication on public procurement rules, also adopted in
2001, which explained the possibilities offered by current legislation of taking into account
environmental considerations in public purchases.285 This was followed by (i) the
incorporation GPP-related aspects in the revision of the Public Procurement Directives
282 On the use of the EU Ecolabel in public procurement see http://ec.europa.eu/environment/
ecolabel/ecolabel-and-green-public-procurement.html as well as the fact sheet included in the GPP
Toolkit (EC, Green Public Procurement and the European Ecolabel - Fact sheet, 2008).
283 The position of the industry was illustrated in a letter to Commissioner Tajani on 9 April 2013
accompanied by a position paper supported by Eurofer and eleven other European industry associations
(―Custom designed industrial kilns and furnaces are already sufficiently regulated – an eco-design
regulation for these installations is not needed‖, April 2013.
284 Communication from the Commission, A Sustainable Europe for a Better World: A European Union
Strategy for Sustainable Development, 15.5.2001, COM(2001)264.
285 Interpretative Communication of the Commission on the Community law applicable to public
procurement and the possibilities for integrating social considerations into public procurement,
15.10.2001, COM(2001)566.

Page 235 out of 259
approved in 2004,286 and (ii) the formulation of a comprehensive approach towards GPP
in the Communication on ‗Public procurement for a better environment‘ (‗GPP
Communication‘) adopted in 2008.287 The Public Procurement Directives contain
several references to GPP, including specific provisions on (i) the inclusion of
environmental requirements in technical specifications (Article 23(3)b); (ii) the use of eco-
labels (Article 23(6)); (iii) the setting of social and environmental conditions for the
performance of contracts (Article 26); (iv) the requirement for economic operators to
demonstrate they have met their environmental obligations (Article 27) and that they can
perform a contract in accordance with environmental management measures (Articles
48(2)f and 50); and (v) the inclusion of environmental characteristics among the criteria
that may be taken into consideration in the case of award procedures adopting the ‗most
economically advantageous‘ approach (Article 53). The GPP Communication seeks to
foster a wider use of GPP by Member States through the identification of common ‗GPP
criteria‘, with special reference to a set of ‗priority sectors‘ where GPP is deemed capable of
yielding the greatest potential impact.
Relevance for the Steel Industry
As in the case of eco-labelling discussed above, the EU legislation on GPP does not impose
any obligation on operators and therefore it exerts only an indirect impact on the steel
industry, by influencing market developments. So far, this indirect impact has been
relatively limited, due to two factors. First, most of the priority sectors for which
GPP criteria have been devised have a „distant‟ relationship with the steel
industry and this is reflected in the nature of GPP criteria. There are instances when the
linkage is stronger, namely in the case of the criterion ‗use of environmental friendly
materials‘ in the construction industry, but even in this case steel is only one of the many
materials to be considered (and, in any event, a large share of steel used in construction is
indeed the result of recycling and, therefore, can qualify as being environmental friendly).
Second, the uptake of GPP principles is still relatively modest across the EU,
with most public authorities making reference to only some of the GPP criteria, which
obviously reduces the magnitude of whatever impacts may occur.288 For instance, in the
case of the construction industry, the ‗use of environmental friendly materials‘ criterion
was present in less than one third of a sample of public procurement contracts in 2009 –
2010 period. The situation may however change in the future, as the interaction between
GPP and eco-labelling (as well as other pieces of EU legislation) is expected to become
286 Directive 2004/17/EC of the European Parliament and of the Council coordinating the procurement
procedures of entities operating in the water, energy, transport and postal services sectors; and Directive
2004/18/EC of the European Parliament and of the Council on the coordination of procedures for the
award of public works contracts, public supply contracts and public service contracts.
287 Communication from the Commission, Public procurement for a better environment, 16.7.2008,
COM(2008)400.
288 For a recent analysis of the utilization of GPP criteria see CEPS and College d‘Europe, The Uptake of
Green Public Procurement in the EU27, report submitted to DG Environment, 29 February 2012.

Page 236 out of 259
more pervasive. In particular, negative consequences may emerge in the case of steel
products that incorporate substances subject to ‗special attention‘ (such as those placed on
the candidate list under REACH, see below), which may trigger substitution with other
materials.
12.2.3 Life-Cycle Assessment Methodologies
Overview
Life-cycle Assessment (LCA) is a methodology to assess environmental impacts associated
with the various stages of a product's life, from raw material extraction through materials
processing, manufacture, distribution, use, repair and maintenance, and disposal or
recycling. Early LCA analyses focused on energy consumption, but the methodology was
quickly extended to encompass air emissions, waste water and solid waste.289 LCA is often
mentioned in EU product policy. The carrying out of LCA analyses was already envisaged
by the Directive on Packaging and Packaging Waste of 1994290 while the already
mentioned Communication on IPP291 of 2003 qualified LCA as ―the best framework for
assessing the potential environmental impacts of products currently available‖ (page 10).
More recently, recourse to LCA was also emphasized in the Resource-efficient Europe
Flagship Initiative,292 which recognizes the ―need to consider the whole life-cycle of the
way we use resources, including the value chain and the trade-offs between different
priorities‖ (page 4). However, there are instances in which a less comprehensive approach
to the assessment of environmental impacts is adopted. This is the case of the Vehicles
Emissions Regulations, i.e. the regulation on CO2 emissions from passenger cars of
2009293 and its counterpart for vans of 2001294, where emissions are considered only for
the usage phase, adopting the so called ‗tailpipe‘ approach. In other cases, EU policy relies
on variants of the LCA approach that attribute different weights to various forms of end-of-
life treatment of materials (e.g. recycling vs. recovery). This is the case, in particular, of the
methodology proposed in the recent Communication on the Single Market for
289 For a review of early developments in LCA, see Boustead I, ―LCA - How it Came About, The Beginning in
the UK‖, The International Journal of Life Cycle Assessment, volume 1, issue 3, 1996. For a
comprehensive review of LCA, see European Environment Agency, Life Cycle Assessment - A guide to
approaches, experiences and information sources, Environmental Issues Series n° 6, August 1997.
290 European Parliament and Council Directive 94/62/EC on packaging and packaging waste.
291 Communication from the Commission, Integrated Product Policy - Building on Environmental Life-Cycle
Thinking, 18.6.2003, COM(2003)302.
292 Communication from the Commission, A resource-efficient Europe – Flagship initiative under the Europe
2020 Strategy, 26.1.2011, COM(2011)21.
293 Regulation (EC) No 443/2009 of the European Parliament and of the Council setting emission
performance standards for new passenger cars as part of the Community‘s integrated approach to reduce
CO2 emissions from light-duty vehicles.
294 Regulation (EU) No 510/2011 of the European Parliament and of the Council setting emission
performance standards for new light commercial vehicles as part of the Union's integrated approach to
reduce CO2 emissions from light-duty vehicles.

Page 237 out of 259
Green Products,295 which attributes only partial credit to recycled materials as opposed
to the full credit granted to energy recovery.
Relevance for the Steel Industry
The steel industry makes substantial use of recycled materials, namely in the form of scrap
metal, and therefore the use LCA methodologies is generally seen with favour by
steelmakers. Indeed, steel industry associations at the European and world level have been
quite active in promoting the utilization of LCA.296 However, there are still differences in
the concrete application of LCA and the use of different methodological approaches may
yield substantially different results for final products made of steel. To the extent that
results of LCA exercises are expected to exert an influence on consumers‘ behaviour, the
adoption of LCA methodologies that do not (fully) take into account the recyclability of
steel may favour the utilization of alternative products, with a negative impact on steel
sales.
12.2.4 Chemical Products
Overview
The production and use of chemical products (―substances‖) and their potential impacts on
both human health and the environment is addressed by the Regulation on the
Registration, Evaluation, Authorization and Restriction of Chemical
Substances (REACH Regulation).297 The purpose of the Regulation is ―to ensure a high
level of protection of human health and the environment, including the promotion of
alternative methods for assessment of hazards of substances‖ (art. 1). This objective is to be
attained through the better and earlier identification of the intrinsic properties of chemical
substances. To this effect, the REACH Regulation introduces a system of registrations and
authorizations for all the chemical substances and the objects containing chemical
substances produced or otherwise supplied in the EU. Operational tasks related to the
implementation of the REACH Regulation are entrusted to the European Chemicals
Agency (ECHA), a decentralized EU agency. Approved at the end of 2006, the REACH
Regulation entered into force on 1 June 2007 and its provisions are to be gradually phased-
in over an eleven years period, until 2018.
295 Communication from the Commission, Building the Single Market for Green Products - Facilitating better
information on the environmental performance of products and organisations, 9.4.2013, COM(2013)196.
296 The World Steel Association has been particularly active on this front, with the development of
methodological guidance materials. See in particular World Steel Association, Life Cycle Assessment
Methodology report, 2011 as well as the position paper World Steel Association, Life cycle assessment in
the steel industry, January 2010.
297 Regulation (EC) No 1907/2006 of the European Parliament and of the Council concerning the
Registration, Evaluation, Authorization and Restriction of Chemicals (REACH), establishing a European
Chemicals Agency, amending Directive 1999/45/EC and repealing Council Regulation (EEC) No 793/93
and Commission Regulation (EC) No 1488/94 as well as Council Directive 76/769/EEC and Commission
Directives 91/155/EEC, 93/67/EEC, 93/105/EC and 2000/21/EC.

Page 238 out of 259
Key Provisions
The key principle of REACH is that the marketing of substances that have not
been registered with ECHA is unlawful, in line with the ―no data, no market‖
principle (art. 5). Registration is the responsibility of producers and importers, which can
act individually or collectively, through the mechanism of ―joint submissions‖ (art.11). To
simplify the registration process, all the manufacturers, importers and other entities
dealing with the same substance are required to form the Substance Information Exchange
Forums (SIEF). The registration process is to be implemented in stages,
depending upon the volume marketed in the EU. Substances with an annual tonnage in
excess of 1,000 tons (the so called ‗first tonnage band‘) were to be registered by the end of
November 2010. The deadline for the registration of substances with a tonnage between
100 and 1,000 tons (‗second tonnage band‘) was end May 2013, while substances traded in
amounts between 1 and 100 tons (‗third tonnage band‘) will have to be registered by May
2018. While the REACH Regulation applies to all chemical substances (estimated to be in
excess of 140,000), special provisions are envisaged for the so called
“Substances of Very High Concern” (SVHC), which are subject to a specific
authorization mechanism, and for high risk substances, whose placing on the market
may be subject to restrictions. Another key feature of the REACH Regulation is the
requirement to communicate information on substances up and down the
supply chain. This is aimed at ensuring that manufacturers, importers and the
―downstream users‖ are aware of the information relating to health and safety of the
products supplied.
Relevance for the Steel Industry
The REACH Regulation deploys its effects across all sectors and has a significant influence
on the steel industry: steel makers are subject to registration requirements for certain
products and to the obligation of providing information to downstream users while the
utilization of several substances used in the steel making process maybe subject to
authorization or restrictions. Regarding registration, the key raw materials (mineral
ores, ore concentrates, coal, coke, etc.) are exempted and the same applies to the bulk of
the industry‘s output, which is mostly comprised of ‗articles‘, i.e. objects whose shape,
surface or design are more important than the chemical composition in determining the
function and utilization. In practice, steel makers are required to register: (i) some
intermediate products, namely sinter and some liquid or solid iron products when they
have no particular shapes (e.g. pig iron, directly-reduced iron, hot-briquetted iron) and are
manufactured from non-recovered sources, and (ii) by-products (such as coke oven by-
products), to the extent that they are placed on the market (i.e. they have a non-waste
status). The requirement to provide information to downstream users entails the
development and dissemination of technical documentation to ensure the safe use of
products. However, the classification of steel products as ‗articles‘ in most cases results in
lighter information requirements compared with what envisaged for substances.
Potentially more far reaching effects are associated with the authorization and
restriction mechanism, as it may influence the availability of some key substances used

Page 239 out of 259
in the steel making process. In case a certain substance becomes unavailable, it is
necessary to look for alternatives, which given the complex nature of the steel making
process, usually entails a significant increase in costs. Potentially even more important, the
authorization/restriction mechanism may influence market developments, as users of
certain steel products may be induced (due to cost and/or quality considerations) to
consider switching to alternative products.
12.2.5 Construction Products
Overview
EU initiatives in this area concern the performance of products used by the construction
industry, including steel products, as well as the environmental performance of buildings.
The main legislative measures and policy initiatives include: (i) the Strategy for the
competitiveness of the construction sector;298 (ii) the Directive on the energy performance
of buildings;299 and (iii) the Construction Products Regulation.300 The Strategy for the
competitiveness of the construction sector addresses the broad theme of the
development of the construction industry. Adopted in mid 2012, the Strategy formulates a
number of proposals for short and medium-long term measures aimed at increasing the
contribution of the construction sector to Europe‘s sustainable growth. In this context,
special emphasis is placed on the issues of improving resource efficiency and
environmental performance. The achievement of higher levels of energy efficiency (the
―nearly-zero energy building‖ concept) is the objective of the Directive on the energy
performance of buildings. A recast of previous legislation from the early 2002, the
Directive lays down a comprehensive framework to achieve the target of ‗nearly-zero
energy buildings‘ by 2020. In particular, the Directive requires Member States (i) to
develop a methodology for calculating the energy performance of buildings, (ii) to set
minimum requirements for energy performance in order to achieve cost-optimal levels,
and (iii) to establish a system for the energy performance certification of buildings. The
theme of product performance is addressed by the Construction Products
Regulation, whose purpose is to create a set of ―harmonised rules on how to express the
performance of construction products in relation to their essential characteristics‖ (art. 1).
To this effect, the Regulation provides a ‗common technical language‘ on the performance
of products that can be used by all parties involved and establishes a system for attesting
the performance of products, in particular through the generalization of the use of the CE
Mark.
298 Communication from the, Strategy for the sustainable competitiveness of the construction sector and its
enterprises, 31.7.2012, COM(2012)433.
299 Directive 2010/31/EU of the European Parliament and of the Council on the energy performance of
buildings (recast).
300 Regulation (EU) No 305/2011 of the European Parliament and of the Council laying down harmonised
conditions for the marketing of construction products and repealing Council Directive 89/106/EEC.

Page 240 out of 259
Relevance for the Steel Industry
The Strategy for the construction sector and the Directive on the energy
performance of buildings have only a limited, indirect influence on the steel industry.
For instance, the Strategy emphasizes the re-use, recycling and recovery of construction
and demolition waste, including metal. However, the matter is extensively covered by
other pieces of EU legislation (i.e. the Waste Framework Directive) and the Strategy only
reiterates the objectives previously set. More directly relevant is the Construction
Products Regulation, which is immediately applicable to operators and extends to steel
products used in the construction industry. In particular, the Regulation introduces the
mandatory CE-marking for all construction products starting from 1 July 2013 and from 1
July 2014 for fabricated structural steel works. At the same time, the Regulation entails a
simplification of the pre-existing legal framework, with the elimination of inconsistencies
and the harmonization of procedures, thereby reducing the administrative burden placed
upon producers.301
12.3 Assessment of Compliance Costs
12.3.1 Introduction
Compliance costs refer to the expenses incurred by operators to fulfill the substantive
obligations spelled out in the EU legislation. These costs typically take the form of
incremental operating and/or investment costs. However, whenever the regulatory regime
exerts an influence on market developments, operators may also face additional costs, in
the form of reduced or missed business opportunities. In the case of EU product policy,
compliance costs for steel makers originate primarily from the legislation regulating the
production, use and commercialization of chemical products, i.e. the REACH Regulation.
The concept of compliance costs is in principle applicable also to measures regulating
construction products, although – as it will be shown below – in practice the magnitude of
these costs appears to be negligible. Instead, no compliance costs are connected with EU
actions in eco-labelling, green procurement and LCA, as the relevant legislative and policy
documents do not impose any specific obligation upon the operators.
12.3.2 Compliance Costs Linked to the REACH Regulation
In the case of the REACH Regulation compliance costs refer to the expenditures
associated with the need to replace chemical substances whose utilization
has not been authorized or is subject to restrictions. Given the complex nature of
the steel making process (especially in the case of integrated producers), the replacement
of substances is generally an intricate matter, as usually there are no viable alternatives
that can be bought ‗off shelf‘. In most cases, the replacement of substances implies
significant changes in the production process, usually entailing an increase in operating
301 On this point, see Eurofer, Annual Report 2009, page 18.

Page 241 out of 259
costs and, at times, requiring some investments.302 In other cases, substitution may be
technically feasible and not too onerous, but may affect the properties of the final product,
which may or may not be acceptable by customers.303 The authorization mechanism
established by the REACH Regulation is not yet fully operational and so far no
authorization has been granted or denied. Similarly, the restrictions on the use of
dangerous substances imposed under REACH do not seem to have affected any important
substance used by the steel industry. However, the simple nomination of certain
substances for future authorization (i.e. the placing of substances on the so called
‗candidate list‘) is generating an „announcement‟ effect, triggering the removal
of certain substances from the market even before any decision is formally
made. The problem was already indentified by earlier studies304 and is confirmed by steel
industry representatives, who lately have been notified of the upcoming withdrawal of
some substances (e.g. nickel salts used in the electro-deposition process for metallic
coatings).305
According to industry representatives, the „announcement‟ mechanism may also
influence the behaviour of downstream users of steel products, with
potential consequences on market developments. This is particularly the case of
steel products used for consumer products (e.g. tin cans), as downstream users are
obviously very sensitive to anything even remotely linked to consumers‘ health and safety.
In these cases, irrespective of the actual risk profile of the final steel products, the
uncertainties associated with the authorization process and/or the inability to quickly find
302 For instance, one of the steel companies interviewed mentioned the case of the replacement of a certain
pigment, which entailed an increase in operating costs in the order of € 2 million/year, plus an increase in
the use of energy (with the new substance, more paint has to be applied, which requires more spraying).
303 This is the case, for instance, of the replacement of certain substances in the production of some steel
products used in the construction industry. Although the structural features of the products remain the
same, additional precautions have to be adopted in storage, and this is resisted by customers in the
construction industry, who tend to favor sturdier products.
304 See CSES, Interim Evaluation: Functioning of the European chemical market after the introduction of
REACH, 30 March 2012 and CSES, Interim Evaluation: Impact of the REACH Regulation on the
innovativeness of the EU chemical industry, 14 June, 2012. The latter report, in particular, notes that
―Premature de-selection of substances (―blacklisting‖) is also a major issue‖ (page vii) and that ―A further
result has been the ―blacklisting‖ of substances used in sectors such as metals, construction chemicals,
printing inks, or paints and coatings. Companies decide to remove substances or not to use them to avoid
the extra costs of compliance related to use of those substances‖ (page 71).
305 It should be noted that the ‗announcement‘ effect associated with the ‗candidate list‘ is not a novelty and
indeed its possible role in accelerating the replacement of unwanted substances was extensively analyzed
in the preparatory works for the REACH Regulation. See in particular Ökopol, Case study on
―Announcement effect‖ in the market related to the candidate list of substances subject to authorisation,
January 2007. Based on the analysis of other ‗substance lists‘ used in various countries, the study
concluded that ―The candidate list will be appreciated as an EU-wide agreed list and implemented as a
black list by many companies. This way substitution of identified SVHC will be promoted‖ (page 13).

Page 242 out of 259
suitable substitutes for substances placed on the ‗candidate list‘ might trigger the
substitution of steel with other materials, with potentially negative effects on sales.306
Overall, between one third and one half of the substances placed on the ‗candidate list‘ are
considered to be relevant to the steel industry (chromate compounds, cobalt salts, lead
compounds, borates, RCF, coal tar pitch, etc.) and EU steelmakers are obviously concerned
about the possible long term consequences of the REACH authorization mechanism. Some
estimates provided by the industry, referred to a selection of substances and products, put
at € 100 to 200 million/year the future potential loss due to problems linked to the need of
replacing substances on the ―candidate list‖. As these figures could not be independently
verified during the study, further analysis would be necessary in order to verify any side-
effects of the REACH regulation on steelmakers.
12.3.3 Compliance Costs Linked to the Construction Products Regulation
In the case of construction products, compliance costs refer to the expenses
incurred (i) to ensure that the products display the required properties (the
“essential characteristics”); and (ii) in documenting the performance of
products. Regarding the first aspect, the Construction Products Regulation does not seem
to have had any material impact, as the ‗essential characteristics‘ are specified in
harmonized standards that have been gradually developed over more than a decade in the
framework of the previous Construction Products Directive. The main innovation
introduced by the Regulation concerns the mandatory use of the CE Mark to attest the
certified performance of products. However, even the CE-marking is not a major novelty,
as the system was already in use in most Member States under the previous Directive, with
the only exception of Sweden, Finland, Ireland and the United Kingdom. This is
particularly the case of the steel industry, where the use of the CE Mark is quite widespread
for a variety of products, including those used in the construction sector.307 Even in
countries where the CE Mark was not mandatory, the system seems to have been used by
leading producers on a voluntary basis.308 Overall, the EU legislation on
construction products does not seem to have resulted in significant
incremental costs for the steel industry.
306 This point was also noted by earlier studies, in particular in the above mentioned study from CSES on the
innovativeness of the EU chemical industry (―there is a great deal of unease in the industry about the
candidate list as we have been told repeatedly that [downstream users] and final customers often have
very little understanding of what the candidate list actually means: the substances in question have not
yet been evaluated but they are considered unsafe. So there are often ―unwarranted‖ requests for their
removal‖, page 71). 307 The earliest reference to the CE-marking of steel products for construction located during the study dates
back to the late 1990s, when Eurofer was announcing that, following to the completion of the relevant
standardization work,―CE-marked steel products may be available in 2001‖ (see Eurofer, Annual Report
1999, Brussels, 2000, page 30).
308 For instance, already in 2006 (i.e. five years before the approval of the Regulation) Corus UK was
reporting to have ―independent approval to CE-mark its hot-rolled structural steels‖ (see Corus Strip
Products UK, CE marking for steel, 2006).

Page 243 out of 259
12.4 Assessment of Administrative Costs
12.4.1 Introduction
Administrative costs refer to the expenses incurred operators to fulfill the administrative
requirements spelled out in legislation (e.g. the registration with a certain entity, the
provision of information, etc.). Administrative costs may include a wide range of cost
items, from the payment of registration fees to the cost of personnel handling the relevant
administrative procedures. In the area of product policy, the main source of administrative
costs is the REACH Regulation. In the case of the legislation on the construction products,
administrative obligations (e.g. the issuance of the declarations of performance, which
leads to the affixing of the CE Mark) are not easily separable from compliance costs, which
– as indicated in the previous section – are regarded to be of limited importance. The other
pieces of product legislation do not impose specific requirements upon operators and
therefore do not give origin to administrative costs.
12.4.2 Administrative Costs Linked to the REACH Regulation
The analysis of administrative costs linked to the REACH Regulation focused on six main
types of obligations, namely: (i) the registration of substances; (ii) the updating of
registrations; (iii) the pre-registration of substances; (iv) the notification of SVHC in
articles; (v) the requirement to provide information to downstream users; and (vi) the
submission of documentation as part of the authorization/restriction process for
dangerous substances. The analysis focuses primarily on the costs incurred since up to end
2012, although some indications are also provided regarding future costs. The information
used in the analysis was largely obtained from industry sources (Eurofer and interviews
with individual steel makers), with some additional elements derived from ECHA reports
and earlier evaluations of REACH.309 The key parameters used in the analysis are
presented in Box 6 here below.
309 Reference is made in particular to ECHA, Registration Statistics, 5 April 2013; ECHA, Evaluation under
REACH - Progress Report 2011, 2012; and CSES, Interim Evaluation: Functioning of the European
chemical market after the introduction of REACH, 30 March 2012.

Page 244 out of 259
Box 6 Administrative Costs Linked to REACH - Key Parameters
Registration of Substances – First Tonnage Band
The registration of substances involves the submission of an application to ECHA, supported by technical
documentation. In the case of the registration for the first tonnage band (i.e. up to end 2010), the steel
industry took responsibility for 9 SIEF, whose activities were coordinated by three large companies acting as
Lead Registrants (ArcelorMittal for iron and compounds, Corus for iron oxides, ThyssenKrupp for steel
slags). However, steel companies also participated in a non leading position in the registration of other
substances. Overall, the steel industry is estimated to have contributed to the registration of about 20
substances, with a total of some 200 – 250 dossiers submitted. According to Eurofer, the costs incurred by
the three Lead Registrants were in the € 22 to 30 mln range, including ECHA registration fees, the cost for
the functioning of SIEF, and the cost for background studies. These figures also include part of personnel
costs, which however cannot be determined accurately, due to the large number of functional units involved
in the process. Considering the likely underestimation of personnel and, more importantly, the costs incurred
by steel makers participating in other SIEF not in a leading position, the total administrative costs incurred
by the steel industry for the period up to end 2010 can be guess estimated at € 50 mln.
Registration of Substances – Second and Third Tonnage Bands
Costs for the second and third tonnage bands (i.e. over the 2011 – 2018 period) are expected to be much
lower, due to the limited number of substances concerned. Still, the steel industry is taking responsibility for
the registration of some imported substances for which the producers are unwilling to sustain the
registration costs in view of the shrinking EU market. Overall, administrative costs are guess estimated at
one tenth of the value recorded for the first registration period, i.e. € 5 mln, of which € 2 mln for the period
2011-2012 and € 3 mln for the 2013-2018 period.
Updating of Registrations
Registrations have to be periodically updated, to reflect new empirical evidence on the effects of substances.
This involves the modifications of dossiers submitted at the time of the initial registration. Updating may also
be requested by ECHA. The frequency of updating varies. For instance, the dossiers for iron substances are
expected to be updated in 2013 for the first time since the initial registration in 2010. The same applies to the
five dossiers for ferrous slag, which will have to be updated for the first time due to the availability of new
study results. Previously, the dossiers for coke-oven products had to be updated significantly upon request
from ECHA. The costs of updating includes two components, namely (i) a variable cost, linked to the
expenditures incurred for the updating of specific dossiers, and (ii) a fixed cost, linked to the constant
monitoring of developments for various substances, carried out by consortia of producers. Both variable and
fixed costs vary, depending upon the nature of the updating and the more or less elaborate structure of
consortia. Overall, the administrative costs of updating can be assumed to be in the order of € 1 mln/year.
This implies a total cost of € 2 mln for the period up to 2012 and of € 6 mln for the 2013-2018 periods.
Pre-Registration of Substances
During the pre-registration phase, operators were required to submit applications with ECHA through a
dedicated IT system. The number of applications received by ECHA was quite substantial, about 2.7 mln, i.e.
15 times larger than initially envisaged, as many operators tended to adopt a ‗just in case‘ approach. Pre-
registration was the first stage in the implementation of REACH and de facto coincided with the
familiarization with the regulation. The parameters used for the analysis are as follows:
Population: the number of pre-registrations made by the steel industry is not known. According to
industry sources, it is possible that steelmakers have pre-registered a large number of substances as a
precautionary measure. For instance, a single company is reported to have pre-registered no less than
800 substances. Another source mentions the case of a large manufacturer of basic metals pre-

Page 245 out of 259
registering around 50 substances. For the purpose of the exercise, a total of 5,000 pre-registrations for
the whole steel industry was assumed;
Frequency: pre-registration occurred only once, in the period between 1 June and 1 December 2008;
Costs: pre-registration did not involve the payment of any fee to ECHA and the costs incurred by
operators were essentially linked to the human resources devoted to the process. As pre-registration was
the first step in the implementation of REACH, operators also had to spend time to understand the
obligations under the Regulation, and to collect data. Based on the little information presented in earlier
studies, a cost of € 1,000 per pre-registration was assumed.
Notification of SVHC in Articles
Notification is mandatory when ‗articles‘ contain more than one tonne per year or when the concentration in
articles is more than 0.1% weight by weight. Notification can be avoided if the producer or importer can
demonstrate that there is no exposure to humans or the environment during normal and foreseeable
conditions of use (including disposal). Notification affected only marginally the steel industry, as the
presence of certain SVHC (e.g. chromium trioxide) was already well documented in registration dossiers, and
limited effort was required. Overall, industry sources regard the administrative costs linked to the
notification process as marginal and, therefore, this item was not included in the analysis.
Provision of Information to Downstream Users
The REACH Regulation requires operators supplying dangerous substances to provide information to
downstream users in the form of Safety Data Sheets (SDS). However, this applies to only some steel makers,
typically using the BOF route. Manufacturers of articles, the most common situation in the steel industry, are
subject to lighter requirements, i.e. the provision of information to permit safe use and disposal, which is
done through the so called Safety Information Sheets (SIS). In the case of some products (namely, stainless
steel) the template SIS was developed by Eurofer, while individual steel makers took responsibility of
developing SIS for other products. The parameters used for the analysis are as follows:
Population: based on industry sources, the number of substances requiring an SDS is estimated at 875,
assuming an average of 25 substances requiring an SDS for each of the 35 BOF plants in operations. The
number of SIS is impossible to estimate with any degree of precision, due to a variety of factors (the
number of products requiring a SIS varies across companies, the same – or very similar - SIS might have
been used by companies belonging to the same group, etc.). For the purpose of the study, a guess
estimate of 3,700 SIS was retained, assuming an average of 20 articles requiring a SIS for each of the 185
steel plants (BOF and EAF) in operation;
Costs: little information is available of the costs of SDS/SIS. Earlier studies suggest the existence of
significant variations: for instance, some companies had to invest in IT applications to help in the
development of large numbers of SDS while others relied on external experts producing SDS for as little
as € 200 apiece (plus translation costs, in the order of € 100 – 300 per language). For the purpose of this
exercise, the unit cost of SDS was guesstimated at € 2,000 while SIS was assumed to cost € 1,000 apiece.
Preparation of Dossiers Authorization and Restrictions
The authorization and restriction processes require on intensive interaction with the operators concerned,
involving the submission of fairly complex dossiers (including a detailed analysis of the effects of substances,
a socio-economic analysis, etc.). So far the number of authorization dossiers submitted by the steel industry
is fairly small, seemingly less than ten. The cost for the preparation of dossiers is extremely variable,
depending upon a number of factors (the intrinsic complexity of the matter, the number of companies having
an interest in the substance, the level of familiarity of interested companies in working together, etc.) and is

Page 246 out of 259
usually spread over several years. Examples offered by industry representatives range from a minimum of €
100,000 for a very simple dossier submitted by a single company to an estimated € 3 mln (possibly more) in
the case of a dossier involving a large number of companies (about 150), with an intermediate value of about
€ 300,000 for a moderately complex dossier developed by a fairly small groups of operators with good
experience in working together. 310 Based on these parameters, the administrative costs incurred by the steel
industry for the period up to 2012 were grossly estimated at some € 5 mln. This figure is likely to increase
considerably in future years, as the attention will be gradually focused on the many other substances that are
of potential interest for the steel industry but, given the extreme diversity of situations that could emerge, no
estimate can be provided.
Based on the above parameters, total administrative costs incurred by the steel
industry up to end 2012 in connection with the REACH Regulation can be
estimated at about € 69.5 mln. About three quarters of these costs refer to the
registration process proper, with pre-registration and the updating of registrations
cumulatively accounting for another 10%. The provision of information to downstream
users and the preparation of authorization dossiers account for the remaining 15%. Data
for BOF and EAF producers are available separately only for some cost items of limited
importance, namely the cost of providing information to downstream users. However,
available information suggests that BOF producers are significantly more affected by the
REACH Regulation than their EAF counterparts. Overall, administrative costs for BOF
plants can be roughly estimated at about € 50 mln, while the corresponding figure for EAF
producers is € 19.5 mln.311
Table 47 Summary of Cumulated Administrative Costs Linked to the REACH Regulation (€
mln)
Cost Items Costs Incurred up
to end 2012
Expected Costs for
the 2013 – 2018
Period
Registration of Substances 52.0 3.0
Updating of Registrations 2.0 6.0
Pre-registration of Substances 5.0 0.0
Provision of Information to
Downstream Users 5.5
n.a. (presumably very
low)
Preparation of Dossiers
Authorization and Restrictions 5.0
n.a. (presumably quite
substantial)
Total 69.5 n.a.
310 In principle, some of the costs incurred by consortia can be recouped by charging fees for the letters of
access. However, this simply shifts (part of) the costs among the various players, without altering the
overall cost borne by the industry.
311 Based on the assumption that BOF producers account for 75% of the costs not related to the provision to
downstream users.

Page 247 out of 259
Although the Regulation was approved at end 2006, administrative costs were mostly
incurred over the five-year period spanning from 2008 through 2012, probably with a peak
in 2010, in correspondence with the deadline for the registration of substances falling in
the first tonnage band. Average annual costs for the period are in the order of € 14 mln per
year. When compared with the average crude steel output for the period, average
annual administrative costs can be estimated at about € 0.08 per tonne, with
a higher value for BOF producers, about € 0.10/tonne, and a significantly lower figure for
EAF, around € 0.05/tonne.
Figure 72 Annual Average Administrative Costs of REACH Regulation (€/tonne)
Source: Authors‘ elaborations on various data
The REACH Regulation is expected to continue generating administrative costs for the
steel industry at least until 2018, when the registration process will be completed and the
mechanism for authorizations and restrictions mechanism will be well under way. In
future years the costs are expected to come predominantly from the preparation of dossiers
for substances on the candidate list and of similar documentation related to the restriction
process, with much lower costs linked to the registration of new substances and the
updating of registrations submitted in previous years. While no estimate of future
administrative costs can be provided, the burden for the steel industry is
expected to be quite substantial, possibly in the same order of magnitude
recorded for the period up to 2012.
12.5 Assessment of Indirect Costs
12.5.1 Introduction
Strictly speaking, indirect costs are defined as the costs borne by steel makers as
consequence of regulatory provisions not addressed to them but rather to their
0.000
0.020
0.040
0.060
0.080
0.1 00
0.1 20
BOF Producers EAF Producers Ov erall Av erage
Page 248 out of 259
counterparts. In practice, indirect costs arise in the form of higher costs paid by
steelmakers as a result of the influence exerted by EU legislation on operators active at
other stages of the value chain, typically suppliers of key inputs. In the case of product
policy, the notion of indirect costs can be broadened to encompass the negative side effects
resulting from legislative provisions and policy orientations that may affect developments
in the market for final products. Two instances of indirect costs can be identified, one
linked to eco-labelling legislation, and one connected with the use of different LCA
methodologies.
Indirect Costs Linked to Eco-labelling Legislation
Eco-labelling systems are intended to influence consumer preferences and the granting or
denial of an eco-label may exert significant impact on market developments. This is
particularly the case when eco-labels and are used in public procurement, which for certain
products accounts for a large share of the final consumption. In the case of the steel
industry, problems have emerged in connection with the presence of nickel in
stainless steel. Nickel is known for having negative health effects: it is considered as
potentially carcinogenic by inhalation, it is a skin sensitizer, etc. These undesirable effects,
however, do not extend to nickel containing stainless steels (which account for about 70%
of all stainless steel) and this is why stainless steel is so much used in food contact, medical
devices, jewellery, etc. without any adverse effects observed. Yet, the presence of nickel
may prevent the granting of the EU eco-label to products containing stainless steel. For
instance, an issue emerged in the past regarding the eco-labelling of certain office
equipment (PCs and laptops) due to the presence nickel in stainless steel. The problem was
solved in 2010 with a decision European Union Ecolabel Board, but it is expected to
resurface in the future. So far, the steel industry has only incurred in some operational
costs to ensure that exemptions are asked for each eco-labelled product and that
exemptions are effectively granted. However, if problems were to continue in the future,
EU eco-labelling rules might result in a serious barrier to the use of stainless
steel, with potentially serious consequences in terms of lost sales.
Indirect Costs Linked to Different LCA Methodologies
While the basic tenets of LCA have been progressively refined over time and can be
regarded as well accepted, there are still significant differences in the way in which LCA is
concretely applied to specific cases. In the case of the steel industry the main issue refers to
the treatment reserved to scrap metal, which in an LCA perspective obviously constitutes
one of the key advantages of steel over competing products. In this respect, issues have
emerged with the methodology for the calculation of the Product Environmental Footprint
(PEF) proposed in the recent Communication on the Single Market for Green Products.312
In fact, the PEF methodology, somewhat at odds with the waste hierarchy stipulated in the
312 The methodology is presented in detail in an annex to above mentioned Communication. See Annex II:
Product Environmental Footprint (PEF) Guide.

Page 249 out of 259
Waste Framework Directive, attributes only partial credit to recycled materials as opposed
to the full credit granted to energy recovery. As the PEF methodology is expected to be
applied for the development of benchmarks to assess the degree of environmental
friendliness of a variety of products, the steel industry is concerned that the positive
feature of steel may not be fully accounted for, with potential negative long
term effects compared with competing products.313 However, it should be noted
that the methodology is still in the testing phase and that the Commission has already
indicated its willingness to consider alternative approaches. Therefore, the potential
negative effects on future market developments are at this stage highly
hypothetical and may well not materialize.
313 The position of the steel industry is presented in the joint position paper Eurofer – Eurometaux –
European Aluminium Association, Ferrous and non-ferrous metals comments on the PEF methodology,
Brussels, 25th April 2013.

Page 250 out of 259
SELECTED REFERENCES
ACER/CEER (2012), ACER/CEER Annual Report on the Results of Monitoring the
Internal Electricity and Natural Gas Markets in 2011, 29 November 2012
Barnett, D.F. and R. W. Crandall (1986) ‗Up from the Ashes: The Rise of the Steel Minimill
in the United States‘, The Brookings Institution.
Bhagwat, M. (2012), ―Renewable Energy Support Schemes‖, Power Point Presentation,
IFIEC Brussels, 19 June 2012
Birat J. P. and J. P. Lorraine (2009) The ―Cost Tool‖ operating capital costs of cxisting and
breakthrought routes in a future studies framework, ULCOS
BKP Development (2012) Evaluation of the European Union‘s Trade Defence Instruments
report commissioned by the European Commission, available
at:http://trade.ec.europa.eu/doclib/docs/2012/march/tradoc_149236.pdf
Boston Consulting Group (2007) Beyond the Boom - The outlook for Global Steel
Boston Consulting Group (2013) Steel‘s Contribution to a Low Carbon Europe 2050
Boustead I. (1996) ―LCA - How it Came About, The Beginning in the UK‖, The
International Journal of Life Cycle Assessment, volume 1, issue 3, 1996
Carlton, D. and J. Perloff (2005) Modern Industrial Organisation, Upper Saddle River:
Pearson
Clifford, E. and M. Clancy (2011): Impacts of Wind Generation on Wholesale Electricity
Costs in 2011, SEAI/EirGrid, Ireland.
Crompton, P. and J. Lesourd (2004) ‗Economies of scale in the global iron-making
industry‘, The University of Western Australia, Department of Economics. Working Papers
No. 04-23
Datamonitor (2011) Industry Profile – Steel, www.datamonitor.com
Datamonitor (2011) Steel in Western Europe
Deloitte (2013) Benchmarking study of electricity prices between Belgium and
neighbouring countries
Ecofys, Fraunhofer Institute for Systems and Innovation Research, and Öko-Institut
(2012) Study for the European Commission ―Methodology for the free allocation of
emission allowances in the EU ETS post 2012 ,Sector report for the iron and steel
industry‖ Available at: http://ec.europa.eu/clima/
policies/ets/cap/allocation/docs/bm_study-iron_and_steel_en.pdf

Page 251 out of 259
Ecorys (2008) Study on the Competitiveness of the European Steel Sector, Study for DG
Enterprise and Industry of the European Commission
ENTSO-E (2012), Overview of transmission tariffs in Europe: Synthesis 2012.
EPA – Environmental Protection Agency (1995) Profile of Iron and Steel Industry, Sector
Notebook Project
Ernst and Young (2012) Global Steel (2011 trends, 2012 outlook)
EUROFER (2009) Eurofer annual report 2009, available at:
http://www.eurofer.be/index.php/eng/News-Media/Annual-Report/2009-Annual-
Report2
EUROFER (2010) Eurofer annual report 2010, available at:
http://www.eurofer.be/index.php/eng/News-Media/Annual-Report/2010-Annual-Report
EUROFER (2010) Public consultation future EU trade policy, available at:
http://www.eurofer.org/index.php/eng/content/download/12160/62656/file/Public%20c
onsultation%20future%20EU%20trade%20policy_EUROFER%20_August%202010_-
1.pdf
Eurometal (2013) Fitness Check Steering Group Documentation, Presentation
European Environment Agency (1997) Life Cycle Assessment - A guide to approaches,
experiences and information sources, Environmental Issues Series n° 6, August 1997
Eurostat (2011) NACE Rev. 2 - Statistical classification of economic activities
Eurostat (2013) Glossary, available at:
http://epp.eurostat.ec.europa.eu/statistics_explained/index.php/Glossary:Value_added_
at_factor_cost
Federacciai (2011) Rapporto Ambientale presented at the 2012 annual meeting
Haley U. C. V. and G. T. Haley (2012) Subsidies to Chinese Industry: State Capitalism,
Business Strategy, and Trade Policy, Oxford University Press
International Energy Agency (2008), Energy Prices and taxes, Quarterly Statistics, fourth
quarter 2008.
International Energy Agency (2012), Energy Prices and taxes, Quarterly Statistics, first
quarter 2012.
International Energy Agency (2013), Energy Prices and taxes, Quarterly Statistics, first
quarter 2013.

Page 252 out of 259
Joint position paper Eurofer – Eurometaux – European Aluminium Association (2013),
Ferrous and non-ferrous metals comments on the PEF methodology, Brussels, 25th Apr
2013.
Klimont Z. and others, Modelling Particulate Emissions in Europe - A Framework to
Estimate Reduction Potential and Control Costs, Interim Report IR-02-076
Lienemeyer, M. (2005) ‗State aid for restructuring the steel industry in the new Member
States‘, Competition Policy Newsletter, Number 1, Spring, p.94
Luiso F. (2012) ‗La modulazione degli oneri generali del sistema elettrico sui client-
Confronto tra Italia, Germania e Francia‘, L‘Energia Elettrica, Vol. 89, No. 6
Madar, D. (2009) Big Steel, Toronto: UBC Press
O'Brien, P. (1992) ‗Industry Structure as a Competitive Advantage: The History of Japan's
Post-war Steel Industry‘, in Harvey, C. and G. Jones (eds.) Organisational Capability and
Competitive Advantage, London: Frank Cass.
OECD – Organisation for Economic Co-operation and Development (2013) Economic
Surveys: China, OECD.
OECD – Organisation for Economic Co-operation and Development (2001), Glossary of
Statistical Terms, available at: http://stats.oecd.org/glossary/
Ogaki Y., Tomioka K., Watanabe A., Arita K., Kuriyama I., and Sugayoshi T. (2001), NKK
Technical Review, No. 84
Pardo N., J.A. Moya, K. Vatopoulos (2012) Prospective Scenarios on Energy Efficiency and
CO2 Emissions in the EU Iron & Steel Industry, Joint Research Centre
Podpiera, R. (2006) ‗Progress in China‘s Banking Sector Reform: Has Bank
BehaviorChanged?‘, IMF Working Paper WP/06/71, http://www.imf.org/external/
pubs/ft/wp/2006/wp0671.pdf
Pöyry (2010) ‗Wind Energy and Electricity Prices – Exploring the ‗Merit Order Effect‘‘, the
European Wind Energy Association (EWEA)
Reuster L. und U. Nestle (2012), Reform der Begünstigung der Industrie bei der EEG-
Umlage, Forum Ökologisch-Soziale Marktwirtschaft e.V., Commissioned by Greenpeace,
10/2012.
Rovegno L. and Vandenbussche H. (2011) ‗A comparative analysis of EU Antidumping
rules and application‘, Institu de Recherches Economique et Sociales de l‘Université
catholique de Louvain, Discussion Paper 2011-23
Sato, H. (2009) ‗The Iron and Steel Industry in Asia: Development and Restructuring‘,
Institute of Developing Economies Discussion Paper N. 210.

Page 253 out of 259
Sensfuß, F., M. Ragwitz and M. Genoese (2008) ‗The Merit-Order Effect: A Detailed
Analysis of the Price Effect of Renewable Electricity Generation on Spot Market Prices in
Germany‘, in Energy Policy, Vol. 36, pp. 3086-3094.
Steel Business Briefing & EuroStrategy Consultants (2010) SBBs World Steel Capacity
Book (The World Steel Capacity Book: Current and Planned Production Facilities)
Taube M. and P. T. in der Heiden(2008) The State-Business Nexus in China‘s Steel
Industry – Chinese Market Distortions in Domestic and International Perspective,
Report prepared on behalf of Eurofer European Confederation of Iron and Steel Industries,
Brussels
Toff J. Edwars (2011) ‗China‘s Power Sector Restructuring and Electricity Price Reforms‘,
in Asia Paper 6.2, Brussels Institute of Contemporary China Studies.
Van den Bergh, R.K. (1997) ‗Wer schützt die europäischen Verbraucher vor dem Brüsseler
Verbraucherschutz? Zu den möglichen adversen Effekten der europäischen Richtlinien
zum Schutze des Verbrauchers‘, in C. Ott and H.-B. Schäfer (eds.) Effiziente
Verhaltenssteuerung un Kooperation im Zivilrecht (Tübingen; Mohr Siebeck)
VITO (2007), Sectoral Costs of Environmental Policy
Worldsteel (2011) Steel Statistical Yearbook 2011
Worldsteel (2012) Steel Statistical Yearbook 2012

Page 254 out of 259
Annex 1:
Interviews (in person, by phone or via e-mail)
Commission Services
CLIMA
COMP
EMPL
ENERGY
ENV
EUROSTAT
MARKT
RTD
TRADE
Stakeholders Enrico Gibellieri (last president of the ECSC)
Eurofer
general introductory meeting,
climate change experts;
energy experts,
trade experts,
environmental policy expert
REACH expert
ESTA
ESTEP
Euroalliage
Eurometal
Federacciai (Italian national steel federation)
IIASA IndustriAll
ISTAT Wirtschaftsvereinigung Stahl - Stahlinstitut VDEh im Stahl-Zentrum Wirtschaftsvereinigung Stahl (German national steel federation)
Worldsteel
Companies and Plant Operators Company 1 (for trade policy) Company 2 (for commodity markets) Plants 3, 4 and 5 (for Environmental Policies, Climate Change, Energy, Trade)

Page 255 out of 259
Plant 6 (for Climate Change) Company 7 (for REACH)

Page 256 out of 259
Annex 2
Background Information on Compliance Costs of Environmental
Policy
Investment Costs – Basic Data from Surveys and Other Sources
Table A Environmental Protection Investments - Selected Countries, 2003-2010 – Steel
Industry (€ million)
2003 2004 2005 2006 2007 2008 2009 2010
Germany 35.0 48.5 50.4 67.7 62.8 66.0 70.5 58.1
Spain 68.6 78.5 70.7 73.6 98.1 80.9 64.5 55.5
France 17.0 29.0 19.3 16.3 28.8 31.4 32.2 25.7
Italy 70.5 76.0 121.3 86.3 149.4 217.0 159.2 111.4
United Kingdom 7.6 12.4 2.9 2.8 22.4 4.7 3.5 2.5
Austria 17.7 30.8 25.9 15.3 12.5 51.9 37.3 22.7
Belgium 2.6 12.1 15.3 9.4 34.2 16.7 13.1 11.7
Total 219.1 287.3 305.8 271.3 408.3 468.6 380.2 287.6
Source: EUROSTAT - Steel Survey and own estimates
Notes: with the exception of Italy (for which national data are available) data for the years 2009 and 2010
were estimated on the basis of the ratio of environmental investments to total investments in the steel
industry according to SBS statistics. The same applies for the figure for Belgium in 2004.

Page 257 out of 259
Table B Environmental Protection Investments - Selected Countries, 2003-2010 –
Manufacture of Basic Metals (€ million)
2003 2004 2005 2006 2007 2008 2009 2010
Germany 138.7 186.0 127.8 144.4 203.2 172.0 145.2 180.0
Spain 75.8 66.0 72.7 102.0 116.4 134.4 78.4 76.5
France 93.9 44.3 84.5 94.2 73.1 125.6 52.1 75.7
Italy 118.8 40.4 59.7 29.0 91.2 134.4 78.4 76.5
United Kingdom 17.6 20.0 15.5 27.4 28.7 178.5 39.5 27.0
Austria 40.4 24.3 45.3 62.9 53.7 55.8 51.2 43.4
Belgium 22.6 8.0 26.4 40.1 40.3 17.7 22.2 33.4
Total 507.8 389.0 431.9 500.0 606.6 818.4 467.0 512.5
Source: EUROSTAT - EPE Survey and own estimates
Notes: data for Italy in 2005 and Germany in 2006 and 2007 were estimated on the basis of the ratio of
environmental investments to total investments in the metals industry according to SBS statistics. The figure
for Germany in 2010 was guess estimated based on national data.
Table C Environmental Protection Investments - Germany, 2003-2010 (€ million)
2003 2004 2005 2006 2007 2008 2009 2010
Steel Survey 35.0 48.5 50.4 67.7 62.8 66.0 70.5 58.1
EPE Survey 138.7 186.0 127.8 144.4 203.2 172.0 145.2 180.0
VDEh Data 93.0 117.0 120.0 169.0 142.0 137.0 82.0 n.a.
Source: EUROSTAT – EPE/Steel Surveys and own estimates; VDEh
Operating Costs – Considerations on Available Secondary Sources
Data on environmental current expenditures are collected through the EPE Survey.
However, the EPE dataset presents some peculiarities that limit its usefulness for the
purpose of the study. First, unlike the case of investments, data on current expenditures
are collected by national statistical offices on a voluntary basis and, in principle, only every
two years. As a result, time series show many more gaps than in the case of corresponding
data on there are more gaps Second, the definition of current expenditures is very broad,
including both operating costs ‗proper‘ (defined in the survey as ‗in-house‘ expenditure)
and other expenditures whose linkage with environmental regulation is at least doubtful
(e.g. the fees paid for waste collection and landfilling and effluent water treatment) or that
are already covered in this study under different cost categories (e.g. the cost of studies for

Page 258 out of 259
the issuance of permits). Unfortunately, only for some countries and years data on the
various categories of current expenditures are available separately. Third, possibly due to
difficulties in the interpretation of the definition of environmentally-related expenditures,
the time series show major variations over time and marked differences across
countries.314
Similar considerations apply to the estimates of current expenditures provided by some
steel makers which, in general, appear to be based on very broad definitions. In fact, in the
case of some companies, it was possible to clarify that the estimates provided included
both depreciation and financial charges, which in our case would result in a double
counting of investment and financial costs that have been calculated separately. The
inclusion of fees for ladfilling, waste water treatment and similar charges is also somewhat
debatable, at least from the perspective of a study on the impact of EU legislation (fees are
set at the national if not regional/local levels, and they reflect actual costs).
Operating Costs – Sample OPEX/CAPEX Ratios
Table D Ratios between CAPEX and OPEX for Selected Pollution Control/Prevention
Technologies
Technology CAPEX
(€‘000)
OPEX
(€ ‘000) OPEX/CAPEX Comments
Advanced Electrostatic
Precipitator 6,250 540 8.6% Plant with a 4 MT capacity.
Bag Filter 9,300 697 7.5% Plant with a 1.6 MT capacity
Cyclone 675 94 13.9% Average value
Wet Desulphurization
System 65,000 3,200 4.9% Plant with a 4 MT capacity.
Regenerative Activated
Carbon 73,000 3,720 5.1% Plant with a 4 MT capacity.
Cast House De-dusting
System 14,500 420 2.9%
Plant with a 3 MT capacity. Energy
costs not considered
Fume Suppression 6,800 360 5.3% Plant with a 3 MT capacity. Nitrogen
cost not considered
Gas Recovery System 1,200 28 2.3% Plant with a 2.8 MT capacity.
BOF Primary De-dusting
System 32,000 3,000 9.4% Plant with a 1 MT capacity.
314 For instance, the trend is particularly erratic in the case of the United Kingdom, with the value of current
expenditures passing from € 485 million in 2001 to € 184 million in 2003 and to just € 89 million in
2004. Similar sharp movements are also found in the case of Italy, where expenditures record a five fold
increase between 2002- 2004, when they averaged around € 50 million, and 2007, when they reached the
value of € 262 million.

Page 259 out of 259
BOF Secondary De-
dusting System 29,000 12,000 41.4% Plant with a 1 MT capacity.
EAF Bag Filter &
Adsorbent Material 500 n.a. >15% Plant with a 1 MT capacity.
Source: BREF for the Iron and Steel Industry, 2012
Notes: the selection of the above technologies was heavily influenced by the availability of the information
required to compute the OPEX/CAPEX ratio, In fact, in a number of cases, the BREF does not provide any
indication regarding the investment and/or operational expenditure of the proposed BAT. Some cost data are
fairly old and may well be below current level, but - to the extent that price escalation has affected both
investment and operating costs - this should not affect the ratio OPEX/CAPEX. The above technologies do
not relate to downstream processes (hot and cold rolling, wire plants, coating, and galvanisation), which are
covered by the Ferrous Metals Processing Industry BREF. This document is currently under revision and the
current BREF, adopted back in 2001, was not used as it contains very little information regarding the
economic parameters of proposed BATs.
Table E Ratios between CAPEX and OPEX for Some Pollution Control/Prevention
Investments Implemented/Under Consideration by Selected Steelmakers
Investment CAPEX
(€‘000)
OPEX
(€ ‘000) OPEX/CAPEX Comments
Sinter Plant – Bag Filter 17,000 2,000 11.8%
Sinter Plant – Bag Filter 20,000 3,000 15.0%
Sinter Plant – Activated
carbon 6,300 800 12.7% Covering two sinter strands
Sinter Plant – Complete
retrofitting 50,000 10,000 20.0%
Two sinter strands, with total 10 MT
capacity
Coking Plant – Gas
Desulphurization &
Benzene Control
32,000 2,800 8.8%
Additional € 4 million/year OPEX if
coke gas cannot be used, raising ratio
to 21.2%
Blast Furnace – Water
treatment (Pb, Zn) 3,000 100 3.3%
BOF Shop – De-dusting
(re-lading of hot metal) 17,000 200 1.2% Not a priority intervention
Integrated Plant - Noise
abatement 10,000 2,000 20.0%
Integrated Plant –
Prevention of Diffuse Dust
Emissions
12,000 3,000 25.0%
Source: Interviews with selected steelmakers