Embed Size (px)
Citation preview

Nat. Hazards Earth Syst. Sci., 10, 485–497, 2010www.nat-hazards-earth-syst-sci.net/10/485/2010/© Author(s) 2010. This work is distributed underthe Creative Commons Attribution 3.0 License.
Natural Hazardsand Earth
System Sciences
Assessment and validation of wildfire susceptibilityand hazard in Portugal
J. C. Verde and J. L. Zezere
RISKam – Research group on Environmental hazard and risk assessment and management, Geographical Research Centre,University of Lisbon, Lisbon, Portugal
Received: 26 September 2009 – Revised: 21 January 2010 – Accepted: 25 January 2010 – Published: 16 March 2010
Abstract. A comprehensive methodology to assess forestfire susceptibility, that uses variables of strong spatial corre-lation, is presented and applied for the Portuguese mainland.Our study is based on a thirty-year chronological series ofburnt areas. The first twenty years (1975–1994) are used forstatistical modelling, and the last ten (1995–2004) are usedfor the independent validation of results. The wildfire af-fected areas are crossed with a set of independent layers thatare assumed to be relevant wildfire conditioning factors: ele-vation, slope, land cover, rainfall and temperature. Moreover,the wildfire recurring pattern is also considered, as a proxyvariable expressing the influence of human action in wildfireoccurrence. A sensitivity analysis is performed to evaluatethe weight of each individual theme within the susceptibil-ity model. Validation of the wildfire susceptibility modelsis made through the computation of success rate and predic-tion rate curves. The results show that it is possible to havea good compromise between the number of variables withinthe model and the model predictive power. Additionally, it isshown that integration of climatic variables does not produceany relevant increase in the prediction capacity of wildfiresusceptibility models. Finally, the prediction rate curves pro-duced by the independent cross validation are used to assessthe probabilistic wildfire hazard at a scenario basis, for thecomplete mainland Portuguese territory.
1 Introduction
Wildfires have destroyed, in the past few years, thousands ofhectares in Portugal (e.g. over 425 thousand ha burnt in 2003and over 300 thousand ha in 2005) stepping up as a majorenvironmental problem in the country. Numbers have been
Correspondence to:J. C. Verde([email protected])
far more positive since 2006, but how they will evolve in thefuture is highly uncertain (Fig. 1). Between 1980 and 2007,wildfires have affected over 3 million ha in Portugal: that isequivalent to almost all of Belgium, one and half of Israelor twelve times the Luxembourg territory. Summed up, whatwas burnt in those 28 years is almost equivalent to the presentday Portuguese forested areas.
Two thirds of Portugal is forested spaces, providing for pa-per, cork, furniture and many more products accounting for3.2% of the Gross National Product (GNP), and 15 thousandjobs, in 2005. This data points to wildfires as a problem,not even accounting other environmental issues. Further-more, the Portuguese forest was last evaluated at around7750 millionC. To sum it up, the problem is how to sustain64%, roughly two thirds, of the Portuguese territory.
Wildfires are not a Portuguese exclusive and several au-thors have dedicated their time investigating how to bestmodel and achieve cartographic tools for wildfire suscep-tibility and hazard assessment, such as the work of Chu-vieco and Congalton (1989), Viegas et al. (1999), Vasilakoset al. (2007), and Verde (2008) among others. Some at-tempts have been made to model susceptibility by meansof different methods, like nearest-neighbourhood. Such isthe case of Amatulli et al. (2007) who applied interpola-tion techniques to map lightning/human-caused wildfires, orDurao et al. (2010) whose work, dealing with the CanadianFWI system, tried to assess the probability of fire in a givenregion by running simulations. Apart from the somewhatstatic approach of susceptibility assessments, other authorshave explored the correlations of wildfires and weather con-ditions, such as in Pereira et al. (2005), Trigo et al. (2006)and Le Page et al. (2008). Wildfire prevention is a vec-tor for model development, driving efforts for a better pre-diction of those conditions that favour fire spread, or to al-low for a quicker wildfire detection. The United States Na-tional Weather Service is running an experimental interfacewhich divulges fire weather warnings, outlooks and danger
Published by Copernicus Publications on behalf of the European Geosciences Union.

486 J. C. Verde and J. L. Zezere: Assessment and validation of wildfire susceptibility and hazard
0
5
10
15
20
25
30
35
40
0
500
1000
1500
2000
2500
3000
3500
4000
4500
19
80
19
81
19
82
19
83
19
84
19
85
19
86
19
87
19
88
19
89
19
90
19
91
19
92
19
93
19
94
19
95
19
96
19
97
19
98
19
99
20
00
20
01
20
02
20
03
20
04
20
05
20
06
20
07
Nu
mb
er
of
Wil
dfi
res
Th
ou
san
d
Bu
rnt
Are
a i
n S
qu
are
Kil
om
ete
rs
Burnt Areas Number of Wildfires
Fig. 1. Evolution of burnt area and number of wildfires in Portugalfrom 1980 to 2007.
ratings (NOAA, 2010), and while that information is forNorth America, a similar service, under the United NationsInternational Strategy for Disaster Reduction (UN-ISDR),provides a global early warning system for wildfires, whoseobjective is to “(...) provide a scientifically supported, sys-tematic procedure for assessing current and future fire dan-ger that can be applied from local to global scales. (...)”(GWFEWS, 2010). Other global modules have been devel-oped under the UN-ISDR, such as the Lund-Potsdam-JenaDynamic Global vegetation model, looking for interactionsbetween vegetation and fire (GFMC, 2010). All these stud-ies and approaches share a common goal, explicit or implicit:through a better knowledge of wildfire susceptibility, on landor atmospheric conditioning factors, reducing exposure andminimizing losses. The aforementioned studies have varyingdegrees of complexity, and many more authors have studiedthis subject, making it very difficult to refer them all. Thispaper focuses more on susceptibility as a property of the ter-ritory and less on wildfire dynamic patterns due to weatherconditions, although correlations with rainfall and tempera-ture are explored, to investigate model behaviour with similarvariables as those used by other authors.
2 The conceptual framework
In Sect. 1, we have shown that the problem is how to sustaina large portion of the Portuguese territory. To do so, con-cepts must be clearly defined and understood, because ac-tions might be taken to deal with the problem on the hazardlevel – through hazard reduction – or by risk mitigation on abroader sense.
A consensus regarding the concept of wildfire risk doesnot exist. Bachmann and Allgower (1999) have already ad-dressed that issue, pointing out that “the somewhat inconsid-erate use of the various terms “danger”, “hazard”, and “risk”may result in misunderstandings that can have fatal conse-quences” (op.cit., p. 1). Indeed, if a common understand-ing of what is hazard and what is risk does not exist, wemight end up using products in an erroneous way: wildfirerisk maps, containing financial data, cannot be read as direct
ConsequencesHazard
Risk = Susceptibility x Probability x Vulnerability x Economic Value
Fig. 2. Conceptual framework, based on Varnes (1984) and Bach-mann and Allgower (1999).
indications of where a wildfire can grow faster and harderto extinguish due to increased susceptibility or recurrencepatterns. If such a mistake happens at an operational level,where decisions must be made fast and accurately, conse-quences may be dire.
As the aforementioned authors pointed out, “the phe-nomenon fire has so many aspects as do people who aredealing with it (...) based on their primary interests, each ofthese “communities” has different notions of the term “wild-fire risk” (Bachmann and Allgower, 1999, p. 1). The con-ceptual framework we adopt in this paper is the same frame-work widely applied to study other hazardous phenomena,like mass movements, floods or earthquakes, following theUNDRO (1979) and Varnes (1984) proposal and the risk def-inition given by Bachmann and Allgower (1999, p. 5): “theprobability of a wildfire occuring at a specified location andunder given circumstances and its expected outcome as de-fined by the impacts on the affected objects”. We considerwildfire susceptibility the terrain propensity to suffer a wild-fire or to support its spreading, given by the terrain’s intrinsiccharacteristics (e.g., elevation, slope, vegetation cover). Inaddition, we consider wildfire hazard as the probability of awildfire occurance associated with terrain susceptibility.
In this paper, we do not get into risk. Our study stops athazard assessment. Figure 2 shows the adopted conceptualframework.
3 Susceptibility assessment
For susceptibility assessment, our model integrates somewidely used variables in wildfire hazard modelling. Thefollowing variables were considered: elevation, slope, landcover, average annual rainfall, average number of days withminimum temperature≥20◦C, and past burn scar mapping(which we transformed into simple probability). We havechosen to include those variables that relate to the fire tri-angle, air, heat and fuel, but also to the most prominent fireagent in Portugal: man. We did not consider variables thatcould be best used in dynamic mapping (e.g., wind speedand direction), mostly when fire is already progressing, asour purpose was to map susceptibility in the long term, asa property of the territory, as mentioned in Sect. 1. A sen-sitivity analysis was performed in order to assess the vari-able combination with the best prediction capacity. Figure 3summarizes the adopted methodology from data capture towildfire susceptibility and hazard evaluation.
Nat. Hazards Earth Syst. Sci., 10, 485–497, 2010 www.nat-hazards-earth-syst-sci.net/10/485/2010/

J. C. Verde and J. L. Zezere: Assessment and validation of wildfire susceptibility and hazard 487
Elevation Slope Landcover Rainfall Temp. oC Probability
DEM(80m pixel)
Wildfire cartography (30 years)
Elevation x Slope x Landcover x Rainfall x Temperature x Probability
Favourability calculation
Data Integration
Repeated, 2 to 6 variables
Wildfire Susceptibility Map
Modelling subset(1975-1994)
Prediction subset(1995-2004)
Classification
Success Rate Curve
Prediction Rate Curve
ScenarioWildfire Hazard Map
Documentation and Cartography
Layers
Modelling subset(1975-1994)
Fig. 3. General methodology from data sources and data integration, to susceptibility and hazard mapping.
3.1 Data capture
Elevation is one of the wildfire conditioning factors. Ele-vation “controls temperature and rainfall” (Ventura and Vas-concelos, 2006, p. 101–102), which will, in turn, influencethe type and availability of fuel, as well as its humidity. El-evation is not homogeneous in Portugal, and the higher val-ues are found in the central and northern part of the country(Fig. 4).
Influence of slope on fire progression is well known. Thehigher the slope, the faster fire progresses by heating of fuelsuphill. Slope is also a factor that controls the wind speed(Macedo and Sardinha, 1993; Ferreira de Castro et al., 2003;Viegas, 2006). The spatial pattern of slope distribution inPortugal is similar to that of elevation (Fig. 5). The slopegradient is usually higher in the north and central part of thecountry.
The existence of wildfire susceptibility depends on sus-ceptible territories, and it does not make any sense to assesswildfire susceptibility where wildfires cannot occur. There-fore, we have excluded from the land cover thematic layer(CORINE Land Cover 2000), all artificial areas, inland waterbodies and ocean, corresponding to levels 1, 4 and 5 (Fig. 6).
The selection of the appropriate meteorological parame-ters to integrate wildfire susceptibility models is a significantissue. In Portugal, according to Pereira et al. (2006), “rainfallbetween January and April shows a slight positive correla-tion with burnt areas, possibly because it favours the growthof fine fuels (...) to burn during the summer”. On the otherhand, “there is a negative correlation (...) between the burntarea and rainfall during the month of May” (op.cit, p. 149)which results in higher humidity levels on those fine fuels,that become less available for ignition. In our work, rain-fall influence is integrated into the model by using the meanannual precipitation from the period 1931–1960 (Fig. 7).
www.nat-hazards-earth-syst-sci.net/10/485/2010/ Nat. Hazards Earth Syst. Sci., 10, 485–497, 2010

488 J. C. Verde and J. L. Zezere: Assessment and validation of wildfire susceptibility and hazard
Fig. 4. Elevation map. Legend: class Id (see Table 1).
The rainfall annual average does not allow for a total assess-ment of the above-mentioned rationale, however, knowinghow rainfall is distributed in Portugal, one can assume thespatial coincidence between the higher annual rainfall andthe winter rainfall maxima, hence, confirming what Pereiraet al. (2006) have pointed out.
In previous studies (Pereira and Santos, 2003), air tem-perature has been used as a variable for wildfire susceptibil-ity assessment, assuming that regions with higher air tem-peratures are those of higher wildfire susceptibility. Ven-tura and Vasconcelos (2006) state that high temperaturesand low humidity levels favour the drying of fuels. Havingthis assumption in mind, we chose to integrate air temper-ature in a different way. Whereas in previous studies, likePereira and Santos (2003), it was integrated as the num-ber of days with temperatures equal or above 25◦C, be-tween May and September, we used the average numberof days with minimum temperatures equal to, or above,20◦C (Fig. 8), for the period 1990–2007. Considering thatit is during night time that wildfire suppression efforts aremore likely to succeed, taking advantage of lower tempera-tures and higher air humidity, we assume that where there are
Fig. 5. Slope map. Legend: class Id (see Table 1).
more nights with temperatures equal or above 20◦C, wildfiresusceptibility should be higher.
Past history of burnt areas enters into the model as a sim-ple probability (Fig. 9), that allows us to read “every year,what is the probability of each ground unit to be affectedby combustion?”. This approach allows for discriminating,where fire is a recurring phenomenon rather than an unusualevent. These wildfire records are also used to determine wild-fire favourability for all other variables, as the past – from amapped history of more than 30 years of wildfires – showsus how different classes of those variables behave under fire.Historical data is also a proxy for a factor that would, other-wise, be extremely difficult to integrate in the model: humanbehaviour. In fact, this factor is extremely important to un-derstand wildfires in Portugal, because over 97% of wildfiresare linked with human causality (Beighley, 2009). In Ta-ble 1, we present the legend and favourability scores for allvariables, except for probability, for which no favourabilityscore was computed. It should be noted that not all thematiclayers have the same total number of pixels as a consequenceof different criteria for definition of coastlines and inland wa-ter bodies. In the case of land cover, not considering levels 1,
Nat. Hazards Earth Syst. Sci., 10, 485–497, 2010 www.nat-hazards-earth-syst-sci.net/10/485/2010/

J. C. Verde and J. L. Zezere: Assessment and validation of wildfire susceptibility and hazard 489
Fig. 6. Landcover map. Legend: class Id (see Table 1).
4 and 5 as previously stated, adds to this difference. We havechosen not to force all thematic layers to the same extentbecause the difference was small and in doing so we couldbring erroneous data into the model. In all models, we useda subset of 20 years of burnt scars (1975–1994) to computefavourability scores, and the remaining set of 10 years (1995–2004) for the independent validation of susceptibility results(Fig. 10). It becomes clear that these thematic layers do notentirely share the same timeframe and this may be consid-ered a drawback of our model. However, in a previous work,Verde (2008) had shown that the effectiveness of the modelwas not affected by combining land cover of the year 2000with burnt scars of the period 1975–1994. In fact, that au-thor has shown that, using land cover of the year 2000, themodel has an overall better behaviour with older burnt scars(e.g. 1975–1984) than with a block comprising the year theland cover was created (1995–2004). In addition, climato-logic data is assumed stable regarding their spatial distribu-tion, and we expect annual rainfall and temperature patternsto remain reasonably unchanged in the medium-long term,taking into account the Portuguese climate, where the mostannual rainfall occurs during winter time and the higher tem-peratures during the summer.
Fig. 7. Annual Rainfall map (based on Daveau et al., 1977). Leg-end: class Id (see Table 1).
3.2 Integrating the variables
We perform the wildfire susceptibility assessment based onthe following assumptions: 1) the probability of occurrenceof burnt areas can be quantitatively assessed by statistical re-lationships between past burnt areas and a spatial dataset; and2) wildfires, assessed by their respective burnt areas, occurunder conditions that can be characterised by the layers inthe aforementioned spatial dataset, thus, considered as con-ditioning (or predisposal) variables, to be integrated in theprediction model.
Our work has been done in a GIS, with raster process-ing, after preparing and transforming vector data we hadavailable. We used a 80-m pixel size digital elevationmodel (source: http://www.fc.up.pt/pessoas/jagoncal/srtm/srtm.htm) from which we derived the elevation and slopethemes.
The rationale behind the use of the method used to weighvariable cases is beyond the scope of this paper, but it fol-lows the work of Chung and Fabbri (1993) and Fabbri etal. (2002) regarding favourability scores. The basic equation
www.nat-hazards-earth-syst-sci.net/10/485/2010/ Nat. Hazards Earth Syst. Sci., 10, 485–497, 2010

490 J. C. Verde and J. L. Zezere: Assessment and validation of wildfire susceptibility and hazard
Fig. 8. Temperature map. Legend: class Id (see Table 1).
for favourability score calculation, for all variables, exceptprobability, is:
Sfx=umAx
�x·100 (1)
Where Sfx is the favourability score for classx, umAx is thetotal number of burnt units (or pixels) in classx, and�x isthe total number of units of classx.
In addition, the transformation of historical data into asimple probability was made using Eq. (2):
pa=f
N·100 (2)
Where pa is the probability (simple, not conditioned),f isthe number of times the pixel has been burnt, andN thenumber of years. Due to the nature of our dataset, it is notpossible for any pixel to havef higher than 1, therefore, pacan never exceed 1 (or, as per Eq. 2, 100). After all favoura-bility scores and probability values have been calculated, weintegrate the total set of variables using Eq. (3):
UC= pa∩Sf1∩Sf2∩ ...∩Sfn⇔
⇔ UCF= F(pa) ·F(Sf1) ·F(Sf2) ·F(...) ·F(Sfn)(3)
Fig. 9. Annual Probability of wildfire occurrence.
Where UC is a unique condition, UCF is the unique conditionfavourability value andF is the favourability value of eachclass within each thematic layer.
The Unique Condition (UC) expresses all existing the-matic layer combinations translated by the favourabilityvalue of each class in each thematic layer (pa, Sf1, Sf2,...,Sfn) as expressed in Eq. (3). The UC favourability value iscalculated for each pixel and is given by the multiplicationof the favourability score of each class variable present in thepixel (Eq. 3). It should be noted that wherever a favourabil-ity score computed zero, it was reclassified as the value one,thus, becoming neutral in the multiplication.
To identify each model, resulting from the integration ofdifferent variables, each layer is represented by a code, asfollows: A – Elevation, D – Slope, C – Land cover, R –Rainfall, T – Temperature, P – Probability. Combining thesecodes identifies which variables have been used, for example,a model identified by “ACD” is a model whose calculationtook into account elevation, land cover and slope.
Unique condition favourabilities (UCF in Eq. 3) for eachmodel, when ordered in descending order and crossed withburnt areas, allow computing two types of curve: success and
Nat. Hazards Earth Syst. Sci., 10, 485–497, 2010 www.nat-hazards-earth-syst-sci.net/10/485/2010/

J. C. Verde and J. L. Zezere: Assessment and validation of wildfire susceptibility and hazard 491
Table 1. Thematic layers and favourability values of variables. The most significant results are highlighted in bold.
Thematic Class Number of pixels Number of burnt pixels Favourability Datalayer class ID in the class within the class value capture
Elevation (m)
0 1 114 515 240 0.00210–100 2 2 769 360 103 914 0.0375100–200 3 3 102 003 216 481 0.0698200–300 4 2 490 516 237 136 0.0952300–400 5 1 384 088 217 162 0.1569400–500 6 951 387 217 120 0.2282500–600 7 774 191 223 624 0.2888600–700 8 732 445 222 151 0.3033700–800 9 702 783 214 079 0.3046800–900 10 436 979 160 150 0.3665 Derived900–1000 11 221 888 100 843 0.4545 from DEM1000–1100 12 112 622 58 780 0.5219 (80-m pixel)1100–1200 13 59 698 34 392 0.57611200–1300 14 31 791 19 637 0.61771300–1400 15 14 420 7160 0.49651400–1500 16 7932 2240 0.28241500–1600 17 4695 1110 0.23641600–1700 18 3961 547 0.13811700–1800 19 1744 258 0.14791800–1900 20 1574 28 0.01781900–2000 21 420 0 0.0000
Total 13 919 012 2 037 052
Slope angle
0–2◦ 1 3 769 671 270 168 0.07172–5◦ 2 4 620 398 647 943 0.1402 Derived5–10◦ 3 3 113 286 856 590 0.2751 from DEM10–15◦ 4 1 363 989 553 316 0.4057 (80-m pixel)15–20◦ 5 659 408 315 286 0.4781> 20◦ 6 392 260 196 724 0.5015
Total 13 919 012 2 840 027
Land cover (wildfire susceptible areas)
Non-irrigated arable land 211 1 708 124 82 209 0.0481Permanently irrigated land 212 304 212 7269 0.0239Rice fields 213 83 543 662 0.0079Vineyards 221 363 891 8010 0.0220Fruit trees and berry plantations 222 156 557 5298 0.0338Olive groves 223 422 767 7772 0.0184Pastures 231 58 999 2444 0.0414Annual crops associated withpermanent crops 241 656 927 10 909 0.0166Complex cultivation patterns 242 972 839 17 430 0.0179Land principally occupied byagriculture, with significant areas Corine Landof natural vegetation 243 1 063 543 75 674 0.0712 Cover 2000Agro-forestry areas 244 874 533 20 794 0.0238Broad-leaved forest 311 1 908 393 212 452 0.1113Coniferous forest 312 1 079 951 214 363 0.1985Mixed forest 313 820 553 145 770 0.1776Natural grasslands 321 289 554 157 757 0.5448Moors and heathland 322 526 757 290 650 0.5518Schlerophyllous vegetation 323 303 814 46 371 0.1526
www.nat-hazards-earth-syst-sci.net/10/485/2010/ Nat. Hazards Earth Syst. Sci., 10, 485–497, 2010

492 J. C. Verde and J. L. Zezere: Assessment and validation of wildfire susceptibility and hazard
Table 1. Continued.
Thematic Class Number of pixels Number of burnt pixels Favourability Datalayer class ID in the class within the class value capture
Land cover (wildfire susceptible areas)
Transitional woodland-shrub 324 1 505 318 578 481 0.3843Beaches, dunes, sands 331 18 868 456 0.0242Bare rocks 332 69 070 32 018 0.4636Sparsely vegetated areas 333 121 568 79 077 0.6505Burnt areas 334 49 378 27 389 0.5547
Total 13 359 159 2 828 548
Yearly average rainfall (mm)
200–300 1 3353 1488 0.4438300–400 2 37 445 16 903 0.4514400–500 3 530 578 52 359 0.0987500–600 4 2 274 773 123 320 0.0542600–700 5 2 653 299 163 279 0.0615700–800 6 1 893 065 146 436 0.0774800–900 7 1 247 532 143 681 0.1152900–1000 8 841 013 154 706 0.1840 From Daveau1000–1200 9 1 329 184 258 192 0.1942 et al. (1977)1200–1400 10 1 117 460 288 552 0.25821400–1600 11 790 464 267 946 0.33901600–1800 12 449 731 148 567 0.33031800–2000 13 301 067 100 095 0.33252000–2500 14 267 007 88 570 0.33172500–3000 15 145 103 53 847 0.37113000–3500 16 52 601 21 649 0.41163500–4000 17 9002 3918 0.4352
Total 13 942 677 2 033 508
Average number of days, per year, of minimum air temperature above 20◦C
0–3 d 1 2 517 498 395 707 0.15723–6 d 2 3 665 182 720 590 0.19666–9 d 3 2 561 075 466 648 0.1822 Meteorological9–18 d 4 3 358 875 383 563 0.1142 Institute18–36 d 5 1 816 251 70 544 0.0388
Total 13 918 881 2 037 052
prediction rate curves. The success rate curve results fromthe cross tabulation between the model results and the burntareas used to build the model. Therefore, this curve is ableto evaluate the degree of model fit. The prediction rate curveresults from the cross tabulation between the model resultsand an independent set of burnt areas that was not used inthe model, as referenced in Sect. 3.1. Hence, prediction ratecurve can be used to predict the future behaviour of wildfires.
3.3 Model results and validation
The first susceptibility model run was the CDP, assumingwildfire susceptibility can be assessed through integration offuel (land cover), slope and the historical pattern (derived
from past burnt areas). This is a model of high success andprediction rates (Fig. 11; Tables 2 and 3): the 30% most sus-ceptible territory accounts for over 90% of burnt areas con-tained in the model. As for the prediction, the same 30% ofthe territory only predicts correctly 71% of those “new” burntareas, not considered in the model (1995–2004 sub-set).
On a second model run, another variable was added to themodel: elevation. The ACDP model maintains high rates(Tables 2 and 3); however, keeping 30% of the most suscep-tible territory as reference, the success rate is slightly lower,but the prediction rate is somewhat better than before. InFig. 12, we plot those curves, keeping CDP curves for com-parison.
Nat. Hazards Earth Syst. Sci., 10, 485–497, 2010 www.nat-hazards-earth-syst-sci.net/10/485/2010/

J. C. Verde and J. L. Zezere: Assessment and validation of wildfire susceptibility and hazard 493
Fig. 10. Modelling and Validation wildfire data subsets.
0%
10%
20%
30%
40%
50%
60%
70%
80%
90%
100%
0% 20% 40% 60% 80% 100%
Bu
rn
t a
re
a
Total area
Success
Prediction
Fig. 11.Success rate and Prediction rate curves for the CDP model.
Next, to evaluate the impact of rainfall on susceptibilityassessment, the rainfall layer was added to the model. Thefive variable model, ACDPR, shows the worse behaviour(Fig. 13). The prediction rate is similar to the previous model(ACDP), but the success rate is worse.
To complete this series of model runs, temperature wasadded to the model (Fig. 14). The six variable model, ACD-PRT, has less satisfactory results, as both success and predic-tion rates are worse than any other previous model, as can bevisually perceived in Fig. 14.
Although the general good quality of the wildfire suscepti-bility assessment, we wanted to evaluate the models responseif burnt areas in the past (as mentioned earlier, transformed
0%
10%
20%
30%
40%
50%
60%
70%
80%
90%
100%
0% 20% 40% 60% 80% 100%
Bu
rn
t a
re
a
Total area
Success
Prediction
CDP Success
CDP Prediction
Fig. 12. Success rate and Prediction rate curves for the ACDPmodel.
0%
10%
20%
30%
40%
50%
60%
70%
80%
90%
100%
0% 20% 40% 60% 80% 100%
Bu
rn
t a
re
a
Total area
Success
Prediction
CDP Success
CDP Prediction
Fig. 13. Success and prediction curves for the ACDPR model.
0%
10%
20%
30%
40%
50%
60%
70%
80%
90%
100%
0% 20% 40% 60% 80% 100%
Bu
rn
t a
re
a
Total area
Success
Prediction
CDP Success
CDP Prediction
Fig. 14. Success rate and prediction rate curves for the ACDPRTmodel.
www.nat-hazards-earth-syst-sci.net/10/485/2010/ Nat. Hazards Earth Syst. Sci., 10, 485–497, 2010

494 J. C. Verde and J. L. Zezere: Assessment and validation of wildfire susceptibility and hazard
Table 2. Success rates of susceptibility models. The most significant results are highlighted in bold.
Area 10% 20% 30% 40% 50% 60% 70% 80% 90%
CDP 64.12% 85.46% 90.87% 95.77% 97.83% 99.00% 99.97% 100% 100%ACDP 59.47% 81.72% 90.42% 95.57% 97.42% 98.88% 99.73% 99.97% 99.99%ACDPR 55.76% 79.66% 88.84% 94.06% 96.35% 98.26% 99.52% 99.82% 99.98%ACDPRT 55.59% 79.12% 88.60% 93.55% 95.73% 97.44% 98.99% 99.77% 99.97%CD 36.39% 60.07% 75.92% 84.83% 89.21% 92.62% 94.96% 97.84% 99.00%ACD 37.51% 62.38% 76.24% 84.78% 89.59% 93.36% 95.77% 97.69% 99.27%ACDR 36.90% 62.25% 77.50% 85.22% 90.00% 93.25% 95.50% 97.36% 99.00%ACDRT 36.78% 62.47% 78.36% 85.75% 90.19% 93.25% 95.09% 97.01% 98.82%
Table 3. Prediction rates of susceptibility models. The most significant results are highlighted in bold.
Area 10% 20% 30% 40% 50% 60% 70% 80% 90%
CDP 34.52% 56.36% 71.31% 81.77% 87.87% 92.68% 95.02% 97.11% 99.79%ACDP 33.91% 56.31% 71.65% 82.08% 88.41% 92.53% 95.40% 97.55% 99.23%ACDPR 33.37% 55.65% 71.14% 80.63% 87.06% 92.21%95.42% 97.61% 99.32%ACDPRT 33.08% 54.13% 69.11% 79.06% 85.55% 90.51% 94.22% 97.00% 99.06%CD 30.48% 53.29% 70.12% 80.15% 87.04% 92.39% 94.74% 96.96% 98.81%ACD 31.04% 53.99% 70.36% 81.01% 87.81% 92.25% 95.24% 97.50% 99.22%ACDR 30.05% 53.10% 69.35% 79.53% 86.35% 92.02% 95.28% 97.57% 99.30%ACDRT 29.25% 51.68% 67.61% 77.83% 84.56% 90.23% 94.02% 96.89% 99.02%
0%
10%
20%
30%
40%
50%
60%
70%
80%
90%
100%
0% 20% 40% 60% 80% 100%
Bu
rn
t a
re
a
Total area
Success
Prediction
CDP Success
CDP Prediction
Fig. 15. Success rate and prediction rate curves for the CD model.
into a simple probability) were to be removed. Therefore, asecond set of susceptibility models was performed withoutthe P layer.
The first model run, in this series, was the CD model(Fig. 15). By comparison with the CDP model, when usingonly land cover and slopes, both success and prediction ratesdecrease in quality. Nevertheless, the similarity between theprediction rate curves of both models, CD and CDP (differ-ence around just 1%) is remarkable.
Figure 16 shows the differences between ACDP and ACDmodels. As in the previous case, the success rate is worse,
0%
10%
20%
30%
40%
50%
60%
70%
80%
90%
100%
0% 20% 40% 60% 80% 100%
Bu
rn
t a
re
a
Total area
Success
Prediction
CDP Success
CDP Prediction
Fig. 16.Success rate and prediction rate curves for the ACD model.
but the prediction rate follows closely. In comparison to theprevious model (CD), adding elevation resulted in a subtlegain, usually below 1%, on both success and prediction rates.
Adding rainfall to this series of models (ACDR) gener-ates similar results (Fig. 17). The success rate does increaseslightly, but not always, and the prediction rate is below theprevious ACD model up until 70% of the territory.
Last is the ACDRT model (Fig. 18), which adds temper-ature, allowing for a better success rate, but overall worseprediction rate than any other variable combination.
Nat. Hazards Earth Syst. Sci., 10, 485–497, 2010 www.nat-hazards-earth-syst-sci.net/10/485/2010/
J. C. Verde and J. L. Zezere: Assessment and validation of wildfire susceptibility and hazard 495
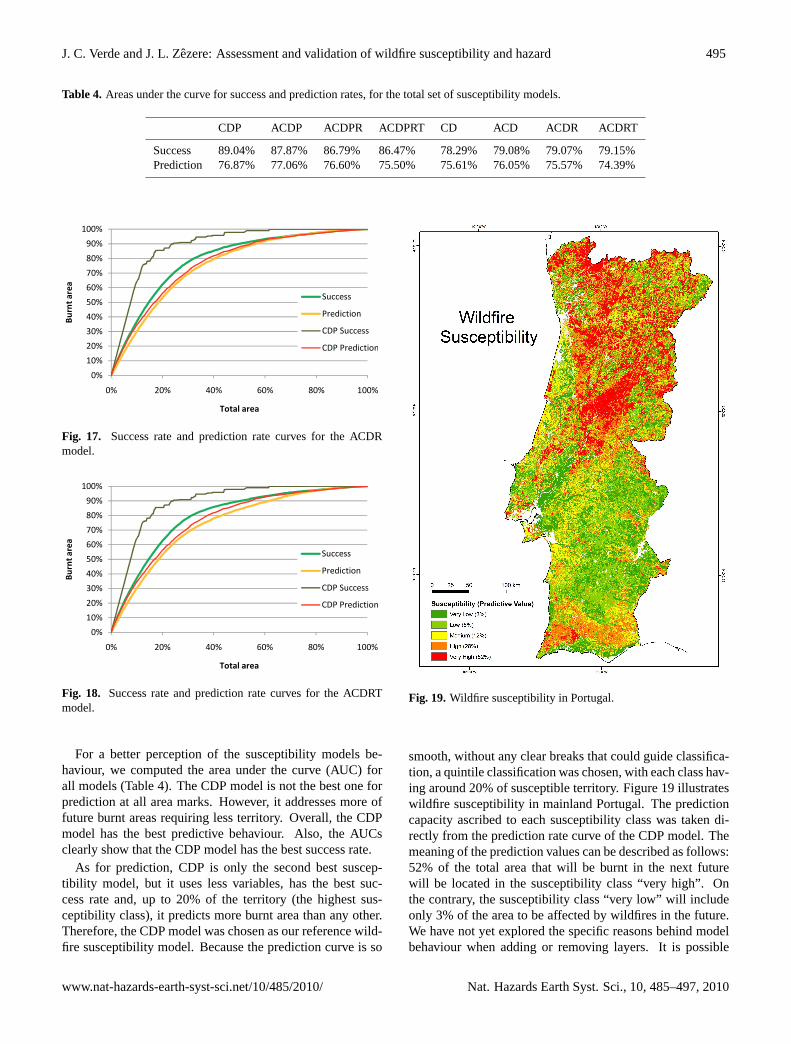
Table 4. Areas under the curve for success and prediction rates, for the total set of susceptibility models.
CDP ACDP ACDPR ACDPRT CD ACD ACDR ACDRT
Success 89.04% 87.87% 86.79% 86.47% 78.29% 79.08% 79.07% 79.15%Prediction 76.87% 77.06% 76.60% 75.50% 75.61% 76.05% 75.57% 74.39%
0%
10%
20%
30%
40%
50%
60%
70%
80%
90%
100%
0% 20% 40% 60% 80% 100%
Bu
rn
t a
re
a
Total area
Success
Prediction
CDP Success
CDP Prediction
Fig. 17. Success rate and prediction rate curves for the ACDRmodel.
0%
10%
20%
30%
40%
50%
60%
70%
80%
90%
100%
0% 20% 40% 60% 80% 100%
Bu
rn
t a
re
a
Total area
Success
Prediction
CDP Success
CDP Prediction
Fig. 18. Success rate and prediction rate curves for the ACDRTmodel.
For a better perception of the susceptibility models be-haviour, we computed the area under the curve (AUC) forall models (Table 4). The CDP model is not the best one forprediction at all area marks. However, it addresses more offuture burnt areas requiring less territory. Overall, the CDPmodel has the best predictive behaviour. Also, the AUCsclearly show that the CDP model has the best success rate.
As for prediction, CDP is only the second best suscep-tibility model, but it uses less variables, has the best suc-cess rate and, up to 20% of the territory (the highest sus-ceptibility class), it predicts more burnt area than any other.Therefore, the CDP model was chosen as our reference wild-fire susceptibility model. Because the prediction curve is so
Fig. 19. Wildfire susceptibility in Portugal.
smooth, without any clear breaks that could guide classifica-tion, a quintile classification was chosen, with each class hav-ing around 20% of susceptible territory. Figure 19 illustrateswildfire susceptibility in mainland Portugal. The predictioncapacity ascribed to each susceptibility class was taken di-rectly from the prediction rate curve of the CDP model. Themeaning of the prediction values can be described as follows:52% of the total area that will be burnt in the next futurewill be located in the susceptibility class “very high”. Onthe contrary, the susceptibility class “very low” will includeonly 3% of the area to be affected by wildfires in the future.We have not yet explored the specific reasons behind modelbehaviour when adding or removing layers. It is possible
www.nat-hazards-earth-syst-sci.net/10/485/2010/ Nat. Hazards Earth Syst. Sci., 10, 485–497, 2010

496 J. C. Verde and J. L. Zezere: Assessment and validation of wildfire susceptibility and hazard
Table 5. Hazard evaluation for wildfire susceptibility classes, for ascenario of 500 000 ha burnt in a year.
Susceptibility Area Predictive Probabilityclass (nr. of pixels, value per
pixel=80 m) pixel
Very low 2 783 096 0.03 0.85%Low 2 780 358 0.05 1.40%Medium 2 758 308 0.12 3.38%High 2 634 032 0.28 8.42%Very high 2 401 267 0.52 16.81%
that, due mainly to the human nature of Portuguese wildfires,variables not entirely related to the cause, but to the spreadof fire, when stacked in the model, add noise that reducesits ability to accurately predict wildfire susceptibility. Manyof the Portuguese wildfires are related to fuel managementand landscape renewal or arsoning (AFN, 2009). Wildfiresstart and/or spread mainly where people want them to. It is,therefore, quite possible that the worst behaviour we get fromthe model, when adding more variables, simply demonstratesthat their relevance, in this context, is not as high as it wouldbe should the fire mainly be of natural origin.
4 Hazard assessment
The hazard map has the same appearance as the susceptibilitymap, but its classes are not subjective, they are probabilisticvalues, given by an underlying scenario of future burnt area.
For hazard assessment of a single pixel within a wildfiresusceptibility class, we use the following equation (Zezere etal., 2004):
P = 1−
(1−
aaf
atx·vpredx
)(4)
WhereP is the probability; aaf is the total area to be burntin the considered scenario; at is the total area within the sus-ceptibility classx; vpred is the predictive value for the sus-ceptibility classx. Table 5 shows an example of a hazardcalculation for each susceptibility class in a scenario of a to-tal of 500 000 ha burnt in a single year. It should be notedthat the probabilities expressed in Table 5, are for each andevery pixel within a class, that is, every pixel on the highestsusceptibility class has a probability of ignition of 16.81%.
5 Conclusions
The existing large number of studies on the subject of wild-fires is an indicator of how important wildfires are and howthey have motivated many investigators, due to the many as-pects related to fire: social, economic, environmental and
cultural. This has led to the development of many meth-ods for assessing wildfire susceptibility, not only under staticapproaches, for medium- and long-term analysis, but alsofor decision critical applications: when wildfires are alreadyspreading, taking into account current and local weather con-ditions.
We have shown that wildfire susceptibility and hazard canbe assessed at a national scale using few variables, like pastwildfire history, slope and land use. The relationships be-tween fire, land use and slope allow us to identify those areasof higher susceptibility. Adding historical data provides abetter understanding of where wildfires have a pattern andwhere recurrence places a problem. That is as relevant aswildfires in Portugal are mostly of human origin.
Using only three variables makes the model quick to im-plement and easy to process, while having a good compro-mise between simplicity and predictive capacity. We havedemonstrated that adding more variables does not increasethe model prediction capacity substantially.
We have also demonstrated that meteorological variablesdo not bring enough value to prediction rates, hence not of-fering a good justification for including them in the wildfiresusceptibility model. Meteorological data is relevant on adaily basis, for wildfire forecast mostly when wildfires arealready happening. However, it does not play a significantrole on long-term susceptibility assessment and mapping.
Finally, hazard evaluation is very useful in preparation forworst case scenarios, and can be used as a method for de-termining the number of hectares for fuel management usingtechniques such as landscape mosaics and prescribed burn-ing, determining optimal size for fuel management breaks,optimal size for forest roads, the location and density of wa-ter points for vehicles and airplanes, and for dimensioningof fuel management around buildings on urban/forest inter-faces.
Acknowledgements.The authors want to thank the referees fortheir careful reading of the paper and for their useful suggestions,which led to a better presentation of this work’s subject.
Edited by: R. LasaponaraReviewed by: S. Fuchs and three other anonymous referees
References
AFN: Incendios Florestais 2008, Relatorio Final, Autori-dade Florestal Nacional, available at: http://www.afn.min-agricultura.pt/portal/dudf/informacoes/relatorios/2008/incendios-florestais-2008-relatorio-final, (last access: 10 July2009), 2007.
Amatulli, G., Perez-Cabello, F., and de la Riva, J.: Map-ping lightning/human-caused wildfires occurrence under ignitionpoint location uncertainty, Ecol. Model., 200, 321–333, 2007.
Bachmann, A. and Allgower, B.: The need for a consistent wild-fire risk terminology, in: Proceedings of the Joint Fire ScienceConference and Workshop, Boise Idaho, 15–17 June 1999.
Nat. Hazards Earth Syst. Sci., 10, 485–497, 2010 www.nat-hazards-earth-syst-sci.net/10/485/2010/

J. C. Verde and J. L. Zezere: Assessment and validation of wildfire susceptibility and hazard 497
Beighley, M.: Forest defense against fire in Portugal, situation andcapability, The Forest, the Path to sustainable prosperity – Inter-national Seminar, Lisbon, 2 June 2009.
Chung, C. F. and Fabbri, A.: The representation of geoscience in-formation for data integration, Nonrenewable Resources, 2(2),122–138, 1993.
Chuvieco, E. and Congalton, R. G.: Application of remote sensingand geographic information systems to forest fire hazard map-ping, Remote Sens. Environ., 29, 147–159, 1989.
Daveau, S., Coelho, C., Costa, V. G., and Carvalho, L. : Repartitionet rythme des precipitations au Portugal, Lisboa, Memorias doCentro de Estudos Geograficos, 3, 192 pp., 1977.
Durao, R. M., Pereira, M. J., Branquinho, C., and Soares, A.: As-sessing spatial uncertainty of the Portuguese fire risk through di-rect sequential simulation, Ecol. Model., 221, 27–33, 2010.
Fabbri, A., Chung, C. F., Napolitano, P., Remondo, J., and Zezere,J. L.: Prediction rate functions of landslide susceptibility appliedin the Iberian Peninsula, in: Risk Analysis III, Series: Manage-ment Information Systems, edited by: Brebbia, C. A., WIT Press,Southampton, Boston, 5, 703–718, 2002.
Ferreira de Castro, C., Serra, G., Parola, J., Reis, J., Lourenco,L., and Correia, S.: Combate a Incendios Florestais, Manualde Formacao Inicial do Bombeiro, 2nd edn., Escola Nacional deBombeiros, Sintra, Portugal, 93 pp., 2003.
GFMC: Global Fire Monitoring Center: UN International Strategyfor Disaster Reduction,http://www.fire.uni-freiburg.de/, last ac-cess: 12 January 2010.
GWFEWS: Global Wildland Fire Early Warning System,http://www.fire.uni-freiburg.de/fwf/fwf.htm, last access: 15 January2010.
Le Page, Y., Pereira, J. M. C., Trigo, R., da Camara, C., Oom, D.,and Mota, B.: Global fire activity patterns (1996–2006) and cli-matic influence: an analysis using the World Fire Atlas, Atmos.Chem. Phys., 8, 1911–1924, 2008,http://www.atmos-chem-phys.net/8/1911/2008/.
Macedo, F. W. and Sardinha, A. M.: Fogos Florestais, 2nd edn.,Publ. Ciencia e Vida, Lisboa, I, 430 pp., 1993.
NOAA: National Oceanic and Atmospheric Administration, Na-tional Weather Service: Fire Weather, available at:http://radar.srh.noaa.gov/fire/, last access: 15 January 2010.
Pereira, J. M. C. P. and Santos, M. T.:Areas Queimadas e Riscode Incendio em Portugal, Direccao-Geral das Florestas, Lisboa,Portugal, 64 pp., 2003.
Pereira, M. G., Trigo, R. M., DaCamara, C. C., Pereira, J. M. C.,and Leite, S. M.: Synoptic patterns associated with large summerforest fires in Portugal, Agr. Forest Meteorol., 129, 11–25, 2005.
Pereira, J. M. C. P, Carreiras, J., Silva, J., and Vasconcelos, M.:Alguns conceitos basicos sobre os fogos rurais em Portugal,in: Incendios Florestais em Portugal, Caracterizacao, Impactese Prevencao, ISAPress, Lisboa, Portugal, 133–161, 2006.
Trigo, R. M., Pereira, J. M. C., Pereira, M. G., Mota, B., Calado,M. T., DaCamara, C. C., and Santo, F. E.: The exceptional fireseason of summer 2003 in Portugal, Int. J. Climatol., 26, 1741–1757, 2006.
UNDRO: Natural Disasters and Vulnerability Analysis, Report ofExpert Group Meeting, Office of the United Nations Disaster Re-lief Coordinator, Geneva, 9–12 July 1979.
Varnes, D. J.: Landslide hazard zonation: a review of principles andpractice, UNESCO, Paris, 1984.
Vasilakos, C., Kalabokidis, K., Hatzopoulos, J., Kallos, G., andMatsinos, Y.: Integrating new methods and tools in fire dangerrating, Int. J. Wildland Fire, 16, 306–316, 2007.
Ventura, J. and Vasconcelos, M. J.: O fogo como processofısico-quımico e ecologico, Incendios Florestais em Portugal,Caracterizacao, Impactes e Prevencao, ISAPress, Lisboa, Por-tugal, 93–113, 2006.
Verde, J.: Wildfire Hazard Assessment, M.Sc. thesis, University ofLisbon, Portugal, 2008 (in Portuguese).
Viegas, X., Bovio, G., Ferreira, A., Nosenzo, A., and Bernard, S.:Comparative study of various methods of fire danger evaluationin Southern Europe, Int. J. Wildland Fire, 9(4), 235–246, 1999.
Viegas, D. X.: Modelacao do comportamento do fogo, IncendiosFlorestais em Portugal, Caracterizacao, Impactes e Prevencao,ISAPress, Lisboa, Portugal, 287–325, 2006.
Zezere, J. L., Reis, E., Garcia, R., Oliveira, S., Rodrigues, M. L.,Vieira, G., and Ferreira, A. B.: Integration of spatial and tempo-ral data for the definition of different landslide hazard scenariosin the area north of Lisbon (Portugal), Nat. Hazards Earth Syst.Sci., 4, 133–146, 2004,http://www.nat-hazards-earth-syst-sci.net/4/133/2004/.
www.nat-hazards-earth-syst-sci.net/10/485/2010/ Nat. Hazards Earth Syst. Sci., 10, 485–497, 2010


![A Combined Model for Landslide Susceptibility, Hazard and ... · 18]. However, landslide hazard and risk evaluation are not a frequent topic in recent landslide literature [19, 20]](https://img.dokumen.tips/doc/110x75/5e744b3821bc3621652d4065/a-combined-model-for-landslide-susceptibility-hazard-and-18-however-landslide.jpg)