Embed Size (px)
Citation preview
Landscape-scale fuel treatment and wildfire impacts on carbon stocks and fire hazard in California spotted owl habitat
LINDSAY A CHIONO15t DANNY L FRY1 BRANDON M COLLINS23
ANDREA H CHATFIELD4 AND SCOTT L STEPHENS
1
1Ecosystem Sciences Division Department of Environmental Science Policy and Management University of California Berkeley 130 Mulford Hall Berkeley California 94720 USA
2USDA Forest Service Pacific Southwest Research Station Davis California 95618 USA 3Center for Fire Research and Outreach University of California Berkeley Berkeley California 94720 USA
4Western EcoSystems Technology Inc 456 SW Monroe Ave Suite 106 Corvallis Oregon 97333 USA
Citation Chiono L A D L Fry B M Collins A H Chatfield and S L Stephens 2017 Landscape-scale fuel treatment and wildfire impacts on carbon stocks and fire hazard in California spotted owl habitat Ecosphere 8(1)e01648 101002ecs21648
Abstract Forest managers are challenged with meeting numerous demands that often include wildlife habitat and carbon (C) sequestration We used a probabilistic framework of wildfire occurrence to (1) estishymate the potential for fuel treatments to reduce fire risk and hazard across the landscape and within proshytected California spotted owl (Strix occidentalis occidentalis) habitat and (2) evaluate the consequences of treatments with respect to terrestrial C stocks and burning emissions Silvicultural and prescribed fire treatshyments were simulated on 20 of a northern Sierra Nevada landscape in three treatment scenarios that varshyied in the land area eligible for treatment Treatment prescriptions varied with topography vegetation characteristics and ownership We then simulated many wildfires in the treated and untreated landscapes Additional simulations allowed us to consider the influence of wildfire size on estimated emissions Treatshyments constrained to the land area outside of spotted owl activity centers reduced the probability of burnshying and potential fire intensity within owl habitat and across the landscape relative to no-treatment scenarios Allowing treatment of the activity centers achieved even greater fire hazard reductions within the activity centers Treatments also reduced estimated wildfire emissions of C by 45ndash61 However emisshysions from prescribed burning exceeded simulated reductions in wildfire emissions Consequently all treatment scenarios resulted in higher C emissions than the no-treatment scenarios Further for wildfires of moderate size (714ndash2133 ha) the treatment scenarios reduced the C contained in live tree biomass folshylowing simulated wildfire When large wildfires (8070ndash10757 ha) were simulated however the treatment scenario retained more live tree C than the no-treatment scenario Our approach which estimated terresshytrial C immediately following wildfire did not account for long-term C dynamics such as emissions assoshyciated with post-wildfire decay C sequestration by future forest growth or longer-term C sequestration in structural wood products While simulated landscape fuel treatments in the present study reduced the risk of uncharacteristically severe wildfire across the landscape and within protected habitat the C costs of treatment generally exceeded the C benefits
Key words ArcFuels California spotted owl forest thinning prescribed fire Strix occidentalis occidentalis wildfire emissions
Received 31 October 2016 accepted 2 November 2016 Corresponding Editor Debra P C Peters Copyright copy 2017 Chiono et al This is an open access article under the terms of the Creative Commons Attribution
License which permits use distribution and reproduction in any medium provided the original work is properly cited 5 Present address Department of Natural Resources Confederated Tribes of the Umatilla Indian Reservation 46411
Timmıne Way Pendleton Oregon 97801 USA t E-mail lchionoberkeleyedu
wwwesajournalsorg 1 January 2017 Volume 8(1) Article e01648
CHIONO ET AL
INTRODUCTION
Forest managers in fire-prone ecosystems seek to balance a complex set of sometimes competing objectives that include providing wildlife habitat avoiding catastrophic disturbance and supportshying local economies In recent years maintaining and increasing the capacity of forests to store carshybon (C) has been added to these considerations due to concern over the effects of rising atmoshyspheric greenhouse gas concentrations on the earthrsquos climate In dry forests across much of the western United States meeting these objectives is complicated by the increasing area and severity of wildfires occurring in concert with climate change (McKenzie et al 2004 Stephens 2005 Westerling et al 2006 Miller et al 2009)
A high-visibility example of competing objecshytives in forest management is spotted owl (Strix occidentalis occidentalis) conservation in California The northern (S occidentalis caurina) and Mexican (S occidentalis lucida) spotted owl subspecies have been listed as Threatened under the Endangered Species Act Management directives for the Calishyfornia subspecies focus on conserving nesting and roosting habitat by identifying protected activity centers (PACs) sites that include 121 ha (300 ac) of the best-quality habitat near known nest sites (Verner et al 1992) Given the multi-storied dense canopy forest characteristics of nesting and roostshying sites the potential vulnerability of PACs to high-severity fire is a challenge to owl conservashytion (Collins et al 2010 Stephens et al 2016b) While low- to moderate-severity wildfire within nesting and roosting habitat may not negatively impact owls in the short term (Bond et al 2002) longer-term effects of high-severity wildfire can include significant habitat loss due to direct and indirect tree mortality (Gaines et al 1997 Jones et al 2016 Stephens et al 2016b) However due to uncertainty concerning the effects of fuels reducshytion activities management options for reducing wildfire hazard within PACs are restricted to light prescribed burning although some thinning is permitted in the wildlandndashurban interface (USDA Forest Service 2004)
There is concern that such constraints on manshyagement activities limit the effectiveness of land-scape-scale treatments intended to reduce the threat of uncharacteristically severe wildfire (Colshylins et al 2010 Tempel et al 2015) Fire modeling
studies have shown that treating a portion of the landscape can alter simulated fire behavior within and outside of treated areas and that strategically locating fuel treatments across the landscape has the potential to maximize treatment benefits while minimizing area treated (Finney et al 2007 Schmidt et al 2008) Restrictions on fuel treatshyment location and severity limit real-world applishycation of treatment optimization methods Even so there may be significant opportunity for active management outside of high-quality owl habitat on fire-prone landscapes (Ager et al 2007 Prather et al 2008 Gaines et al 2010) Given their demonstrated ability to alter wildshy
fire behavior and effects (Martinson and Omi 2002 Pollet and Omi 2002 Ritchie et al 2007 Fulme et al 2012) fuel treatments that address accumulated fuels and reduce stand density (eg prescribed burning forest thinning mastication) are comshymonly applied in dry western forests where wildshyfires were once frequent It is less certain how treatments influence C stocks and how to maxishymize C storage in frequent-fire systems In the absence of disturbance untreated forests may sequester the most C (Hurteau and North 2009 Stephens et al 2009 Hurteau et al 2011) Howshyever high-severity wildfires can rapidly convert C sinks to sources and burned forests may continue to be C sources for decades (Dore et al 2008 2012) Treatments can reduce wildfire emissions (Finkral and Evans 2008 Hurteau and North 2009 2010 North et al 2009a Reinhardt and Holsinger 2010 Wiedinmyer and Hurteau 2010 North and Hurshyteau 2011) and may retain more live tree C post fire (Hurteau and North 2009 North and Hurteau 2011 Stephens et al 2012) Yet fuel treatments are associated with significant C emissions releasing C to the atmosphere during harvest operations burning andor biomass transport and the C cost of treating forest fuels may exceed its C benefits (Campbell et al 2011 Campbell and Ager 2013) The circumstances under which treatments might lead to a net gain in C have not yet been resolved Recently as a result of concern over the C costs
of fossil fuel use and the threat of wildfire intershyest in harvesting historically low-value woody biomass has increased (Evans and Finkral 2009) Utilizing forest biomass for energy proshyduction can help to reduce the cost of fuel treatshyments support local economies offset fossil fuel use and reduce the C and smoke emissions
wwwesajournalsorg 2 January 2017 Volume 8(1) Article e01648
CHIONO ET AL
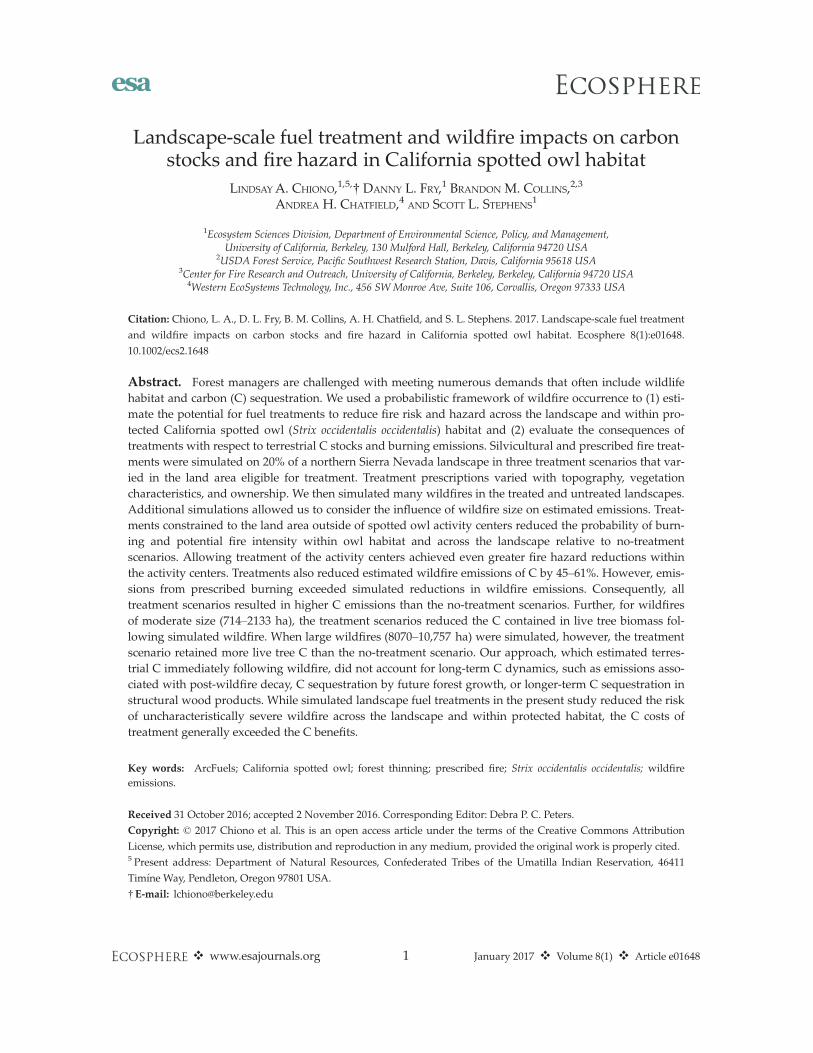
Fig 1 Study area in Tahoe and Eldorado counties northern Sierra Nevada California Land ownership and owl protected activity center (PAC) locations
associated with fuel treatments (Reinhardt et al 2008) Concerns remain over the sustainability of biomass removals funding and the availability of markets (Evans and Finkral 2009)
The focus of our research was to (1) evaluate whether withholding some land area from treatshyment influences potential wildfire hazard across the landscape and within California spotted owl habitat (2) estimate the short-term C conseshyquences of treatments and (3) quantify the bioshymass harvested in treatments We simulated fuels reduction treatments and wildfire in a northern Sierra Nevada study area that encompassed 61 spotted owl PACs In order to evaluate the C balshyance of the treatment scenarios we quantified the C contained in the forest biomass harvested in each treatment scenario the C emitted during prescribed fire and wildfires and the C remaining within onsite pools We confined our analysis to the immediate changes in C stocks and emissions but recognize that a full accounting of treatment effects would also include long-term C dynamics (eg Dore et al 2008 Malmsheimer et al 2011)
METHODS
Study area The study area was defined by a longshy
term demographic study site for the California
spotted owl (S occidentalis occidentalis) The 55398-ha area contains 61 owl PACs The study area is located ~20 km west of Lake Tahoe in the northern Sierra Nevada with elevation ranging from 300 to 2400 m The climate is Meditershyranean with warm dry summers and cool wet winters Vegetation at lower elevations in the study area is montane mixed-conifer forest The forest type is dominated by ponderosa pine (Pinus ponderosa Dougl) Douglas-fir (Pseudoshytsuga menziesii var menziesii (Mirb) sugar pine (Pinus lambertiana Dougl) incense-cedar (Caloceshydrus decurrens [Torr] Florin) white fir (Abies con-color (Gord and Glend)) Franco) and California black oak (Quercus kelloggii Newb) California red fir (Abies magnifica var magnifica Andr Murray) has a stronger presence above ~2000 m (Barbour and Minnich 2000) but the red fir forest type is present on only ~5 of our core study area One-third of the study area is privately held in
a generally checkerboard pattern of ownership (Fig 1) The remaining 37120 ha is managed by the Tahoe and Eldorado National Forests Young forests dominate private land in the study area due to historical and active logging while intershymediate and mature forests are relatively abunshydant on public land (Laymon 1988 Bias and Gutimerrez 1992)
wwwesajournalsorg 3 January 2017 Volume 8(1) Article e01648
CHIONO ET AL
Table 1 Description of Chatfield (2005) cover classes
Cover class Description
1 Hardwood forest (gt10 hardwood canopy closure and lt10 conifer canopy closure)
2 Clearcut or shrubsmall tree (lt153 cm dbh) 3 Pole (153ndash28 cm dbh) forest 4 Medium (28ndash61 cm dbh) conifermixed-conifer
forest with low to medium canopy closure (30ndash69)
5 Medium (28ndash61 cm dbh) conifermixed-conifer forest with high canopy closure (ge70)
6 Mature (ge61 cm dbh) conifermixed-conifer forest with low to medium canopy closure (30ndash69)
7 Mature (ge61 cm dbh) conifermixed-conifer forest with high canopy closure (ge70)
8 Water
Vegetation and fuels data The vegetation classification map developed in
Chatfield (2005) forms the basis of our study area Using aerial photographs combined with field accuracy assessment Chatfield (2005) digitized eight land cover classes consistent with the California Wildlife Habitat Relationships (CWHR Mayer and Laudenslayer 1988) system A descripshytion of the cover classes is provided in Table 1 From the resulting cover class map we delinshyeated polygons to represent stands of similar vegetation composition and structure (n = 4470) based on aerial photographs and topography (Fig 2)
Stands were populated with vegetation data collected in 2007 in 382 sampling plots located within 10 km of the study arearsquos northern boundshyary based on the assumption that the characterisshytics of the plots are representative of the study area These vegetation data included tree species heights diameters and crown ratios See Collins et al (2011) for a detailed description of data colshylection To populate stands in the core study area with plot data we first assigned a Chatfield cover class to each sampling plot based on species comshyposition canopy cover and tree diameter distrishybution We then used a Most Similar Neighbor procedure (Crookston et al 2002) to select five nearest neighbor plots for each stand using the Random Forest method with the R package yaimshypute (version 10-22 Crookston and Finley 2008) Variables used in identifying nearest neighbors were topographic relative moisture index eastshyness northness slope and elevation Stands were
populated with data only from plots belonging to the same cover class In order to increase variabilshyity in stand conditions three of the five plots inishytially selected to represent each stand were chosen randomly to contribute data to the stand Each plot contributed data to an average of 355 stands (range 1ndash437) The method in which surface fuels are represhy
sented for fire modeling has important implicashytions for findings related to expected fire behavior and effects Fuel models are representashytions of fuelbed properties such as the distribushytion of fuel between particle size classes heat content and dead fuel moisture of extinction for use in the Rothermel (1972) surface fire spread model As representations fuel models artifishycially constrain the variation in surface fuel conditions In order to represent a range of preshytreatment fuel conditions for fire modeling we overrode fuel model assignments made by the Fire and Fuels Extension to the Forest Vegetation Simulator (FVS-FFE Dixon 2002 Reinhardt and Crookston 2003) and selected two fuel models for each stand Fuel models representing the low end of the range were assigned following the selection logic of Collins et al (2011) high-end models were selected to amplify surface fire behavior relative to the low-end models (Appshyendix S1 Table S1 Collins et al 2013) This approach to assigning fuel models to stands has been demonstrated to result in modeled fire behavior that is more consistent with observed fire effects than default fuel model assignments (Collins et al 2013) An alternative approach could be to use the Landfire surface fuel model layer (eg Scott et al 2016) However we opted to tie fuel model assignments to the specific forest structural characteristics for each stand (Lydersen et al 2015) as represented by the imputed plots rather than the remotely sensed dominant vegeshytation characteristics captured by Landfire Study area data were processed in the western
Sierra variant of FVS to obtain the data layers required for fire behavior modeling Due to the potential for spurious fire modeling results near study area edges we obtained additional canopy fuel and surface fuel data layers from Landfire (wwwlandfiregov) for an area adjacent to the study area boundary defined by a 10-km minishymum bounding rectangle (Fig 2) The reason for using Landfire data for the buffer area was that
wwwesajournalsorg 4 January 2017 Volume 8(1) Article e01648
CHIONO ET AL
Fig 2 Land cover classes (Chatfield 2005) within the core study area stand polygons and 10-km minimum bounding rectangle for fire spread modeling See Table 1 for description of classes
we did not have a vegetation map with a similar classification scheme and level of detail outside of our core study area (Fig 2) We merged study area and Landfire data layers to build 90 9 90 m resolution landscape files for fire behavior modshyeling in Randig described below This allowed us to include wildfires originating outside of the study area in our analysis
Wildfire fuel treatments and carbon loss modeling
We used ArcFuels (Ager et al 2006) to streamshyline fuel treatment planning and analysis of effects ArcFuels is a library of ArcGIS macros that facilitates communication among the array of models and other programs commonly used in fuel treatment planning at the landscape scale (vegetation growth and yield simulators fire
behavior models ArcGIS and desktop software) Our process depicted in Fig 3 involved
1 fire behavior modeling in Randig (Finney 2006) to identify stands with high fire hazard
2 prioritizing stands for treatment using the Landscape Treatment Designer (LTD) (Ager et al 2012)
3 modeling fuel treatments in FVS-FFE 4 fire behavior modeling for the post-treatment
and untreated landscapes and 5 developing C loss functions from simulated
burning with FVS-FFE
Conditional burn probability and flame lengthmdash Wildfire growth simulations were performed in Randig a command-line version of FlamMap (Finney 2006) Randig uses the minimum travel
wwwesajournalsorg 5 January 2017 Volume 8(1) Article e01648
CHIONO ET AL
Fig 3 Work flow used in the present study to evaluate landscape fuel treatment effects on wildfire hazard and carbon pools and emissions
time algorithm (Finney 2002) to simulate fire growth during discrete burn periods under conshystant weather conditions Simulating many burn periods with Randig generates a burn probability surface for the study landscape Simulations were conducted at 90-m resolution for computashytional efficiency We simulated 80000 randomly located ignitions with a 5-h burn period for all scenarios including no treatment The burn pershyiod was selected to produce fire sizes that approximated area burned in spread events of historical large wildfires near the study area Large daily spread events in previous wildfires in the northern Sierra Nevada have burned gt2000 ha (Dailey et al 2008 Safford 2008) average fire sizes from our simulations ranged from 715 to 2133 ha (The exceptional growth observed in the 2014 King Fire is addressed in a subsequent subsection) The combination of ignishytion number and burn period was sufficient to ensure that 99 of pixels in burnable fuel types experienced fire at least once (average 64ndash1891 fires)
Randig outputs were used both in prioritizing stands for treatment and in evaluating the effects of treatment We performed one Randig run for each fuel model range (low and high) within each scenario (no treatment S1 S2 and S3) using landshyscape files representing the year immediately folshylowing treatment 2009 Simulations were also completed for the 2007 pre-treatment landscape for use in treatment prioritization for a total of 10 modeling runs
To evaluate the effect of treatments on fire risk and fire hazard we assessed changes in condishytional burn probability (CBP) and conditional flame length (CFL) between the treatment scenarshyios and the untreated landscape based on wildfire simulations It is important to note that the burn probabilities estimated in this study are not empirshyical estimates of the likelihood of wildfire occurshyrence (eg Preisler et al 2004 Brillinger et al 2006 Parisien et al 2012) Rather we use CBP the likelihood that a pixel will burn given a single ignition in the study area and assuming the simushylation conditions described From the simulation of many fires Randig calculates a pixel-level disshytribution of flame lengths (FL) in twenty 05-m classes between 05 and 10 m Conditional flame length the probability-weighted FL given that a fire occurs (Ager et al 2010) was calculated by combining burn probability estimates with FL disshytributions summarized at the stand level
( )20 BPiCFL frac14 Fi X
BPifrac141
where BP is CBP BPi is the probability of burning at the ith FL class and Fi is the midpoint FL of the ith FL class To estimate the effect of treatment on fire risk
and hazard we first computed average pixel-level BP and CFL for treated and untreated stands in each scenario Then we calculated average BP and CFL for the same stands within the no-treatment landscape The effect of each treatment scenario
wwwesajournalsorg 6 January 2017 Volume 8(1) Article e01648
CHIONO ET AL
was estimated as the proportional change in each fire metric between the untreated and treated landscapes
We obtained weather and fuel moisture inputs for wildfire modeling from the Bald Mountain and Hell Hole remote automated weather stations (RAWS) based on recommendations from local USDA Forest Service fire and fuel managers We used 95th percentile weather conditions from the 1 June to 30 September period (1989ndash2013) This period represents the typical fire season for the study area encompassing 85 of wildfires and 93 of the area burned within a 161-km (100-mi) radius of the study area between 1984 and 2012 (Monitoring Trends in Burn Severity database Eidenshink et al 2007)
Weather and fuel moisture inputs for wildfire simulations are provided in Appendix S1 Table S2 These conditions are similar to those occurring during recent large wildfires in and near the study area (eg 2001 Star Fire 2008 American River Complex 2013 American Fire) In addition to using Randig to model fire spread and intensity we used FVS-FFE to project effects of prescribed fires and wildfires (described below) Wind inputs varied somewhat between fire models FVS-FFE requires only a single wind speed while multiple wind scenarios were applied in Randig fire simulations Wind speeds azimuths and relative proportions for Randig simulations followed Collins et al (2011)
Spatial optimization of fuel treatmentsmdashStands were selected for treatment based on modeled pre-treatment wildfire hazard and stand structure using the LTD which allows multiple objectives to be combined in the spatial prioritization of fuel treatments Three treatment scenarios varied in the land designations eligible for treatment
Scenario 1 Public land excluding spotted owl habitat Scenario 2 Public land including spotted owl habitat Scenario 3 All lands public and private ownerships
Objectives were consistent across treatment sceshynarios but differed in the land area available for treatment For all LTD runs we directed the model to maximize a total score that comprised numeric stand structure and fire hazard rankings
(Appendix S1 Table S3) The stand structure rankshying (0 1 2) was based on cover class category Cover classes most conducive to thinning were ranked highest Fire hazard ranking (0 2 3) was assigned according to stand-level CFL as calcushylated from FL probability files generated in Randig simulations for the 2007 pre-treatment landscape To isolate the effect of varying land designashy
tions in the area available for treatment total area treated was held constant between scenarios (20 of the core study area) In order to exclude small spatially isolated treatment areas that would be impractical from a management standshypoint we required a minimum treatment area of 121 ha (30 ac) To achieve this the treatment prishyoritization process was iterative In each step we eliminated all stands selected by LTD for treatshyment that were not contiguous with a ge121-ha treatment area The rationale for this is based on the cost associated with re-locating equipment necessary to implement mechanical andor fire treatments (D Errington personal communication El Dorado National Forest) We then calculated the treatment area remaining This process was repeated until total treatment area summed to the target area (~11080 ha) We simulated fuel treatments using FVS-FFE
Stands selected for treatment were assigned one of 13 treatment prescriptions depending on topogshyraphy vegetation cover class ownership and overlap with owl PACs (Appendix S1 Table S4) In an effort to promote landscape-scale heteroshygeneity basal area targets for commercial thinning on public land varied with topography (aspect and slope position canyondrainage bottom mid-slope and ridge) (North et al 2009b North 2012) All thinning treatments were simulated as thinshyfrom-below harvests and thinning within owl PACs was limited to hand thinning We assumed that trees ge254 cm (10 in) dbh would be harshyvested for wood products (FVS VOLUME keyshyword) and that the biomass contained in smaller trees and in the tops and branches of larger trees would be utilized as feedstocks for bioenergy conshyversion Therefore all thinning (except hand thinshyning) treatments were simulated as whole tree harvests (FVS keyword YARDLOSS) Treatments preferentially retained fire-resistant species with relative retention preference as follows black oakgtponderosa pinegtsugar pinegtDouglas-firgtinshycense-cedargtred firegtwhite fir
wwwesajournalsorg 7 January 2017 Volume 8(1) Article e01648
CHIONO ET AL
Prescribed fires were simulated in the year folshylowing thinning (2009) Broadcast burning was applied except within owl PACs on private land and on steep slopes (gt35) where follow-up burning was limited to pile burning To capture a more realistic range of post-treatment surface fuel conditions stands selected for treatment were randomly assigned to one of three post-treatment fuel models for each fuel model range TL1 (181) TL3 (183) or TL5 (185) (low range) TL3 (183) TL5 (185) or SB1 (201) (high range) (Scott and Burgan 2005) Weather conditions for prescribed fire modeling were based on recomshymendations from a local fire management speshycialist (B Ebert personal communication)
Biomass and carbon effects of treatmentmdashSimushylated treatment prescriptions varied according to site characteristics such as topography and land ownership (Appendix S1 Table S4) We tracked the C emitted from burning removed during harshyvesting and contained in live and dead aboveshyground biomass with FVS-FFE carbon reports (Reinhardt and Crookston 2003 Hoover and Rebain 2008) FVS converts biomass to units of C using a multiplier of 05 for all live and dead C pools (Penman et al 2003) except duff and litter pools for which a multiplier of 037 is applied (Smith and Heath 2002) Stand C is partitioned into a number of pools including aboveground live tree standing dead tree herb and shrub litter and duff woody surface fuel and belowground live and dead tree root C we limited our analysis to aboveground pools of C FVS-FFE also reports the C emitted during burning and that conshytained in harvested biomass (Rebain et al 2009) Treatment effects were assessed by comparing expected aboveground biomass C and emissions between the treated and untreated landscapes
We developed C loss functions for each FVS treelist by simulating burning with FVS-FFE at a range of FLs (SIMFIRE and FLAMEADJ keyshywords) (Ager et al 2010 Cathcart et al 2010) The FL values supplied to FLAMEADJ were the 20 midpoints of the 05-m FL classes (05ndash10 m) found in Randig FL probability output files As noted by Ager et al (2010) and Cathcart et al (2010) it is not currently possible to precisely match fire behaviors between Randig and FVS The FLs reported in Randig outputs are the total of surface fire and if initiated crown fire In
contrast the FLs supplied to FVS-FFE via the FLAMEADJ keyword are treated as surface fire FLs and when FLAMEADJ is parameterized with only a predefined FL the model does not use the input FL in crown fire simulations To estimate fire effects in FVS-FFE we parameterized FLAshyMEADJ with percent crowning (PC) and scorch height in addition to FL Scorch height and critical FL for crown fire initiation (FLCRIT) were based on Van Wagner (1977) We estimated PC using a downward concave function where PC = 32 when flame length = FLCRIT and PC = 100 when FL is ge30 of stand top height (the average height of the 40 largest trees by diameter) (Ager et al 2010 A Ager personal communication) The derived C loss functions were combined
with the probabilistic estimates of surface fire behavior produced in Randig simulations to estishymate the ldquoexpected Crdquo emitted in wildfire or conshytained in biomass We estimated expected C emissions and post-fire biomass C for each pixel as follows
20 X[ ]Efrac12 ]C i frac14 BPij X Cij
ifrac140
where E[C]j is the expected wildfire emissions of C from pixel j or biomass C in pixel j in mass per unit area BPij is the probability of burning at the ith FL class for pixel j and Cij is the C emitshyted from pixel j or the biomass C remaining in pixel j post-wildfire given burning at the ith FL class Expected C emissions and biomass C were
summed across all pixels in the core study area to obtain total expected wildfire emissions and expected terrestrial C for each treatment scenario In order to compare our modeling results to
other analyses that reported wildfire emissions on a per area basis we used a different method to estishymate C emissions per area burned Because wildshyfires burned both the core and buffer areas of our study landscape while emissions were estimated only in the core area we used conditional expected wildfire emissions to approximate the emissions from a wildfire burning entirely within the core study area Conditional expected emissions are those produced for an area given that the area is burned Conditional emissions were estimated for each pixel as follows
wwwesajournalsorg 8 January 2017 Volume 8(1) Article e01648
CHIONO ET AL
Table 2 Total area and proportion of area treated by category in each treatment scenario
SC1 SC2 SC3
Proportion of Proportion of Proportion of Treatment category Area (ha) area treated Area (ha) area treated Area (ha) area treated
Treated 11081 100 11082 100 11081 100 Avail for treatmentdagger 22042 199 28998 262 45647 412 Owl habitat treated 00 000 2769 025 1127 010 Private land treated 00 000 00 000 5685 051 Hand thin 1499 014 3819 034 1612 015 Biomass thin 8404 076 7240 065 9470 085 Commercial thin 7765 070 6916 062 9470 085 Broadcast burn 9410 085 7247 065 3785 034 Pile burn 1671 015 3835 035 7296 066
dagger Total land area potentially available for treatment in each scenario The area available for treatment increased from Scenarshyios 1 to 3 as restrictions on the area available for treatment were relaxed
20 X C WCfrac12 ]j frac14
BPij X WCijBPjifrac141
where C[WC]j is the C emitted by wildfire from pixel j in mass per unit area BPj is the probability that pixel j is burned BPij is the probability of burning at the ith FL class and WCij is the C emitted from pixel j when burned at the ith FL class
Conditional expected emissions were averaged across all pixels to obtain an estimate of wildfire emissions per area burned
Large fire revisionmdashWildfire modeling was calishybrated to produce fire sizes that approximated area burned in spread events of historical large wildfires near the study area However during the course of the study a very large fire encounshytered our study area The King Fire began on 13 September 2014 in El Dorado County and burned 39545 hamdashmore than an order of magnishytude greater than our modeled wildfires includshying gt25 of the study area Given the potential for very large wildfires in this region demonshystrated by the King Fire we completed addishytional wildfire modeling to estimate the C effects of treatment given the occurrence of a very large fire
Randig modeling was repeated for the no-treatment and S3 scenarios using the high fuel model range and a revised burn period number of simulated ignitions wind speed and wind directions Burn period was increased from 5 to 12 h number of ignitions was reduced by half to 40000 Wind directions and relative probabilities (Appendix S1 Table S5) were those recorded at
Hell Hole RAWS between 0400 and 1900 hours on 17 September the day of the King Firersquos larshygest spread event We used the probable 1-min maximum wind speed as calculated from the maximum gust recorded on that day 33 kmh (205 mph) based on maximum gust of 547 kmh (34 mph) (Crosby and Chandler 1966) These settings produced average fire sizes of NT = 10757 ha (no-treatment scenario) and 8070 ha (S3) Average fire size was limited by the size of our buffered study area Longer burn periods resulted in an increasing number of simulated wildfires that burned to the study area boundary
RESULTS
Treatment simulation Table 2 provides a summary of the area treashy
ted in each scenario Scenario 1 (S1) was the most restrictive with respect to the land area available for treatment which more than doushybled between S1 and S3 Because treatment preshyscriptions varied with land designation (public owl PAC private) and the designations availshyable for treatment varied between scenarios the relative proportions of thinning and burning methods also varied between scenarios Comshymercial and biomass thinning were applied most frequently in S3 which permitted treatshyment of private land Spotted owl activity censhyters composed 25 of the area treated in S2 vs 10 in S3 and 0 in S1 the scenario in which PACs were not subject to treatment As a result the area treated with hand thinning in S2 was more than twice that in S1 and S3 Due to the
wwwesajournalsorg 9 January 2017 Volume 8(1) Article e01648
CHIONO ET AL
Fig 4 Low fuel model range treatment locations and difference in conditional burn probability (CBP) and conshyditional flame length (CFL) (untreated-treated) for each treatment scenario Negative values indicate an increase in CBP or CFL while positive values represent a reduction CBP is the likelihood that a pixel will burn given a single ignition on the landscape and assuming the simulation conditions described in Appendix S1 Table S1 and in the text Conditional flame length is the probability-weighted flame length given these same assumptions
inclusion of PACs in S2 and both PACs and prishyvate land in S3 the proportion of area treated with pile burning increased between S1 and S3 while broadcast burn area exhibited an opposite trend Despite the variation in land designations available for treatment the pattern of treatshyment placement was generally similar between scenarios with treatments concentrated in the central and eastern portions of the study area (Figs 4 5)
Landscape-scale burn probability and fire hazard Conditional burn probabilitymdashThe pixel-to-pixel
change in CBP between the untreated scenario and each treatment scenario is mapped in Figs 4 (LO FM) and 5 (HI FM) Treatment reduced landshyscape burn probability by approximately 50 (Table 3) from 00124 (NT) to 00062 (S1) 00059 (S2) and 00055 (S3) Within treatment units avershyage CBP fell by 69ndash76 to 00033ndash00035 outside of treated stands CBP fell to 00060ndash00069 Some
wwwesajournalsorg 10 January 2017 Volume 8(1) Article e01648
CHIONO ET AL
Fig 5 Treatment locations and high fuel model range difference in conditional burn probability and condishytional flame length (untreated-treated) for each treatment scenario
increases in CBP were also observed particularly for the low fuel model range (Fig 4)
The influence of treatment on owl PAC likelishyhood of burning was similar to that observed for stands in general For treated PACs average CBP fell by ~70 relative to no treatment for the same stands Although PACs were not eligible for treatment in S1 all treatment scenarios had a large impact on estimated PAC CBP Average PAC CBP was reduced from 0013 to 00063 in S1 00049 in S2 and 00054 in S3 a 49ndash64 decrease relative to PACs in the no-treatment landscape (Table 3)
Fire hazardmdashTreatments reduced average landshyscape CFL by ~1 m from 36 m (NT) to 25ndash27 m Pixel-level CFL was reduced by a maximum of 80 m (LO FM) and 90 m (HI FM) Increases in CFL were also observed however particularly near the study arearsquos western and southwestern boundaries where treatments were least concentrated (Figs 4 5) Maximum pixel-level CFL increases were 25 m (LO FM) and 31 m (HI FM) Because fire hazard was used in prioritizing
stands for treatment the estimated pre-treatment CFL in stands selected for treatment (43ndash51 m)
wwwesajournalsorg 11 January 2017 Volume 8(1) Article e01648
CHIONO ET AL
Table 3 Proportional change in burn probability for treatment scenarios compared to the NT scenario
LO FM HI FM AVG
Stand type
S1 S2 S3 Proportional change
relative to NT
S1 S2 S3 Proportional change
relative to NT
S1 S2 S3 Proportional change
relative to NT
All PACs -045 -064 -056 -053 -063 -059 -049 -064 -057 Treated PACs NA -081 -076 NA -057 -067 NA -069 -072 Untreated PACs -045 -053 -051 -053 -054 -058 -049 -053 -054 All stands Treated stands
-044 -076
-048 -079
-053 -063
-050 -072
-053 -074
-056 -074
-047 -074
-050 -076
-054 -069
Untreated stands -035 -039 -049 -045 -047 -051 -040 -043 -050
Notes NT no treatment PACs protected activity centers Proportions are ratios of treatment values to no-treatment values as calculated for the same stands Treatment and no-treatment values were calculated as the average pixel value for the low and high fuel model range (LO FM and HI FM) within each stand category and treatment scenario
was greater than in stands not selected (32ndash 33 m) After treatment average CFL within treashyted stands fell to 13 (S1 and S2) and 17 m (S3) CFL in untreated stands was also reduced as a result of the influence of treatments on fire spread and intensity CFL fell by 05ndash08 m (9ndash 16) relative to CFL in the same stands within the no-treatment landscape (Table 4)
Although spotted owl PACs were not treated in S1 relative to PACs in the NT landscape PAC CFL was reduced by 10 (to 32 m) in S1 Treating PACs had a much larger impact on potential fire intensity however Average treashyted PAC CFL fell to 13 and 14 m in S2 and S3 respectively
Carbon consequences of landscape fuel treatments
Prior to treatment aboveground landscape carbon totaled 14705 tonnesha on average Treatments removed 14 of pre-treatment C from treated stands or 2374 tonnesha totaling
81772ndash119103 tonnes of C in harvested biomass and merchantable material (Tables 5 and 6) Both the treatment scenarios and the choice of
fuel models were important influences on estishymated C emissions from burning As the least restrictive treatment scenario in terms of treatshyment location and the only scenario to include treatment of private land where broadcast burnshying was precluded as a treatment option the S3 treatment scenario was associated with the lowshyest wildfire and prescribed burning emissions (Tables 5 and 6) For each treatment scenario expected wildfire emissions increased by more than an order of magnitude between the low and high fuel model ranges This difference was the result of increasing fire intensity as well as wildshyfire size Average wildfire size nearly doubled between fuel model ranges in the treatment sceshynarios and tripled in the no-treatment scenario (Fig 6) For a given treatment scenario wildfire emissions on a per hectare basis were approxishymately two tonnes greater for the high fuel
Table 4 Proportional change in conditional flame length for treatment scenarios compared to the NT scenario
LO FM HI FM AVG
Stand type
S1 S2 S3 Proportional change
relative to NT
S1 S2 S3 Proportional change
relative to NT
S1 S2 S3 Proportional change
relative to NT
All PACs -009 -042 -028 -012 -043 -027 -010 -042 -028 Treated PACs NA -071 -075 NA -071 -073 NA -071 -074 Untreated PACs -009 -014 -011 -012 -017 -014 -010 -016 -013 All stands -022 -026 -031 -025 -026 -028 -024 -026 -030 Treated stands -065 -069 -052 -071 -071 -073 -068 -070 -062 Untreated stands -008 -009 -021 -011 -012 -012 -009 -010 -016
Notes NT no treatment PACs protected activity centers Proportions are ratios of treatment values to no-treatment values as calculated for the same stands Treatment and no-treatment values were calculated as the average pixel value for the low and high fuel model range (LO FM and HI FM) within each stand category and treatment scenario
wwwesajournalsorg 12 January 2017 Volume 8(1) Article e01648
CHIONO ET AL
Table 5 Expected biomass carbon expected wildfire C emissions and C harvested and emitted in fuel treatshyments for NT and treatment (S1 S2 S3) scenarios using the low fuel model range in fire modeling
Carbon pool NT S1 S2 S3
Untreated stands Tonnes C Live 5004505 3915044 3695489 3954131 Dead 1845659 1421704 1378824 1466202 Wildfire emissions 2372 1137 1039 904
Treated stands Live 881358 1072625 826366 Dead 260089 299244 220932 All harvested biomass 88773 81772 119103 Prescribed fire emissions 178530 169693 122599 Wildfire emissions 48 56 61
All stands Live 5004505 4796402 4768113 4780497 Dead 1845659 1681793 1678068 1687135 Treatment (harvested and emitted) 267303 251465 241702 Wildfire emissions 2372 1186 1095 965
Grand totals 6852536 6746684 6698741 6710299
Notes LF indicates the large fire scenarios Expected C is that remaining in the core study area following treatment if applishycable and a random ignition and wildfire in the larger buffered study area as estimated from the simulation of many wildfires Live C is that contained in live aboveground herb shrub and tree biomass dead C is the C contained in litter duff woody surshyface fuel and aboveground portions of tree snags NT no treatment
model range than for the low range In contrast to the large influence of fuel model choice on wildfire emissions the effect of fuel model range on prescribed fire emissions was minimal with only a 1 increase in emissions between the low and high fuel model ranges for a given treatment scenario
Although treatment significantly reduced wildshyfire emissions combined emissions from preshyscribed burning on 20 of the landscape and wildfire exceeded wildfire emissions in the no-treatment scenarios (Tables 5 and 6) Relative to the no-treatment scenarios treatment reduced estimated wildfire emissions by approximately 54 (low fuel model range) 59 (high fuel model range) and 45 (large fire scenarios) Yet preshyscribed burning was a far more significant source of emissions than were wildfires of moderate size with emissions from treatment exceeding wildfire emissions by 111259ndash177344 tonnes Even for the large wildfire simulations where landscape treatments nearly halved estimated wildfire emisshysions the combined carbon emissions from preshyscribed burning and wildfire in the treatment scenario surpassed wildfire emissions in the no-treatment scenario by 45 (Table 6 Fig 7)
The total quantity of aboveground C expected to remain on the landscape following treatment
and a randomly ignited wildfire was greatest for the no-treatment scenarios (Tables 5 and 6) For modeled wildfires of moderate size treatment reduced both the live and dead C pools relative to the no-treatment scenarios and terrestrial C in the no-treatment scenarios was 4ndash5 greater (323316 ndash434960 tonnes) than in any of the treatment scenarios (Tables 5 and 6) In comparison under large wildfire conditions the treatment scenario retained slightly more live biomass C~15000 tonshynes or 03 more than the no-treatment scenario However treatment also reduced necromass C by 288000 tonnes (12) resulting in a 3 overall decrease in onsite biomass C relative to an untreshyated landscape (Table 6) The proportional changes in aboveground
biomass C pools between the treatment and no-treatment scenarios are summarized in Table 7 For all treatment scenarios the consumption of duff litter and downed woody fuels with preshyscribed burning contributed to a net reduction in these C pools relative to the untreated landscape Conversely treatments protected more C in the live understory (herb and shrub) poolmdashthe result of reduced wildfire size and intensity in the treatshyment scenarios Treatments in the moderate wildshyfire scenarios reduced live tree biomass C in comparison with no-treatment levels (Fig 8)
wwwesajournalsorg 13 January 2017 Volume 8(1) Article e01648
CHIONO ET AL
Table 6 Expected biomass carbon expected wildfire C emissions and C harvested and emitted in fuel treatshyments for NT and treatment (S1 S2 S3) scenarios using the high fuel model range in fire modeling
Carbon pool NT S1 S2 S3 NT-LF S3-LF
Untreated stands Tonnes C Live 4910239 3879854 3664690 3923358 4586898 3750774 Dead 1912429 1448947 1403313 1489629 2130034 1605591 Wildfire emissions 31831 12934 12001 11293 137622 68061
Treated stands Live 896670 1115918 853503 847374 Dead 280182 325628 238130 247744 All harvested biomass 88773 81772 119103 119103 Prescribed fire emissions 180357 171247 123539 123539 Wildfire emissions 798 951 986 8285
All stands Live 4910239 4776524 4780607 4776861 4586898 4598148 Dead 1912429 1729129 1728941 1727759 2130034 1853334 Treatment (harvested and emitted) 282862 265971 254921 254921 Wildfire emissions 31831 13732 12952 12279 137622 76346
Grand totals 6854499 6802247 6788471 6771820 6854554 6782749
Notes LF indicates the large fire scenarios Expected terrestrial C is that remaining in the core study area following treatshyment if applicable and a random ignition and wildfire in the larger buffered study area as estimated from the simulation of many wildfires Live C is that contained in live aboveground herb shrub and tree biomass dead C is the C contained in litter duff woody surface fuel and aboveground portions of tree snags NT no treatment
Notably in the large modeled wildfire scenarios (NT-LF and S3-LF) treatments resulted in a 400000-tonne increase in landscape-level live tree C over the no-treatment scenario
DISCUSSION
Fuel treatments in protected habitat Because there are often competing objectives
between managing forests for resilience to fire and drought and protecting owl habitat we assessed potential fire occurrence and hazard based on treatment scenarios that included and omitted treatment of PACs Conducting fuels management outside of occupied owl habitat has been suggested as a means of reducing fire risk within occupied sites (Jenness et al 2004 Tempel et al 2015) Ager et al (2007) reported that fuel treatments on 20 of a western Oregon landscape reduced the probability of northern spotted owl nesting and roosting habitat loss by 44 even though that habitat type was not treated As in Ager et al (2007) we observed modifications in fire intensity and burn probability within owl habitat even when it was left untreated In the S1 treatment scenario in which owl activity centers were not eligible for treatment the effect of treatshying other stands reduced both fire hazard (by
9ndash12 for CFL or approximately 04 m) and CBP (by ~45) within PACs It is difficult to assess the significance of this proportional reduction in CBP given that the absolute differences in probabilities were relatively modest (Figs 3 4) Ager et al (2007) noted that allowing treatment of owl habishytat would have significantly reduced estimated habitat loss in their study In this study it is expected that habitat quality may be reduced within treated PACs in the short term through the removal of small-diameter trees (ie lower vertical structural heterogeneity) However two structural attributes for suitable spotted owl nestshying habitat identified by Tempel et al (2015) high canopy cover and large tree density would not be altered While we did not directly estimate habitat loss we did observe much larger reductions in fire hazard within PACs that were treated as meashysured by CFL (71ndash75 reduction equivalent to 2ndash3 m) It should be noted that the effect of wideshyspread treatments within PACs on spotted owl nesting and foraging behavior is unknown One concern with designating some land area
unavailable for treatment is that it may limit the potential for treatments to alter fire behavior across the landscape (eg Finney 2001) Including all stands in the potential treatment pool allows the highest-priority stands with respect to simulated
wwwesajournalsorg 14 January 2017 Volume 8(1) Article e01648
CHIONO ET AL
effects on landscape-level fire behavior The true effect of increasing the land area available for treatshyment may be partially obscured by the varying frequency of treatment prescriptions between sceshynarios For example the hand thinning treatments applied within PACs would be expected to have a milder effect on potential wildfire behavior than more severe prescriptions and hand thinning was twice as common in S2 as in the other scenarios
Terrestrial carbon and burning emissions Landscape treatments reduced wildfire emisshy
sions by reducing the emissions produced per area burned by wildfire as well as average wildfire size On average wildfires in the treated landscapes released 193ndash216 tonnes Cha while wildfires in the untreated landscapes released 234ndash254 tonnes Cha Modeled wildfires decreased in size by 7 (low fuel model range) 36 (high fuel model range) and 25 (large fire scenario) relative to untreated landscapes (Fig 6) Since the burn pershyiod for simulated wildfires was held constant between scenarios this reduction in average wildshyfire size is the result of reduced spread rates derived from fuel treatments Despite the influence of treatments on wildfire
intensity size and expected emissions treatment-related emissions exceeded the avoided wildfire emissions conferred by treatment Prescribed burning in our study a combination of broadcast
Fig 6 Wildfire size relative frequency distributions from wildfire simulations Bar color represents no-treatment (NT) and treatment scenarios (S1ndashS3)
fire spread to be treated which would be expected to achieve the greatest modification of landscape fire behavior and effects In the present study although the land area potentially available for treatment more than doubled between S1 and S3 landscape-level effects of treatment on modeled fire risk and hazard were fairly similar (compared with the no-treatment landscape all-stand CBP fell by 47 and 54 in S1 and S3 while CFL fell by 24 and 30) Dow et al (2016) also found that incorporating modest restrictions on treatment Fig 7 Carbon emissions (tonnes) from wildfire and
area availability (24 of the landscape unavail- prescribed burning X-axis labels indicate no-treatment able) had minimal consequences for modeled fire (NT) and treatment scenarios (S1ndashS3) subscripts size and hazard The modest changes in estimated denote fuel model ranges used in fire modeling
fire metrics we observed may also be due to simi- (L low H high) Large fire scenarios which were
larity in the general pattern of treatment placement modeled with the high fuel model range only are indishybetween scenarios which probably led to similar cated by LF
wwwesajournalsorg 15 January 2017 Volume 8(1) Article e01648
CHIONO ET AL
Table 7 Proportional change in expected carbon by biomass pool for treatment scenarios compared to the no-treatment landscape
Treatment Standing Down dead Forest Herb Live scenario dead wood floor shrub tree
S1 004 -017 -013 014 -004 S2 001 -016 -012 014 -004 S3 -001 -015 -010 016 -004 S3-LF -016 -013 -008 017 000
Notes For example a value of -010 represents a 10 decshyline in biomass C from the no-treatment scenario Treatment and no-treatment values were calculated as the average of low and high fuel model range values except in the case of the large fire (LF) scenarios which were modeled for the high fuel model range only Expected C is that remaining after a random ignition and wildfire in the buffered study area as estimated from simulating 80000 ignitions (LF 40000 ignitions)
C pool categories are those reported in Forest Vegetation Simulator Carbon Reports Standing dead aboveground porshytion of standing dead trees Down dead wood woody surface fuels Forest floor litter and duff Herbshrub herbs and shrubs Live tree aboveground portion of live trees
and pile burning released 111ndash163 tonnes Cha For comparison studies conducted in comparable forest types have estimated prescribed fire emisshysions of 127 tonnes Cha (warm dry ponderosa pine habitat types Reinhardt and Holsinger 2010)
Fig 8 Expected carbon contained in aboveground live and dead tree biomass Expected C is that remainshying in the core study area following treatment (if applishycable) and a single random ignition within the larger buffered study area X-axis labels indicate no-treatment (NT) and treatment scenarios (S1ndashS3) subshyscripts denote fuel model ranges used in fire modeling (L low H high) Large fire scenarios which were modeled for the high fuel model range only are indishycated by LF
and 148 tonnes Cha (an old-growth mixed-conifer reserve in the southern Sierra Nevada North et al 2009a) Relative to the approximately 158000 tonnes C emitted in prescribed burning avoided wildfire emissions at 1186ndash19551 tonnes for wildfires of moderate size were small A simishylar study in southern Oregon with average modshyeled wildfires of 2350 and 3500 ha (treatment and no-treatment scenarios respectively) found that treatments reduced expected wildfire emissions by 6157 tonnes of C (Ager et al 2010) Surface fuels represented with surface fuel
models in commonly used modeling software are the most influential inputs determining preshydicted fire behavior (Hall and Burke 2006) Fire behavior fire sizes and emissions in this study varied according to fuel model assignment highshylighting the importance of selecting the approprishyate fuel model to represent fuel conditions (see Collins et al 2013) We show a 12- to 14-fold change in wildfire emissions due solely to the choice of fuel models (Tables 5 and 6) Indeed the range of fuel models used in recent studies investigating fuel treatments and simulated fire behavior in mixed-conifer forests is noteworthy Incorporating a range of fuel models into analyshyses such that outcome variability can be reported facilitates comparison of effects across studies Our estimates of the aboveground C benefits
of treatment under the moderate wildfire scenarshyios with average fire sizes of le2133 ha are likely conservative The effect of modeled wildfire size on the C consequences of fuel treatment was conshysiderable emphasizing the importance of this variable in studies of the climate benefits of treatshyment Avoided wildfire emissions resulting from treatment increased to 61276 tonnes C when large wildfires (8070ndash10757 ha) were simulated The treatment scenario given large wildfires also protected a greater portion of live tree C If the ~40000-ha King Fire is representative of the magnitude of future wildfires in the region C accounting should improve with respect to treatshyment favorability Similarly if multiple wildfires were to encounter the study area within the effective lifespan of treatments the C gains assoshyciated with avoided emissions in the treatment scenarios would increase Our approach to estimating the C conseshy
quences of fuel treatments has a number of limitashytions A full accounting of treatment effects
wwwesajournalsorg 16 January 2017 Volume 8(1) Article e01648
CHIONO ET AL
would project through time the consequences of both treatment and wildfire Our analysis is static incorporating only the short-term C costs and benefits of treatment Simulating wildfire in the year immediately following treatment maximizes the apparent benefits of treatment Over time as surface fuels accumulate and vegetation regenershyates maintenance would be required to retain the effectiveness of treatments (Martinson and Omi 2013) increasing the C costs of reduced fire hazard In addition the C contained in fire-killed biomass will ultimately be emitted to the atmoshysphere although biomass decay could be delayed through conversion to long-lived wood products such as building materials (Malmsheimer et al 2011) It is also important to note that our analysis did not include stochastic wildfire occurrence Estimates of burn probability in the present study are not estimates of the likelihood of wildfire occurrence based on historical fire sizes and freshyquency (eg Preisler et al 2004 Mercer and Prestemon 2005 Brillinger et al 2006) but rather are conditional on a single randomly ignited wildfire within the buffered study area
CONCLUSIONS
Our findings generally support those of Campshybell et al (2011) who concluded from an analysis of fire-prone western forests that the C costs of treatments are likely to outweigh their benefits under current depressed fire frequencies In a more recent paper Campbell and Ager (2013) conshycluded that ldquonone of the fuel treatment simulation scenarios resulted in increased system carbonrdquo primarily from the low incidences of treated areas being burned by wildfire However our interpreshytation of these findings differs from those disshycussed in Campbell et al (2011) and Campbell and Ager (2013) especially in light of recent and projected future trends in fire activity (Westerling et al 2011 Miller and Safford 2012 Dennison et al 2014) The current divergence of increasing surface air temperatures and low fire activity is unlikely to be sustained further suggesting greater future fire activity (Marlon et al 2012) If increased fire activity is realized then the likelishyhood of a given area being burned in a wildfire increases This differs from the simple increase in stand-level fire frequency modeled by Campbell et al (2011) because increases in fire likelihood are
not necessarily associated with corresponding decreases in fire severity as assumed by Campbell et al (2011) Increased fire likelihood could very well lead to positive feedbacks in fire severity and ultimately to vegetation type conversion (Copposhyletta et al 2016)mdasheffects that would have signifishycant implications for carbon storage Due to the significant emissions associated
with treatment and the low likelihood that wildshyfire will encounter a given treatment area forest management that is narrowly focused on C accounting alone would favor the no-treatment scenarios Landscape treatments protected more C in live tree biomass only when large wildfires were simulated While treatment favorability improved with large wildfire simulation the no-treatment scenario still produced fewer emissions than the treatment scenario Given the potential for large wildfire in the region as demonstrated by the 2014 King Fire and the increasing freshyquency of large wildfires and area burned in Calishyfornia expected from climate modeling studies (Lenihan et al 2008 Westerling et al 2011) we suggest that future studies of fuel treatmentndashwildshyfirendashC relationships should incorporate the potenshytial for large wildfires at a frequency greater than those observed over the last 20ndash30 yr Others have argued that treatments to increase forest resilience should be a stand-alone top land management priority independent of other ecosystem values such as carbon sequestration and fire hazard reduction (Stephens et al 2016a) We also note that the potential benefits of fuels
management are not restricted to avoided wildshyfire emissions Here we show that landscape fuel treatments can alter fire hazard across the landshyscape both within and outside of treated stands and have the potential to affect the likelihood of burning and fire intensity within protected Calishyfornia spotted owl habitat Underscoring the risk to sensitive habitat the 2014 King Fire encounshytered 31 PACs within our study area leading to the greatest single-year decline in habitat occushypancy recorded over a 23-yr study period (Jones et al 2016) Modest simulated treatments within activity centers significantly reduced potential fire intensity relative to both the no-treatment landscape and a treatment scenario that did not permit treatment within PACs indicating that active management may be desirable to protect habitat in the long term (Roloff et al 2012)
wwwesajournalsorg 17 January 2017 Volume 8(1) Article e01648
CHIONO ET AL
However treatments conducted outside of owl habitat also reduced wildfire hazard
ACKNOWLEDGMENTS
We are grateful to a number of individuals for sharshying their time and fuel treatment and fire modeling expertise Nicole Vaillant (ArcFuels) Alan Ager and Andrew McMahan (carbon estimation) and Coeli Hoover (harvest simulations in FVS-FFE) Brian Ebert and Dana Walsh of the Eldorado National Forest proshyvided invaluable advice on weather inputs for fire modeling and on designing fuel treatment prescripshytions Ken Somers Operations Forester on the Blodgett Forest Research Station gave advice concerning timshyber management on private land We also thank two anonymous reviewers whose comments greatly improved this article The California Energy Commisshysion provided funding for this project
LITERATURE CITED
Ager A A B Bahro and K Barber 2006 Automating the fireshed assessment process with ArcGIS Pages 163ndash167 in P L Andrews and B W Butler (Comps) Fuels ManagementndashHow to Measure Success Conference Proceedings Portland OR March 28ndash30 2006 Proceedings RMRS-P-41 USDA Forest Service Rocky Mountain Research Station Fort Collins Colorado USA
Ager A A M A Finney B K Kerns and H Maffei 2007 Modeling wildfire risk to northern spotted owl (Strix occidentalis caurina) habitat in Central Oregon USA Forest Ecology and Management 24645ndash56
Ager A A M A Finney A McMahan and J Cathcart 2010 Measuring the effect of fuel treatments on forshyest carbon using landscape risk analysis Natural Hazards and Earth System Science 102515ndash2526
Ager A A N M Vaillant D E Owens S Brittain and J Hamann 2012 Overview and example application of the Landscape Treatment Designer Pages 11 General Technical Report PNW-GTR-859 USDA Forest Service Pacific Northwest Research Station Portland Oregon USA
Barbour M G and R A Minnich 2000 Californian upland forests and woodlands Pages 131ndash164 in M Barbour and W Billings editors North Amerishycan terrestrial vegetation Cambridge University Press Cambridge UK
Bias M A and R Gutimerrez 1992 Habitat associations of California spotted owls in the central Sierra Nevada Journal of Wildlife Management 56584ndash595
Bond M L R Gutierrez A B Franklin W S LaHaye C A May and M E Seamans 2002
Short-term effects of wildfires on spotted owl surshyvival site fidelity mate fidelity and reproductive success Wildlife Society Bulletin 301022ndash1028
Brillinger D H Preisler and J Benoit 2006 Probashybilistic risk assessment for wildfires Environ-metrics 17623ndash633
Campbell J L and A A Ager 2013 Forest wildfire fuel reduction treatments and landscape carbon stocks a sensitivity analysis Journal of Environshymental Management 121124ndash132
Campbell J L M E Harmon and S R Mitchell 2011 Can fuel-reduction treatments really increase forest carbon storage in the western US by reducshying future fire emissions Frontiers in Ecology and the Environment 1083ndash90
Cathcart J A A Ager A McMahan M Finney and B Watt 2010 Carbon benefits from fuel treatshyments Pages 61ndash80 in T B Jain R T Graham and J Sandquist editors Integrated management of carbon sequestration and biomass utilization opportunities in a changing climate Proceedings of the 2009 National Silviculture Workshop Boise Idaho June 15ndash18 2009 USDA Forest Service Proshyceedings RMRS-P-61 Rocky Mountain Research Station Fort Collins Colorado USA
Chatfield A H 2005 Habitat selection by a California spotted owl population a landscape scale analysis using resource selection functions Thesis Univershysity of Minnesota St Paul Minnesota USA
Collins B M H A Kramer K Menning C Dilling-ham D Saah P A Stine and S L Stephens 2013 Modeling hazardous fire potential within a comshypleted fuel treatment network in the northern Sierra Nevada Forest Ecology and Management 310156ndash166
Collins B M S L Stephens J J Moghaddas and J Battles 2010 Challenges and approaches in planshyning fuel treatments across fire-excluded forested landscapes Journal of Forestry 10824ndash31
Collins B M S L Stephens G B Roller and J J Battles 2011 Simulating fire and forest dynamics for a landscape fuel treatment project in the Sierra Nevada Forest Science 5777ndash88
Coppoletta M K E Merriam and B M Collins 2016 Post-fire vegetation and fuel development influences fire severity patterns in reburns Ecologishycal Applications 26686ndash699
Crookston N L and A O Finley 2008 yaimpute an r package for knn imputation Journal of Statistical Software 231ndash16
Crookston N L M Moeur and D L Renner 2002 Userrsquos guide to the most similar neighbor imputashytion program version 2 General Technical Report RMRS-GTR-96 USDA Forest Service Rocky Mountain Research Station Ogden Utah USA
wwwesajournalsorg 18 January 2017 Volume 8(1) Article e01648
CHIONO ET AL
Crosby J and C Chandler 1966 Get the most from your windspeed observations Fire Control Notes 2712ndash13
Dailey S J Fites A Reiner and S Mori 2008 Fire behavior and effects in fuel treatments and proshytected habitat on the Moonlight fire Fire Behavior Assessment Team wwwfsfedusadaptivemana gementprojectsFBATdocsMoonlightFinal_8_6_08 pdf
Dennison P E S C Brewer J D Arnold and M A Moritz 2014 Large wildfire trends in the western United States 1984ndash2011 Geophysical Research Letters 412928ndash2933
Dixon G E 2002 Essential FVS a userrsquos guide to the forest vegetation simulator Pages 193 USDA Forest Service Forest Management Service Center Fort Collins Colorado USA
Dore S T E Kolb M Montes-Helu B W Sullivan W D Winslow S C Hart J P Kaye G W Koch and B A Hungate 2008 Long-term impact of a stand-replacing fire on ecosystem CO2 exchange of a ponderosa pine forest Global Change Biology 141ndash20
Dore S M Montes-Helu S C Hart B A Hungate G W Koch J B Moon A J Finkral and T E Kolb 2012 Recovery of ponderosa pine ecosystem carbon and water fluxes from thinning and stand-replacing fire Global Change Biology 183171ndash3185
Dow C J B M Collins and S L Stephens 2016 Incorporating resource protection constraints in an analysis of landscape fuel-treatment effectiveness in the Northern Sierra Nevada California USA Environmental Management 571ndash15
Eidenshink J B Schwind K Brewer Z Zhu B Quayle and S Howard 2007 A project for monshyitoring trends in burn severity Fire Ecology 33ndash21
Evans A M and A J Finkral 2009 From renewable energy to fire risk reduction a synthesis of biomass harvesting and utilization case studies in US forshyests GCB Bioenergy 1211ndash219
Finkral A J and A M Evans 2008 The effects of a thinning treatment on carbon stocks in a northern Arizona ponderosa pine forest Forest Ecology and Management 2552743ndash2750
Finney M A 2001 Design of regular landscape fuel treatment patterns for modifying fire growth and behavior Forest Science 47219ndash228
Finney M A 2002 Fire growth using minimum travel time methods Canadian Journal of Forest Research 321420ndash1424
Finney M A 2006 An overview of FlamMap fire modeling capabilities Pages 213ndash220 in P L Andrews and B W Butler editors Proceedings of Fuels ManagementndashHow to Measure Success Research Paper RMRS-P-41 USDA Forest Service
Rocky Mountain Research Station Portland Oregon USA
Finney M A R C Seli C W McHugh A A Ager B Bahro and J K Agee 2007 Simulation of longshyterm landscape-level fuel treatment effects on large wildfires International Journal of Wildland Fire 16712ndash727
Fulme P Z J E Crouse J P Roccaforte and E L Kalies 2012 Do thinning andor burning treatments in western USA ponderosa or Jeffrey pine-dominated forests help restore natural fire behavior Forest Ecology and Management 26968ndash81
Gaines W L R J Harrod J Dickinson A L Lyons and K Halupka 2010 Integration of Northern spotted owl habitat and fuels treatments in the eastern Cascades Washington USA Forest Ecolshyogy and Management 2602045ndash2052
Gaines W L R A Strand and S D Piper 1997 Effects of the hatchery complex fires on northern spotted owls in the eastern Washington Cascades Pages 123ndash129 in J N Greenlee editor Proceedings of the Fire Effects on Rare and Endangered Species and Habitats Conference Coeur DrsquoAlene Idaho International Association of Wildfire and Forestry Hot Springs South Dakota USA
Hall S A and I C Burke 2006 Considerations for characterizing fuels as inputs for fire behavior models Forest Ecology and Management 227 102ndash114
Hoover C and S Rebain 2008 The Kane Experimenshytal Forest carbon inventory carbon reporting with FVS Pages 13ndash15 in R N Havis and N L Crookston editors Third Forest Vegetation Simushylator Conference Fort Collins Colorado February 13ndash15 2007 USDA Forest Service Rocky Mountain Research Station Fort Collins Colorado USA
Hurteau M and M North 2009 Fuel treatment effects on tree-based forest carbon storage and emissions under modeled wildfire scenarios Fronshytiers in Ecology and the Environment 7409ndash414
Hurteau M D and M North 2010 Carbon recovery rates following different wildfire risk mitigation treatments Forest Ecology and Management 260 930ndash937
Hurteau M D M T Stoddard and P Z Fulme 2011 The carbon costs of mitigating high-severity wildshyfire in southwestern ponderosa pine Global Change Biology 171516ndash1521
Jenness J S P Beier and J L Ganey 2004 Associashytions between forest fire and Mexican spotted owls Forest Science 50765ndash772
Jones G M R Gutimerrez D J Tempel S A Whitmore W J Berigan and M Z Peery 2016 Megafires an emerging threat to old-forest species Frontiers in Ecology and the Environment 14300ndash306
wwwesajournalsorg 19 January 2017 Volume 8(1) Article e01648
CHIONO ET AL
Laymon S A 1988 Ecology of the spotted owl in the central Sierra Nevada California Dissertation University of California Berkeley California USA
Lenihan J M D Bachelet R P Neilson and R Drapek 2008 Response of vegetation distribution ecosystem productivity and fire to climate change scenarios for California Climatic Change 87215ndash230
Lydersen J M B M Collins E E Knapp G B Roller and S Stephens 2015 Relating fuel loads to overshystorey structure and composition in a fire-excluded Sierra Nevada mixed conifer forest International Journal of Wildland Fire 24484ndash494
Malmsheimer R J Bowyer J Fried E Gee R Islar R Miner I E Munn E Oneil and W C Stewart 2011 Managing forests because carbon matters integrating energy products and land manageshyment policy Journal of Forestry 109S7ndashS50
Marlon J R et al 2012 Long-term perspective on wildfires in the western USA Proceedings of the National Academy of Sciences of the United States of America 109E535ndashE543
Martinson E J and P N Omi 2002 Performance of fuel treatments subjected to wildfires Pages 7ndash13 in P N Omi and L A Joyce editors Conference on Fire Fuel Treatments and Ecological Restorashytion USDA Forest Service Rocky Mountain Research Station Fort Collins Colorado USA
Martinson E J and P N Omi 2013 Fuel treatments and fire severity a meta-analysis Pages 38 USDA Forest Service Rocky Mountain Research Station Fort Collins Colorado USA
Mayer K E and W F Laudenslayer 1988 A guide to wildlife habitats of California California Departshyment of Forestry and Fire Protection Sacramento California USA
McKenzie D Z Gedalof D L Peterson and P Mote 2004 Climatic change wildfire and conservation Conservation Biology 18890ndash902
Mercer D E and J P Prestemon 2005 Comparing production function models for wildfire risk analyshysis in the wildlandndashurban interface Forest Policy and Economics 7782ndash795
Miller J D and H Safford 2012 Trends in wildfire severity 1984 to 2010 in the Sierra Nevada Modoc Plateau and southern Cascades California USA Fire Ecology 841ndash57
Miller J H Safford M Crimmins and A Thode 2009 Quantitative evidence for increasing forest fire severity in the Sierra Nevada and southern Cascade mountains California and Nevada USA Ecosystems 1216ndash32
North M 2012 Managing Sierra Nevada forests PSWshyGTR-237 USDA Forest Service Pacific Southwest Research Station Albany California USA
North M P and M D Hurteau 2011 High-severity wildfire effects on carbon stocks and emissions in fuels treated and untreated forest Forest Ecology and Management 2611115ndash1120
North M M Hurteau and J Innes 2009a Fire supshypression and fuels treatment effects on mixed-conifer carbon stocks and emissions Ecological Applications 191385ndash1396
North M P A Stine K OrsquoHara W Zielinski and S Stephens 2009b An ecosystem management strategy for Sierran mixed-conifer forests General Technical Report PSW-GTR-220 USDA Forest Service Pacific Southwest Research Station Albany California USA
Parisien M-A S Snetsinger J A Greenberg C R Nelson T Schoennagel S Z Dobrowski and M A Moritz 2012 Spatial variability in wildfire probability across the western United States Intershynational Journal of Wildland Fire 21313ndash327
Penman J M Gytarsky T Hiraishi T Krug D Kruger R Pipatti L Buendia K Miwa T Ngara and K Tanabe 2003 Good practice guidance for land use land-use change and forestry Institute for Global Environmental Strategies for the Intergovshyernmental Panel on Climate Change Hayama Kanagawa Japan
Pollet J and P N Omi 2002 Effect of thinning and prescribed burning on crown fire severity in ponderosa pine forests International Journal of Wildland Fire 111ndash10
Prather J W R F Noss and T D Sisk 2008 Real versus perceived conflicts between restoration of ponderosa pine forests and conservation of the Mexican spotted owl Forest Policy and Economics 10140ndash150
Preisler H K D R Brillinger R E Burgan and J Benoit 2004 Probability based models for estimation of wildfire risk International Journal of Wildland Fire 13133ndash142
Rebain S E Reinhardt N Crookston S Beukema W Kurz and J Greenough 2009 The fire and fuels extension to the Forest Vegetation Simulator Addendum to RMRS-GTR-119 USDA Forest Service and ESSA Technologies Ltd Fort Collins Colorado USA
Reinhardt E D and N L Crookston 2003 The fire and fuels extension to the forest vegetation simulashytor Pages 209 RMRS-GTR-116 USDA Forest Sershyvice Rocky Mountain Research Station Ogden Utah USA
Reinhardt E and L Holsinger 2010 Effects of fuel treatments on carbon-disturbance relationshyships in forests of the northern Rocky Mountains Forest Ecology and Management 2591427ndash1435
wwwesajournalsorg 20 January 2017 Volume 8(1) Article e01648
CHIONO ET AL
Reinhardt E D R E Keane D E Calkin and J D Cohen 2008 Objectives and considerations for wildland fuel treatment in forested ecosystems of the interior western United States Forest Ecology and Management 2561997ndash2006
Ritchie M W C N Skinner and T A Hamilton 2007 Probability of tree survival after wildfire in an interior pine forest of northern California effects of thinning and prescribed fire Forest Ecolshyogy and Management 247200ndash208
Roloff G J S P Mealey and J D Bailey 2012 Comshyparative hazard assessment for protected species in a fire-prone landscape Forest Ecology and Manshyagement 2771ndash10
Rothermel R C 1972 A mathematical model for preshydicting fire spread in wildland fuels Research Paper INT-115 USDA Forest Service Intermounshytain Forest and Range Experiment Station Ogden Utah USA
Safford H D 2008 Fire severity in fuel treatments American River Complex fire Tahoe National Forest California Unpublished Report USDA Forest Service Pacific Southwest Region Vallejo California USA
Schmidt D A A H Taylor and C N Skinner 2008 The influence of fuels treatment and landscape arrangement on simulated fire behavior Southern Cascade range California Forest Ecology and Management 2553170ndash3184
Scott J H and R E Burgan 2005 Standard fire behavior fuel models a comprehensive set for use with Rothermelrsquos surface fire spread model General Technical Report RMRS-GTR-153 USDA Forest Service Rocky Mountain Research Station Fort Collins Colorado USA
Scott J H M P Thompson and J W Gilbertson-Day 2016 Examining alternative fuel management strategies and the relative contribution of National Forest System land to wildfire risk to adjacent homesndasha pilot assessment on the Sierra National Forest California USA Forest Ecology and Manshyagement 36229ndash37
Smith J E and L S Heath 2002 A model of forest floor carbon mass for United States forest types Research Paper NE-722 USDA Forest Service Northeastern Research Station Newtown Square Pennsylvania USA
Stephens S L 2005 Forest fire causes and extent on United States Forest Service lands International Journal of Wildland Fire 14213ndash222
Stephens S L B M Collins E Biber and P Z Fulme 2016a US federal fire and forest policy emphasizshying resilience in dry forests Ecosphere 7e01584
Stephens S L J D Miller B M Collins M P North J J Keane and S L Roberts 2016b Wildfire impacts on California Spotted Owl nesting habitat in the Sierra Nevada Ecosphere 7e01584
Stephens S L J J Moghaddas B R Hartsough E E Y Moghaddas and N E Clinton 2009 Fuel treatshyment effects on stand-level carbon pools treatshyment-related emissions and fire risk in a Sierra Nevada mixed-conifer forest Canadian Journal of Forest Research 391538ndash1547
Stephens S L et al 2012 Fuel treatment impacts on estimated wildfire carbon loss from forests in Monshytana Oregon California and Arizona Ecosphere 31ndash17
Tempel D et al 2015 Evaluating short- and longshyterm impacts of fuels treatments and simulated wildfire on an old-forest species Ecosphere 61ndash19
USDA Forest Service 2004 Sierra Nevada Forest Plan Amendment Final supplemental environmental impact statement Record of decision Publication R5-MB-046 USDA Forest Service Pacific Southshywest Region Vallejo California USA
Van Wagner C E 1977 Conditions for the start and spread of crown fire Canadian Journal of Forest Research 723ndash34
Verner J K S McKelvey B R Noon R Gutimerrez G I Gould Jr and T W Beck 1992 Assessment of the current status of the California spotted owl with recommendations for management Pages 3ndash27 in J Verner K S McKelvey B R Noon R Gutimerrez G I Gould Jr and T W Beck edishytors The California Spotted Owl a technical assessment of its current status PSW-GTR-133 USDA Forest Service Albany California USA
Westerling A B Bryant H Preisler T Holmes H Hidalgo T Das and S Shrestha 2011 Climate change and growth scenarios for California wildshyfire Climatic Change 109445ndash463
Westerling A L H G Hidalgo D R Cayan and T W Swetnam 2006 Warming and earlier Spring increase Western US Forest Wildfire Activity Science 313940ndash943
Wiedinmyer C and M D Hurteau 2010 Prescribed fire as a means of reducing forest carbon emissions in the Western United States Environmental Science amp Technology 441926ndash1932
SUPPORTING INFORMATION
Additional Supporting Information may be found online at httponlinelibrarywileycomdoi101002ecs2 1648full
wwwesajournalsorg 21 January 2017 Volume 8(1) Article e01648
CHIONO ET AL
INTRODUCTION
Forest managers in fire-prone ecosystems seek to balance a complex set of sometimes competing objectives that include providing wildlife habitat avoiding catastrophic disturbance and supportshying local economies In recent years maintaining and increasing the capacity of forests to store carshybon (C) has been added to these considerations due to concern over the effects of rising atmoshyspheric greenhouse gas concentrations on the earthrsquos climate In dry forests across much of the western United States meeting these objectives is complicated by the increasing area and severity of wildfires occurring in concert with climate change (McKenzie et al 2004 Stephens 2005 Westerling et al 2006 Miller et al 2009)
A high-visibility example of competing objecshytives in forest management is spotted owl (Strix occidentalis occidentalis) conservation in California The northern (S occidentalis caurina) and Mexican (S occidentalis lucida) spotted owl subspecies have been listed as Threatened under the Endangered Species Act Management directives for the Calishyfornia subspecies focus on conserving nesting and roosting habitat by identifying protected activity centers (PACs) sites that include 121 ha (300 ac) of the best-quality habitat near known nest sites (Verner et al 1992) Given the multi-storied dense canopy forest characteristics of nesting and roostshying sites the potential vulnerability of PACs to high-severity fire is a challenge to owl conservashytion (Collins et al 2010 Stephens et al 2016b) While low- to moderate-severity wildfire within nesting and roosting habitat may not negatively impact owls in the short term (Bond et al 2002) longer-term effects of high-severity wildfire can include significant habitat loss due to direct and indirect tree mortality (Gaines et al 1997 Jones et al 2016 Stephens et al 2016b) However due to uncertainty concerning the effects of fuels reducshytion activities management options for reducing wildfire hazard within PACs are restricted to light prescribed burning although some thinning is permitted in the wildlandndashurban interface (USDA Forest Service 2004)
There is concern that such constraints on manshyagement activities limit the effectiveness of land-scape-scale treatments intended to reduce the threat of uncharacteristically severe wildfire (Colshylins et al 2010 Tempel et al 2015) Fire modeling
studies have shown that treating a portion of the landscape can alter simulated fire behavior within and outside of treated areas and that strategically locating fuel treatments across the landscape has the potential to maximize treatment benefits while minimizing area treated (Finney et al 2007 Schmidt et al 2008) Restrictions on fuel treatshyment location and severity limit real-world applishycation of treatment optimization methods Even so there may be significant opportunity for active management outside of high-quality owl habitat on fire-prone landscapes (Ager et al 2007 Prather et al 2008 Gaines et al 2010) Given their demonstrated ability to alter wildshy
fire behavior and effects (Martinson and Omi 2002 Pollet and Omi 2002 Ritchie et al 2007 Fulme et al 2012) fuel treatments that address accumulated fuels and reduce stand density (eg prescribed burning forest thinning mastication) are comshymonly applied in dry western forests where wildshyfires were once frequent It is less certain how treatments influence C stocks and how to maxishymize C storage in frequent-fire systems In the absence of disturbance untreated forests may sequester the most C (Hurteau and North 2009 Stephens et al 2009 Hurteau et al 2011) Howshyever high-severity wildfires can rapidly convert C sinks to sources and burned forests may continue to be C sources for decades (Dore et al 2008 2012) Treatments can reduce wildfire emissions (Finkral and Evans 2008 Hurteau and North 2009 2010 North et al 2009a Reinhardt and Holsinger 2010 Wiedinmyer and Hurteau 2010 North and Hurshyteau 2011) and may retain more live tree C post fire (Hurteau and North 2009 North and Hurteau 2011 Stephens et al 2012) Yet fuel treatments are associated with significant C emissions releasing C to the atmosphere during harvest operations burning andor biomass transport and the C cost of treating forest fuels may exceed its C benefits (Campbell et al 2011 Campbell and Ager 2013) The circumstances under which treatments might lead to a net gain in C have not yet been resolved Recently as a result of concern over the C costs
of fossil fuel use and the threat of wildfire intershyest in harvesting historically low-value woody biomass has increased (Evans and Finkral 2009) Utilizing forest biomass for energy proshyduction can help to reduce the cost of fuel treatshyments support local economies offset fossil fuel use and reduce the C and smoke emissions
wwwesajournalsorg 2 January 2017 Volume 8(1) Article e01648
CHIONO ET AL
Fig 1 Study area in Tahoe and Eldorado counties northern Sierra Nevada California Land ownership and owl protected activity center (PAC) locations
associated with fuel treatments (Reinhardt et al 2008) Concerns remain over the sustainability of biomass removals funding and the availability of markets (Evans and Finkral 2009)
The focus of our research was to (1) evaluate whether withholding some land area from treatshyment influences potential wildfire hazard across the landscape and within California spotted owl habitat (2) estimate the short-term C conseshyquences of treatments and (3) quantify the bioshymass harvested in treatments We simulated fuels reduction treatments and wildfire in a northern Sierra Nevada study area that encompassed 61 spotted owl PACs In order to evaluate the C balshyance of the treatment scenarios we quantified the C contained in the forest biomass harvested in each treatment scenario the C emitted during prescribed fire and wildfires and the C remaining within onsite pools We confined our analysis to the immediate changes in C stocks and emissions but recognize that a full accounting of treatment effects would also include long-term C dynamics (eg Dore et al 2008 Malmsheimer et al 2011)
METHODS
Study area The study area was defined by a longshy
term demographic study site for the California
spotted owl (S occidentalis occidentalis) The 55398-ha area contains 61 owl PACs The study area is located ~20 km west of Lake Tahoe in the northern Sierra Nevada with elevation ranging from 300 to 2400 m The climate is Meditershyranean with warm dry summers and cool wet winters Vegetation at lower elevations in the study area is montane mixed-conifer forest The forest type is dominated by ponderosa pine (Pinus ponderosa Dougl) Douglas-fir (Pseudoshytsuga menziesii var menziesii (Mirb) sugar pine (Pinus lambertiana Dougl) incense-cedar (Caloceshydrus decurrens [Torr] Florin) white fir (Abies con-color (Gord and Glend)) Franco) and California black oak (Quercus kelloggii Newb) California red fir (Abies magnifica var magnifica Andr Murray) has a stronger presence above ~2000 m (Barbour and Minnich 2000) but the red fir forest type is present on only ~5 of our core study area One-third of the study area is privately held in
a generally checkerboard pattern of ownership (Fig 1) The remaining 37120 ha is managed by the Tahoe and Eldorado National Forests Young forests dominate private land in the study area due to historical and active logging while intershymediate and mature forests are relatively abunshydant on public land (Laymon 1988 Bias and Gutimerrez 1992)
wwwesajournalsorg 3 January 2017 Volume 8(1) Article e01648
CHIONO ET AL
Table 1 Description of Chatfield (2005) cover classes
Cover class Description
1 Hardwood forest (gt10 hardwood canopy closure and lt10 conifer canopy closure)
2 Clearcut or shrubsmall tree (lt153 cm dbh) 3 Pole (153ndash28 cm dbh) forest 4 Medium (28ndash61 cm dbh) conifermixed-conifer
forest with low to medium canopy closure (30ndash69)
5 Medium (28ndash61 cm dbh) conifermixed-conifer forest with high canopy closure (ge70)
6 Mature (ge61 cm dbh) conifermixed-conifer forest with low to medium canopy closure (30ndash69)
7 Mature (ge61 cm dbh) conifermixed-conifer forest with high canopy closure (ge70)
8 Water
Vegetation and fuels data The vegetation classification map developed in
Chatfield (2005) forms the basis of our study area Using aerial photographs combined with field accuracy assessment Chatfield (2005) digitized eight land cover classes consistent with the California Wildlife Habitat Relationships (CWHR Mayer and Laudenslayer 1988) system A descripshytion of the cover classes is provided in Table 1 From the resulting cover class map we delinshyeated polygons to represent stands of similar vegetation composition and structure (n = 4470) based on aerial photographs and topography (Fig 2)
Stands were populated with vegetation data collected in 2007 in 382 sampling plots located within 10 km of the study arearsquos northern boundshyary based on the assumption that the characterisshytics of the plots are representative of the study area These vegetation data included tree species heights diameters and crown ratios See Collins et al (2011) for a detailed description of data colshylection To populate stands in the core study area with plot data we first assigned a Chatfield cover class to each sampling plot based on species comshyposition canopy cover and tree diameter distrishybution We then used a Most Similar Neighbor procedure (Crookston et al 2002) to select five nearest neighbor plots for each stand using the Random Forest method with the R package yaimshypute (version 10-22 Crookston and Finley 2008) Variables used in identifying nearest neighbors were topographic relative moisture index eastshyness northness slope and elevation Stands were
populated with data only from plots belonging to the same cover class In order to increase variabilshyity in stand conditions three of the five plots inishytially selected to represent each stand were chosen randomly to contribute data to the stand Each plot contributed data to an average of 355 stands (range 1ndash437) The method in which surface fuels are represhy
sented for fire modeling has important implicashytions for findings related to expected fire behavior and effects Fuel models are representashytions of fuelbed properties such as the distribushytion of fuel between particle size classes heat content and dead fuel moisture of extinction for use in the Rothermel (1972) surface fire spread model As representations fuel models artifishycially constrain the variation in surface fuel conditions In order to represent a range of preshytreatment fuel conditions for fire modeling we overrode fuel model assignments made by the Fire and Fuels Extension to the Forest Vegetation Simulator (FVS-FFE Dixon 2002 Reinhardt and Crookston 2003) and selected two fuel models for each stand Fuel models representing the low end of the range were assigned following the selection logic of Collins et al (2011) high-end models were selected to amplify surface fire behavior relative to the low-end models (Appshyendix S1 Table S1 Collins et al 2013) This approach to assigning fuel models to stands has been demonstrated to result in modeled fire behavior that is more consistent with observed fire effects than default fuel model assignments (Collins et al 2013) An alternative approach could be to use the Landfire surface fuel model layer (eg Scott et al 2016) However we opted to tie fuel model assignments to the specific forest structural characteristics for each stand (Lydersen et al 2015) as represented by the imputed plots rather than the remotely sensed dominant vegeshytation characteristics captured by Landfire Study area data were processed in the western
Sierra variant of FVS to obtain the data layers required for fire behavior modeling Due to the potential for spurious fire modeling results near study area edges we obtained additional canopy fuel and surface fuel data layers from Landfire (wwwlandfiregov) for an area adjacent to the study area boundary defined by a 10-km minishymum bounding rectangle (Fig 2) The reason for using Landfire data for the buffer area was that
wwwesajournalsorg 4 January 2017 Volume 8(1) Article e01648
CHIONO ET AL
Fig 2 Land cover classes (Chatfield 2005) within the core study area stand polygons and 10-km minimum bounding rectangle for fire spread modeling See Table 1 for description of classes
we did not have a vegetation map with a similar classification scheme and level of detail outside of our core study area (Fig 2) We merged study area and Landfire data layers to build 90 9 90 m resolution landscape files for fire behavior modshyeling in Randig described below This allowed us to include wildfires originating outside of the study area in our analysis
Wildfire fuel treatments and carbon loss modeling
We used ArcFuels (Ager et al 2006) to streamshyline fuel treatment planning and analysis of effects ArcFuels is a library of ArcGIS macros that facilitates communication among the array of models and other programs commonly used in fuel treatment planning at the landscape scale (vegetation growth and yield simulators fire
behavior models ArcGIS and desktop software) Our process depicted in Fig 3 involved
1 fire behavior modeling in Randig (Finney 2006) to identify stands with high fire hazard
2 prioritizing stands for treatment using the Landscape Treatment Designer (LTD) (Ager et al 2012)
3 modeling fuel treatments in FVS-FFE 4 fire behavior modeling for the post-treatment
and untreated landscapes and 5 developing C loss functions from simulated
burning with FVS-FFE
Conditional burn probability and flame lengthmdash Wildfire growth simulations were performed in Randig a command-line version of FlamMap (Finney 2006) Randig uses the minimum travel
wwwesajournalsorg 5 January 2017 Volume 8(1) Article e01648
CHIONO ET AL
Fig 3 Work flow used in the present study to evaluate landscape fuel treatment effects on wildfire hazard and carbon pools and emissions
time algorithm (Finney 2002) to simulate fire growth during discrete burn periods under conshystant weather conditions Simulating many burn periods with Randig generates a burn probability surface for the study landscape Simulations were conducted at 90-m resolution for computashytional efficiency We simulated 80000 randomly located ignitions with a 5-h burn period for all scenarios including no treatment The burn pershyiod was selected to produce fire sizes that approximated area burned in spread events of historical large wildfires near the study area Large daily spread events in previous wildfires in the northern Sierra Nevada have burned gt2000 ha (Dailey et al 2008 Safford 2008) average fire sizes from our simulations ranged from 715 to 2133 ha (The exceptional growth observed in the 2014 King Fire is addressed in a subsequent subsection) The combination of ignishytion number and burn period was sufficient to ensure that 99 of pixels in burnable fuel types experienced fire at least once (average 64ndash1891 fires)
Randig outputs were used both in prioritizing stands for treatment and in evaluating the effects of treatment We performed one Randig run for each fuel model range (low and high) within each scenario (no treatment S1 S2 and S3) using landshyscape files representing the year immediately folshylowing treatment 2009 Simulations were also completed for the 2007 pre-treatment landscape for use in treatment prioritization for a total of 10 modeling runs
To evaluate the effect of treatments on fire risk and fire hazard we assessed changes in condishytional burn probability (CBP) and conditional flame length (CFL) between the treatment scenarshyios and the untreated landscape based on wildfire simulations It is important to note that the burn probabilities estimated in this study are not empirshyical estimates of the likelihood of wildfire occurshyrence (eg Preisler et al 2004 Brillinger et al 2006 Parisien et al 2012) Rather we use CBP the likelihood that a pixel will burn given a single ignition in the study area and assuming the simushylation conditions described From the simulation of many fires Randig calculates a pixel-level disshytribution of flame lengths (FL) in twenty 05-m classes between 05 and 10 m Conditional flame length the probability-weighted FL given that a fire occurs (Ager et al 2010) was calculated by combining burn probability estimates with FL disshytributions summarized at the stand level
( )20 BPiCFL frac14 Fi X
BPifrac141
where BP is CBP BPi is the probability of burning at the ith FL class and Fi is the midpoint FL of the ith FL class To estimate the effect of treatment on fire risk
and hazard we first computed average pixel-level BP and CFL for treated and untreated stands in each scenario Then we calculated average BP and CFL for the same stands within the no-treatment landscape The effect of each treatment scenario
wwwesajournalsorg 6 January 2017 Volume 8(1) Article e01648
CHIONO ET AL
was estimated as the proportional change in each fire metric between the untreated and treated landscapes
We obtained weather and fuel moisture inputs for wildfire modeling from the Bald Mountain and Hell Hole remote automated weather stations (RAWS) based on recommendations from local USDA Forest Service fire and fuel managers We used 95th percentile weather conditions from the 1 June to 30 September period (1989ndash2013) This period represents the typical fire season for the study area encompassing 85 of wildfires and 93 of the area burned within a 161-km (100-mi) radius of the study area between 1984 and 2012 (Monitoring Trends in Burn Severity database Eidenshink et al 2007)
Weather and fuel moisture inputs for wildfire simulations are provided in Appendix S1 Table S2 These conditions are similar to those occurring during recent large wildfires in and near the study area (eg 2001 Star Fire 2008 American River Complex 2013 American Fire) In addition to using Randig to model fire spread and intensity we used FVS-FFE to project effects of prescribed fires and wildfires (described below) Wind inputs varied somewhat between fire models FVS-FFE requires only a single wind speed while multiple wind scenarios were applied in Randig fire simulations Wind speeds azimuths and relative proportions for Randig simulations followed Collins et al (2011)
Spatial optimization of fuel treatmentsmdashStands were selected for treatment based on modeled pre-treatment wildfire hazard and stand structure using the LTD which allows multiple objectives to be combined in the spatial prioritization of fuel treatments Three treatment scenarios varied in the land designations eligible for treatment
Scenario 1 Public land excluding spotted owl habitat Scenario 2 Public land including spotted owl habitat Scenario 3 All lands public and private ownerships
Objectives were consistent across treatment sceshynarios but differed in the land area available for treatment For all LTD runs we directed the model to maximize a total score that comprised numeric stand structure and fire hazard rankings
(Appendix S1 Table S3) The stand structure rankshying (0 1 2) was based on cover class category Cover classes most conducive to thinning were ranked highest Fire hazard ranking (0 2 3) was assigned according to stand-level CFL as calcushylated from FL probability files generated in Randig simulations for the 2007 pre-treatment landscape To isolate the effect of varying land designashy
tions in the area available for treatment total area treated was held constant between scenarios (20 of the core study area) In order to exclude small spatially isolated treatment areas that would be impractical from a management standshypoint we required a minimum treatment area of 121 ha (30 ac) To achieve this the treatment prishyoritization process was iterative In each step we eliminated all stands selected by LTD for treatshyment that were not contiguous with a ge121-ha treatment area The rationale for this is based on the cost associated with re-locating equipment necessary to implement mechanical andor fire treatments (D Errington personal communication El Dorado National Forest) We then calculated the treatment area remaining This process was repeated until total treatment area summed to the target area (~11080 ha) We simulated fuel treatments using FVS-FFE
Stands selected for treatment were assigned one of 13 treatment prescriptions depending on topogshyraphy vegetation cover class ownership and overlap with owl PACs (Appendix S1 Table S4) In an effort to promote landscape-scale heteroshygeneity basal area targets for commercial thinning on public land varied with topography (aspect and slope position canyondrainage bottom mid-slope and ridge) (North et al 2009b North 2012) All thinning treatments were simulated as thinshyfrom-below harvests and thinning within owl PACs was limited to hand thinning We assumed that trees ge254 cm (10 in) dbh would be harshyvested for wood products (FVS VOLUME keyshyword) and that the biomass contained in smaller trees and in the tops and branches of larger trees would be utilized as feedstocks for bioenergy conshyversion Therefore all thinning (except hand thinshyning) treatments were simulated as whole tree harvests (FVS keyword YARDLOSS) Treatments preferentially retained fire-resistant species with relative retention preference as follows black oakgtponderosa pinegtsugar pinegtDouglas-firgtinshycense-cedargtred firegtwhite fir
wwwesajournalsorg 7 January 2017 Volume 8(1) Article e01648
CHIONO ET AL
Prescribed fires were simulated in the year folshylowing thinning (2009) Broadcast burning was applied except within owl PACs on private land and on steep slopes (gt35) where follow-up burning was limited to pile burning To capture a more realistic range of post-treatment surface fuel conditions stands selected for treatment were randomly assigned to one of three post-treatment fuel models for each fuel model range TL1 (181) TL3 (183) or TL5 (185) (low range) TL3 (183) TL5 (185) or SB1 (201) (high range) (Scott and Burgan 2005) Weather conditions for prescribed fire modeling were based on recomshymendations from a local fire management speshycialist (B Ebert personal communication)
Biomass and carbon effects of treatmentmdashSimushylated treatment prescriptions varied according to site characteristics such as topography and land ownership (Appendix S1 Table S4) We tracked the C emitted from burning removed during harshyvesting and contained in live and dead aboveshyground biomass with FVS-FFE carbon reports (Reinhardt and Crookston 2003 Hoover and Rebain 2008) FVS converts biomass to units of C using a multiplier of 05 for all live and dead C pools (Penman et al 2003) except duff and litter pools for which a multiplier of 037 is applied (Smith and Heath 2002) Stand C is partitioned into a number of pools including aboveground live tree standing dead tree herb and shrub litter and duff woody surface fuel and belowground live and dead tree root C we limited our analysis to aboveground pools of C FVS-FFE also reports the C emitted during burning and that conshytained in harvested biomass (Rebain et al 2009) Treatment effects were assessed by comparing expected aboveground biomass C and emissions between the treated and untreated landscapes
We developed C loss functions for each FVS treelist by simulating burning with FVS-FFE at a range of FLs (SIMFIRE and FLAMEADJ keyshywords) (Ager et al 2010 Cathcart et al 2010) The FL values supplied to FLAMEADJ were the 20 midpoints of the 05-m FL classes (05ndash10 m) found in Randig FL probability output files As noted by Ager et al (2010) and Cathcart et al (2010) it is not currently possible to precisely match fire behaviors between Randig and FVS The FLs reported in Randig outputs are the total of surface fire and if initiated crown fire In
contrast the FLs supplied to FVS-FFE via the FLAMEADJ keyword are treated as surface fire FLs and when FLAMEADJ is parameterized with only a predefined FL the model does not use the input FL in crown fire simulations To estimate fire effects in FVS-FFE we parameterized FLAshyMEADJ with percent crowning (PC) and scorch height in addition to FL Scorch height and critical FL for crown fire initiation (FLCRIT) were based on Van Wagner (1977) We estimated PC using a downward concave function where PC = 32 when flame length = FLCRIT and PC = 100 when FL is ge30 of stand top height (the average height of the 40 largest trees by diameter) (Ager et al 2010 A Ager personal communication) The derived C loss functions were combined
with the probabilistic estimates of surface fire behavior produced in Randig simulations to estishymate the ldquoexpected Crdquo emitted in wildfire or conshytained in biomass We estimated expected C emissions and post-fire biomass C for each pixel as follows
20 X[ ]Efrac12 ]C i frac14 BPij X Cij
ifrac140
where E[C]j is the expected wildfire emissions of C from pixel j or biomass C in pixel j in mass per unit area BPij is the probability of burning at the ith FL class for pixel j and Cij is the C emitshyted from pixel j or the biomass C remaining in pixel j post-wildfire given burning at the ith FL class Expected C emissions and biomass C were
summed across all pixels in the core study area to obtain total expected wildfire emissions and expected terrestrial C for each treatment scenario In order to compare our modeling results to
other analyses that reported wildfire emissions on a per area basis we used a different method to estishymate C emissions per area burned Because wildshyfires burned both the core and buffer areas of our study landscape while emissions were estimated only in the core area we used conditional expected wildfire emissions to approximate the emissions from a wildfire burning entirely within the core study area Conditional expected emissions are those produced for an area given that the area is burned Conditional emissions were estimated for each pixel as follows
wwwesajournalsorg 8 January 2017 Volume 8(1) Article e01648
CHIONO ET AL
Table 2 Total area and proportion of area treated by category in each treatment scenario
SC1 SC2 SC3
Proportion of Proportion of Proportion of Treatment category Area (ha) area treated Area (ha) area treated Area (ha) area treated
Treated 11081 100 11082 100 11081 100 Avail for treatmentdagger 22042 199 28998 262 45647 412 Owl habitat treated 00 000 2769 025 1127 010 Private land treated 00 000 00 000 5685 051 Hand thin 1499 014 3819 034 1612 015 Biomass thin 8404 076 7240 065 9470 085 Commercial thin 7765 070 6916 062 9470 085 Broadcast burn 9410 085 7247 065 3785 034 Pile burn 1671 015 3835 035 7296 066
dagger Total land area potentially available for treatment in each scenario The area available for treatment increased from Scenarshyios 1 to 3 as restrictions on the area available for treatment were relaxed
20 X C WCfrac12 ]j frac14
BPij X WCijBPjifrac141
where C[WC]j is the C emitted by wildfire from pixel j in mass per unit area BPj is the probability that pixel j is burned BPij is the probability of burning at the ith FL class and WCij is the C emitted from pixel j when burned at the ith FL class
Conditional expected emissions were averaged across all pixels to obtain an estimate of wildfire emissions per area burned
Large fire revisionmdashWildfire modeling was calishybrated to produce fire sizes that approximated area burned in spread events of historical large wildfires near the study area However during the course of the study a very large fire encounshytered our study area The King Fire began on 13 September 2014 in El Dorado County and burned 39545 hamdashmore than an order of magnishytude greater than our modeled wildfires includshying gt25 of the study area Given the potential for very large wildfires in this region demonshystrated by the King Fire we completed addishytional wildfire modeling to estimate the C effects of treatment given the occurrence of a very large fire
Randig modeling was repeated for the no-treatment and S3 scenarios using the high fuel model range and a revised burn period number of simulated ignitions wind speed and wind directions Burn period was increased from 5 to 12 h number of ignitions was reduced by half to 40000 Wind directions and relative probabilities (Appendix S1 Table S5) were those recorded at
Hell Hole RAWS between 0400 and 1900 hours on 17 September the day of the King Firersquos larshygest spread event We used the probable 1-min maximum wind speed as calculated from the maximum gust recorded on that day 33 kmh (205 mph) based on maximum gust of 547 kmh (34 mph) (Crosby and Chandler 1966) These settings produced average fire sizes of NT = 10757 ha (no-treatment scenario) and 8070 ha (S3) Average fire size was limited by the size of our buffered study area Longer burn periods resulted in an increasing number of simulated wildfires that burned to the study area boundary
RESULTS
Treatment simulation Table 2 provides a summary of the area treashy
ted in each scenario Scenario 1 (S1) was the most restrictive with respect to the land area available for treatment which more than doushybled between S1 and S3 Because treatment preshyscriptions varied with land designation (public owl PAC private) and the designations availshyable for treatment varied between scenarios the relative proportions of thinning and burning methods also varied between scenarios Comshymercial and biomass thinning were applied most frequently in S3 which permitted treatshyment of private land Spotted owl activity censhyters composed 25 of the area treated in S2 vs 10 in S3 and 0 in S1 the scenario in which PACs were not subject to treatment As a result the area treated with hand thinning in S2 was more than twice that in S1 and S3 Due to the
wwwesajournalsorg 9 January 2017 Volume 8(1) Article e01648
CHIONO ET AL
Fig 4 Low fuel model range treatment locations and difference in conditional burn probability (CBP) and conshyditional flame length (CFL) (untreated-treated) for each treatment scenario Negative values indicate an increase in CBP or CFL while positive values represent a reduction CBP is the likelihood that a pixel will burn given a single ignition on the landscape and assuming the simulation conditions described in Appendix S1 Table S1 and in the text Conditional flame length is the probability-weighted flame length given these same assumptions
inclusion of PACs in S2 and both PACs and prishyvate land in S3 the proportion of area treated with pile burning increased between S1 and S3 while broadcast burn area exhibited an opposite trend Despite the variation in land designations available for treatment the pattern of treatshyment placement was generally similar between scenarios with treatments concentrated in the central and eastern portions of the study area (Figs 4 5)
Landscape-scale burn probability and fire hazard Conditional burn probabilitymdashThe pixel-to-pixel
change in CBP between the untreated scenario and each treatment scenario is mapped in Figs 4 (LO FM) and 5 (HI FM) Treatment reduced landshyscape burn probability by approximately 50 (Table 3) from 00124 (NT) to 00062 (S1) 00059 (S2) and 00055 (S3) Within treatment units avershyage CBP fell by 69ndash76 to 00033ndash00035 outside of treated stands CBP fell to 00060ndash00069 Some
wwwesajournalsorg 10 January 2017 Volume 8(1) Article e01648
CHIONO ET AL
Fig 5 Treatment locations and high fuel model range difference in conditional burn probability and condishytional flame length (untreated-treated) for each treatment scenario
increases in CBP were also observed particularly for the low fuel model range (Fig 4)
The influence of treatment on owl PAC likelishyhood of burning was similar to that observed for stands in general For treated PACs average CBP fell by ~70 relative to no treatment for the same stands Although PACs were not eligible for treatment in S1 all treatment scenarios had a large impact on estimated PAC CBP Average PAC CBP was reduced from 0013 to 00063 in S1 00049 in S2 and 00054 in S3 a 49ndash64 decrease relative to PACs in the no-treatment landscape (Table 3)
Fire hazardmdashTreatments reduced average landshyscape CFL by ~1 m from 36 m (NT) to 25ndash27 m Pixel-level CFL was reduced by a maximum of 80 m (LO FM) and 90 m (HI FM) Increases in CFL were also observed however particularly near the study arearsquos western and southwestern boundaries where treatments were least concentrated (Figs 4 5) Maximum pixel-level CFL increases were 25 m (LO FM) and 31 m (HI FM) Because fire hazard was used in prioritizing
stands for treatment the estimated pre-treatment CFL in stands selected for treatment (43ndash51 m)
wwwesajournalsorg 11 January 2017 Volume 8(1) Article e01648
CHIONO ET AL
Table 3 Proportional change in burn probability for treatment scenarios compared to the NT scenario
LO FM HI FM AVG
Stand type
S1 S2 S3 Proportional change
relative to NT
S1 S2 S3 Proportional change
relative to NT
S1 S2 S3 Proportional change
relative to NT
All PACs -045 -064 -056 -053 -063 -059 -049 -064 -057 Treated PACs NA -081 -076 NA -057 -067 NA -069 -072 Untreated PACs -045 -053 -051 -053 -054 -058 -049 -053 -054 All stands Treated stands
-044 -076
-048 -079
-053 -063
-050 -072
-053 -074
-056 -074
-047 -074
-050 -076
-054 -069
Untreated stands -035 -039 -049 -045 -047 -051 -040 -043 -050
Notes NT no treatment PACs protected activity centers Proportions are ratios of treatment values to no-treatment values as calculated for the same stands Treatment and no-treatment values were calculated as the average pixel value for the low and high fuel model range (LO FM and HI FM) within each stand category and treatment scenario
was greater than in stands not selected (32ndash 33 m) After treatment average CFL within treashyted stands fell to 13 (S1 and S2) and 17 m (S3) CFL in untreated stands was also reduced as a result of the influence of treatments on fire spread and intensity CFL fell by 05ndash08 m (9ndash 16) relative to CFL in the same stands within the no-treatment landscape (Table 4)
Although spotted owl PACs were not treated in S1 relative to PACs in the NT landscape PAC CFL was reduced by 10 (to 32 m) in S1 Treating PACs had a much larger impact on potential fire intensity however Average treashyted PAC CFL fell to 13 and 14 m in S2 and S3 respectively
Carbon consequences of landscape fuel treatments
Prior to treatment aboveground landscape carbon totaled 14705 tonnesha on average Treatments removed 14 of pre-treatment C from treated stands or 2374 tonnesha totaling
81772ndash119103 tonnes of C in harvested biomass and merchantable material (Tables 5 and 6) Both the treatment scenarios and the choice of
fuel models were important influences on estishymated C emissions from burning As the least restrictive treatment scenario in terms of treatshyment location and the only scenario to include treatment of private land where broadcast burnshying was precluded as a treatment option the S3 treatment scenario was associated with the lowshyest wildfire and prescribed burning emissions (Tables 5 and 6) For each treatment scenario expected wildfire emissions increased by more than an order of magnitude between the low and high fuel model ranges This difference was the result of increasing fire intensity as well as wildshyfire size Average wildfire size nearly doubled between fuel model ranges in the treatment sceshynarios and tripled in the no-treatment scenario (Fig 6) For a given treatment scenario wildfire emissions on a per hectare basis were approxishymately two tonnes greater for the high fuel
Table 4 Proportional change in conditional flame length for treatment scenarios compared to the NT scenario
LO FM HI FM AVG
Stand type
S1 S2 S3 Proportional change
relative to NT
S1 S2 S3 Proportional change
relative to NT
S1 S2 S3 Proportional change
relative to NT
All PACs -009 -042 -028 -012 -043 -027 -010 -042 -028 Treated PACs NA -071 -075 NA -071 -073 NA -071 -074 Untreated PACs -009 -014 -011 -012 -017 -014 -010 -016 -013 All stands -022 -026 -031 -025 -026 -028 -024 -026 -030 Treated stands -065 -069 -052 -071 -071 -073 -068 -070 -062 Untreated stands -008 -009 -021 -011 -012 -012 -009 -010 -016
Notes NT no treatment PACs protected activity centers Proportions are ratios of treatment values to no-treatment values as calculated for the same stands Treatment and no-treatment values were calculated as the average pixel value for the low and high fuel model range (LO FM and HI FM) within each stand category and treatment scenario
wwwesajournalsorg 12 January 2017 Volume 8(1) Article e01648
CHIONO ET AL
Table 5 Expected biomass carbon expected wildfire C emissions and C harvested and emitted in fuel treatshyments for NT and treatment (S1 S2 S3) scenarios using the low fuel model range in fire modeling
Carbon pool NT S1 S2 S3
Untreated stands Tonnes C Live 5004505 3915044 3695489 3954131 Dead 1845659 1421704 1378824 1466202 Wildfire emissions 2372 1137 1039 904
Treated stands Live 881358 1072625 826366 Dead 260089 299244 220932 All harvested biomass 88773 81772 119103 Prescribed fire emissions 178530 169693 122599 Wildfire emissions 48 56 61
All stands Live 5004505 4796402 4768113 4780497 Dead 1845659 1681793 1678068 1687135 Treatment (harvested and emitted) 267303 251465 241702 Wildfire emissions 2372 1186 1095 965
Grand totals 6852536 6746684 6698741 6710299
Notes LF indicates the large fire scenarios Expected C is that remaining in the core study area following treatment if applishycable and a random ignition and wildfire in the larger buffered study area as estimated from the simulation of many wildfires Live C is that contained in live aboveground herb shrub and tree biomass dead C is the C contained in litter duff woody surshyface fuel and aboveground portions of tree snags NT no treatment
model range than for the low range In contrast to the large influence of fuel model choice on wildfire emissions the effect of fuel model range on prescribed fire emissions was minimal with only a 1 increase in emissions between the low and high fuel model ranges for a given treatment scenario
Although treatment significantly reduced wildshyfire emissions combined emissions from preshyscribed burning on 20 of the landscape and wildfire exceeded wildfire emissions in the no-treatment scenarios (Tables 5 and 6) Relative to the no-treatment scenarios treatment reduced estimated wildfire emissions by approximately 54 (low fuel model range) 59 (high fuel model range) and 45 (large fire scenarios) Yet preshyscribed burning was a far more significant source of emissions than were wildfires of moderate size with emissions from treatment exceeding wildfire emissions by 111259ndash177344 tonnes Even for the large wildfire simulations where landscape treatments nearly halved estimated wildfire emisshysions the combined carbon emissions from preshyscribed burning and wildfire in the treatment scenario surpassed wildfire emissions in the no-treatment scenario by 45 (Table 6 Fig 7)
The total quantity of aboveground C expected to remain on the landscape following treatment
and a randomly ignited wildfire was greatest for the no-treatment scenarios (Tables 5 and 6) For modeled wildfires of moderate size treatment reduced both the live and dead C pools relative to the no-treatment scenarios and terrestrial C in the no-treatment scenarios was 4ndash5 greater (323316 ndash434960 tonnes) than in any of the treatment scenarios (Tables 5 and 6) In comparison under large wildfire conditions the treatment scenario retained slightly more live biomass C~15000 tonshynes or 03 more than the no-treatment scenario However treatment also reduced necromass C by 288000 tonnes (12) resulting in a 3 overall decrease in onsite biomass C relative to an untreshyated landscape (Table 6) The proportional changes in aboveground
biomass C pools between the treatment and no-treatment scenarios are summarized in Table 7 For all treatment scenarios the consumption of duff litter and downed woody fuels with preshyscribed burning contributed to a net reduction in these C pools relative to the untreated landscape Conversely treatments protected more C in the live understory (herb and shrub) poolmdashthe result of reduced wildfire size and intensity in the treatshyment scenarios Treatments in the moderate wildshyfire scenarios reduced live tree biomass C in comparison with no-treatment levels (Fig 8)
wwwesajournalsorg 13 January 2017 Volume 8(1) Article e01648
CHIONO ET AL
Table 6 Expected biomass carbon expected wildfire C emissions and C harvested and emitted in fuel treatshyments for NT and treatment (S1 S2 S3) scenarios using the high fuel model range in fire modeling
Carbon pool NT S1 S2 S3 NT-LF S3-LF
Untreated stands Tonnes C Live 4910239 3879854 3664690 3923358 4586898 3750774 Dead 1912429 1448947 1403313 1489629 2130034 1605591 Wildfire emissions 31831 12934 12001 11293 137622 68061
Treated stands Live 896670 1115918 853503 847374 Dead 280182 325628 238130 247744 All harvested biomass 88773 81772 119103 119103 Prescribed fire emissions 180357 171247 123539 123539 Wildfire emissions 798 951 986 8285
All stands Live 4910239 4776524 4780607 4776861 4586898 4598148 Dead 1912429 1729129 1728941 1727759 2130034 1853334 Treatment (harvested and emitted) 282862 265971 254921 254921 Wildfire emissions 31831 13732 12952 12279 137622 76346
Grand totals 6854499 6802247 6788471 6771820 6854554 6782749
Notes LF indicates the large fire scenarios Expected terrestrial C is that remaining in the core study area following treatshyment if applicable and a random ignition and wildfire in the larger buffered study area as estimated from the simulation of many wildfires Live C is that contained in live aboveground herb shrub and tree biomass dead C is the C contained in litter duff woody surface fuel and aboveground portions of tree snags NT no treatment
Notably in the large modeled wildfire scenarios (NT-LF and S3-LF) treatments resulted in a 400000-tonne increase in landscape-level live tree C over the no-treatment scenario
DISCUSSION
Fuel treatments in protected habitat Because there are often competing objectives
between managing forests for resilience to fire and drought and protecting owl habitat we assessed potential fire occurrence and hazard based on treatment scenarios that included and omitted treatment of PACs Conducting fuels management outside of occupied owl habitat has been suggested as a means of reducing fire risk within occupied sites (Jenness et al 2004 Tempel et al 2015) Ager et al (2007) reported that fuel treatments on 20 of a western Oregon landscape reduced the probability of northern spotted owl nesting and roosting habitat loss by 44 even though that habitat type was not treated As in Ager et al (2007) we observed modifications in fire intensity and burn probability within owl habitat even when it was left untreated In the S1 treatment scenario in which owl activity centers were not eligible for treatment the effect of treatshying other stands reduced both fire hazard (by
9ndash12 for CFL or approximately 04 m) and CBP (by ~45) within PACs It is difficult to assess the significance of this proportional reduction in CBP given that the absolute differences in probabilities were relatively modest (Figs 3 4) Ager et al (2007) noted that allowing treatment of owl habishytat would have significantly reduced estimated habitat loss in their study In this study it is expected that habitat quality may be reduced within treated PACs in the short term through the removal of small-diameter trees (ie lower vertical structural heterogeneity) However two structural attributes for suitable spotted owl nestshying habitat identified by Tempel et al (2015) high canopy cover and large tree density would not be altered While we did not directly estimate habitat loss we did observe much larger reductions in fire hazard within PACs that were treated as meashysured by CFL (71ndash75 reduction equivalent to 2ndash3 m) It should be noted that the effect of wideshyspread treatments within PACs on spotted owl nesting and foraging behavior is unknown One concern with designating some land area
unavailable for treatment is that it may limit the potential for treatments to alter fire behavior across the landscape (eg Finney 2001) Including all stands in the potential treatment pool allows the highest-priority stands with respect to simulated
wwwesajournalsorg 14 January 2017 Volume 8(1) Article e01648
CHIONO ET AL
effects on landscape-level fire behavior The true effect of increasing the land area available for treatshyment may be partially obscured by the varying frequency of treatment prescriptions between sceshynarios For example the hand thinning treatments applied within PACs would be expected to have a milder effect on potential wildfire behavior than more severe prescriptions and hand thinning was twice as common in S2 as in the other scenarios
Terrestrial carbon and burning emissions Landscape treatments reduced wildfire emisshy
sions by reducing the emissions produced per area burned by wildfire as well as average wildfire size On average wildfires in the treated landscapes released 193ndash216 tonnes Cha while wildfires in the untreated landscapes released 234ndash254 tonnes Cha Modeled wildfires decreased in size by 7 (low fuel model range) 36 (high fuel model range) and 25 (large fire scenario) relative to untreated landscapes (Fig 6) Since the burn pershyiod for simulated wildfires was held constant between scenarios this reduction in average wildshyfire size is the result of reduced spread rates derived from fuel treatments Despite the influence of treatments on wildfire
intensity size and expected emissions treatment-related emissions exceeded the avoided wildfire emissions conferred by treatment Prescribed burning in our study a combination of broadcast
Fig 6 Wildfire size relative frequency distributions from wildfire simulations Bar color represents no-treatment (NT) and treatment scenarios (S1ndashS3)
fire spread to be treated which would be expected to achieve the greatest modification of landscape fire behavior and effects In the present study although the land area potentially available for treatment more than doubled between S1 and S3 landscape-level effects of treatment on modeled fire risk and hazard were fairly similar (compared with the no-treatment landscape all-stand CBP fell by 47 and 54 in S1 and S3 while CFL fell by 24 and 30) Dow et al (2016) also found that incorporating modest restrictions on treatment Fig 7 Carbon emissions (tonnes) from wildfire and
area availability (24 of the landscape unavail- prescribed burning X-axis labels indicate no-treatment able) had minimal consequences for modeled fire (NT) and treatment scenarios (S1ndashS3) subscripts size and hazard The modest changes in estimated denote fuel model ranges used in fire modeling
fire metrics we observed may also be due to simi- (L low H high) Large fire scenarios which were
larity in the general pattern of treatment placement modeled with the high fuel model range only are indishybetween scenarios which probably led to similar cated by LF
wwwesajournalsorg 15 January 2017 Volume 8(1) Article e01648
CHIONO ET AL
Table 7 Proportional change in expected carbon by biomass pool for treatment scenarios compared to the no-treatment landscape
Treatment Standing Down dead Forest Herb Live scenario dead wood floor shrub tree
S1 004 -017 -013 014 -004 S2 001 -016 -012 014 -004 S3 -001 -015 -010 016 -004 S3-LF -016 -013 -008 017 000
Notes For example a value of -010 represents a 10 decshyline in biomass C from the no-treatment scenario Treatment and no-treatment values were calculated as the average of low and high fuel model range values except in the case of the large fire (LF) scenarios which were modeled for the high fuel model range only Expected C is that remaining after a random ignition and wildfire in the buffered study area as estimated from simulating 80000 ignitions (LF 40000 ignitions)
C pool categories are those reported in Forest Vegetation Simulator Carbon Reports Standing dead aboveground porshytion of standing dead trees Down dead wood woody surface fuels Forest floor litter and duff Herbshrub herbs and shrubs Live tree aboveground portion of live trees
and pile burning released 111ndash163 tonnes Cha For comparison studies conducted in comparable forest types have estimated prescribed fire emisshysions of 127 tonnes Cha (warm dry ponderosa pine habitat types Reinhardt and Holsinger 2010)
Fig 8 Expected carbon contained in aboveground live and dead tree biomass Expected C is that remainshying in the core study area following treatment (if applishycable) and a single random ignition within the larger buffered study area X-axis labels indicate no-treatment (NT) and treatment scenarios (S1ndashS3) subshyscripts denote fuel model ranges used in fire modeling (L low H high) Large fire scenarios which were modeled for the high fuel model range only are indishycated by LF
and 148 tonnes Cha (an old-growth mixed-conifer reserve in the southern Sierra Nevada North et al 2009a) Relative to the approximately 158000 tonnes C emitted in prescribed burning avoided wildfire emissions at 1186ndash19551 tonnes for wildfires of moderate size were small A simishylar study in southern Oregon with average modshyeled wildfires of 2350 and 3500 ha (treatment and no-treatment scenarios respectively) found that treatments reduced expected wildfire emissions by 6157 tonnes of C (Ager et al 2010) Surface fuels represented with surface fuel
models in commonly used modeling software are the most influential inputs determining preshydicted fire behavior (Hall and Burke 2006) Fire behavior fire sizes and emissions in this study varied according to fuel model assignment highshylighting the importance of selecting the approprishyate fuel model to represent fuel conditions (see Collins et al 2013) We show a 12- to 14-fold change in wildfire emissions due solely to the choice of fuel models (Tables 5 and 6) Indeed the range of fuel models used in recent studies investigating fuel treatments and simulated fire behavior in mixed-conifer forests is noteworthy Incorporating a range of fuel models into analyshyses such that outcome variability can be reported facilitates comparison of effects across studies Our estimates of the aboveground C benefits
of treatment under the moderate wildfire scenarshyios with average fire sizes of le2133 ha are likely conservative The effect of modeled wildfire size on the C consequences of fuel treatment was conshysiderable emphasizing the importance of this variable in studies of the climate benefits of treatshyment Avoided wildfire emissions resulting from treatment increased to 61276 tonnes C when large wildfires (8070ndash10757 ha) were simulated The treatment scenario given large wildfires also protected a greater portion of live tree C If the ~40000-ha King Fire is representative of the magnitude of future wildfires in the region C accounting should improve with respect to treatshyment favorability Similarly if multiple wildfires were to encounter the study area within the effective lifespan of treatments the C gains assoshyciated with avoided emissions in the treatment scenarios would increase Our approach to estimating the C conseshy
quences of fuel treatments has a number of limitashytions A full accounting of treatment effects
wwwesajournalsorg 16 January 2017 Volume 8(1) Article e01648
CHIONO ET AL
would project through time the consequences of both treatment and wildfire Our analysis is static incorporating only the short-term C costs and benefits of treatment Simulating wildfire in the year immediately following treatment maximizes the apparent benefits of treatment Over time as surface fuels accumulate and vegetation regenershyates maintenance would be required to retain the effectiveness of treatments (Martinson and Omi 2013) increasing the C costs of reduced fire hazard In addition the C contained in fire-killed biomass will ultimately be emitted to the atmoshysphere although biomass decay could be delayed through conversion to long-lived wood products such as building materials (Malmsheimer et al 2011) It is also important to note that our analysis did not include stochastic wildfire occurrence Estimates of burn probability in the present study are not estimates of the likelihood of wildfire occurrence based on historical fire sizes and freshyquency (eg Preisler et al 2004 Mercer and Prestemon 2005 Brillinger et al 2006) but rather are conditional on a single randomly ignited wildfire within the buffered study area
CONCLUSIONS
Our findings generally support those of Campshybell et al (2011) who concluded from an analysis of fire-prone western forests that the C costs of treatments are likely to outweigh their benefits under current depressed fire frequencies In a more recent paper Campbell and Ager (2013) conshycluded that ldquonone of the fuel treatment simulation scenarios resulted in increased system carbonrdquo primarily from the low incidences of treated areas being burned by wildfire However our interpreshytation of these findings differs from those disshycussed in Campbell et al (2011) and Campbell and Ager (2013) especially in light of recent and projected future trends in fire activity (Westerling et al 2011 Miller and Safford 2012 Dennison et al 2014) The current divergence of increasing surface air temperatures and low fire activity is unlikely to be sustained further suggesting greater future fire activity (Marlon et al 2012) If increased fire activity is realized then the likelishyhood of a given area being burned in a wildfire increases This differs from the simple increase in stand-level fire frequency modeled by Campbell et al (2011) because increases in fire likelihood are
not necessarily associated with corresponding decreases in fire severity as assumed by Campbell et al (2011) Increased fire likelihood could very well lead to positive feedbacks in fire severity and ultimately to vegetation type conversion (Copposhyletta et al 2016)mdasheffects that would have signifishycant implications for carbon storage Due to the significant emissions associated
with treatment and the low likelihood that wildshyfire will encounter a given treatment area forest management that is narrowly focused on C accounting alone would favor the no-treatment scenarios Landscape treatments protected more C in live tree biomass only when large wildfires were simulated While treatment favorability improved with large wildfire simulation the no-treatment scenario still produced fewer emissions than the treatment scenario Given the potential for large wildfire in the region as demonstrated by the 2014 King Fire and the increasing freshyquency of large wildfires and area burned in Calishyfornia expected from climate modeling studies (Lenihan et al 2008 Westerling et al 2011) we suggest that future studies of fuel treatmentndashwildshyfirendashC relationships should incorporate the potenshytial for large wildfires at a frequency greater than those observed over the last 20ndash30 yr Others have argued that treatments to increase forest resilience should be a stand-alone top land management priority independent of other ecosystem values such as carbon sequestration and fire hazard reduction (Stephens et al 2016a) We also note that the potential benefits of fuels
management are not restricted to avoided wildshyfire emissions Here we show that landscape fuel treatments can alter fire hazard across the landshyscape both within and outside of treated stands and have the potential to affect the likelihood of burning and fire intensity within protected Calishyfornia spotted owl habitat Underscoring the risk to sensitive habitat the 2014 King Fire encounshytered 31 PACs within our study area leading to the greatest single-year decline in habitat occushypancy recorded over a 23-yr study period (Jones et al 2016) Modest simulated treatments within activity centers significantly reduced potential fire intensity relative to both the no-treatment landscape and a treatment scenario that did not permit treatment within PACs indicating that active management may be desirable to protect habitat in the long term (Roloff et al 2012)
wwwesajournalsorg 17 January 2017 Volume 8(1) Article e01648
CHIONO ET AL
However treatments conducted outside of owl habitat also reduced wildfire hazard
ACKNOWLEDGMENTS
We are grateful to a number of individuals for sharshying their time and fuel treatment and fire modeling expertise Nicole Vaillant (ArcFuels) Alan Ager and Andrew McMahan (carbon estimation) and Coeli Hoover (harvest simulations in FVS-FFE) Brian Ebert and Dana Walsh of the Eldorado National Forest proshyvided invaluable advice on weather inputs for fire modeling and on designing fuel treatment prescripshytions Ken Somers Operations Forester on the Blodgett Forest Research Station gave advice concerning timshyber management on private land We also thank two anonymous reviewers whose comments greatly improved this article The California Energy Commisshysion provided funding for this project
LITERATURE CITED
Ager A A B Bahro and K Barber 2006 Automating the fireshed assessment process with ArcGIS Pages 163ndash167 in P L Andrews and B W Butler (Comps) Fuels ManagementndashHow to Measure Success Conference Proceedings Portland OR March 28ndash30 2006 Proceedings RMRS-P-41 USDA Forest Service Rocky Mountain Research Station Fort Collins Colorado USA
Ager A A M A Finney B K Kerns and H Maffei 2007 Modeling wildfire risk to northern spotted owl (Strix occidentalis caurina) habitat in Central Oregon USA Forest Ecology and Management 24645ndash56
Ager A A M A Finney A McMahan and J Cathcart 2010 Measuring the effect of fuel treatments on forshyest carbon using landscape risk analysis Natural Hazards and Earth System Science 102515ndash2526
Ager A A N M Vaillant D E Owens S Brittain and J Hamann 2012 Overview and example application of the Landscape Treatment Designer Pages 11 General Technical Report PNW-GTR-859 USDA Forest Service Pacific Northwest Research Station Portland Oregon USA
Barbour M G and R A Minnich 2000 Californian upland forests and woodlands Pages 131ndash164 in M Barbour and W Billings editors North Amerishycan terrestrial vegetation Cambridge University Press Cambridge UK
Bias M A and R Gutimerrez 1992 Habitat associations of California spotted owls in the central Sierra Nevada Journal of Wildlife Management 56584ndash595
Bond M L R Gutierrez A B Franklin W S LaHaye C A May and M E Seamans 2002
Short-term effects of wildfires on spotted owl surshyvival site fidelity mate fidelity and reproductive success Wildlife Society Bulletin 301022ndash1028
Brillinger D H Preisler and J Benoit 2006 Probashybilistic risk assessment for wildfires Environ-metrics 17623ndash633
Campbell J L and A A Ager 2013 Forest wildfire fuel reduction treatments and landscape carbon stocks a sensitivity analysis Journal of Environshymental Management 121124ndash132
Campbell J L M E Harmon and S R Mitchell 2011 Can fuel-reduction treatments really increase forest carbon storage in the western US by reducshying future fire emissions Frontiers in Ecology and the Environment 1083ndash90
Cathcart J A A Ager A McMahan M Finney and B Watt 2010 Carbon benefits from fuel treatshyments Pages 61ndash80 in T B Jain R T Graham and J Sandquist editors Integrated management of carbon sequestration and biomass utilization opportunities in a changing climate Proceedings of the 2009 National Silviculture Workshop Boise Idaho June 15ndash18 2009 USDA Forest Service Proshyceedings RMRS-P-61 Rocky Mountain Research Station Fort Collins Colorado USA
Chatfield A H 2005 Habitat selection by a California spotted owl population a landscape scale analysis using resource selection functions Thesis Univershysity of Minnesota St Paul Minnesota USA
Collins B M H A Kramer K Menning C Dilling-ham D Saah P A Stine and S L Stephens 2013 Modeling hazardous fire potential within a comshypleted fuel treatment network in the northern Sierra Nevada Forest Ecology and Management 310156ndash166
Collins B M S L Stephens J J Moghaddas and J Battles 2010 Challenges and approaches in planshyning fuel treatments across fire-excluded forested landscapes Journal of Forestry 10824ndash31
Collins B M S L Stephens G B Roller and J J Battles 2011 Simulating fire and forest dynamics for a landscape fuel treatment project in the Sierra Nevada Forest Science 5777ndash88
Coppoletta M K E Merriam and B M Collins 2016 Post-fire vegetation and fuel development influences fire severity patterns in reburns Ecologishycal Applications 26686ndash699
Crookston N L and A O Finley 2008 yaimpute an r package for knn imputation Journal of Statistical Software 231ndash16
Crookston N L M Moeur and D L Renner 2002 Userrsquos guide to the most similar neighbor imputashytion program version 2 General Technical Report RMRS-GTR-96 USDA Forest Service Rocky Mountain Research Station Ogden Utah USA
wwwesajournalsorg 18 January 2017 Volume 8(1) Article e01648
CHIONO ET AL
Crosby J and C Chandler 1966 Get the most from your windspeed observations Fire Control Notes 2712ndash13
Dailey S J Fites A Reiner and S Mori 2008 Fire behavior and effects in fuel treatments and proshytected habitat on the Moonlight fire Fire Behavior Assessment Team wwwfsfedusadaptivemana gementprojectsFBATdocsMoonlightFinal_8_6_08 pdf
Dennison P E S C Brewer J D Arnold and M A Moritz 2014 Large wildfire trends in the western United States 1984ndash2011 Geophysical Research Letters 412928ndash2933
Dixon G E 2002 Essential FVS a userrsquos guide to the forest vegetation simulator Pages 193 USDA Forest Service Forest Management Service Center Fort Collins Colorado USA
Dore S T E Kolb M Montes-Helu B W Sullivan W D Winslow S C Hart J P Kaye G W Koch and B A Hungate 2008 Long-term impact of a stand-replacing fire on ecosystem CO2 exchange of a ponderosa pine forest Global Change Biology 141ndash20
Dore S M Montes-Helu S C Hart B A Hungate G W Koch J B Moon A J Finkral and T E Kolb 2012 Recovery of ponderosa pine ecosystem carbon and water fluxes from thinning and stand-replacing fire Global Change Biology 183171ndash3185
Dow C J B M Collins and S L Stephens 2016 Incorporating resource protection constraints in an analysis of landscape fuel-treatment effectiveness in the Northern Sierra Nevada California USA Environmental Management 571ndash15
Eidenshink J B Schwind K Brewer Z Zhu B Quayle and S Howard 2007 A project for monshyitoring trends in burn severity Fire Ecology 33ndash21
Evans A M and A J Finkral 2009 From renewable energy to fire risk reduction a synthesis of biomass harvesting and utilization case studies in US forshyests GCB Bioenergy 1211ndash219
Finkral A J and A M Evans 2008 The effects of a thinning treatment on carbon stocks in a northern Arizona ponderosa pine forest Forest Ecology and Management 2552743ndash2750
Finney M A 2001 Design of regular landscape fuel treatment patterns for modifying fire growth and behavior Forest Science 47219ndash228
Finney M A 2002 Fire growth using minimum travel time methods Canadian Journal of Forest Research 321420ndash1424
Finney M A 2006 An overview of FlamMap fire modeling capabilities Pages 213ndash220 in P L Andrews and B W Butler editors Proceedings of Fuels ManagementndashHow to Measure Success Research Paper RMRS-P-41 USDA Forest Service
Rocky Mountain Research Station Portland Oregon USA
Finney M A R C Seli C W McHugh A A Ager B Bahro and J K Agee 2007 Simulation of longshyterm landscape-level fuel treatment effects on large wildfires International Journal of Wildland Fire 16712ndash727
Fulme P Z J E Crouse J P Roccaforte and E L Kalies 2012 Do thinning andor burning treatments in western USA ponderosa or Jeffrey pine-dominated forests help restore natural fire behavior Forest Ecology and Management 26968ndash81
Gaines W L R J Harrod J Dickinson A L Lyons and K Halupka 2010 Integration of Northern spotted owl habitat and fuels treatments in the eastern Cascades Washington USA Forest Ecolshyogy and Management 2602045ndash2052
Gaines W L R A Strand and S D Piper 1997 Effects of the hatchery complex fires on northern spotted owls in the eastern Washington Cascades Pages 123ndash129 in J N Greenlee editor Proceedings of the Fire Effects on Rare and Endangered Species and Habitats Conference Coeur DrsquoAlene Idaho International Association of Wildfire and Forestry Hot Springs South Dakota USA
Hall S A and I C Burke 2006 Considerations for characterizing fuels as inputs for fire behavior models Forest Ecology and Management 227 102ndash114
Hoover C and S Rebain 2008 The Kane Experimenshytal Forest carbon inventory carbon reporting with FVS Pages 13ndash15 in R N Havis and N L Crookston editors Third Forest Vegetation Simushylator Conference Fort Collins Colorado February 13ndash15 2007 USDA Forest Service Rocky Mountain Research Station Fort Collins Colorado USA
Hurteau M and M North 2009 Fuel treatment effects on tree-based forest carbon storage and emissions under modeled wildfire scenarios Fronshytiers in Ecology and the Environment 7409ndash414
Hurteau M D and M North 2010 Carbon recovery rates following different wildfire risk mitigation treatments Forest Ecology and Management 260 930ndash937
Hurteau M D M T Stoddard and P Z Fulme 2011 The carbon costs of mitigating high-severity wildshyfire in southwestern ponderosa pine Global Change Biology 171516ndash1521
Jenness J S P Beier and J L Ganey 2004 Associashytions between forest fire and Mexican spotted owls Forest Science 50765ndash772
Jones G M R Gutimerrez D J Tempel S A Whitmore W J Berigan and M Z Peery 2016 Megafires an emerging threat to old-forest species Frontiers in Ecology and the Environment 14300ndash306
wwwesajournalsorg 19 January 2017 Volume 8(1) Article e01648
CHIONO ET AL
Laymon S A 1988 Ecology of the spotted owl in the central Sierra Nevada California Dissertation University of California Berkeley California USA
Lenihan J M D Bachelet R P Neilson and R Drapek 2008 Response of vegetation distribution ecosystem productivity and fire to climate change scenarios for California Climatic Change 87215ndash230
Lydersen J M B M Collins E E Knapp G B Roller and S Stephens 2015 Relating fuel loads to overshystorey structure and composition in a fire-excluded Sierra Nevada mixed conifer forest International Journal of Wildland Fire 24484ndash494
Malmsheimer R J Bowyer J Fried E Gee R Islar R Miner I E Munn E Oneil and W C Stewart 2011 Managing forests because carbon matters integrating energy products and land manageshyment policy Journal of Forestry 109S7ndashS50
Marlon J R et al 2012 Long-term perspective on wildfires in the western USA Proceedings of the National Academy of Sciences of the United States of America 109E535ndashE543
Martinson E J and P N Omi 2002 Performance of fuel treatments subjected to wildfires Pages 7ndash13 in P N Omi and L A Joyce editors Conference on Fire Fuel Treatments and Ecological Restorashytion USDA Forest Service Rocky Mountain Research Station Fort Collins Colorado USA
Martinson E J and P N Omi 2013 Fuel treatments and fire severity a meta-analysis Pages 38 USDA Forest Service Rocky Mountain Research Station Fort Collins Colorado USA
Mayer K E and W F Laudenslayer 1988 A guide to wildlife habitats of California California Departshyment of Forestry and Fire Protection Sacramento California USA
McKenzie D Z Gedalof D L Peterson and P Mote 2004 Climatic change wildfire and conservation Conservation Biology 18890ndash902
Mercer D E and J P Prestemon 2005 Comparing production function models for wildfire risk analyshysis in the wildlandndashurban interface Forest Policy and Economics 7782ndash795
Miller J D and H Safford 2012 Trends in wildfire severity 1984 to 2010 in the Sierra Nevada Modoc Plateau and southern Cascades California USA Fire Ecology 841ndash57
Miller J H Safford M Crimmins and A Thode 2009 Quantitative evidence for increasing forest fire severity in the Sierra Nevada and southern Cascade mountains California and Nevada USA Ecosystems 1216ndash32
North M 2012 Managing Sierra Nevada forests PSWshyGTR-237 USDA Forest Service Pacific Southwest Research Station Albany California USA
North M P and M D Hurteau 2011 High-severity wildfire effects on carbon stocks and emissions in fuels treated and untreated forest Forest Ecology and Management 2611115ndash1120
North M M Hurteau and J Innes 2009a Fire supshypression and fuels treatment effects on mixed-conifer carbon stocks and emissions Ecological Applications 191385ndash1396
North M P A Stine K OrsquoHara W Zielinski and S Stephens 2009b An ecosystem management strategy for Sierran mixed-conifer forests General Technical Report PSW-GTR-220 USDA Forest Service Pacific Southwest Research Station Albany California USA
Parisien M-A S Snetsinger J A Greenberg C R Nelson T Schoennagel S Z Dobrowski and M A Moritz 2012 Spatial variability in wildfire probability across the western United States Intershynational Journal of Wildland Fire 21313ndash327
Penman J M Gytarsky T Hiraishi T Krug D Kruger R Pipatti L Buendia K Miwa T Ngara and K Tanabe 2003 Good practice guidance for land use land-use change and forestry Institute for Global Environmental Strategies for the Intergovshyernmental Panel on Climate Change Hayama Kanagawa Japan
Pollet J and P N Omi 2002 Effect of thinning and prescribed burning on crown fire severity in ponderosa pine forests International Journal of Wildland Fire 111ndash10
Prather J W R F Noss and T D Sisk 2008 Real versus perceived conflicts between restoration of ponderosa pine forests and conservation of the Mexican spotted owl Forest Policy and Economics 10140ndash150
Preisler H K D R Brillinger R E Burgan and J Benoit 2004 Probability based models for estimation of wildfire risk International Journal of Wildland Fire 13133ndash142
Rebain S E Reinhardt N Crookston S Beukema W Kurz and J Greenough 2009 The fire and fuels extension to the Forest Vegetation Simulator Addendum to RMRS-GTR-119 USDA Forest Service and ESSA Technologies Ltd Fort Collins Colorado USA
Reinhardt E D and N L Crookston 2003 The fire and fuels extension to the forest vegetation simulashytor Pages 209 RMRS-GTR-116 USDA Forest Sershyvice Rocky Mountain Research Station Ogden Utah USA
Reinhardt E and L Holsinger 2010 Effects of fuel treatments on carbon-disturbance relationshyships in forests of the northern Rocky Mountains Forest Ecology and Management 2591427ndash1435
wwwesajournalsorg 20 January 2017 Volume 8(1) Article e01648
CHIONO ET AL
Reinhardt E D R E Keane D E Calkin and J D Cohen 2008 Objectives and considerations for wildland fuel treatment in forested ecosystems of the interior western United States Forest Ecology and Management 2561997ndash2006
Ritchie M W C N Skinner and T A Hamilton 2007 Probability of tree survival after wildfire in an interior pine forest of northern California effects of thinning and prescribed fire Forest Ecolshyogy and Management 247200ndash208
Roloff G J S P Mealey and J D Bailey 2012 Comshyparative hazard assessment for protected species in a fire-prone landscape Forest Ecology and Manshyagement 2771ndash10
Rothermel R C 1972 A mathematical model for preshydicting fire spread in wildland fuels Research Paper INT-115 USDA Forest Service Intermounshytain Forest and Range Experiment Station Ogden Utah USA
Safford H D 2008 Fire severity in fuel treatments American River Complex fire Tahoe National Forest California Unpublished Report USDA Forest Service Pacific Southwest Region Vallejo California USA
Schmidt D A A H Taylor and C N Skinner 2008 The influence of fuels treatment and landscape arrangement on simulated fire behavior Southern Cascade range California Forest Ecology and Management 2553170ndash3184
Scott J H and R E Burgan 2005 Standard fire behavior fuel models a comprehensive set for use with Rothermelrsquos surface fire spread model General Technical Report RMRS-GTR-153 USDA Forest Service Rocky Mountain Research Station Fort Collins Colorado USA
Scott J H M P Thompson and J W Gilbertson-Day 2016 Examining alternative fuel management strategies and the relative contribution of National Forest System land to wildfire risk to adjacent homesndasha pilot assessment on the Sierra National Forest California USA Forest Ecology and Manshyagement 36229ndash37
Smith J E and L S Heath 2002 A model of forest floor carbon mass for United States forest types Research Paper NE-722 USDA Forest Service Northeastern Research Station Newtown Square Pennsylvania USA
Stephens S L 2005 Forest fire causes and extent on United States Forest Service lands International Journal of Wildland Fire 14213ndash222
Stephens S L B M Collins E Biber and P Z Fulme 2016a US federal fire and forest policy emphasizshying resilience in dry forests Ecosphere 7e01584
Stephens S L J D Miller B M Collins M P North J J Keane and S L Roberts 2016b Wildfire impacts on California Spotted Owl nesting habitat in the Sierra Nevada Ecosphere 7e01584
Stephens S L J J Moghaddas B R Hartsough E E Y Moghaddas and N E Clinton 2009 Fuel treatshyment effects on stand-level carbon pools treatshyment-related emissions and fire risk in a Sierra Nevada mixed-conifer forest Canadian Journal of Forest Research 391538ndash1547
Stephens S L et al 2012 Fuel treatment impacts on estimated wildfire carbon loss from forests in Monshytana Oregon California and Arizona Ecosphere 31ndash17
Tempel D et al 2015 Evaluating short- and longshyterm impacts of fuels treatments and simulated wildfire on an old-forest species Ecosphere 61ndash19
USDA Forest Service 2004 Sierra Nevada Forest Plan Amendment Final supplemental environmental impact statement Record of decision Publication R5-MB-046 USDA Forest Service Pacific Southshywest Region Vallejo California USA
Van Wagner C E 1977 Conditions for the start and spread of crown fire Canadian Journal of Forest Research 723ndash34
Verner J K S McKelvey B R Noon R Gutimerrez G I Gould Jr and T W Beck 1992 Assessment of the current status of the California spotted owl with recommendations for management Pages 3ndash27 in J Verner K S McKelvey B R Noon R Gutimerrez G I Gould Jr and T W Beck edishytors The California Spotted Owl a technical assessment of its current status PSW-GTR-133 USDA Forest Service Albany California USA
Westerling A B Bryant H Preisler T Holmes H Hidalgo T Das and S Shrestha 2011 Climate change and growth scenarios for California wildshyfire Climatic Change 109445ndash463
Westerling A L H G Hidalgo D R Cayan and T W Swetnam 2006 Warming and earlier Spring increase Western US Forest Wildfire Activity Science 313940ndash943
Wiedinmyer C and M D Hurteau 2010 Prescribed fire as a means of reducing forest carbon emissions in the Western United States Environmental Science amp Technology 441926ndash1932
SUPPORTING INFORMATION
Additional Supporting Information may be found online at httponlinelibrarywileycomdoi101002ecs2 1648full
wwwesajournalsorg 21 January 2017 Volume 8(1) Article e01648
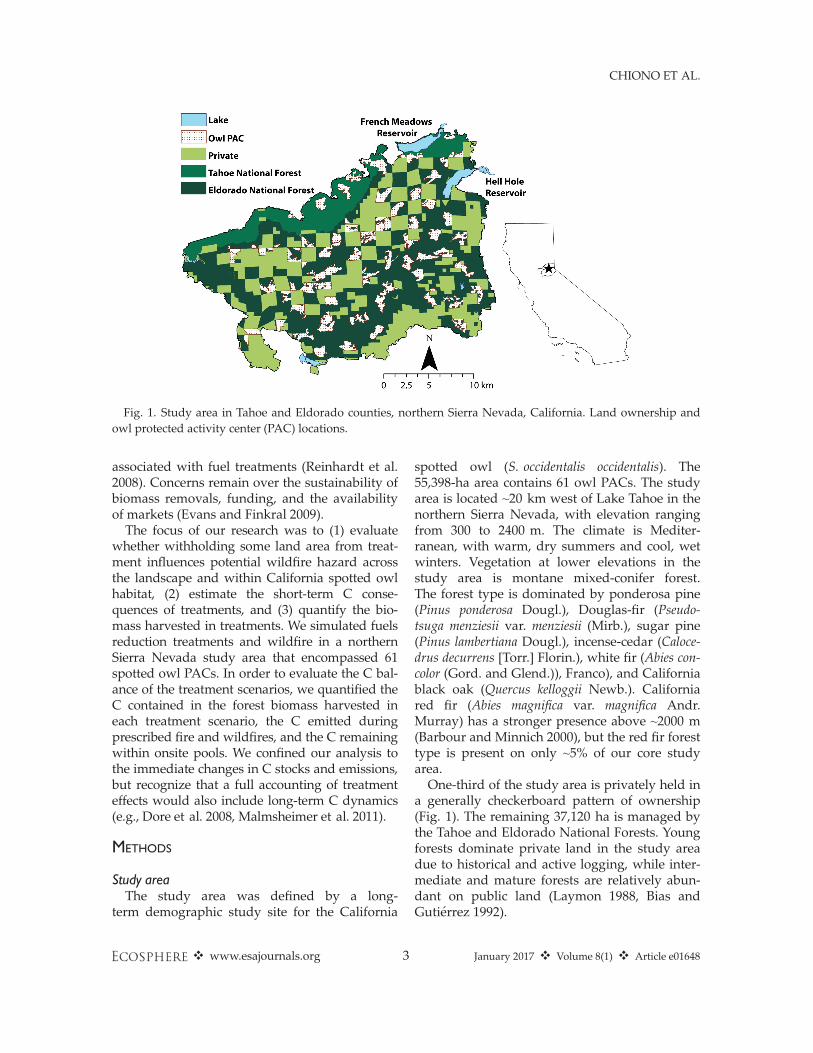
CHIONO ET AL
Fig 1 Study area in Tahoe and Eldorado counties northern Sierra Nevada California Land ownership and owl protected activity center (PAC) locations
associated with fuel treatments (Reinhardt et al 2008) Concerns remain over the sustainability of biomass removals funding and the availability of markets (Evans and Finkral 2009)
The focus of our research was to (1) evaluate whether withholding some land area from treatshyment influences potential wildfire hazard across the landscape and within California spotted owl habitat (2) estimate the short-term C conseshyquences of treatments and (3) quantify the bioshymass harvested in treatments We simulated fuels reduction treatments and wildfire in a northern Sierra Nevada study area that encompassed 61 spotted owl PACs In order to evaluate the C balshyance of the treatment scenarios we quantified the C contained in the forest biomass harvested in each treatment scenario the C emitted during prescribed fire and wildfires and the C remaining within onsite pools We confined our analysis to the immediate changes in C stocks and emissions but recognize that a full accounting of treatment effects would also include long-term C dynamics (eg Dore et al 2008 Malmsheimer et al 2011)
METHODS
Study area The study area was defined by a longshy
term demographic study site for the California
spotted owl (S occidentalis occidentalis) The 55398-ha area contains 61 owl PACs The study area is located ~20 km west of Lake Tahoe in the northern Sierra Nevada with elevation ranging from 300 to 2400 m The climate is Meditershyranean with warm dry summers and cool wet winters Vegetation at lower elevations in the study area is montane mixed-conifer forest The forest type is dominated by ponderosa pine (Pinus ponderosa Dougl) Douglas-fir (Pseudoshytsuga menziesii var menziesii (Mirb) sugar pine (Pinus lambertiana Dougl) incense-cedar (Caloceshydrus decurrens [Torr] Florin) white fir (Abies con-color (Gord and Glend)) Franco) and California black oak (Quercus kelloggii Newb) California red fir (Abies magnifica var magnifica Andr Murray) has a stronger presence above ~2000 m (Barbour and Minnich 2000) but the red fir forest type is present on only ~5 of our core study area One-third of the study area is privately held in
a generally checkerboard pattern of ownership (Fig 1) The remaining 37120 ha is managed by the Tahoe and Eldorado National Forests Young forests dominate private land in the study area due to historical and active logging while intershymediate and mature forests are relatively abunshydant on public land (Laymon 1988 Bias and Gutimerrez 1992)
wwwesajournalsorg 3 January 2017 Volume 8(1) Article e01648
CHIONO ET AL
Table 1 Description of Chatfield (2005) cover classes
Cover class Description
1 Hardwood forest (gt10 hardwood canopy closure and lt10 conifer canopy closure)
2 Clearcut or shrubsmall tree (lt153 cm dbh) 3 Pole (153ndash28 cm dbh) forest 4 Medium (28ndash61 cm dbh) conifermixed-conifer
forest with low to medium canopy closure (30ndash69)
5 Medium (28ndash61 cm dbh) conifermixed-conifer forest with high canopy closure (ge70)
6 Mature (ge61 cm dbh) conifermixed-conifer forest with low to medium canopy closure (30ndash69)
7 Mature (ge61 cm dbh) conifermixed-conifer forest with high canopy closure (ge70)
8 Water
Vegetation and fuels data The vegetation classification map developed in
Chatfield (2005) forms the basis of our study area Using aerial photographs combined with field accuracy assessment Chatfield (2005) digitized eight land cover classes consistent with the California Wildlife Habitat Relationships (CWHR Mayer and Laudenslayer 1988) system A descripshytion of the cover classes is provided in Table 1 From the resulting cover class map we delinshyeated polygons to represent stands of similar vegetation composition and structure (n = 4470) based on aerial photographs and topography (Fig 2)
Stands were populated with vegetation data collected in 2007 in 382 sampling plots located within 10 km of the study arearsquos northern boundshyary based on the assumption that the characterisshytics of the plots are representative of the study area These vegetation data included tree species heights diameters and crown ratios See Collins et al (2011) for a detailed description of data colshylection To populate stands in the core study area with plot data we first assigned a Chatfield cover class to each sampling plot based on species comshyposition canopy cover and tree diameter distrishybution We then used a Most Similar Neighbor procedure (Crookston et al 2002) to select five nearest neighbor plots for each stand using the Random Forest method with the R package yaimshypute (version 10-22 Crookston and Finley 2008) Variables used in identifying nearest neighbors were topographic relative moisture index eastshyness northness slope and elevation Stands were
populated with data only from plots belonging to the same cover class In order to increase variabilshyity in stand conditions three of the five plots inishytially selected to represent each stand were chosen randomly to contribute data to the stand Each plot contributed data to an average of 355 stands (range 1ndash437) The method in which surface fuels are represhy
sented for fire modeling has important implicashytions for findings related to expected fire behavior and effects Fuel models are representashytions of fuelbed properties such as the distribushytion of fuel between particle size classes heat content and dead fuel moisture of extinction for use in the Rothermel (1972) surface fire spread model As representations fuel models artifishycially constrain the variation in surface fuel conditions In order to represent a range of preshytreatment fuel conditions for fire modeling we overrode fuel model assignments made by the Fire and Fuels Extension to the Forest Vegetation Simulator (FVS-FFE Dixon 2002 Reinhardt and Crookston 2003) and selected two fuel models for each stand Fuel models representing the low end of the range were assigned following the selection logic of Collins et al (2011) high-end models were selected to amplify surface fire behavior relative to the low-end models (Appshyendix S1 Table S1 Collins et al 2013) This approach to assigning fuel models to stands has been demonstrated to result in modeled fire behavior that is more consistent with observed fire effects than default fuel model assignments (Collins et al 2013) An alternative approach could be to use the Landfire surface fuel model layer (eg Scott et al 2016) However we opted to tie fuel model assignments to the specific forest structural characteristics for each stand (Lydersen et al 2015) as represented by the imputed plots rather than the remotely sensed dominant vegeshytation characteristics captured by Landfire Study area data were processed in the western
Sierra variant of FVS to obtain the data layers required for fire behavior modeling Due to the potential for spurious fire modeling results near study area edges we obtained additional canopy fuel and surface fuel data layers from Landfire (wwwlandfiregov) for an area adjacent to the study area boundary defined by a 10-km minishymum bounding rectangle (Fig 2) The reason for using Landfire data for the buffer area was that
wwwesajournalsorg 4 January 2017 Volume 8(1) Article e01648
CHIONO ET AL
Fig 2 Land cover classes (Chatfield 2005) within the core study area stand polygons and 10-km minimum bounding rectangle for fire spread modeling See Table 1 for description of classes
we did not have a vegetation map with a similar classification scheme and level of detail outside of our core study area (Fig 2) We merged study area and Landfire data layers to build 90 9 90 m resolution landscape files for fire behavior modshyeling in Randig described below This allowed us to include wildfires originating outside of the study area in our analysis
Wildfire fuel treatments and carbon loss modeling
We used ArcFuels (Ager et al 2006) to streamshyline fuel treatment planning and analysis of effects ArcFuels is a library of ArcGIS macros that facilitates communication among the array of models and other programs commonly used in fuel treatment planning at the landscape scale (vegetation growth and yield simulators fire
behavior models ArcGIS and desktop software) Our process depicted in Fig 3 involved
1 fire behavior modeling in Randig (Finney 2006) to identify stands with high fire hazard
2 prioritizing stands for treatment using the Landscape Treatment Designer (LTD) (Ager et al 2012)
3 modeling fuel treatments in FVS-FFE 4 fire behavior modeling for the post-treatment
and untreated landscapes and 5 developing C loss functions from simulated
burning with FVS-FFE
Conditional burn probability and flame lengthmdash Wildfire growth simulations were performed in Randig a command-line version of FlamMap (Finney 2006) Randig uses the minimum travel
wwwesajournalsorg 5 January 2017 Volume 8(1) Article e01648
CHIONO ET AL
Fig 3 Work flow used in the present study to evaluate landscape fuel treatment effects on wildfire hazard and carbon pools and emissions
time algorithm (Finney 2002) to simulate fire growth during discrete burn periods under conshystant weather conditions Simulating many burn periods with Randig generates a burn probability surface for the study landscape Simulations were conducted at 90-m resolution for computashytional efficiency We simulated 80000 randomly located ignitions with a 5-h burn period for all scenarios including no treatment The burn pershyiod was selected to produce fire sizes that approximated area burned in spread events of historical large wildfires near the study area Large daily spread events in previous wildfires in the northern Sierra Nevada have burned gt2000 ha (Dailey et al 2008 Safford 2008) average fire sizes from our simulations ranged from 715 to 2133 ha (The exceptional growth observed in the 2014 King Fire is addressed in a subsequent subsection) The combination of ignishytion number and burn period was sufficient to ensure that 99 of pixels in burnable fuel types experienced fire at least once (average 64ndash1891 fires)
Randig outputs were used both in prioritizing stands for treatment and in evaluating the effects of treatment We performed one Randig run for each fuel model range (low and high) within each scenario (no treatment S1 S2 and S3) using landshyscape files representing the year immediately folshylowing treatment 2009 Simulations were also completed for the 2007 pre-treatment landscape for use in treatment prioritization for a total of 10 modeling runs
To evaluate the effect of treatments on fire risk and fire hazard we assessed changes in condishytional burn probability (CBP) and conditional flame length (CFL) between the treatment scenarshyios and the untreated landscape based on wildfire simulations It is important to note that the burn probabilities estimated in this study are not empirshyical estimates of the likelihood of wildfire occurshyrence (eg Preisler et al 2004 Brillinger et al 2006 Parisien et al 2012) Rather we use CBP the likelihood that a pixel will burn given a single ignition in the study area and assuming the simushylation conditions described From the simulation of many fires Randig calculates a pixel-level disshytribution of flame lengths (FL) in twenty 05-m classes between 05 and 10 m Conditional flame length the probability-weighted FL given that a fire occurs (Ager et al 2010) was calculated by combining burn probability estimates with FL disshytributions summarized at the stand level
( )20 BPiCFL frac14 Fi X
BPifrac141
where BP is CBP BPi is the probability of burning at the ith FL class and Fi is the midpoint FL of the ith FL class To estimate the effect of treatment on fire risk
and hazard we first computed average pixel-level BP and CFL for treated and untreated stands in each scenario Then we calculated average BP and CFL for the same stands within the no-treatment landscape The effect of each treatment scenario
wwwesajournalsorg 6 January 2017 Volume 8(1) Article e01648
CHIONO ET AL
was estimated as the proportional change in each fire metric between the untreated and treated landscapes
We obtained weather and fuel moisture inputs for wildfire modeling from the Bald Mountain and Hell Hole remote automated weather stations (RAWS) based on recommendations from local USDA Forest Service fire and fuel managers We used 95th percentile weather conditions from the 1 June to 30 September period (1989ndash2013) This period represents the typical fire season for the study area encompassing 85 of wildfires and 93 of the area burned within a 161-km (100-mi) radius of the study area between 1984 and 2012 (Monitoring Trends in Burn Severity database Eidenshink et al 2007)
Weather and fuel moisture inputs for wildfire simulations are provided in Appendix S1 Table S2 These conditions are similar to those occurring during recent large wildfires in and near the study area (eg 2001 Star Fire 2008 American River Complex 2013 American Fire) In addition to using Randig to model fire spread and intensity we used FVS-FFE to project effects of prescribed fires and wildfires (described below) Wind inputs varied somewhat between fire models FVS-FFE requires only a single wind speed while multiple wind scenarios were applied in Randig fire simulations Wind speeds azimuths and relative proportions for Randig simulations followed Collins et al (2011)
Spatial optimization of fuel treatmentsmdashStands were selected for treatment based on modeled pre-treatment wildfire hazard and stand structure using the LTD which allows multiple objectives to be combined in the spatial prioritization of fuel treatments Three treatment scenarios varied in the land designations eligible for treatment
Scenario 1 Public land excluding spotted owl habitat Scenario 2 Public land including spotted owl habitat Scenario 3 All lands public and private ownerships
Objectives were consistent across treatment sceshynarios but differed in the land area available for treatment For all LTD runs we directed the model to maximize a total score that comprised numeric stand structure and fire hazard rankings
(Appendix S1 Table S3) The stand structure rankshying (0 1 2) was based on cover class category Cover classes most conducive to thinning were ranked highest Fire hazard ranking (0 2 3) was assigned according to stand-level CFL as calcushylated from FL probability files generated in Randig simulations for the 2007 pre-treatment landscape To isolate the effect of varying land designashy
tions in the area available for treatment total area treated was held constant between scenarios (20 of the core study area) In order to exclude small spatially isolated treatment areas that would be impractical from a management standshypoint we required a minimum treatment area of 121 ha (30 ac) To achieve this the treatment prishyoritization process was iterative In each step we eliminated all stands selected by LTD for treatshyment that were not contiguous with a ge121-ha treatment area The rationale for this is based on the cost associated with re-locating equipment necessary to implement mechanical andor fire treatments (D Errington personal communication El Dorado National Forest) We then calculated the treatment area remaining This process was repeated until total treatment area summed to the target area (~11080 ha) We simulated fuel treatments using FVS-FFE
Stands selected for treatment were assigned one of 13 treatment prescriptions depending on topogshyraphy vegetation cover class ownership and overlap with owl PACs (Appendix S1 Table S4) In an effort to promote landscape-scale heteroshygeneity basal area targets for commercial thinning on public land varied with topography (aspect and slope position canyondrainage bottom mid-slope and ridge) (North et al 2009b North 2012) All thinning treatments were simulated as thinshyfrom-below harvests and thinning within owl PACs was limited to hand thinning We assumed that trees ge254 cm (10 in) dbh would be harshyvested for wood products (FVS VOLUME keyshyword) and that the biomass contained in smaller trees and in the tops and branches of larger trees would be utilized as feedstocks for bioenergy conshyversion Therefore all thinning (except hand thinshyning) treatments were simulated as whole tree harvests (FVS keyword YARDLOSS) Treatments preferentially retained fire-resistant species with relative retention preference as follows black oakgtponderosa pinegtsugar pinegtDouglas-firgtinshycense-cedargtred firegtwhite fir
wwwesajournalsorg 7 January 2017 Volume 8(1) Article e01648
CHIONO ET AL
Prescribed fires were simulated in the year folshylowing thinning (2009) Broadcast burning was applied except within owl PACs on private land and on steep slopes (gt35) where follow-up burning was limited to pile burning To capture a more realistic range of post-treatment surface fuel conditions stands selected for treatment were randomly assigned to one of three post-treatment fuel models for each fuel model range TL1 (181) TL3 (183) or TL5 (185) (low range) TL3 (183) TL5 (185) or SB1 (201) (high range) (Scott and Burgan 2005) Weather conditions for prescribed fire modeling were based on recomshymendations from a local fire management speshycialist (B Ebert personal communication)
Biomass and carbon effects of treatmentmdashSimushylated treatment prescriptions varied according to site characteristics such as topography and land ownership (Appendix S1 Table S4) We tracked the C emitted from burning removed during harshyvesting and contained in live and dead aboveshyground biomass with FVS-FFE carbon reports (Reinhardt and Crookston 2003 Hoover and Rebain 2008) FVS converts biomass to units of C using a multiplier of 05 for all live and dead C pools (Penman et al 2003) except duff and litter pools for which a multiplier of 037 is applied (Smith and Heath 2002) Stand C is partitioned into a number of pools including aboveground live tree standing dead tree herb and shrub litter and duff woody surface fuel and belowground live and dead tree root C we limited our analysis to aboveground pools of C FVS-FFE also reports the C emitted during burning and that conshytained in harvested biomass (Rebain et al 2009) Treatment effects were assessed by comparing expected aboveground biomass C and emissions between the treated and untreated landscapes
We developed C loss functions for each FVS treelist by simulating burning with FVS-FFE at a range of FLs (SIMFIRE and FLAMEADJ keyshywords) (Ager et al 2010 Cathcart et al 2010) The FL values supplied to FLAMEADJ were the 20 midpoints of the 05-m FL classes (05ndash10 m) found in Randig FL probability output files As noted by Ager et al (2010) and Cathcart et al (2010) it is not currently possible to precisely match fire behaviors between Randig and FVS The FLs reported in Randig outputs are the total of surface fire and if initiated crown fire In
contrast the FLs supplied to FVS-FFE via the FLAMEADJ keyword are treated as surface fire FLs and when FLAMEADJ is parameterized with only a predefined FL the model does not use the input FL in crown fire simulations To estimate fire effects in FVS-FFE we parameterized FLAshyMEADJ with percent crowning (PC) and scorch height in addition to FL Scorch height and critical FL for crown fire initiation (FLCRIT) were based on Van Wagner (1977) We estimated PC using a downward concave function where PC = 32 when flame length = FLCRIT and PC = 100 when FL is ge30 of stand top height (the average height of the 40 largest trees by diameter) (Ager et al 2010 A Ager personal communication) The derived C loss functions were combined
with the probabilistic estimates of surface fire behavior produced in Randig simulations to estishymate the ldquoexpected Crdquo emitted in wildfire or conshytained in biomass We estimated expected C emissions and post-fire biomass C for each pixel as follows
20 X[ ]Efrac12 ]C i frac14 BPij X Cij
ifrac140
where E[C]j is the expected wildfire emissions of C from pixel j or biomass C in pixel j in mass per unit area BPij is the probability of burning at the ith FL class for pixel j and Cij is the C emitshyted from pixel j or the biomass C remaining in pixel j post-wildfire given burning at the ith FL class Expected C emissions and biomass C were
summed across all pixels in the core study area to obtain total expected wildfire emissions and expected terrestrial C for each treatment scenario In order to compare our modeling results to
other analyses that reported wildfire emissions on a per area basis we used a different method to estishymate C emissions per area burned Because wildshyfires burned both the core and buffer areas of our study landscape while emissions were estimated only in the core area we used conditional expected wildfire emissions to approximate the emissions from a wildfire burning entirely within the core study area Conditional expected emissions are those produced for an area given that the area is burned Conditional emissions were estimated for each pixel as follows
wwwesajournalsorg 8 January 2017 Volume 8(1) Article e01648
CHIONO ET AL
Table 2 Total area and proportion of area treated by category in each treatment scenario
SC1 SC2 SC3
Proportion of Proportion of Proportion of Treatment category Area (ha) area treated Area (ha) area treated Area (ha) area treated
Treated 11081 100 11082 100 11081 100 Avail for treatmentdagger 22042 199 28998 262 45647 412 Owl habitat treated 00 000 2769 025 1127 010 Private land treated 00 000 00 000 5685 051 Hand thin 1499 014 3819 034 1612 015 Biomass thin 8404 076 7240 065 9470 085 Commercial thin 7765 070 6916 062 9470 085 Broadcast burn 9410 085 7247 065 3785 034 Pile burn 1671 015 3835 035 7296 066
dagger Total land area potentially available for treatment in each scenario The area available for treatment increased from Scenarshyios 1 to 3 as restrictions on the area available for treatment were relaxed
20 X C WCfrac12 ]j frac14
BPij X WCijBPjifrac141
where C[WC]j is the C emitted by wildfire from pixel j in mass per unit area BPj is the probability that pixel j is burned BPij is the probability of burning at the ith FL class and WCij is the C emitted from pixel j when burned at the ith FL class
Conditional expected emissions were averaged across all pixels to obtain an estimate of wildfire emissions per area burned
Large fire revisionmdashWildfire modeling was calishybrated to produce fire sizes that approximated area burned in spread events of historical large wildfires near the study area However during the course of the study a very large fire encounshytered our study area The King Fire began on 13 September 2014 in El Dorado County and burned 39545 hamdashmore than an order of magnishytude greater than our modeled wildfires includshying gt25 of the study area Given the potential for very large wildfires in this region demonshystrated by the King Fire we completed addishytional wildfire modeling to estimate the C effects of treatment given the occurrence of a very large fire
Randig modeling was repeated for the no-treatment and S3 scenarios using the high fuel model range and a revised burn period number of simulated ignitions wind speed and wind directions Burn period was increased from 5 to 12 h number of ignitions was reduced by half to 40000 Wind directions and relative probabilities (Appendix S1 Table S5) were those recorded at
Hell Hole RAWS between 0400 and 1900 hours on 17 September the day of the King Firersquos larshygest spread event We used the probable 1-min maximum wind speed as calculated from the maximum gust recorded on that day 33 kmh (205 mph) based on maximum gust of 547 kmh (34 mph) (Crosby and Chandler 1966) These settings produced average fire sizes of NT = 10757 ha (no-treatment scenario) and 8070 ha (S3) Average fire size was limited by the size of our buffered study area Longer burn periods resulted in an increasing number of simulated wildfires that burned to the study area boundary
RESULTS
Treatment simulation Table 2 provides a summary of the area treashy
ted in each scenario Scenario 1 (S1) was the most restrictive with respect to the land area available for treatment which more than doushybled between S1 and S3 Because treatment preshyscriptions varied with land designation (public owl PAC private) and the designations availshyable for treatment varied between scenarios the relative proportions of thinning and burning methods also varied between scenarios Comshymercial and biomass thinning were applied most frequently in S3 which permitted treatshyment of private land Spotted owl activity censhyters composed 25 of the area treated in S2 vs 10 in S3 and 0 in S1 the scenario in which PACs were not subject to treatment As a result the area treated with hand thinning in S2 was more than twice that in S1 and S3 Due to the
wwwesajournalsorg 9 January 2017 Volume 8(1) Article e01648
CHIONO ET AL
Fig 4 Low fuel model range treatment locations and difference in conditional burn probability (CBP) and conshyditional flame length (CFL) (untreated-treated) for each treatment scenario Negative values indicate an increase in CBP or CFL while positive values represent a reduction CBP is the likelihood that a pixel will burn given a single ignition on the landscape and assuming the simulation conditions described in Appendix S1 Table S1 and in the text Conditional flame length is the probability-weighted flame length given these same assumptions
inclusion of PACs in S2 and both PACs and prishyvate land in S3 the proportion of area treated with pile burning increased between S1 and S3 while broadcast burn area exhibited an opposite trend Despite the variation in land designations available for treatment the pattern of treatshyment placement was generally similar between scenarios with treatments concentrated in the central and eastern portions of the study area (Figs 4 5)
Landscape-scale burn probability and fire hazard Conditional burn probabilitymdashThe pixel-to-pixel
change in CBP between the untreated scenario and each treatment scenario is mapped in Figs 4 (LO FM) and 5 (HI FM) Treatment reduced landshyscape burn probability by approximately 50 (Table 3) from 00124 (NT) to 00062 (S1) 00059 (S2) and 00055 (S3) Within treatment units avershyage CBP fell by 69ndash76 to 00033ndash00035 outside of treated stands CBP fell to 00060ndash00069 Some
wwwesajournalsorg 10 January 2017 Volume 8(1) Article e01648
CHIONO ET AL
Fig 5 Treatment locations and high fuel model range difference in conditional burn probability and condishytional flame length (untreated-treated) for each treatment scenario
increases in CBP were also observed particularly for the low fuel model range (Fig 4)
The influence of treatment on owl PAC likelishyhood of burning was similar to that observed for stands in general For treated PACs average CBP fell by ~70 relative to no treatment for the same stands Although PACs were not eligible for treatment in S1 all treatment scenarios had a large impact on estimated PAC CBP Average PAC CBP was reduced from 0013 to 00063 in S1 00049 in S2 and 00054 in S3 a 49ndash64 decrease relative to PACs in the no-treatment landscape (Table 3)
Fire hazardmdashTreatments reduced average landshyscape CFL by ~1 m from 36 m (NT) to 25ndash27 m Pixel-level CFL was reduced by a maximum of 80 m (LO FM) and 90 m (HI FM) Increases in CFL were also observed however particularly near the study arearsquos western and southwestern boundaries where treatments were least concentrated (Figs 4 5) Maximum pixel-level CFL increases were 25 m (LO FM) and 31 m (HI FM) Because fire hazard was used in prioritizing
stands for treatment the estimated pre-treatment CFL in stands selected for treatment (43ndash51 m)
wwwesajournalsorg 11 January 2017 Volume 8(1) Article e01648
CHIONO ET AL
Table 3 Proportional change in burn probability for treatment scenarios compared to the NT scenario
LO FM HI FM AVG
Stand type
S1 S2 S3 Proportional change
relative to NT
S1 S2 S3 Proportional change
relative to NT
S1 S2 S3 Proportional change
relative to NT
All PACs -045 -064 -056 -053 -063 -059 -049 -064 -057 Treated PACs NA -081 -076 NA -057 -067 NA -069 -072 Untreated PACs -045 -053 -051 -053 -054 -058 -049 -053 -054 All stands Treated stands
-044 -076
-048 -079
-053 -063
-050 -072
-053 -074
-056 -074
-047 -074
-050 -076
-054 -069
Untreated stands -035 -039 -049 -045 -047 -051 -040 -043 -050
Notes NT no treatment PACs protected activity centers Proportions are ratios of treatment values to no-treatment values as calculated for the same stands Treatment and no-treatment values were calculated as the average pixel value for the low and high fuel model range (LO FM and HI FM) within each stand category and treatment scenario
was greater than in stands not selected (32ndash 33 m) After treatment average CFL within treashyted stands fell to 13 (S1 and S2) and 17 m (S3) CFL in untreated stands was also reduced as a result of the influence of treatments on fire spread and intensity CFL fell by 05ndash08 m (9ndash 16) relative to CFL in the same stands within the no-treatment landscape (Table 4)
Although spotted owl PACs were not treated in S1 relative to PACs in the NT landscape PAC CFL was reduced by 10 (to 32 m) in S1 Treating PACs had a much larger impact on potential fire intensity however Average treashyted PAC CFL fell to 13 and 14 m in S2 and S3 respectively
Carbon consequences of landscape fuel treatments
Prior to treatment aboveground landscape carbon totaled 14705 tonnesha on average Treatments removed 14 of pre-treatment C from treated stands or 2374 tonnesha totaling
81772ndash119103 tonnes of C in harvested biomass and merchantable material (Tables 5 and 6) Both the treatment scenarios and the choice of
fuel models were important influences on estishymated C emissions from burning As the least restrictive treatment scenario in terms of treatshyment location and the only scenario to include treatment of private land where broadcast burnshying was precluded as a treatment option the S3 treatment scenario was associated with the lowshyest wildfire and prescribed burning emissions (Tables 5 and 6) For each treatment scenario expected wildfire emissions increased by more than an order of magnitude between the low and high fuel model ranges This difference was the result of increasing fire intensity as well as wildshyfire size Average wildfire size nearly doubled between fuel model ranges in the treatment sceshynarios and tripled in the no-treatment scenario (Fig 6) For a given treatment scenario wildfire emissions on a per hectare basis were approxishymately two tonnes greater for the high fuel
Table 4 Proportional change in conditional flame length for treatment scenarios compared to the NT scenario
LO FM HI FM AVG
Stand type
S1 S2 S3 Proportional change
relative to NT
S1 S2 S3 Proportional change
relative to NT
S1 S2 S3 Proportional change
relative to NT
All PACs -009 -042 -028 -012 -043 -027 -010 -042 -028 Treated PACs NA -071 -075 NA -071 -073 NA -071 -074 Untreated PACs -009 -014 -011 -012 -017 -014 -010 -016 -013 All stands -022 -026 -031 -025 -026 -028 -024 -026 -030 Treated stands -065 -069 -052 -071 -071 -073 -068 -070 -062 Untreated stands -008 -009 -021 -011 -012 -012 -009 -010 -016
Notes NT no treatment PACs protected activity centers Proportions are ratios of treatment values to no-treatment values as calculated for the same stands Treatment and no-treatment values were calculated as the average pixel value for the low and high fuel model range (LO FM and HI FM) within each stand category and treatment scenario
wwwesajournalsorg 12 January 2017 Volume 8(1) Article e01648
CHIONO ET AL
Table 5 Expected biomass carbon expected wildfire C emissions and C harvested and emitted in fuel treatshyments for NT and treatment (S1 S2 S3) scenarios using the low fuel model range in fire modeling
Carbon pool NT S1 S2 S3
Untreated stands Tonnes C Live 5004505 3915044 3695489 3954131 Dead 1845659 1421704 1378824 1466202 Wildfire emissions 2372 1137 1039 904
Treated stands Live 881358 1072625 826366 Dead 260089 299244 220932 All harvested biomass 88773 81772 119103 Prescribed fire emissions 178530 169693 122599 Wildfire emissions 48 56 61
All stands Live 5004505 4796402 4768113 4780497 Dead 1845659 1681793 1678068 1687135 Treatment (harvested and emitted) 267303 251465 241702 Wildfire emissions 2372 1186 1095 965
Grand totals 6852536 6746684 6698741 6710299
Notes LF indicates the large fire scenarios Expected C is that remaining in the core study area following treatment if applishycable and a random ignition and wildfire in the larger buffered study area as estimated from the simulation of many wildfires Live C is that contained in live aboveground herb shrub and tree biomass dead C is the C contained in litter duff woody surshyface fuel and aboveground portions of tree snags NT no treatment
model range than for the low range In contrast to the large influence of fuel model choice on wildfire emissions the effect of fuel model range on prescribed fire emissions was minimal with only a 1 increase in emissions between the low and high fuel model ranges for a given treatment scenario
Although treatment significantly reduced wildshyfire emissions combined emissions from preshyscribed burning on 20 of the landscape and wildfire exceeded wildfire emissions in the no-treatment scenarios (Tables 5 and 6) Relative to the no-treatment scenarios treatment reduced estimated wildfire emissions by approximately 54 (low fuel model range) 59 (high fuel model range) and 45 (large fire scenarios) Yet preshyscribed burning was a far more significant source of emissions than were wildfires of moderate size with emissions from treatment exceeding wildfire emissions by 111259ndash177344 tonnes Even for the large wildfire simulations where landscape treatments nearly halved estimated wildfire emisshysions the combined carbon emissions from preshyscribed burning and wildfire in the treatment scenario surpassed wildfire emissions in the no-treatment scenario by 45 (Table 6 Fig 7)
The total quantity of aboveground C expected to remain on the landscape following treatment
and a randomly ignited wildfire was greatest for the no-treatment scenarios (Tables 5 and 6) For modeled wildfires of moderate size treatment reduced both the live and dead C pools relative to the no-treatment scenarios and terrestrial C in the no-treatment scenarios was 4ndash5 greater (323316 ndash434960 tonnes) than in any of the treatment scenarios (Tables 5 and 6) In comparison under large wildfire conditions the treatment scenario retained slightly more live biomass C~15000 tonshynes or 03 more than the no-treatment scenario However treatment also reduced necromass C by 288000 tonnes (12) resulting in a 3 overall decrease in onsite biomass C relative to an untreshyated landscape (Table 6) The proportional changes in aboveground
biomass C pools between the treatment and no-treatment scenarios are summarized in Table 7 For all treatment scenarios the consumption of duff litter and downed woody fuels with preshyscribed burning contributed to a net reduction in these C pools relative to the untreated landscape Conversely treatments protected more C in the live understory (herb and shrub) poolmdashthe result of reduced wildfire size and intensity in the treatshyment scenarios Treatments in the moderate wildshyfire scenarios reduced live tree biomass C in comparison with no-treatment levels (Fig 8)
wwwesajournalsorg 13 January 2017 Volume 8(1) Article e01648
CHIONO ET AL
Table 6 Expected biomass carbon expected wildfire C emissions and C harvested and emitted in fuel treatshyments for NT and treatment (S1 S2 S3) scenarios using the high fuel model range in fire modeling
Carbon pool NT S1 S2 S3 NT-LF S3-LF
Untreated stands Tonnes C Live 4910239 3879854 3664690 3923358 4586898 3750774 Dead 1912429 1448947 1403313 1489629 2130034 1605591 Wildfire emissions 31831 12934 12001 11293 137622 68061
Treated stands Live 896670 1115918 853503 847374 Dead 280182 325628 238130 247744 All harvested biomass 88773 81772 119103 119103 Prescribed fire emissions 180357 171247 123539 123539 Wildfire emissions 798 951 986 8285
All stands Live 4910239 4776524 4780607 4776861 4586898 4598148 Dead 1912429 1729129 1728941 1727759 2130034 1853334 Treatment (harvested and emitted) 282862 265971 254921 254921 Wildfire emissions 31831 13732 12952 12279 137622 76346
Grand totals 6854499 6802247 6788471 6771820 6854554 6782749
Notes LF indicates the large fire scenarios Expected terrestrial C is that remaining in the core study area following treatshyment if applicable and a random ignition and wildfire in the larger buffered study area as estimated from the simulation of many wildfires Live C is that contained in live aboveground herb shrub and tree biomass dead C is the C contained in litter duff woody surface fuel and aboveground portions of tree snags NT no treatment
Notably in the large modeled wildfire scenarios (NT-LF and S3-LF) treatments resulted in a 400000-tonne increase in landscape-level live tree C over the no-treatment scenario
DISCUSSION
Fuel treatments in protected habitat Because there are often competing objectives
between managing forests for resilience to fire and drought and protecting owl habitat we assessed potential fire occurrence and hazard based on treatment scenarios that included and omitted treatment of PACs Conducting fuels management outside of occupied owl habitat has been suggested as a means of reducing fire risk within occupied sites (Jenness et al 2004 Tempel et al 2015) Ager et al (2007) reported that fuel treatments on 20 of a western Oregon landscape reduced the probability of northern spotted owl nesting and roosting habitat loss by 44 even though that habitat type was not treated As in Ager et al (2007) we observed modifications in fire intensity and burn probability within owl habitat even when it was left untreated In the S1 treatment scenario in which owl activity centers were not eligible for treatment the effect of treatshying other stands reduced both fire hazard (by
9ndash12 for CFL or approximately 04 m) and CBP (by ~45) within PACs It is difficult to assess the significance of this proportional reduction in CBP given that the absolute differences in probabilities were relatively modest (Figs 3 4) Ager et al (2007) noted that allowing treatment of owl habishytat would have significantly reduced estimated habitat loss in their study In this study it is expected that habitat quality may be reduced within treated PACs in the short term through the removal of small-diameter trees (ie lower vertical structural heterogeneity) However two structural attributes for suitable spotted owl nestshying habitat identified by Tempel et al (2015) high canopy cover and large tree density would not be altered While we did not directly estimate habitat loss we did observe much larger reductions in fire hazard within PACs that were treated as meashysured by CFL (71ndash75 reduction equivalent to 2ndash3 m) It should be noted that the effect of wideshyspread treatments within PACs on spotted owl nesting and foraging behavior is unknown One concern with designating some land area
unavailable for treatment is that it may limit the potential for treatments to alter fire behavior across the landscape (eg Finney 2001) Including all stands in the potential treatment pool allows the highest-priority stands with respect to simulated
wwwesajournalsorg 14 January 2017 Volume 8(1) Article e01648
CHIONO ET AL
effects on landscape-level fire behavior The true effect of increasing the land area available for treatshyment may be partially obscured by the varying frequency of treatment prescriptions between sceshynarios For example the hand thinning treatments applied within PACs would be expected to have a milder effect on potential wildfire behavior than more severe prescriptions and hand thinning was twice as common in S2 as in the other scenarios
Terrestrial carbon and burning emissions Landscape treatments reduced wildfire emisshy
sions by reducing the emissions produced per area burned by wildfire as well as average wildfire size On average wildfires in the treated landscapes released 193ndash216 tonnes Cha while wildfires in the untreated landscapes released 234ndash254 tonnes Cha Modeled wildfires decreased in size by 7 (low fuel model range) 36 (high fuel model range) and 25 (large fire scenario) relative to untreated landscapes (Fig 6) Since the burn pershyiod for simulated wildfires was held constant between scenarios this reduction in average wildshyfire size is the result of reduced spread rates derived from fuel treatments Despite the influence of treatments on wildfire
intensity size and expected emissions treatment-related emissions exceeded the avoided wildfire emissions conferred by treatment Prescribed burning in our study a combination of broadcast
Fig 6 Wildfire size relative frequency distributions from wildfire simulations Bar color represents no-treatment (NT) and treatment scenarios (S1ndashS3)
fire spread to be treated which would be expected to achieve the greatest modification of landscape fire behavior and effects In the present study although the land area potentially available for treatment more than doubled between S1 and S3 landscape-level effects of treatment on modeled fire risk and hazard were fairly similar (compared with the no-treatment landscape all-stand CBP fell by 47 and 54 in S1 and S3 while CFL fell by 24 and 30) Dow et al (2016) also found that incorporating modest restrictions on treatment Fig 7 Carbon emissions (tonnes) from wildfire and
area availability (24 of the landscape unavail- prescribed burning X-axis labels indicate no-treatment able) had minimal consequences for modeled fire (NT) and treatment scenarios (S1ndashS3) subscripts size and hazard The modest changes in estimated denote fuel model ranges used in fire modeling
fire metrics we observed may also be due to simi- (L low H high) Large fire scenarios which were
larity in the general pattern of treatment placement modeled with the high fuel model range only are indishybetween scenarios which probably led to similar cated by LF
wwwesajournalsorg 15 January 2017 Volume 8(1) Article e01648
CHIONO ET AL
Table 7 Proportional change in expected carbon by biomass pool for treatment scenarios compared to the no-treatment landscape
Treatment Standing Down dead Forest Herb Live scenario dead wood floor shrub tree
S1 004 -017 -013 014 -004 S2 001 -016 -012 014 -004 S3 -001 -015 -010 016 -004 S3-LF -016 -013 -008 017 000
Notes For example a value of -010 represents a 10 decshyline in biomass C from the no-treatment scenario Treatment and no-treatment values were calculated as the average of low and high fuel model range values except in the case of the large fire (LF) scenarios which were modeled for the high fuel model range only Expected C is that remaining after a random ignition and wildfire in the buffered study area as estimated from simulating 80000 ignitions (LF 40000 ignitions)
C pool categories are those reported in Forest Vegetation Simulator Carbon Reports Standing dead aboveground porshytion of standing dead trees Down dead wood woody surface fuels Forest floor litter and duff Herbshrub herbs and shrubs Live tree aboveground portion of live trees
and pile burning released 111ndash163 tonnes Cha For comparison studies conducted in comparable forest types have estimated prescribed fire emisshysions of 127 tonnes Cha (warm dry ponderosa pine habitat types Reinhardt and Holsinger 2010)
Fig 8 Expected carbon contained in aboveground live and dead tree biomass Expected C is that remainshying in the core study area following treatment (if applishycable) and a single random ignition within the larger buffered study area X-axis labels indicate no-treatment (NT) and treatment scenarios (S1ndashS3) subshyscripts denote fuel model ranges used in fire modeling (L low H high) Large fire scenarios which were modeled for the high fuel model range only are indishycated by LF
and 148 tonnes Cha (an old-growth mixed-conifer reserve in the southern Sierra Nevada North et al 2009a) Relative to the approximately 158000 tonnes C emitted in prescribed burning avoided wildfire emissions at 1186ndash19551 tonnes for wildfires of moderate size were small A simishylar study in southern Oregon with average modshyeled wildfires of 2350 and 3500 ha (treatment and no-treatment scenarios respectively) found that treatments reduced expected wildfire emissions by 6157 tonnes of C (Ager et al 2010) Surface fuels represented with surface fuel
models in commonly used modeling software are the most influential inputs determining preshydicted fire behavior (Hall and Burke 2006) Fire behavior fire sizes and emissions in this study varied according to fuel model assignment highshylighting the importance of selecting the approprishyate fuel model to represent fuel conditions (see Collins et al 2013) We show a 12- to 14-fold change in wildfire emissions due solely to the choice of fuel models (Tables 5 and 6) Indeed the range of fuel models used in recent studies investigating fuel treatments and simulated fire behavior in mixed-conifer forests is noteworthy Incorporating a range of fuel models into analyshyses such that outcome variability can be reported facilitates comparison of effects across studies Our estimates of the aboveground C benefits
of treatment under the moderate wildfire scenarshyios with average fire sizes of le2133 ha are likely conservative The effect of modeled wildfire size on the C consequences of fuel treatment was conshysiderable emphasizing the importance of this variable in studies of the climate benefits of treatshyment Avoided wildfire emissions resulting from treatment increased to 61276 tonnes C when large wildfires (8070ndash10757 ha) were simulated The treatment scenario given large wildfires also protected a greater portion of live tree C If the ~40000-ha King Fire is representative of the magnitude of future wildfires in the region C accounting should improve with respect to treatshyment favorability Similarly if multiple wildfires were to encounter the study area within the effective lifespan of treatments the C gains assoshyciated with avoided emissions in the treatment scenarios would increase Our approach to estimating the C conseshy
quences of fuel treatments has a number of limitashytions A full accounting of treatment effects
wwwesajournalsorg 16 January 2017 Volume 8(1) Article e01648
CHIONO ET AL
would project through time the consequences of both treatment and wildfire Our analysis is static incorporating only the short-term C costs and benefits of treatment Simulating wildfire in the year immediately following treatment maximizes the apparent benefits of treatment Over time as surface fuels accumulate and vegetation regenershyates maintenance would be required to retain the effectiveness of treatments (Martinson and Omi 2013) increasing the C costs of reduced fire hazard In addition the C contained in fire-killed biomass will ultimately be emitted to the atmoshysphere although biomass decay could be delayed through conversion to long-lived wood products such as building materials (Malmsheimer et al 2011) It is also important to note that our analysis did not include stochastic wildfire occurrence Estimates of burn probability in the present study are not estimates of the likelihood of wildfire occurrence based on historical fire sizes and freshyquency (eg Preisler et al 2004 Mercer and Prestemon 2005 Brillinger et al 2006) but rather are conditional on a single randomly ignited wildfire within the buffered study area
CONCLUSIONS
Our findings generally support those of Campshybell et al (2011) who concluded from an analysis of fire-prone western forests that the C costs of treatments are likely to outweigh their benefits under current depressed fire frequencies In a more recent paper Campbell and Ager (2013) conshycluded that ldquonone of the fuel treatment simulation scenarios resulted in increased system carbonrdquo primarily from the low incidences of treated areas being burned by wildfire However our interpreshytation of these findings differs from those disshycussed in Campbell et al (2011) and Campbell and Ager (2013) especially in light of recent and projected future trends in fire activity (Westerling et al 2011 Miller and Safford 2012 Dennison et al 2014) The current divergence of increasing surface air temperatures and low fire activity is unlikely to be sustained further suggesting greater future fire activity (Marlon et al 2012) If increased fire activity is realized then the likelishyhood of a given area being burned in a wildfire increases This differs from the simple increase in stand-level fire frequency modeled by Campbell et al (2011) because increases in fire likelihood are
not necessarily associated with corresponding decreases in fire severity as assumed by Campbell et al (2011) Increased fire likelihood could very well lead to positive feedbacks in fire severity and ultimately to vegetation type conversion (Copposhyletta et al 2016)mdasheffects that would have signifishycant implications for carbon storage Due to the significant emissions associated
with treatment and the low likelihood that wildshyfire will encounter a given treatment area forest management that is narrowly focused on C accounting alone would favor the no-treatment scenarios Landscape treatments protected more C in live tree biomass only when large wildfires were simulated While treatment favorability improved with large wildfire simulation the no-treatment scenario still produced fewer emissions than the treatment scenario Given the potential for large wildfire in the region as demonstrated by the 2014 King Fire and the increasing freshyquency of large wildfires and area burned in Calishyfornia expected from climate modeling studies (Lenihan et al 2008 Westerling et al 2011) we suggest that future studies of fuel treatmentndashwildshyfirendashC relationships should incorporate the potenshytial for large wildfires at a frequency greater than those observed over the last 20ndash30 yr Others have argued that treatments to increase forest resilience should be a stand-alone top land management priority independent of other ecosystem values such as carbon sequestration and fire hazard reduction (Stephens et al 2016a) We also note that the potential benefits of fuels
management are not restricted to avoided wildshyfire emissions Here we show that landscape fuel treatments can alter fire hazard across the landshyscape both within and outside of treated stands and have the potential to affect the likelihood of burning and fire intensity within protected Calishyfornia spotted owl habitat Underscoring the risk to sensitive habitat the 2014 King Fire encounshytered 31 PACs within our study area leading to the greatest single-year decline in habitat occushypancy recorded over a 23-yr study period (Jones et al 2016) Modest simulated treatments within activity centers significantly reduced potential fire intensity relative to both the no-treatment landscape and a treatment scenario that did not permit treatment within PACs indicating that active management may be desirable to protect habitat in the long term (Roloff et al 2012)
wwwesajournalsorg 17 January 2017 Volume 8(1) Article e01648
CHIONO ET AL
However treatments conducted outside of owl habitat also reduced wildfire hazard
ACKNOWLEDGMENTS
We are grateful to a number of individuals for sharshying their time and fuel treatment and fire modeling expertise Nicole Vaillant (ArcFuels) Alan Ager and Andrew McMahan (carbon estimation) and Coeli Hoover (harvest simulations in FVS-FFE) Brian Ebert and Dana Walsh of the Eldorado National Forest proshyvided invaluable advice on weather inputs for fire modeling and on designing fuel treatment prescripshytions Ken Somers Operations Forester on the Blodgett Forest Research Station gave advice concerning timshyber management on private land We also thank two anonymous reviewers whose comments greatly improved this article The California Energy Commisshysion provided funding for this project
LITERATURE CITED
Ager A A B Bahro and K Barber 2006 Automating the fireshed assessment process with ArcGIS Pages 163ndash167 in P L Andrews and B W Butler (Comps) Fuels ManagementndashHow to Measure Success Conference Proceedings Portland OR March 28ndash30 2006 Proceedings RMRS-P-41 USDA Forest Service Rocky Mountain Research Station Fort Collins Colorado USA
Ager A A M A Finney B K Kerns and H Maffei 2007 Modeling wildfire risk to northern spotted owl (Strix occidentalis caurina) habitat in Central Oregon USA Forest Ecology and Management 24645ndash56
Ager A A M A Finney A McMahan and J Cathcart 2010 Measuring the effect of fuel treatments on forshyest carbon using landscape risk analysis Natural Hazards and Earth System Science 102515ndash2526
Ager A A N M Vaillant D E Owens S Brittain and J Hamann 2012 Overview and example application of the Landscape Treatment Designer Pages 11 General Technical Report PNW-GTR-859 USDA Forest Service Pacific Northwest Research Station Portland Oregon USA
Barbour M G and R A Minnich 2000 Californian upland forests and woodlands Pages 131ndash164 in M Barbour and W Billings editors North Amerishycan terrestrial vegetation Cambridge University Press Cambridge UK
Bias M A and R Gutimerrez 1992 Habitat associations of California spotted owls in the central Sierra Nevada Journal of Wildlife Management 56584ndash595
Bond M L R Gutierrez A B Franklin W S LaHaye C A May and M E Seamans 2002
Short-term effects of wildfires on spotted owl surshyvival site fidelity mate fidelity and reproductive success Wildlife Society Bulletin 301022ndash1028
Brillinger D H Preisler and J Benoit 2006 Probashybilistic risk assessment for wildfires Environ-metrics 17623ndash633
Campbell J L and A A Ager 2013 Forest wildfire fuel reduction treatments and landscape carbon stocks a sensitivity analysis Journal of Environshymental Management 121124ndash132
Campbell J L M E Harmon and S R Mitchell 2011 Can fuel-reduction treatments really increase forest carbon storage in the western US by reducshying future fire emissions Frontiers in Ecology and the Environment 1083ndash90
Cathcart J A A Ager A McMahan M Finney and B Watt 2010 Carbon benefits from fuel treatshyments Pages 61ndash80 in T B Jain R T Graham and J Sandquist editors Integrated management of carbon sequestration and biomass utilization opportunities in a changing climate Proceedings of the 2009 National Silviculture Workshop Boise Idaho June 15ndash18 2009 USDA Forest Service Proshyceedings RMRS-P-61 Rocky Mountain Research Station Fort Collins Colorado USA
Chatfield A H 2005 Habitat selection by a California spotted owl population a landscape scale analysis using resource selection functions Thesis Univershysity of Minnesota St Paul Minnesota USA
Collins B M H A Kramer K Menning C Dilling-ham D Saah P A Stine and S L Stephens 2013 Modeling hazardous fire potential within a comshypleted fuel treatment network in the northern Sierra Nevada Forest Ecology and Management 310156ndash166
Collins B M S L Stephens J J Moghaddas and J Battles 2010 Challenges and approaches in planshyning fuel treatments across fire-excluded forested landscapes Journal of Forestry 10824ndash31
Collins B M S L Stephens G B Roller and J J Battles 2011 Simulating fire and forest dynamics for a landscape fuel treatment project in the Sierra Nevada Forest Science 5777ndash88
Coppoletta M K E Merriam and B M Collins 2016 Post-fire vegetation and fuel development influences fire severity patterns in reburns Ecologishycal Applications 26686ndash699
Crookston N L and A O Finley 2008 yaimpute an r package for knn imputation Journal of Statistical Software 231ndash16
Crookston N L M Moeur and D L Renner 2002 Userrsquos guide to the most similar neighbor imputashytion program version 2 General Technical Report RMRS-GTR-96 USDA Forest Service Rocky Mountain Research Station Ogden Utah USA
wwwesajournalsorg 18 January 2017 Volume 8(1) Article e01648
CHIONO ET AL
Crosby J and C Chandler 1966 Get the most from your windspeed observations Fire Control Notes 2712ndash13
Dailey S J Fites A Reiner and S Mori 2008 Fire behavior and effects in fuel treatments and proshytected habitat on the Moonlight fire Fire Behavior Assessment Team wwwfsfedusadaptivemana gementprojectsFBATdocsMoonlightFinal_8_6_08 pdf
Dennison P E S C Brewer J D Arnold and M A Moritz 2014 Large wildfire trends in the western United States 1984ndash2011 Geophysical Research Letters 412928ndash2933
Dixon G E 2002 Essential FVS a userrsquos guide to the forest vegetation simulator Pages 193 USDA Forest Service Forest Management Service Center Fort Collins Colorado USA
Dore S T E Kolb M Montes-Helu B W Sullivan W D Winslow S C Hart J P Kaye G W Koch and B A Hungate 2008 Long-term impact of a stand-replacing fire on ecosystem CO2 exchange of a ponderosa pine forest Global Change Biology 141ndash20
Dore S M Montes-Helu S C Hart B A Hungate G W Koch J B Moon A J Finkral and T E Kolb 2012 Recovery of ponderosa pine ecosystem carbon and water fluxes from thinning and stand-replacing fire Global Change Biology 183171ndash3185
Dow C J B M Collins and S L Stephens 2016 Incorporating resource protection constraints in an analysis of landscape fuel-treatment effectiveness in the Northern Sierra Nevada California USA Environmental Management 571ndash15
Eidenshink J B Schwind K Brewer Z Zhu B Quayle and S Howard 2007 A project for monshyitoring trends in burn severity Fire Ecology 33ndash21
Evans A M and A J Finkral 2009 From renewable energy to fire risk reduction a synthesis of biomass harvesting and utilization case studies in US forshyests GCB Bioenergy 1211ndash219
Finkral A J and A M Evans 2008 The effects of a thinning treatment on carbon stocks in a northern Arizona ponderosa pine forest Forest Ecology and Management 2552743ndash2750
Finney M A 2001 Design of regular landscape fuel treatment patterns for modifying fire growth and behavior Forest Science 47219ndash228
Finney M A 2002 Fire growth using minimum travel time methods Canadian Journal of Forest Research 321420ndash1424
Finney M A 2006 An overview of FlamMap fire modeling capabilities Pages 213ndash220 in P L Andrews and B W Butler editors Proceedings of Fuels ManagementndashHow to Measure Success Research Paper RMRS-P-41 USDA Forest Service
Rocky Mountain Research Station Portland Oregon USA
Finney M A R C Seli C W McHugh A A Ager B Bahro and J K Agee 2007 Simulation of longshyterm landscape-level fuel treatment effects on large wildfires International Journal of Wildland Fire 16712ndash727
Fulme P Z J E Crouse J P Roccaforte and E L Kalies 2012 Do thinning andor burning treatments in western USA ponderosa or Jeffrey pine-dominated forests help restore natural fire behavior Forest Ecology and Management 26968ndash81
Gaines W L R J Harrod J Dickinson A L Lyons and K Halupka 2010 Integration of Northern spotted owl habitat and fuels treatments in the eastern Cascades Washington USA Forest Ecolshyogy and Management 2602045ndash2052
Gaines W L R A Strand and S D Piper 1997 Effects of the hatchery complex fires on northern spotted owls in the eastern Washington Cascades Pages 123ndash129 in J N Greenlee editor Proceedings of the Fire Effects on Rare and Endangered Species and Habitats Conference Coeur DrsquoAlene Idaho International Association of Wildfire and Forestry Hot Springs South Dakota USA
Hall S A and I C Burke 2006 Considerations for characterizing fuels as inputs for fire behavior models Forest Ecology and Management 227 102ndash114
Hoover C and S Rebain 2008 The Kane Experimenshytal Forest carbon inventory carbon reporting with FVS Pages 13ndash15 in R N Havis and N L Crookston editors Third Forest Vegetation Simushylator Conference Fort Collins Colorado February 13ndash15 2007 USDA Forest Service Rocky Mountain Research Station Fort Collins Colorado USA
Hurteau M and M North 2009 Fuel treatment effects on tree-based forest carbon storage and emissions under modeled wildfire scenarios Fronshytiers in Ecology and the Environment 7409ndash414
Hurteau M D and M North 2010 Carbon recovery rates following different wildfire risk mitigation treatments Forest Ecology and Management 260 930ndash937
Hurteau M D M T Stoddard and P Z Fulme 2011 The carbon costs of mitigating high-severity wildshyfire in southwestern ponderosa pine Global Change Biology 171516ndash1521
Jenness J S P Beier and J L Ganey 2004 Associashytions between forest fire and Mexican spotted owls Forest Science 50765ndash772
Jones G M R Gutimerrez D J Tempel S A Whitmore W J Berigan and M Z Peery 2016 Megafires an emerging threat to old-forest species Frontiers in Ecology and the Environment 14300ndash306
wwwesajournalsorg 19 January 2017 Volume 8(1) Article e01648
CHIONO ET AL
Laymon S A 1988 Ecology of the spotted owl in the central Sierra Nevada California Dissertation University of California Berkeley California USA
Lenihan J M D Bachelet R P Neilson and R Drapek 2008 Response of vegetation distribution ecosystem productivity and fire to climate change scenarios for California Climatic Change 87215ndash230
Lydersen J M B M Collins E E Knapp G B Roller and S Stephens 2015 Relating fuel loads to overshystorey structure and composition in a fire-excluded Sierra Nevada mixed conifer forest International Journal of Wildland Fire 24484ndash494
Malmsheimer R J Bowyer J Fried E Gee R Islar R Miner I E Munn E Oneil and W C Stewart 2011 Managing forests because carbon matters integrating energy products and land manageshyment policy Journal of Forestry 109S7ndashS50
Marlon J R et al 2012 Long-term perspective on wildfires in the western USA Proceedings of the National Academy of Sciences of the United States of America 109E535ndashE543
Martinson E J and P N Omi 2002 Performance of fuel treatments subjected to wildfires Pages 7ndash13 in P N Omi and L A Joyce editors Conference on Fire Fuel Treatments and Ecological Restorashytion USDA Forest Service Rocky Mountain Research Station Fort Collins Colorado USA
Martinson E J and P N Omi 2013 Fuel treatments and fire severity a meta-analysis Pages 38 USDA Forest Service Rocky Mountain Research Station Fort Collins Colorado USA
Mayer K E and W F Laudenslayer 1988 A guide to wildlife habitats of California California Departshyment of Forestry and Fire Protection Sacramento California USA
McKenzie D Z Gedalof D L Peterson and P Mote 2004 Climatic change wildfire and conservation Conservation Biology 18890ndash902
Mercer D E and J P Prestemon 2005 Comparing production function models for wildfire risk analyshysis in the wildlandndashurban interface Forest Policy and Economics 7782ndash795
Miller J D and H Safford 2012 Trends in wildfire severity 1984 to 2010 in the Sierra Nevada Modoc Plateau and southern Cascades California USA Fire Ecology 841ndash57
Miller J H Safford M Crimmins and A Thode 2009 Quantitative evidence for increasing forest fire severity in the Sierra Nevada and southern Cascade mountains California and Nevada USA Ecosystems 1216ndash32
North M 2012 Managing Sierra Nevada forests PSWshyGTR-237 USDA Forest Service Pacific Southwest Research Station Albany California USA
North M P and M D Hurteau 2011 High-severity wildfire effects on carbon stocks and emissions in fuels treated and untreated forest Forest Ecology and Management 2611115ndash1120
North M M Hurteau and J Innes 2009a Fire supshypression and fuels treatment effects on mixed-conifer carbon stocks and emissions Ecological Applications 191385ndash1396
North M P A Stine K OrsquoHara W Zielinski and S Stephens 2009b An ecosystem management strategy for Sierran mixed-conifer forests General Technical Report PSW-GTR-220 USDA Forest Service Pacific Southwest Research Station Albany California USA
Parisien M-A S Snetsinger J A Greenberg C R Nelson T Schoennagel S Z Dobrowski and M A Moritz 2012 Spatial variability in wildfire probability across the western United States Intershynational Journal of Wildland Fire 21313ndash327
Penman J M Gytarsky T Hiraishi T Krug D Kruger R Pipatti L Buendia K Miwa T Ngara and K Tanabe 2003 Good practice guidance for land use land-use change and forestry Institute for Global Environmental Strategies for the Intergovshyernmental Panel on Climate Change Hayama Kanagawa Japan
Pollet J and P N Omi 2002 Effect of thinning and prescribed burning on crown fire severity in ponderosa pine forests International Journal of Wildland Fire 111ndash10
Prather J W R F Noss and T D Sisk 2008 Real versus perceived conflicts between restoration of ponderosa pine forests and conservation of the Mexican spotted owl Forest Policy and Economics 10140ndash150
Preisler H K D R Brillinger R E Burgan and J Benoit 2004 Probability based models for estimation of wildfire risk International Journal of Wildland Fire 13133ndash142
Rebain S E Reinhardt N Crookston S Beukema W Kurz and J Greenough 2009 The fire and fuels extension to the Forest Vegetation Simulator Addendum to RMRS-GTR-119 USDA Forest Service and ESSA Technologies Ltd Fort Collins Colorado USA
Reinhardt E D and N L Crookston 2003 The fire and fuels extension to the forest vegetation simulashytor Pages 209 RMRS-GTR-116 USDA Forest Sershyvice Rocky Mountain Research Station Ogden Utah USA
Reinhardt E and L Holsinger 2010 Effects of fuel treatments on carbon-disturbance relationshyships in forests of the northern Rocky Mountains Forest Ecology and Management 2591427ndash1435
wwwesajournalsorg 20 January 2017 Volume 8(1) Article e01648
CHIONO ET AL
Reinhardt E D R E Keane D E Calkin and J D Cohen 2008 Objectives and considerations for wildland fuel treatment in forested ecosystems of the interior western United States Forest Ecology and Management 2561997ndash2006
Ritchie M W C N Skinner and T A Hamilton 2007 Probability of tree survival after wildfire in an interior pine forest of northern California effects of thinning and prescribed fire Forest Ecolshyogy and Management 247200ndash208
Roloff G J S P Mealey and J D Bailey 2012 Comshyparative hazard assessment for protected species in a fire-prone landscape Forest Ecology and Manshyagement 2771ndash10
Rothermel R C 1972 A mathematical model for preshydicting fire spread in wildland fuels Research Paper INT-115 USDA Forest Service Intermounshytain Forest and Range Experiment Station Ogden Utah USA
Safford H D 2008 Fire severity in fuel treatments American River Complex fire Tahoe National Forest California Unpublished Report USDA Forest Service Pacific Southwest Region Vallejo California USA
Schmidt D A A H Taylor and C N Skinner 2008 The influence of fuels treatment and landscape arrangement on simulated fire behavior Southern Cascade range California Forest Ecology and Management 2553170ndash3184
Scott J H and R E Burgan 2005 Standard fire behavior fuel models a comprehensive set for use with Rothermelrsquos surface fire spread model General Technical Report RMRS-GTR-153 USDA Forest Service Rocky Mountain Research Station Fort Collins Colorado USA
Scott J H M P Thompson and J W Gilbertson-Day 2016 Examining alternative fuel management strategies and the relative contribution of National Forest System land to wildfire risk to adjacent homesndasha pilot assessment on the Sierra National Forest California USA Forest Ecology and Manshyagement 36229ndash37
Smith J E and L S Heath 2002 A model of forest floor carbon mass for United States forest types Research Paper NE-722 USDA Forest Service Northeastern Research Station Newtown Square Pennsylvania USA
Stephens S L 2005 Forest fire causes and extent on United States Forest Service lands International Journal of Wildland Fire 14213ndash222
Stephens S L B M Collins E Biber and P Z Fulme 2016a US federal fire and forest policy emphasizshying resilience in dry forests Ecosphere 7e01584
Stephens S L J D Miller B M Collins M P North J J Keane and S L Roberts 2016b Wildfire impacts on California Spotted Owl nesting habitat in the Sierra Nevada Ecosphere 7e01584
Stephens S L J J Moghaddas B R Hartsough E E Y Moghaddas and N E Clinton 2009 Fuel treatshyment effects on stand-level carbon pools treatshyment-related emissions and fire risk in a Sierra Nevada mixed-conifer forest Canadian Journal of Forest Research 391538ndash1547
Stephens S L et al 2012 Fuel treatment impacts on estimated wildfire carbon loss from forests in Monshytana Oregon California and Arizona Ecosphere 31ndash17
Tempel D et al 2015 Evaluating short- and longshyterm impacts of fuels treatments and simulated wildfire on an old-forest species Ecosphere 61ndash19
USDA Forest Service 2004 Sierra Nevada Forest Plan Amendment Final supplemental environmental impact statement Record of decision Publication R5-MB-046 USDA Forest Service Pacific Southshywest Region Vallejo California USA
Van Wagner C E 1977 Conditions for the start and spread of crown fire Canadian Journal of Forest Research 723ndash34
Verner J K S McKelvey B R Noon R Gutimerrez G I Gould Jr and T W Beck 1992 Assessment of the current status of the California spotted owl with recommendations for management Pages 3ndash27 in J Verner K S McKelvey B R Noon R Gutimerrez G I Gould Jr and T W Beck edishytors The California Spotted Owl a technical assessment of its current status PSW-GTR-133 USDA Forest Service Albany California USA
Westerling A B Bryant H Preisler T Holmes H Hidalgo T Das and S Shrestha 2011 Climate change and growth scenarios for California wildshyfire Climatic Change 109445ndash463
Westerling A L H G Hidalgo D R Cayan and T W Swetnam 2006 Warming and earlier Spring increase Western US Forest Wildfire Activity Science 313940ndash943
Wiedinmyer C and M D Hurteau 2010 Prescribed fire as a means of reducing forest carbon emissions in the Western United States Environmental Science amp Technology 441926ndash1932
SUPPORTING INFORMATION
Additional Supporting Information may be found online at httponlinelibrarywileycomdoi101002ecs2 1648full
wwwesajournalsorg 21 January 2017 Volume 8(1) Article e01648
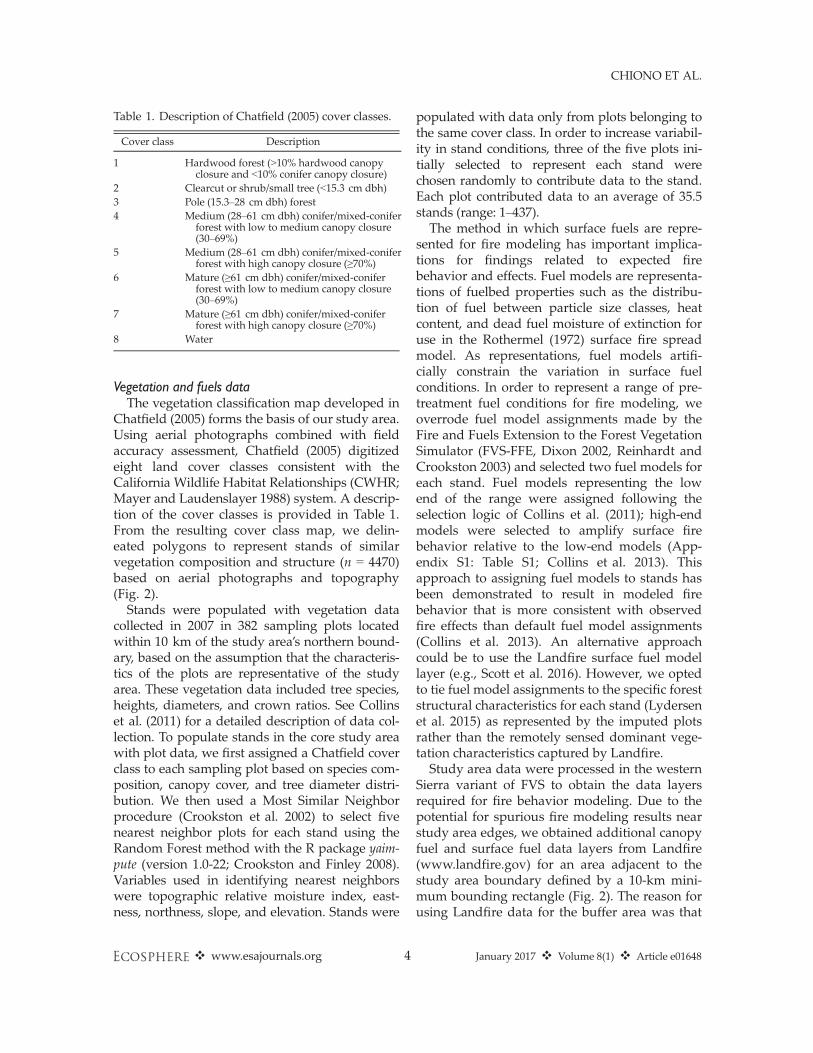
CHIONO ET AL
Table 1 Description of Chatfield (2005) cover classes
Cover class Description
1 Hardwood forest (gt10 hardwood canopy closure and lt10 conifer canopy closure)
2 Clearcut or shrubsmall tree (lt153 cm dbh) 3 Pole (153ndash28 cm dbh) forest 4 Medium (28ndash61 cm dbh) conifermixed-conifer
forest with low to medium canopy closure (30ndash69)
5 Medium (28ndash61 cm dbh) conifermixed-conifer forest with high canopy closure (ge70)
6 Mature (ge61 cm dbh) conifermixed-conifer forest with low to medium canopy closure (30ndash69)
7 Mature (ge61 cm dbh) conifermixed-conifer forest with high canopy closure (ge70)
8 Water
Vegetation and fuels data The vegetation classification map developed in
Chatfield (2005) forms the basis of our study area Using aerial photographs combined with field accuracy assessment Chatfield (2005) digitized eight land cover classes consistent with the California Wildlife Habitat Relationships (CWHR Mayer and Laudenslayer 1988) system A descripshytion of the cover classes is provided in Table 1 From the resulting cover class map we delinshyeated polygons to represent stands of similar vegetation composition and structure (n = 4470) based on aerial photographs and topography (Fig 2)
Stands were populated with vegetation data collected in 2007 in 382 sampling plots located within 10 km of the study arearsquos northern boundshyary based on the assumption that the characterisshytics of the plots are representative of the study area These vegetation data included tree species heights diameters and crown ratios See Collins et al (2011) for a detailed description of data colshylection To populate stands in the core study area with plot data we first assigned a Chatfield cover class to each sampling plot based on species comshyposition canopy cover and tree diameter distrishybution We then used a Most Similar Neighbor procedure (Crookston et al 2002) to select five nearest neighbor plots for each stand using the Random Forest method with the R package yaimshypute (version 10-22 Crookston and Finley 2008) Variables used in identifying nearest neighbors were topographic relative moisture index eastshyness northness slope and elevation Stands were
populated with data only from plots belonging to the same cover class In order to increase variabilshyity in stand conditions three of the five plots inishytially selected to represent each stand were chosen randomly to contribute data to the stand Each plot contributed data to an average of 355 stands (range 1ndash437) The method in which surface fuels are represhy
sented for fire modeling has important implicashytions for findings related to expected fire behavior and effects Fuel models are representashytions of fuelbed properties such as the distribushytion of fuel between particle size classes heat content and dead fuel moisture of extinction for use in the Rothermel (1972) surface fire spread model As representations fuel models artifishycially constrain the variation in surface fuel conditions In order to represent a range of preshytreatment fuel conditions for fire modeling we overrode fuel model assignments made by the Fire and Fuels Extension to the Forest Vegetation Simulator (FVS-FFE Dixon 2002 Reinhardt and Crookston 2003) and selected two fuel models for each stand Fuel models representing the low end of the range were assigned following the selection logic of Collins et al (2011) high-end models were selected to amplify surface fire behavior relative to the low-end models (Appshyendix S1 Table S1 Collins et al 2013) This approach to assigning fuel models to stands has been demonstrated to result in modeled fire behavior that is more consistent with observed fire effects than default fuel model assignments (Collins et al 2013) An alternative approach could be to use the Landfire surface fuel model layer (eg Scott et al 2016) However we opted to tie fuel model assignments to the specific forest structural characteristics for each stand (Lydersen et al 2015) as represented by the imputed plots rather than the remotely sensed dominant vegeshytation characteristics captured by Landfire Study area data were processed in the western
Sierra variant of FVS to obtain the data layers required for fire behavior modeling Due to the potential for spurious fire modeling results near study area edges we obtained additional canopy fuel and surface fuel data layers from Landfire (wwwlandfiregov) for an area adjacent to the study area boundary defined by a 10-km minishymum bounding rectangle (Fig 2) The reason for using Landfire data for the buffer area was that
wwwesajournalsorg 4 January 2017 Volume 8(1) Article e01648
CHIONO ET AL
Fig 2 Land cover classes (Chatfield 2005) within the core study area stand polygons and 10-km minimum bounding rectangle for fire spread modeling See Table 1 for description of classes
we did not have a vegetation map with a similar classification scheme and level of detail outside of our core study area (Fig 2) We merged study area and Landfire data layers to build 90 9 90 m resolution landscape files for fire behavior modshyeling in Randig described below This allowed us to include wildfires originating outside of the study area in our analysis
Wildfire fuel treatments and carbon loss modeling
We used ArcFuels (Ager et al 2006) to streamshyline fuel treatment planning and analysis of effects ArcFuels is a library of ArcGIS macros that facilitates communication among the array of models and other programs commonly used in fuel treatment planning at the landscape scale (vegetation growth and yield simulators fire
behavior models ArcGIS and desktop software) Our process depicted in Fig 3 involved
1 fire behavior modeling in Randig (Finney 2006) to identify stands with high fire hazard
2 prioritizing stands for treatment using the Landscape Treatment Designer (LTD) (Ager et al 2012)
3 modeling fuel treatments in FVS-FFE 4 fire behavior modeling for the post-treatment
and untreated landscapes and 5 developing C loss functions from simulated
burning with FVS-FFE
Conditional burn probability and flame lengthmdash Wildfire growth simulations were performed in Randig a command-line version of FlamMap (Finney 2006) Randig uses the minimum travel
wwwesajournalsorg 5 January 2017 Volume 8(1) Article e01648
CHIONO ET AL
Fig 3 Work flow used in the present study to evaluate landscape fuel treatment effects on wildfire hazard and carbon pools and emissions
time algorithm (Finney 2002) to simulate fire growth during discrete burn periods under conshystant weather conditions Simulating many burn periods with Randig generates a burn probability surface for the study landscape Simulations were conducted at 90-m resolution for computashytional efficiency We simulated 80000 randomly located ignitions with a 5-h burn period for all scenarios including no treatment The burn pershyiod was selected to produce fire sizes that approximated area burned in spread events of historical large wildfires near the study area Large daily spread events in previous wildfires in the northern Sierra Nevada have burned gt2000 ha (Dailey et al 2008 Safford 2008) average fire sizes from our simulations ranged from 715 to 2133 ha (The exceptional growth observed in the 2014 King Fire is addressed in a subsequent subsection) The combination of ignishytion number and burn period was sufficient to ensure that 99 of pixels in burnable fuel types experienced fire at least once (average 64ndash1891 fires)
Randig outputs were used both in prioritizing stands for treatment and in evaluating the effects of treatment We performed one Randig run for each fuel model range (low and high) within each scenario (no treatment S1 S2 and S3) using landshyscape files representing the year immediately folshylowing treatment 2009 Simulations were also completed for the 2007 pre-treatment landscape for use in treatment prioritization for a total of 10 modeling runs
To evaluate the effect of treatments on fire risk and fire hazard we assessed changes in condishytional burn probability (CBP) and conditional flame length (CFL) between the treatment scenarshyios and the untreated landscape based on wildfire simulations It is important to note that the burn probabilities estimated in this study are not empirshyical estimates of the likelihood of wildfire occurshyrence (eg Preisler et al 2004 Brillinger et al 2006 Parisien et al 2012) Rather we use CBP the likelihood that a pixel will burn given a single ignition in the study area and assuming the simushylation conditions described From the simulation of many fires Randig calculates a pixel-level disshytribution of flame lengths (FL) in twenty 05-m classes between 05 and 10 m Conditional flame length the probability-weighted FL given that a fire occurs (Ager et al 2010) was calculated by combining burn probability estimates with FL disshytributions summarized at the stand level
( )20 BPiCFL frac14 Fi X
BPifrac141
where BP is CBP BPi is the probability of burning at the ith FL class and Fi is the midpoint FL of the ith FL class To estimate the effect of treatment on fire risk
and hazard we first computed average pixel-level BP and CFL for treated and untreated stands in each scenario Then we calculated average BP and CFL for the same stands within the no-treatment landscape The effect of each treatment scenario
wwwesajournalsorg 6 January 2017 Volume 8(1) Article e01648
CHIONO ET AL
was estimated as the proportional change in each fire metric between the untreated and treated landscapes
We obtained weather and fuel moisture inputs for wildfire modeling from the Bald Mountain and Hell Hole remote automated weather stations (RAWS) based on recommendations from local USDA Forest Service fire and fuel managers We used 95th percentile weather conditions from the 1 June to 30 September period (1989ndash2013) This period represents the typical fire season for the study area encompassing 85 of wildfires and 93 of the area burned within a 161-km (100-mi) radius of the study area between 1984 and 2012 (Monitoring Trends in Burn Severity database Eidenshink et al 2007)
Weather and fuel moisture inputs for wildfire simulations are provided in Appendix S1 Table S2 These conditions are similar to those occurring during recent large wildfires in and near the study area (eg 2001 Star Fire 2008 American River Complex 2013 American Fire) In addition to using Randig to model fire spread and intensity we used FVS-FFE to project effects of prescribed fires and wildfires (described below) Wind inputs varied somewhat between fire models FVS-FFE requires only a single wind speed while multiple wind scenarios were applied in Randig fire simulations Wind speeds azimuths and relative proportions for Randig simulations followed Collins et al (2011)
Spatial optimization of fuel treatmentsmdashStands were selected for treatment based on modeled pre-treatment wildfire hazard and stand structure using the LTD which allows multiple objectives to be combined in the spatial prioritization of fuel treatments Three treatment scenarios varied in the land designations eligible for treatment
Scenario 1 Public land excluding spotted owl habitat Scenario 2 Public land including spotted owl habitat Scenario 3 All lands public and private ownerships
Objectives were consistent across treatment sceshynarios but differed in the land area available for treatment For all LTD runs we directed the model to maximize a total score that comprised numeric stand structure and fire hazard rankings
(Appendix S1 Table S3) The stand structure rankshying (0 1 2) was based on cover class category Cover classes most conducive to thinning were ranked highest Fire hazard ranking (0 2 3) was assigned according to stand-level CFL as calcushylated from FL probability files generated in Randig simulations for the 2007 pre-treatment landscape To isolate the effect of varying land designashy
tions in the area available for treatment total area treated was held constant between scenarios (20 of the core study area) In order to exclude small spatially isolated treatment areas that would be impractical from a management standshypoint we required a minimum treatment area of 121 ha (30 ac) To achieve this the treatment prishyoritization process was iterative In each step we eliminated all stands selected by LTD for treatshyment that were not contiguous with a ge121-ha treatment area The rationale for this is based on the cost associated with re-locating equipment necessary to implement mechanical andor fire treatments (D Errington personal communication El Dorado National Forest) We then calculated the treatment area remaining This process was repeated until total treatment area summed to the target area (~11080 ha) We simulated fuel treatments using FVS-FFE
Stands selected for treatment were assigned one of 13 treatment prescriptions depending on topogshyraphy vegetation cover class ownership and overlap with owl PACs (Appendix S1 Table S4) In an effort to promote landscape-scale heteroshygeneity basal area targets for commercial thinning on public land varied with topography (aspect and slope position canyondrainage bottom mid-slope and ridge) (North et al 2009b North 2012) All thinning treatments were simulated as thinshyfrom-below harvests and thinning within owl PACs was limited to hand thinning We assumed that trees ge254 cm (10 in) dbh would be harshyvested for wood products (FVS VOLUME keyshyword) and that the biomass contained in smaller trees and in the tops and branches of larger trees would be utilized as feedstocks for bioenergy conshyversion Therefore all thinning (except hand thinshyning) treatments were simulated as whole tree harvests (FVS keyword YARDLOSS) Treatments preferentially retained fire-resistant species with relative retention preference as follows black oakgtponderosa pinegtsugar pinegtDouglas-firgtinshycense-cedargtred firegtwhite fir
wwwesajournalsorg 7 January 2017 Volume 8(1) Article e01648
CHIONO ET AL
Prescribed fires were simulated in the year folshylowing thinning (2009) Broadcast burning was applied except within owl PACs on private land and on steep slopes (gt35) where follow-up burning was limited to pile burning To capture a more realistic range of post-treatment surface fuel conditions stands selected for treatment were randomly assigned to one of three post-treatment fuel models for each fuel model range TL1 (181) TL3 (183) or TL5 (185) (low range) TL3 (183) TL5 (185) or SB1 (201) (high range) (Scott and Burgan 2005) Weather conditions for prescribed fire modeling were based on recomshymendations from a local fire management speshycialist (B Ebert personal communication)
Biomass and carbon effects of treatmentmdashSimushylated treatment prescriptions varied according to site characteristics such as topography and land ownership (Appendix S1 Table S4) We tracked the C emitted from burning removed during harshyvesting and contained in live and dead aboveshyground biomass with FVS-FFE carbon reports (Reinhardt and Crookston 2003 Hoover and Rebain 2008) FVS converts biomass to units of C using a multiplier of 05 for all live and dead C pools (Penman et al 2003) except duff and litter pools for which a multiplier of 037 is applied (Smith and Heath 2002) Stand C is partitioned into a number of pools including aboveground live tree standing dead tree herb and shrub litter and duff woody surface fuel and belowground live and dead tree root C we limited our analysis to aboveground pools of C FVS-FFE also reports the C emitted during burning and that conshytained in harvested biomass (Rebain et al 2009) Treatment effects were assessed by comparing expected aboveground biomass C and emissions between the treated and untreated landscapes
We developed C loss functions for each FVS treelist by simulating burning with FVS-FFE at a range of FLs (SIMFIRE and FLAMEADJ keyshywords) (Ager et al 2010 Cathcart et al 2010) The FL values supplied to FLAMEADJ were the 20 midpoints of the 05-m FL classes (05ndash10 m) found in Randig FL probability output files As noted by Ager et al (2010) and Cathcart et al (2010) it is not currently possible to precisely match fire behaviors between Randig and FVS The FLs reported in Randig outputs are the total of surface fire and if initiated crown fire In
contrast the FLs supplied to FVS-FFE via the FLAMEADJ keyword are treated as surface fire FLs and when FLAMEADJ is parameterized with only a predefined FL the model does not use the input FL in crown fire simulations To estimate fire effects in FVS-FFE we parameterized FLAshyMEADJ with percent crowning (PC) and scorch height in addition to FL Scorch height and critical FL for crown fire initiation (FLCRIT) were based on Van Wagner (1977) We estimated PC using a downward concave function where PC = 32 when flame length = FLCRIT and PC = 100 when FL is ge30 of stand top height (the average height of the 40 largest trees by diameter) (Ager et al 2010 A Ager personal communication) The derived C loss functions were combined
with the probabilistic estimates of surface fire behavior produced in Randig simulations to estishymate the ldquoexpected Crdquo emitted in wildfire or conshytained in biomass We estimated expected C emissions and post-fire biomass C for each pixel as follows
20 X[ ]Efrac12 ]C i frac14 BPij X Cij
ifrac140
where E[C]j is the expected wildfire emissions of C from pixel j or biomass C in pixel j in mass per unit area BPij is the probability of burning at the ith FL class for pixel j and Cij is the C emitshyted from pixel j or the biomass C remaining in pixel j post-wildfire given burning at the ith FL class Expected C emissions and biomass C were
summed across all pixels in the core study area to obtain total expected wildfire emissions and expected terrestrial C for each treatment scenario In order to compare our modeling results to
other analyses that reported wildfire emissions on a per area basis we used a different method to estishymate C emissions per area burned Because wildshyfires burned both the core and buffer areas of our study landscape while emissions were estimated only in the core area we used conditional expected wildfire emissions to approximate the emissions from a wildfire burning entirely within the core study area Conditional expected emissions are those produced for an area given that the area is burned Conditional emissions were estimated for each pixel as follows
wwwesajournalsorg 8 January 2017 Volume 8(1) Article e01648
CHIONO ET AL
Table 2 Total area and proportion of area treated by category in each treatment scenario
SC1 SC2 SC3
Proportion of Proportion of Proportion of Treatment category Area (ha) area treated Area (ha) area treated Area (ha) area treated
Treated 11081 100 11082 100 11081 100 Avail for treatmentdagger 22042 199 28998 262 45647 412 Owl habitat treated 00 000 2769 025 1127 010 Private land treated 00 000 00 000 5685 051 Hand thin 1499 014 3819 034 1612 015 Biomass thin 8404 076 7240 065 9470 085 Commercial thin 7765 070 6916 062 9470 085 Broadcast burn 9410 085 7247 065 3785 034 Pile burn 1671 015 3835 035 7296 066
dagger Total land area potentially available for treatment in each scenario The area available for treatment increased from Scenarshyios 1 to 3 as restrictions on the area available for treatment were relaxed
20 X C WCfrac12 ]j frac14
BPij X WCijBPjifrac141
where C[WC]j is the C emitted by wildfire from pixel j in mass per unit area BPj is the probability that pixel j is burned BPij is the probability of burning at the ith FL class and WCij is the C emitted from pixel j when burned at the ith FL class
Conditional expected emissions were averaged across all pixels to obtain an estimate of wildfire emissions per area burned
Large fire revisionmdashWildfire modeling was calishybrated to produce fire sizes that approximated area burned in spread events of historical large wildfires near the study area However during the course of the study a very large fire encounshytered our study area The King Fire began on 13 September 2014 in El Dorado County and burned 39545 hamdashmore than an order of magnishytude greater than our modeled wildfires includshying gt25 of the study area Given the potential for very large wildfires in this region demonshystrated by the King Fire we completed addishytional wildfire modeling to estimate the C effects of treatment given the occurrence of a very large fire
Randig modeling was repeated for the no-treatment and S3 scenarios using the high fuel model range and a revised burn period number of simulated ignitions wind speed and wind directions Burn period was increased from 5 to 12 h number of ignitions was reduced by half to 40000 Wind directions and relative probabilities (Appendix S1 Table S5) were those recorded at
Hell Hole RAWS between 0400 and 1900 hours on 17 September the day of the King Firersquos larshygest spread event We used the probable 1-min maximum wind speed as calculated from the maximum gust recorded on that day 33 kmh (205 mph) based on maximum gust of 547 kmh (34 mph) (Crosby and Chandler 1966) These settings produced average fire sizes of NT = 10757 ha (no-treatment scenario) and 8070 ha (S3) Average fire size was limited by the size of our buffered study area Longer burn periods resulted in an increasing number of simulated wildfires that burned to the study area boundary
RESULTS
Treatment simulation Table 2 provides a summary of the area treashy
ted in each scenario Scenario 1 (S1) was the most restrictive with respect to the land area available for treatment which more than doushybled between S1 and S3 Because treatment preshyscriptions varied with land designation (public owl PAC private) and the designations availshyable for treatment varied between scenarios the relative proportions of thinning and burning methods also varied between scenarios Comshymercial and biomass thinning were applied most frequently in S3 which permitted treatshyment of private land Spotted owl activity censhyters composed 25 of the area treated in S2 vs 10 in S3 and 0 in S1 the scenario in which PACs were not subject to treatment As a result the area treated with hand thinning in S2 was more than twice that in S1 and S3 Due to the
wwwesajournalsorg 9 January 2017 Volume 8(1) Article e01648
CHIONO ET AL
Fig 4 Low fuel model range treatment locations and difference in conditional burn probability (CBP) and conshyditional flame length (CFL) (untreated-treated) for each treatment scenario Negative values indicate an increase in CBP or CFL while positive values represent a reduction CBP is the likelihood that a pixel will burn given a single ignition on the landscape and assuming the simulation conditions described in Appendix S1 Table S1 and in the text Conditional flame length is the probability-weighted flame length given these same assumptions
inclusion of PACs in S2 and both PACs and prishyvate land in S3 the proportion of area treated with pile burning increased between S1 and S3 while broadcast burn area exhibited an opposite trend Despite the variation in land designations available for treatment the pattern of treatshyment placement was generally similar between scenarios with treatments concentrated in the central and eastern portions of the study area (Figs 4 5)
Landscape-scale burn probability and fire hazard Conditional burn probabilitymdashThe pixel-to-pixel
change in CBP between the untreated scenario and each treatment scenario is mapped in Figs 4 (LO FM) and 5 (HI FM) Treatment reduced landshyscape burn probability by approximately 50 (Table 3) from 00124 (NT) to 00062 (S1) 00059 (S2) and 00055 (S3) Within treatment units avershyage CBP fell by 69ndash76 to 00033ndash00035 outside of treated stands CBP fell to 00060ndash00069 Some
wwwesajournalsorg 10 January 2017 Volume 8(1) Article e01648
CHIONO ET AL
Fig 5 Treatment locations and high fuel model range difference in conditional burn probability and condishytional flame length (untreated-treated) for each treatment scenario
increases in CBP were also observed particularly for the low fuel model range (Fig 4)
The influence of treatment on owl PAC likelishyhood of burning was similar to that observed for stands in general For treated PACs average CBP fell by ~70 relative to no treatment for the same stands Although PACs were not eligible for treatment in S1 all treatment scenarios had a large impact on estimated PAC CBP Average PAC CBP was reduced from 0013 to 00063 in S1 00049 in S2 and 00054 in S3 a 49ndash64 decrease relative to PACs in the no-treatment landscape (Table 3)
Fire hazardmdashTreatments reduced average landshyscape CFL by ~1 m from 36 m (NT) to 25ndash27 m Pixel-level CFL was reduced by a maximum of 80 m (LO FM) and 90 m (HI FM) Increases in CFL were also observed however particularly near the study arearsquos western and southwestern boundaries where treatments were least concentrated (Figs 4 5) Maximum pixel-level CFL increases were 25 m (LO FM) and 31 m (HI FM) Because fire hazard was used in prioritizing
stands for treatment the estimated pre-treatment CFL in stands selected for treatment (43ndash51 m)
wwwesajournalsorg 11 January 2017 Volume 8(1) Article e01648
CHIONO ET AL
Table 3 Proportional change in burn probability for treatment scenarios compared to the NT scenario
LO FM HI FM AVG
Stand type
S1 S2 S3 Proportional change
relative to NT
S1 S2 S3 Proportional change
relative to NT
S1 S2 S3 Proportional change
relative to NT
All PACs -045 -064 -056 -053 -063 -059 -049 -064 -057 Treated PACs NA -081 -076 NA -057 -067 NA -069 -072 Untreated PACs -045 -053 -051 -053 -054 -058 -049 -053 -054 All stands Treated stands
-044 -076
-048 -079
-053 -063
-050 -072
-053 -074
-056 -074
-047 -074
-050 -076
-054 -069
Untreated stands -035 -039 -049 -045 -047 -051 -040 -043 -050
Notes NT no treatment PACs protected activity centers Proportions are ratios of treatment values to no-treatment values as calculated for the same stands Treatment and no-treatment values were calculated as the average pixel value for the low and high fuel model range (LO FM and HI FM) within each stand category and treatment scenario
was greater than in stands not selected (32ndash 33 m) After treatment average CFL within treashyted stands fell to 13 (S1 and S2) and 17 m (S3) CFL in untreated stands was also reduced as a result of the influence of treatments on fire spread and intensity CFL fell by 05ndash08 m (9ndash 16) relative to CFL in the same stands within the no-treatment landscape (Table 4)
Although spotted owl PACs were not treated in S1 relative to PACs in the NT landscape PAC CFL was reduced by 10 (to 32 m) in S1 Treating PACs had a much larger impact on potential fire intensity however Average treashyted PAC CFL fell to 13 and 14 m in S2 and S3 respectively
Carbon consequences of landscape fuel treatments
Prior to treatment aboveground landscape carbon totaled 14705 tonnesha on average Treatments removed 14 of pre-treatment C from treated stands or 2374 tonnesha totaling
81772ndash119103 tonnes of C in harvested biomass and merchantable material (Tables 5 and 6) Both the treatment scenarios and the choice of
fuel models were important influences on estishymated C emissions from burning As the least restrictive treatment scenario in terms of treatshyment location and the only scenario to include treatment of private land where broadcast burnshying was precluded as a treatment option the S3 treatment scenario was associated with the lowshyest wildfire and prescribed burning emissions (Tables 5 and 6) For each treatment scenario expected wildfire emissions increased by more than an order of magnitude between the low and high fuel model ranges This difference was the result of increasing fire intensity as well as wildshyfire size Average wildfire size nearly doubled between fuel model ranges in the treatment sceshynarios and tripled in the no-treatment scenario (Fig 6) For a given treatment scenario wildfire emissions on a per hectare basis were approxishymately two tonnes greater for the high fuel
Table 4 Proportional change in conditional flame length for treatment scenarios compared to the NT scenario
LO FM HI FM AVG
Stand type
S1 S2 S3 Proportional change
relative to NT
S1 S2 S3 Proportional change
relative to NT
S1 S2 S3 Proportional change
relative to NT
All PACs -009 -042 -028 -012 -043 -027 -010 -042 -028 Treated PACs NA -071 -075 NA -071 -073 NA -071 -074 Untreated PACs -009 -014 -011 -012 -017 -014 -010 -016 -013 All stands -022 -026 -031 -025 -026 -028 -024 -026 -030 Treated stands -065 -069 -052 -071 -071 -073 -068 -070 -062 Untreated stands -008 -009 -021 -011 -012 -012 -009 -010 -016
Notes NT no treatment PACs protected activity centers Proportions are ratios of treatment values to no-treatment values as calculated for the same stands Treatment and no-treatment values were calculated as the average pixel value for the low and high fuel model range (LO FM and HI FM) within each stand category and treatment scenario
wwwesajournalsorg 12 January 2017 Volume 8(1) Article e01648
CHIONO ET AL
Table 5 Expected biomass carbon expected wildfire C emissions and C harvested and emitted in fuel treatshyments for NT and treatment (S1 S2 S3) scenarios using the low fuel model range in fire modeling
Carbon pool NT S1 S2 S3
Untreated stands Tonnes C Live 5004505 3915044 3695489 3954131 Dead 1845659 1421704 1378824 1466202 Wildfire emissions 2372 1137 1039 904
Treated stands Live 881358 1072625 826366 Dead 260089 299244 220932 All harvested biomass 88773 81772 119103 Prescribed fire emissions 178530 169693 122599 Wildfire emissions 48 56 61
All stands Live 5004505 4796402 4768113 4780497 Dead 1845659 1681793 1678068 1687135 Treatment (harvested and emitted) 267303 251465 241702 Wildfire emissions 2372 1186 1095 965
Grand totals 6852536 6746684 6698741 6710299
Notes LF indicates the large fire scenarios Expected C is that remaining in the core study area following treatment if applishycable and a random ignition and wildfire in the larger buffered study area as estimated from the simulation of many wildfires Live C is that contained in live aboveground herb shrub and tree biomass dead C is the C contained in litter duff woody surshyface fuel and aboveground portions of tree snags NT no treatment
model range than for the low range In contrast to the large influence of fuel model choice on wildfire emissions the effect of fuel model range on prescribed fire emissions was minimal with only a 1 increase in emissions between the low and high fuel model ranges for a given treatment scenario
Although treatment significantly reduced wildshyfire emissions combined emissions from preshyscribed burning on 20 of the landscape and wildfire exceeded wildfire emissions in the no-treatment scenarios (Tables 5 and 6) Relative to the no-treatment scenarios treatment reduced estimated wildfire emissions by approximately 54 (low fuel model range) 59 (high fuel model range) and 45 (large fire scenarios) Yet preshyscribed burning was a far more significant source of emissions than were wildfires of moderate size with emissions from treatment exceeding wildfire emissions by 111259ndash177344 tonnes Even for the large wildfire simulations where landscape treatments nearly halved estimated wildfire emisshysions the combined carbon emissions from preshyscribed burning and wildfire in the treatment scenario surpassed wildfire emissions in the no-treatment scenario by 45 (Table 6 Fig 7)
The total quantity of aboveground C expected to remain on the landscape following treatment
and a randomly ignited wildfire was greatest for the no-treatment scenarios (Tables 5 and 6) For modeled wildfires of moderate size treatment reduced both the live and dead C pools relative to the no-treatment scenarios and terrestrial C in the no-treatment scenarios was 4ndash5 greater (323316 ndash434960 tonnes) than in any of the treatment scenarios (Tables 5 and 6) In comparison under large wildfire conditions the treatment scenario retained slightly more live biomass C~15000 tonshynes or 03 more than the no-treatment scenario However treatment also reduced necromass C by 288000 tonnes (12) resulting in a 3 overall decrease in onsite biomass C relative to an untreshyated landscape (Table 6) The proportional changes in aboveground
biomass C pools between the treatment and no-treatment scenarios are summarized in Table 7 For all treatment scenarios the consumption of duff litter and downed woody fuels with preshyscribed burning contributed to a net reduction in these C pools relative to the untreated landscape Conversely treatments protected more C in the live understory (herb and shrub) poolmdashthe result of reduced wildfire size and intensity in the treatshyment scenarios Treatments in the moderate wildshyfire scenarios reduced live tree biomass C in comparison with no-treatment levels (Fig 8)
wwwesajournalsorg 13 January 2017 Volume 8(1) Article e01648
CHIONO ET AL
Table 6 Expected biomass carbon expected wildfire C emissions and C harvested and emitted in fuel treatshyments for NT and treatment (S1 S2 S3) scenarios using the high fuel model range in fire modeling
Carbon pool NT S1 S2 S3 NT-LF S3-LF
Untreated stands Tonnes C Live 4910239 3879854 3664690 3923358 4586898 3750774 Dead 1912429 1448947 1403313 1489629 2130034 1605591 Wildfire emissions 31831 12934 12001 11293 137622 68061
Treated stands Live 896670 1115918 853503 847374 Dead 280182 325628 238130 247744 All harvested biomass 88773 81772 119103 119103 Prescribed fire emissions 180357 171247 123539 123539 Wildfire emissions 798 951 986 8285
All stands Live 4910239 4776524 4780607 4776861 4586898 4598148 Dead 1912429 1729129 1728941 1727759 2130034 1853334 Treatment (harvested and emitted) 282862 265971 254921 254921 Wildfire emissions 31831 13732 12952 12279 137622 76346
Grand totals 6854499 6802247 6788471 6771820 6854554 6782749
Notes LF indicates the large fire scenarios Expected terrestrial C is that remaining in the core study area following treatshyment if applicable and a random ignition and wildfire in the larger buffered study area as estimated from the simulation of many wildfires Live C is that contained in live aboveground herb shrub and tree biomass dead C is the C contained in litter duff woody surface fuel and aboveground portions of tree snags NT no treatment
Notably in the large modeled wildfire scenarios (NT-LF and S3-LF) treatments resulted in a 400000-tonne increase in landscape-level live tree C over the no-treatment scenario
DISCUSSION
Fuel treatments in protected habitat Because there are often competing objectives
between managing forests for resilience to fire and drought and protecting owl habitat we assessed potential fire occurrence and hazard based on treatment scenarios that included and omitted treatment of PACs Conducting fuels management outside of occupied owl habitat has been suggested as a means of reducing fire risk within occupied sites (Jenness et al 2004 Tempel et al 2015) Ager et al (2007) reported that fuel treatments on 20 of a western Oregon landscape reduced the probability of northern spotted owl nesting and roosting habitat loss by 44 even though that habitat type was not treated As in Ager et al (2007) we observed modifications in fire intensity and burn probability within owl habitat even when it was left untreated In the S1 treatment scenario in which owl activity centers were not eligible for treatment the effect of treatshying other stands reduced both fire hazard (by
9ndash12 for CFL or approximately 04 m) and CBP (by ~45) within PACs It is difficult to assess the significance of this proportional reduction in CBP given that the absolute differences in probabilities were relatively modest (Figs 3 4) Ager et al (2007) noted that allowing treatment of owl habishytat would have significantly reduced estimated habitat loss in their study In this study it is expected that habitat quality may be reduced within treated PACs in the short term through the removal of small-diameter trees (ie lower vertical structural heterogeneity) However two structural attributes for suitable spotted owl nestshying habitat identified by Tempel et al (2015) high canopy cover and large tree density would not be altered While we did not directly estimate habitat loss we did observe much larger reductions in fire hazard within PACs that were treated as meashysured by CFL (71ndash75 reduction equivalent to 2ndash3 m) It should be noted that the effect of wideshyspread treatments within PACs on spotted owl nesting and foraging behavior is unknown One concern with designating some land area
unavailable for treatment is that it may limit the potential for treatments to alter fire behavior across the landscape (eg Finney 2001) Including all stands in the potential treatment pool allows the highest-priority stands with respect to simulated
wwwesajournalsorg 14 January 2017 Volume 8(1) Article e01648
CHIONO ET AL
effects on landscape-level fire behavior The true effect of increasing the land area available for treatshyment may be partially obscured by the varying frequency of treatment prescriptions between sceshynarios For example the hand thinning treatments applied within PACs would be expected to have a milder effect on potential wildfire behavior than more severe prescriptions and hand thinning was twice as common in S2 as in the other scenarios
Terrestrial carbon and burning emissions Landscape treatments reduced wildfire emisshy
sions by reducing the emissions produced per area burned by wildfire as well as average wildfire size On average wildfires in the treated landscapes released 193ndash216 tonnes Cha while wildfires in the untreated landscapes released 234ndash254 tonnes Cha Modeled wildfires decreased in size by 7 (low fuel model range) 36 (high fuel model range) and 25 (large fire scenario) relative to untreated landscapes (Fig 6) Since the burn pershyiod for simulated wildfires was held constant between scenarios this reduction in average wildshyfire size is the result of reduced spread rates derived from fuel treatments Despite the influence of treatments on wildfire
intensity size and expected emissions treatment-related emissions exceeded the avoided wildfire emissions conferred by treatment Prescribed burning in our study a combination of broadcast
Fig 6 Wildfire size relative frequency distributions from wildfire simulations Bar color represents no-treatment (NT) and treatment scenarios (S1ndashS3)
fire spread to be treated which would be expected to achieve the greatest modification of landscape fire behavior and effects In the present study although the land area potentially available for treatment more than doubled between S1 and S3 landscape-level effects of treatment on modeled fire risk and hazard were fairly similar (compared with the no-treatment landscape all-stand CBP fell by 47 and 54 in S1 and S3 while CFL fell by 24 and 30) Dow et al (2016) also found that incorporating modest restrictions on treatment Fig 7 Carbon emissions (tonnes) from wildfire and
area availability (24 of the landscape unavail- prescribed burning X-axis labels indicate no-treatment able) had minimal consequences for modeled fire (NT) and treatment scenarios (S1ndashS3) subscripts size and hazard The modest changes in estimated denote fuel model ranges used in fire modeling
fire metrics we observed may also be due to simi- (L low H high) Large fire scenarios which were
larity in the general pattern of treatment placement modeled with the high fuel model range only are indishybetween scenarios which probably led to similar cated by LF
wwwesajournalsorg 15 January 2017 Volume 8(1) Article e01648
CHIONO ET AL
Table 7 Proportional change in expected carbon by biomass pool for treatment scenarios compared to the no-treatment landscape
Treatment Standing Down dead Forest Herb Live scenario dead wood floor shrub tree
S1 004 -017 -013 014 -004 S2 001 -016 -012 014 -004 S3 -001 -015 -010 016 -004 S3-LF -016 -013 -008 017 000
Notes For example a value of -010 represents a 10 decshyline in biomass C from the no-treatment scenario Treatment and no-treatment values were calculated as the average of low and high fuel model range values except in the case of the large fire (LF) scenarios which were modeled for the high fuel model range only Expected C is that remaining after a random ignition and wildfire in the buffered study area as estimated from simulating 80000 ignitions (LF 40000 ignitions)
C pool categories are those reported in Forest Vegetation Simulator Carbon Reports Standing dead aboveground porshytion of standing dead trees Down dead wood woody surface fuels Forest floor litter and duff Herbshrub herbs and shrubs Live tree aboveground portion of live trees
and pile burning released 111ndash163 tonnes Cha For comparison studies conducted in comparable forest types have estimated prescribed fire emisshysions of 127 tonnes Cha (warm dry ponderosa pine habitat types Reinhardt and Holsinger 2010)
Fig 8 Expected carbon contained in aboveground live and dead tree biomass Expected C is that remainshying in the core study area following treatment (if applishycable) and a single random ignition within the larger buffered study area X-axis labels indicate no-treatment (NT) and treatment scenarios (S1ndashS3) subshyscripts denote fuel model ranges used in fire modeling (L low H high) Large fire scenarios which were modeled for the high fuel model range only are indishycated by LF
and 148 tonnes Cha (an old-growth mixed-conifer reserve in the southern Sierra Nevada North et al 2009a) Relative to the approximately 158000 tonnes C emitted in prescribed burning avoided wildfire emissions at 1186ndash19551 tonnes for wildfires of moderate size were small A simishylar study in southern Oregon with average modshyeled wildfires of 2350 and 3500 ha (treatment and no-treatment scenarios respectively) found that treatments reduced expected wildfire emissions by 6157 tonnes of C (Ager et al 2010) Surface fuels represented with surface fuel
models in commonly used modeling software are the most influential inputs determining preshydicted fire behavior (Hall and Burke 2006) Fire behavior fire sizes and emissions in this study varied according to fuel model assignment highshylighting the importance of selecting the approprishyate fuel model to represent fuel conditions (see Collins et al 2013) We show a 12- to 14-fold change in wildfire emissions due solely to the choice of fuel models (Tables 5 and 6) Indeed the range of fuel models used in recent studies investigating fuel treatments and simulated fire behavior in mixed-conifer forests is noteworthy Incorporating a range of fuel models into analyshyses such that outcome variability can be reported facilitates comparison of effects across studies Our estimates of the aboveground C benefits
of treatment under the moderate wildfire scenarshyios with average fire sizes of le2133 ha are likely conservative The effect of modeled wildfire size on the C consequences of fuel treatment was conshysiderable emphasizing the importance of this variable in studies of the climate benefits of treatshyment Avoided wildfire emissions resulting from treatment increased to 61276 tonnes C when large wildfires (8070ndash10757 ha) were simulated The treatment scenario given large wildfires also protected a greater portion of live tree C If the ~40000-ha King Fire is representative of the magnitude of future wildfires in the region C accounting should improve with respect to treatshyment favorability Similarly if multiple wildfires were to encounter the study area within the effective lifespan of treatments the C gains assoshyciated with avoided emissions in the treatment scenarios would increase Our approach to estimating the C conseshy
quences of fuel treatments has a number of limitashytions A full accounting of treatment effects
wwwesajournalsorg 16 January 2017 Volume 8(1) Article e01648
CHIONO ET AL
would project through time the consequences of both treatment and wildfire Our analysis is static incorporating only the short-term C costs and benefits of treatment Simulating wildfire in the year immediately following treatment maximizes the apparent benefits of treatment Over time as surface fuels accumulate and vegetation regenershyates maintenance would be required to retain the effectiveness of treatments (Martinson and Omi 2013) increasing the C costs of reduced fire hazard In addition the C contained in fire-killed biomass will ultimately be emitted to the atmoshysphere although biomass decay could be delayed through conversion to long-lived wood products such as building materials (Malmsheimer et al 2011) It is also important to note that our analysis did not include stochastic wildfire occurrence Estimates of burn probability in the present study are not estimates of the likelihood of wildfire occurrence based on historical fire sizes and freshyquency (eg Preisler et al 2004 Mercer and Prestemon 2005 Brillinger et al 2006) but rather are conditional on a single randomly ignited wildfire within the buffered study area
CONCLUSIONS
Our findings generally support those of Campshybell et al (2011) who concluded from an analysis of fire-prone western forests that the C costs of treatments are likely to outweigh their benefits under current depressed fire frequencies In a more recent paper Campbell and Ager (2013) conshycluded that ldquonone of the fuel treatment simulation scenarios resulted in increased system carbonrdquo primarily from the low incidences of treated areas being burned by wildfire However our interpreshytation of these findings differs from those disshycussed in Campbell et al (2011) and Campbell and Ager (2013) especially in light of recent and projected future trends in fire activity (Westerling et al 2011 Miller and Safford 2012 Dennison et al 2014) The current divergence of increasing surface air temperatures and low fire activity is unlikely to be sustained further suggesting greater future fire activity (Marlon et al 2012) If increased fire activity is realized then the likelishyhood of a given area being burned in a wildfire increases This differs from the simple increase in stand-level fire frequency modeled by Campbell et al (2011) because increases in fire likelihood are
not necessarily associated with corresponding decreases in fire severity as assumed by Campbell et al (2011) Increased fire likelihood could very well lead to positive feedbacks in fire severity and ultimately to vegetation type conversion (Copposhyletta et al 2016)mdasheffects that would have signifishycant implications for carbon storage Due to the significant emissions associated
with treatment and the low likelihood that wildshyfire will encounter a given treatment area forest management that is narrowly focused on C accounting alone would favor the no-treatment scenarios Landscape treatments protected more C in live tree biomass only when large wildfires were simulated While treatment favorability improved with large wildfire simulation the no-treatment scenario still produced fewer emissions than the treatment scenario Given the potential for large wildfire in the region as demonstrated by the 2014 King Fire and the increasing freshyquency of large wildfires and area burned in Calishyfornia expected from climate modeling studies (Lenihan et al 2008 Westerling et al 2011) we suggest that future studies of fuel treatmentndashwildshyfirendashC relationships should incorporate the potenshytial for large wildfires at a frequency greater than those observed over the last 20ndash30 yr Others have argued that treatments to increase forest resilience should be a stand-alone top land management priority independent of other ecosystem values such as carbon sequestration and fire hazard reduction (Stephens et al 2016a) We also note that the potential benefits of fuels
management are not restricted to avoided wildshyfire emissions Here we show that landscape fuel treatments can alter fire hazard across the landshyscape both within and outside of treated stands and have the potential to affect the likelihood of burning and fire intensity within protected Calishyfornia spotted owl habitat Underscoring the risk to sensitive habitat the 2014 King Fire encounshytered 31 PACs within our study area leading to the greatest single-year decline in habitat occushypancy recorded over a 23-yr study period (Jones et al 2016) Modest simulated treatments within activity centers significantly reduced potential fire intensity relative to both the no-treatment landscape and a treatment scenario that did not permit treatment within PACs indicating that active management may be desirable to protect habitat in the long term (Roloff et al 2012)
wwwesajournalsorg 17 January 2017 Volume 8(1) Article e01648
CHIONO ET AL
However treatments conducted outside of owl habitat also reduced wildfire hazard
ACKNOWLEDGMENTS
We are grateful to a number of individuals for sharshying their time and fuel treatment and fire modeling expertise Nicole Vaillant (ArcFuels) Alan Ager and Andrew McMahan (carbon estimation) and Coeli Hoover (harvest simulations in FVS-FFE) Brian Ebert and Dana Walsh of the Eldorado National Forest proshyvided invaluable advice on weather inputs for fire modeling and on designing fuel treatment prescripshytions Ken Somers Operations Forester on the Blodgett Forest Research Station gave advice concerning timshyber management on private land We also thank two anonymous reviewers whose comments greatly improved this article The California Energy Commisshysion provided funding for this project
LITERATURE CITED
Ager A A B Bahro and K Barber 2006 Automating the fireshed assessment process with ArcGIS Pages 163ndash167 in P L Andrews and B W Butler (Comps) Fuels ManagementndashHow to Measure Success Conference Proceedings Portland OR March 28ndash30 2006 Proceedings RMRS-P-41 USDA Forest Service Rocky Mountain Research Station Fort Collins Colorado USA
Ager A A M A Finney B K Kerns and H Maffei 2007 Modeling wildfire risk to northern spotted owl (Strix occidentalis caurina) habitat in Central Oregon USA Forest Ecology and Management 24645ndash56
Ager A A M A Finney A McMahan and J Cathcart 2010 Measuring the effect of fuel treatments on forshyest carbon using landscape risk analysis Natural Hazards and Earth System Science 102515ndash2526
Ager A A N M Vaillant D E Owens S Brittain and J Hamann 2012 Overview and example application of the Landscape Treatment Designer Pages 11 General Technical Report PNW-GTR-859 USDA Forest Service Pacific Northwest Research Station Portland Oregon USA
Barbour M G and R A Minnich 2000 Californian upland forests and woodlands Pages 131ndash164 in M Barbour and W Billings editors North Amerishycan terrestrial vegetation Cambridge University Press Cambridge UK
Bias M A and R Gutimerrez 1992 Habitat associations of California spotted owls in the central Sierra Nevada Journal of Wildlife Management 56584ndash595
Bond M L R Gutierrez A B Franklin W S LaHaye C A May and M E Seamans 2002
Short-term effects of wildfires on spotted owl surshyvival site fidelity mate fidelity and reproductive success Wildlife Society Bulletin 301022ndash1028
Brillinger D H Preisler and J Benoit 2006 Probashybilistic risk assessment for wildfires Environ-metrics 17623ndash633
Campbell J L and A A Ager 2013 Forest wildfire fuel reduction treatments and landscape carbon stocks a sensitivity analysis Journal of Environshymental Management 121124ndash132
Campbell J L M E Harmon and S R Mitchell 2011 Can fuel-reduction treatments really increase forest carbon storage in the western US by reducshying future fire emissions Frontiers in Ecology and the Environment 1083ndash90
Cathcart J A A Ager A McMahan M Finney and B Watt 2010 Carbon benefits from fuel treatshyments Pages 61ndash80 in T B Jain R T Graham and J Sandquist editors Integrated management of carbon sequestration and biomass utilization opportunities in a changing climate Proceedings of the 2009 National Silviculture Workshop Boise Idaho June 15ndash18 2009 USDA Forest Service Proshyceedings RMRS-P-61 Rocky Mountain Research Station Fort Collins Colorado USA
Chatfield A H 2005 Habitat selection by a California spotted owl population a landscape scale analysis using resource selection functions Thesis Univershysity of Minnesota St Paul Minnesota USA
Collins B M H A Kramer K Menning C Dilling-ham D Saah P A Stine and S L Stephens 2013 Modeling hazardous fire potential within a comshypleted fuel treatment network in the northern Sierra Nevada Forest Ecology and Management 310156ndash166
Collins B M S L Stephens J J Moghaddas and J Battles 2010 Challenges and approaches in planshyning fuel treatments across fire-excluded forested landscapes Journal of Forestry 10824ndash31
Collins B M S L Stephens G B Roller and J J Battles 2011 Simulating fire and forest dynamics for a landscape fuel treatment project in the Sierra Nevada Forest Science 5777ndash88
Coppoletta M K E Merriam and B M Collins 2016 Post-fire vegetation and fuel development influences fire severity patterns in reburns Ecologishycal Applications 26686ndash699
Crookston N L and A O Finley 2008 yaimpute an r package for knn imputation Journal of Statistical Software 231ndash16
Crookston N L M Moeur and D L Renner 2002 Userrsquos guide to the most similar neighbor imputashytion program version 2 General Technical Report RMRS-GTR-96 USDA Forest Service Rocky Mountain Research Station Ogden Utah USA
wwwesajournalsorg 18 January 2017 Volume 8(1) Article e01648
CHIONO ET AL
Crosby J and C Chandler 1966 Get the most from your windspeed observations Fire Control Notes 2712ndash13
Dailey S J Fites A Reiner and S Mori 2008 Fire behavior and effects in fuel treatments and proshytected habitat on the Moonlight fire Fire Behavior Assessment Team wwwfsfedusadaptivemana gementprojectsFBATdocsMoonlightFinal_8_6_08 pdf
Dennison P E S C Brewer J D Arnold and M A Moritz 2014 Large wildfire trends in the western United States 1984ndash2011 Geophysical Research Letters 412928ndash2933
Dixon G E 2002 Essential FVS a userrsquos guide to the forest vegetation simulator Pages 193 USDA Forest Service Forest Management Service Center Fort Collins Colorado USA
Dore S T E Kolb M Montes-Helu B W Sullivan W D Winslow S C Hart J P Kaye G W Koch and B A Hungate 2008 Long-term impact of a stand-replacing fire on ecosystem CO2 exchange of a ponderosa pine forest Global Change Biology 141ndash20
Dore S M Montes-Helu S C Hart B A Hungate G W Koch J B Moon A J Finkral and T E Kolb 2012 Recovery of ponderosa pine ecosystem carbon and water fluxes from thinning and stand-replacing fire Global Change Biology 183171ndash3185
Dow C J B M Collins and S L Stephens 2016 Incorporating resource protection constraints in an analysis of landscape fuel-treatment effectiveness in the Northern Sierra Nevada California USA Environmental Management 571ndash15
Eidenshink J B Schwind K Brewer Z Zhu B Quayle and S Howard 2007 A project for monshyitoring trends in burn severity Fire Ecology 33ndash21
Evans A M and A J Finkral 2009 From renewable energy to fire risk reduction a synthesis of biomass harvesting and utilization case studies in US forshyests GCB Bioenergy 1211ndash219
Finkral A J and A M Evans 2008 The effects of a thinning treatment on carbon stocks in a northern Arizona ponderosa pine forest Forest Ecology and Management 2552743ndash2750
Finney M A 2001 Design of regular landscape fuel treatment patterns for modifying fire growth and behavior Forest Science 47219ndash228
Finney M A 2002 Fire growth using minimum travel time methods Canadian Journal of Forest Research 321420ndash1424
Finney M A 2006 An overview of FlamMap fire modeling capabilities Pages 213ndash220 in P L Andrews and B W Butler editors Proceedings of Fuels ManagementndashHow to Measure Success Research Paper RMRS-P-41 USDA Forest Service
Rocky Mountain Research Station Portland Oregon USA
Finney M A R C Seli C W McHugh A A Ager B Bahro and J K Agee 2007 Simulation of longshyterm landscape-level fuel treatment effects on large wildfires International Journal of Wildland Fire 16712ndash727
Fulme P Z J E Crouse J P Roccaforte and E L Kalies 2012 Do thinning andor burning treatments in western USA ponderosa or Jeffrey pine-dominated forests help restore natural fire behavior Forest Ecology and Management 26968ndash81
Gaines W L R J Harrod J Dickinson A L Lyons and K Halupka 2010 Integration of Northern spotted owl habitat and fuels treatments in the eastern Cascades Washington USA Forest Ecolshyogy and Management 2602045ndash2052
Gaines W L R A Strand and S D Piper 1997 Effects of the hatchery complex fires on northern spotted owls in the eastern Washington Cascades Pages 123ndash129 in J N Greenlee editor Proceedings of the Fire Effects on Rare and Endangered Species and Habitats Conference Coeur DrsquoAlene Idaho International Association of Wildfire and Forestry Hot Springs South Dakota USA
Hall S A and I C Burke 2006 Considerations for characterizing fuels as inputs for fire behavior models Forest Ecology and Management 227 102ndash114
Hoover C and S Rebain 2008 The Kane Experimenshytal Forest carbon inventory carbon reporting with FVS Pages 13ndash15 in R N Havis and N L Crookston editors Third Forest Vegetation Simushylator Conference Fort Collins Colorado February 13ndash15 2007 USDA Forest Service Rocky Mountain Research Station Fort Collins Colorado USA
Hurteau M and M North 2009 Fuel treatment effects on tree-based forest carbon storage and emissions under modeled wildfire scenarios Fronshytiers in Ecology and the Environment 7409ndash414
Hurteau M D and M North 2010 Carbon recovery rates following different wildfire risk mitigation treatments Forest Ecology and Management 260 930ndash937
Hurteau M D M T Stoddard and P Z Fulme 2011 The carbon costs of mitigating high-severity wildshyfire in southwestern ponderosa pine Global Change Biology 171516ndash1521
Jenness J S P Beier and J L Ganey 2004 Associashytions between forest fire and Mexican spotted owls Forest Science 50765ndash772
Jones G M R Gutimerrez D J Tempel S A Whitmore W J Berigan and M Z Peery 2016 Megafires an emerging threat to old-forest species Frontiers in Ecology and the Environment 14300ndash306
wwwesajournalsorg 19 January 2017 Volume 8(1) Article e01648
CHIONO ET AL
Laymon S A 1988 Ecology of the spotted owl in the central Sierra Nevada California Dissertation University of California Berkeley California USA
Lenihan J M D Bachelet R P Neilson and R Drapek 2008 Response of vegetation distribution ecosystem productivity and fire to climate change scenarios for California Climatic Change 87215ndash230
Lydersen J M B M Collins E E Knapp G B Roller and S Stephens 2015 Relating fuel loads to overshystorey structure and composition in a fire-excluded Sierra Nevada mixed conifer forest International Journal of Wildland Fire 24484ndash494
Malmsheimer R J Bowyer J Fried E Gee R Islar R Miner I E Munn E Oneil and W C Stewart 2011 Managing forests because carbon matters integrating energy products and land manageshyment policy Journal of Forestry 109S7ndashS50
Marlon J R et al 2012 Long-term perspective on wildfires in the western USA Proceedings of the National Academy of Sciences of the United States of America 109E535ndashE543
Martinson E J and P N Omi 2002 Performance of fuel treatments subjected to wildfires Pages 7ndash13 in P N Omi and L A Joyce editors Conference on Fire Fuel Treatments and Ecological Restorashytion USDA Forest Service Rocky Mountain Research Station Fort Collins Colorado USA
Martinson E J and P N Omi 2013 Fuel treatments and fire severity a meta-analysis Pages 38 USDA Forest Service Rocky Mountain Research Station Fort Collins Colorado USA
Mayer K E and W F Laudenslayer 1988 A guide to wildlife habitats of California California Departshyment of Forestry and Fire Protection Sacramento California USA
McKenzie D Z Gedalof D L Peterson and P Mote 2004 Climatic change wildfire and conservation Conservation Biology 18890ndash902
Mercer D E and J P Prestemon 2005 Comparing production function models for wildfire risk analyshysis in the wildlandndashurban interface Forest Policy and Economics 7782ndash795
Miller J D and H Safford 2012 Trends in wildfire severity 1984 to 2010 in the Sierra Nevada Modoc Plateau and southern Cascades California USA Fire Ecology 841ndash57
Miller J H Safford M Crimmins and A Thode 2009 Quantitative evidence for increasing forest fire severity in the Sierra Nevada and southern Cascade mountains California and Nevada USA Ecosystems 1216ndash32
North M 2012 Managing Sierra Nevada forests PSWshyGTR-237 USDA Forest Service Pacific Southwest Research Station Albany California USA
North M P and M D Hurteau 2011 High-severity wildfire effects on carbon stocks and emissions in fuels treated and untreated forest Forest Ecology and Management 2611115ndash1120
North M M Hurteau and J Innes 2009a Fire supshypression and fuels treatment effects on mixed-conifer carbon stocks and emissions Ecological Applications 191385ndash1396
North M P A Stine K OrsquoHara W Zielinski and S Stephens 2009b An ecosystem management strategy for Sierran mixed-conifer forests General Technical Report PSW-GTR-220 USDA Forest Service Pacific Southwest Research Station Albany California USA
Parisien M-A S Snetsinger J A Greenberg C R Nelson T Schoennagel S Z Dobrowski and M A Moritz 2012 Spatial variability in wildfire probability across the western United States Intershynational Journal of Wildland Fire 21313ndash327
Penman J M Gytarsky T Hiraishi T Krug D Kruger R Pipatti L Buendia K Miwa T Ngara and K Tanabe 2003 Good practice guidance for land use land-use change and forestry Institute for Global Environmental Strategies for the Intergovshyernmental Panel on Climate Change Hayama Kanagawa Japan
Pollet J and P N Omi 2002 Effect of thinning and prescribed burning on crown fire severity in ponderosa pine forests International Journal of Wildland Fire 111ndash10
Prather J W R F Noss and T D Sisk 2008 Real versus perceived conflicts between restoration of ponderosa pine forests and conservation of the Mexican spotted owl Forest Policy and Economics 10140ndash150
Preisler H K D R Brillinger R E Burgan and J Benoit 2004 Probability based models for estimation of wildfire risk International Journal of Wildland Fire 13133ndash142
Rebain S E Reinhardt N Crookston S Beukema W Kurz and J Greenough 2009 The fire and fuels extension to the Forest Vegetation Simulator Addendum to RMRS-GTR-119 USDA Forest Service and ESSA Technologies Ltd Fort Collins Colorado USA
Reinhardt E D and N L Crookston 2003 The fire and fuels extension to the forest vegetation simulashytor Pages 209 RMRS-GTR-116 USDA Forest Sershyvice Rocky Mountain Research Station Ogden Utah USA
Reinhardt E and L Holsinger 2010 Effects of fuel treatments on carbon-disturbance relationshyships in forests of the northern Rocky Mountains Forest Ecology and Management 2591427ndash1435
wwwesajournalsorg 20 January 2017 Volume 8(1) Article e01648
CHIONO ET AL
Reinhardt E D R E Keane D E Calkin and J D Cohen 2008 Objectives and considerations for wildland fuel treatment in forested ecosystems of the interior western United States Forest Ecology and Management 2561997ndash2006
Ritchie M W C N Skinner and T A Hamilton 2007 Probability of tree survival after wildfire in an interior pine forest of northern California effects of thinning and prescribed fire Forest Ecolshyogy and Management 247200ndash208
Roloff G J S P Mealey and J D Bailey 2012 Comshyparative hazard assessment for protected species in a fire-prone landscape Forest Ecology and Manshyagement 2771ndash10
Rothermel R C 1972 A mathematical model for preshydicting fire spread in wildland fuels Research Paper INT-115 USDA Forest Service Intermounshytain Forest and Range Experiment Station Ogden Utah USA
Safford H D 2008 Fire severity in fuel treatments American River Complex fire Tahoe National Forest California Unpublished Report USDA Forest Service Pacific Southwest Region Vallejo California USA
Schmidt D A A H Taylor and C N Skinner 2008 The influence of fuels treatment and landscape arrangement on simulated fire behavior Southern Cascade range California Forest Ecology and Management 2553170ndash3184
Scott J H and R E Burgan 2005 Standard fire behavior fuel models a comprehensive set for use with Rothermelrsquos surface fire spread model General Technical Report RMRS-GTR-153 USDA Forest Service Rocky Mountain Research Station Fort Collins Colorado USA
Scott J H M P Thompson and J W Gilbertson-Day 2016 Examining alternative fuel management strategies and the relative contribution of National Forest System land to wildfire risk to adjacent homesndasha pilot assessment on the Sierra National Forest California USA Forest Ecology and Manshyagement 36229ndash37
Smith J E and L S Heath 2002 A model of forest floor carbon mass for United States forest types Research Paper NE-722 USDA Forest Service Northeastern Research Station Newtown Square Pennsylvania USA
Stephens S L 2005 Forest fire causes and extent on United States Forest Service lands International Journal of Wildland Fire 14213ndash222
Stephens S L B M Collins E Biber and P Z Fulme 2016a US federal fire and forest policy emphasizshying resilience in dry forests Ecosphere 7e01584
Stephens S L J D Miller B M Collins M P North J J Keane and S L Roberts 2016b Wildfire impacts on California Spotted Owl nesting habitat in the Sierra Nevada Ecosphere 7e01584
Stephens S L J J Moghaddas B R Hartsough E E Y Moghaddas and N E Clinton 2009 Fuel treatshyment effects on stand-level carbon pools treatshyment-related emissions and fire risk in a Sierra Nevada mixed-conifer forest Canadian Journal of Forest Research 391538ndash1547
Stephens S L et al 2012 Fuel treatment impacts on estimated wildfire carbon loss from forests in Monshytana Oregon California and Arizona Ecosphere 31ndash17
Tempel D et al 2015 Evaluating short- and longshyterm impacts of fuels treatments and simulated wildfire on an old-forest species Ecosphere 61ndash19
USDA Forest Service 2004 Sierra Nevada Forest Plan Amendment Final supplemental environmental impact statement Record of decision Publication R5-MB-046 USDA Forest Service Pacific Southshywest Region Vallejo California USA
Van Wagner C E 1977 Conditions for the start and spread of crown fire Canadian Journal of Forest Research 723ndash34
Verner J K S McKelvey B R Noon R Gutimerrez G I Gould Jr and T W Beck 1992 Assessment of the current status of the California spotted owl with recommendations for management Pages 3ndash27 in J Verner K S McKelvey B R Noon R Gutimerrez G I Gould Jr and T W Beck edishytors The California Spotted Owl a technical assessment of its current status PSW-GTR-133 USDA Forest Service Albany California USA
Westerling A B Bryant H Preisler T Holmes H Hidalgo T Das and S Shrestha 2011 Climate change and growth scenarios for California wildshyfire Climatic Change 109445ndash463
Westerling A L H G Hidalgo D R Cayan and T W Swetnam 2006 Warming and earlier Spring increase Western US Forest Wildfire Activity Science 313940ndash943
Wiedinmyer C and M D Hurteau 2010 Prescribed fire as a means of reducing forest carbon emissions in the Western United States Environmental Science amp Technology 441926ndash1932
SUPPORTING INFORMATION
Additional Supporting Information may be found online at httponlinelibrarywileycomdoi101002ecs2 1648full
wwwesajournalsorg 21 January 2017 Volume 8(1) Article e01648
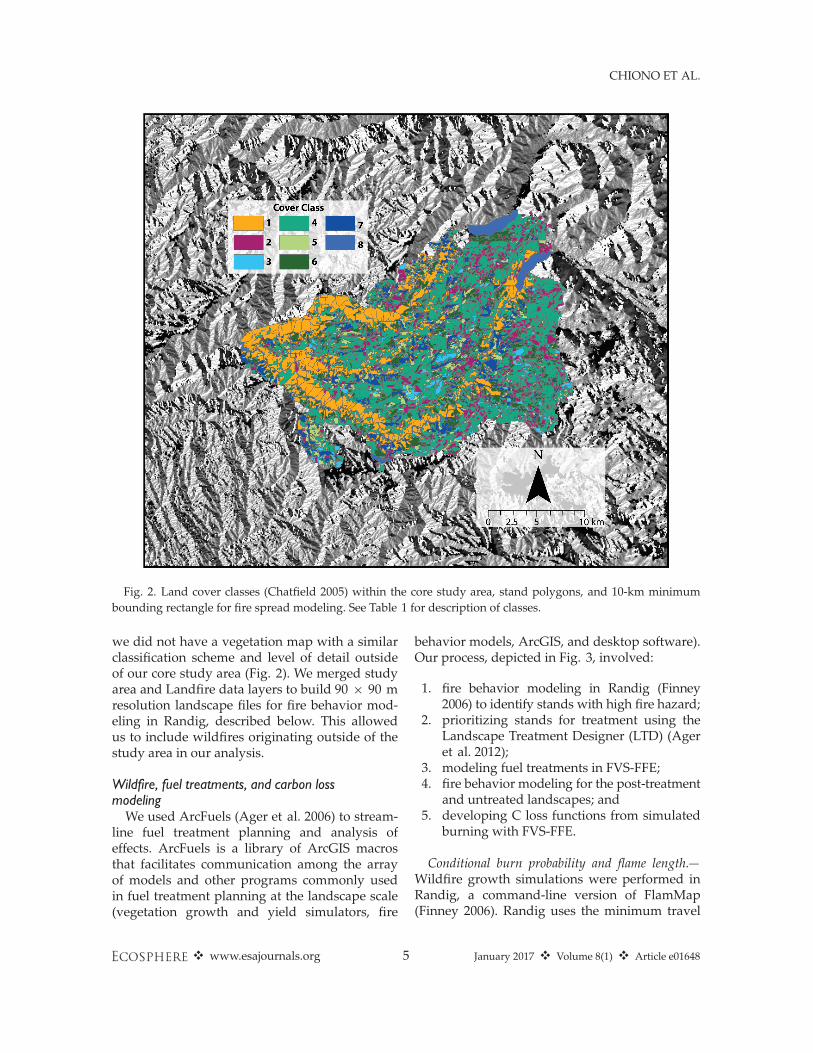
CHIONO ET AL
Fig 2 Land cover classes (Chatfield 2005) within the core study area stand polygons and 10-km minimum bounding rectangle for fire spread modeling See Table 1 for description of classes
we did not have a vegetation map with a similar classification scheme and level of detail outside of our core study area (Fig 2) We merged study area and Landfire data layers to build 90 9 90 m resolution landscape files for fire behavior modshyeling in Randig described below This allowed us to include wildfires originating outside of the study area in our analysis
Wildfire fuel treatments and carbon loss modeling
We used ArcFuels (Ager et al 2006) to streamshyline fuel treatment planning and analysis of effects ArcFuels is a library of ArcGIS macros that facilitates communication among the array of models and other programs commonly used in fuel treatment planning at the landscape scale (vegetation growth and yield simulators fire
behavior models ArcGIS and desktop software) Our process depicted in Fig 3 involved
1 fire behavior modeling in Randig (Finney 2006) to identify stands with high fire hazard
2 prioritizing stands for treatment using the Landscape Treatment Designer (LTD) (Ager et al 2012)
3 modeling fuel treatments in FVS-FFE 4 fire behavior modeling for the post-treatment
and untreated landscapes and 5 developing C loss functions from simulated
burning with FVS-FFE
Conditional burn probability and flame lengthmdash Wildfire growth simulations were performed in Randig a command-line version of FlamMap (Finney 2006) Randig uses the minimum travel
wwwesajournalsorg 5 January 2017 Volume 8(1) Article e01648
CHIONO ET AL
Fig 3 Work flow used in the present study to evaluate landscape fuel treatment effects on wildfire hazard and carbon pools and emissions
time algorithm (Finney 2002) to simulate fire growth during discrete burn periods under conshystant weather conditions Simulating many burn periods with Randig generates a burn probability surface for the study landscape Simulations were conducted at 90-m resolution for computashytional efficiency We simulated 80000 randomly located ignitions with a 5-h burn period for all scenarios including no treatment The burn pershyiod was selected to produce fire sizes that approximated area burned in spread events of historical large wildfires near the study area Large daily spread events in previous wildfires in the northern Sierra Nevada have burned gt2000 ha (Dailey et al 2008 Safford 2008) average fire sizes from our simulations ranged from 715 to 2133 ha (The exceptional growth observed in the 2014 King Fire is addressed in a subsequent subsection) The combination of ignishytion number and burn period was sufficient to ensure that 99 of pixels in burnable fuel types experienced fire at least once (average 64ndash1891 fires)
Randig outputs were used both in prioritizing stands for treatment and in evaluating the effects of treatment We performed one Randig run for each fuel model range (low and high) within each scenario (no treatment S1 S2 and S3) using landshyscape files representing the year immediately folshylowing treatment 2009 Simulations were also completed for the 2007 pre-treatment landscape for use in treatment prioritization for a total of 10 modeling runs
To evaluate the effect of treatments on fire risk and fire hazard we assessed changes in condishytional burn probability (CBP) and conditional flame length (CFL) between the treatment scenarshyios and the untreated landscape based on wildfire simulations It is important to note that the burn probabilities estimated in this study are not empirshyical estimates of the likelihood of wildfire occurshyrence (eg Preisler et al 2004 Brillinger et al 2006 Parisien et al 2012) Rather we use CBP the likelihood that a pixel will burn given a single ignition in the study area and assuming the simushylation conditions described From the simulation of many fires Randig calculates a pixel-level disshytribution of flame lengths (FL) in twenty 05-m classes between 05 and 10 m Conditional flame length the probability-weighted FL given that a fire occurs (Ager et al 2010) was calculated by combining burn probability estimates with FL disshytributions summarized at the stand level
( )20 BPiCFL frac14 Fi X
BPifrac141
where BP is CBP BPi is the probability of burning at the ith FL class and Fi is the midpoint FL of the ith FL class To estimate the effect of treatment on fire risk
and hazard we first computed average pixel-level BP and CFL for treated and untreated stands in each scenario Then we calculated average BP and CFL for the same stands within the no-treatment landscape The effect of each treatment scenario
wwwesajournalsorg 6 January 2017 Volume 8(1) Article e01648
CHIONO ET AL
was estimated as the proportional change in each fire metric between the untreated and treated landscapes
We obtained weather and fuel moisture inputs for wildfire modeling from the Bald Mountain and Hell Hole remote automated weather stations (RAWS) based on recommendations from local USDA Forest Service fire and fuel managers We used 95th percentile weather conditions from the 1 June to 30 September period (1989ndash2013) This period represents the typical fire season for the study area encompassing 85 of wildfires and 93 of the area burned within a 161-km (100-mi) radius of the study area between 1984 and 2012 (Monitoring Trends in Burn Severity database Eidenshink et al 2007)
Weather and fuel moisture inputs for wildfire simulations are provided in Appendix S1 Table S2 These conditions are similar to those occurring during recent large wildfires in and near the study area (eg 2001 Star Fire 2008 American River Complex 2013 American Fire) In addition to using Randig to model fire spread and intensity we used FVS-FFE to project effects of prescribed fires and wildfires (described below) Wind inputs varied somewhat between fire models FVS-FFE requires only a single wind speed while multiple wind scenarios were applied in Randig fire simulations Wind speeds azimuths and relative proportions for Randig simulations followed Collins et al (2011)
Spatial optimization of fuel treatmentsmdashStands were selected for treatment based on modeled pre-treatment wildfire hazard and stand structure using the LTD which allows multiple objectives to be combined in the spatial prioritization of fuel treatments Three treatment scenarios varied in the land designations eligible for treatment
Scenario 1 Public land excluding spotted owl habitat Scenario 2 Public land including spotted owl habitat Scenario 3 All lands public and private ownerships
Objectives were consistent across treatment sceshynarios but differed in the land area available for treatment For all LTD runs we directed the model to maximize a total score that comprised numeric stand structure and fire hazard rankings
(Appendix S1 Table S3) The stand structure rankshying (0 1 2) was based on cover class category Cover classes most conducive to thinning were ranked highest Fire hazard ranking (0 2 3) was assigned according to stand-level CFL as calcushylated from FL probability files generated in Randig simulations for the 2007 pre-treatment landscape To isolate the effect of varying land designashy
tions in the area available for treatment total area treated was held constant between scenarios (20 of the core study area) In order to exclude small spatially isolated treatment areas that would be impractical from a management standshypoint we required a minimum treatment area of 121 ha (30 ac) To achieve this the treatment prishyoritization process was iterative In each step we eliminated all stands selected by LTD for treatshyment that were not contiguous with a ge121-ha treatment area The rationale for this is based on the cost associated with re-locating equipment necessary to implement mechanical andor fire treatments (D Errington personal communication El Dorado National Forest) We then calculated the treatment area remaining This process was repeated until total treatment area summed to the target area (~11080 ha) We simulated fuel treatments using FVS-FFE
Stands selected for treatment were assigned one of 13 treatment prescriptions depending on topogshyraphy vegetation cover class ownership and overlap with owl PACs (Appendix S1 Table S4) In an effort to promote landscape-scale heteroshygeneity basal area targets for commercial thinning on public land varied with topography (aspect and slope position canyondrainage bottom mid-slope and ridge) (North et al 2009b North 2012) All thinning treatments were simulated as thinshyfrom-below harvests and thinning within owl PACs was limited to hand thinning We assumed that trees ge254 cm (10 in) dbh would be harshyvested for wood products (FVS VOLUME keyshyword) and that the biomass contained in smaller trees and in the tops and branches of larger trees would be utilized as feedstocks for bioenergy conshyversion Therefore all thinning (except hand thinshyning) treatments were simulated as whole tree harvests (FVS keyword YARDLOSS) Treatments preferentially retained fire-resistant species with relative retention preference as follows black oakgtponderosa pinegtsugar pinegtDouglas-firgtinshycense-cedargtred firegtwhite fir
wwwesajournalsorg 7 January 2017 Volume 8(1) Article e01648
CHIONO ET AL
Prescribed fires were simulated in the year folshylowing thinning (2009) Broadcast burning was applied except within owl PACs on private land and on steep slopes (gt35) where follow-up burning was limited to pile burning To capture a more realistic range of post-treatment surface fuel conditions stands selected for treatment were randomly assigned to one of three post-treatment fuel models for each fuel model range TL1 (181) TL3 (183) or TL5 (185) (low range) TL3 (183) TL5 (185) or SB1 (201) (high range) (Scott and Burgan 2005) Weather conditions for prescribed fire modeling were based on recomshymendations from a local fire management speshycialist (B Ebert personal communication)
Biomass and carbon effects of treatmentmdashSimushylated treatment prescriptions varied according to site characteristics such as topography and land ownership (Appendix S1 Table S4) We tracked the C emitted from burning removed during harshyvesting and contained in live and dead aboveshyground biomass with FVS-FFE carbon reports (Reinhardt and Crookston 2003 Hoover and Rebain 2008) FVS converts biomass to units of C using a multiplier of 05 for all live and dead C pools (Penman et al 2003) except duff and litter pools for which a multiplier of 037 is applied (Smith and Heath 2002) Stand C is partitioned into a number of pools including aboveground live tree standing dead tree herb and shrub litter and duff woody surface fuel and belowground live and dead tree root C we limited our analysis to aboveground pools of C FVS-FFE also reports the C emitted during burning and that conshytained in harvested biomass (Rebain et al 2009) Treatment effects were assessed by comparing expected aboveground biomass C and emissions between the treated and untreated landscapes
We developed C loss functions for each FVS treelist by simulating burning with FVS-FFE at a range of FLs (SIMFIRE and FLAMEADJ keyshywords) (Ager et al 2010 Cathcart et al 2010) The FL values supplied to FLAMEADJ were the 20 midpoints of the 05-m FL classes (05ndash10 m) found in Randig FL probability output files As noted by Ager et al (2010) and Cathcart et al (2010) it is not currently possible to precisely match fire behaviors between Randig and FVS The FLs reported in Randig outputs are the total of surface fire and if initiated crown fire In
contrast the FLs supplied to FVS-FFE via the FLAMEADJ keyword are treated as surface fire FLs and when FLAMEADJ is parameterized with only a predefined FL the model does not use the input FL in crown fire simulations To estimate fire effects in FVS-FFE we parameterized FLAshyMEADJ with percent crowning (PC) and scorch height in addition to FL Scorch height and critical FL for crown fire initiation (FLCRIT) were based on Van Wagner (1977) We estimated PC using a downward concave function where PC = 32 when flame length = FLCRIT and PC = 100 when FL is ge30 of stand top height (the average height of the 40 largest trees by diameter) (Ager et al 2010 A Ager personal communication) The derived C loss functions were combined
with the probabilistic estimates of surface fire behavior produced in Randig simulations to estishymate the ldquoexpected Crdquo emitted in wildfire or conshytained in biomass We estimated expected C emissions and post-fire biomass C for each pixel as follows
20 X[ ]Efrac12 ]C i frac14 BPij X Cij
ifrac140
where E[C]j is the expected wildfire emissions of C from pixel j or biomass C in pixel j in mass per unit area BPij is the probability of burning at the ith FL class for pixel j and Cij is the C emitshyted from pixel j or the biomass C remaining in pixel j post-wildfire given burning at the ith FL class Expected C emissions and biomass C were
summed across all pixels in the core study area to obtain total expected wildfire emissions and expected terrestrial C for each treatment scenario In order to compare our modeling results to
other analyses that reported wildfire emissions on a per area basis we used a different method to estishymate C emissions per area burned Because wildshyfires burned both the core and buffer areas of our study landscape while emissions were estimated only in the core area we used conditional expected wildfire emissions to approximate the emissions from a wildfire burning entirely within the core study area Conditional expected emissions are those produced for an area given that the area is burned Conditional emissions were estimated for each pixel as follows
wwwesajournalsorg 8 January 2017 Volume 8(1) Article e01648
CHIONO ET AL
Table 2 Total area and proportion of area treated by category in each treatment scenario
SC1 SC2 SC3
Proportion of Proportion of Proportion of Treatment category Area (ha) area treated Area (ha) area treated Area (ha) area treated
Treated 11081 100 11082 100 11081 100 Avail for treatmentdagger 22042 199 28998 262 45647 412 Owl habitat treated 00 000 2769 025 1127 010 Private land treated 00 000 00 000 5685 051 Hand thin 1499 014 3819 034 1612 015 Biomass thin 8404 076 7240 065 9470 085 Commercial thin 7765 070 6916 062 9470 085 Broadcast burn 9410 085 7247 065 3785 034 Pile burn 1671 015 3835 035 7296 066
dagger Total land area potentially available for treatment in each scenario The area available for treatment increased from Scenarshyios 1 to 3 as restrictions on the area available for treatment were relaxed
20 X C WCfrac12 ]j frac14
BPij X WCijBPjifrac141
where C[WC]j is the C emitted by wildfire from pixel j in mass per unit area BPj is the probability that pixel j is burned BPij is the probability of burning at the ith FL class and WCij is the C emitted from pixel j when burned at the ith FL class
Conditional expected emissions were averaged across all pixels to obtain an estimate of wildfire emissions per area burned
Large fire revisionmdashWildfire modeling was calishybrated to produce fire sizes that approximated area burned in spread events of historical large wildfires near the study area However during the course of the study a very large fire encounshytered our study area The King Fire began on 13 September 2014 in El Dorado County and burned 39545 hamdashmore than an order of magnishytude greater than our modeled wildfires includshying gt25 of the study area Given the potential for very large wildfires in this region demonshystrated by the King Fire we completed addishytional wildfire modeling to estimate the C effects of treatment given the occurrence of a very large fire
Randig modeling was repeated for the no-treatment and S3 scenarios using the high fuel model range and a revised burn period number of simulated ignitions wind speed and wind directions Burn period was increased from 5 to 12 h number of ignitions was reduced by half to 40000 Wind directions and relative probabilities (Appendix S1 Table S5) were those recorded at
Hell Hole RAWS between 0400 and 1900 hours on 17 September the day of the King Firersquos larshygest spread event We used the probable 1-min maximum wind speed as calculated from the maximum gust recorded on that day 33 kmh (205 mph) based on maximum gust of 547 kmh (34 mph) (Crosby and Chandler 1966) These settings produced average fire sizes of NT = 10757 ha (no-treatment scenario) and 8070 ha (S3) Average fire size was limited by the size of our buffered study area Longer burn periods resulted in an increasing number of simulated wildfires that burned to the study area boundary
RESULTS
Treatment simulation Table 2 provides a summary of the area treashy
ted in each scenario Scenario 1 (S1) was the most restrictive with respect to the land area available for treatment which more than doushybled between S1 and S3 Because treatment preshyscriptions varied with land designation (public owl PAC private) and the designations availshyable for treatment varied between scenarios the relative proportions of thinning and burning methods also varied between scenarios Comshymercial and biomass thinning were applied most frequently in S3 which permitted treatshyment of private land Spotted owl activity censhyters composed 25 of the area treated in S2 vs 10 in S3 and 0 in S1 the scenario in which PACs were not subject to treatment As a result the area treated with hand thinning in S2 was more than twice that in S1 and S3 Due to the
wwwesajournalsorg 9 January 2017 Volume 8(1) Article e01648
CHIONO ET AL
Fig 4 Low fuel model range treatment locations and difference in conditional burn probability (CBP) and conshyditional flame length (CFL) (untreated-treated) for each treatment scenario Negative values indicate an increase in CBP or CFL while positive values represent a reduction CBP is the likelihood that a pixel will burn given a single ignition on the landscape and assuming the simulation conditions described in Appendix S1 Table S1 and in the text Conditional flame length is the probability-weighted flame length given these same assumptions
inclusion of PACs in S2 and both PACs and prishyvate land in S3 the proportion of area treated with pile burning increased between S1 and S3 while broadcast burn area exhibited an opposite trend Despite the variation in land designations available for treatment the pattern of treatshyment placement was generally similar between scenarios with treatments concentrated in the central and eastern portions of the study area (Figs 4 5)
Landscape-scale burn probability and fire hazard Conditional burn probabilitymdashThe pixel-to-pixel
change in CBP between the untreated scenario and each treatment scenario is mapped in Figs 4 (LO FM) and 5 (HI FM) Treatment reduced landshyscape burn probability by approximately 50 (Table 3) from 00124 (NT) to 00062 (S1) 00059 (S2) and 00055 (S3) Within treatment units avershyage CBP fell by 69ndash76 to 00033ndash00035 outside of treated stands CBP fell to 00060ndash00069 Some
wwwesajournalsorg 10 January 2017 Volume 8(1) Article e01648
CHIONO ET AL
Fig 5 Treatment locations and high fuel model range difference in conditional burn probability and condishytional flame length (untreated-treated) for each treatment scenario
increases in CBP were also observed particularly for the low fuel model range (Fig 4)
The influence of treatment on owl PAC likelishyhood of burning was similar to that observed for stands in general For treated PACs average CBP fell by ~70 relative to no treatment for the same stands Although PACs were not eligible for treatment in S1 all treatment scenarios had a large impact on estimated PAC CBP Average PAC CBP was reduced from 0013 to 00063 in S1 00049 in S2 and 00054 in S3 a 49ndash64 decrease relative to PACs in the no-treatment landscape (Table 3)
Fire hazardmdashTreatments reduced average landshyscape CFL by ~1 m from 36 m (NT) to 25ndash27 m Pixel-level CFL was reduced by a maximum of 80 m (LO FM) and 90 m (HI FM) Increases in CFL were also observed however particularly near the study arearsquos western and southwestern boundaries where treatments were least concentrated (Figs 4 5) Maximum pixel-level CFL increases were 25 m (LO FM) and 31 m (HI FM) Because fire hazard was used in prioritizing
stands for treatment the estimated pre-treatment CFL in stands selected for treatment (43ndash51 m)
wwwesajournalsorg 11 January 2017 Volume 8(1) Article e01648
CHIONO ET AL
Table 3 Proportional change in burn probability for treatment scenarios compared to the NT scenario
LO FM HI FM AVG
Stand type
S1 S2 S3 Proportional change
relative to NT
S1 S2 S3 Proportional change
relative to NT
S1 S2 S3 Proportional change
relative to NT
All PACs -045 -064 -056 -053 -063 -059 -049 -064 -057 Treated PACs NA -081 -076 NA -057 -067 NA -069 -072 Untreated PACs -045 -053 -051 -053 -054 -058 -049 -053 -054 All stands Treated stands
-044 -076
-048 -079
-053 -063
-050 -072
-053 -074
-056 -074
-047 -074
-050 -076
-054 -069
Untreated stands -035 -039 -049 -045 -047 -051 -040 -043 -050
Notes NT no treatment PACs protected activity centers Proportions are ratios of treatment values to no-treatment values as calculated for the same stands Treatment and no-treatment values were calculated as the average pixel value for the low and high fuel model range (LO FM and HI FM) within each stand category and treatment scenario
was greater than in stands not selected (32ndash 33 m) After treatment average CFL within treashyted stands fell to 13 (S1 and S2) and 17 m (S3) CFL in untreated stands was also reduced as a result of the influence of treatments on fire spread and intensity CFL fell by 05ndash08 m (9ndash 16) relative to CFL in the same stands within the no-treatment landscape (Table 4)
Although spotted owl PACs were not treated in S1 relative to PACs in the NT landscape PAC CFL was reduced by 10 (to 32 m) in S1 Treating PACs had a much larger impact on potential fire intensity however Average treashyted PAC CFL fell to 13 and 14 m in S2 and S3 respectively
Carbon consequences of landscape fuel treatments
Prior to treatment aboveground landscape carbon totaled 14705 tonnesha on average Treatments removed 14 of pre-treatment C from treated stands or 2374 tonnesha totaling
81772ndash119103 tonnes of C in harvested biomass and merchantable material (Tables 5 and 6) Both the treatment scenarios and the choice of
fuel models were important influences on estishymated C emissions from burning As the least restrictive treatment scenario in terms of treatshyment location and the only scenario to include treatment of private land where broadcast burnshying was precluded as a treatment option the S3 treatment scenario was associated with the lowshyest wildfire and prescribed burning emissions (Tables 5 and 6) For each treatment scenario expected wildfire emissions increased by more than an order of magnitude between the low and high fuel model ranges This difference was the result of increasing fire intensity as well as wildshyfire size Average wildfire size nearly doubled between fuel model ranges in the treatment sceshynarios and tripled in the no-treatment scenario (Fig 6) For a given treatment scenario wildfire emissions on a per hectare basis were approxishymately two tonnes greater for the high fuel
Table 4 Proportional change in conditional flame length for treatment scenarios compared to the NT scenario
LO FM HI FM AVG
Stand type
S1 S2 S3 Proportional change
relative to NT
S1 S2 S3 Proportional change
relative to NT
S1 S2 S3 Proportional change
relative to NT
All PACs -009 -042 -028 -012 -043 -027 -010 -042 -028 Treated PACs NA -071 -075 NA -071 -073 NA -071 -074 Untreated PACs -009 -014 -011 -012 -017 -014 -010 -016 -013 All stands -022 -026 -031 -025 -026 -028 -024 -026 -030 Treated stands -065 -069 -052 -071 -071 -073 -068 -070 -062 Untreated stands -008 -009 -021 -011 -012 -012 -009 -010 -016
Notes NT no treatment PACs protected activity centers Proportions are ratios of treatment values to no-treatment values as calculated for the same stands Treatment and no-treatment values were calculated as the average pixel value for the low and high fuel model range (LO FM and HI FM) within each stand category and treatment scenario
wwwesajournalsorg 12 January 2017 Volume 8(1) Article e01648
CHIONO ET AL
Table 5 Expected biomass carbon expected wildfire C emissions and C harvested and emitted in fuel treatshyments for NT and treatment (S1 S2 S3) scenarios using the low fuel model range in fire modeling
Carbon pool NT S1 S2 S3
Untreated stands Tonnes C Live 5004505 3915044 3695489 3954131 Dead 1845659 1421704 1378824 1466202 Wildfire emissions 2372 1137 1039 904
Treated stands Live 881358 1072625 826366 Dead 260089 299244 220932 All harvested biomass 88773 81772 119103 Prescribed fire emissions 178530 169693 122599 Wildfire emissions 48 56 61
All stands Live 5004505 4796402 4768113 4780497 Dead 1845659 1681793 1678068 1687135 Treatment (harvested and emitted) 267303 251465 241702 Wildfire emissions 2372 1186 1095 965
Grand totals 6852536 6746684 6698741 6710299
Notes LF indicates the large fire scenarios Expected C is that remaining in the core study area following treatment if applishycable and a random ignition and wildfire in the larger buffered study area as estimated from the simulation of many wildfires Live C is that contained in live aboveground herb shrub and tree biomass dead C is the C contained in litter duff woody surshyface fuel and aboveground portions of tree snags NT no treatment
model range than for the low range In contrast to the large influence of fuel model choice on wildfire emissions the effect of fuel model range on prescribed fire emissions was minimal with only a 1 increase in emissions between the low and high fuel model ranges for a given treatment scenario
Although treatment significantly reduced wildshyfire emissions combined emissions from preshyscribed burning on 20 of the landscape and wildfire exceeded wildfire emissions in the no-treatment scenarios (Tables 5 and 6) Relative to the no-treatment scenarios treatment reduced estimated wildfire emissions by approximately 54 (low fuel model range) 59 (high fuel model range) and 45 (large fire scenarios) Yet preshyscribed burning was a far more significant source of emissions than were wildfires of moderate size with emissions from treatment exceeding wildfire emissions by 111259ndash177344 tonnes Even for the large wildfire simulations where landscape treatments nearly halved estimated wildfire emisshysions the combined carbon emissions from preshyscribed burning and wildfire in the treatment scenario surpassed wildfire emissions in the no-treatment scenario by 45 (Table 6 Fig 7)
The total quantity of aboveground C expected to remain on the landscape following treatment
and a randomly ignited wildfire was greatest for the no-treatment scenarios (Tables 5 and 6) For modeled wildfires of moderate size treatment reduced both the live and dead C pools relative to the no-treatment scenarios and terrestrial C in the no-treatment scenarios was 4ndash5 greater (323316 ndash434960 tonnes) than in any of the treatment scenarios (Tables 5 and 6) In comparison under large wildfire conditions the treatment scenario retained slightly more live biomass C~15000 tonshynes or 03 more than the no-treatment scenario However treatment also reduced necromass C by 288000 tonnes (12) resulting in a 3 overall decrease in onsite biomass C relative to an untreshyated landscape (Table 6) The proportional changes in aboveground
biomass C pools between the treatment and no-treatment scenarios are summarized in Table 7 For all treatment scenarios the consumption of duff litter and downed woody fuels with preshyscribed burning contributed to a net reduction in these C pools relative to the untreated landscape Conversely treatments protected more C in the live understory (herb and shrub) poolmdashthe result of reduced wildfire size and intensity in the treatshyment scenarios Treatments in the moderate wildshyfire scenarios reduced live tree biomass C in comparison with no-treatment levels (Fig 8)
wwwesajournalsorg 13 January 2017 Volume 8(1) Article e01648
CHIONO ET AL
Table 6 Expected biomass carbon expected wildfire C emissions and C harvested and emitted in fuel treatshyments for NT and treatment (S1 S2 S3) scenarios using the high fuel model range in fire modeling
Carbon pool NT S1 S2 S3 NT-LF S3-LF
Untreated stands Tonnes C Live 4910239 3879854 3664690 3923358 4586898 3750774 Dead 1912429 1448947 1403313 1489629 2130034 1605591 Wildfire emissions 31831 12934 12001 11293 137622 68061
Treated stands Live 896670 1115918 853503 847374 Dead 280182 325628 238130 247744 All harvested biomass 88773 81772 119103 119103 Prescribed fire emissions 180357 171247 123539 123539 Wildfire emissions 798 951 986 8285
All stands Live 4910239 4776524 4780607 4776861 4586898 4598148 Dead 1912429 1729129 1728941 1727759 2130034 1853334 Treatment (harvested and emitted) 282862 265971 254921 254921 Wildfire emissions 31831 13732 12952 12279 137622 76346
Grand totals 6854499 6802247 6788471 6771820 6854554 6782749
Notes LF indicates the large fire scenarios Expected terrestrial C is that remaining in the core study area following treatshyment if applicable and a random ignition and wildfire in the larger buffered study area as estimated from the simulation of many wildfires Live C is that contained in live aboveground herb shrub and tree biomass dead C is the C contained in litter duff woody surface fuel and aboveground portions of tree snags NT no treatment
Notably in the large modeled wildfire scenarios (NT-LF and S3-LF) treatments resulted in a 400000-tonne increase in landscape-level live tree C over the no-treatment scenario
DISCUSSION
Fuel treatments in protected habitat Because there are often competing objectives
between managing forests for resilience to fire and drought and protecting owl habitat we assessed potential fire occurrence and hazard based on treatment scenarios that included and omitted treatment of PACs Conducting fuels management outside of occupied owl habitat has been suggested as a means of reducing fire risk within occupied sites (Jenness et al 2004 Tempel et al 2015) Ager et al (2007) reported that fuel treatments on 20 of a western Oregon landscape reduced the probability of northern spotted owl nesting and roosting habitat loss by 44 even though that habitat type was not treated As in Ager et al (2007) we observed modifications in fire intensity and burn probability within owl habitat even when it was left untreated In the S1 treatment scenario in which owl activity centers were not eligible for treatment the effect of treatshying other stands reduced both fire hazard (by
9ndash12 for CFL or approximately 04 m) and CBP (by ~45) within PACs It is difficult to assess the significance of this proportional reduction in CBP given that the absolute differences in probabilities were relatively modest (Figs 3 4) Ager et al (2007) noted that allowing treatment of owl habishytat would have significantly reduced estimated habitat loss in their study In this study it is expected that habitat quality may be reduced within treated PACs in the short term through the removal of small-diameter trees (ie lower vertical structural heterogeneity) However two structural attributes for suitable spotted owl nestshying habitat identified by Tempel et al (2015) high canopy cover and large tree density would not be altered While we did not directly estimate habitat loss we did observe much larger reductions in fire hazard within PACs that were treated as meashysured by CFL (71ndash75 reduction equivalent to 2ndash3 m) It should be noted that the effect of wideshyspread treatments within PACs on spotted owl nesting and foraging behavior is unknown One concern with designating some land area
unavailable for treatment is that it may limit the potential for treatments to alter fire behavior across the landscape (eg Finney 2001) Including all stands in the potential treatment pool allows the highest-priority stands with respect to simulated
wwwesajournalsorg 14 January 2017 Volume 8(1) Article e01648
CHIONO ET AL
effects on landscape-level fire behavior The true effect of increasing the land area available for treatshyment may be partially obscured by the varying frequency of treatment prescriptions between sceshynarios For example the hand thinning treatments applied within PACs would be expected to have a milder effect on potential wildfire behavior than more severe prescriptions and hand thinning was twice as common in S2 as in the other scenarios
Terrestrial carbon and burning emissions Landscape treatments reduced wildfire emisshy
sions by reducing the emissions produced per area burned by wildfire as well as average wildfire size On average wildfires in the treated landscapes released 193ndash216 tonnes Cha while wildfires in the untreated landscapes released 234ndash254 tonnes Cha Modeled wildfires decreased in size by 7 (low fuel model range) 36 (high fuel model range) and 25 (large fire scenario) relative to untreated landscapes (Fig 6) Since the burn pershyiod for simulated wildfires was held constant between scenarios this reduction in average wildshyfire size is the result of reduced spread rates derived from fuel treatments Despite the influence of treatments on wildfire
intensity size and expected emissions treatment-related emissions exceeded the avoided wildfire emissions conferred by treatment Prescribed burning in our study a combination of broadcast
Fig 6 Wildfire size relative frequency distributions from wildfire simulations Bar color represents no-treatment (NT) and treatment scenarios (S1ndashS3)
fire spread to be treated which would be expected to achieve the greatest modification of landscape fire behavior and effects In the present study although the land area potentially available for treatment more than doubled between S1 and S3 landscape-level effects of treatment on modeled fire risk and hazard were fairly similar (compared with the no-treatment landscape all-stand CBP fell by 47 and 54 in S1 and S3 while CFL fell by 24 and 30) Dow et al (2016) also found that incorporating modest restrictions on treatment Fig 7 Carbon emissions (tonnes) from wildfire and
area availability (24 of the landscape unavail- prescribed burning X-axis labels indicate no-treatment able) had minimal consequences for modeled fire (NT) and treatment scenarios (S1ndashS3) subscripts size and hazard The modest changes in estimated denote fuel model ranges used in fire modeling
fire metrics we observed may also be due to simi- (L low H high) Large fire scenarios which were
larity in the general pattern of treatment placement modeled with the high fuel model range only are indishybetween scenarios which probably led to similar cated by LF
wwwesajournalsorg 15 January 2017 Volume 8(1) Article e01648
CHIONO ET AL
Table 7 Proportional change in expected carbon by biomass pool for treatment scenarios compared to the no-treatment landscape
Treatment Standing Down dead Forest Herb Live scenario dead wood floor shrub tree
S1 004 -017 -013 014 -004 S2 001 -016 -012 014 -004 S3 -001 -015 -010 016 -004 S3-LF -016 -013 -008 017 000
Notes For example a value of -010 represents a 10 decshyline in biomass C from the no-treatment scenario Treatment and no-treatment values were calculated as the average of low and high fuel model range values except in the case of the large fire (LF) scenarios which were modeled for the high fuel model range only Expected C is that remaining after a random ignition and wildfire in the buffered study area as estimated from simulating 80000 ignitions (LF 40000 ignitions)
C pool categories are those reported in Forest Vegetation Simulator Carbon Reports Standing dead aboveground porshytion of standing dead trees Down dead wood woody surface fuels Forest floor litter and duff Herbshrub herbs and shrubs Live tree aboveground portion of live trees
and pile burning released 111ndash163 tonnes Cha For comparison studies conducted in comparable forest types have estimated prescribed fire emisshysions of 127 tonnes Cha (warm dry ponderosa pine habitat types Reinhardt and Holsinger 2010)
Fig 8 Expected carbon contained in aboveground live and dead tree biomass Expected C is that remainshying in the core study area following treatment (if applishycable) and a single random ignition within the larger buffered study area X-axis labels indicate no-treatment (NT) and treatment scenarios (S1ndashS3) subshyscripts denote fuel model ranges used in fire modeling (L low H high) Large fire scenarios which were modeled for the high fuel model range only are indishycated by LF
and 148 tonnes Cha (an old-growth mixed-conifer reserve in the southern Sierra Nevada North et al 2009a) Relative to the approximately 158000 tonnes C emitted in prescribed burning avoided wildfire emissions at 1186ndash19551 tonnes for wildfires of moderate size were small A simishylar study in southern Oregon with average modshyeled wildfires of 2350 and 3500 ha (treatment and no-treatment scenarios respectively) found that treatments reduced expected wildfire emissions by 6157 tonnes of C (Ager et al 2010) Surface fuels represented with surface fuel
models in commonly used modeling software are the most influential inputs determining preshydicted fire behavior (Hall and Burke 2006) Fire behavior fire sizes and emissions in this study varied according to fuel model assignment highshylighting the importance of selecting the approprishyate fuel model to represent fuel conditions (see Collins et al 2013) We show a 12- to 14-fold change in wildfire emissions due solely to the choice of fuel models (Tables 5 and 6) Indeed the range of fuel models used in recent studies investigating fuel treatments and simulated fire behavior in mixed-conifer forests is noteworthy Incorporating a range of fuel models into analyshyses such that outcome variability can be reported facilitates comparison of effects across studies Our estimates of the aboveground C benefits
of treatment under the moderate wildfire scenarshyios with average fire sizes of le2133 ha are likely conservative The effect of modeled wildfire size on the C consequences of fuel treatment was conshysiderable emphasizing the importance of this variable in studies of the climate benefits of treatshyment Avoided wildfire emissions resulting from treatment increased to 61276 tonnes C when large wildfires (8070ndash10757 ha) were simulated The treatment scenario given large wildfires also protected a greater portion of live tree C If the ~40000-ha King Fire is representative of the magnitude of future wildfires in the region C accounting should improve with respect to treatshyment favorability Similarly if multiple wildfires were to encounter the study area within the effective lifespan of treatments the C gains assoshyciated with avoided emissions in the treatment scenarios would increase Our approach to estimating the C conseshy
quences of fuel treatments has a number of limitashytions A full accounting of treatment effects
wwwesajournalsorg 16 January 2017 Volume 8(1) Article e01648
CHIONO ET AL
would project through time the consequences of both treatment and wildfire Our analysis is static incorporating only the short-term C costs and benefits of treatment Simulating wildfire in the year immediately following treatment maximizes the apparent benefits of treatment Over time as surface fuels accumulate and vegetation regenershyates maintenance would be required to retain the effectiveness of treatments (Martinson and Omi 2013) increasing the C costs of reduced fire hazard In addition the C contained in fire-killed biomass will ultimately be emitted to the atmoshysphere although biomass decay could be delayed through conversion to long-lived wood products such as building materials (Malmsheimer et al 2011) It is also important to note that our analysis did not include stochastic wildfire occurrence Estimates of burn probability in the present study are not estimates of the likelihood of wildfire occurrence based on historical fire sizes and freshyquency (eg Preisler et al 2004 Mercer and Prestemon 2005 Brillinger et al 2006) but rather are conditional on a single randomly ignited wildfire within the buffered study area
CONCLUSIONS
Our findings generally support those of Campshybell et al (2011) who concluded from an analysis of fire-prone western forests that the C costs of treatments are likely to outweigh their benefits under current depressed fire frequencies In a more recent paper Campbell and Ager (2013) conshycluded that ldquonone of the fuel treatment simulation scenarios resulted in increased system carbonrdquo primarily from the low incidences of treated areas being burned by wildfire However our interpreshytation of these findings differs from those disshycussed in Campbell et al (2011) and Campbell and Ager (2013) especially in light of recent and projected future trends in fire activity (Westerling et al 2011 Miller and Safford 2012 Dennison et al 2014) The current divergence of increasing surface air temperatures and low fire activity is unlikely to be sustained further suggesting greater future fire activity (Marlon et al 2012) If increased fire activity is realized then the likelishyhood of a given area being burned in a wildfire increases This differs from the simple increase in stand-level fire frequency modeled by Campbell et al (2011) because increases in fire likelihood are
not necessarily associated with corresponding decreases in fire severity as assumed by Campbell et al (2011) Increased fire likelihood could very well lead to positive feedbacks in fire severity and ultimately to vegetation type conversion (Copposhyletta et al 2016)mdasheffects that would have signifishycant implications for carbon storage Due to the significant emissions associated
with treatment and the low likelihood that wildshyfire will encounter a given treatment area forest management that is narrowly focused on C accounting alone would favor the no-treatment scenarios Landscape treatments protected more C in live tree biomass only when large wildfires were simulated While treatment favorability improved with large wildfire simulation the no-treatment scenario still produced fewer emissions than the treatment scenario Given the potential for large wildfire in the region as demonstrated by the 2014 King Fire and the increasing freshyquency of large wildfires and area burned in Calishyfornia expected from climate modeling studies (Lenihan et al 2008 Westerling et al 2011) we suggest that future studies of fuel treatmentndashwildshyfirendashC relationships should incorporate the potenshytial for large wildfires at a frequency greater than those observed over the last 20ndash30 yr Others have argued that treatments to increase forest resilience should be a stand-alone top land management priority independent of other ecosystem values such as carbon sequestration and fire hazard reduction (Stephens et al 2016a) We also note that the potential benefits of fuels
management are not restricted to avoided wildshyfire emissions Here we show that landscape fuel treatments can alter fire hazard across the landshyscape both within and outside of treated stands and have the potential to affect the likelihood of burning and fire intensity within protected Calishyfornia spotted owl habitat Underscoring the risk to sensitive habitat the 2014 King Fire encounshytered 31 PACs within our study area leading to the greatest single-year decline in habitat occushypancy recorded over a 23-yr study period (Jones et al 2016) Modest simulated treatments within activity centers significantly reduced potential fire intensity relative to both the no-treatment landscape and a treatment scenario that did not permit treatment within PACs indicating that active management may be desirable to protect habitat in the long term (Roloff et al 2012)
wwwesajournalsorg 17 January 2017 Volume 8(1) Article e01648
CHIONO ET AL
However treatments conducted outside of owl habitat also reduced wildfire hazard
ACKNOWLEDGMENTS
We are grateful to a number of individuals for sharshying their time and fuel treatment and fire modeling expertise Nicole Vaillant (ArcFuels) Alan Ager and Andrew McMahan (carbon estimation) and Coeli Hoover (harvest simulations in FVS-FFE) Brian Ebert and Dana Walsh of the Eldorado National Forest proshyvided invaluable advice on weather inputs for fire modeling and on designing fuel treatment prescripshytions Ken Somers Operations Forester on the Blodgett Forest Research Station gave advice concerning timshyber management on private land We also thank two anonymous reviewers whose comments greatly improved this article The California Energy Commisshysion provided funding for this project
LITERATURE CITED
Ager A A B Bahro and K Barber 2006 Automating the fireshed assessment process with ArcGIS Pages 163ndash167 in P L Andrews and B W Butler (Comps) Fuels ManagementndashHow to Measure Success Conference Proceedings Portland OR March 28ndash30 2006 Proceedings RMRS-P-41 USDA Forest Service Rocky Mountain Research Station Fort Collins Colorado USA
Ager A A M A Finney B K Kerns and H Maffei 2007 Modeling wildfire risk to northern spotted owl (Strix occidentalis caurina) habitat in Central Oregon USA Forest Ecology and Management 24645ndash56
Ager A A M A Finney A McMahan and J Cathcart 2010 Measuring the effect of fuel treatments on forshyest carbon using landscape risk analysis Natural Hazards and Earth System Science 102515ndash2526
Ager A A N M Vaillant D E Owens S Brittain and J Hamann 2012 Overview and example application of the Landscape Treatment Designer Pages 11 General Technical Report PNW-GTR-859 USDA Forest Service Pacific Northwest Research Station Portland Oregon USA
Barbour M G and R A Minnich 2000 Californian upland forests and woodlands Pages 131ndash164 in M Barbour and W Billings editors North Amerishycan terrestrial vegetation Cambridge University Press Cambridge UK
Bias M A and R Gutimerrez 1992 Habitat associations of California spotted owls in the central Sierra Nevada Journal of Wildlife Management 56584ndash595
Bond M L R Gutierrez A B Franklin W S LaHaye C A May and M E Seamans 2002
Short-term effects of wildfires on spotted owl surshyvival site fidelity mate fidelity and reproductive success Wildlife Society Bulletin 301022ndash1028
Brillinger D H Preisler and J Benoit 2006 Probashybilistic risk assessment for wildfires Environ-metrics 17623ndash633
Campbell J L and A A Ager 2013 Forest wildfire fuel reduction treatments and landscape carbon stocks a sensitivity analysis Journal of Environshymental Management 121124ndash132
Campbell J L M E Harmon and S R Mitchell 2011 Can fuel-reduction treatments really increase forest carbon storage in the western US by reducshying future fire emissions Frontiers in Ecology and the Environment 1083ndash90
Cathcart J A A Ager A McMahan M Finney and B Watt 2010 Carbon benefits from fuel treatshyments Pages 61ndash80 in T B Jain R T Graham and J Sandquist editors Integrated management of carbon sequestration and biomass utilization opportunities in a changing climate Proceedings of the 2009 National Silviculture Workshop Boise Idaho June 15ndash18 2009 USDA Forest Service Proshyceedings RMRS-P-61 Rocky Mountain Research Station Fort Collins Colorado USA
Chatfield A H 2005 Habitat selection by a California spotted owl population a landscape scale analysis using resource selection functions Thesis Univershysity of Minnesota St Paul Minnesota USA
Collins B M H A Kramer K Menning C Dilling-ham D Saah P A Stine and S L Stephens 2013 Modeling hazardous fire potential within a comshypleted fuel treatment network in the northern Sierra Nevada Forest Ecology and Management 310156ndash166
Collins B M S L Stephens J J Moghaddas and J Battles 2010 Challenges and approaches in planshyning fuel treatments across fire-excluded forested landscapes Journal of Forestry 10824ndash31
Collins B M S L Stephens G B Roller and J J Battles 2011 Simulating fire and forest dynamics for a landscape fuel treatment project in the Sierra Nevada Forest Science 5777ndash88
Coppoletta M K E Merriam and B M Collins 2016 Post-fire vegetation and fuel development influences fire severity patterns in reburns Ecologishycal Applications 26686ndash699
Crookston N L and A O Finley 2008 yaimpute an r package for knn imputation Journal of Statistical Software 231ndash16
Crookston N L M Moeur and D L Renner 2002 Userrsquos guide to the most similar neighbor imputashytion program version 2 General Technical Report RMRS-GTR-96 USDA Forest Service Rocky Mountain Research Station Ogden Utah USA
wwwesajournalsorg 18 January 2017 Volume 8(1) Article e01648
CHIONO ET AL
Crosby J and C Chandler 1966 Get the most from your windspeed observations Fire Control Notes 2712ndash13
Dailey S J Fites A Reiner and S Mori 2008 Fire behavior and effects in fuel treatments and proshytected habitat on the Moonlight fire Fire Behavior Assessment Team wwwfsfedusadaptivemana gementprojectsFBATdocsMoonlightFinal_8_6_08 pdf
Dennison P E S C Brewer J D Arnold and M A Moritz 2014 Large wildfire trends in the western United States 1984ndash2011 Geophysical Research Letters 412928ndash2933
Dixon G E 2002 Essential FVS a userrsquos guide to the forest vegetation simulator Pages 193 USDA Forest Service Forest Management Service Center Fort Collins Colorado USA
Dore S T E Kolb M Montes-Helu B W Sullivan W D Winslow S C Hart J P Kaye G W Koch and B A Hungate 2008 Long-term impact of a stand-replacing fire on ecosystem CO2 exchange of a ponderosa pine forest Global Change Biology 141ndash20
Dore S M Montes-Helu S C Hart B A Hungate G W Koch J B Moon A J Finkral and T E Kolb 2012 Recovery of ponderosa pine ecosystem carbon and water fluxes from thinning and stand-replacing fire Global Change Biology 183171ndash3185
Dow C J B M Collins and S L Stephens 2016 Incorporating resource protection constraints in an analysis of landscape fuel-treatment effectiveness in the Northern Sierra Nevada California USA Environmental Management 571ndash15
Eidenshink J B Schwind K Brewer Z Zhu B Quayle and S Howard 2007 A project for monshyitoring trends in burn severity Fire Ecology 33ndash21
Evans A M and A J Finkral 2009 From renewable energy to fire risk reduction a synthesis of biomass harvesting and utilization case studies in US forshyests GCB Bioenergy 1211ndash219
Finkral A J and A M Evans 2008 The effects of a thinning treatment on carbon stocks in a northern Arizona ponderosa pine forest Forest Ecology and Management 2552743ndash2750
Finney M A 2001 Design of regular landscape fuel treatment patterns for modifying fire growth and behavior Forest Science 47219ndash228
Finney M A 2002 Fire growth using minimum travel time methods Canadian Journal of Forest Research 321420ndash1424
Finney M A 2006 An overview of FlamMap fire modeling capabilities Pages 213ndash220 in P L Andrews and B W Butler editors Proceedings of Fuels ManagementndashHow to Measure Success Research Paper RMRS-P-41 USDA Forest Service
Rocky Mountain Research Station Portland Oregon USA
Finney M A R C Seli C W McHugh A A Ager B Bahro and J K Agee 2007 Simulation of longshyterm landscape-level fuel treatment effects on large wildfires International Journal of Wildland Fire 16712ndash727
Fulme P Z J E Crouse J P Roccaforte and E L Kalies 2012 Do thinning andor burning treatments in western USA ponderosa or Jeffrey pine-dominated forests help restore natural fire behavior Forest Ecology and Management 26968ndash81
Gaines W L R J Harrod J Dickinson A L Lyons and K Halupka 2010 Integration of Northern spotted owl habitat and fuels treatments in the eastern Cascades Washington USA Forest Ecolshyogy and Management 2602045ndash2052
Gaines W L R A Strand and S D Piper 1997 Effects of the hatchery complex fires on northern spotted owls in the eastern Washington Cascades Pages 123ndash129 in J N Greenlee editor Proceedings of the Fire Effects on Rare and Endangered Species and Habitats Conference Coeur DrsquoAlene Idaho International Association of Wildfire and Forestry Hot Springs South Dakota USA
Hall S A and I C Burke 2006 Considerations for characterizing fuels as inputs for fire behavior models Forest Ecology and Management 227 102ndash114
Hoover C and S Rebain 2008 The Kane Experimenshytal Forest carbon inventory carbon reporting with FVS Pages 13ndash15 in R N Havis and N L Crookston editors Third Forest Vegetation Simushylator Conference Fort Collins Colorado February 13ndash15 2007 USDA Forest Service Rocky Mountain Research Station Fort Collins Colorado USA
Hurteau M and M North 2009 Fuel treatment effects on tree-based forest carbon storage and emissions under modeled wildfire scenarios Fronshytiers in Ecology and the Environment 7409ndash414
Hurteau M D and M North 2010 Carbon recovery rates following different wildfire risk mitigation treatments Forest Ecology and Management 260 930ndash937
Hurteau M D M T Stoddard and P Z Fulme 2011 The carbon costs of mitigating high-severity wildshyfire in southwestern ponderosa pine Global Change Biology 171516ndash1521
Jenness J S P Beier and J L Ganey 2004 Associashytions between forest fire and Mexican spotted owls Forest Science 50765ndash772
Jones G M R Gutimerrez D J Tempel S A Whitmore W J Berigan and M Z Peery 2016 Megafires an emerging threat to old-forest species Frontiers in Ecology and the Environment 14300ndash306
wwwesajournalsorg 19 January 2017 Volume 8(1) Article e01648
CHIONO ET AL
Laymon S A 1988 Ecology of the spotted owl in the central Sierra Nevada California Dissertation University of California Berkeley California USA
Lenihan J M D Bachelet R P Neilson and R Drapek 2008 Response of vegetation distribution ecosystem productivity and fire to climate change scenarios for California Climatic Change 87215ndash230
Lydersen J M B M Collins E E Knapp G B Roller and S Stephens 2015 Relating fuel loads to overshystorey structure and composition in a fire-excluded Sierra Nevada mixed conifer forest International Journal of Wildland Fire 24484ndash494
Malmsheimer R J Bowyer J Fried E Gee R Islar R Miner I E Munn E Oneil and W C Stewart 2011 Managing forests because carbon matters integrating energy products and land manageshyment policy Journal of Forestry 109S7ndashS50
Marlon J R et al 2012 Long-term perspective on wildfires in the western USA Proceedings of the National Academy of Sciences of the United States of America 109E535ndashE543
Martinson E J and P N Omi 2002 Performance of fuel treatments subjected to wildfires Pages 7ndash13 in P N Omi and L A Joyce editors Conference on Fire Fuel Treatments and Ecological Restorashytion USDA Forest Service Rocky Mountain Research Station Fort Collins Colorado USA
Martinson E J and P N Omi 2013 Fuel treatments and fire severity a meta-analysis Pages 38 USDA Forest Service Rocky Mountain Research Station Fort Collins Colorado USA
Mayer K E and W F Laudenslayer 1988 A guide to wildlife habitats of California California Departshyment of Forestry and Fire Protection Sacramento California USA
McKenzie D Z Gedalof D L Peterson and P Mote 2004 Climatic change wildfire and conservation Conservation Biology 18890ndash902
Mercer D E and J P Prestemon 2005 Comparing production function models for wildfire risk analyshysis in the wildlandndashurban interface Forest Policy and Economics 7782ndash795
Miller J D and H Safford 2012 Trends in wildfire severity 1984 to 2010 in the Sierra Nevada Modoc Plateau and southern Cascades California USA Fire Ecology 841ndash57
Miller J H Safford M Crimmins and A Thode 2009 Quantitative evidence for increasing forest fire severity in the Sierra Nevada and southern Cascade mountains California and Nevada USA Ecosystems 1216ndash32
North M 2012 Managing Sierra Nevada forests PSWshyGTR-237 USDA Forest Service Pacific Southwest Research Station Albany California USA
North M P and M D Hurteau 2011 High-severity wildfire effects on carbon stocks and emissions in fuels treated and untreated forest Forest Ecology and Management 2611115ndash1120
North M M Hurteau and J Innes 2009a Fire supshypression and fuels treatment effects on mixed-conifer carbon stocks and emissions Ecological Applications 191385ndash1396
North M P A Stine K OrsquoHara W Zielinski and S Stephens 2009b An ecosystem management strategy for Sierran mixed-conifer forests General Technical Report PSW-GTR-220 USDA Forest Service Pacific Southwest Research Station Albany California USA
Parisien M-A S Snetsinger J A Greenberg C R Nelson T Schoennagel S Z Dobrowski and M A Moritz 2012 Spatial variability in wildfire probability across the western United States Intershynational Journal of Wildland Fire 21313ndash327
Penman J M Gytarsky T Hiraishi T Krug D Kruger R Pipatti L Buendia K Miwa T Ngara and K Tanabe 2003 Good practice guidance for land use land-use change and forestry Institute for Global Environmental Strategies for the Intergovshyernmental Panel on Climate Change Hayama Kanagawa Japan
Pollet J and P N Omi 2002 Effect of thinning and prescribed burning on crown fire severity in ponderosa pine forests International Journal of Wildland Fire 111ndash10
Prather J W R F Noss and T D Sisk 2008 Real versus perceived conflicts between restoration of ponderosa pine forests and conservation of the Mexican spotted owl Forest Policy and Economics 10140ndash150
Preisler H K D R Brillinger R E Burgan and J Benoit 2004 Probability based models for estimation of wildfire risk International Journal of Wildland Fire 13133ndash142
Rebain S E Reinhardt N Crookston S Beukema W Kurz and J Greenough 2009 The fire and fuels extension to the Forest Vegetation Simulator Addendum to RMRS-GTR-119 USDA Forest Service and ESSA Technologies Ltd Fort Collins Colorado USA
Reinhardt E D and N L Crookston 2003 The fire and fuels extension to the forest vegetation simulashytor Pages 209 RMRS-GTR-116 USDA Forest Sershyvice Rocky Mountain Research Station Ogden Utah USA
Reinhardt E and L Holsinger 2010 Effects of fuel treatments on carbon-disturbance relationshyships in forests of the northern Rocky Mountains Forest Ecology and Management 2591427ndash1435
wwwesajournalsorg 20 January 2017 Volume 8(1) Article e01648
CHIONO ET AL
Reinhardt E D R E Keane D E Calkin and J D Cohen 2008 Objectives and considerations for wildland fuel treatment in forested ecosystems of the interior western United States Forest Ecology and Management 2561997ndash2006
Ritchie M W C N Skinner and T A Hamilton 2007 Probability of tree survival after wildfire in an interior pine forest of northern California effects of thinning and prescribed fire Forest Ecolshyogy and Management 247200ndash208
Roloff G J S P Mealey and J D Bailey 2012 Comshyparative hazard assessment for protected species in a fire-prone landscape Forest Ecology and Manshyagement 2771ndash10
Rothermel R C 1972 A mathematical model for preshydicting fire spread in wildland fuels Research Paper INT-115 USDA Forest Service Intermounshytain Forest and Range Experiment Station Ogden Utah USA
Safford H D 2008 Fire severity in fuel treatments American River Complex fire Tahoe National Forest California Unpublished Report USDA Forest Service Pacific Southwest Region Vallejo California USA
Schmidt D A A H Taylor and C N Skinner 2008 The influence of fuels treatment and landscape arrangement on simulated fire behavior Southern Cascade range California Forest Ecology and Management 2553170ndash3184
Scott J H and R E Burgan 2005 Standard fire behavior fuel models a comprehensive set for use with Rothermelrsquos surface fire spread model General Technical Report RMRS-GTR-153 USDA Forest Service Rocky Mountain Research Station Fort Collins Colorado USA
Scott J H M P Thompson and J W Gilbertson-Day 2016 Examining alternative fuel management strategies and the relative contribution of National Forest System land to wildfire risk to adjacent homesndasha pilot assessment on the Sierra National Forest California USA Forest Ecology and Manshyagement 36229ndash37
Smith J E and L S Heath 2002 A model of forest floor carbon mass for United States forest types Research Paper NE-722 USDA Forest Service Northeastern Research Station Newtown Square Pennsylvania USA
Stephens S L 2005 Forest fire causes and extent on United States Forest Service lands International Journal of Wildland Fire 14213ndash222
Stephens S L B M Collins E Biber and P Z Fulme 2016a US federal fire and forest policy emphasizshying resilience in dry forests Ecosphere 7e01584
Stephens S L J D Miller B M Collins M P North J J Keane and S L Roberts 2016b Wildfire impacts on California Spotted Owl nesting habitat in the Sierra Nevada Ecosphere 7e01584
Stephens S L J J Moghaddas B R Hartsough E E Y Moghaddas and N E Clinton 2009 Fuel treatshyment effects on stand-level carbon pools treatshyment-related emissions and fire risk in a Sierra Nevada mixed-conifer forest Canadian Journal of Forest Research 391538ndash1547
Stephens S L et al 2012 Fuel treatment impacts on estimated wildfire carbon loss from forests in Monshytana Oregon California and Arizona Ecosphere 31ndash17
Tempel D et al 2015 Evaluating short- and longshyterm impacts of fuels treatments and simulated wildfire on an old-forest species Ecosphere 61ndash19
USDA Forest Service 2004 Sierra Nevada Forest Plan Amendment Final supplemental environmental impact statement Record of decision Publication R5-MB-046 USDA Forest Service Pacific Southshywest Region Vallejo California USA
Van Wagner C E 1977 Conditions for the start and spread of crown fire Canadian Journal of Forest Research 723ndash34
Verner J K S McKelvey B R Noon R Gutimerrez G I Gould Jr and T W Beck 1992 Assessment of the current status of the California spotted owl with recommendations for management Pages 3ndash27 in J Verner K S McKelvey B R Noon R Gutimerrez G I Gould Jr and T W Beck edishytors The California Spotted Owl a technical assessment of its current status PSW-GTR-133 USDA Forest Service Albany California USA
Westerling A B Bryant H Preisler T Holmes H Hidalgo T Das and S Shrestha 2011 Climate change and growth scenarios for California wildshyfire Climatic Change 109445ndash463
Westerling A L H G Hidalgo D R Cayan and T W Swetnam 2006 Warming and earlier Spring increase Western US Forest Wildfire Activity Science 313940ndash943
Wiedinmyer C and M D Hurteau 2010 Prescribed fire as a means of reducing forest carbon emissions in the Western United States Environmental Science amp Technology 441926ndash1932
SUPPORTING INFORMATION
Additional Supporting Information may be found online at httponlinelibrarywileycomdoi101002ecs2 1648full
wwwesajournalsorg 21 January 2017 Volume 8(1) Article e01648
CHIONO ET AL
Fig 3 Work flow used in the present study to evaluate landscape fuel treatment effects on wildfire hazard and carbon pools and emissions
time algorithm (Finney 2002) to simulate fire growth during discrete burn periods under conshystant weather conditions Simulating many burn periods with Randig generates a burn probability surface for the study landscape Simulations were conducted at 90-m resolution for computashytional efficiency We simulated 80000 randomly located ignitions with a 5-h burn period for all scenarios including no treatment The burn pershyiod was selected to produce fire sizes that approximated area burned in spread events of historical large wildfires near the study area Large daily spread events in previous wildfires in the northern Sierra Nevada have burned gt2000 ha (Dailey et al 2008 Safford 2008) average fire sizes from our simulations ranged from 715 to 2133 ha (The exceptional growth observed in the 2014 King Fire is addressed in a subsequent subsection) The combination of ignishytion number and burn period was sufficient to ensure that 99 of pixels in burnable fuel types experienced fire at least once (average 64ndash1891 fires)
Randig outputs were used both in prioritizing stands for treatment and in evaluating the effects of treatment We performed one Randig run for each fuel model range (low and high) within each scenario (no treatment S1 S2 and S3) using landshyscape files representing the year immediately folshylowing treatment 2009 Simulations were also completed for the 2007 pre-treatment landscape for use in treatment prioritization for a total of 10 modeling runs
To evaluate the effect of treatments on fire risk and fire hazard we assessed changes in condishytional burn probability (CBP) and conditional flame length (CFL) between the treatment scenarshyios and the untreated landscape based on wildfire simulations It is important to note that the burn probabilities estimated in this study are not empirshyical estimates of the likelihood of wildfire occurshyrence (eg Preisler et al 2004 Brillinger et al 2006 Parisien et al 2012) Rather we use CBP the likelihood that a pixel will burn given a single ignition in the study area and assuming the simushylation conditions described From the simulation of many fires Randig calculates a pixel-level disshytribution of flame lengths (FL) in twenty 05-m classes between 05 and 10 m Conditional flame length the probability-weighted FL given that a fire occurs (Ager et al 2010) was calculated by combining burn probability estimates with FL disshytributions summarized at the stand level
( )20 BPiCFL frac14 Fi X
BPifrac141
where BP is CBP BPi is the probability of burning at the ith FL class and Fi is the midpoint FL of the ith FL class To estimate the effect of treatment on fire risk
and hazard we first computed average pixel-level BP and CFL for treated and untreated stands in each scenario Then we calculated average BP and CFL for the same stands within the no-treatment landscape The effect of each treatment scenario
wwwesajournalsorg 6 January 2017 Volume 8(1) Article e01648
CHIONO ET AL
was estimated as the proportional change in each fire metric between the untreated and treated landscapes
We obtained weather and fuel moisture inputs for wildfire modeling from the Bald Mountain and Hell Hole remote automated weather stations (RAWS) based on recommendations from local USDA Forest Service fire and fuel managers We used 95th percentile weather conditions from the 1 June to 30 September period (1989ndash2013) This period represents the typical fire season for the study area encompassing 85 of wildfires and 93 of the area burned within a 161-km (100-mi) radius of the study area between 1984 and 2012 (Monitoring Trends in Burn Severity database Eidenshink et al 2007)
Weather and fuel moisture inputs for wildfire simulations are provided in Appendix S1 Table S2 These conditions are similar to those occurring during recent large wildfires in and near the study area (eg 2001 Star Fire 2008 American River Complex 2013 American Fire) In addition to using Randig to model fire spread and intensity we used FVS-FFE to project effects of prescribed fires and wildfires (described below) Wind inputs varied somewhat between fire models FVS-FFE requires only a single wind speed while multiple wind scenarios were applied in Randig fire simulations Wind speeds azimuths and relative proportions for Randig simulations followed Collins et al (2011)
Spatial optimization of fuel treatmentsmdashStands were selected for treatment based on modeled pre-treatment wildfire hazard and stand structure using the LTD which allows multiple objectives to be combined in the spatial prioritization of fuel treatments Three treatment scenarios varied in the land designations eligible for treatment
Scenario 1 Public land excluding spotted owl habitat Scenario 2 Public land including spotted owl habitat Scenario 3 All lands public and private ownerships
Objectives were consistent across treatment sceshynarios but differed in the land area available for treatment For all LTD runs we directed the model to maximize a total score that comprised numeric stand structure and fire hazard rankings
(Appendix S1 Table S3) The stand structure rankshying (0 1 2) was based on cover class category Cover classes most conducive to thinning were ranked highest Fire hazard ranking (0 2 3) was assigned according to stand-level CFL as calcushylated from FL probability files generated in Randig simulations for the 2007 pre-treatment landscape To isolate the effect of varying land designashy
tions in the area available for treatment total area treated was held constant between scenarios (20 of the core study area) In order to exclude small spatially isolated treatment areas that would be impractical from a management standshypoint we required a minimum treatment area of 121 ha (30 ac) To achieve this the treatment prishyoritization process was iterative In each step we eliminated all stands selected by LTD for treatshyment that were not contiguous with a ge121-ha treatment area The rationale for this is based on the cost associated with re-locating equipment necessary to implement mechanical andor fire treatments (D Errington personal communication El Dorado National Forest) We then calculated the treatment area remaining This process was repeated until total treatment area summed to the target area (~11080 ha) We simulated fuel treatments using FVS-FFE
Stands selected for treatment were assigned one of 13 treatment prescriptions depending on topogshyraphy vegetation cover class ownership and overlap with owl PACs (Appendix S1 Table S4) In an effort to promote landscape-scale heteroshygeneity basal area targets for commercial thinning on public land varied with topography (aspect and slope position canyondrainage bottom mid-slope and ridge) (North et al 2009b North 2012) All thinning treatments were simulated as thinshyfrom-below harvests and thinning within owl PACs was limited to hand thinning We assumed that trees ge254 cm (10 in) dbh would be harshyvested for wood products (FVS VOLUME keyshyword) and that the biomass contained in smaller trees and in the tops and branches of larger trees would be utilized as feedstocks for bioenergy conshyversion Therefore all thinning (except hand thinshyning) treatments were simulated as whole tree harvests (FVS keyword YARDLOSS) Treatments preferentially retained fire-resistant species with relative retention preference as follows black oakgtponderosa pinegtsugar pinegtDouglas-firgtinshycense-cedargtred firegtwhite fir
wwwesajournalsorg 7 January 2017 Volume 8(1) Article e01648
CHIONO ET AL
Prescribed fires were simulated in the year folshylowing thinning (2009) Broadcast burning was applied except within owl PACs on private land and on steep slopes (gt35) where follow-up burning was limited to pile burning To capture a more realistic range of post-treatment surface fuel conditions stands selected for treatment were randomly assigned to one of three post-treatment fuel models for each fuel model range TL1 (181) TL3 (183) or TL5 (185) (low range) TL3 (183) TL5 (185) or SB1 (201) (high range) (Scott and Burgan 2005) Weather conditions for prescribed fire modeling were based on recomshymendations from a local fire management speshycialist (B Ebert personal communication)
Biomass and carbon effects of treatmentmdashSimushylated treatment prescriptions varied according to site characteristics such as topography and land ownership (Appendix S1 Table S4) We tracked the C emitted from burning removed during harshyvesting and contained in live and dead aboveshyground biomass with FVS-FFE carbon reports (Reinhardt and Crookston 2003 Hoover and Rebain 2008) FVS converts biomass to units of C using a multiplier of 05 for all live and dead C pools (Penman et al 2003) except duff and litter pools for which a multiplier of 037 is applied (Smith and Heath 2002) Stand C is partitioned into a number of pools including aboveground live tree standing dead tree herb and shrub litter and duff woody surface fuel and belowground live and dead tree root C we limited our analysis to aboveground pools of C FVS-FFE also reports the C emitted during burning and that conshytained in harvested biomass (Rebain et al 2009) Treatment effects were assessed by comparing expected aboveground biomass C and emissions between the treated and untreated landscapes
We developed C loss functions for each FVS treelist by simulating burning with FVS-FFE at a range of FLs (SIMFIRE and FLAMEADJ keyshywords) (Ager et al 2010 Cathcart et al 2010) The FL values supplied to FLAMEADJ were the 20 midpoints of the 05-m FL classes (05ndash10 m) found in Randig FL probability output files As noted by Ager et al (2010) and Cathcart et al (2010) it is not currently possible to precisely match fire behaviors between Randig and FVS The FLs reported in Randig outputs are the total of surface fire and if initiated crown fire In
contrast the FLs supplied to FVS-FFE via the FLAMEADJ keyword are treated as surface fire FLs and when FLAMEADJ is parameterized with only a predefined FL the model does not use the input FL in crown fire simulations To estimate fire effects in FVS-FFE we parameterized FLAshyMEADJ with percent crowning (PC) and scorch height in addition to FL Scorch height and critical FL for crown fire initiation (FLCRIT) were based on Van Wagner (1977) We estimated PC using a downward concave function where PC = 32 when flame length = FLCRIT and PC = 100 when FL is ge30 of stand top height (the average height of the 40 largest trees by diameter) (Ager et al 2010 A Ager personal communication) The derived C loss functions were combined
with the probabilistic estimates of surface fire behavior produced in Randig simulations to estishymate the ldquoexpected Crdquo emitted in wildfire or conshytained in biomass We estimated expected C emissions and post-fire biomass C for each pixel as follows
20 X[ ]Efrac12 ]C i frac14 BPij X Cij
ifrac140
where E[C]j is the expected wildfire emissions of C from pixel j or biomass C in pixel j in mass per unit area BPij is the probability of burning at the ith FL class for pixel j and Cij is the C emitshyted from pixel j or the biomass C remaining in pixel j post-wildfire given burning at the ith FL class Expected C emissions and biomass C were
summed across all pixels in the core study area to obtain total expected wildfire emissions and expected terrestrial C for each treatment scenario In order to compare our modeling results to
other analyses that reported wildfire emissions on a per area basis we used a different method to estishymate C emissions per area burned Because wildshyfires burned both the core and buffer areas of our study landscape while emissions were estimated only in the core area we used conditional expected wildfire emissions to approximate the emissions from a wildfire burning entirely within the core study area Conditional expected emissions are those produced for an area given that the area is burned Conditional emissions were estimated for each pixel as follows
wwwesajournalsorg 8 January 2017 Volume 8(1) Article e01648
CHIONO ET AL
Table 2 Total area and proportion of area treated by category in each treatment scenario
SC1 SC2 SC3
Proportion of Proportion of Proportion of Treatment category Area (ha) area treated Area (ha) area treated Area (ha) area treated
Treated 11081 100 11082 100 11081 100 Avail for treatmentdagger 22042 199 28998 262 45647 412 Owl habitat treated 00 000 2769 025 1127 010 Private land treated 00 000 00 000 5685 051 Hand thin 1499 014 3819 034 1612 015 Biomass thin 8404 076 7240 065 9470 085 Commercial thin 7765 070 6916 062 9470 085 Broadcast burn 9410 085 7247 065 3785 034 Pile burn 1671 015 3835 035 7296 066
dagger Total land area potentially available for treatment in each scenario The area available for treatment increased from Scenarshyios 1 to 3 as restrictions on the area available for treatment were relaxed
20 X C WCfrac12 ]j frac14
BPij X WCijBPjifrac141
where C[WC]j is the C emitted by wildfire from pixel j in mass per unit area BPj is the probability that pixel j is burned BPij is the probability of burning at the ith FL class and WCij is the C emitted from pixel j when burned at the ith FL class
Conditional expected emissions were averaged across all pixels to obtain an estimate of wildfire emissions per area burned
Large fire revisionmdashWildfire modeling was calishybrated to produce fire sizes that approximated area burned in spread events of historical large wildfires near the study area However during the course of the study a very large fire encounshytered our study area The King Fire began on 13 September 2014 in El Dorado County and burned 39545 hamdashmore than an order of magnishytude greater than our modeled wildfires includshying gt25 of the study area Given the potential for very large wildfires in this region demonshystrated by the King Fire we completed addishytional wildfire modeling to estimate the C effects of treatment given the occurrence of a very large fire
Randig modeling was repeated for the no-treatment and S3 scenarios using the high fuel model range and a revised burn period number of simulated ignitions wind speed and wind directions Burn period was increased from 5 to 12 h number of ignitions was reduced by half to 40000 Wind directions and relative probabilities (Appendix S1 Table S5) were those recorded at
Hell Hole RAWS between 0400 and 1900 hours on 17 September the day of the King Firersquos larshygest spread event We used the probable 1-min maximum wind speed as calculated from the maximum gust recorded on that day 33 kmh (205 mph) based on maximum gust of 547 kmh (34 mph) (Crosby and Chandler 1966) These settings produced average fire sizes of NT = 10757 ha (no-treatment scenario) and 8070 ha (S3) Average fire size was limited by the size of our buffered study area Longer burn periods resulted in an increasing number of simulated wildfires that burned to the study area boundary
RESULTS
Treatment simulation Table 2 provides a summary of the area treashy
ted in each scenario Scenario 1 (S1) was the most restrictive with respect to the land area available for treatment which more than doushybled between S1 and S3 Because treatment preshyscriptions varied with land designation (public owl PAC private) and the designations availshyable for treatment varied between scenarios the relative proportions of thinning and burning methods also varied between scenarios Comshymercial and biomass thinning were applied most frequently in S3 which permitted treatshyment of private land Spotted owl activity censhyters composed 25 of the area treated in S2 vs 10 in S3 and 0 in S1 the scenario in which PACs were not subject to treatment As a result the area treated with hand thinning in S2 was more than twice that in S1 and S3 Due to the
wwwesajournalsorg 9 January 2017 Volume 8(1) Article e01648
CHIONO ET AL
Fig 4 Low fuel model range treatment locations and difference in conditional burn probability (CBP) and conshyditional flame length (CFL) (untreated-treated) for each treatment scenario Negative values indicate an increase in CBP or CFL while positive values represent a reduction CBP is the likelihood that a pixel will burn given a single ignition on the landscape and assuming the simulation conditions described in Appendix S1 Table S1 and in the text Conditional flame length is the probability-weighted flame length given these same assumptions
inclusion of PACs in S2 and both PACs and prishyvate land in S3 the proportion of area treated with pile burning increased between S1 and S3 while broadcast burn area exhibited an opposite trend Despite the variation in land designations available for treatment the pattern of treatshyment placement was generally similar between scenarios with treatments concentrated in the central and eastern portions of the study area (Figs 4 5)
Landscape-scale burn probability and fire hazard Conditional burn probabilitymdashThe pixel-to-pixel
change in CBP between the untreated scenario and each treatment scenario is mapped in Figs 4 (LO FM) and 5 (HI FM) Treatment reduced landshyscape burn probability by approximately 50 (Table 3) from 00124 (NT) to 00062 (S1) 00059 (S2) and 00055 (S3) Within treatment units avershyage CBP fell by 69ndash76 to 00033ndash00035 outside of treated stands CBP fell to 00060ndash00069 Some
wwwesajournalsorg 10 January 2017 Volume 8(1) Article e01648
CHIONO ET AL
Fig 5 Treatment locations and high fuel model range difference in conditional burn probability and condishytional flame length (untreated-treated) for each treatment scenario
increases in CBP were also observed particularly for the low fuel model range (Fig 4)
The influence of treatment on owl PAC likelishyhood of burning was similar to that observed for stands in general For treated PACs average CBP fell by ~70 relative to no treatment for the same stands Although PACs were not eligible for treatment in S1 all treatment scenarios had a large impact on estimated PAC CBP Average PAC CBP was reduced from 0013 to 00063 in S1 00049 in S2 and 00054 in S3 a 49ndash64 decrease relative to PACs in the no-treatment landscape (Table 3)
Fire hazardmdashTreatments reduced average landshyscape CFL by ~1 m from 36 m (NT) to 25ndash27 m Pixel-level CFL was reduced by a maximum of 80 m (LO FM) and 90 m (HI FM) Increases in CFL were also observed however particularly near the study arearsquos western and southwestern boundaries where treatments were least concentrated (Figs 4 5) Maximum pixel-level CFL increases were 25 m (LO FM) and 31 m (HI FM) Because fire hazard was used in prioritizing
stands for treatment the estimated pre-treatment CFL in stands selected for treatment (43ndash51 m)
wwwesajournalsorg 11 January 2017 Volume 8(1) Article e01648
CHIONO ET AL
Table 3 Proportional change in burn probability for treatment scenarios compared to the NT scenario
LO FM HI FM AVG
Stand type
S1 S2 S3 Proportional change
relative to NT
S1 S2 S3 Proportional change
relative to NT
S1 S2 S3 Proportional change
relative to NT
All PACs -045 -064 -056 -053 -063 -059 -049 -064 -057 Treated PACs NA -081 -076 NA -057 -067 NA -069 -072 Untreated PACs -045 -053 -051 -053 -054 -058 -049 -053 -054 All stands Treated stands
-044 -076
-048 -079
-053 -063
-050 -072
-053 -074
-056 -074
-047 -074
-050 -076
-054 -069
Untreated stands -035 -039 -049 -045 -047 -051 -040 -043 -050
Notes NT no treatment PACs protected activity centers Proportions are ratios of treatment values to no-treatment values as calculated for the same stands Treatment and no-treatment values were calculated as the average pixel value for the low and high fuel model range (LO FM and HI FM) within each stand category and treatment scenario
was greater than in stands not selected (32ndash 33 m) After treatment average CFL within treashyted stands fell to 13 (S1 and S2) and 17 m (S3) CFL in untreated stands was also reduced as a result of the influence of treatments on fire spread and intensity CFL fell by 05ndash08 m (9ndash 16) relative to CFL in the same stands within the no-treatment landscape (Table 4)
Although spotted owl PACs were not treated in S1 relative to PACs in the NT landscape PAC CFL was reduced by 10 (to 32 m) in S1 Treating PACs had a much larger impact on potential fire intensity however Average treashyted PAC CFL fell to 13 and 14 m in S2 and S3 respectively
Carbon consequences of landscape fuel treatments
Prior to treatment aboveground landscape carbon totaled 14705 tonnesha on average Treatments removed 14 of pre-treatment C from treated stands or 2374 tonnesha totaling
81772ndash119103 tonnes of C in harvested biomass and merchantable material (Tables 5 and 6) Both the treatment scenarios and the choice of
fuel models were important influences on estishymated C emissions from burning As the least restrictive treatment scenario in terms of treatshyment location and the only scenario to include treatment of private land where broadcast burnshying was precluded as a treatment option the S3 treatment scenario was associated with the lowshyest wildfire and prescribed burning emissions (Tables 5 and 6) For each treatment scenario expected wildfire emissions increased by more than an order of magnitude between the low and high fuel model ranges This difference was the result of increasing fire intensity as well as wildshyfire size Average wildfire size nearly doubled between fuel model ranges in the treatment sceshynarios and tripled in the no-treatment scenario (Fig 6) For a given treatment scenario wildfire emissions on a per hectare basis were approxishymately two tonnes greater for the high fuel
Table 4 Proportional change in conditional flame length for treatment scenarios compared to the NT scenario
LO FM HI FM AVG
Stand type
S1 S2 S3 Proportional change
relative to NT
S1 S2 S3 Proportional change
relative to NT
S1 S2 S3 Proportional change
relative to NT
All PACs -009 -042 -028 -012 -043 -027 -010 -042 -028 Treated PACs NA -071 -075 NA -071 -073 NA -071 -074 Untreated PACs -009 -014 -011 -012 -017 -014 -010 -016 -013 All stands -022 -026 -031 -025 -026 -028 -024 -026 -030 Treated stands -065 -069 -052 -071 -071 -073 -068 -070 -062 Untreated stands -008 -009 -021 -011 -012 -012 -009 -010 -016
Notes NT no treatment PACs protected activity centers Proportions are ratios of treatment values to no-treatment values as calculated for the same stands Treatment and no-treatment values were calculated as the average pixel value for the low and high fuel model range (LO FM and HI FM) within each stand category and treatment scenario
wwwesajournalsorg 12 January 2017 Volume 8(1) Article e01648
CHIONO ET AL
Table 5 Expected biomass carbon expected wildfire C emissions and C harvested and emitted in fuel treatshyments for NT and treatment (S1 S2 S3) scenarios using the low fuel model range in fire modeling
Carbon pool NT S1 S2 S3
Untreated stands Tonnes C Live 5004505 3915044 3695489 3954131 Dead 1845659 1421704 1378824 1466202 Wildfire emissions 2372 1137 1039 904
Treated stands Live 881358 1072625 826366 Dead 260089 299244 220932 All harvested biomass 88773 81772 119103 Prescribed fire emissions 178530 169693 122599 Wildfire emissions 48 56 61
All stands Live 5004505 4796402 4768113 4780497 Dead 1845659 1681793 1678068 1687135 Treatment (harvested and emitted) 267303 251465 241702 Wildfire emissions 2372 1186 1095 965
Grand totals 6852536 6746684 6698741 6710299
Notes LF indicates the large fire scenarios Expected C is that remaining in the core study area following treatment if applishycable and a random ignition and wildfire in the larger buffered study area as estimated from the simulation of many wildfires Live C is that contained in live aboveground herb shrub and tree biomass dead C is the C contained in litter duff woody surshyface fuel and aboveground portions of tree snags NT no treatment
model range than for the low range In contrast to the large influence of fuel model choice on wildfire emissions the effect of fuel model range on prescribed fire emissions was minimal with only a 1 increase in emissions between the low and high fuel model ranges for a given treatment scenario
Although treatment significantly reduced wildshyfire emissions combined emissions from preshyscribed burning on 20 of the landscape and wildfire exceeded wildfire emissions in the no-treatment scenarios (Tables 5 and 6) Relative to the no-treatment scenarios treatment reduced estimated wildfire emissions by approximately 54 (low fuel model range) 59 (high fuel model range) and 45 (large fire scenarios) Yet preshyscribed burning was a far more significant source of emissions than were wildfires of moderate size with emissions from treatment exceeding wildfire emissions by 111259ndash177344 tonnes Even for the large wildfire simulations where landscape treatments nearly halved estimated wildfire emisshysions the combined carbon emissions from preshyscribed burning and wildfire in the treatment scenario surpassed wildfire emissions in the no-treatment scenario by 45 (Table 6 Fig 7)
The total quantity of aboveground C expected to remain on the landscape following treatment
and a randomly ignited wildfire was greatest for the no-treatment scenarios (Tables 5 and 6) For modeled wildfires of moderate size treatment reduced both the live and dead C pools relative to the no-treatment scenarios and terrestrial C in the no-treatment scenarios was 4ndash5 greater (323316 ndash434960 tonnes) than in any of the treatment scenarios (Tables 5 and 6) In comparison under large wildfire conditions the treatment scenario retained slightly more live biomass C~15000 tonshynes or 03 more than the no-treatment scenario However treatment also reduced necromass C by 288000 tonnes (12) resulting in a 3 overall decrease in onsite biomass C relative to an untreshyated landscape (Table 6) The proportional changes in aboveground
biomass C pools between the treatment and no-treatment scenarios are summarized in Table 7 For all treatment scenarios the consumption of duff litter and downed woody fuels with preshyscribed burning contributed to a net reduction in these C pools relative to the untreated landscape Conversely treatments protected more C in the live understory (herb and shrub) poolmdashthe result of reduced wildfire size and intensity in the treatshyment scenarios Treatments in the moderate wildshyfire scenarios reduced live tree biomass C in comparison with no-treatment levels (Fig 8)
wwwesajournalsorg 13 January 2017 Volume 8(1) Article e01648
CHIONO ET AL
Table 6 Expected biomass carbon expected wildfire C emissions and C harvested and emitted in fuel treatshyments for NT and treatment (S1 S2 S3) scenarios using the high fuel model range in fire modeling
Carbon pool NT S1 S2 S3 NT-LF S3-LF
Untreated stands Tonnes C Live 4910239 3879854 3664690 3923358 4586898 3750774 Dead 1912429 1448947 1403313 1489629 2130034 1605591 Wildfire emissions 31831 12934 12001 11293 137622 68061
Treated stands Live 896670 1115918 853503 847374 Dead 280182 325628 238130 247744 All harvested biomass 88773 81772 119103 119103 Prescribed fire emissions 180357 171247 123539 123539 Wildfire emissions 798 951 986 8285
All stands Live 4910239 4776524 4780607 4776861 4586898 4598148 Dead 1912429 1729129 1728941 1727759 2130034 1853334 Treatment (harvested and emitted) 282862 265971 254921 254921 Wildfire emissions 31831 13732 12952 12279 137622 76346
Grand totals 6854499 6802247 6788471 6771820 6854554 6782749
Notes LF indicates the large fire scenarios Expected terrestrial C is that remaining in the core study area following treatshyment if applicable and a random ignition and wildfire in the larger buffered study area as estimated from the simulation of many wildfires Live C is that contained in live aboveground herb shrub and tree biomass dead C is the C contained in litter duff woody surface fuel and aboveground portions of tree snags NT no treatment
Notably in the large modeled wildfire scenarios (NT-LF and S3-LF) treatments resulted in a 400000-tonne increase in landscape-level live tree C over the no-treatment scenario
DISCUSSION
Fuel treatments in protected habitat Because there are often competing objectives
between managing forests for resilience to fire and drought and protecting owl habitat we assessed potential fire occurrence and hazard based on treatment scenarios that included and omitted treatment of PACs Conducting fuels management outside of occupied owl habitat has been suggested as a means of reducing fire risk within occupied sites (Jenness et al 2004 Tempel et al 2015) Ager et al (2007) reported that fuel treatments on 20 of a western Oregon landscape reduced the probability of northern spotted owl nesting and roosting habitat loss by 44 even though that habitat type was not treated As in Ager et al (2007) we observed modifications in fire intensity and burn probability within owl habitat even when it was left untreated In the S1 treatment scenario in which owl activity centers were not eligible for treatment the effect of treatshying other stands reduced both fire hazard (by
9ndash12 for CFL or approximately 04 m) and CBP (by ~45) within PACs It is difficult to assess the significance of this proportional reduction in CBP given that the absolute differences in probabilities were relatively modest (Figs 3 4) Ager et al (2007) noted that allowing treatment of owl habishytat would have significantly reduced estimated habitat loss in their study In this study it is expected that habitat quality may be reduced within treated PACs in the short term through the removal of small-diameter trees (ie lower vertical structural heterogeneity) However two structural attributes for suitable spotted owl nestshying habitat identified by Tempel et al (2015) high canopy cover and large tree density would not be altered While we did not directly estimate habitat loss we did observe much larger reductions in fire hazard within PACs that were treated as meashysured by CFL (71ndash75 reduction equivalent to 2ndash3 m) It should be noted that the effect of wideshyspread treatments within PACs on spotted owl nesting and foraging behavior is unknown One concern with designating some land area
unavailable for treatment is that it may limit the potential for treatments to alter fire behavior across the landscape (eg Finney 2001) Including all stands in the potential treatment pool allows the highest-priority stands with respect to simulated
wwwesajournalsorg 14 January 2017 Volume 8(1) Article e01648
CHIONO ET AL
effects on landscape-level fire behavior The true effect of increasing the land area available for treatshyment may be partially obscured by the varying frequency of treatment prescriptions between sceshynarios For example the hand thinning treatments applied within PACs would be expected to have a milder effect on potential wildfire behavior than more severe prescriptions and hand thinning was twice as common in S2 as in the other scenarios
Terrestrial carbon and burning emissions Landscape treatments reduced wildfire emisshy
sions by reducing the emissions produced per area burned by wildfire as well as average wildfire size On average wildfires in the treated landscapes released 193ndash216 tonnes Cha while wildfires in the untreated landscapes released 234ndash254 tonnes Cha Modeled wildfires decreased in size by 7 (low fuel model range) 36 (high fuel model range) and 25 (large fire scenario) relative to untreated landscapes (Fig 6) Since the burn pershyiod for simulated wildfires was held constant between scenarios this reduction in average wildshyfire size is the result of reduced spread rates derived from fuel treatments Despite the influence of treatments on wildfire
intensity size and expected emissions treatment-related emissions exceeded the avoided wildfire emissions conferred by treatment Prescribed burning in our study a combination of broadcast
Fig 6 Wildfire size relative frequency distributions from wildfire simulations Bar color represents no-treatment (NT) and treatment scenarios (S1ndashS3)
fire spread to be treated which would be expected to achieve the greatest modification of landscape fire behavior and effects In the present study although the land area potentially available for treatment more than doubled between S1 and S3 landscape-level effects of treatment on modeled fire risk and hazard were fairly similar (compared with the no-treatment landscape all-stand CBP fell by 47 and 54 in S1 and S3 while CFL fell by 24 and 30) Dow et al (2016) also found that incorporating modest restrictions on treatment Fig 7 Carbon emissions (tonnes) from wildfire and
area availability (24 of the landscape unavail- prescribed burning X-axis labels indicate no-treatment able) had minimal consequences for modeled fire (NT) and treatment scenarios (S1ndashS3) subscripts size and hazard The modest changes in estimated denote fuel model ranges used in fire modeling
fire metrics we observed may also be due to simi- (L low H high) Large fire scenarios which were
larity in the general pattern of treatment placement modeled with the high fuel model range only are indishybetween scenarios which probably led to similar cated by LF
wwwesajournalsorg 15 January 2017 Volume 8(1) Article e01648
CHIONO ET AL
Table 7 Proportional change in expected carbon by biomass pool for treatment scenarios compared to the no-treatment landscape
Treatment Standing Down dead Forest Herb Live scenario dead wood floor shrub tree
S1 004 -017 -013 014 -004 S2 001 -016 -012 014 -004 S3 -001 -015 -010 016 -004 S3-LF -016 -013 -008 017 000
Notes For example a value of -010 represents a 10 decshyline in biomass C from the no-treatment scenario Treatment and no-treatment values were calculated as the average of low and high fuel model range values except in the case of the large fire (LF) scenarios which were modeled for the high fuel model range only Expected C is that remaining after a random ignition and wildfire in the buffered study area as estimated from simulating 80000 ignitions (LF 40000 ignitions)
C pool categories are those reported in Forest Vegetation Simulator Carbon Reports Standing dead aboveground porshytion of standing dead trees Down dead wood woody surface fuels Forest floor litter and duff Herbshrub herbs and shrubs Live tree aboveground portion of live trees
and pile burning released 111ndash163 tonnes Cha For comparison studies conducted in comparable forest types have estimated prescribed fire emisshysions of 127 tonnes Cha (warm dry ponderosa pine habitat types Reinhardt and Holsinger 2010)
Fig 8 Expected carbon contained in aboveground live and dead tree biomass Expected C is that remainshying in the core study area following treatment (if applishycable) and a single random ignition within the larger buffered study area X-axis labels indicate no-treatment (NT) and treatment scenarios (S1ndashS3) subshyscripts denote fuel model ranges used in fire modeling (L low H high) Large fire scenarios which were modeled for the high fuel model range only are indishycated by LF
and 148 tonnes Cha (an old-growth mixed-conifer reserve in the southern Sierra Nevada North et al 2009a) Relative to the approximately 158000 tonnes C emitted in prescribed burning avoided wildfire emissions at 1186ndash19551 tonnes for wildfires of moderate size were small A simishylar study in southern Oregon with average modshyeled wildfires of 2350 and 3500 ha (treatment and no-treatment scenarios respectively) found that treatments reduced expected wildfire emissions by 6157 tonnes of C (Ager et al 2010) Surface fuels represented with surface fuel
models in commonly used modeling software are the most influential inputs determining preshydicted fire behavior (Hall and Burke 2006) Fire behavior fire sizes and emissions in this study varied according to fuel model assignment highshylighting the importance of selecting the approprishyate fuel model to represent fuel conditions (see Collins et al 2013) We show a 12- to 14-fold change in wildfire emissions due solely to the choice of fuel models (Tables 5 and 6) Indeed the range of fuel models used in recent studies investigating fuel treatments and simulated fire behavior in mixed-conifer forests is noteworthy Incorporating a range of fuel models into analyshyses such that outcome variability can be reported facilitates comparison of effects across studies Our estimates of the aboveground C benefits
of treatment under the moderate wildfire scenarshyios with average fire sizes of le2133 ha are likely conservative The effect of modeled wildfire size on the C consequences of fuel treatment was conshysiderable emphasizing the importance of this variable in studies of the climate benefits of treatshyment Avoided wildfire emissions resulting from treatment increased to 61276 tonnes C when large wildfires (8070ndash10757 ha) were simulated The treatment scenario given large wildfires also protected a greater portion of live tree C If the ~40000-ha King Fire is representative of the magnitude of future wildfires in the region C accounting should improve with respect to treatshyment favorability Similarly if multiple wildfires were to encounter the study area within the effective lifespan of treatments the C gains assoshyciated with avoided emissions in the treatment scenarios would increase Our approach to estimating the C conseshy
quences of fuel treatments has a number of limitashytions A full accounting of treatment effects
wwwesajournalsorg 16 January 2017 Volume 8(1) Article e01648
CHIONO ET AL
would project through time the consequences of both treatment and wildfire Our analysis is static incorporating only the short-term C costs and benefits of treatment Simulating wildfire in the year immediately following treatment maximizes the apparent benefits of treatment Over time as surface fuels accumulate and vegetation regenershyates maintenance would be required to retain the effectiveness of treatments (Martinson and Omi 2013) increasing the C costs of reduced fire hazard In addition the C contained in fire-killed biomass will ultimately be emitted to the atmoshysphere although biomass decay could be delayed through conversion to long-lived wood products such as building materials (Malmsheimer et al 2011) It is also important to note that our analysis did not include stochastic wildfire occurrence Estimates of burn probability in the present study are not estimates of the likelihood of wildfire occurrence based on historical fire sizes and freshyquency (eg Preisler et al 2004 Mercer and Prestemon 2005 Brillinger et al 2006) but rather are conditional on a single randomly ignited wildfire within the buffered study area
CONCLUSIONS
Our findings generally support those of Campshybell et al (2011) who concluded from an analysis of fire-prone western forests that the C costs of treatments are likely to outweigh their benefits under current depressed fire frequencies In a more recent paper Campbell and Ager (2013) conshycluded that ldquonone of the fuel treatment simulation scenarios resulted in increased system carbonrdquo primarily from the low incidences of treated areas being burned by wildfire However our interpreshytation of these findings differs from those disshycussed in Campbell et al (2011) and Campbell and Ager (2013) especially in light of recent and projected future trends in fire activity (Westerling et al 2011 Miller and Safford 2012 Dennison et al 2014) The current divergence of increasing surface air temperatures and low fire activity is unlikely to be sustained further suggesting greater future fire activity (Marlon et al 2012) If increased fire activity is realized then the likelishyhood of a given area being burned in a wildfire increases This differs from the simple increase in stand-level fire frequency modeled by Campbell et al (2011) because increases in fire likelihood are
not necessarily associated with corresponding decreases in fire severity as assumed by Campbell et al (2011) Increased fire likelihood could very well lead to positive feedbacks in fire severity and ultimately to vegetation type conversion (Copposhyletta et al 2016)mdasheffects that would have signifishycant implications for carbon storage Due to the significant emissions associated
with treatment and the low likelihood that wildshyfire will encounter a given treatment area forest management that is narrowly focused on C accounting alone would favor the no-treatment scenarios Landscape treatments protected more C in live tree biomass only when large wildfires were simulated While treatment favorability improved with large wildfire simulation the no-treatment scenario still produced fewer emissions than the treatment scenario Given the potential for large wildfire in the region as demonstrated by the 2014 King Fire and the increasing freshyquency of large wildfires and area burned in Calishyfornia expected from climate modeling studies (Lenihan et al 2008 Westerling et al 2011) we suggest that future studies of fuel treatmentndashwildshyfirendashC relationships should incorporate the potenshytial for large wildfires at a frequency greater than those observed over the last 20ndash30 yr Others have argued that treatments to increase forest resilience should be a stand-alone top land management priority independent of other ecosystem values such as carbon sequestration and fire hazard reduction (Stephens et al 2016a) We also note that the potential benefits of fuels
management are not restricted to avoided wildshyfire emissions Here we show that landscape fuel treatments can alter fire hazard across the landshyscape both within and outside of treated stands and have the potential to affect the likelihood of burning and fire intensity within protected Calishyfornia spotted owl habitat Underscoring the risk to sensitive habitat the 2014 King Fire encounshytered 31 PACs within our study area leading to the greatest single-year decline in habitat occushypancy recorded over a 23-yr study period (Jones et al 2016) Modest simulated treatments within activity centers significantly reduced potential fire intensity relative to both the no-treatment landscape and a treatment scenario that did not permit treatment within PACs indicating that active management may be desirable to protect habitat in the long term (Roloff et al 2012)
wwwesajournalsorg 17 January 2017 Volume 8(1) Article e01648
CHIONO ET AL
However treatments conducted outside of owl habitat also reduced wildfire hazard
ACKNOWLEDGMENTS
We are grateful to a number of individuals for sharshying their time and fuel treatment and fire modeling expertise Nicole Vaillant (ArcFuels) Alan Ager and Andrew McMahan (carbon estimation) and Coeli Hoover (harvest simulations in FVS-FFE) Brian Ebert and Dana Walsh of the Eldorado National Forest proshyvided invaluable advice on weather inputs for fire modeling and on designing fuel treatment prescripshytions Ken Somers Operations Forester on the Blodgett Forest Research Station gave advice concerning timshyber management on private land We also thank two anonymous reviewers whose comments greatly improved this article The California Energy Commisshysion provided funding for this project
LITERATURE CITED
Ager A A B Bahro and K Barber 2006 Automating the fireshed assessment process with ArcGIS Pages 163ndash167 in P L Andrews and B W Butler (Comps) Fuels ManagementndashHow to Measure Success Conference Proceedings Portland OR March 28ndash30 2006 Proceedings RMRS-P-41 USDA Forest Service Rocky Mountain Research Station Fort Collins Colorado USA
Ager A A M A Finney B K Kerns and H Maffei 2007 Modeling wildfire risk to northern spotted owl (Strix occidentalis caurina) habitat in Central Oregon USA Forest Ecology and Management 24645ndash56
Ager A A M A Finney A McMahan and J Cathcart 2010 Measuring the effect of fuel treatments on forshyest carbon using landscape risk analysis Natural Hazards and Earth System Science 102515ndash2526
Ager A A N M Vaillant D E Owens S Brittain and J Hamann 2012 Overview and example application of the Landscape Treatment Designer Pages 11 General Technical Report PNW-GTR-859 USDA Forest Service Pacific Northwest Research Station Portland Oregon USA
Barbour M G and R A Minnich 2000 Californian upland forests and woodlands Pages 131ndash164 in M Barbour and W Billings editors North Amerishycan terrestrial vegetation Cambridge University Press Cambridge UK
Bias M A and R Gutimerrez 1992 Habitat associations of California spotted owls in the central Sierra Nevada Journal of Wildlife Management 56584ndash595
Bond M L R Gutierrez A B Franklin W S LaHaye C A May and M E Seamans 2002
Short-term effects of wildfires on spotted owl surshyvival site fidelity mate fidelity and reproductive success Wildlife Society Bulletin 301022ndash1028
Brillinger D H Preisler and J Benoit 2006 Probashybilistic risk assessment for wildfires Environ-metrics 17623ndash633
Campbell J L and A A Ager 2013 Forest wildfire fuel reduction treatments and landscape carbon stocks a sensitivity analysis Journal of Environshymental Management 121124ndash132
Campbell J L M E Harmon and S R Mitchell 2011 Can fuel-reduction treatments really increase forest carbon storage in the western US by reducshying future fire emissions Frontiers in Ecology and the Environment 1083ndash90
Cathcart J A A Ager A McMahan M Finney and B Watt 2010 Carbon benefits from fuel treatshyments Pages 61ndash80 in T B Jain R T Graham and J Sandquist editors Integrated management of carbon sequestration and biomass utilization opportunities in a changing climate Proceedings of the 2009 National Silviculture Workshop Boise Idaho June 15ndash18 2009 USDA Forest Service Proshyceedings RMRS-P-61 Rocky Mountain Research Station Fort Collins Colorado USA
Chatfield A H 2005 Habitat selection by a California spotted owl population a landscape scale analysis using resource selection functions Thesis Univershysity of Minnesota St Paul Minnesota USA
Collins B M H A Kramer K Menning C Dilling-ham D Saah P A Stine and S L Stephens 2013 Modeling hazardous fire potential within a comshypleted fuel treatment network in the northern Sierra Nevada Forest Ecology and Management 310156ndash166
Collins B M S L Stephens J J Moghaddas and J Battles 2010 Challenges and approaches in planshyning fuel treatments across fire-excluded forested landscapes Journal of Forestry 10824ndash31
Collins B M S L Stephens G B Roller and J J Battles 2011 Simulating fire and forest dynamics for a landscape fuel treatment project in the Sierra Nevada Forest Science 5777ndash88
Coppoletta M K E Merriam and B M Collins 2016 Post-fire vegetation and fuel development influences fire severity patterns in reburns Ecologishycal Applications 26686ndash699
Crookston N L and A O Finley 2008 yaimpute an r package for knn imputation Journal of Statistical Software 231ndash16
Crookston N L M Moeur and D L Renner 2002 Userrsquos guide to the most similar neighbor imputashytion program version 2 General Technical Report RMRS-GTR-96 USDA Forest Service Rocky Mountain Research Station Ogden Utah USA
wwwesajournalsorg 18 January 2017 Volume 8(1) Article e01648
CHIONO ET AL
Crosby J and C Chandler 1966 Get the most from your windspeed observations Fire Control Notes 2712ndash13
Dailey S J Fites A Reiner and S Mori 2008 Fire behavior and effects in fuel treatments and proshytected habitat on the Moonlight fire Fire Behavior Assessment Team wwwfsfedusadaptivemana gementprojectsFBATdocsMoonlightFinal_8_6_08 pdf
Dennison P E S C Brewer J D Arnold and M A Moritz 2014 Large wildfire trends in the western United States 1984ndash2011 Geophysical Research Letters 412928ndash2933
Dixon G E 2002 Essential FVS a userrsquos guide to the forest vegetation simulator Pages 193 USDA Forest Service Forest Management Service Center Fort Collins Colorado USA
Dore S T E Kolb M Montes-Helu B W Sullivan W D Winslow S C Hart J P Kaye G W Koch and B A Hungate 2008 Long-term impact of a stand-replacing fire on ecosystem CO2 exchange of a ponderosa pine forest Global Change Biology 141ndash20
Dore S M Montes-Helu S C Hart B A Hungate G W Koch J B Moon A J Finkral and T E Kolb 2012 Recovery of ponderosa pine ecosystem carbon and water fluxes from thinning and stand-replacing fire Global Change Biology 183171ndash3185
Dow C J B M Collins and S L Stephens 2016 Incorporating resource protection constraints in an analysis of landscape fuel-treatment effectiveness in the Northern Sierra Nevada California USA Environmental Management 571ndash15
Eidenshink J B Schwind K Brewer Z Zhu B Quayle and S Howard 2007 A project for monshyitoring trends in burn severity Fire Ecology 33ndash21
Evans A M and A J Finkral 2009 From renewable energy to fire risk reduction a synthesis of biomass harvesting and utilization case studies in US forshyests GCB Bioenergy 1211ndash219
Finkral A J and A M Evans 2008 The effects of a thinning treatment on carbon stocks in a northern Arizona ponderosa pine forest Forest Ecology and Management 2552743ndash2750
Finney M A 2001 Design of regular landscape fuel treatment patterns for modifying fire growth and behavior Forest Science 47219ndash228
Finney M A 2002 Fire growth using minimum travel time methods Canadian Journal of Forest Research 321420ndash1424
Finney M A 2006 An overview of FlamMap fire modeling capabilities Pages 213ndash220 in P L Andrews and B W Butler editors Proceedings of Fuels ManagementndashHow to Measure Success Research Paper RMRS-P-41 USDA Forest Service
Rocky Mountain Research Station Portland Oregon USA
Finney M A R C Seli C W McHugh A A Ager B Bahro and J K Agee 2007 Simulation of longshyterm landscape-level fuel treatment effects on large wildfires International Journal of Wildland Fire 16712ndash727
Fulme P Z J E Crouse J P Roccaforte and E L Kalies 2012 Do thinning andor burning treatments in western USA ponderosa or Jeffrey pine-dominated forests help restore natural fire behavior Forest Ecology and Management 26968ndash81
Gaines W L R J Harrod J Dickinson A L Lyons and K Halupka 2010 Integration of Northern spotted owl habitat and fuels treatments in the eastern Cascades Washington USA Forest Ecolshyogy and Management 2602045ndash2052
Gaines W L R A Strand and S D Piper 1997 Effects of the hatchery complex fires on northern spotted owls in the eastern Washington Cascades Pages 123ndash129 in J N Greenlee editor Proceedings of the Fire Effects on Rare and Endangered Species and Habitats Conference Coeur DrsquoAlene Idaho International Association of Wildfire and Forestry Hot Springs South Dakota USA
Hall S A and I C Burke 2006 Considerations for characterizing fuels as inputs for fire behavior models Forest Ecology and Management 227 102ndash114
Hoover C and S Rebain 2008 The Kane Experimenshytal Forest carbon inventory carbon reporting with FVS Pages 13ndash15 in R N Havis and N L Crookston editors Third Forest Vegetation Simushylator Conference Fort Collins Colorado February 13ndash15 2007 USDA Forest Service Rocky Mountain Research Station Fort Collins Colorado USA
Hurteau M and M North 2009 Fuel treatment effects on tree-based forest carbon storage and emissions under modeled wildfire scenarios Fronshytiers in Ecology and the Environment 7409ndash414
Hurteau M D and M North 2010 Carbon recovery rates following different wildfire risk mitigation treatments Forest Ecology and Management 260 930ndash937
Hurteau M D M T Stoddard and P Z Fulme 2011 The carbon costs of mitigating high-severity wildshyfire in southwestern ponderosa pine Global Change Biology 171516ndash1521
Jenness J S P Beier and J L Ganey 2004 Associashytions between forest fire and Mexican spotted owls Forest Science 50765ndash772
Jones G M R Gutimerrez D J Tempel S A Whitmore W J Berigan and M Z Peery 2016 Megafires an emerging threat to old-forest species Frontiers in Ecology and the Environment 14300ndash306
wwwesajournalsorg 19 January 2017 Volume 8(1) Article e01648
CHIONO ET AL
Laymon S A 1988 Ecology of the spotted owl in the central Sierra Nevada California Dissertation University of California Berkeley California USA
Lenihan J M D Bachelet R P Neilson and R Drapek 2008 Response of vegetation distribution ecosystem productivity and fire to climate change scenarios for California Climatic Change 87215ndash230
Lydersen J M B M Collins E E Knapp G B Roller and S Stephens 2015 Relating fuel loads to overshystorey structure and composition in a fire-excluded Sierra Nevada mixed conifer forest International Journal of Wildland Fire 24484ndash494
Malmsheimer R J Bowyer J Fried E Gee R Islar R Miner I E Munn E Oneil and W C Stewart 2011 Managing forests because carbon matters integrating energy products and land manageshyment policy Journal of Forestry 109S7ndashS50
Marlon J R et al 2012 Long-term perspective on wildfires in the western USA Proceedings of the National Academy of Sciences of the United States of America 109E535ndashE543
Martinson E J and P N Omi 2002 Performance of fuel treatments subjected to wildfires Pages 7ndash13 in P N Omi and L A Joyce editors Conference on Fire Fuel Treatments and Ecological Restorashytion USDA Forest Service Rocky Mountain Research Station Fort Collins Colorado USA
Martinson E J and P N Omi 2013 Fuel treatments and fire severity a meta-analysis Pages 38 USDA Forest Service Rocky Mountain Research Station Fort Collins Colorado USA
Mayer K E and W F Laudenslayer 1988 A guide to wildlife habitats of California California Departshyment of Forestry and Fire Protection Sacramento California USA
McKenzie D Z Gedalof D L Peterson and P Mote 2004 Climatic change wildfire and conservation Conservation Biology 18890ndash902
Mercer D E and J P Prestemon 2005 Comparing production function models for wildfire risk analyshysis in the wildlandndashurban interface Forest Policy and Economics 7782ndash795
Miller J D and H Safford 2012 Trends in wildfire severity 1984 to 2010 in the Sierra Nevada Modoc Plateau and southern Cascades California USA Fire Ecology 841ndash57
Miller J H Safford M Crimmins and A Thode 2009 Quantitative evidence for increasing forest fire severity in the Sierra Nevada and southern Cascade mountains California and Nevada USA Ecosystems 1216ndash32
North M 2012 Managing Sierra Nevada forests PSWshyGTR-237 USDA Forest Service Pacific Southwest Research Station Albany California USA
North M P and M D Hurteau 2011 High-severity wildfire effects on carbon stocks and emissions in fuels treated and untreated forest Forest Ecology and Management 2611115ndash1120
North M M Hurteau and J Innes 2009a Fire supshypression and fuels treatment effects on mixed-conifer carbon stocks and emissions Ecological Applications 191385ndash1396
North M P A Stine K OrsquoHara W Zielinski and S Stephens 2009b An ecosystem management strategy for Sierran mixed-conifer forests General Technical Report PSW-GTR-220 USDA Forest Service Pacific Southwest Research Station Albany California USA
Parisien M-A S Snetsinger J A Greenberg C R Nelson T Schoennagel S Z Dobrowski and M A Moritz 2012 Spatial variability in wildfire probability across the western United States Intershynational Journal of Wildland Fire 21313ndash327
Penman J M Gytarsky T Hiraishi T Krug D Kruger R Pipatti L Buendia K Miwa T Ngara and K Tanabe 2003 Good practice guidance for land use land-use change and forestry Institute for Global Environmental Strategies for the Intergovshyernmental Panel on Climate Change Hayama Kanagawa Japan
Pollet J and P N Omi 2002 Effect of thinning and prescribed burning on crown fire severity in ponderosa pine forests International Journal of Wildland Fire 111ndash10
Prather J W R F Noss and T D Sisk 2008 Real versus perceived conflicts between restoration of ponderosa pine forests and conservation of the Mexican spotted owl Forest Policy and Economics 10140ndash150
Preisler H K D R Brillinger R E Burgan and J Benoit 2004 Probability based models for estimation of wildfire risk International Journal of Wildland Fire 13133ndash142
Rebain S E Reinhardt N Crookston S Beukema W Kurz and J Greenough 2009 The fire and fuels extension to the Forest Vegetation Simulator Addendum to RMRS-GTR-119 USDA Forest Service and ESSA Technologies Ltd Fort Collins Colorado USA
Reinhardt E D and N L Crookston 2003 The fire and fuels extension to the forest vegetation simulashytor Pages 209 RMRS-GTR-116 USDA Forest Sershyvice Rocky Mountain Research Station Ogden Utah USA
Reinhardt E and L Holsinger 2010 Effects of fuel treatments on carbon-disturbance relationshyships in forests of the northern Rocky Mountains Forest Ecology and Management 2591427ndash1435
wwwesajournalsorg 20 January 2017 Volume 8(1) Article e01648
CHIONO ET AL
Reinhardt E D R E Keane D E Calkin and J D Cohen 2008 Objectives and considerations for wildland fuel treatment in forested ecosystems of the interior western United States Forest Ecology and Management 2561997ndash2006
Ritchie M W C N Skinner and T A Hamilton 2007 Probability of tree survival after wildfire in an interior pine forest of northern California effects of thinning and prescribed fire Forest Ecolshyogy and Management 247200ndash208
Roloff G J S P Mealey and J D Bailey 2012 Comshyparative hazard assessment for protected species in a fire-prone landscape Forest Ecology and Manshyagement 2771ndash10
Rothermel R C 1972 A mathematical model for preshydicting fire spread in wildland fuels Research Paper INT-115 USDA Forest Service Intermounshytain Forest and Range Experiment Station Ogden Utah USA
Safford H D 2008 Fire severity in fuel treatments American River Complex fire Tahoe National Forest California Unpublished Report USDA Forest Service Pacific Southwest Region Vallejo California USA
Schmidt D A A H Taylor and C N Skinner 2008 The influence of fuels treatment and landscape arrangement on simulated fire behavior Southern Cascade range California Forest Ecology and Management 2553170ndash3184
Scott J H and R E Burgan 2005 Standard fire behavior fuel models a comprehensive set for use with Rothermelrsquos surface fire spread model General Technical Report RMRS-GTR-153 USDA Forest Service Rocky Mountain Research Station Fort Collins Colorado USA
Scott J H M P Thompson and J W Gilbertson-Day 2016 Examining alternative fuel management strategies and the relative contribution of National Forest System land to wildfire risk to adjacent homesndasha pilot assessment on the Sierra National Forest California USA Forest Ecology and Manshyagement 36229ndash37
Smith J E and L S Heath 2002 A model of forest floor carbon mass for United States forest types Research Paper NE-722 USDA Forest Service Northeastern Research Station Newtown Square Pennsylvania USA
Stephens S L 2005 Forest fire causes and extent on United States Forest Service lands International Journal of Wildland Fire 14213ndash222
Stephens S L B M Collins E Biber and P Z Fulme 2016a US federal fire and forest policy emphasizshying resilience in dry forests Ecosphere 7e01584
Stephens S L J D Miller B M Collins M P North J J Keane and S L Roberts 2016b Wildfire impacts on California Spotted Owl nesting habitat in the Sierra Nevada Ecosphere 7e01584
Stephens S L J J Moghaddas B R Hartsough E E Y Moghaddas and N E Clinton 2009 Fuel treatshyment effects on stand-level carbon pools treatshyment-related emissions and fire risk in a Sierra Nevada mixed-conifer forest Canadian Journal of Forest Research 391538ndash1547
Stephens S L et al 2012 Fuel treatment impacts on estimated wildfire carbon loss from forests in Monshytana Oregon California and Arizona Ecosphere 31ndash17
Tempel D et al 2015 Evaluating short- and longshyterm impacts of fuels treatments and simulated wildfire on an old-forest species Ecosphere 61ndash19
USDA Forest Service 2004 Sierra Nevada Forest Plan Amendment Final supplemental environmental impact statement Record of decision Publication R5-MB-046 USDA Forest Service Pacific Southshywest Region Vallejo California USA
Van Wagner C E 1977 Conditions for the start and spread of crown fire Canadian Journal of Forest Research 723ndash34
Verner J K S McKelvey B R Noon R Gutimerrez G I Gould Jr and T W Beck 1992 Assessment of the current status of the California spotted owl with recommendations for management Pages 3ndash27 in J Verner K S McKelvey B R Noon R Gutimerrez G I Gould Jr and T W Beck edishytors The California Spotted Owl a technical assessment of its current status PSW-GTR-133 USDA Forest Service Albany California USA
Westerling A B Bryant H Preisler T Holmes H Hidalgo T Das and S Shrestha 2011 Climate change and growth scenarios for California wildshyfire Climatic Change 109445ndash463
Westerling A L H G Hidalgo D R Cayan and T W Swetnam 2006 Warming and earlier Spring increase Western US Forest Wildfire Activity Science 313940ndash943
Wiedinmyer C and M D Hurteau 2010 Prescribed fire as a means of reducing forest carbon emissions in the Western United States Environmental Science amp Technology 441926ndash1932
SUPPORTING INFORMATION
Additional Supporting Information may be found online at httponlinelibrarywileycomdoi101002ecs2 1648full
wwwesajournalsorg 21 January 2017 Volume 8(1) Article e01648
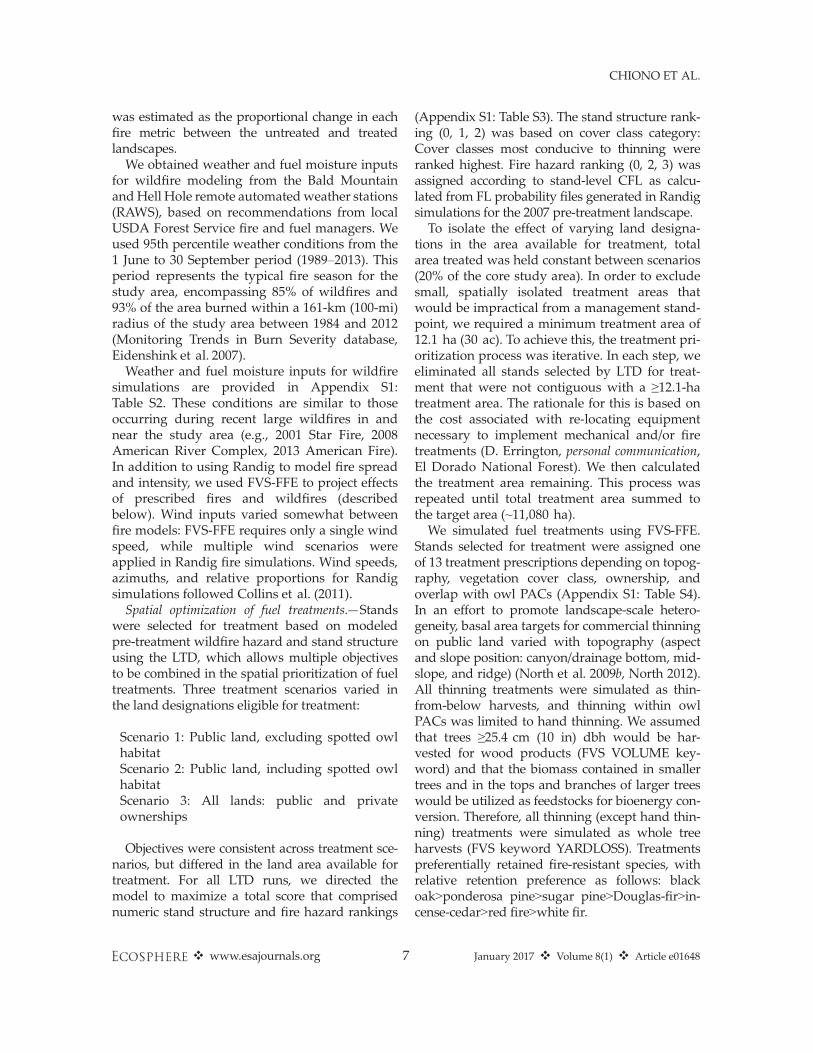
CHIONO ET AL
was estimated as the proportional change in each fire metric between the untreated and treated landscapes
We obtained weather and fuel moisture inputs for wildfire modeling from the Bald Mountain and Hell Hole remote automated weather stations (RAWS) based on recommendations from local USDA Forest Service fire and fuel managers We used 95th percentile weather conditions from the 1 June to 30 September period (1989ndash2013) This period represents the typical fire season for the study area encompassing 85 of wildfires and 93 of the area burned within a 161-km (100-mi) radius of the study area between 1984 and 2012 (Monitoring Trends in Burn Severity database Eidenshink et al 2007)
Weather and fuel moisture inputs for wildfire simulations are provided in Appendix S1 Table S2 These conditions are similar to those occurring during recent large wildfires in and near the study area (eg 2001 Star Fire 2008 American River Complex 2013 American Fire) In addition to using Randig to model fire spread and intensity we used FVS-FFE to project effects of prescribed fires and wildfires (described below) Wind inputs varied somewhat between fire models FVS-FFE requires only a single wind speed while multiple wind scenarios were applied in Randig fire simulations Wind speeds azimuths and relative proportions for Randig simulations followed Collins et al (2011)
Spatial optimization of fuel treatmentsmdashStands were selected for treatment based on modeled pre-treatment wildfire hazard and stand structure using the LTD which allows multiple objectives to be combined in the spatial prioritization of fuel treatments Three treatment scenarios varied in the land designations eligible for treatment
Scenario 1 Public land excluding spotted owl habitat Scenario 2 Public land including spotted owl habitat Scenario 3 All lands public and private ownerships
Objectives were consistent across treatment sceshynarios but differed in the land area available for treatment For all LTD runs we directed the model to maximize a total score that comprised numeric stand structure and fire hazard rankings
(Appendix S1 Table S3) The stand structure rankshying (0 1 2) was based on cover class category Cover classes most conducive to thinning were ranked highest Fire hazard ranking (0 2 3) was assigned according to stand-level CFL as calcushylated from FL probability files generated in Randig simulations for the 2007 pre-treatment landscape To isolate the effect of varying land designashy
tions in the area available for treatment total area treated was held constant between scenarios (20 of the core study area) In order to exclude small spatially isolated treatment areas that would be impractical from a management standshypoint we required a minimum treatment area of 121 ha (30 ac) To achieve this the treatment prishyoritization process was iterative In each step we eliminated all stands selected by LTD for treatshyment that were not contiguous with a ge121-ha treatment area The rationale for this is based on the cost associated with re-locating equipment necessary to implement mechanical andor fire treatments (D Errington personal communication El Dorado National Forest) We then calculated the treatment area remaining This process was repeated until total treatment area summed to the target area (~11080 ha) We simulated fuel treatments using FVS-FFE
Stands selected for treatment were assigned one of 13 treatment prescriptions depending on topogshyraphy vegetation cover class ownership and overlap with owl PACs (Appendix S1 Table S4) In an effort to promote landscape-scale heteroshygeneity basal area targets for commercial thinning on public land varied with topography (aspect and slope position canyondrainage bottom mid-slope and ridge) (North et al 2009b North 2012) All thinning treatments were simulated as thinshyfrom-below harvests and thinning within owl PACs was limited to hand thinning We assumed that trees ge254 cm (10 in) dbh would be harshyvested for wood products (FVS VOLUME keyshyword) and that the biomass contained in smaller trees and in the tops and branches of larger trees would be utilized as feedstocks for bioenergy conshyversion Therefore all thinning (except hand thinshyning) treatments were simulated as whole tree harvests (FVS keyword YARDLOSS) Treatments preferentially retained fire-resistant species with relative retention preference as follows black oakgtponderosa pinegtsugar pinegtDouglas-firgtinshycense-cedargtred firegtwhite fir
wwwesajournalsorg 7 January 2017 Volume 8(1) Article e01648
CHIONO ET AL
Prescribed fires were simulated in the year folshylowing thinning (2009) Broadcast burning was applied except within owl PACs on private land and on steep slopes (gt35) where follow-up burning was limited to pile burning To capture a more realistic range of post-treatment surface fuel conditions stands selected for treatment were randomly assigned to one of three post-treatment fuel models for each fuel model range TL1 (181) TL3 (183) or TL5 (185) (low range) TL3 (183) TL5 (185) or SB1 (201) (high range) (Scott and Burgan 2005) Weather conditions for prescribed fire modeling were based on recomshymendations from a local fire management speshycialist (B Ebert personal communication)
Biomass and carbon effects of treatmentmdashSimushylated treatment prescriptions varied according to site characteristics such as topography and land ownership (Appendix S1 Table S4) We tracked the C emitted from burning removed during harshyvesting and contained in live and dead aboveshyground biomass with FVS-FFE carbon reports (Reinhardt and Crookston 2003 Hoover and Rebain 2008) FVS converts biomass to units of C using a multiplier of 05 for all live and dead C pools (Penman et al 2003) except duff and litter pools for which a multiplier of 037 is applied (Smith and Heath 2002) Stand C is partitioned into a number of pools including aboveground live tree standing dead tree herb and shrub litter and duff woody surface fuel and belowground live and dead tree root C we limited our analysis to aboveground pools of C FVS-FFE also reports the C emitted during burning and that conshytained in harvested biomass (Rebain et al 2009) Treatment effects were assessed by comparing expected aboveground biomass C and emissions between the treated and untreated landscapes
We developed C loss functions for each FVS treelist by simulating burning with FVS-FFE at a range of FLs (SIMFIRE and FLAMEADJ keyshywords) (Ager et al 2010 Cathcart et al 2010) The FL values supplied to FLAMEADJ were the 20 midpoints of the 05-m FL classes (05ndash10 m) found in Randig FL probability output files As noted by Ager et al (2010) and Cathcart et al (2010) it is not currently possible to precisely match fire behaviors between Randig and FVS The FLs reported in Randig outputs are the total of surface fire and if initiated crown fire In
contrast the FLs supplied to FVS-FFE via the FLAMEADJ keyword are treated as surface fire FLs and when FLAMEADJ is parameterized with only a predefined FL the model does not use the input FL in crown fire simulations To estimate fire effects in FVS-FFE we parameterized FLAshyMEADJ with percent crowning (PC) and scorch height in addition to FL Scorch height and critical FL for crown fire initiation (FLCRIT) were based on Van Wagner (1977) We estimated PC using a downward concave function where PC = 32 when flame length = FLCRIT and PC = 100 when FL is ge30 of stand top height (the average height of the 40 largest trees by diameter) (Ager et al 2010 A Ager personal communication) The derived C loss functions were combined
with the probabilistic estimates of surface fire behavior produced in Randig simulations to estishymate the ldquoexpected Crdquo emitted in wildfire or conshytained in biomass We estimated expected C emissions and post-fire biomass C for each pixel as follows
20 X[ ]Efrac12 ]C i frac14 BPij X Cij
ifrac140
where E[C]j is the expected wildfire emissions of C from pixel j or biomass C in pixel j in mass per unit area BPij is the probability of burning at the ith FL class for pixel j and Cij is the C emitshyted from pixel j or the biomass C remaining in pixel j post-wildfire given burning at the ith FL class Expected C emissions and biomass C were
summed across all pixels in the core study area to obtain total expected wildfire emissions and expected terrestrial C for each treatment scenario In order to compare our modeling results to
other analyses that reported wildfire emissions on a per area basis we used a different method to estishymate C emissions per area burned Because wildshyfires burned both the core and buffer areas of our study landscape while emissions were estimated only in the core area we used conditional expected wildfire emissions to approximate the emissions from a wildfire burning entirely within the core study area Conditional expected emissions are those produced for an area given that the area is burned Conditional emissions were estimated for each pixel as follows
wwwesajournalsorg 8 January 2017 Volume 8(1) Article e01648
CHIONO ET AL
Table 2 Total area and proportion of area treated by category in each treatment scenario
SC1 SC2 SC3
Proportion of Proportion of Proportion of Treatment category Area (ha) area treated Area (ha) area treated Area (ha) area treated
Treated 11081 100 11082 100 11081 100 Avail for treatmentdagger 22042 199 28998 262 45647 412 Owl habitat treated 00 000 2769 025 1127 010 Private land treated 00 000 00 000 5685 051 Hand thin 1499 014 3819 034 1612 015 Biomass thin 8404 076 7240 065 9470 085 Commercial thin 7765 070 6916 062 9470 085 Broadcast burn 9410 085 7247 065 3785 034 Pile burn 1671 015 3835 035 7296 066
dagger Total land area potentially available for treatment in each scenario The area available for treatment increased from Scenarshyios 1 to 3 as restrictions on the area available for treatment were relaxed
20 X C WCfrac12 ]j frac14
BPij X WCijBPjifrac141
where C[WC]j is the C emitted by wildfire from pixel j in mass per unit area BPj is the probability that pixel j is burned BPij is the probability of burning at the ith FL class and WCij is the C emitted from pixel j when burned at the ith FL class
Conditional expected emissions were averaged across all pixels to obtain an estimate of wildfire emissions per area burned
Large fire revisionmdashWildfire modeling was calishybrated to produce fire sizes that approximated area burned in spread events of historical large wildfires near the study area However during the course of the study a very large fire encounshytered our study area The King Fire began on 13 September 2014 in El Dorado County and burned 39545 hamdashmore than an order of magnishytude greater than our modeled wildfires includshying gt25 of the study area Given the potential for very large wildfires in this region demonshystrated by the King Fire we completed addishytional wildfire modeling to estimate the C effects of treatment given the occurrence of a very large fire
Randig modeling was repeated for the no-treatment and S3 scenarios using the high fuel model range and a revised burn period number of simulated ignitions wind speed and wind directions Burn period was increased from 5 to 12 h number of ignitions was reduced by half to 40000 Wind directions and relative probabilities (Appendix S1 Table S5) were those recorded at
Hell Hole RAWS between 0400 and 1900 hours on 17 September the day of the King Firersquos larshygest spread event We used the probable 1-min maximum wind speed as calculated from the maximum gust recorded on that day 33 kmh (205 mph) based on maximum gust of 547 kmh (34 mph) (Crosby and Chandler 1966) These settings produced average fire sizes of NT = 10757 ha (no-treatment scenario) and 8070 ha (S3) Average fire size was limited by the size of our buffered study area Longer burn periods resulted in an increasing number of simulated wildfires that burned to the study area boundary
RESULTS
Treatment simulation Table 2 provides a summary of the area treashy
ted in each scenario Scenario 1 (S1) was the most restrictive with respect to the land area available for treatment which more than doushybled between S1 and S3 Because treatment preshyscriptions varied with land designation (public owl PAC private) and the designations availshyable for treatment varied between scenarios the relative proportions of thinning and burning methods also varied between scenarios Comshymercial and biomass thinning were applied most frequently in S3 which permitted treatshyment of private land Spotted owl activity censhyters composed 25 of the area treated in S2 vs 10 in S3 and 0 in S1 the scenario in which PACs were not subject to treatment As a result the area treated with hand thinning in S2 was more than twice that in S1 and S3 Due to the
wwwesajournalsorg 9 January 2017 Volume 8(1) Article e01648
CHIONO ET AL
Fig 4 Low fuel model range treatment locations and difference in conditional burn probability (CBP) and conshyditional flame length (CFL) (untreated-treated) for each treatment scenario Negative values indicate an increase in CBP or CFL while positive values represent a reduction CBP is the likelihood that a pixel will burn given a single ignition on the landscape and assuming the simulation conditions described in Appendix S1 Table S1 and in the text Conditional flame length is the probability-weighted flame length given these same assumptions
inclusion of PACs in S2 and both PACs and prishyvate land in S3 the proportion of area treated with pile burning increased between S1 and S3 while broadcast burn area exhibited an opposite trend Despite the variation in land designations available for treatment the pattern of treatshyment placement was generally similar between scenarios with treatments concentrated in the central and eastern portions of the study area (Figs 4 5)
Landscape-scale burn probability and fire hazard Conditional burn probabilitymdashThe pixel-to-pixel
change in CBP between the untreated scenario and each treatment scenario is mapped in Figs 4 (LO FM) and 5 (HI FM) Treatment reduced landshyscape burn probability by approximately 50 (Table 3) from 00124 (NT) to 00062 (S1) 00059 (S2) and 00055 (S3) Within treatment units avershyage CBP fell by 69ndash76 to 00033ndash00035 outside of treated stands CBP fell to 00060ndash00069 Some
wwwesajournalsorg 10 January 2017 Volume 8(1) Article e01648
CHIONO ET AL
Fig 5 Treatment locations and high fuel model range difference in conditional burn probability and condishytional flame length (untreated-treated) for each treatment scenario
increases in CBP were also observed particularly for the low fuel model range (Fig 4)
The influence of treatment on owl PAC likelishyhood of burning was similar to that observed for stands in general For treated PACs average CBP fell by ~70 relative to no treatment for the same stands Although PACs were not eligible for treatment in S1 all treatment scenarios had a large impact on estimated PAC CBP Average PAC CBP was reduced from 0013 to 00063 in S1 00049 in S2 and 00054 in S3 a 49ndash64 decrease relative to PACs in the no-treatment landscape (Table 3)
Fire hazardmdashTreatments reduced average landshyscape CFL by ~1 m from 36 m (NT) to 25ndash27 m Pixel-level CFL was reduced by a maximum of 80 m (LO FM) and 90 m (HI FM) Increases in CFL were also observed however particularly near the study arearsquos western and southwestern boundaries where treatments were least concentrated (Figs 4 5) Maximum pixel-level CFL increases were 25 m (LO FM) and 31 m (HI FM) Because fire hazard was used in prioritizing
stands for treatment the estimated pre-treatment CFL in stands selected for treatment (43ndash51 m)
wwwesajournalsorg 11 January 2017 Volume 8(1) Article e01648
CHIONO ET AL
Table 3 Proportional change in burn probability for treatment scenarios compared to the NT scenario
LO FM HI FM AVG
Stand type
S1 S2 S3 Proportional change
relative to NT
S1 S2 S3 Proportional change
relative to NT
S1 S2 S3 Proportional change
relative to NT
All PACs -045 -064 -056 -053 -063 -059 -049 -064 -057 Treated PACs NA -081 -076 NA -057 -067 NA -069 -072 Untreated PACs -045 -053 -051 -053 -054 -058 -049 -053 -054 All stands Treated stands
-044 -076
-048 -079
-053 -063
-050 -072
-053 -074
-056 -074
-047 -074
-050 -076
-054 -069
Untreated stands -035 -039 -049 -045 -047 -051 -040 -043 -050
Notes NT no treatment PACs protected activity centers Proportions are ratios of treatment values to no-treatment values as calculated for the same stands Treatment and no-treatment values were calculated as the average pixel value for the low and high fuel model range (LO FM and HI FM) within each stand category and treatment scenario
was greater than in stands not selected (32ndash 33 m) After treatment average CFL within treashyted stands fell to 13 (S1 and S2) and 17 m (S3) CFL in untreated stands was also reduced as a result of the influence of treatments on fire spread and intensity CFL fell by 05ndash08 m (9ndash 16) relative to CFL in the same stands within the no-treatment landscape (Table 4)
Although spotted owl PACs were not treated in S1 relative to PACs in the NT landscape PAC CFL was reduced by 10 (to 32 m) in S1 Treating PACs had a much larger impact on potential fire intensity however Average treashyted PAC CFL fell to 13 and 14 m in S2 and S3 respectively
Carbon consequences of landscape fuel treatments
Prior to treatment aboveground landscape carbon totaled 14705 tonnesha on average Treatments removed 14 of pre-treatment C from treated stands or 2374 tonnesha totaling
81772ndash119103 tonnes of C in harvested biomass and merchantable material (Tables 5 and 6) Both the treatment scenarios and the choice of
fuel models were important influences on estishymated C emissions from burning As the least restrictive treatment scenario in terms of treatshyment location and the only scenario to include treatment of private land where broadcast burnshying was precluded as a treatment option the S3 treatment scenario was associated with the lowshyest wildfire and prescribed burning emissions (Tables 5 and 6) For each treatment scenario expected wildfire emissions increased by more than an order of magnitude between the low and high fuel model ranges This difference was the result of increasing fire intensity as well as wildshyfire size Average wildfire size nearly doubled between fuel model ranges in the treatment sceshynarios and tripled in the no-treatment scenario (Fig 6) For a given treatment scenario wildfire emissions on a per hectare basis were approxishymately two tonnes greater for the high fuel
Table 4 Proportional change in conditional flame length for treatment scenarios compared to the NT scenario
LO FM HI FM AVG
Stand type
S1 S2 S3 Proportional change
relative to NT
S1 S2 S3 Proportional change
relative to NT
S1 S2 S3 Proportional change
relative to NT
All PACs -009 -042 -028 -012 -043 -027 -010 -042 -028 Treated PACs NA -071 -075 NA -071 -073 NA -071 -074 Untreated PACs -009 -014 -011 -012 -017 -014 -010 -016 -013 All stands -022 -026 -031 -025 -026 -028 -024 -026 -030 Treated stands -065 -069 -052 -071 -071 -073 -068 -070 -062 Untreated stands -008 -009 -021 -011 -012 -012 -009 -010 -016
Notes NT no treatment PACs protected activity centers Proportions are ratios of treatment values to no-treatment values as calculated for the same stands Treatment and no-treatment values were calculated as the average pixel value for the low and high fuel model range (LO FM and HI FM) within each stand category and treatment scenario
wwwesajournalsorg 12 January 2017 Volume 8(1) Article e01648
CHIONO ET AL
Table 5 Expected biomass carbon expected wildfire C emissions and C harvested and emitted in fuel treatshyments for NT and treatment (S1 S2 S3) scenarios using the low fuel model range in fire modeling
Carbon pool NT S1 S2 S3
Untreated stands Tonnes C Live 5004505 3915044 3695489 3954131 Dead 1845659 1421704 1378824 1466202 Wildfire emissions 2372 1137 1039 904
Treated stands Live 881358 1072625 826366 Dead 260089 299244 220932 All harvested biomass 88773 81772 119103 Prescribed fire emissions 178530 169693 122599 Wildfire emissions 48 56 61
All stands Live 5004505 4796402 4768113 4780497 Dead 1845659 1681793 1678068 1687135 Treatment (harvested and emitted) 267303 251465 241702 Wildfire emissions 2372 1186 1095 965
Grand totals 6852536 6746684 6698741 6710299
Notes LF indicates the large fire scenarios Expected C is that remaining in the core study area following treatment if applishycable and a random ignition and wildfire in the larger buffered study area as estimated from the simulation of many wildfires Live C is that contained in live aboveground herb shrub and tree biomass dead C is the C contained in litter duff woody surshyface fuel and aboveground portions of tree snags NT no treatment
model range than for the low range In contrast to the large influence of fuel model choice on wildfire emissions the effect of fuel model range on prescribed fire emissions was minimal with only a 1 increase in emissions between the low and high fuel model ranges for a given treatment scenario
Although treatment significantly reduced wildshyfire emissions combined emissions from preshyscribed burning on 20 of the landscape and wildfire exceeded wildfire emissions in the no-treatment scenarios (Tables 5 and 6) Relative to the no-treatment scenarios treatment reduced estimated wildfire emissions by approximately 54 (low fuel model range) 59 (high fuel model range) and 45 (large fire scenarios) Yet preshyscribed burning was a far more significant source of emissions than were wildfires of moderate size with emissions from treatment exceeding wildfire emissions by 111259ndash177344 tonnes Even for the large wildfire simulations where landscape treatments nearly halved estimated wildfire emisshysions the combined carbon emissions from preshyscribed burning and wildfire in the treatment scenario surpassed wildfire emissions in the no-treatment scenario by 45 (Table 6 Fig 7)
The total quantity of aboveground C expected to remain on the landscape following treatment
and a randomly ignited wildfire was greatest for the no-treatment scenarios (Tables 5 and 6) For modeled wildfires of moderate size treatment reduced both the live and dead C pools relative to the no-treatment scenarios and terrestrial C in the no-treatment scenarios was 4ndash5 greater (323316 ndash434960 tonnes) than in any of the treatment scenarios (Tables 5 and 6) In comparison under large wildfire conditions the treatment scenario retained slightly more live biomass C~15000 tonshynes or 03 more than the no-treatment scenario However treatment also reduced necromass C by 288000 tonnes (12) resulting in a 3 overall decrease in onsite biomass C relative to an untreshyated landscape (Table 6) The proportional changes in aboveground
biomass C pools between the treatment and no-treatment scenarios are summarized in Table 7 For all treatment scenarios the consumption of duff litter and downed woody fuels with preshyscribed burning contributed to a net reduction in these C pools relative to the untreated landscape Conversely treatments protected more C in the live understory (herb and shrub) poolmdashthe result of reduced wildfire size and intensity in the treatshyment scenarios Treatments in the moderate wildshyfire scenarios reduced live tree biomass C in comparison with no-treatment levels (Fig 8)
wwwesajournalsorg 13 January 2017 Volume 8(1) Article e01648
CHIONO ET AL
Table 6 Expected biomass carbon expected wildfire C emissions and C harvested and emitted in fuel treatshyments for NT and treatment (S1 S2 S3) scenarios using the high fuel model range in fire modeling
Carbon pool NT S1 S2 S3 NT-LF S3-LF
Untreated stands Tonnes C Live 4910239 3879854 3664690 3923358 4586898 3750774 Dead 1912429 1448947 1403313 1489629 2130034 1605591 Wildfire emissions 31831 12934 12001 11293 137622 68061
Treated stands Live 896670 1115918 853503 847374 Dead 280182 325628 238130 247744 All harvested biomass 88773 81772 119103 119103 Prescribed fire emissions 180357 171247 123539 123539 Wildfire emissions 798 951 986 8285
All stands Live 4910239 4776524 4780607 4776861 4586898 4598148 Dead 1912429 1729129 1728941 1727759 2130034 1853334 Treatment (harvested and emitted) 282862 265971 254921 254921 Wildfire emissions 31831 13732 12952 12279 137622 76346
Grand totals 6854499 6802247 6788471 6771820 6854554 6782749
Notes LF indicates the large fire scenarios Expected terrestrial C is that remaining in the core study area following treatshyment if applicable and a random ignition and wildfire in the larger buffered study area as estimated from the simulation of many wildfires Live C is that contained in live aboveground herb shrub and tree biomass dead C is the C contained in litter duff woody surface fuel and aboveground portions of tree snags NT no treatment
Notably in the large modeled wildfire scenarios (NT-LF and S3-LF) treatments resulted in a 400000-tonne increase in landscape-level live tree C over the no-treatment scenario
DISCUSSION
Fuel treatments in protected habitat Because there are often competing objectives
between managing forests for resilience to fire and drought and protecting owl habitat we assessed potential fire occurrence and hazard based on treatment scenarios that included and omitted treatment of PACs Conducting fuels management outside of occupied owl habitat has been suggested as a means of reducing fire risk within occupied sites (Jenness et al 2004 Tempel et al 2015) Ager et al (2007) reported that fuel treatments on 20 of a western Oregon landscape reduced the probability of northern spotted owl nesting and roosting habitat loss by 44 even though that habitat type was not treated As in Ager et al (2007) we observed modifications in fire intensity and burn probability within owl habitat even when it was left untreated In the S1 treatment scenario in which owl activity centers were not eligible for treatment the effect of treatshying other stands reduced both fire hazard (by
9ndash12 for CFL or approximately 04 m) and CBP (by ~45) within PACs It is difficult to assess the significance of this proportional reduction in CBP given that the absolute differences in probabilities were relatively modest (Figs 3 4) Ager et al (2007) noted that allowing treatment of owl habishytat would have significantly reduced estimated habitat loss in their study In this study it is expected that habitat quality may be reduced within treated PACs in the short term through the removal of small-diameter trees (ie lower vertical structural heterogeneity) However two structural attributes for suitable spotted owl nestshying habitat identified by Tempel et al (2015) high canopy cover and large tree density would not be altered While we did not directly estimate habitat loss we did observe much larger reductions in fire hazard within PACs that were treated as meashysured by CFL (71ndash75 reduction equivalent to 2ndash3 m) It should be noted that the effect of wideshyspread treatments within PACs on spotted owl nesting and foraging behavior is unknown One concern with designating some land area
unavailable for treatment is that it may limit the potential for treatments to alter fire behavior across the landscape (eg Finney 2001) Including all stands in the potential treatment pool allows the highest-priority stands with respect to simulated
wwwesajournalsorg 14 January 2017 Volume 8(1) Article e01648
CHIONO ET AL
effects on landscape-level fire behavior The true effect of increasing the land area available for treatshyment may be partially obscured by the varying frequency of treatment prescriptions between sceshynarios For example the hand thinning treatments applied within PACs would be expected to have a milder effect on potential wildfire behavior than more severe prescriptions and hand thinning was twice as common in S2 as in the other scenarios
Terrestrial carbon and burning emissions Landscape treatments reduced wildfire emisshy
sions by reducing the emissions produced per area burned by wildfire as well as average wildfire size On average wildfires in the treated landscapes released 193ndash216 tonnes Cha while wildfires in the untreated landscapes released 234ndash254 tonnes Cha Modeled wildfires decreased in size by 7 (low fuel model range) 36 (high fuel model range) and 25 (large fire scenario) relative to untreated landscapes (Fig 6) Since the burn pershyiod for simulated wildfires was held constant between scenarios this reduction in average wildshyfire size is the result of reduced spread rates derived from fuel treatments Despite the influence of treatments on wildfire
intensity size and expected emissions treatment-related emissions exceeded the avoided wildfire emissions conferred by treatment Prescribed burning in our study a combination of broadcast
Fig 6 Wildfire size relative frequency distributions from wildfire simulations Bar color represents no-treatment (NT) and treatment scenarios (S1ndashS3)
fire spread to be treated which would be expected to achieve the greatest modification of landscape fire behavior and effects In the present study although the land area potentially available for treatment more than doubled between S1 and S3 landscape-level effects of treatment on modeled fire risk and hazard were fairly similar (compared with the no-treatment landscape all-stand CBP fell by 47 and 54 in S1 and S3 while CFL fell by 24 and 30) Dow et al (2016) also found that incorporating modest restrictions on treatment Fig 7 Carbon emissions (tonnes) from wildfire and
area availability (24 of the landscape unavail- prescribed burning X-axis labels indicate no-treatment able) had minimal consequences for modeled fire (NT) and treatment scenarios (S1ndashS3) subscripts size and hazard The modest changes in estimated denote fuel model ranges used in fire modeling
fire metrics we observed may also be due to simi- (L low H high) Large fire scenarios which were
larity in the general pattern of treatment placement modeled with the high fuel model range only are indishybetween scenarios which probably led to similar cated by LF
wwwesajournalsorg 15 January 2017 Volume 8(1) Article e01648
CHIONO ET AL
Table 7 Proportional change in expected carbon by biomass pool for treatment scenarios compared to the no-treatment landscape
Treatment Standing Down dead Forest Herb Live scenario dead wood floor shrub tree
S1 004 -017 -013 014 -004 S2 001 -016 -012 014 -004 S3 -001 -015 -010 016 -004 S3-LF -016 -013 -008 017 000
Notes For example a value of -010 represents a 10 decshyline in biomass C from the no-treatment scenario Treatment and no-treatment values were calculated as the average of low and high fuel model range values except in the case of the large fire (LF) scenarios which were modeled for the high fuel model range only Expected C is that remaining after a random ignition and wildfire in the buffered study area as estimated from simulating 80000 ignitions (LF 40000 ignitions)
C pool categories are those reported in Forest Vegetation Simulator Carbon Reports Standing dead aboveground porshytion of standing dead trees Down dead wood woody surface fuels Forest floor litter and duff Herbshrub herbs and shrubs Live tree aboveground portion of live trees
and pile burning released 111ndash163 tonnes Cha For comparison studies conducted in comparable forest types have estimated prescribed fire emisshysions of 127 tonnes Cha (warm dry ponderosa pine habitat types Reinhardt and Holsinger 2010)
Fig 8 Expected carbon contained in aboveground live and dead tree biomass Expected C is that remainshying in the core study area following treatment (if applishycable) and a single random ignition within the larger buffered study area X-axis labels indicate no-treatment (NT) and treatment scenarios (S1ndashS3) subshyscripts denote fuel model ranges used in fire modeling (L low H high) Large fire scenarios which were modeled for the high fuel model range only are indishycated by LF
and 148 tonnes Cha (an old-growth mixed-conifer reserve in the southern Sierra Nevada North et al 2009a) Relative to the approximately 158000 tonnes C emitted in prescribed burning avoided wildfire emissions at 1186ndash19551 tonnes for wildfires of moderate size were small A simishylar study in southern Oregon with average modshyeled wildfires of 2350 and 3500 ha (treatment and no-treatment scenarios respectively) found that treatments reduced expected wildfire emissions by 6157 tonnes of C (Ager et al 2010) Surface fuels represented with surface fuel
models in commonly used modeling software are the most influential inputs determining preshydicted fire behavior (Hall and Burke 2006) Fire behavior fire sizes and emissions in this study varied according to fuel model assignment highshylighting the importance of selecting the approprishyate fuel model to represent fuel conditions (see Collins et al 2013) We show a 12- to 14-fold change in wildfire emissions due solely to the choice of fuel models (Tables 5 and 6) Indeed the range of fuel models used in recent studies investigating fuel treatments and simulated fire behavior in mixed-conifer forests is noteworthy Incorporating a range of fuel models into analyshyses such that outcome variability can be reported facilitates comparison of effects across studies Our estimates of the aboveground C benefits
of treatment under the moderate wildfire scenarshyios with average fire sizes of le2133 ha are likely conservative The effect of modeled wildfire size on the C consequences of fuel treatment was conshysiderable emphasizing the importance of this variable in studies of the climate benefits of treatshyment Avoided wildfire emissions resulting from treatment increased to 61276 tonnes C when large wildfires (8070ndash10757 ha) were simulated The treatment scenario given large wildfires also protected a greater portion of live tree C If the ~40000-ha King Fire is representative of the magnitude of future wildfires in the region C accounting should improve with respect to treatshyment favorability Similarly if multiple wildfires were to encounter the study area within the effective lifespan of treatments the C gains assoshyciated with avoided emissions in the treatment scenarios would increase Our approach to estimating the C conseshy
quences of fuel treatments has a number of limitashytions A full accounting of treatment effects
wwwesajournalsorg 16 January 2017 Volume 8(1) Article e01648
CHIONO ET AL
would project through time the consequences of both treatment and wildfire Our analysis is static incorporating only the short-term C costs and benefits of treatment Simulating wildfire in the year immediately following treatment maximizes the apparent benefits of treatment Over time as surface fuels accumulate and vegetation regenershyates maintenance would be required to retain the effectiveness of treatments (Martinson and Omi 2013) increasing the C costs of reduced fire hazard In addition the C contained in fire-killed biomass will ultimately be emitted to the atmoshysphere although biomass decay could be delayed through conversion to long-lived wood products such as building materials (Malmsheimer et al 2011) It is also important to note that our analysis did not include stochastic wildfire occurrence Estimates of burn probability in the present study are not estimates of the likelihood of wildfire occurrence based on historical fire sizes and freshyquency (eg Preisler et al 2004 Mercer and Prestemon 2005 Brillinger et al 2006) but rather are conditional on a single randomly ignited wildfire within the buffered study area
CONCLUSIONS
Our findings generally support those of Campshybell et al (2011) who concluded from an analysis of fire-prone western forests that the C costs of treatments are likely to outweigh their benefits under current depressed fire frequencies In a more recent paper Campbell and Ager (2013) conshycluded that ldquonone of the fuel treatment simulation scenarios resulted in increased system carbonrdquo primarily from the low incidences of treated areas being burned by wildfire However our interpreshytation of these findings differs from those disshycussed in Campbell et al (2011) and Campbell and Ager (2013) especially in light of recent and projected future trends in fire activity (Westerling et al 2011 Miller and Safford 2012 Dennison et al 2014) The current divergence of increasing surface air temperatures and low fire activity is unlikely to be sustained further suggesting greater future fire activity (Marlon et al 2012) If increased fire activity is realized then the likelishyhood of a given area being burned in a wildfire increases This differs from the simple increase in stand-level fire frequency modeled by Campbell et al (2011) because increases in fire likelihood are
not necessarily associated with corresponding decreases in fire severity as assumed by Campbell et al (2011) Increased fire likelihood could very well lead to positive feedbacks in fire severity and ultimately to vegetation type conversion (Copposhyletta et al 2016)mdasheffects that would have signifishycant implications for carbon storage Due to the significant emissions associated
with treatment and the low likelihood that wildshyfire will encounter a given treatment area forest management that is narrowly focused on C accounting alone would favor the no-treatment scenarios Landscape treatments protected more C in live tree biomass only when large wildfires were simulated While treatment favorability improved with large wildfire simulation the no-treatment scenario still produced fewer emissions than the treatment scenario Given the potential for large wildfire in the region as demonstrated by the 2014 King Fire and the increasing freshyquency of large wildfires and area burned in Calishyfornia expected from climate modeling studies (Lenihan et al 2008 Westerling et al 2011) we suggest that future studies of fuel treatmentndashwildshyfirendashC relationships should incorporate the potenshytial for large wildfires at a frequency greater than those observed over the last 20ndash30 yr Others have argued that treatments to increase forest resilience should be a stand-alone top land management priority independent of other ecosystem values such as carbon sequestration and fire hazard reduction (Stephens et al 2016a) We also note that the potential benefits of fuels
management are not restricted to avoided wildshyfire emissions Here we show that landscape fuel treatments can alter fire hazard across the landshyscape both within and outside of treated stands and have the potential to affect the likelihood of burning and fire intensity within protected Calishyfornia spotted owl habitat Underscoring the risk to sensitive habitat the 2014 King Fire encounshytered 31 PACs within our study area leading to the greatest single-year decline in habitat occushypancy recorded over a 23-yr study period (Jones et al 2016) Modest simulated treatments within activity centers significantly reduced potential fire intensity relative to both the no-treatment landscape and a treatment scenario that did not permit treatment within PACs indicating that active management may be desirable to protect habitat in the long term (Roloff et al 2012)
wwwesajournalsorg 17 January 2017 Volume 8(1) Article e01648
CHIONO ET AL
However treatments conducted outside of owl habitat also reduced wildfire hazard
ACKNOWLEDGMENTS
We are grateful to a number of individuals for sharshying their time and fuel treatment and fire modeling expertise Nicole Vaillant (ArcFuels) Alan Ager and Andrew McMahan (carbon estimation) and Coeli Hoover (harvest simulations in FVS-FFE) Brian Ebert and Dana Walsh of the Eldorado National Forest proshyvided invaluable advice on weather inputs for fire modeling and on designing fuel treatment prescripshytions Ken Somers Operations Forester on the Blodgett Forest Research Station gave advice concerning timshyber management on private land We also thank two anonymous reviewers whose comments greatly improved this article The California Energy Commisshysion provided funding for this project
LITERATURE CITED
Ager A A B Bahro and K Barber 2006 Automating the fireshed assessment process with ArcGIS Pages 163ndash167 in P L Andrews and B W Butler (Comps) Fuels ManagementndashHow to Measure Success Conference Proceedings Portland OR March 28ndash30 2006 Proceedings RMRS-P-41 USDA Forest Service Rocky Mountain Research Station Fort Collins Colorado USA
Ager A A M A Finney B K Kerns and H Maffei 2007 Modeling wildfire risk to northern spotted owl (Strix occidentalis caurina) habitat in Central Oregon USA Forest Ecology and Management 24645ndash56
Ager A A M A Finney A McMahan and J Cathcart 2010 Measuring the effect of fuel treatments on forshyest carbon using landscape risk analysis Natural Hazards and Earth System Science 102515ndash2526
Ager A A N M Vaillant D E Owens S Brittain and J Hamann 2012 Overview and example application of the Landscape Treatment Designer Pages 11 General Technical Report PNW-GTR-859 USDA Forest Service Pacific Northwest Research Station Portland Oregon USA
Barbour M G and R A Minnich 2000 Californian upland forests and woodlands Pages 131ndash164 in M Barbour and W Billings editors North Amerishycan terrestrial vegetation Cambridge University Press Cambridge UK
Bias M A and R Gutimerrez 1992 Habitat associations of California spotted owls in the central Sierra Nevada Journal of Wildlife Management 56584ndash595
Bond M L R Gutierrez A B Franklin W S LaHaye C A May and M E Seamans 2002
Short-term effects of wildfires on spotted owl surshyvival site fidelity mate fidelity and reproductive success Wildlife Society Bulletin 301022ndash1028
Brillinger D H Preisler and J Benoit 2006 Probashybilistic risk assessment for wildfires Environ-metrics 17623ndash633
Campbell J L and A A Ager 2013 Forest wildfire fuel reduction treatments and landscape carbon stocks a sensitivity analysis Journal of Environshymental Management 121124ndash132
Campbell J L M E Harmon and S R Mitchell 2011 Can fuel-reduction treatments really increase forest carbon storage in the western US by reducshying future fire emissions Frontiers in Ecology and the Environment 1083ndash90
Cathcart J A A Ager A McMahan M Finney and B Watt 2010 Carbon benefits from fuel treatshyments Pages 61ndash80 in T B Jain R T Graham and J Sandquist editors Integrated management of carbon sequestration and biomass utilization opportunities in a changing climate Proceedings of the 2009 National Silviculture Workshop Boise Idaho June 15ndash18 2009 USDA Forest Service Proshyceedings RMRS-P-61 Rocky Mountain Research Station Fort Collins Colorado USA
Chatfield A H 2005 Habitat selection by a California spotted owl population a landscape scale analysis using resource selection functions Thesis Univershysity of Minnesota St Paul Minnesota USA
Collins B M H A Kramer K Menning C Dilling-ham D Saah P A Stine and S L Stephens 2013 Modeling hazardous fire potential within a comshypleted fuel treatment network in the northern Sierra Nevada Forest Ecology and Management 310156ndash166
Collins B M S L Stephens J J Moghaddas and J Battles 2010 Challenges and approaches in planshyning fuel treatments across fire-excluded forested landscapes Journal of Forestry 10824ndash31
Collins B M S L Stephens G B Roller and J J Battles 2011 Simulating fire and forest dynamics for a landscape fuel treatment project in the Sierra Nevada Forest Science 5777ndash88
Coppoletta M K E Merriam and B M Collins 2016 Post-fire vegetation and fuel development influences fire severity patterns in reburns Ecologishycal Applications 26686ndash699
Crookston N L and A O Finley 2008 yaimpute an r package for knn imputation Journal of Statistical Software 231ndash16
Crookston N L M Moeur and D L Renner 2002 Userrsquos guide to the most similar neighbor imputashytion program version 2 General Technical Report RMRS-GTR-96 USDA Forest Service Rocky Mountain Research Station Ogden Utah USA
wwwesajournalsorg 18 January 2017 Volume 8(1) Article e01648
CHIONO ET AL
Crosby J and C Chandler 1966 Get the most from your windspeed observations Fire Control Notes 2712ndash13
Dailey S J Fites A Reiner and S Mori 2008 Fire behavior and effects in fuel treatments and proshytected habitat on the Moonlight fire Fire Behavior Assessment Team wwwfsfedusadaptivemana gementprojectsFBATdocsMoonlightFinal_8_6_08 pdf
Dennison P E S C Brewer J D Arnold and M A Moritz 2014 Large wildfire trends in the western United States 1984ndash2011 Geophysical Research Letters 412928ndash2933
Dixon G E 2002 Essential FVS a userrsquos guide to the forest vegetation simulator Pages 193 USDA Forest Service Forest Management Service Center Fort Collins Colorado USA
Dore S T E Kolb M Montes-Helu B W Sullivan W D Winslow S C Hart J P Kaye G W Koch and B A Hungate 2008 Long-term impact of a stand-replacing fire on ecosystem CO2 exchange of a ponderosa pine forest Global Change Biology 141ndash20
Dore S M Montes-Helu S C Hart B A Hungate G W Koch J B Moon A J Finkral and T E Kolb 2012 Recovery of ponderosa pine ecosystem carbon and water fluxes from thinning and stand-replacing fire Global Change Biology 183171ndash3185
Dow C J B M Collins and S L Stephens 2016 Incorporating resource protection constraints in an analysis of landscape fuel-treatment effectiveness in the Northern Sierra Nevada California USA Environmental Management 571ndash15
Eidenshink J B Schwind K Brewer Z Zhu B Quayle and S Howard 2007 A project for monshyitoring trends in burn severity Fire Ecology 33ndash21
Evans A M and A J Finkral 2009 From renewable energy to fire risk reduction a synthesis of biomass harvesting and utilization case studies in US forshyests GCB Bioenergy 1211ndash219
Finkral A J and A M Evans 2008 The effects of a thinning treatment on carbon stocks in a northern Arizona ponderosa pine forest Forest Ecology and Management 2552743ndash2750
Finney M A 2001 Design of regular landscape fuel treatment patterns for modifying fire growth and behavior Forest Science 47219ndash228
Finney M A 2002 Fire growth using minimum travel time methods Canadian Journal of Forest Research 321420ndash1424
Finney M A 2006 An overview of FlamMap fire modeling capabilities Pages 213ndash220 in P L Andrews and B W Butler editors Proceedings of Fuels ManagementndashHow to Measure Success Research Paper RMRS-P-41 USDA Forest Service
Rocky Mountain Research Station Portland Oregon USA
Finney M A R C Seli C W McHugh A A Ager B Bahro and J K Agee 2007 Simulation of longshyterm landscape-level fuel treatment effects on large wildfires International Journal of Wildland Fire 16712ndash727
Fulme P Z J E Crouse J P Roccaforte and E L Kalies 2012 Do thinning andor burning treatments in western USA ponderosa or Jeffrey pine-dominated forests help restore natural fire behavior Forest Ecology and Management 26968ndash81
Gaines W L R J Harrod J Dickinson A L Lyons and K Halupka 2010 Integration of Northern spotted owl habitat and fuels treatments in the eastern Cascades Washington USA Forest Ecolshyogy and Management 2602045ndash2052
Gaines W L R A Strand and S D Piper 1997 Effects of the hatchery complex fires on northern spotted owls in the eastern Washington Cascades Pages 123ndash129 in J N Greenlee editor Proceedings of the Fire Effects on Rare and Endangered Species and Habitats Conference Coeur DrsquoAlene Idaho International Association of Wildfire and Forestry Hot Springs South Dakota USA
Hall S A and I C Burke 2006 Considerations for characterizing fuels as inputs for fire behavior models Forest Ecology and Management 227 102ndash114
Hoover C and S Rebain 2008 The Kane Experimenshytal Forest carbon inventory carbon reporting with FVS Pages 13ndash15 in R N Havis and N L Crookston editors Third Forest Vegetation Simushylator Conference Fort Collins Colorado February 13ndash15 2007 USDA Forest Service Rocky Mountain Research Station Fort Collins Colorado USA
Hurteau M and M North 2009 Fuel treatment effects on tree-based forest carbon storage and emissions under modeled wildfire scenarios Fronshytiers in Ecology and the Environment 7409ndash414
Hurteau M D and M North 2010 Carbon recovery rates following different wildfire risk mitigation treatments Forest Ecology and Management 260 930ndash937
Hurteau M D M T Stoddard and P Z Fulme 2011 The carbon costs of mitigating high-severity wildshyfire in southwestern ponderosa pine Global Change Biology 171516ndash1521
Jenness J S P Beier and J L Ganey 2004 Associashytions between forest fire and Mexican spotted owls Forest Science 50765ndash772
Jones G M R Gutimerrez D J Tempel S A Whitmore W J Berigan and M Z Peery 2016 Megafires an emerging threat to old-forest species Frontiers in Ecology and the Environment 14300ndash306
wwwesajournalsorg 19 January 2017 Volume 8(1) Article e01648
CHIONO ET AL
Laymon S A 1988 Ecology of the spotted owl in the central Sierra Nevada California Dissertation University of California Berkeley California USA
Lenihan J M D Bachelet R P Neilson and R Drapek 2008 Response of vegetation distribution ecosystem productivity and fire to climate change scenarios for California Climatic Change 87215ndash230
Lydersen J M B M Collins E E Knapp G B Roller and S Stephens 2015 Relating fuel loads to overshystorey structure and composition in a fire-excluded Sierra Nevada mixed conifer forest International Journal of Wildland Fire 24484ndash494
Malmsheimer R J Bowyer J Fried E Gee R Islar R Miner I E Munn E Oneil and W C Stewart 2011 Managing forests because carbon matters integrating energy products and land manageshyment policy Journal of Forestry 109S7ndashS50
Marlon J R et al 2012 Long-term perspective on wildfires in the western USA Proceedings of the National Academy of Sciences of the United States of America 109E535ndashE543
Martinson E J and P N Omi 2002 Performance of fuel treatments subjected to wildfires Pages 7ndash13 in P N Omi and L A Joyce editors Conference on Fire Fuel Treatments and Ecological Restorashytion USDA Forest Service Rocky Mountain Research Station Fort Collins Colorado USA
Martinson E J and P N Omi 2013 Fuel treatments and fire severity a meta-analysis Pages 38 USDA Forest Service Rocky Mountain Research Station Fort Collins Colorado USA
Mayer K E and W F Laudenslayer 1988 A guide to wildlife habitats of California California Departshyment of Forestry and Fire Protection Sacramento California USA
McKenzie D Z Gedalof D L Peterson and P Mote 2004 Climatic change wildfire and conservation Conservation Biology 18890ndash902
Mercer D E and J P Prestemon 2005 Comparing production function models for wildfire risk analyshysis in the wildlandndashurban interface Forest Policy and Economics 7782ndash795
Miller J D and H Safford 2012 Trends in wildfire severity 1984 to 2010 in the Sierra Nevada Modoc Plateau and southern Cascades California USA Fire Ecology 841ndash57
Miller J H Safford M Crimmins and A Thode 2009 Quantitative evidence for increasing forest fire severity in the Sierra Nevada and southern Cascade mountains California and Nevada USA Ecosystems 1216ndash32
North M 2012 Managing Sierra Nevada forests PSWshyGTR-237 USDA Forest Service Pacific Southwest Research Station Albany California USA
North M P and M D Hurteau 2011 High-severity wildfire effects on carbon stocks and emissions in fuels treated and untreated forest Forest Ecology and Management 2611115ndash1120
North M M Hurteau and J Innes 2009a Fire supshypression and fuels treatment effects on mixed-conifer carbon stocks and emissions Ecological Applications 191385ndash1396
North M P A Stine K OrsquoHara W Zielinski and S Stephens 2009b An ecosystem management strategy for Sierran mixed-conifer forests General Technical Report PSW-GTR-220 USDA Forest Service Pacific Southwest Research Station Albany California USA
Parisien M-A S Snetsinger J A Greenberg C R Nelson T Schoennagel S Z Dobrowski and M A Moritz 2012 Spatial variability in wildfire probability across the western United States Intershynational Journal of Wildland Fire 21313ndash327
Penman J M Gytarsky T Hiraishi T Krug D Kruger R Pipatti L Buendia K Miwa T Ngara and K Tanabe 2003 Good practice guidance for land use land-use change and forestry Institute for Global Environmental Strategies for the Intergovshyernmental Panel on Climate Change Hayama Kanagawa Japan
Pollet J and P N Omi 2002 Effect of thinning and prescribed burning on crown fire severity in ponderosa pine forests International Journal of Wildland Fire 111ndash10
Prather J W R F Noss and T D Sisk 2008 Real versus perceived conflicts between restoration of ponderosa pine forests and conservation of the Mexican spotted owl Forest Policy and Economics 10140ndash150
Preisler H K D R Brillinger R E Burgan and J Benoit 2004 Probability based models for estimation of wildfire risk International Journal of Wildland Fire 13133ndash142
Rebain S E Reinhardt N Crookston S Beukema W Kurz and J Greenough 2009 The fire and fuels extension to the Forest Vegetation Simulator Addendum to RMRS-GTR-119 USDA Forest Service and ESSA Technologies Ltd Fort Collins Colorado USA
Reinhardt E D and N L Crookston 2003 The fire and fuels extension to the forest vegetation simulashytor Pages 209 RMRS-GTR-116 USDA Forest Sershyvice Rocky Mountain Research Station Ogden Utah USA
Reinhardt E and L Holsinger 2010 Effects of fuel treatments on carbon-disturbance relationshyships in forests of the northern Rocky Mountains Forest Ecology and Management 2591427ndash1435
wwwesajournalsorg 20 January 2017 Volume 8(1) Article e01648
CHIONO ET AL
Reinhardt E D R E Keane D E Calkin and J D Cohen 2008 Objectives and considerations for wildland fuel treatment in forested ecosystems of the interior western United States Forest Ecology and Management 2561997ndash2006
Ritchie M W C N Skinner and T A Hamilton 2007 Probability of tree survival after wildfire in an interior pine forest of northern California effects of thinning and prescribed fire Forest Ecolshyogy and Management 247200ndash208
Roloff G J S P Mealey and J D Bailey 2012 Comshyparative hazard assessment for protected species in a fire-prone landscape Forest Ecology and Manshyagement 2771ndash10
Rothermel R C 1972 A mathematical model for preshydicting fire spread in wildland fuels Research Paper INT-115 USDA Forest Service Intermounshytain Forest and Range Experiment Station Ogden Utah USA
Safford H D 2008 Fire severity in fuel treatments American River Complex fire Tahoe National Forest California Unpublished Report USDA Forest Service Pacific Southwest Region Vallejo California USA
Schmidt D A A H Taylor and C N Skinner 2008 The influence of fuels treatment and landscape arrangement on simulated fire behavior Southern Cascade range California Forest Ecology and Management 2553170ndash3184
Scott J H and R E Burgan 2005 Standard fire behavior fuel models a comprehensive set for use with Rothermelrsquos surface fire spread model General Technical Report RMRS-GTR-153 USDA Forest Service Rocky Mountain Research Station Fort Collins Colorado USA
Scott J H M P Thompson and J W Gilbertson-Day 2016 Examining alternative fuel management strategies and the relative contribution of National Forest System land to wildfire risk to adjacent homesndasha pilot assessment on the Sierra National Forest California USA Forest Ecology and Manshyagement 36229ndash37
Smith J E and L S Heath 2002 A model of forest floor carbon mass for United States forest types Research Paper NE-722 USDA Forest Service Northeastern Research Station Newtown Square Pennsylvania USA
Stephens S L 2005 Forest fire causes and extent on United States Forest Service lands International Journal of Wildland Fire 14213ndash222
Stephens S L B M Collins E Biber and P Z Fulme 2016a US federal fire and forest policy emphasizshying resilience in dry forests Ecosphere 7e01584
Stephens S L J D Miller B M Collins M P North J J Keane and S L Roberts 2016b Wildfire impacts on California Spotted Owl nesting habitat in the Sierra Nevada Ecosphere 7e01584
Stephens S L J J Moghaddas B R Hartsough E E Y Moghaddas and N E Clinton 2009 Fuel treatshyment effects on stand-level carbon pools treatshyment-related emissions and fire risk in a Sierra Nevada mixed-conifer forest Canadian Journal of Forest Research 391538ndash1547
Stephens S L et al 2012 Fuel treatment impacts on estimated wildfire carbon loss from forests in Monshytana Oregon California and Arizona Ecosphere 31ndash17
Tempel D et al 2015 Evaluating short- and longshyterm impacts of fuels treatments and simulated wildfire on an old-forest species Ecosphere 61ndash19
USDA Forest Service 2004 Sierra Nevada Forest Plan Amendment Final supplemental environmental impact statement Record of decision Publication R5-MB-046 USDA Forest Service Pacific Southshywest Region Vallejo California USA
Van Wagner C E 1977 Conditions for the start and spread of crown fire Canadian Journal of Forest Research 723ndash34
Verner J K S McKelvey B R Noon R Gutimerrez G I Gould Jr and T W Beck 1992 Assessment of the current status of the California spotted owl with recommendations for management Pages 3ndash27 in J Verner K S McKelvey B R Noon R Gutimerrez G I Gould Jr and T W Beck edishytors The California Spotted Owl a technical assessment of its current status PSW-GTR-133 USDA Forest Service Albany California USA
Westerling A B Bryant H Preisler T Holmes H Hidalgo T Das and S Shrestha 2011 Climate change and growth scenarios for California wildshyfire Climatic Change 109445ndash463
Westerling A L H G Hidalgo D R Cayan and T W Swetnam 2006 Warming and earlier Spring increase Western US Forest Wildfire Activity Science 313940ndash943
Wiedinmyer C and M D Hurteau 2010 Prescribed fire as a means of reducing forest carbon emissions in the Western United States Environmental Science amp Technology 441926ndash1932
SUPPORTING INFORMATION
Additional Supporting Information may be found online at httponlinelibrarywileycomdoi101002ecs2 1648full
wwwesajournalsorg 21 January 2017 Volume 8(1) Article e01648
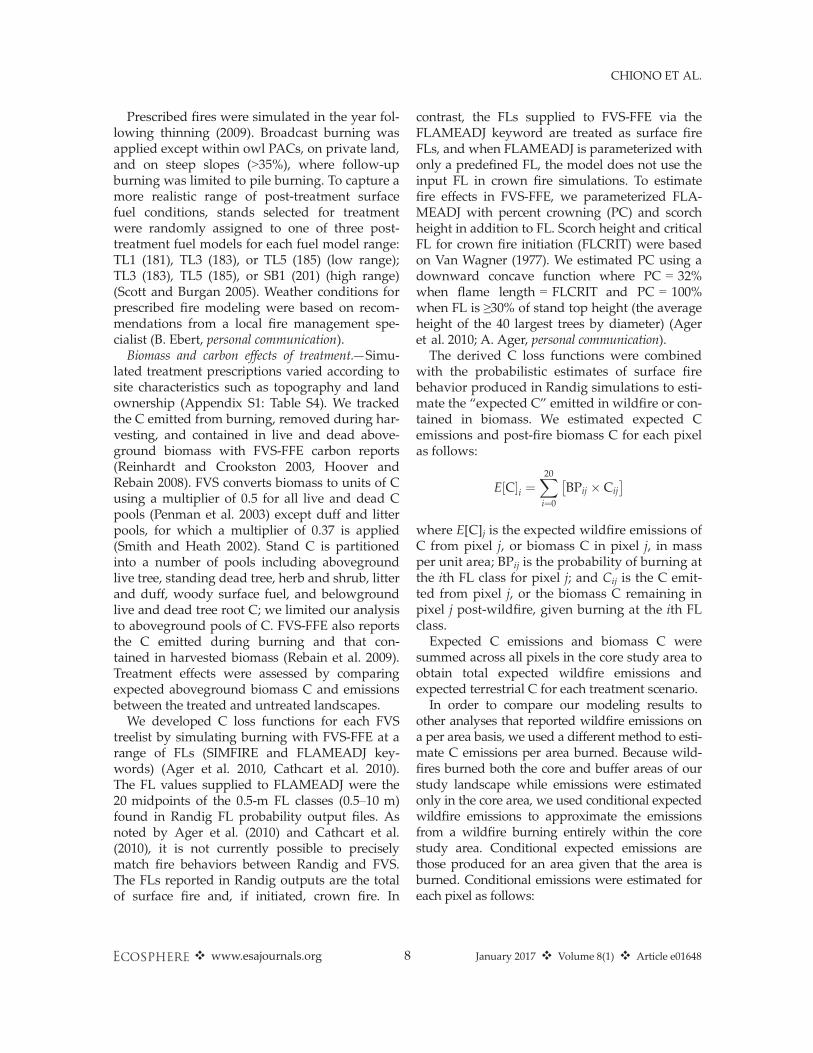
CHIONO ET AL
Prescribed fires were simulated in the year folshylowing thinning (2009) Broadcast burning was applied except within owl PACs on private land and on steep slopes (gt35) where follow-up burning was limited to pile burning To capture a more realistic range of post-treatment surface fuel conditions stands selected for treatment were randomly assigned to one of three post-treatment fuel models for each fuel model range TL1 (181) TL3 (183) or TL5 (185) (low range) TL3 (183) TL5 (185) or SB1 (201) (high range) (Scott and Burgan 2005) Weather conditions for prescribed fire modeling were based on recomshymendations from a local fire management speshycialist (B Ebert personal communication)
Biomass and carbon effects of treatmentmdashSimushylated treatment prescriptions varied according to site characteristics such as topography and land ownership (Appendix S1 Table S4) We tracked the C emitted from burning removed during harshyvesting and contained in live and dead aboveshyground biomass with FVS-FFE carbon reports (Reinhardt and Crookston 2003 Hoover and Rebain 2008) FVS converts biomass to units of C using a multiplier of 05 for all live and dead C pools (Penman et al 2003) except duff and litter pools for which a multiplier of 037 is applied (Smith and Heath 2002) Stand C is partitioned into a number of pools including aboveground live tree standing dead tree herb and shrub litter and duff woody surface fuel and belowground live and dead tree root C we limited our analysis to aboveground pools of C FVS-FFE also reports the C emitted during burning and that conshytained in harvested biomass (Rebain et al 2009) Treatment effects were assessed by comparing expected aboveground biomass C and emissions between the treated and untreated landscapes
We developed C loss functions for each FVS treelist by simulating burning with FVS-FFE at a range of FLs (SIMFIRE and FLAMEADJ keyshywords) (Ager et al 2010 Cathcart et al 2010) The FL values supplied to FLAMEADJ were the 20 midpoints of the 05-m FL classes (05ndash10 m) found in Randig FL probability output files As noted by Ager et al (2010) and Cathcart et al (2010) it is not currently possible to precisely match fire behaviors between Randig and FVS The FLs reported in Randig outputs are the total of surface fire and if initiated crown fire In
contrast the FLs supplied to FVS-FFE via the FLAMEADJ keyword are treated as surface fire FLs and when FLAMEADJ is parameterized with only a predefined FL the model does not use the input FL in crown fire simulations To estimate fire effects in FVS-FFE we parameterized FLAshyMEADJ with percent crowning (PC) and scorch height in addition to FL Scorch height and critical FL for crown fire initiation (FLCRIT) were based on Van Wagner (1977) We estimated PC using a downward concave function where PC = 32 when flame length = FLCRIT and PC = 100 when FL is ge30 of stand top height (the average height of the 40 largest trees by diameter) (Ager et al 2010 A Ager personal communication) The derived C loss functions were combined
with the probabilistic estimates of surface fire behavior produced in Randig simulations to estishymate the ldquoexpected Crdquo emitted in wildfire or conshytained in biomass We estimated expected C emissions and post-fire biomass C for each pixel as follows
20 X[ ]Efrac12 ]C i frac14 BPij X Cij
ifrac140
where E[C]j is the expected wildfire emissions of C from pixel j or biomass C in pixel j in mass per unit area BPij is the probability of burning at the ith FL class for pixel j and Cij is the C emitshyted from pixel j or the biomass C remaining in pixel j post-wildfire given burning at the ith FL class Expected C emissions and biomass C were
summed across all pixels in the core study area to obtain total expected wildfire emissions and expected terrestrial C for each treatment scenario In order to compare our modeling results to
other analyses that reported wildfire emissions on a per area basis we used a different method to estishymate C emissions per area burned Because wildshyfires burned both the core and buffer areas of our study landscape while emissions were estimated only in the core area we used conditional expected wildfire emissions to approximate the emissions from a wildfire burning entirely within the core study area Conditional expected emissions are those produced for an area given that the area is burned Conditional emissions were estimated for each pixel as follows
wwwesajournalsorg 8 January 2017 Volume 8(1) Article e01648
CHIONO ET AL
Table 2 Total area and proportion of area treated by category in each treatment scenario
SC1 SC2 SC3
Proportion of Proportion of Proportion of Treatment category Area (ha) area treated Area (ha) area treated Area (ha) area treated
Treated 11081 100 11082 100 11081 100 Avail for treatmentdagger 22042 199 28998 262 45647 412 Owl habitat treated 00 000 2769 025 1127 010 Private land treated 00 000 00 000 5685 051 Hand thin 1499 014 3819 034 1612 015 Biomass thin 8404 076 7240 065 9470 085 Commercial thin 7765 070 6916 062 9470 085 Broadcast burn 9410 085 7247 065 3785 034 Pile burn 1671 015 3835 035 7296 066
dagger Total land area potentially available for treatment in each scenario The area available for treatment increased from Scenarshyios 1 to 3 as restrictions on the area available for treatment were relaxed
20 X C WCfrac12 ]j frac14
BPij X WCijBPjifrac141
where C[WC]j is the C emitted by wildfire from pixel j in mass per unit area BPj is the probability that pixel j is burned BPij is the probability of burning at the ith FL class and WCij is the C emitted from pixel j when burned at the ith FL class
Conditional expected emissions were averaged across all pixels to obtain an estimate of wildfire emissions per area burned
Large fire revisionmdashWildfire modeling was calishybrated to produce fire sizes that approximated area burned in spread events of historical large wildfires near the study area However during the course of the study a very large fire encounshytered our study area The King Fire began on 13 September 2014 in El Dorado County and burned 39545 hamdashmore than an order of magnishytude greater than our modeled wildfires includshying gt25 of the study area Given the potential for very large wildfires in this region demonshystrated by the King Fire we completed addishytional wildfire modeling to estimate the C effects of treatment given the occurrence of a very large fire
Randig modeling was repeated for the no-treatment and S3 scenarios using the high fuel model range and a revised burn period number of simulated ignitions wind speed and wind directions Burn period was increased from 5 to 12 h number of ignitions was reduced by half to 40000 Wind directions and relative probabilities (Appendix S1 Table S5) were those recorded at
Hell Hole RAWS between 0400 and 1900 hours on 17 September the day of the King Firersquos larshygest spread event We used the probable 1-min maximum wind speed as calculated from the maximum gust recorded on that day 33 kmh (205 mph) based on maximum gust of 547 kmh (34 mph) (Crosby and Chandler 1966) These settings produced average fire sizes of NT = 10757 ha (no-treatment scenario) and 8070 ha (S3) Average fire size was limited by the size of our buffered study area Longer burn periods resulted in an increasing number of simulated wildfires that burned to the study area boundary
RESULTS
Treatment simulation Table 2 provides a summary of the area treashy
ted in each scenario Scenario 1 (S1) was the most restrictive with respect to the land area available for treatment which more than doushybled between S1 and S3 Because treatment preshyscriptions varied with land designation (public owl PAC private) and the designations availshyable for treatment varied between scenarios the relative proportions of thinning and burning methods also varied between scenarios Comshymercial and biomass thinning were applied most frequently in S3 which permitted treatshyment of private land Spotted owl activity censhyters composed 25 of the area treated in S2 vs 10 in S3 and 0 in S1 the scenario in which PACs were not subject to treatment As a result the area treated with hand thinning in S2 was more than twice that in S1 and S3 Due to the
wwwesajournalsorg 9 January 2017 Volume 8(1) Article e01648
CHIONO ET AL
Fig 4 Low fuel model range treatment locations and difference in conditional burn probability (CBP) and conshyditional flame length (CFL) (untreated-treated) for each treatment scenario Negative values indicate an increase in CBP or CFL while positive values represent a reduction CBP is the likelihood that a pixel will burn given a single ignition on the landscape and assuming the simulation conditions described in Appendix S1 Table S1 and in the text Conditional flame length is the probability-weighted flame length given these same assumptions
inclusion of PACs in S2 and both PACs and prishyvate land in S3 the proportion of area treated with pile burning increased between S1 and S3 while broadcast burn area exhibited an opposite trend Despite the variation in land designations available for treatment the pattern of treatshyment placement was generally similar between scenarios with treatments concentrated in the central and eastern portions of the study area (Figs 4 5)
Landscape-scale burn probability and fire hazard Conditional burn probabilitymdashThe pixel-to-pixel
change in CBP between the untreated scenario and each treatment scenario is mapped in Figs 4 (LO FM) and 5 (HI FM) Treatment reduced landshyscape burn probability by approximately 50 (Table 3) from 00124 (NT) to 00062 (S1) 00059 (S2) and 00055 (S3) Within treatment units avershyage CBP fell by 69ndash76 to 00033ndash00035 outside of treated stands CBP fell to 00060ndash00069 Some
wwwesajournalsorg 10 January 2017 Volume 8(1) Article e01648
CHIONO ET AL
Fig 5 Treatment locations and high fuel model range difference in conditional burn probability and condishytional flame length (untreated-treated) for each treatment scenario
increases in CBP were also observed particularly for the low fuel model range (Fig 4)
The influence of treatment on owl PAC likelishyhood of burning was similar to that observed for stands in general For treated PACs average CBP fell by ~70 relative to no treatment for the same stands Although PACs were not eligible for treatment in S1 all treatment scenarios had a large impact on estimated PAC CBP Average PAC CBP was reduced from 0013 to 00063 in S1 00049 in S2 and 00054 in S3 a 49ndash64 decrease relative to PACs in the no-treatment landscape (Table 3)
Fire hazardmdashTreatments reduced average landshyscape CFL by ~1 m from 36 m (NT) to 25ndash27 m Pixel-level CFL was reduced by a maximum of 80 m (LO FM) and 90 m (HI FM) Increases in CFL were also observed however particularly near the study arearsquos western and southwestern boundaries where treatments were least concentrated (Figs 4 5) Maximum pixel-level CFL increases were 25 m (LO FM) and 31 m (HI FM) Because fire hazard was used in prioritizing
stands for treatment the estimated pre-treatment CFL in stands selected for treatment (43ndash51 m)
wwwesajournalsorg 11 January 2017 Volume 8(1) Article e01648
CHIONO ET AL
Table 3 Proportional change in burn probability for treatment scenarios compared to the NT scenario
LO FM HI FM AVG
Stand type
S1 S2 S3 Proportional change
relative to NT
S1 S2 S3 Proportional change
relative to NT
S1 S2 S3 Proportional change
relative to NT
All PACs -045 -064 -056 -053 -063 -059 -049 -064 -057 Treated PACs NA -081 -076 NA -057 -067 NA -069 -072 Untreated PACs -045 -053 -051 -053 -054 -058 -049 -053 -054 All stands Treated stands
-044 -076
-048 -079
-053 -063
-050 -072
-053 -074
-056 -074
-047 -074
-050 -076
-054 -069
Untreated stands -035 -039 -049 -045 -047 -051 -040 -043 -050
Notes NT no treatment PACs protected activity centers Proportions are ratios of treatment values to no-treatment values as calculated for the same stands Treatment and no-treatment values were calculated as the average pixel value for the low and high fuel model range (LO FM and HI FM) within each stand category and treatment scenario
was greater than in stands not selected (32ndash 33 m) After treatment average CFL within treashyted stands fell to 13 (S1 and S2) and 17 m (S3) CFL in untreated stands was also reduced as a result of the influence of treatments on fire spread and intensity CFL fell by 05ndash08 m (9ndash 16) relative to CFL in the same stands within the no-treatment landscape (Table 4)
Although spotted owl PACs were not treated in S1 relative to PACs in the NT landscape PAC CFL was reduced by 10 (to 32 m) in S1 Treating PACs had a much larger impact on potential fire intensity however Average treashyted PAC CFL fell to 13 and 14 m in S2 and S3 respectively
Carbon consequences of landscape fuel treatments
Prior to treatment aboveground landscape carbon totaled 14705 tonnesha on average Treatments removed 14 of pre-treatment C from treated stands or 2374 tonnesha totaling
81772ndash119103 tonnes of C in harvested biomass and merchantable material (Tables 5 and 6) Both the treatment scenarios and the choice of
fuel models were important influences on estishymated C emissions from burning As the least restrictive treatment scenario in terms of treatshyment location and the only scenario to include treatment of private land where broadcast burnshying was precluded as a treatment option the S3 treatment scenario was associated with the lowshyest wildfire and prescribed burning emissions (Tables 5 and 6) For each treatment scenario expected wildfire emissions increased by more than an order of magnitude between the low and high fuel model ranges This difference was the result of increasing fire intensity as well as wildshyfire size Average wildfire size nearly doubled between fuel model ranges in the treatment sceshynarios and tripled in the no-treatment scenario (Fig 6) For a given treatment scenario wildfire emissions on a per hectare basis were approxishymately two tonnes greater for the high fuel
Table 4 Proportional change in conditional flame length for treatment scenarios compared to the NT scenario
LO FM HI FM AVG
Stand type
S1 S2 S3 Proportional change
relative to NT
S1 S2 S3 Proportional change
relative to NT
S1 S2 S3 Proportional change
relative to NT
All PACs -009 -042 -028 -012 -043 -027 -010 -042 -028 Treated PACs NA -071 -075 NA -071 -073 NA -071 -074 Untreated PACs -009 -014 -011 -012 -017 -014 -010 -016 -013 All stands -022 -026 -031 -025 -026 -028 -024 -026 -030 Treated stands -065 -069 -052 -071 -071 -073 -068 -070 -062 Untreated stands -008 -009 -021 -011 -012 -012 -009 -010 -016
Notes NT no treatment PACs protected activity centers Proportions are ratios of treatment values to no-treatment values as calculated for the same stands Treatment and no-treatment values were calculated as the average pixel value for the low and high fuel model range (LO FM and HI FM) within each stand category and treatment scenario
wwwesajournalsorg 12 January 2017 Volume 8(1) Article e01648
CHIONO ET AL
Table 5 Expected biomass carbon expected wildfire C emissions and C harvested and emitted in fuel treatshyments for NT and treatment (S1 S2 S3) scenarios using the low fuel model range in fire modeling
Carbon pool NT S1 S2 S3
Untreated stands Tonnes C Live 5004505 3915044 3695489 3954131 Dead 1845659 1421704 1378824 1466202 Wildfire emissions 2372 1137 1039 904
Treated stands Live 881358 1072625 826366 Dead 260089 299244 220932 All harvested biomass 88773 81772 119103 Prescribed fire emissions 178530 169693 122599 Wildfire emissions 48 56 61
All stands Live 5004505 4796402 4768113 4780497 Dead 1845659 1681793 1678068 1687135 Treatment (harvested and emitted) 267303 251465 241702 Wildfire emissions 2372 1186 1095 965
Grand totals 6852536 6746684 6698741 6710299
Notes LF indicates the large fire scenarios Expected C is that remaining in the core study area following treatment if applishycable and a random ignition and wildfire in the larger buffered study area as estimated from the simulation of many wildfires Live C is that contained in live aboveground herb shrub and tree biomass dead C is the C contained in litter duff woody surshyface fuel and aboveground portions of tree snags NT no treatment
model range than for the low range In contrast to the large influence of fuel model choice on wildfire emissions the effect of fuel model range on prescribed fire emissions was minimal with only a 1 increase in emissions between the low and high fuel model ranges for a given treatment scenario
Although treatment significantly reduced wildshyfire emissions combined emissions from preshyscribed burning on 20 of the landscape and wildfire exceeded wildfire emissions in the no-treatment scenarios (Tables 5 and 6) Relative to the no-treatment scenarios treatment reduced estimated wildfire emissions by approximately 54 (low fuel model range) 59 (high fuel model range) and 45 (large fire scenarios) Yet preshyscribed burning was a far more significant source of emissions than were wildfires of moderate size with emissions from treatment exceeding wildfire emissions by 111259ndash177344 tonnes Even for the large wildfire simulations where landscape treatments nearly halved estimated wildfire emisshysions the combined carbon emissions from preshyscribed burning and wildfire in the treatment scenario surpassed wildfire emissions in the no-treatment scenario by 45 (Table 6 Fig 7)
The total quantity of aboveground C expected to remain on the landscape following treatment
and a randomly ignited wildfire was greatest for the no-treatment scenarios (Tables 5 and 6) For modeled wildfires of moderate size treatment reduced both the live and dead C pools relative to the no-treatment scenarios and terrestrial C in the no-treatment scenarios was 4ndash5 greater (323316 ndash434960 tonnes) than in any of the treatment scenarios (Tables 5 and 6) In comparison under large wildfire conditions the treatment scenario retained slightly more live biomass C~15000 tonshynes or 03 more than the no-treatment scenario However treatment also reduced necromass C by 288000 tonnes (12) resulting in a 3 overall decrease in onsite biomass C relative to an untreshyated landscape (Table 6) The proportional changes in aboveground
biomass C pools between the treatment and no-treatment scenarios are summarized in Table 7 For all treatment scenarios the consumption of duff litter and downed woody fuels with preshyscribed burning contributed to a net reduction in these C pools relative to the untreated landscape Conversely treatments protected more C in the live understory (herb and shrub) poolmdashthe result of reduced wildfire size and intensity in the treatshyment scenarios Treatments in the moderate wildshyfire scenarios reduced live tree biomass C in comparison with no-treatment levels (Fig 8)
wwwesajournalsorg 13 January 2017 Volume 8(1) Article e01648
CHIONO ET AL
Table 6 Expected biomass carbon expected wildfire C emissions and C harvested and emitted in fuel treatshyments for NT and treatment (S1 S2 S3) scenarios using the high fuel model range in fire modeling
Carbon pool NT S1 S2 S3 NT-LF S3-LF
Untreated stands Tonnes C Live 4910239 3879854 3664690 3923358 4586898 3750774 Dead 1912429 1448947 1403313 1489629 2130034 1605591 Wildfire emissions 31831 12934 12001 11293 137622 68061
Treated stands Live 896670 1115918 853503 847374 Dead 280182 325628 238130 247744 All harvested biomass 88773 81772 119103 119103 Prescribed fire emissions 180357 171247 123539 123539 Wildfire emissions 798 951 986 8285
All stands Live 4910239 4776524 4780607 4776861 4586898 4598148 Dead 1912429 1729129 1728941 1727759 2130034 1853334 Treatment (harvested and emitted) 282862 265971 254921 254921 Wildfire emissions 31831 13732 12952 12279 137622 76346
Grand totals 6854499 6802247 6788471 6771820 6854554 6782749
Notes LF indicates the large fire scenarios Expected terrestrial C is that remaining in the core study area following treatshyment if applicable and a random ignition and wildfire in the larger buffered study area as estimated from the simulation of many wildfires Live C is that contained in live aboveground herb shrub and tree biomass dead C is the C contained in litter duff woody surface fuel and aboveground portions of tree snags NT no treatment
Notably in the large modeled wildfire scenarios (NT-LF and S3-LF) treatments resulted in a 400000-tonne increase in landscape-level live tree C over the no-treatment scenario
DISCUSSION
Fuel treatments in protected habitat Because there are often competing objectives
between managing forests for resilience to fire and drought and protecting owl habitat we assessed potential fire occurrence and hazard based on treatment scenarios that included and omitted treatment of PACs Conducting fuels management outside of occupied owl habitat has been suggested as a means of reducing fire risk within occupied sites (Jenness et al 2004 Tempel et al 2015) Ager et al (2007) reported that fuel treatments on 20 of a western Oregon landscape reduced the probability of northern spotted owl nesting and roosting habitat loss by 44 even though that habitat type was not treated As in Ager et al (2007) we observed modifications in fire intensity and burn probability within owl habitat even when it was left untreated In the S1 treatment scenario in which owl activity centers were not eligible for treatment the effect of treatshying other stands reduced both fire hazard (by
9ndash12 for CFL or approximately 04 m) and CBP (by ~45) within PACs It is difficult to assess the significance of this proportional reduction in CBP given that the absolute differences in probabilities were relatively modest (Figs 3 4) Ager et al (2007) noted that allowing treatment of owl habishytat would have significantly reduced estimated habitat loss in their study In this study it is expected that habitat quality may be reduced within treated PACs in the short term through the removal of small-diameter trees (ie lower vertical structural heterogeneity) However two structural attributes for suitable spotted owl nestshying habitat identified by Tempel et al (2015) high canopy cover and large tree density would not be altered While we did not directly estimate habitat loss we did observe much larger reductions in fire hazard within PACs that were treated as meashysured by CFL (71ndash75 reduction equivalent to 2ndash3 m) It should be noted that the effect of wideshyspread treatments within PACs on spotted owl nesting and foraging behavior is unknown One concern with designating some land area
unavailable for treatment is that it may limit the potential for treatments to alter fire behavior across the landscape (eg Finney 2001) Including all stands in the potential treatment pool allows the highest-priority stands with respect to simulated
wwwesajournalsorg 14 January 2017 Volume 8(1) Article e01648
CHIONO ET AL
effects on landscape-level fire behavior The true effect of increasing the land area available for treatshyment may be partially obscured by the varying frequency of treatment prescriptions between sceshynarios For example the hand thinning treatments applied within PACs would be expected to have a milder effect on potential wildfire behavior than more severe prescriptions and hand thinning was twice as common in S2 as in the other scenarios
Terrestrial carbon and burning emissions Landscape treatments reduced wildfire emisshy
sions by reducing the emissions produced per area burned by wildfire as well as average wildfire size On average wildfires in the treated landscapes released 193ndash216 tonnes Cha while wildfires in the untreated landscapes released 234ndash254 tonnes Cha Modeled wildfires decreased in size by 7 (low fuel model range) 36 (high fuel model range) and 25 (large fire scenario) relative to untreated landscapes (Fig 6) Since the burn pershyiod for simulated wildfires was held constant between scenarios this reduction in average wildshyfire size is the result of reduced spread rates derived from fuel treatments Despite the influence of treatments on wildfire
intensity size and expected emissions treatment-related emissions exceeded the avoided wildfire emissions conferred by treatment Prescribed burning in our study a combination of broadcast
Fig 6 Wildfire size relative frequency distributions from wildfire simulations Bar color represents no-treatment (NT) and treatment scenarios (S1ndashS3)
fire spread to be treated which would be expected to achieve the greatest modification of landscape fire behavior and effects In the present study although the land area potentially available for treatment more than doubled between S1 and S3 landscape-level effects of treatment on modeled fire risk and hazard were fairly similar (compared with the no-treatment landscape all-stand CBP fell by 47 and 54 in S1 and S3 while CFL fell by 24 and 30) Dow et al (2016) also found that incorporating modest restrictions on treatment Fig 7 Carbon emissions (tonnes) from wildfire and
area availability (24 of the landscape unavail- prescribed burning X-axis labels indicate no-treatment able) had minimal consequences for modeled fire (NT) and treatment scenarios (S1ndashS3) subscripts size and hazard The modest changes in estimated denote fuel model ranges used in fire modeling
fire metrics we observed may also be due to simi- (L low H high) Large fire scenarios which were
larity in the general pattern of treatment placement modeled with the high fuel model range only are indishybetween scenarios which probably led to similar cated by LF
wwwesajournalsorg 15 January 2017 Volume 8(1) Article e01648
CHIONO ET AL
Table 7 Proportional change in expected carbon by biomass pool for treatment scenarios compared to the no-treatment landscape
Treatment Standing Down dead Forest Herb Live scenario dead wood floor shrub tree
S1 004 -017 -013 014 -004 S2 001 -016 -012 014 -004 S3 -001 -015 -010 016 -004 S3-LF -016 -013 -008 017 000
Notes For example a value of -010 represents a 10 decshyline in biomass C from the no-treatment scenario Treatment and no-treatment values were calculated as the average of low and high fuel model range values except in the case of the large fire (LF) scenarios which were modeled for the high fuel model range only Expected C is that remaining after a random ignition and wildfire in the buffered study area as estimated from simulating 80000 ignitions (LF 40000 ignitions)
C pool categories are those reported in Forest Vegetation Simulator Carbon Reports Standing dead aboveground porshytion of standing dead trees Down dead wood woody surface fuels Forest floor litter and duff Herbshrub herbs and shrubs Live tree aboveground portion of live trees
and pile burning released 111ndash163 tonnes Cha For comparison studies conducted in comparable forest types have estimated prescribed fire emisshysions of 127 tonnes Cha (warm dry ponderosa pine habitat types Reinhardt and Holsinger 2010)
Fig 8 Expected carbon contained in aboveground live and dead tree biomass Expected C is that remainshying in the core study area following treatment (if applishycable) and a single random ignition within the larger buffered study area X-axis labels indicate no-treatment (NT) and treatment scenarios (S1ndashS3) subshyscripts denote fuel model ranges used in fire modeling (L low H high) Large fire scenarios which were modeled for the high fuel model range only are indishycated by LF
and 148 tonnes Cha (an old-growth mixed-conifer reserve in the southern Sierra Nevada North et al 2009a) Relative to the approximately 158000 tonnes C emitted in prescribed burning avoided wildfire emissions at 1186ndash19551 tonnes for wildfires of moderate size were small A simishylar study in southern Oregon with average modshyeled wildfires of 2350 and 3500 ha (treatment and no-treatment scenarios respectively) found that treatments reduced expected wildfire emissions by 6157 tonnes of C (Ager et al 2010) Surface fuels represented with surface fuel
models in commonly used modeling software are the most influential inputs determining preshydicted fire behavior (Hall and Burke 2006) Fire behavior fire sizes and emissions in this study varied according to fuel model assignment highshylighting the importance of selecting the approprishyate fuel model to represent fuel conditions (see Collins et al 2013) We show a 12- to 14-fold change in wildfire emissions due solely to the choice of fuel models (Tables 5 and 6) Indeed the range of fuel models used in recent studies investigating fuel treatments and simulated fire behavior in mixed-conifer forests is noteworthy Incorporating a range of fuel models into analyshyses such that outcome variability can be reported facilitates comparison of effects across studies Our estimates of the aboveground C benefits
of treatment under the moderate wildfire scenarshyios with average fire sizes of le2133 ha are likely conservative The effect of modeled wildfire size on the C consequences of fuel treatment was conshysiderable emphasizing the importance of this variable in studies of the climate benefits of treatshyment Avoided wildfire emissions resulting from treatment increased to 61276 tonnes C when large wildfires (8070ndash10757 ha) were simulated The treatment scenario given large wildfires also protected a greater portion of live tree C If the ~40000-ha King Fire is representative of the magnitude of future wildfires in the region C accounting should improve with respect to treatshyment favorability Similarly if multiple wildfires were to encounter the study area within the effective lifespan of treatments the C gains assoshyciated with avoided emissions in the treatment scenarios would increase Our approach to estimating the C conseshy
quences of fuel treatments has a number of limitashytions A full accounting of treatment effects
wwwesajournalsorg 16 January 2017 Volume 8(1) Article e01648
CHIONO ET AL
would project through time the consequences of both treatment and wildfire Our analysis is static incorporating only the short-term C costs and benefits of treatment Simulating wildfire in the year immediately following treatment maximizes the apparent benefits of treatment Over time as surface fuels accumulate and vegetation regenershyates maintenance would be required to retain the effectiveness of treatments (Martinson and Omi 2013) increasing the C costs of reduced fire hazard In addition the C contained in fire-killed biomass will ultimately be emitted to the atmoshysphere although biomass decay could be delayed through conversion to long-lived wood products such as building materials (Malmsheimer et al 2011) It is also important to note that our analysis did not include stochastic wildfire occurrence Estimates of burn probability in the present study are not estimates of the likelihood of wildfire occurrence based on historical fire sizes and freshyquency (eg Preisler et al 2004 Mercer and Prestemon 2005 Brillinger et al 2006) but rather are conditional on a single randomly ignited wildfire within the buffered study area
CONCLUSIONS
Our findings generally support those of Campshybell et al (2011) who concluded from an analysis of fire-prone western forests that the C costs of treatments are likely to outweigh their benefits under current depressed fire frequencies In a more recent paper Campbell and Ager (2013) conshycluded that ldquonone of the fuel treatment simulation scenarios resulted in increased system carbonrdquo primarily from the low incidences of treated areas being burned by wildfire However our interpreshytation of these findings differs from those disshycussed in Campbell et al (2011) and Campbell and Ager (2013) especially in light of recent and projected future trends in fire activity (Westerling et al 2011 Miller and Safford 2012 Dennison et al 2014) The current divergence of increasing surface air temperatures and low fire activity is unlikely to be sustained further suggesting greater future fire activity (Marlon et al 2012) If increased fire activity is realized then the likelishyhood of a given area being burned in a wildfire increases This differs from the simple increase in stand-level fire frequency modeled by Campbell et al (2011) because increases in fire likelihood are
not necessarily associated with corresponding decreases in fire severity as assumed by Campbell et al (2011) Increased fire likelihood could very well lead to positive feedbacks in fire severity and ultimately to vegetation type conversion (Copposhyletta et al 2016)mdasheffects that would have signifishycant implications for carbon storage Due to the significant emissions associated
with treatment and the low likelihood that wildshyfire will encounter a given treatment area forest management that is narrowly focused on C accounting alone would favor the no-treatment scenarios Landscape treatments protected more C in live tree biomass only when large wildfires were simulated While treatment favorability improved with large wildfire simulation the no-treatment scenario still produced fewer emissions than the treatment scenario Given the potential for large wildfire in the region as demonstrated by the 2014 King Fire and the increasing freshyquency of large wildfires and area burned in Calishyfornia expected from climate modeling studies (Lenihan et al 2008 Westerling et al 2011) we suggest that future studies of fuel treatmentndashwildshyfirendashC relationships should incorporate the potenshytial for large wildfires at a frequency greater than those observed over the last 20ndash30 yr Others have argued that treatments to increase forest resilience should be a stand-alone top land management priority independent of other ecosystem values such as carbon sequestration and fire hazard reduction (Stephens et al 2016a) We also note that the potential benefits of fuels
management are not restricted to avoided wildshyfire emissions Here we show that landscape fuel treatments can alter fire hazard across the landshyscape both within and outside of treated stands and have the potential to affect the likelihood of burning and fire intensity within protected Calishyfornia spotted owl habitat Underscoring the risk to sensitive habitat the 2014 King Fire encounshytered 31 PACs within our study area leading to the greatest single-year decline in habitat occushypancy recorded over a 23-yr study period (Jones et al 2016) Modest simulated treatments within activity centers significantly reduced potential fire intensity relative to both the no-treatment landscape and a treatment scenario that did not permit treatment within PACs indicating that active management may be desirable to protect habitat in the long term (Roloff et al 2012)
wwwesajournalsorg 17 January 2017 Volume 8(1) Article e01648
CHIONO ET AL
However treatments conducted outside of owl habitat also reduced wildfire hazard
ACKNOWLEDGMENTS
We are grateful to a number of individuals for sharshying their time and fuel treatment and fire modeling expertise Nicole Vaillant (ArcFuels) Alan Ager and Andrew McMahan (carbon estimation) and Coeli Hoover (harvest simulations in FVS-FFE) Brian Ebert and Dana Walsh of the Eldorado National Forest proshyvided invaluable advice on weather inputs for fire modeling and on designing fuel treatment prescripshytions Ken Somers Operations Forester on the Blodgett Forest Research Station gave advice concerning timshyber management on private land We also thank two anonymous reviewers whose comments greatly improved this article The California Energy Commisshysion provided funding for this project
LITERATURE CITED
Ager A A B Bahro and K Barber 2006 Automating the fireshed assessment process with ArcGIS Pages 163ndash167 in P L Andrews and B W Butler (Comps) Fuels ManagementndashHow to Measure Success Conference Proceedings Portland OR March 28ndash30 2006 Proceedings RMRS-P-41 USDA Forest Service Rocky Mountain Research Station Fort Collins Colorado USA
Ager A A M A Finney B K Kerns and H Maffei 2007 Modeling wildfire risk to northern spotted owl (Strix occidentalis caurina) habitat in Central Oregon USA Forest Ecology and Management 24645ndash56
Ager A A M A Finney A McMahan and J Cathcart 2010 Measuring the effect of fuel treatments on forshyest carbon using landscape risk analysis Natural Hazards and Earth System Science 102515ndash2526
Ager A A N M Vaillant D E Owens S Brittain and J Hamann 2012 Overview and example application of the Landscape Treatment Designer Pages 11 General Technical Report PNW-GTR-859 USDA Forest Service Pacific Northwest Research Station Portland Oregon USA
Barbour M G and R A Minnich 2000 Californian upland forests and woodlands Pages 131ndash164 in M Barbour and W Billings editors North Amerishycan terrestrial vegetation Cambridge University Press Cambridge UK
Bias M A and R Gutimerrez 1992 Habitat associations of California spotted owls in the central Sierra Nevada Journal of Wildlife Management 56584ndash595
Bond M L R Gutierrez A B Franklin W S LaHaye C A May and M E Seamans 2002
Short-term effects of wildfires on spotted owl surshyvival site fidelity mate fidelity and reproductive success Wildlife Society Bulletin 301022ndash1028
Brillinger D H Preisler and J Benoit 2006 Probashybilistic risk assessment for wildfires Environ-metrics 17623ndash633
Campbell J L and A A Ager 2013 Forest wildfire fuel reduction treatments and landscape carbon stocks a sensitivity analysis Journal of Environshymental Management 121124ndash132
Campbell J L M E Harmon and S R Mitchell 2011 Can fuel-reduction treatments really increase forest carbon storage in the western US by reducshying future fire emissions Frontiers in Ecology and the Environment 1083ndash90
Cathcart J A A Ager A McMahan M Finney and B Watt 2010 Carbon benefits from fuel treatshyments Pages 61ndash80 in T B Jain R T Graham and J Sandquist editors Integrated management of carbon sequestration and biomass utilization opportunities in a changing climate Proceedings of the 2009 National Silviculture Workshop Boise Idaho June 15ndash18 2009 USDA Forest Service Proshyceedings RMRS-P-61 Rocky Mountain Research Station Fort Collins Colorado USA
Chatfield A H 2005 Habitat selection by a California spotted owl population a landscape scale analysis using resource selection functions Thesis Univershysity of Minnesota St Paul Minnesota USA
Collins B M H A Kramer K Menning C Dilling-ham D Saah P A Stine and S L Stephens 2013 Modeling hazardous fire potential within a comshypleted fuel treatment network in the northern Sierra Nevada Forest Ecology and Management 310156ndash166
Collins B M S L Stephens J J Moghaddas and J Battles 2010 Challenges and approaches in planshyning fuel treatments across fire-excluded forested landscapes Journal of Forestry 10824ndash31
Collins B M S L Stephens G B Roller and J J Battles 2011 Simulating fire and forest dynamics for a landscape fuel treatment project in the Sierra Nevada Forest Science 5777ndash88
Coppoletta M K E Merriam and B M Collins 2016 Post-fire vegetation and fuel development influences fire severity patterns in reburns Ecologishycal Applications 26686ndash699
Crookston N L and A O Finley 2008 yaimpute an r package for knn imputation Journal of Statistical Software 231ndash16
Crookston N L M Moeur and D L Renner 2002 Userrsquos guide to the most similar neighbor imputashytion program version 2 General Technical Report RMRS-GTR-96 USDA Forest Service Rocky Mountain Research Station Ogden Utah USA
wwwesajournalsorg 18 January 2017 Volume 8(1) Article e01648
CHIONO ET AL
Crosby J and C Chandler 1966 Get the most from your windspeed observations Fire Control Notes 2712ndash13
Dailey S J Fites A Reiner and S Mori 2008 Fire behavior and effects in fuel treatments and proshytected habitat on the Moonlight fire Fire Behavior Assessment Team wwwfsfedusadaptivemana gementprojectsFBATdocsMoonlightFinal_8_6_08 pdf
Dennison P E S C Brewer J D Arnold and M A Moritz 2014 Large wildfire trends in the western United States 1984ndash2011 Geophysical Research Letters 412928ndash2933
Dixon G E 2002 Essential FVS a userrsquos guide to the forest vegetation simulator Pages 193 USDA Forest Service Forest Management Service Center Fort Collins Colorado USA
Dore S T E Kolb M Montes-Helu B W Sullivan W D Winslow S C Hart J P Kaye G W Koch and B A Hungate 2008 Long-term impact of a stand-replacing fire on ecosystem CO2 exchange of a ponderosa pine forest Global Change Biology 141ndash20
Dore S M Montes-Helu S C Hart B A Hungate G W Koch J B Moon A J Finkral and T E Kolb 2012 Recovery of ponderosa pine ecosystem carbon and water fluxes from thinning and stand-replacing fire Global Change Biology 183171ndash3185
Dow C J B M Collins and S L Stephens 2016 Incorporating resource protection constraints in an analysis of landscape fuel-treatment effectiveness in the Northern Sierra Nevada California USA Environmental Management 571ndash15
Eidenshink J B Schwind K Brewer Z Zhu B Quayle and S Howard 2007 A project for monshyitoring trends in burn severity Fire Ecology 33ndash21
Evans A M and A J Finkral 2009 From renewable energy to fire risk reduction a synthesis of biomass harvesting and utilization case studies in US forshyests GCB Bioenergy 1211ndash219
Finkral A J and A M Evans 2008 The effects of a thinning treatment on carbon stocks in a northern Arizona ponderosa pine forest Forest Ecology and Management 2552743ndash2750
Finney M A 2001 Design of regular landscape fuel treatment patterns for modifying fire growth and behavior Forest Science 47219ndash228
Finney M A 2002 Fire growth using minimum travel time methods Canadian Journal of Forest Research 321420ndash1424
Finney M A 2006 An overview of FlamMap fire modeling capabilities Pages 213ndash220 in P L Andrews and B W Butler editors Proceedings of Fuels ManagementndashHow to Measure Success Research Paper RMRS-P-41 USDA Forest Service
Rocky Mountain Research Station Portland Oregon USA
Finney M A R C Seli C W McHugh A A Ager B Bahro and J K Agee 2007 Simulation of longshyterm landscape-level fuel treatment effects on large wildfires International Journal of Wildland Fire 16712ndash727
Fulme P Z J E Crouse J P Roccaforte and E L Kalies 2012 Do thinning andor burning treatments in western USA ponderosa or Jeffrey pine-dominated forests help restore natural fire behavior Forest Ecology and Management 26968ndash81
Gaines W L R J Harrod J Dickinson A L Lyons and K Halupka 2010 Integration of Northern spotted owl habitat and fuels treatments in the eastern Cascades Washington USA Forest Ecolshyogy and Management 2602045ndash2052
Gaines W L R A Strand and S D Piper 1997 Effects of the hatchery complex fires on northern spotted owls in the eastern Washington Cascades Pages 123ndash129 in J N Greenlee editor Proceedings of the Fire Effects on Rare and Endangered Species and Habitats Conference Coeur DrsquoAlene Idaho International Association of Wildfire and Forestry Hot Springs South Dakota USA
Hall S A and I C Burke 2006 Considerations for characterizing fuels as inputs for fire behavior models Forest Ecology and Management 227 102ndash114
Hoover C and S Rebain 2008 The Kane Experimenshytal Forest carbon inventory carbon reporting with FVS Pages 13ndash15 in R N Havis and N L Crookston editors Third Forest Vegetation Simushylator Conference Fort Collins Colorado February 13ndash15 2007 USDA Forest Service Rocky Mountain Research Station Fort Collins Colorado USA
Hurteau M and M North 2009 Fuel treatment effects on tree-based forest carbon storage and emissions under modeled wildfire scenarios Fronshytiers in Ecology and the Environment 7409ndash414
Hurteau M D and M North 2010 Carbon recovery rates following different wildfire risk mitigation treatments Forest Ecology and Management 260 930ndash937
Hurteau M D M T Stoddard and P Z Fulme 2011 The carbon costs of mitigating high-severity wildshyfire in southwestern ponderosa pine Global Change Biology 171516ndash1521
Jenness J S P Beier and J L Ganey 2004 Associashytions between forest fire and Mexican spotted owls Forest Science 50765ndash772
Jones G M R Gutimerrez D J Tempel S A Whitmore W J Berigan and M Z Peery 2016 Megafires an emerging threat to old-forest species Frontiers in Ecology and the Environment 14300ndash306
wwwesajournalsorg 19 January 2017 Volume 8(1) Article e01648
CHIONO ET AL
Laymon S A 1988 Ecology of the spotted owl in the central Sierra Nevada California Dissertation University of California Berkeley California USA
Lenihan J M D Bachelet R P Neilson and R Drapek 2008 Response of vegetation distribution ecosystem productivity and fire to climate change scenarios for California Climatic Change 87215ndash230
Lydersen J M B M Collins E E Knapp G B Roller and S Stephens 2015 Relating fuel loads to overshystorey structure and composition in a fire-excluded Sierra Nevada mixed conifer forest International Journal of Wildland Fire 24484ndash494
Malmsheimer R J Bowyer J Fried E Gee R Islar R Miner I E Munn E Oneil and W C Stewart 2011 Managing forests because carbon matters integrating energy products and land manageshyment policy Journal of Forestry 109S7ndashS50
Marlon J R et al 2012 Long-term perspective on wildfires in the western USA Proceedings of the National Academy of Sciences of the United States of America 109E535ndashE543
Martinson E J and P N Omi 2002 Performance of fuel treatments subjected to wildfires Pages 7ndash13 in P N Omi and L A Joyce editors Conference on Fire Fuel Treatments and Ecological Restorashytion USDA Forest Service Rocky Mountain Research Station Fort Collins Colorado USA
Martinson E J and P N Omi 2013 Fuel treatments and fire severity a meta-analysis Pages 38 USDA Forest Service Rocky Mountain Research Station Fort Collins Colorado USA
Mayer K E and W F Laudenslayer 1988 A guide to wildlife habitats of California California Departshyment of Forestry and Fire Protection Sacramento California USA
McKenzie D Z Gedalof D L Peterson and P Mote 2004 Climatic change wildfire and conservation Conservation Biology 18890ndash902
Mercer D E and J P Prestemon 2005 Comparing production function models for wildfire risk analyshysis in the wildlandndashurban interface Forest Policy and Economics 7782ndash795
Miller J D and H Safford 2012 Trends in wildfire severity 1984 to 2010 in the Sierra Nevada Modoc Plateau and southern Cascades California USA Fire Ecology 841ndash57
Miller J H Safford M Crimmins and A Thode 2009 Quantitative evidence for increasing forest fire severity in the Sierra Nevada and southern Cascade mountains California and Nevada USA Ecosystems 1216ndash32
North M 2012 Managing Sierra Nevada forests PSWshyGTR-237 USDA Forest Service Pacific Southwest Research Station Albany California USA
North M P and M D Hurteau 2011 High-severity wildfire effects on carbon stocks and emissions in fuels treated and untreated forest Forest Ecology and Management 2611115ndash1120
North M M Hurteau and J Innes 2009a Fire supshypression and fuels treatment effects on mixed-conifer carbon stocks and emissions Ecological Applications 191385ndash1396
North M P A Stine K OrsquoHara W Zielinski and S Stephens 2009b An ecosystem management strategy for Sierran mixed-conifer forests General Technical Report PSW-GTR-220 USDA Forest Service Pacific Southwest Research Station Albany California USA
Parisien M-A S Snetsinger J A Greenberg C R Nelson T Schoennagel S Z Dobrowski and M A Moritz 2012 Spatial variability in wildfire probability across the western United States Intershynational Journal of Wildland Fire 21313ndash327
Penman J M Gytarsky T Hiraishi T Krug D Kruger R Pipatti L Buendia K Miwa T Ngara and K Tanabe 2003 Good practice guidance for land use land-use change and forestry Institute for Global Environmental Strategies for the Intergovshyernmental Panel on Climate Change Hayama Kanagawa Japan
Pollet J and P N Omi 2002 Effect of thinning and prescribed burning on crown fire severity in ponderosa pine forests International Journal of Wildland Fire 111ndash10
Prather J W R F Noss and T D Sisk 2008 Real versus perceived conflicts between restoration of ponderosa pine forests and conservation of the Mexican spotted owl Forest Policy and Economics 10140ndash150
Preisler H K D R Brillinger R E Burgan and J Benoit 2004 Probability based models for estimation of wildfire risk International Journal of Wildland Fire 13133ndash142
Rebain S E Reinhardt N Crookston S Beukema W Kurz and J Greenough 2009 The fire and fuels extension to the Forest Vegetation Simulator Addendum to RMRS-GTR-119 USDA Forest Service and ESSA Technologies Ltd Fort Collins Colorado USA
Reinhardt E D and N L Crookston 2003 The fire and fuels extension to the forest vegetation simulashytor Pages 209 RMRS-GTR-116 USDA Forest Sershyvice Rocky Mountain Research Station Ogden Utah USA
Reinhardt E and L Holsinger 2010 Effects of fuel treatments on carbon-disturbance relationshyships in forests of the northern Rocky Mountains Forest Ecology and Management 2591427ndash1435
wwwesajournalsorg 20 January 2017 Volume 8(1) Article e01648
CHIONO ET AL
Reinhardt E D R E Keane D E Calkin and J D Cohen 2008 Objectives and considerations for wildland fuel treatment in forested ecosystems of the interior western United States Forest Ecology and Management 2561997ndash2006
Ritchie M W C N Skinner and T A Hamilton 2007 Probability of tree survival after wildfire in an interior pine forest of northern California effects of thinning and prescribed fire Forest Ecolshyogy and Management 247200ndash208
Roloff G J S P Mealey and J D Bailey 2012 Comshyparative hazard assessment for protected species in a fire-prone landscape Forest Ecology and Manshyagement 2771ndash10
Rothermel R C 1972 A mathematical model for preshydicting fire spread in wildland fuels Research Paper INT-115 USDA Forest Service Intermounshytain Forest and Range Experiment Station Ogden Utah USA
Safford H D 2008 Fire severity in fuel treatments American River Complex fire Tahoe National Forest California Unpublished Report USDA Forest Service Pacific Southwest Region Vallejo California USA
Schmidt D A A H Taylor and C N Skinner 2008 The influence of fuels treatment and landscape arrangement on simulated fire behavior Southern Cascade range California Forest Ecology and Management 2553170ndash3184
Scott J H and R E Burgan 2005 Standard fire behavior fuel models a comprehensive set for use with Rothermelrsquos surface fire spread model General Technical Report RMRS-GTR-153 USDA Forest Service Rocky Mountain Research Station Fort Collins Colorado USA
Scott J H M P Thompson and J W Gilbertson-Day 2016 Examining alternative fuel management strategies and the relative contribution of National Forest System land to wildfire risk to adjacent homesndasha pilot assessment on the Sierra National Forest California USA Forest Ecology and Manshyagement 36229ndash37
Smith J E and L S Heath 2002 A model of forest floor carbon mass for United States forest types Research Paper NE-722 USDA Forest Service Northeastern Research Station Newtown Square Pennsylvania USA
Stephens S L 2005 Forest fire causes and extent on United States Forest Service lands International Journal of Wildland Fire 14213ndash222
Stephens S L B M Collins E Biber and P Z Fulme 2016a US federal fire and forest policy emphasizshying resilience in dry forests Ecosphere 7e01584
Stephens S L J D Miller B M Collins M P North J J Keane and S L Roberts 2016b Wildfire impacts on California Spotted Owl nesting habitat in the Sierra Nevada Ecosphere 7e01584
Stephens S L J J Moghaddas B R Hartsough E E Y Moghaddas and N E Clinton 2009 Fuel treatshyment effects on stand-level carbon pools treatshyment-related emissions and fire risk in a Sierra Nevada mixed-conifer forest Canadian Journal of Forest Research 391538ndash1547
Stephens S L et al 2012 Fuel treatment impacts on estimated wildfire carbon loss from forests in Monshytana Oregon California and Arizona Ecosphere 31ndash17
Tempel D et al 2015 Evaluating short- and longshyterm impacts of fuels treatments and simulated wildfire on an old-forest species Ecosphere 61ndash19
USDA Forest Service 2004 Sierra Nevada Forest Plan Amendment Final supplemental environmental impact statement Record of decision Publication R5-MB-046 USDA Forest Service Pacific Southshywest Region Vallejo California USA
Van Wagner C E 1977 Conditions for the start and spread of crown fire Canadian Journal of Forest Research 723ndash34
Verner J K S McKelvey B R Noon R Gutimerrez G I Gould Jr and T W Beck 1992 Assessment of the current status of the California spotted owl with recommendations for management Pages 3ndash27 in J Verner K S McKelvey B R Noon R Gutimerrez G I Gould Jr and T W Beck edishytors The California Spotted Owl a technical assessment of its current status PSW-GTR-133 USDA Forest Service Albany California USA
Westerling A B Bryant H Preisler T Holmes H Hidalgo T Das and S Shrestha 2011 Climate change and growth scenarios for California wildshyfire Climatic Change 109445ndash463
Westerling A L H G Hidalgo D R Cayan and T W Swetnam 2006 Warming and earlier Spring increase Western US Forest Wildfire Activity Science 313940ndash943
Wiedinmyer C and M D Hurteau 2010 Prescribed fire as a means of reducing forest carbon emissions in the Western United States Environmental Science amp Technology 441926ndash1932
SUPPORTING INFORMATION
Additional Supporting Information may be found online at httponlinelibrarywileycomdoi101002ecs2 1648full
wwwesajournalsorg 21 January 2017 Volume 8(1) Article e01648
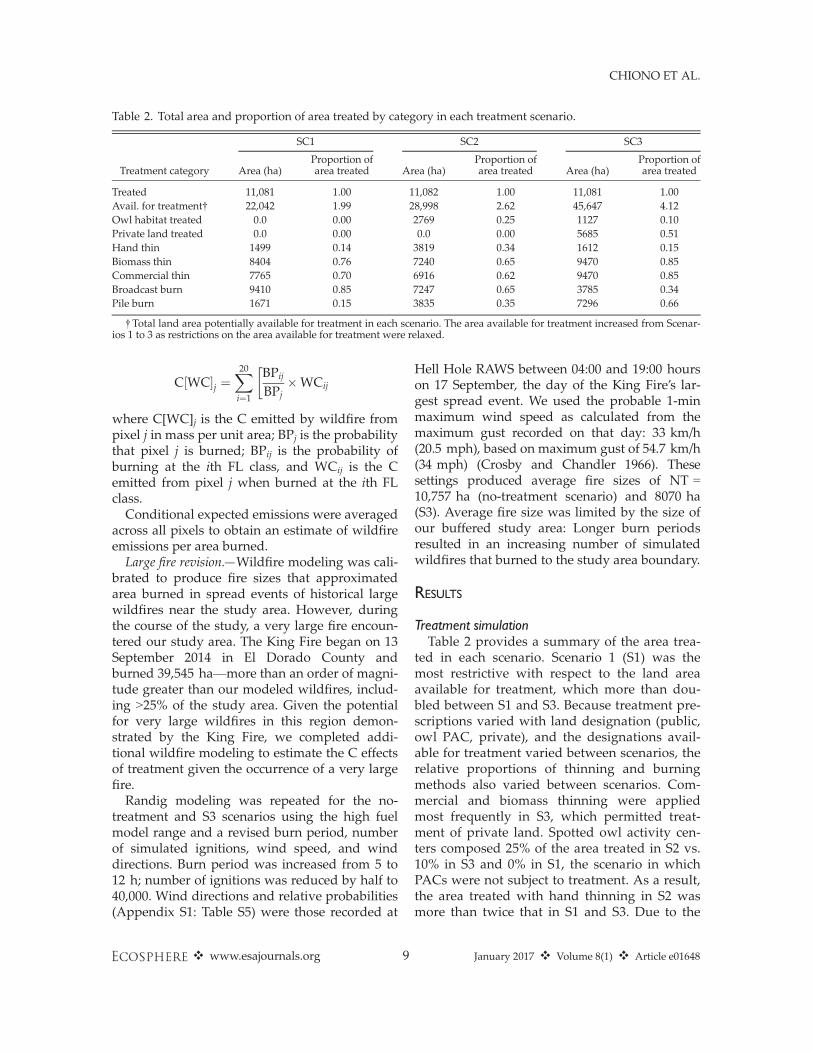
CHIONO ET AL
Table 2 Total area and proportion of area treated by category in each treatment scenario
SC1 SC2 SC3
Proportion of Proportion of Proportion of Treatment category Area (ha) area treated Area (ha) area treated Area (ha) area treated
Treated 11081 100 11082 100 11081 100 Avail for treatmentdagger 22042 199 28998 262 45647 412 Owl habitat treated 00 000 2769 025 1127 010 Private land treated 00 000 00 000 5685 051 Hand thin 1499 014 3819 034 1612 015 Biomass thin 8404 076 7240 065 9470 085 Commercial thin 7765 070 6916 062 9470 085 Broadcast burn 9410 085 7247 065 3785 034 Pile burn 1671 015 3835 035 7296 066
dagger Total land area potentially available for treatment in each scenario The area available for treatment increased from Scenarshyios 1 to 3 as restrictions on the area available for treatment were relaxed
20 X C WCfrac12 ]j frac14
BPij X WCijBPjifrac141
where C[WC]j is the C emitted by wildfire from pixel j in mass per unit area BPj is the probability that pixel j is burned BPij is the probability of burning at the ith FL class and WCij is the C emitted from pixel j when burned at the ith FL class
Conditional expected emissions were averaged across all pixels to obtain an estimate of wildfire emissions per area burned
Large fire revisionmdashWildfire modeling was calishybrated to produce fire sizes that approximated area burned in spread events of historical large wildfires near the study area However during the course of the study a very large fire encounshytered our study area The King Fire began on 13 September 2014 in El Dorado County and burned 39545 hamdashmore than an order of magnishytude greater than our modeled wildfires includshying gt25 of the study area Given the potential for very large wildfires in this region demonshystrated by the King Fire we completed addishytional wildfire modeling to estimate the C effects of treatment given the occurrence of a very large fire
Randig modeling was repeated for the no-treatment and S3 scenarios using the high fuel model range and a revised burn period number of simulated ignitions wind speed and wind directions Burn period was increased from 5 to 12 h number of ignitions was reduced by half to 40000 Wind directions and relative probabilities (Appendix S1 Table S5) were those recorded at
Hell Hole RAWS between 0400 and 1900 hours on 17 September the day of the King Firersquos larshygest spread event We used the probable 1-min maximum wind speed as calculated from the maximum gust recorded on that day 33 kmh (205 mph) based on maximum gust of 547 kmh (34 mph) (Crosby and Chandler 1966) These settings produced average fire sizes of NT = 10757 ha (no-treatment scenario) and 8070 ha (S3) Average fire size was limited by the size of our buffered study area Longer burn periods resulted in an increasing number of simulated wildfires that burned to the study area boundary
RESULTS
Treatment simulation Table 2 provides a summary of the area treashy
ted in each scenario Scenario 1 (S1) was the most restrictive with respect to the land area available for treatment which more than doushybled between S1 and S3 Because treatment preshyscriptions varied with land designation (public owl PAC private) and the designations availshyable for treatment varied between scenarios the relative proportions of thinning and burning methods also varied between scenarios Comshymercial and biomass thinning were applied most frequently in S3 which permitted treatshyment of private land Spotted owl activity censhyters composed 25 of the area treated in S2 vs 10 in S3 and 0 in S1 the scenario in which PACs were not subject to treatment As a result the area treated with hand thinning in S2 was more than twice that in S1 and S3 Due to the
wwwesajournalsorg 9 January 2017 Volume 8(1) Article e01648
CHIONO ET AL
Fig 4 Low fuel model range treatment locations and difference in conditional burn probability (CBP) and conshyditional flame length (CFL) (untreated-treated) for each treatment scenario Negative values indicate an increase in CBP or CFL while positive values represent a reduction CBP is the likelihood that a pixel will burn given a single ignition on the landscape and assuming the simulation conditions described in Appendix S1 Table S1 and in the text Conditional flame length is the probability-weighted flame length given these same assumptions
inclusion of PACs in S2 and both PACs and prishyvate land in S3 the proportion of area treated with pile burning increased between S1 and S3 while broadcast burn area exhibited an opposite trend Despite the variation in land designations available for treatment the pattern of treatshyment placement was generally similar between scenarios with treatments concentrated in the central and eastern portions of the study area (Figs 4 5)
Landscape-scale burn probability and fire hazard Conditional burn probabilitymdashThe pixel-to-pixel
change in CBP between the untreated scenario and each treatment scenario is mapped in Figs 4 (LO FM) and 5 (HI FM) Treatment reduced landshyscape burn probability by approximately 50 (Table 3) from 00124 (NT) to 00062 (S1) 00059 (S2) and 00055 (S3) Within treatment units avershyage CBP fell by 69ndash76 to 00033ndash00035 outside of treated stands CBP fell to 00060ndash00069 Some
wwwesajournalsorg 10 January 2017 Volume 8(1) Article e01648
CHIONO ET AL
Fig 5 Treatment locations and high fuel model range difference in conditional burn probability and condishytional flame length (untreated-treated) for each treatment scenario
increases in CBP were also observed particularly for the low fuel model range (Fig 4)
The influence of treatment on owl PAC likelishyhood of burning was similar to that observed for stands in general For treated PACs average CBP fell by ~70 relative to no treatment for the same stands Although PACs were not eligible for treatment in S1 all treatment scenarios had a large impact on estimated PAC CBP Average PAC CBP was reduced from 0013 to 00063 in S1 00049 in S2 and 00054 in S3 a 49ndash64 decrease relative to PACs in the no-treatment landscape (Table 3)
Fire hazardmdashTreatments reduced average landshyscape CFL by ~1 m from 36 m (NT) to 25ndash27 m Pixel-level CFL was reduced by a maximum of 80 m (LO FM) and 90 m (HI FM) Increases in CFL were also observed however particularly near the study arearsquos western and southwestern boundaries where treatments were least concentrated (Figs 4 5) Maximum pixel-level CFL increases were 25 m (LO FM) and 31 m (HI FM) Because fire hazard was used in prioritizing
stands for treatment the estimated pre-treatment CFL in stands selected for treatment (43ndash51 m)
wwwesajournalsorg 11 January 2017 Volume 8(1) Article e01648
CHIONO ET AL
Table 3 Proportional change in burn probability for treatment scenarios compared to the NT scenario
LO FM HI FM AVG
Stand type
S1 S2 S3 Proportional change
relative to NT
S1 S2 S3 Proportional change
relative to NT
S1 S2 S3 Proportional change
relative to NT
All PACs -045 -064 -056 -053 -063 -059 -049 -064 -057 Treated PACs NA -081 -076 NA -057 -067 NA -069 -072 Untreated PACs -045 -053 -051 -053 -054 -058 -049 -053 -054 All stands Treated stands
-044 -076
-048 -079
-053 -063
-050 -072
-053 -074
-056 -074
-047 -074
-050 -076
-054 -069
Untreated stands -035 -039 -049 -045 -047 -051 -040 -043 -050
Notes NT no treatment PACs protected activity centers Proportions are ratios of treatment values to no-treatment values as calculated for the same stands Treatment and no-treatment values were calculated as the average pixel value for the low and high fuel model range (LO FM and HI FM) within each stand category and treatment scenario
was greater than in stands not selected (32ndash 33 m) After treatment average CFL within treashyted stands fell to 13 (S1 and S2) and 17 m (S3) CFL in untreated stands was also reduced as a result of the influence of treatments on fire spread and intensity CFL fell by 05ndash08 m (9ndash 16) relative to CFL in the same stands within the no-treatment landscape (Table 4)
Although spotted owl PACs were not treated in S1 relative to PACs in the NT landscape PAC CFL was reduced by 10 (to 32 m) in S1 Treating PACs had a much larger impact on potential fire intensity however Average treashyted PAC CFL fell to 13 and 14 m in S2 and S3 respectively
Carbon consequences of landscape fuel treatments
Prior to treatment aboveground landscape carbon totaled 14705 tonnesha on average Treatments removed 14 of pre-treatment C from treated stands or 2374 tonnesha totaling
81772ndash119103 tonnes of C in harvested biomass and merchantable material (Tables 5 and 6) Both the treatment scenarios and the choice of
fuel models were important influences on estishymated C emissions from burning As the least restrictive treatment scenario in terms of treatshyment location and the only scenario to include treatment of private land where broadcast burnshying was precluded as a treatment option the S3 treatment scenario was associated with the lowshyest wildfire and prescribed burning emissions (Tables 5 and 6) For each treatment scenario expected wildfire emissions increased by more than an order of magnitude between the low and high fuel model ranges This difference was the result of increasing fire intensity as well as wildshyfire size Average wildfire size nearly doubled between fuel model ranges in the treatment sceshynarios and tripled in the no-treatment scenario (Fig 6) For a given treatment scenario wildfire emissions on a per hectare basis were approxishymately two tonnes greater for the high fuel
Table 4 Proportional change in conditional flame length for treatment scenarios compared to the NT scenario
LO FM HI FM AVG
Stand type
S1 S2 S3 Proportional change
relative to NT
S1 S2 S3 Proportional change
relative to NT
S1 S2 S3 Proportional change
relative to NT
All PACs -009 -042 -028 -012 -043 -027 -010 -042 -028 Treated PACs NA -071 -075 NA -071 -073 NA -071 -074 Untreated PACs -009 -014 -011 -012 -017 -014 -010 -016 -013 All stands -022 -026 -031 -025 -026 -028 -024 -026 -030 Treated stands -065 -069 -052 -071 -071 -073 -068 -070 -062 Untreated stands -008 -009 -021 -011 -012 -012 -009 -010 -016
Notes NT no treatment PACs protected activity centers Proportions are ratios of treatment values to no-treatment values as calculated for the same stands Treatment and no-treatment values were calculated as the average pixel value for the low and high fuel model range (LO FM and HI FM) within each stand category and treatment scenario
wwwesajournalsorg 12 January 2017 Volume 8(1) Article e01648
CHIONO ET AL
Table 5 Expected biomass carbon expected wildfire C emissions and C harvested and emitted in fuel treatshyments for NT and treatment (S1 S2 S3) scenarios using the low fuel model range in fire modeling
Carbon pool NT S1 S2 S3
Untreated stands Tonnes C Live 5004505 3915044 3695489 3954131 Dead 1845659 1421704 1378824 1466202 Wildfire emissions 2372 1137 1039 904
Treated stands Live 881358 1072625 826366 Dead 260089 299244 220932 All harvested biomass 88773 81772 119103 Prescribed fire emissions 178530 169693 122599 Wildfire emissions 48 56 61
All stands Live 5004505 4796402 4768113 4780497 Dead 1845659 1681793 1678068 1687135 Treatment (harvested and emitted) 267303 251465 241702 Wildfire emissions 2372 1186 1095 965
Grand totals 6852536 6746684 6698741 6710299
Notes LF indicates the large fire scenarios Expected C is that remaining in the core study area following treatment if applishycable and a random ignition and wildfire in the larger buffered study area as estimated from the simulation of many wildfires Live C is that contained in live aboveground herb shrub and tree biomass dead C is the C contained in litter duff woody surshyface fuel and aboveground portions of tree snags NT no treatment
model range than for the low range In contrast to the large influence of fuel model choice on wildfire emissions the effect of fuel model range on prescribed fire emissions was minimal with only a 1 increase in emissions between the low and high fuel model ranges for a given treatment scenario
Although treatment significantly reduced wildshyfire emissions combined emissions from preshyscribed burning on 20 of the landscape and wildfire exceeded wildfire emissions in the no-treatment scenarios (Tables 5 and 6) Relative to the no-treatment scenarios treatment reduced estimated wildfire emissions by approximately 54 (low fuel model range) 59 (high fuel model range) and 45 (large fire scenarios) Yet preshyscribed burning was a far more significant source of emissions than were wildfires of moderate size with emissions from treatment exceeding wildfire emissions by 111259ndash177344 tonnes Even for the large wildfire simulations where landscape treatments nearly halved estimated wildfire emisshysions the combined carbon emissions from preshyscribed burning and wildfire in the treatment scenario surpassed wildfire emissions in the no-treatment scenario by 45 (Table 6 Fig 7)
The total quantity of aboveground C expected to remain on the landscape following treatment
and a randomly ignited wildfire was greatest for the no-treatment scenarios (Tables 5 and 6) For modeled wildfires of moderate size treatment reduced both the live and dead C pools relative to the no-treatment scenarios and terrestrial C in the no-treatment scenarios was 4ndash5 greater (323316 ndash434960 tonnes) than in any of the treatment scenarios (Tables 5 and 6) In comparison under large wildfire conditions the treatment scenario retained slightly more live biomass C~15000 tonshynes or 03 more than the no-treatment scenario However treatment also reduced necromass C by 288000 tonnes (12) resulting in a 3 overall decrease in onsite biomass C relative to an untreshyated landscape (Table 6) The proportional changes in aboveground
biomass C pools between the treatment and no-treatment scenarios are summarized in Table 7 For all treatment scenarios the consumption of duff litter and downed woody fuels with preshyscribed burning contributed to a net reduction in these C pools relative to the untreated landscape Conversely treatments protected more C in the live understory (herb and shrub) poolmdashthe result of reduced wildfire size and intensity in the treatshyment scenarios Treatments in the moderate wildshyfire scenarios reduced live tree biomass C in comparison with no-treatment levels (Fig 8)
wwwesajournalsorg 13 January 2017 Volume 8(1) Article e01648
CHIONO ET AL
Table 6 Expected biomass carbon expected wildfire C emissions and C harvested and emitted in fuel treatshyments for NT and treatment (S1 S2 S3) scenarios using the high fuel model range in fire modeling
Carbon pool NT S1 S2 S3 NT-LF S3-LF
Untreated stands Tonnes C Live 4910239 3879854 3664690 3923358 4586898 3750774 Dead 1912429 1448947 1403313 1489629 2130034 1605591 Wildfire emissions 31831 12934 12001 11293 137622 68061
Treated stands Live 896670 1115918 853503 847374 Dead 280182 325628 238130 247744 All harvested biomass 88773 81772 119103 119103 Prescribed fire emissions 180357 171247 123539 123539 Wildfire emissions 798 951 986 8285
All stands Live 4910239 4776524 4780607 4776861 4586898 4598148 Dead 1912429 1729129 1728941 1727759 2130034 1853334 Treatment (harvested and emitted) 282862 265971 254921 254921 Wildfire emissions 31831 13732 12952 12279 137622 76346
Grand totals 6854499 6802247 6788471 6771820 6854554 6782749
Notes LF indicates the large fire scenarios Expected terrestrial C is that remaining in the core study area following treatshyment if applicable and a random ignition and wildfire in the larger buffered study area as estimated from the simulation of many wildfires Live C is that contained in live aboveground herb shrub and tree biomass dead C is the C contained in litter duff woody surface fuel and aboveground portions of tree snags NT no treatment
Notably in the large modeled wildfire scenarios (NT-LF and S3-LF) treatments resulted in a 400000-tonne increase in landscape-level live tree C over the no-treatment scenario
DISCUSSION
Fuel treatments in protected habitat Because there are often competing objectives
between managing forests for resilience to fire and drought and protecting owl habitat we assessed potential fire occurrence and hazard based on treatment scenarios that included and omitted treatment of PACs Conducting fuels management outside of occupied owl habitat has been suggested as a means of reducing fire risk within occupied sites (Jenness et al 2004 Tempel et al 2015) Ager et al (2007) reported that fuel treatments on 20 of a western Oregon landscape reduced the probability of northern spotted owl nesting and roosting habitat loss by 44 even though that habitat type was not treated As in Ager et al (2007) we observed modifications in fire intensity and burn probability within owl habitat even when it was left untreated In the S1 treatment scenario in which owl activity centers were not eligible for treatment the effect of treatshying other stands reduced both fire hazard (by
9ndash12 for CFL or approximately 04 m) and CBP (by ~45) within PACs It is difficult to assess the significance of this proportional reduction in CBP given that the absolute differences in probabilities were relatively modest (Figs 3 4) Ager et al (2007) noted that allowing treatment of owl habishytat would have significantly reduced estimated habitat loss in their study In this study it is expected that habitat quality may be reduced within treated PACs in the short term through the removal of small-diameter trees (ie lower vertical structural heterogeneity) However two structural attributes for suitable spotted owl nestshying habitat identified by Tempel et al (2015) high canopy cover and large tree density would not be altered While we did not directly estimate habitat loss we did observe much larger reductions in fire hazard within PACs that were treated as meashysured by CFL (71ndash75 reduction equivalent to 2ndash3 m) It should be noted that the effect of wideshyspread treatments within PACs on spotted owl nesting and foraging behavior is unknown One concern with designating some land area
unavailable for treatment is that it may limit the potential for treatments to alter fire behavior across the landscape (eg Finney 2001) Including all stands in the potential treatment pool allows the highest-priority stands with respect to simulated
wwwesajournalsorg 14 January 2017 Volume 8(1) Article e01648
CHIONO ET AL
effects on landscape-level fire behavior The true effect of increasing the land area available for treatshyment may be partially obscured by the varying frequency of treatment prescriptions between sceshynarios For example the hand thinning treatments applied within PACs would be expected to have a milder effect on potential wildfire behavior than more severe prescriptions and hand thinning was twice as common in S2 as in the other scenarios
Terrestrial carbon and burning emissions Landscape treatments reduced wildfire emisshy
sions by reducing the emissions produced per area burned by wildfire as well as average wildfire size On average wildfires in the treated landscapes released 193ndash216 tonnes Cha while wildfires in the untreated landscapes released 234ndash254 tonnes Cha Modeled wildfires decreased in size by 7 (low fuel model range) 36 (high fuel model range) and 25 (large fire scenario) relative to untreated landscapes (Fig 6) Since the burn pershyiod for simulated wildfires was held constant between scenarios this reduction in average wildshyfire size is the result of reduced spread rates derived from fuel treatments Despite the influence of treatments on wildfire
intensity size and expected emissions treatment-related emissions exceeded the avoided wildfire emissions conferred by treatment Prescribed burning in our study a combination of broadcast
Fig 6 Wildfire size relative frequency distributions from wildfire simulations Bar color represents no-treatment (NT) and treatment scenarios (S1ndashS3)
fire spread to be treated which would be expected to achieve the greatest modification of landscape fire behavior and effects In the present study although the land area potentially available for treatment more than doubled between S1 and S3 landscape-level effects of treatment on modeled fire risk and hazard were fairly similar (compared with the no-treatment landscape all-stand CBP fell by 47 and 54 in S1 and S3 while CFL fell by 24 and 30) Dow et al (2016) also found that incorporating modest restrictions on treatment Fig 7 Carbon emissions (tonnes) from wildfire and
area availability (24 of the landscape unavail- prescribed burning X-axis labels indicate no-treatment able) had minimal consequences for modeled fire (NT) and treatment scenarios (S1ndashS3) subscripts size and hazard The modest changes in estimated denote fuel model ranges used in fire modeling
fire metrics we observed may also be due to simi- (L low H high) Large fire scenarios which were
larity in the general pattern of treatment placement modeled with the high fuel model range only are indishybetween scenarios which probably led to similar cated by LF
wwwesajournalsorg 15 January 2017 Volume 8(1) Article e01648
CHIONO ET AL
Table 7 Proportional change in expected carbon by biomass pool for treatment scenarios compared to the no-treatment landscape
Treatment Standing Down dead Forest Herb Live scenario dead wood floor shrub tree
S1 004 -017 -013 014 -004 S2 001 -016 -012 014 -004 S3 -001 -015 -010 016 -004 S3-LF -016 -013 -008 017 000
Notes For example a value of -010 represents a 10 decshyline in biomass C from the no-treatment scenario Treatment and no-treatment values were calculated as the average of low and high fuel model range values except in the case of the large fire (LF) scenarios which were modeled for the high fuel model range only Expected C is that remaining after a random ignition and wildfire in the buffered study area as estimated from simulating 80000 ignitions (LF 40000 ignitions)
C pool categories are those reported in Forest Vegetation Simulator Carbon Reports Standing dead aboveground porshytion of standing dead trees Down dead wood woody surface fuels Forest floor litter and duff Herbshrub herbs and shrubs Live tree aboveground portion of live trees
and pile burning released 111ndash163 tonnes Cha For comparison studies conducted in comparable forest types have estimated prescribed fire emisshysions of 127 tonnes Cha (warm dry ponderosa pine habitat types Reinhardt and Holsinger 2010)
Fig 8 Expected carbon contained in aboveground live and dead tree biomass Expected C is that remainshying in the core study area following treatment (if applishycable) and a single random ignition within the larger buffered study area X-axis labels indicate no-treatment (NT) and treatment scenarios (S1ndashS3) subshyscripts denote fuel model ranges used in fire modeling (L low H high) Large fire scenarios which were modeled for the high fuel model range only are indishycated by LF
and 148 tonnes Cha (an old-growth mixed-conifer reserve in the southern Sierra Nevada North et al 2009a) Relative to the approximately 158000 tonnes C emitted in prescribed burning avoided wildfire emissions at 1186ndash19551 tonnes for wildfires of moderate size were small A simishylar study in southern Oregon with average modshyeled wildfires of 2350 and 3500 ha (treatment and no-treatment scenarios respectively) found that treatments reduced expected wildfire emissions by 6157 tonnes of C (Ager et al 2010) Surface fuels represented with surface fuel
models in commonly used modeling software are the most influential inputs determining preshydicted fire behavior (Hall and Burke 2006) Fire behavior fire sizes and emissions in this study varied according to fuel model assignment highshylighting the importance of selecting the approprishyate fuel model to represent fuel conditions (see Collins et al 2013) We show a 12- to 14-fold change in wildfire emissions due solely to the choice of fuel models (Tables 5 and 6) Indeed the range of fuel models used in recent studies investigating fuel treatments and simulated fire behavior in mixed-conifer forests is noteworthy Incorporating a range of fuel models into analyshyses such that outcome variability can be reported facilitates comparison of effects across studies Our estimates of the aboveground C benefits
of treatment under the moderate wildfire scenarshyios with average fire sizes of le2133 ha are likely conservative The effect of modeled wildfire size on the C consequences of fuel treatment was conshysiderable emphasizing the importance of this variable in studies of the climate benefits of treatshyment Avoided wildfire emissions resulting from treatment increased to 61276 tonnes C when large wildfires (8070ndash10757 ha) were simulated The treatment scenario given large wildfires also protected a greater portion of live tree C If the ~40000-ha King Fire is representative of the magnitude of future wildfires in the region C accounting should improve with respect to treatshyment favorability Similarly if multiple wildfires were to encounter the study area within the effective lifespan of treatments the C gains assoshyciated with avoided emissions in the treatment scenarios would increase Our approach to estimating the C conseshy
quences of fuel treatments has a number of limitashytions A full accounting of treatment effects
wwwesajournalsorg 16 January 2017 Volume 8(1) Article e01648
CHIONO ET AL
would project through time the consequences of both treatment and wildfire Our analysis is static incorporating only the short-term C costs and benefits of treatment Simulating wildfire in the year immediately following treatment maximizes the apparent benefits of treatment Over time as surface fuels accumulate and vegetation regenershyates maintenance would be required to retain the effectiveness of treatments (Martinson and Omi 2013) increasing the C costs of reduced fire hazard In addition the C contained in fire-killed biomass will ultimately be emitted to the atmoshysphere although biomass decay could be delayed through conversion to long-lived wood products such as building materials (Malmsheimer et al 2011) It is also important to note that our analysis did not include stochastic wildfire occurrence Estimates of burn probability in the present study are not estimates of the likelihood of wildfire occurrence based on historical fire sizes and freshyquency (eg Preisler et al 2004 Mercer and Prestemon 2005 Brillinger et al 2006) but rather are conditional on a single randomly ignited wildfire within the buffered study area
CONCLUSIONS
Our findings generally support those of Campshybell et al (2011) who concluded from an analysis of fire-prone western forests that the C costs of treatments are likely to outweigh their benefits under current depressed fire frequencies In a more recent paper Campbell and Ager (2013) conshycluded that ldquonone of the fuel treatment simulation scenarios resulted in increased system carbonrdquo primarily from the low incidences of treated areas being burned by wildfire However our interpreshytation of these findings differs from those disshycussed in Campbell et al (2011) and Campbell and Ager (2013) especially in light of recent and projected future trends in fire activity (Westerling et al 2011 Miller and Safford 2012 Dennison et al 2014) The current divergence of increasing surface air temperatures and low fire activity is unlikely to be sustained further suggesting greater future fire activity (Marlon et al 2012) If increased fire activity is realized then the likelishyhood of a given area being burned in a wildfire increases This differs from the simple increase in stand-level fire frequency modeled by Campbell et al (2011) because increases in fire likelihood are
not necessarily associated with corresponding decreases in fire severity as assumed by Campbell et al (2011) Increased fire likelihood could very well lead to positive feedbacks in fire severity and ultimately to vegetation type conversion (Copposhyletta et al 2016)mdasheffects that would have signifishycant implications for carbon storage Due to the significant emissions associated
with treatment and the low likelihood that wildshyfire will encounter a given treatment area forest management that is narrowly focused on C accounting alone would favor the no-treatment scenarios Landscape treatments protected more C in live tree biomass only when large wildfires were simulated While treatment favorability improved with large wildfire simulation the no-treatment scenario still produced fewer emissions than the treatment scenario Given the potential for large wildfire in the region as demonstrated by the 2014 King Fire and the increasing freshyquency of large wildfires and area burned in Calishyfornia expected from climate modeling studies (Lenihan et al 2008 Westerling et al 2011) we suggest that future studies of fuel treatmentndashwildshyfirendashC relationships should incorporate the potenshytial for large wildfires at a frequency greater than those observed over the last 20ndash30 yr Others have argued that treatments to increase forest resilience should be a stand-alone top land management priority independent of other ecosystem values such as carbon sequestration and fire hazard reduction (Stephens et al 2016a) We also note that the potential benefits of fuels
management are not restricted to avoided wildshyfire emissions Here we show that landscape fuel treatments can alter fire hazard across the landshyscape both within and outside of treated stands and have the potential to affect the likelihood of burning and fire intensity within protected Calishyfornia spotted owl habitat Underscoring the risk to sensitive habitat the 2014 King Fire encounshytered 31 PACs within our study area leading to the greatest single-year decline in habitat occushypancy recorded over a 23-yr study period (Jones et al 2016) Modest simulated treatments within activity centers significantly reduced potential fire intensity relative to both the no-treatment landscape and a treatment scenario that did not permit treatment within PACs indicating that active management may be desirable to protect habitat in the long term (Roloff et al 2012)
wwwesajournalsorg 17 January 2017 Volume 8(1) Article e01648
CHIONO ET AL
However treatments conducted outside of owl habitat also reduced wildfire hazard
ACKNOWLEDGMENTS
We are grateful to a number of individuals for sharshying their time and fuel treatment and fire modeling expertise Nicole Vaillant (ArcFuels) Alan Ager and Andrew McMahan (carbon estimation) and Coeli Hoover (harvest simulations in FVS-FFE) Brian Ebert and Dana Walsh of the Eldorado National Forest proshyvided invaluable advice on weather inputs for fire modeling and on designing fuel treatment prescripshytions Ken Somers Operations Forester on the Blodgett Forest Research Station gave advice concerning timshyber management on private land We also thank two anonymous reviewers whose comments greatly improved this article The California Energy Commisshysion provided funding for this project
LITERATURE CITED
Ager A A B Bahro and K Barber 2006 Automating the fireshed assessment process with ArcGIS Pages 163ndash167 in P L Andrews and B W Butler (Comps) Fuels ManagementndashHow to Measure Success Conference Proceedings Portland OR March 28ndash30 2006 Proceedings RMRS-P-41 USDA Forest Service Rocky Mountain Research Station Fort Collins Colorado USA
Ager A A M A Finney B K Kerns and H Maffei 2007 Modeling wildfire risk to northern spotted owl (Strix occidentalis caurina) habitat in Central Oregon USA Forest Ecology and Management 24645ndash56
Ager A A M A Finney A McMahan and J Cathcart 2010 Measuring the effect of fuel treatments on forshyest carbon using landscape risk analysis Natural Hazards and Earth System Science 102515ndash2526
Ager A A N M Vaillant D E Owens S Brittain and J Hamann 2012 Overview and example application of the Landscape Treatment Designer Pages 11 General Technical Report PNW-GTR-859 USDA Forest Service Pacific Northwest Research Station Portland Oregon USA
Barbour M G and R A Minnich 2000 Californian upland forests and woodlands Pages 131ndash164 in M Barbour and W Billings editors North Amerishycan terrestrial vegetation Cambridge University Press Cambridge UK
Bias M A and R Gutimerrez 1992 Habitat associations of California spotted owls in the central Sierra Nevada Journal of Wildlife Management 56584ndash595
Bond M L R Gutierrez A B Franklin W S LaHaye C A May and M E Seamans 2002
Short-term effects of wildfires on spotted owl surshyvival site fidelity mate fidelity and reproductive success Wildlife Society Bulletin 301022ndash1028
Brillinger D H Preisler and J Benoit 2006 Probashybilistic risk assessment for wildfires Environ-metrics 17623ndash633
Campbell J L and A A Ager 2013 Forest wildfire fuel reduction treatments and landscape carbon stocks a sensitivity analysis Journal of Environshymental Management 121124ndash132
Campbell J L M E Harmon and S R Mitchell 2011 Can fuel-reduction treatments really increase forest carbon storage in the western US by reducshying future fire emissions Frontiers in Ecology and the Environment 1083ndash90
Cathcart J A A Ager A McMahan M Finney and B Watt 2010 Carbon benefits from fuel treatshyments Pages 61ndash80 in T B Jain R T Graham and J Sandquist editors Integrated management of carbon sequestration and biomass utilization opportunities in a changing climate Proceedings of the 2009 National Silviculture Workshop Boise Idaho June 15ndash18 2009 USDA Forest Service Proshyceedings RMRS-P-61 Rocky Mountain Research Station Fort Collins Colorado USA
Chatfield A H 2005 Habitat selection by a California spotted owl population a landscape scale analysis using resource selection functions Thesis Univershysity of Minnesota St Paul Minnesota USA
Collins B M H A Kramer K Menning C Dilling-ham D Saah P A Stine and S L Stephens 2013 Modeling hazardous fire potential within a comshypleted fuel treatment network in the northern Sierra Nevada Forest Ecology and Management 310156ndash166
Collins B M S L Stephens J J Moghaddas and J Battles 2010 Challenges and approaches in planshyning fuel treatments across fire-excluded forested landscapes Journal of Forestry 10824ndash31
Collins B M S L Stephens G B Roller and J J Battles 2011 Simulating fire and forest dynamics for a landscape fuel treatment project in the Sierra Nevada Forest Science 5777ndash88
Coppoletta M K E Merriam and B M Collins 2016 Post-fire vegetation and fuel development influences fire severity patterns in reburns Ecologishycal Applications 26686ndash699
Crookston N L and A O Finley 2008 yaimpute an r package for knn imputation Journal of Statistical Software 231ndash16
Crookston N L M Moeur and D L Renner 2002 Userrsquos guide to the most similar neighbor imputashytion program version 2 General Technical Report RMRS-GTR-96 USDA Forest Service Rocky Mountain Research Station Ogden Utah USA
wwwesajournalsorg 18 January 2017 Volume 8(1) Article e01648
CHIONO ET AL
Crosby J and C Chandler 1966 Get the most from your windspeed observations Fire Control Notes 2712ndash13
Dailey S J Fites A Reiner and S Mori 2008 Fire behavior and effects in fuel treatments and proshytected habitat on the Moonlight fire Fire Behavior Assessment Team wwwfsfedusadaptivemana gementprojectsFBATdocsMoonlightFinal_8_6_08 pdf
Dennison P E S C Brewer J D Arnold and M A Moritz 2014 Large wildfire trends in the western United States 1984ndash2011 Geophysical Research Letters 412928ndash2933
Dixon G E 2002 Essential FVS a userrsquos guide to the forest vegetation simulator Pages 193 USDA Forest Service Forest Management Service Center Fort Collins Colorado USA
Dore S T E Kolb M Montes-Helu B W Sullivan W D Winslow S C Hart J P Kaye G W Koch and B A Hungate 2008 Long-term impact of a stand-replacing fire on ecosystem CO2 exchange of a ponderosa pine forest Global Change Biology 141ndash20
Dore S M Montes-Helu S C Hart B A Hungate G W Koch J B Moon A J Finkral and T E Kolb 2012 Recovery of ponderosa pine ecosystem carbon and water fluxes from thinning and stand-replacing fire Global Change Biology 183171ndash3185
Dow C J B M Collins and S L Stephens 2016 Incorporating resource protection constraints in an analysis of landscape fuel-treatment effectiveness in the Northern Sierra Nevada California USA Environmental Management 571ndash15
Eidenshink J B Schwind K Brewer Z Zhu B Quayle and S Howard 2007 A project for monshyitoring trends in burn severity Fire Ecology 33ndash21
Evans A M and A J Finkral 2009 From renewable energy to fire risk reduction a synthesis of biomass harvesting and utilization case studies in US forshyests GCB Bioenergy 1211ndash219
Finkral A J and A M Evans 2008 The effects of a thinning treatment on carbon stocks in a northern Arizona ponderosa pine forest Forest Ecology and Management 2552743ndash2750
Finney M A 2001 Design of regular landscape fuel treatment patterns for modifying fire growth and behavior Forest Science 47219ndash228
Finney M A 2002 Fire growth using minimum travel time methods Canadian Journal of Forest Research 321420ndash1424
Finney M A 2006 An overview of FlamMap fire modeling capabilities Pages 213ndash220 in P L Andrews and B W Butler editors Proceedings of Fuels ManagementndashHow to Measure Success Research Paper RMRS-P-41 USDA Forest Service
Rocky Mountain Research Station Portland Oregon USA
Finney M A R C Seli C W McHugh A A Ager B Bahro and J K Agee 2007 Simulation of longshyterm landscape-level fuel treatment effects on large wildfires International Journal of Wildland Fire 16712ndash727
Fulme P Z J E Crouse J P Roccaforte and E L Kalies 2012 Do thinning andor burning treatments in western USA ponderosa or Jeffrey pine-dominated forests help restore natural fire behavior Forest Ecology and Management 26968ndash81
Gaines W L R J Harrod J Dickinson A L Lyons and K Halupka 2010 Integration of Northern spotted owl habitat and fuels treatments in the eastern Cascades Washington USA Forest Ecolshyogy and Management 2602045ndash2052
Gaines W L R A Strand and S D Piper 1997 Effects of the hatchery complex fires on northern spotted owls in the eastern Washington Cascades Pages 123ndash129 in J N Greenlee editor Proceedings of the Fire Effects on Rare and Endangered Species and Habitats Conference Coeur DrsquoAlene Idaho International Association of Wildfire and Forestry Hot Springs South Dakota USA
Hall S A and I C Burke 2006 Considerations for characterizing fuels as inputs for fire behavior models Forest Ecology and Management 227 102ndash114
Hoover C and S Rebain 2008 The Kane Experimenshytal Forest carbon inventory carbon reporting with FVS Pages 13ndash15 in R N Havis and N L Crookston editors Third Forest Vegetation Simushylator Conference Fort Collins Colorado February 13ndash15 2007 USDA Forest Service Rocky Mountain Research Station Fort Collins Colorado USA
Hurteau M and M North 2009 Fuel treatment effects on tree-based forest carbon storage and emissions under modeled wildfire scenarios Fronshytiers in Ecology and the Environment 7409ndash414
Hurteau M D and M North 2010 Carbon recovery rates following different wildfire risk mitigation treatments Forest Ecology and Management 260 930ndash937
Hurteau M D M T Stoddard and P Z Fulme 2011 The carbon costs of mitigating high-severity wildshyfire in southwestern ponderosa pine Global Change Biology 171516ndash1521
Jenness J S P Beier and J L Ganey 2004 Associashytions between forest fire and Mexican spotted owls Forest Science 50765ndash772
Jones G M R Gutimerrez D J Tempel S A Whitmore W J Berigan and M Z Peery 2016 Megafires an emerging threat to old-forest species Frontiers in Ecology and the Environment 14300ndash306
wwwesajournalsorg 19 January 2017 Volume 8(1) Article e01648
CHIONO ET AL
Laymon S A 1988 Ecology of the spotted owl in the central Sierra Nevada California Dissertation University of California Berkeley California USA
Lenihan J M D Bachelet R P Neilson and R Drapek 2008 Response of vegetation distribution ecosystem productivity and fire to climate change scenarios for California Climatic Change 87215ndash230
Lydersen J M B M Collins E E Knapp G B Roller and S Stephens 2015 Relating fuel loads to overshystorey structure and composition in a fire-excluded Sierra Nevada mixed conifer forest International Journal of Wildland Fire 24484ndash494
Malmsheimer R J Bowyer J Fried E Gee R Islar R Miner I E Munn E Oneil and W C Stewart 2011 Managing forests because carbon matters integrating energy products and land manageshyment policy Journal of Forestry 109S7ndashS50
Marlon J R et al 2012 Long-term perspective on wildfires in the western USA Proceedings of the National Academy of Sciences of the United States of America 109E535ndashE543
Martinson E J and P N Omi 2002 Performance of fuel treatments subjected to wildfires Pages 7ndash13 in P N Omi and L A Joyce editors Conference on Fire Fuel Treatments and Ecological Restorashytion USDA Forest Service Rocky Mountain Research Station Fort Collins Colorado USA
Martinson E J and P N Omi 2013 Fuel treatments and fire severity a meta-analysis Pages 38 USDA Forest Service Rocky Mountain Research Station Fort Collins Colorado USA
Mayer K E and W F Laudenslayer 1988 A guide to wildlife habitats of California California Departshyment of Forestry and Fire Protection Sacramento California USA
McKenzie D Z Gedalof D L Peterson and P Mote 2004 Climatic change wildfire and conservation Conservation Biology 18890ndash902
Mercer D E and J P Prestemon 2005 Comparing production function models for wildfire risk analyshysis in the wildlandndashurban interface Forest Policy and Economics 7782ndash795
Miller J D and H Safford 2012 Trends in wildfire severity 1984 to 2010 in the Sierra Nevada Modoc Plateau and southern Cascades California USA Fire Ecology 841ndash57
Miller J H Safford M Crimmins and A Thode 2009 Quantitative evidence for increasing forest fire severity in the Sierra Nevada and southern Cascade mountains California and Nevada USA Ecosystems 1216ndash32
North M 2012 Managing Sierra Nevada forests PSWshyGTR-237 USDA Forest Service Pacific Southwest Research Station Albany California USA
North M P and M D Hurteau 2011 High-severity wildfire effects on carbon stocks and emissions in fuels treated and untreated forest Forest Ecology and Management 2611115ndash1120
North M M Hurteau and J Innes 2009a Fire supshypression and fuels treatment effects on mixed-conifer carbon stocks and emissions Ecological Applications 191385ndash1396
North M P A Stine K OrsquoHara W Zielinski and S Stephens 2009b An ecosystem management strategy for Sierran mixed-conifer forests General Technical Report PSW-GTR-220 USDA Forest Service Pacific Southwest Research Station Albany California USA
Parisien M-A S Snetsinger J A Greenberg C R Nelson T Schoennagel S Z Dobrowski and M A Moritz 2012 Spatial variability in wildfire probability across the western United States Intershynational Journal of Wildland Fire 21313ndash327
Penman J M Gytarsky T Hiraishi T Krug D Kruger R Pipatti L Buendia K Miwa T Ngara and K Tanabe 2003 Good practice guidance for land use land-use change and forestry Institute for Global Environmental Strategies for the Intergovshyernmental Panel on Climate Change Hayama Kanagawa Japan
Pollet J and P N Omi 2002 Effect of thinning and prescribed burning on crown fire severity in ponderosa pine forests International Journal of Wildland Fire 111ndash10
Prather J W R F Noss and T D Sisk 2008 Real versus perceived conflicts between restoration of ponderosa pine forests and conservation of the Mexican spotted owl Forest Policy and Economics 10140ndash150
Preisler H K D R Brillinger R E Burgan and J Benoit 2004 Probability based models for estimation of wildfire risk International Journal of Wildland Fire 13133ndash142
Rebain S E Reinhardt N Crookston S Beukema W Kurz and J Greenough 2009 The fire and fuels extension to the Forest Vegetation Simulator Addendum to RMRS-GTR-119 USDA Forest Service and ESSA Technologies Ltd Fort Collins Colorado USA
Reinhardt E D and N L Crookston 2003 The fire and fuels extension to the forest vegetation simulashytor Pages 209 RMRS-GTR-116 USDA Forest Sershyvice Rocky Mountain Research Station Ogden Utah USA
Reinhardt E and L Holsinger 2010 Effects of fuel treatments on carbon-disturbance relationshyships in forests of the northern Rocky Mountains Forest Ecology and Management 2591427ndash1435
wwwesajournalsorg 20 January 2017 Volume 8(1) Article e01648
CHIONO ET AL
Reinhardt E D R E Keane D E Calkin and J D Cohen 2008 Objectives and considerations for wildland fuel treatment in forested ecosystems of the interior western United States Forest Ecology and Management 2561997ndash2006
Ritchie M W C N Skinner and T A Hamilton 2007 Probability of tree survival after wildfire in an interior pine forest of northern California effects of thinning and prescribed fire Forest Ecolshyogy and Management 247200ndash208
Roloff G J S P Mealey and J D Bailey 2012 Comshyparative hazard assessment for protected species in a fire-prone landscape Forest Ecology and Manshyagement 2771ndash10
Rothermel R C 1972 A mathematical model for preshydicting fire spread in wildland fuels Research Paper INT-115 USDA Forest Service Intermounshytain Forest and Range Experiment Station Ogden Utah USA
Safford H D 2008 Fire severity in fuel treatments American River Complex fire Tahoe National Forest California Unpublished Report USDA Forest Service Pacific Southwest Region Vallejo California USA
Schmidt D A A H Taylor and C N Skinner 2008 The influence of fuels treatment and landscape arrangement on simulated fire behavior Southern Cascade range California Forest Ecology and Management 2553170ndash3184
Scott J H and R E Burgan 2005 Standard fire behavior fuel models a comprehensive set for use with Rothermelrsquos surface fire spread model General Technical Report RMRS-GTR-153 USDA Forest Service Rocky Mountain Research Station Fort Collins Colorado USA
Scott J H M P Thompson and J W Gilbertson-Day 2016 Examining alternative fuel management strategies and the relative contribution of National Forest System land to wildfire risk to adjacent homesndasha pilot assessment on the Sierra National Forest California USA Forest Ecology and Manshyagement 36229ndash37
Smith J E and L S Heath 2002 A model of forest floor carbon mass for United States forest types Research Paper NE-722 USDA Forest Service Northeastern Research Station Newtown Square Pennsylvania USA
Stephens S L 2005 Forest fire causes and extent on United States Forest Service lands International Journal of Wildland Fire 14213ndash222
Stephens S L B M Collins E Biber and P Z Fulme 2016a US federal fire and forest policy emphasizshying resilience in dry forests Ecosphere 7e01584
Stephens S L J D Miller B M Collins M P North J J Keane and S L Roberts 2016b Wildfire impacts on California Spotted Owl nesting habitat in the Sierra Nevada Ecosphere 7e01584
Stephens S L J J Moghaddas B R Hartsough E E Y Moghaddas and N E Clinton 2009 Fuel treatshyment effects on stand-level carbon pools treatshyment-related emissions and fire risk in a Sierra Nevada mixed-conifer forest Canadian Journal of Forest Research 391538ndash1547
Stephens S L et al 2012 Fuel treatment impacts on estimated wildfire carbon loss from forests in Monshytana Oregon California and Arizona Ecosphere 31ndash17
Tempel D et al 2015 Evaluating short- and longshyterm impacts of fuels treatments and simulated wildfire on an old-forest species Ecosphere 61ndash19
USDA Forest Service 2004 Sierra Nevada Forest Plan Amendment Final supplemental environmental impact statement Record of decision Publication R5-MB-046 USDA Forest Service Pacific Southshywest Region Vallejo California USA
Van Wagner C E 1977 Conditions for the start and spread of crown fire Canadian Journal of Forest Research 723ndash34
Verner J K S McKelvey B R Noon R Gutimerrez G I Gould Jr and T W Beck 1992 Assessment of the current status of the California spotted owl with recommendations for management Pages 3ndash27 in J Verner K S McKelvey B R Noon R Gutimerrez G I Gould Jr and T W Beck edishytors The California Spotted Owl a technical assessment of its current status PSW-GTR-133 USDA Forest Service Albany California USA
Westerling A B Bryant H Preisler T Holmes H Hidalgo T Das and S Shrestha 2011 Climate change and growth scenarios for California wildshyfire Climatic Change 109445ndash463
Westerling A L H G Hidalgo D R Cayan and T W Swetnam 2006 Warming and earlier Spring increase Western US Forest Wildfire Activity Science 313940ndash943
Wiedinmyer C and M D Hurteau 2010 Prescribed fire as a means of reducing forest carbon emissions in the Western United States Environmental Science amp Technology 441926ndash1932
SUPPORTING INFORMATION
Additional Supporting Information may be found online at httponlinelibrarywileycomdoi101002ecs2 1648full
wwwesajournalsorg 21 January 2017 Volume 8(1) Article e01648
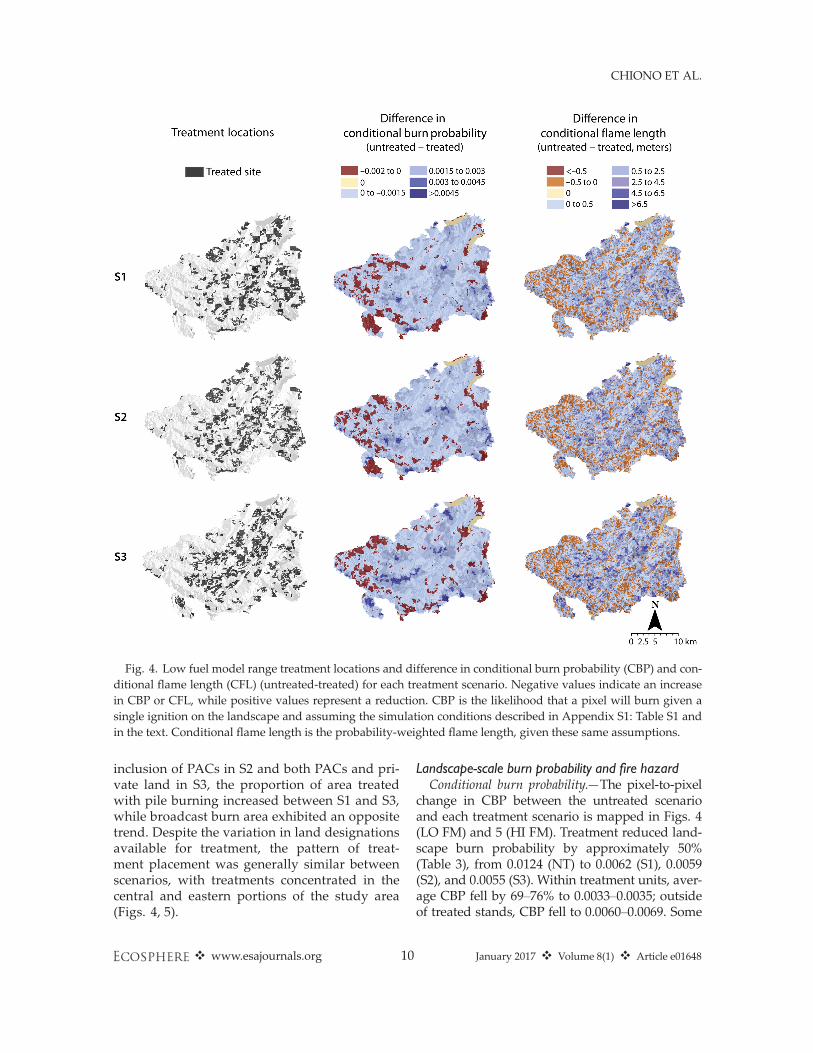
CHIONO ET AL
Fig 4 Low fuel model range treatment locations and difference in conditional burn probability (CBP) and conshyditional flame length (CFL) (untreated-treated) for each treatment scenario Negative values indicate an increase in CBP or CFL while positive values represent a reduction CBP is the likelihood that a pixel will burn given a single ignition on the landscape and assuming the simulation conditions described in Appendix S1 Table S1 and in the text Conditional flame length is the probability-weighted flame length given these same assumptions
inclusion of PACs in S2 and both PACs and prishyvate land in S3 the proportion of area treated with pile burning increased between S1 and S3 while broadcast burn area exhibited an opposite trend Despite the variation in land designations available for treatment the pattern of treatshyment placement was generally similar between scenarios with treatments concentrated in the central and eastern portions of the study area (Figs 4 5)
Landscape-scale burn probability and fire hazard Conditional burn probabilitymdashThe pixel-to-pixel
change in CBP between the untreated scenario and each treatment scenario is mapped in Figs 4 (LO FM) and 5 (HI FM) Treatment reduced landshyscape burn probability by approximately 50 (Table 3) from 00124 (NT) to 00062 (S1) 00059 (S2) and 00055 (S3) Within treatment units avershyage CBP fell by 69ndash76 to 00033ndash00035 outside of treated stands CBP fell to 00060ndash00069 Some
wwwesajournalsorg 10 January 2017 Volume 8(1) Article e01648
CHIONO ET AL
Fig 5 Treatment locations and high fuel model range difference in conditional burn probability and condishytional flame length (untreated-treated) for each treatment scenario
increases in CBP were also observed particularly for the low fuel model range (Fig 4)
The influence of treatment on owl PAC likelishyhood of burning was similar to that observed for stands in general For treated PACs average CBP fell by ~70 relative to no treatment for the same stands Although PACs were not eligible for treatment in S1 all treatment scenarios had a large impact on estimated PAC CBP Average PAC CBP was reduced from 0013 to 00063 in S1 00049 in S2 and 00054 in S3 a 49ndash64 decrease relative to PACs in the no-treatment landscape (Table 3)
Fire hazardmdashTreatments reduced average landshyscape CFL by ~1 m from 36 m (NT) to 25ndash27 m Pixel-level CFL was reduced by a maximum of 80 m (LO FM) and 90 m (HI FM) Increases in CFL were also observed however particularly near the study arearsquos western and southwestern boundaries where treatments were least concentrated (Figs 4 5) Maximum pixel-level CFL increases were 25 m (LO FM) and 31 m (HI FM) Because fire hazard was used in prioritizing
stands for treatment the estimated pre-treatment CFL in stands selected for treatment (43ndash51 m)
wwwesajournalsorg 11 January 2017 Volume 8(1) Article e01648
CHIONO ET AL
Table 3 Proportional change in burn probability for treatment scenarios compared to the NT scenario
LO FM HI FM AVG
Stand type
S1 S2 S3 Proportional change
relative to NT
S1 S2 S3 Proportional change
relative to NT
S1 S2 S3 Proportional change
relative to NT
All PACs -045 -064 -056 -053 -063 -059 -049 -064 -057 Treated PACs NA -081 -076 NA -057 -067 NA -069 -072 Untreated PACs -045 -053 -051 -053 -054 -058 -049 -053 -054 All stands Treated stands
-044 -076
-048 -079
-053 -063
-050 -072
-053 -074
-056 -074
-047 -074
-050 -076
-054 -069
Untreated stands -035 -039 -049 -045 -047 -051 -040 -043 -050
Notes NT no treatment PACs protected activity centers Proportions are ratios of treatment values to no-treatment values as calculated for the same stands Treatment and no-treatment values were calculated as the average pixel value for the low and high fuel model range (LO FM and HI FM) within each stand category and treatment scenario
was greater than in stands not selected (32ndash 33 m) After treatment average CFL within treashyted stands fell to 13 (S1 and S2) and 17 m (S3) CFL in untreated stands was also reduced as a result of the influence of treatments on fire spread and intensity CFL fell by 05ndash08 m (9ndash 16) relative to CFL in the same stands within the no-treatment landscape (Table 4)
Although spotted owl PACs were not treated in S1 relative to PACs in the NT landscape PAC CFL was reduced by 10 (to 32 m) in S1 Treating PACs had a much larger impact on potential fire intensity however Average treashyted PAC CFL fell to 13 and 14 m in S2 and S3 respectively
Carbon consequences of landscape fuel treatments
Prior to treatment aboveground landscape carbon totaled 14705 tonnesha on average Treatments removed 14 of pre-treatment C from treated stands or 2374 tonnesha totaling
81772ndash119103 tonnes of C in harvested biomass and merchantable material (Tables 5 and 6) Both the treatment scenarios and the choice of
fuel models were important influences on estishymated C emissions from burning As the least restrictive treatment scenario in terms of treatshyment location and the only scenario to include treatment of private land where broadcast burnshying was precluded as a treatment option the S3 treatment scenario was associated with the lowshyest wildfire and prescribed burning emissions (Tables 5 and 6) For each treatment scenario expected wildfire emissions increased by more than an order of magnitude between the low and high fuel model ranges This difference was the result of increasing fire intensity as well as wildshyfire size Average wildfire size nearly doubled between fuel model ranges in the treatment sceshynarios and tripled in the no-treatment scenario (Fig 6) For a given treatment scenario wildfire emissions on a per hectare basis were approxishymately two tonnes greater for the high fuel
Table 4 Proportional change in conditional flame length for treatment scenarios compared to the NT scenario
LO FM HI FM AVG
Stand type
S1 S2 S3 Proportional change
relative to NT
S1 S2 S3 Proportional change
relative to NT
S1 S2 S3 Proportional change
relative to NT
All PACs -009 -042 -028 -012 -043 -027 -010 -042 -028 Treated PACs NA -071 -075 NA -071 -073 NA -071 -074 Untreated PACs -009 -014 -011 -012 -017 -014 -010 -016 -013 All stands -022 -026 -031 -025 -026 -028 -024 -026 -030 Treated stands -065 -069 -052 -071 -071 -073 -068 -070 -062 Untreated stands -008 -009 -021 -011 -012 -012 -009 -010 -016
Notes NT no treatment PACs protected activity centers Proportions are ratios of treatment values to no-treatment values as calculated for the same stands Treatment and no-treatment values were calculated as the average pixel value for the low and high fuel model range (LO FM and HI FM) within each stand category and treatment scenario
wwwesajournalsorg 12 January 2017 Volume 8(1) Article e01648
CHIONO ET AL
Table 5 Expected biomass carbon expected wildfire C emissions and C harvested and emitted in fuel treatshyments for NT and treatment (S1 S2 S3) scenarios using the low fuel model range in fire modeling
Carbon pool NT S1 S2 S3
Untreated stands Tonnes C Live 5004505 3915044 3695489 3954131 Dead 1845659 1421704 1378824 1466202 Wildfire emissions 2372 1137 1039 904
Treated stands Live 881358 1072625 826366 Dead 260089 299244 220932 All harvested biomass 88773 81772 119103 Prescribed fire emissions 178530 169693 122599 Wildfire emissions 48 56 61
All stands Live 5004505 4796402 4768113 4780497 Dead 1845659 1681793 1678068 1687135 Treatment (harvested and emitted) 267303 251465 241702 Wildfire emissions 2372 1186 1095 965
Grand totals 6852536 6746684 6698741 6710299
Notes LF indicates the large fire scenarios Expected C is that remaining in the core study area following treatment if applishycable and a random ignition and wildfire in the larger buffered study area as estimated from the simulation of many wildfires Live C is that contained in live aboveground herb shrub and tree biomass dead C is the C contained in litter duff woody surshyface fuel and aboveground portions of tree snags NT no treatment
model range than for the low range In contrast to the large influence of fuel model choice on wildfire emissions the effect of fuel model range on prescribed fire emissions was minimal with only a 1 increase in emissions between the low and high fuel model ranges for a given treatment scenario
Although treatment significantly reduced wildshyfire emissions combined emissions from preshyscribed burning on 20 of the landscape and wildfire exceeded wildfire emissions in the no-treatment scenarios (Tables 5 and 6) Relative to the no-treatment scenarios treatment reduced estimated wildfire emissions by approximately 54 (low fuel model range) 59 (high fuel model range) and 45 (large fire scenarios) Yet preshyscribed burning was a far more significant source of emissions than were wildfires of moderate size with emissions from treatment exceeding wildfire emissions by 111259ndash177344 tonnes Even for the large wildfire simulations where landscape treatments nearly halved estimated wildfire emisshysions the combined carbon emissions from preshyscribed burning and wildfire in the treatment scenario surpassed wildfire emissions in the no-treatment scenario by 45 (Table 6 Fig 7)
The total quantity of aboveground C expected to remain on the landscape following treatment
and a randomly ignited wildfire was greatest for the no-treatment scenarios (Tables 5 and 6) For modeled wildfires of moderate size treatment reduced both the live and dead C pools relative to the no-treatment scenarios and terrestrial C in the no-treatment scenarios was 4ndash5 greater (323316 ndash434960 tonnes) than in any of the treatment scenarios (Tables 5 and 6) In comparison under large wildfire conditions the treatment scenario retained slightly more live biomass C~15000 tonshynes or 03 more than the no-treatment scenario However treatment also reduced necromass C by 288000 tonnes (12) resulting in a 3 overall decrease in onsite biomass C relative to an untreshyated landscape (Table 6) The proportional changes in aboveground
biomass C pools between the treatment and no-treatment scenarios are summarized in Table 7 For all treatment scenarios the consumption of duff litter and downed woody fuels with preshyscribed burning contributed to a net reduction in these C pools relative to the untreated landscape Conversely treatments protected more C in the live understory (herb and shrub) poolmdashthe result of reduced wildfire size and intensity in the treatshyment scenarios Treatments in the moderate wildshyfire scenarios reduced live tree biomass C in comparison with no-treatment levels (Fig 8)
wwwesajournalsorg 13 January 2017 Volume 8(1) Article e01648
CHIONO ET AL
Table 6 Expected biomass carbon expected wildfire C emissions and C harvested and emitted in fuel treatshyments for NT and treatment (S1 S2 S3) scenarios using the high fuel model range in fire modeling
Carbon pool NT S1 S2 S3 NT-LF S3-LF
Untreated stands Tonnes C Live 4910239 3879854 3664690 3923358 4586898 3750774 Dead 1912429 1448947 1403313 1489629 2130034 1605591 Wildfire emissions 31831 12934 12001 11293 137622 68061
Treated stands Live 896670 1115918 853503 847374 Dead 280182 325628 238130 247744 All harvested biomass 88773 81772 119103 119103 Prescribed fire emissions 180357 171247 123539 123539 Wildfire emissions 798 951 986 8285
All stands Live 4910239 4776524 4780607 4776861 4586898 4598148 Dead 1912429 1729129 1728941 1727759 2130034 1853334 Treatment (harvested and emitted) 282862 265971 254921 254921 Wildfire emissions 31831 13732 12952 12279 137622 76346
Grand totals 6854499 6802247 6788471 6771820 6854554 6782749
Notes LF indicates the large fire scenarios Expected terrestrial C is that remaining in the core study area following treatshyment if applicable and a random ignition and wildfire in the larger buffered study area as estimated from the simulation of many wildfires Live C is that contained in live aboveground herb shrub and tree biomass dead C is the C contained in litter duff woody surface fuel and aboveground portions of tree snags NT no treatment
Notably in the large modeled wildfire scenarios (NT-LF and S3-LF) treatments resulted in a 400000-tonne increase in landscape-level live tree C over the no-treatment scenario
DISCUSSION
Fuel treatments in protected habitat Because there are often competing objectives
between managing forests for resilience to fire and drought and protecting owl habitat we assessed potential fire occurrence and hazard based on treatment scenarios that included and omitted treatment of PACs Conducting fuels management outside of occupied owl habitat has been suggested as a means of reducing fire risk within occupied sites (Jenness et al 2004 Tempel et al 2015) Ager et al (2007) reported that fuel treatments on 20 of a western Oregon landscape reduced the probability of northern spotted owl nesting and roosting habitat loss by 44 even though that habitat type was not treated As in Ager et al (2007) we observed modifications in fire intensity and burn probability within owl habitat even when it was left untreated In the S1 treatment scenario in which owl activity centers were not eligible for treatment the effect of treatshying other stands reduced both fire hazard (by
9ndash12 for CFL or approximately 04 m) and CBP (by ~45) within PACs It is difficult to assess the significance of this proportional reduction in CBP given that the absolute differences in probabilities were relatively modest (Figs 3 4) Ager et al (2007) noted that allowing treatment of owl habishytat would have significantly reduced estimated habitat loss in their study In this study it is expected that habitat quality may be reduced within treated PACs in the short term through the removal of small-diameter trees (ie lower vertical structural heterogeneity) However two structural attributes for suitable spotted owl nestshying habitat identified by Tempel et al (2015) high canopy cover and large tree density would not be altered While we did not directly estimate habitat loss we did observe much larger reductions in fire hazard within PACs that were treated as meashysured by CFL (71ndash75 reduction equivalent to 2ndash3 m) It should be noted that the effect of wideshyspread treatments within PACs on spotted owl nesting and foraging behavior is unknown One concern with designating some land area
unavailable for treatment is that it may limit the potential for treatments to alter fire behavior across the landscape (eg Finney 2001) Including all stands in the potential treatment pool allows the highest-priority stands with respect to simulated
wwwesajournalsorg 14 January 2017 Volume 8(1) Article e01648
CHIONO ET AL
effects on landscape-level fire behavior The true effect of increasing the land area available for treatshyment may be partially obscured by the varying frequency of treatment prescriptions between sceshynarios For example the hand thinning treatments applied within PACs would be expected to have a milder effect on potential wildfire behavior than more severe prescriptions and hand thinning was twice as common in S2 as in the other scenarios
Terrestrial carbon and burning emissions Landscape treatments reduced wildfire emisshy
sions by reducing the emissions produced per area burned by wildfire as well as average wildfire size On average wildfires in the treated landscapes released 193ndash216 tonnes Cha while wildfires in the untreated landscapes released 234ndash254 tonnes Cha Modeled wildfires decreased in size by 7 (low fuel model range) 36 (high fuel model range) and 25 (large fire scenario) relative to untreated landscapes (Fig 6) Since the burn pershyiod for simulated wildfires was held constant between scenarios this reduction in average wildshyfire size is the result of reduced spread rates derived from fuel treatments Despite the influence of treatments on wildfire
intensity size and expected emissions treatment-related emissions exceeded the avoided wildfire emissions conferred by treatment Prescribed burning in our study a combination of broadcast
Fig 6 Wildfire size relative frequency distributions from wildfire simulations Bar color represents no-treatment (NT) and treatment scenarios (S1ndashS3)
fire spread to be treated which would be expected to achieve the greatest modification of landscape fire behavior and effects In the present study although the land area potentially available for treatment more than doubled between S1 and S3 landscape-level effects of treatment on modeled fire risk and hazard were fairly similar (compared with the no-treatment landscape all-stand CBP fell by 47 and 54 in S1 and S3 while CFL fell by 24 and 30) Dow et al (2016) also found that incorporating modest restrictions on treatment Fig 7 Carbon emissions (tonnes) from wildfire and
area availability (24 of the landscape unavail- prescribed burning X-axis labels indicate no-treatment able) had minimal consequences for modeled fire (NT) and treatment scenarios (S1ndashS3) subscripts size and hazard The modest changes in estimated denote fuel model ranges used in fire modeling
fire metrics we observed may also be due to simi- (L low H high) Large fire scenarios which were
larity in the general pattern of treatment placement modeled with the high fuel model range only are indishybetween scenarios which probably led to similar cated by LF
wwwesajournalsorg 15 January 2017 Volume 8(1) Article e01648
CHIONO ET AL
Table 7 Proportional change in expected carbon by biomass pool for treatment scenarios compared to the no-treatment landscape
Treatment Standing Down dead Forest Herb Live scenario dead wood floor shrub tree
S1 004 -017 -013 014 -004 S2 001 -016 -012 014 -004 S3 -001 -015 -010 016 -004 S3-LF -016 -013 -008 017 000
Notes For example a value of -010 represents a 10 decshyline in biomass C from the no-treatment scenario Treatment and no-treatment values were calculated as the average of low and high fuel model range values except in the case of the large fire (LF) scenarios which were modeled for the high fuel model range only Expected C is that remaining after a random ignition and wildfire in the buffered study area as estimated from simulating 80000 ignitions (LF 40000 ignitions)
C pool categories are those reported in Forest Vegetation Simulator Carbon Reports Standing dead aboveground porshytion of standing dead trees Down dead wood woody surface fuels Forest floor litter and duff Herbshrub herbs and shrubs Live tree aboveground portion of live trees
and pile burning released 111ndash163 tonnes Cha For comparison studies conducted in comparable forest types have estimated prescribed fire emisshysions of 127 tonnes Cha (warm dry ponderosa pine habitat types Reinhardt and Holsinger 2010)
Fig 8 Expected carbon contained in aboveground live and dead tree biomass Expected C is that remainshying in the core study area following treatment (if applishycable) and a single random ignition within the larger buffered study area X-axis labels indicate no-treatment (NT) and treatment scenarios (S1ndashS3) subshyscripts denote fuel model ranges used in fire modeling (L low H high) Large fire scenarios which were modeled for the high fuel model range only are indishycated by LF
and 148 tonnes Cha (an old-growth mixed-conifer reserve in the southern Sierra Nevada North et al 2009a) Relative to the approximately 158000 tonnes C emitted in prescribed burning avoided wildfire emissions at 1186ndash19551 tonnes for wildfires of moderate size were small A simishylar study in southern Oregon with average modshyeled wildfires of 2350 and 3500 ha (treatment and no-treatment scenarios respectively) found that treatments reduced expected wildfire emissions by 6157 tonnes of C (Ager et al 2010) Surface fuels represented with surface fuel
models in commonly used modeling software are the most influential inputs determining preshydicted fire behavior (Hall and Burke 2006) Fire behavior fire sizes and emissions in this study varied according to fuel model assignment highshylighting the importance of selecting the approprishyate fuel model to represent fuel conditions (see Collins et al 2013) We show a 12- to 14-fold change in wildfire emissions due solely to the choice of fuel models (Tables 5 and 6) Indeed the range of fuel models used in recent studies investigating fuel treatments and simulated fire behavior in mixed-conifer forests is noteworthy Incorporating a range of fuel models into analyshyses such that outcome variability can be reported facilitates comparison of effects across studies Our estimates of the aboveground C benefits
of treatment under the moderate wildfire scenarshyios with average fire sizes of le2133 ha are likely conservative The effect of modeled wildfire size on the C consequences of fuel treatment was conshysiderable emphasizing the importance of this variable in studies of the climate benefits of treatshyment Avoided wildfire emissions resulting from treatment increased to 61276 tonnes C when large wildfires (8070ndash10757 ha) were simulated The treatment scenario given large wildfires also protected a greater portion of live tree C If the ~40000-ha King Fire is representative of the magnitude of future wildfires in the region C accounting should improve with respect to treatshyment favorability Similarly if multiple wildfires were to encounter the study area within the effective lifespan of treatments the C gains assoshyciated with avoided emissions in the treatment scenarios would increase Our approach to estimating the C conseshy
quences of fuel treatments has a number of limitashytions A full accounting of treatment effects
wwwesajournalsorg 16 January 2017 Volume 8(1) Article e01648
CHIONO ET AL
would project through time the consequences of both treatment and wildfire Our analysis is static incorporating only the short-term C costs and benefits of treatment Simulating wildfire in the year immediately following treatment maximizes the apparent benefits of treatment Over time as surface fuels accumulate and vegetation regenershyates maintenance would be required to retain the effectiveness of treatments (Martinson and Omi 2013) increasing the C costs of reduced fire hazard In addition the C contained in fire-killed biomass will ultimately be emitted to the atmoshysphere although biomass decay could be delayed through conversion to long-lived wood products such as building materials (Malmsheimer et al 2011) It is also important to note that our analysis did not include stochastic wildfire occurrence Estimates of burn probability in the present study are not estimates of the likelihood of wildfire occurrence based on historical fire sizes and freshyquency (eg Preisler et al 2004 Mercer and Prestemon 2005 Brillinger et al 2006) but rather are conditional on a single randomly ignited wildfire within the buffered study area
CONCLUSIONS
Our findings generally support those of Campshybell et al (2011) who concluded from an analysis of fire-prone western forests that the C costs of treatments are likely to outweigh their benefits under current depressed fire frequencies In a more recent paper Campbell and Ager (2013) conshycluded that ldquonone of the fuel treatment simulation scenarios resulted in increased system carbonrdquo primarily from the low incidences of treated areas being burned by wildfire However our interpreshytation of these findings differs from those disshycussed in Campbell et al (2011) and Campbell and Ager (2013) especially in light of recent and projected future trends in fire activity (Westerling et al 2011 Miller and Safford 2012 Dennison et al 2014) The current divergence of increasing surface air temperatures and low fire activity is unlikely to be sustained further suggesting greater future fire activity (Marlon et al 2012) If increased fire activity is realized then the likelishyhood of a given area being burned in a wildfire increases This differs from the simple increase in stand-level fire frequency modeled by Campbell et al (2011) because increases in fire likelihood are
not necessarily associated with corresponding decreases in fire severity as assumed by Campbell et al (2011) Increased fire likelihood could very well lead to positive feedbacks in fire severity and ultimately to vegetation type conversion (Copposhyletta et al 2016)mdasheffects that would have signifishycant implications for carbon storage Due to the significant emissions associated
with treatment and the low likelihood that wildshyfire will encounter a given treatment area forest management that is narrowly focused on C accounting alone would favor the no-treatment scenarios Landscape treatments protected more C in live tree biomass only when large wildfires were simulated While treatment favorability improved with large wildfire simulation the no-treatment scenario still produced fewer emissions than the treatment scenario Given the potential for large wildfire in the region as demonstrated by the 2014 King Fire and the increasing freshyquency of large wildfires and area burned in Calishyfornia expected from climate modeling studies (Lenihan et al 2008 Westerling et al 2011) we suggest that future studies of fuel treatmentndashwildshyfirendashC relationships should incorporate the potenshytial for large wildfires at a frequency greater than those observed over the last 20ndash30 yr Others have argued that treatments to increase forest resilience should be a stand-alone top land management priority independent of other ecosystem values such as carbon sequestration and fire hazard reduction (Stephens et al 2016a) We also note that the potential benefits of fuels
management are not restricted to avoided wildshyfire emissions Here we show that landscape fuel treatments can alter fire hazard across the landshyscape both within and outside of treated stands and have the potential to affect the likelihood of burning and fire intensity within protected Calishyfornia spotted owl habitat Underscoring the risk to sensitive habitat the 2014 King Fire encounshytered 31 PACs within our study area leading to the greatest single-year decline in habitat occushypancy recorded over a 23-yr study period (Jones et al 2016) Modest simulated treatments within activity centers significantly reduced potential fire intensity relative to both the no-treatment landscape and a treatment scenario that did not permit treatment within PACs indicating that active management may be desirable to protect habitat in the long term (Roloff et al 2012)
wwwesajournalsorg 17 January 2017 Volume 8(1) Article e01648
CHIONO ET AL
However treatments conducted outside of owl habitat also reduced wildfire hazard
ACKNOWLEDGMENTS
We are grateful to a number of individuals for sharshying their time and fuel treatment and fire modeling expertise Nicole Vaillant (ArcFuels) Alan Ager and Andrew McMahan (carbon estimation) and Coeli Hoover (harvest simulations in FVS-FFE) Brian Ebert and Dana Walsh of the Eldorado National Forest proshyvided invaluable advice on weather inputs for fire modeling and on designing fuel treatment prescripshytions Ken Somers Operations Forester on the Blodgett Forest Research Station gave advice concerning timshyber management on private land We also thank two anonymous reviewers whose comments greatly improved this article The California Energy Commisshysion provided funding for this project
LITERATURE CITED
Ager A A B Bahro and K Barber 2006 Automating the fireshed assessment process with ArcGIS Pages 163ndash167 in P L Andrews and B W Butler (Comps) Fuels ManagementndashHow to Measure Success Conference Proceedings Portland OR March 28ndash30 2006 Proceedings RMRS-P-41 USDA Forest Service Rocky Mountain Research Station Fort Collins Colorado USA
Ager A A M A Finney B K Kerns and H Maffei 2007 Modeling wildfire risk to northern spotted owl (Strix occidentalis caurina) habitat in Central Oregon USA Forest Ecology and Management 24645ndash56
Ager A A M A Finney A McMahan and J Cathcart 2010 Measuring the effect of fuel treatments on forshyest carbon using landscape risk analysis Natural Hazards and Earth System Science 102515ndash2526
Ager A A N M Vaillant D E Owens S Brittain and J Hamann 2012 Overview and example application of the Landscape Treatment Designer Pages 11 General Technical Report PNW-GTR-859 USDA Forest Service Pacific Northwest Research Station Portland Oregon USA
Barbour M G and R A Minnich 2000 Californian upland forests and woodlands Pages 131ndash164 in M Barbour and W Billings editors North Amerishycan terrestrial vegetation Cambridge University Press Cambridge UK
Bias M A and R Gutimerrez 1992 Habitat associations of California spotted owls in the central Sierra Nevada Journal of Wildlife Management 56584ndash595
Bond M L R Gutierrez A B Franklin W S LaHaye C A May and M E Seamans 2002
Short-term effects of wildfires on spotted owl surshyvival site fidelity mate fidelity and reproductive success Wildlife Society Bulletin 301022ndash1028
Brillinger D H Preisler and J Benoit 2006 Probashybilistic risk assessment for wildfires Environ-metrics 17623ndash633
Campbell J L and A A Ager 2013 Forest wildfire fuel reduction treatments and landscape carbon stocks a sensitivity analysis Journal of Environshymental Management 121124ndash132
Campbell J L M E Harmon and S R Mitchell 2011 Can fuel-reduction treatments really increase forest carbon storage in the western US by reducshying future fire emissions Frontiers in Ecology and the Environment 1083ndash90
Cathcart J A A Ager A McMahan M Finney and B Watt 2010 Carbon benefits from fuel treatshyments Pages 61ndash80 in T B Jain R T Graham and J Sandquist editors Integrated management of carbon sequestration and biomass utilization opportunities in a changing climate Proceedings of the 2009 National Silviculture Workshop Boise Idaho June 15ndash18 2009 USDA Forest Service Proshyceedings RMRS-P-61 Rocky Mountain Research Station Fort Collins Colorado USA
Chatfield A H 2005 Habitat selection by a California spotted owl population a landscape scale analysis using resource selection functions Thesis Univershysity of Minnesota St Paul Minnesota USA
Collins B M H A Kramer K Menning C Dilling-ham D Saah P A Stine and S L Stephens 2013 Modeling hazardous fire potential within a comshypleted fuel treatment network in the northern Sierra Nevada Forest Ecology and Management 310156ndash166
Collins B M S L Stephens J J Moghaddas and J Battles 2010 Challenges and approaches in planshyning fuel treatments across fire-excluded forested landscapes Journal of Forestry 10824ndash31
Collins B M S L Stephens G B Roller and J J Battles 2011 Simulating fire and forest dynamics for a landscape fuel treatment project in the Sierra Nevada Forest Science 5777ndash88
Coppoletta M K E Merriam and B M Collins 2016 Post-fire vegetation and fuel development influences fire severity patterns in reburns Ecologishycal Applications 26686ndash699
Crookston N L and A O Finley 2008 yaimpute an r package for knn imputation Journal of Statistical Software 231ndash16
Crookston N L M Moeur and D L Renner 2002 Userrsquos guide to the most similar neighbor imputashytion program version 2 General Technical Report RMRS-GTR-96 USDA Forest Service Rocky Mountain Research Station Ogden Utah USA
wwwesajournalsorg 18 January 2017 Volume 8(1) Article e01648
CHIONO ET AL
Crosby J and C Chandler 1966 Get the most from your windspeed observations Fire Control Notes 2712ndash13
Dailey S J Fites A Reiner and S Mori 2008 Fire behavior and effects in fuel treatments and proshytected habitat on the Moonlight fire Fire Behavior Assessment Team wwwfsfedusadaptivemana gementprojectsFBATdocsMoonlightFinal_8_6_08 pdf
Dennison P E S C Brewer J D Arnold and M A Moritz 2014 Large wildfire trends in the western United States 1984ndash2011 Geophysical Research Letters 412928ndash2933
Dixon G E 2002 Essential FVS a userrsquos guide to the forest vegetation simulator Pages 193 USDA Forest Service Forest Management Service Center Fort Collins Colorado USA
Dore S T E Kolb M Montes-Helu B W Sullivan W D Winslow S C Hart J P Kaye G W Koch and B A Hungate 2008 Long-term impact of a stand-replacing fire on ecosystem CO2 exchange of a ponderosa pine forest Global Change Biology 141ndash20
Dore S M Montes-Helu S C Hart B A Hungate G W Koch J B Moon A J Finkral and T E Kolb 2012 Recovery of ponderosa pine ecosystem carbon and water fluxes from thinning and stand-replacing fire Global Change Biology 183171ndash3185
Dow C J B M Collins and S L Stephens 2016 Incorporating resource protection constraints in an analysis of landscape fuel-treatment effectiveness in the Northern Sierra Nevada California USA Environmental Management 571ndash15
Eidenshink J B Schwind K Brewer Z Zhu B Quayle and S Howard 2007 A project for monshyitoring trends in burn severity Fire Ecology 33ndash21
Evans A M and A J Finkral 2009 From renewable energy to fire risk reduction a synthesis of biomass harvesting and utilization case studies in US forshyests GCB Bioenergy 1211ndash219
Finkral A J and A M Evans 2008 The effects of a thinning treatment on carbon stocks in a northern Arizona ponderosa pine forest Forest Ecology and Management 2552743ndash2750
Finney M A 2001 Design of regular landscape fuel treatment patterns for modifying fire growth and behavior Forest Science 47219ndash228
Finney M A 2002 Fire growth using minimum travel time methods Canadian Journal of Forest Research 321420ndash1424
Finney M A 2006 An overview of FlamMap fire modeling capabilities Pages 213ndash220 in P L Andrews and B W Butler editors Proceedings of Fuels ManagementndashHow to Measure Success Research Paper RMRS-P-41 USDA Forest Service
Rocky Mountain Research Station Portland Oregon USA
Finney M A R C Seli C W McHugh A A Ager B Bahro and J K Agee 2007 Simulation of longshyterm landscape-level fuel treatment effects on large wildfires International Journal of Wildland Fire 16712ndash727
Fulme P Z J E Crouse J P Roccaforte and E L Kalies 2012 Do thinning andor burning treatments in western USA ponderosa or Jeffrey pine-dominated forests help restore natural fire behavior Forest Ecology and Management 26968ndash81
Gaines W L R J Harrod J Dickinson A L Lyons and K Halupka 2010 Integration of Northern spotted owl habitat and fuels treatments in the eastern Cascades Washington USA Forest Ecolshyogy and Management 2602045ndash2052
Gaines W L R A Strand and S D Piper 1997 Effects of the hatchery complex fires on northern spotted owls in the eastern Washington Cascades Pages 123ndash129 in J N Greenlee editor Proceedings of the Fire Effects on Rare and Endangered Species and Habitats Conference Coeur DrsquoAlene Idaho International Association of Wildfire and Forestry Hot Springs South Dakota USA
Hall S A and I C Burke 2006 Considerations for characterizing fuels as inputs for fire behavior models Forest Ecology and Management 227 102ndash114
Hoover C and S Rebain 2008 The Kane Experimenshytal Forest carbon inventory carbon reporting with FVS Pages 13ndash15 in R N Havis and N L Crookston editors Third Forest Vegetation Simushylator Conference Fort Collins Colorado February 13ndash15 2007 USDA Forest Service Rocky Mountain Research Station Fort Collins Colorado USA
Hurteau M and M North 2009 Fuel treatment effects on tree-based forest carbon storage and emissions under modeled wildfire scenarios Fronshytiers in Ecology and the Environment 7409ndash414
Hurteau M D and M North 2010 Carbon recovery rates following different wildfire risk mitigation treatments Forest Ecology and Management 260 930ndash937
Hurteau M D M T Stoddard and P Z Fulme 2011 The carbon costs of mitigating high-severity wildshyfire in southwestern ponderosa pine Global Change Biology 171516ndash1521
Jenness J S P Beier and J L Ganey 2004 Associashytions between forest fire and Mexican spotted owls Forest Science 50765ndash772
Jones G M R Gutimerrez D J Tempel S A Whitmore W J Berigan and M Z Peery 2016 Megafires an emerging threat to old-forest species Frontiers in Ecology and the Environment 14300ndash306
wwwesajournalsorg 19 January 2017 Volume 8(1) Article e01648
CHIONO ET AL
Laymon S A 1988 Ecology of the spotted owl in the central Sierra Nevada California Dissertation University of California Berkeley California USA
Lenihan J M D Bachelet R P Neilson and R Drapek 2008 Response of vegetation distribution ecosystem productivity and fire to climate change scenarios for California Climatic Change 87215ndash230
Lydersen J M B M Collins E E Knapp G B Roller and S Stephens 2015 Relating fuel loads to overshystorey structure and composition in a fire-excluded Sierra Nevada mixed conifer forest International Journal of Wildland Fire 24484ndash494
Malmsheimer R J Bowyer J Fried E Gee R Islar R Miner I E Munn E Oneil and W C Stewart 2011 Managing forests because carbon matters integrating energy products and land manageshyment policy Journal of Forestry 109S7ndashS50
Marlon J R et al 2012 Long-term perspective on wildfires in the western USA Proceedings of the National Academy of Sciences of the United States of America 109E535ndashE543
Martinson E J and P N Omi 2002 Performance of fuel treatments subjected to wildfires Pages 7ndash13 in P N Omi and L A Joyce editors Conference on Fire Fuel Treatments and Ecological Restorashytion USDA Forest Service Rocky Mountain Research Station Fort Collins Colorado USA
Martinson E J and P N Omi 2013 Fuel treatments and fire severity a meta-analysis Pages 38 USDA Forest Service Rocky Mountain Research Station Fort Collins Colorado USA
Mayer K E and W F Laudenslayer 1988 A guide to wildlife habitats of California California Departshyment of Forestry and Fire Protection Sacramento California USA
McKenzie D Z Gedalof D L Peterson and P Mote 2004 Climatic change wildfire and conservation Conservation Biology 18890ndash902
Mercer D E and J P Prestemon 2005 Comparing production function models for wildfire risk analyshysis in the wildlandndashurban interface Forest Policy and Economics 7782ndash795
Miller J D and H Safford 2012 Trends in wildfire severity 1984 to 2010 in the Sierra Nevada Modoc Plateau and southern Cascades California USA Fire Ecology 841ndash57
Miller J H Safford M Crimmins and A Thode 2009 Quantitative evidence for increasing forest fire severity in the Sierra Nevada and southern Cascade mountains California and Nevada USA Ecosystems 1216ndash32
North M 2012 Managing Sierra Nevada forests PSWshyGTR-237 USDA Forest Service Pacific Southwest Research Station Albany California USA
North M P and M D Hurteau 2011 High-severity wildfire effects on carbon stocks and emissions in fuels treated and untreated forest Forest Ecology and Management 2611115ndash1120
North M M Hurteau and J Innes 2009a Fire supshypression and fuels treatment effects on mixed-conifer carbon stocks and emissions Ecological Applications 191385ndash1396
North M P A Stine K OrsquoHara W Zielinski and S Stephens 2009b An ecosystem management strategy for Sierran mixed-conifer forests General Technical Report PSW-GTR-220 USDA Forest Service Pacific Southwest Research Station Albany California USA
Parisien M-A S Snetsinger J A Greenberg C R Nelson T Schoennagel S Z Dobrowski and M A Moritz 2012 Spatial variability in wildfire probability across the western United States Intershynational Journal of Wildland Fire 21313ndash327
Penman J M Gytarsky T Hiraishi T Krug D Kruger R Pipatti L Buendia K Miwa T Ngara and K Tanabe 2003 Good practice guidance for land use land-use change and forestry Institute for Global Environmental Strategies for the Intergovshyernmental Panel on Climate Change Hayama Kanagawa Japan
Pollet J and P N Omi 2002 Effect of thinning and prescribed burning on crown fire severity in ponderosa pine forests International Journal of Wildland Fire 111ndash10
Prather J W R F Noss and T D Sisk 2008 Real versus perceived conflicts between restoration of ponderosa pine forests and conservation of the Mexican spotted owl Forest Policy and Economics 10140ndash150
Preisler H K D R Brillinger R E Burgan and J Benoit 2004 Probability based models for estimation of wildfire risk International Journal of Wildland Fire 13133ndash142
Rebain S E Reinhardt N Crookston S Beukema W Kurz and J Greenough 2009 The fire and fuels extension to the Forest Vegetation Simulator Addendum to RMRS-GTR-119 USDA Forest Service and ESSA Technologies Ltd Fort Collins Colorado USA
Reinhardt E D and N L Crookston 2003 The fire and fuels extension to the forest vegetation simulashytor Pages 209 RMRS-GTR-116 USDA Forest Sershyvice Rocky Mountain Research Station Ogden Utah USA
Reinhardt E and L Holsinger 2010 Effects of fuel treatments on carbon-disturbance relationshyships in forests of the northern Rocky Mountains Forest Ecology and Management 2591427ndash1435
wwwesajournalsorg 20 January 2017 Volume 8(1) Article e01648
CHIONO ET AL
Reinhardt E D R E Keane D E Calkin and J D Cohen 2008 Objectives and considerations for wildland fuel treatment in forested ecosystems of the interior western United States Forest Ecology and Management 2561997ndash2006
Ritchie M W C N Skinner and T A Hamilton 2007 Probability of tree survival after wildfire in an interior pine forest of northern California effects of thinning and prescribed fire Forest Ecolshyogy and Management 247200ndash208
Roloff G J S P Mealey and J D Bailey 2012 Comshyparative hazard assessment for protected species in a fire-prone landscape Forest Ecology and Manshyagement 2771ndash10
Rothermel R C 1972 A mathematical model for preshydicting fire spread in wildland fuels Research Paper INT-115 USDA Forest Service Intermounshytain Forest and Range Experiment Station Ogden Utah USA
Safford H D 2008 Fire severity in fuel treatments American River Complex fire Tahoe National Forest California Unpublished Report USDA Forest Service Pacific Southwest Region Vallejo California USA
Schmidt D A A H Taylor and C N Skinner 2008 The influence of fuels treatment and landscape arrangement on simulated fire behavior Southern Cascade range California Forest Ecology and Management 2553170ndash3184
Scott J H and R E Burgan 2005 Standard fire behavior fuel models a comprehensive set for use with Rothermelrsquos surface fire spread model General Technical Report RMRS-GTR-153 USDA Forest Service Rocky Mountain Research Station Fort Collins Colorado USA
Scott J H M P Thompson and J W Gilbertson-Day 2016 Examining alternative fuel management strategies and the relative contribution of National Forest System land to wildfire risk to adjacent homesndasha pilot assessment on the Sierra National Forest California USA Forest Ecology and Manshyagement 36229ndash37
Smith J E and L S Heath 2002 A model of forest floor carbon mass for United States forest types Research Paper NE-722 USDA Forest Service Northeastern Research Station Newtown Square Pennsylvania USA
Stephens S L 2005 Forest fire causes and extent on United States Forest Service lands International Journal of Wildland Fire 14213ndash222
Stephens S L B M Collins E Biber and P Z Fulme 2016a US federal fire and forest policy emphasizshying resilience in dry forests Ecosphere 7e01584
Stephens S L J D Miller B M Collins M P North J J Keane and S L Roberts 2016b Wildfire impacts on California Spotted Owl nesting habitat in the Sierra Nevada Ecosphere 7e01584
Stephens S L J J Moghaddas B R Hartsough E E Y Moghaddas and N E Clinton 2009 Fuel treatshyment effects on stand-level carbon pools treatshyment-related emissions and fire risk in a Sierra Nevada mixed-conifer forest Canadian Journal of Forest Research 391538ndash1547
Stephens S L et al 2012 Fuel treatment impacts on estimated wildfire carbon loss from forests in Monshytana Oregon California and Arizona Ecosphere 31ndash17
Tempel D et al 2015 Evaluating short- and longshyterm impacts of fuels treatments and simulated wildfire on an old-forest species Ecosphere 61ndash19
USDA Forest Service 2004 Sierra Nevada Forest Plan Amendment Final supplemental environmental impact statement Record of decision Publication R5-MB-046 USDA Forest Service Pacific Southshywest Region Vallejo California USA
Van Wagner C E 1977 Conditions for the start and spread of crown fire Canadian Journal of Forest Research 723ndash34
Verner J K S McKelvey B R Noon R Gutimerrez G I Gould Jr and T W Beck 1992 Assessment of the current status of the California spotted owl with recommendations for management Pages 3ndash27 in J Verner K S McKelvey B R Noon R Gutimerrez G I Gould Jr and T W Beck edishytors The California Spotted Owl a technical assessment of its current status PSW-GTR-133 USDA Forest Service Albany California USA
Westerling A B Bryant H Preisler T Holmes H Hidalgo T Das and S Shrestha 2011 Climate change and growth scenarios for California wildshyfire Climatic Change 109445ndash463
Westerling A L H G Hidalgo D R Cayan and T W Swetnam 2006 Warming and earlier Spring increase Western US Forest Wildfire Activity Science 313940ndash943
Wiedinmyer C and M D Hurteau 2010 Prescribed fire as a means of reducing forest carbon emissions in the Western United States Environmental Science amp Technology 441926ndash1932
SUPPORTING INFORMATION
Additional Supporting Information may be found online at httponlinelibrarywileycomdoi101002ecs2 1648full
wwwesajournalsorg 21 January 2017 Volume 8(1) Article e01648
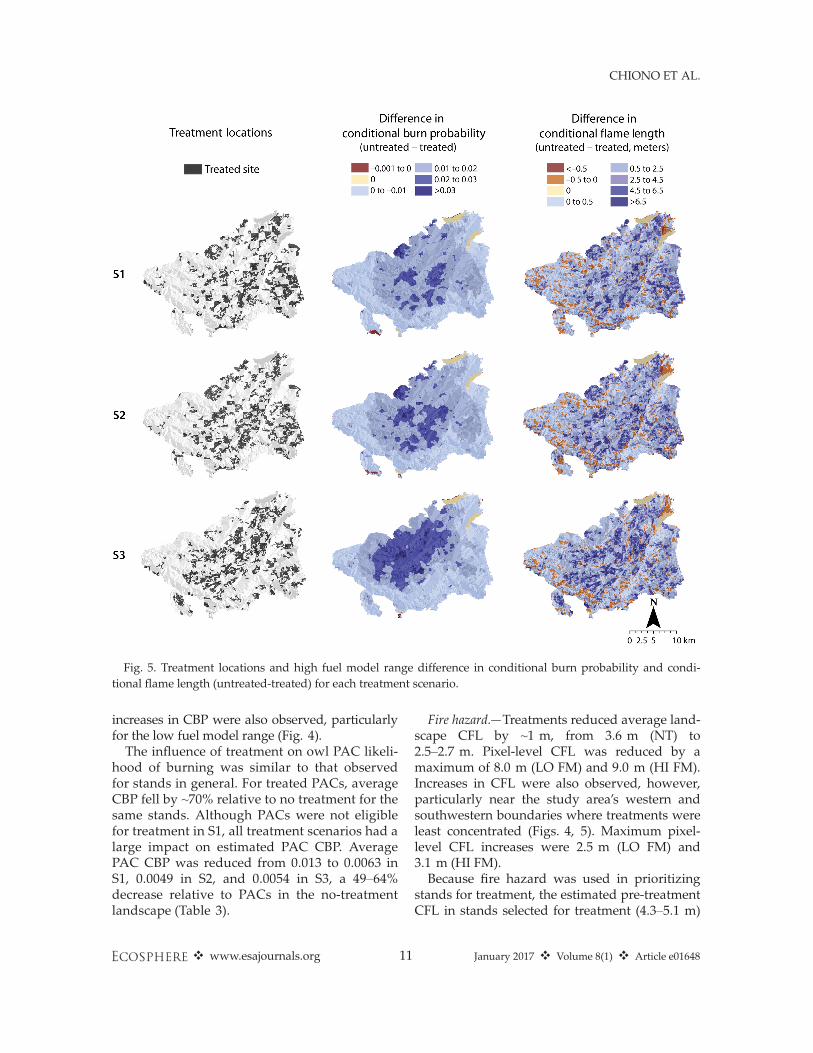
CHIONO ET AL
Fig 5 Treatment locations and high fuel model range difference in conditional burn probability and condishytional flame length (untreated-treated) for each treatment scenario
increases in CBP were also observed particularly for the low fuel model range (Fig 4)
The influence of treatment on owl PAC likelishyhood of burning was similar to that observed for stands in general For treated PACs average CBP fell by ~70 relative to no treatment for the same stands Although PACs were not eligible for treatment in S1 all treatment scenarios had a large impact on estimated PAC CBP Average PAC CBP was reduced from 0013 to 00063 in S1 00049 in S2 and 00054 in S3 a 49ndash64 decrease relative to PACs in the no-treatment landscape (Table 3)
Fire hazardmdashTreatments reduced average landshyscape CFL by ~1 m from 36 m (NT) to 25ndash27 m Pixel-level CFL was reduced by a maximum of 80 m (LO FM) and 90 m (HI FM) Increases in CFL were also observed however particularly near the study arearsquos western and southwestern boundaries where treatments were least concentrated (Figs 4 5) Maximum pixel-level CFL increases were 25 m (LO FM) and 31 m (HI FM) Because fire hazard was used in prioritizing
stands for treatment the estimated pre-treatment CFL in stands selected for treatment (43ndash51 m)
wwwesajournalsorg 11 January 2017 Volume 8(1) Article e01648
CHIONO ET AL
Table 3 Proportional change in burn probability for treatment scenarios compared to the NT scenario
LO FM HI FM AVG
Stand type
S1 S2 S3 Proportional change
relative to NT
S1 S2 S3 Proportional change
relative to NT
S1 S2 S3 Proportional change
relative to NT
All PACs -045 -064 -056 -053 -063 -059 -049 -064 -057 Treated PACs NA -081 -076 NA -057 -067 NA -069 -072 Untreated PACs -045 -053 -051 -053 -054 -058 -049 -053 -054 All stands Treated stands
-044 -076
-048 -079
-053 -063
-050 -072
-053 -074
-056 -074
-047 -074
-050 -076
-054 -069
Untreated stands -035 -039 -049 -045 -047 -051 -040 -043 -050
Notes NT no treatment PACs protected activity centers Proportions are ratios of treatment values to no-treatment values as calculated for the same stands Treatment and no-treatment values were calculated as the average pixel value for the low and high fuel model range (LO FM and HI FM) within each stand category and treatment scenario
was greater than in stands not selected (32ndash 33 m) After treatment average CFL within treashyted stands fell to 13 (S1 and S2) and 17 m (S3) CFL in untreated stands was also reduced as a result of the influence of treatments on fire spread and intensity CFL fell by 05ndash08 m (9ndash 16) relative to CFL in the same stands within the no-treatment landscape (Table 4)
Although spotted owl PACs were not treated in S1 relative to PACs in the NT landscape PAC CFL was reduced by 10 (to 32 m) in S1 Treating PACs had a much larger impact on potential fire intensity however Average treashyted PAC CFL fell to 13 and 14 m in S2 and S3 respectively
Carbon consequences of landscape fuel treatments
Prior to treatment aboveground landscape carbon totaled 14705 tonnesha on average Treatments removed 14 of pre-treatment C from treated stands or 2374 tonnesha totaling
81772ndash119103 tonnes of C in harvested biomass and merchantable material (Tables 5 and 6) Both the treatment scenarios and the choice of
fuel models were important influences on estishymated C emissions from burning As the least restrictive treatment scenario in terms of treatshyment location and the only scenario to include treatment of private land where broadcast burnshying was precluded as a treatment option the S3 treatment scenario was associated with the lowshyest wildfire and prescribed burning emissions (Tables 5 and 6) For each treatment scenario expected wildfire emissions increased by more than an order of magnitude between the low and high fuel model ranges This difference was the result of increasing fire intensity as well as wildshyfire size Average wildfire size nearly doubled between fuel model ranges in the treatment sceshynarios and tripled in the no-treatment scenario (Fig 6) For a given treatment scenario wildfire emissions on a per hectare basis were approxishymately two tonnes greater for the high fuel
Table 4 Proportional change in conditional flame length for treatment scenarios compared to the NT scenario
LO FM HI FM AVG
Stand type
S1 S2 S3 Proportional change
relative to NT
S1 S2 S3 Proportional change
relative to NT
S1 S2 S3 Proportional change
relative to NT
All PACs -009 -042 -028 -012 -043 -027 -010 -042 -028 Treated PACs NA -071 -075 NA -071 -073 NA -071 -074 Untreated PACs -009 -014 -011 -012 -017 -014 -010 -016 -013 All stands -022 -026 -031 -025 -026 -028 -024 -026 -030 Treated stands -065 -069 -052 -071 -071 -073 -068 -070 -062 Untreated stands -008 -009 -021 -011 -012 -012 -009 -010 -016
Notes NT no treatment PACs protected activity centers Proportions are ratios of treatment values to no-treatment values as calculated for the same stands Treatment and no-treatment values were calculated as the average pixel value for the low and high fuel model range (LO FM and HI FM) within each stand category and treatment scenario
wwwesajournalsorg 12 January 2017 Volume 8(1) Article e01648
CHIONO ET AL
Table 5 Expected biomass carbon expected wildfire C emissions and C harvested and emitted in fuel treatshyments for NT and treatment (S1 S2 S3) scenarios using the low fuel model range in fire modeling
Carbon pool NT S1 S2 S3
Untreated stands Tonnes C Live 5004505 3915044 3695489 3954131 Dead 1845659 1421704 1378824 1466202 Wildfire emissions 2372 1137 1039 904
Treated stands Live 881358 1072625 826366 Dead 260089 299244 220932 All harvested biomass 88773 81772 119103 Prescribed fire emissions 178530 169693 122599 Wildfire emissions 48 56 61
All stands Live 5004505 4796402 4768113 4780497 Dead 1845659 1681793 1678068 1687135 Treatment (harvested and emitted) 267303 251465 241702 Wildfire emissions 2372 1186 1095 965
Grand totals 6852536 6746684 6698741 6710299
Notes LF indicates the large fire scenarios Expected C is that remaining in the core study area following treatment if applishycable and a random ignition and wildfire in the larger buffered study area as estimated from the simulation of many wildfires Live C is that contained in live aboveground herb shrub and tree biomass dead C is the C contained in litter duff woody surshyface fuel and aboveground portions of tree snags NT no treatment
model range than for the low range In contrast to the large influence of fuel model choice on wildfire emissions the effect of fuel model range on prescribed fire emissions was minimal with only a 1 increase in emissions between the low and high fuel model ranges for a given treatment scenario
Although treatment significantly reduced wildshyfire emissions combined emissions from preshyscribed burning on 20 of the landscape and wildfire exceeded wildfire emissions in the no-treatment scenarios (Tables 5 and 6) Relative to the no-treatment scenarios treatment reduced estimated wildfire emissions by approximately 54 (low fuel model range) 59 (high fuel model range) and 45 (large fire scenarios) Yet preshyscribed burning was a far more significant source of emissions than were wildfires of moderate size with emissions from treatment exceeding wildfire emissions by 111259ndash177344 tonnes Even for the large wildfire simulations where landscape treatments nearly halved estimated wildfire emisshysions the combined carbon emissions from preshyscribed burning and wildfire in the treatment scenario surpassed wildfire emissions in the no-treatment scenario by 45 (Table 6 Fig 7)
The total quantity of aboveground C expected to remain on the landscape following treatment
and a randomly ignited wildfire was greatest for the no-treatment scenarios (Tables 5 and 6) For modeled wildfires of moderate size treatment reduced both the live and dead C pools relative to the no-treatment scenarios and terrestrial C in the no-treatment scenarios was 4ndash5 greater (323316 ndash434960 tonnes) than in any of the treatment scenarios (Tables 5 and 6) In comparison under large wildfire conditions the treatment scenario retained slightly more live biomass C~15000 tonshynes or 03 more than the no-treatment scenario However treatment also reduced necromass C by 288000 tonnes (12) resulting in a 3 overall decrease in onsite biomass C relative to an untreshyated landscape (Table 6) The proportional changes in aboveground
biomass C pools between the treatment and no-treatment scenarios are summarized in Table 7 For all treatment scenarios the consumption of duff litter and downed woody fuels with preshyscribed burning contributed to a net reduction in these C pools relative to the untreated landscape Conversely treatments protected more C in the live understory (herb and shrub) poolmdashthe result of reduced wildfire size and intensity in the treatshyment scenarios Treatments in the moderate wildshyfire scenarios reduced live tree biomass C in comparison with no-treatment levels (Fig 8)
wwwesajournalsorg 13 January 2017 Volume 8(1) Article e01648
CHIONO ET AL
Table 6 Expected biomass carbon expected wildfire C emissions and C harvested and emitted in fuel treatshyments for NT and treatment (S1 S2 S3) scenarios using the high fuel model range in fire modeling
Carbon pool NT S1 S2 S3 NT-LF S3-LF
Untreated stands Tonnes C Live 4910239 3879854 3664690 3923358 4586898 3750774 Dead 1912429 1448947 1403313 1489629 2130034 1605591 Wildfire emissions 31831 12934 12001 11293 137622 68061
Treated stands Live 896670 1115918 853503 847374 Dead 280182 325628 238130 247744 All harvested biomass 88773 81772 119103 119103 Prescribed fire emissions 180357 171247 123539 123539 Wildfire emissions 798 951 986 8285
All stands Live 4910239 4776524 4780607 4776861 4586898 4598148 Dead 1912429 1729129 1728941 1727759 2130034 1853334 Treatment (harvested and emitted) 282862 265971 254921 254921 Wildfire emissions 31831 13732 12952 12279 137622 76346
Grand totals 6854499 6802247 6788471 6771820 6854554 6782749
Notes LF indicates the large fire scenarios Expected terrestrial C is that remaining in the core study area following treatshyment if applicable and a random ignition and wildfire in the larger buffered study area as estimated from the simulation of many wildfires Live C is that contained in live aboveground herb shrub and tree biomass dead C is the C contained in litter duff woody surface fuel and aboveground portions of tree snags NT no treatment
Notably in the large modeled wildfire scenarios (NT-LF and S3-LF) treatments resulted in a 400000-tonne increase in landscape-level live tree C over the no-treatment scenario
DISCUSSION
Fuel treatments in protected habitat Because there are often competing objectives
between managing forests for resilience to fire and drought and protecting owl habitat we assessed potential fire occurrence and hazard based on treatment scenarios that included and omitted treatment of PACs Conducting fuels management outside of occupied owl habitat has been suggested as a means of reducing fire risk within occupied sites (Jenness et al 2004 Tempel et al 2015) Ager et al (2007) reported that fuel treatments on 20 of a western Oregon landscape reduced the probability of northern spotted owl nesting and roosting habitat loss by 44 even though that habitat type was not treated As in Ager et al (2007) we observed modifications in fire intensity and burn probability within owl habitat even when it was left untreated In the S1 treatment scenario in which owl activity centers were not eligible for treatment the effect of treatshying other stands reduced both fire hazard (by
9ndash12 for CFL or approximately 04 m) and CBP (by ~45) within PACs It is difficult to assess the significance of this proportional reduction in CBP given that the absolute differences in probabilities were relatively modest (Figs 3 4) Ager et al (2007) noted that allowing treatment of owl habishytat would have significantly reduced estimated habitat loss in their study In this study it is expected that habitat quality may be reduced within treated PACs in the short term through the removal of small-diameter trees (ie lower vertical structural heterogeneity) However two structural attributes for suitable spotted owl nestshying habitat identified by Tempel et al (2015) high canopy cover and large tree density would not be altered While we did not directly estimate habitat loss we did observe much larger reductions in fire hazard within PACs that were treated as meashysured by CFL (71ndash75 reduction equivalent to 2ndash3 m) It should be noted that the effect of wideshyspread treatments within PACs on spotted owl nesting and foraging behavior is unknown One concern with designating some land area
unavailable for treatment is that it may limit the potential for treatments to alter fire behavior across the landscape (eg Finney 2001) Including all stands in the potential treatment pool allows the highest-priority stands with respect to simulated
wwwesajournalsorg 14 January 2017 Volume 8(1) Article e01648
CHIONO ET AL
effects on landscape-level fire behavior The true effect of increasing the land area available for treatshyment may be partially obscured by the varying frequency of treatment prescriptions between sceshynarios For example the hand thinning treatments applied within PACs would be expected to have a milder effect on potential wildfire behavior than more severe prescriptions and hand thinning was twice as common in S2 as in the other scenarios
Terrestrial carbon and burning emissions Landscape treatments reduced wildfire emisshy
sions by reducing the emissions produced per area burned by wildfire as well as average wildfire size On average wildfires in the treated landscapes released 193ndash216 tonnes Cha while wildfires in the untreated landscapes released 234ndash254 tonnes Cha Modeled wildfires decreased in size by 7 (low fuel model range) 36 (high fuel model range) and 25 (large fire scenario) relative to untreated landscapes (Fig 6) Since the burn pershyiod for simulated wildfires was held constant between scenarios this reduction in average wildshyfire size is the result of reduced spread rates derived from fuel treatments Despite the influence of treatments on wildfire
intensity size and expected emissions treatment-related emissions exceeded the avoided wildfire emissions conferred by treatment Prescribed burning in our study a combination of broadcast
Fig 6 Wildfire size relative frequency distributions from wildfire simulations Bar color represents no-treatment (NT) and treatment scenarios (S1ndashS3)
fire spread to be treated which would be expected to achieve the greatest modification of landscape fire behavior and effects In the present study although the land area potentially available for treatment more than doubled between S1 and S3 landscape-level effects of treatment on modeled fire risk and hazard were fairly similar (compared with the no-treatment landscape all-stand CBP fell by 47 and 54 in S1 and S3 while CFL fell by 24 and 30) Dow et al (2016) also found that incorporating modest restrictions on treatment Fig 7 Carbon emissions (tonnes) from wildfire and
area availability (24 of the landscape unavail- prescribed burning X-axis labels indicate no-treatment able) had minimal consequences for modeled fire (NT) and treatment scenarios (S1ndashS3) subscripts size and hazard The modest changes in estimated denote fuel model ranges used in fire modeling
fire metrics we observed may also be due to simi- (L low H high) Large fire scenarios which were
larity in the general pattern of treatment placement modeled with the high fuel model range only are indishybetween scenarios which probably led to similar cated by LF
wwwesajournalsorg 15 January 2017 Volume 8(1) Article e01648
CHIONO ET AL
Table 7 Proportional change in expected carbon by biomass pool for treatment scenarios compared to the no-treatment landscape
Treatment Standing Down dead Forest Herb Live scenario dead wood floor shrub tree
S1 004 -017 -013 014 -004 S2 001 -016 -012 014 -004 S3 -001 -015 -010 016 -004 S3-LF -016 -013 -008 017 000
Notes For example a value of -010 represents a 10 decshyline in biomass C from the no-treatment scenario Treatment and no-treatment values were calculated as the average of low and high fuel model range values except in the case of the large fire (LF) scenarios which were modeled for the high fuel model range only Expected C is that remaining after a random ignition and wildfire in the buffered study area as estimated from simulating 80000 ignitions (LF 40000 ignitions)
C pool categories are those reported in Forest Vegetation Simulator Carbon Reports Standing dead aboveground porshytion of standing dead trees Down dead wood woody surface fuels Forest floor litter and duff Herbshrub herbs and shrubs Live tree aboveground portion of live trees
and pile burning released 111ndash163 tonnes Cha For comparison studies conducted in comparable forest types have estimated prescribed fire emisshysions of 127 tonnes Cha (warm dry ponderosa pine habitat types Reinhardt and Holsinger 2010)
Fig 8 Expected carbon contained in aboveground live and dead tree biomass Expected C is that remainshying in the core study area following treatment (if applishycable) and a single random ignition within the larger buffered study area X-axis labels indicate no-treatment (NT) and treatment scenarios (S1ndashS3) subshyscripts denote fuel model ranges used in fire modeling (L low H high) Large fire scenarios which were modeled for the high fuel model range only are indishycated by LF
and 148 tonnes Cha (an old-growth mixed-conifer reserve in the southern Sierra Nevada North et al 2009a) Relative to the approximately 158000 tonnes C emitted in prescribed burning avoided wildfire emissions at 1186ndash19551 tonnes for wildfires of moderate size were small A simishylar study in southern Oregon with average modshyeled wildfires of 2350 and 3500 ha (treatment and no-treatment scenarios respectively) found that treatments reduced expected wildfire emissions by 6157 tonnes of C (Ager et al 2010) Surface fuels represented with surface fuel
models in commonly used modeling software are the most influential inputs determining preshydicted fire behavior (Hall and Burke 2006) Fire behavior fire sizes and emissions in this study varied according to fuel model assignment highshylighting the importance of selecting the approprishyate fuel model to represent fuel conditions (see Collins et al 2013) We show a 12- to 14-fold change in wildfire emissions due solely to the choice of fuel models (Tables 5 and 6) Indeed the range of fuel models used in recent studies investigating fuel treatments and simulated fire behavior in mixed-conifer forests is noteworthy Incorporating a range of fuel models into analyshyses such that outcome variability can be reported facilitates comparison of effects across studies Our estimates of the aboveground C benefits
of treatment under the moderate wildfire scenarshyios with average fire sizes of le2133 ha are likely conservative The effect of modeled wildfire size on the C consequences of fuel treatment was conshysiderable emphasizing the importance of this variable in studies of the climate benefits of treatshyment Avoided wildfire emissions resulting from treatment increased to 61276 tonnes C when large wildfires (8070ndash10757 ha) were simulated The treatment scenario given large wildfires also protected a greater portion of live tree C If the ~40000-ha King Fire is representative of the magnitude of future wildfires in the region C accounting should improve with respect to treatshyment favorability Similarly if multiple wildfires were to encounter the study area within the effective lifespan of treatments the C gains assoshyciated with avoided emissions in the treatment scenarios would increase Our approach to estimating the C conseshy
quences of fuel treatments has a number of limitashytions A full accounting of treatment effects
wwwesajournalsorg 16 January 2017 Volume 8(1) Article e01648
CHIONO ET AL
would project through time the consequences of both treatment and wildfire Our analysis is static incorporating only the short-term C costs and benefits of treatment Simulating wildfire in the year immediately following treatment maximizes the apparent benefits of treatment Over time as surface fuels accumulate and vegetation regenershyates maintenance would be required to retain the effectiveness of treatments (Martinson and Omi 2013) increasing the C costs of reduced fire hazard In addition the C contained in fire-killed biomass will ultimately be emitted to the atmoshysphere although biomass decay could be delayed through conversion to long-lived wood products such as building materials (Malmsheimer et al 2011) It is also important to note that our analysis did not include stochastic wildfire occurrence Estimates of burn probability in the present study are not estimates of the likelihood of wildfire occurrence based on historical fire sizes and freshyquency (eg Preisler et al 2004 Mercer and Prestemon 2005 Brillinger et al 2006) but rather are conditional on a single randomly ignited wildfire within the buffered study area
CONCLUSIONS
Our findings generally support those of Campshybell et al (2011) who concluded from an analysis of fire-prone western forests that the C costs of treatments are likely to outweigh their benefits under current depressed fire frequencies In a more recent paper Campbell and Ager (2013) conshycluded that ldquonone of the fuel treatment simulation scenarios resulted in increased system carbonrdquo primarily from the low incidences of treated areas being burned by wildfire However our interpreshytation of these findings differs from those disshycussed in Campbell et al (2011) and Campbell and Ager (2013) especially in light of recent and projected future trends in fire activity (Westerling et al 2011 Miller and Safford 2012 Dennison et al 2014) The current divergence of increasing surface air temperatures and low fire activity is unlikely to be sustained further suggesting greater future fire activity (Marlon et al 2012) If increased fire activity is realized then the likelishyhood of a given area being burned in a wildfire increases This differs from the simple increase in stand-level fire frequency modeled by Campbell et al (2011) because increases in fire likelihood are
not necessarily associated with corresponding decreases in fire severity as assumed by Campbell et al (2011) Increased fire likelihood could very well lead to positive feedbacks in fire severity and ultimately to vegetation type conversion (Copposhyletta et al 2016)mdasheffects that would have signifishycant implications for carbon storage Due to the significant emissions associated
with treatment and the low likelihood that wildshyfire will encounter a given treatment area forest management that is narrowly focused on C accounting alone would favor the no-treatment scenarios Landscape treatments protected more C in live tree biomass only when large wildfires were simulated While treatment favorability improved with large wildfire simulation the no-treatment scenario still produced fewer emissions than the treatment scenario Given the potential for large wildfire in the region as demonstrated by the 2014 King Fire and the increasing freshyquency of large wildfires and area burned in Calishyfornia expected from climate modeling studies (Lenihan et al 2008 Westerling et al 2011) we suggest that future studies of fuel treatmentndashwildshyfirendashC relationships should incorporate the potenshytial for large wildfires at a frequency greater than those observed over the last 20ndash30 yr Others have argued that treatments to increase forest resilience should be a stand-alone top land management priority independent of other ecosystem values such as carbon sequestration and fire hazard reduction (Stephens et al 2016a) We also note that the potential benefits of fuels
management are not restricted to avoided wildshyfire emissions Here we show that landscape fuel treatments can alter fire hazard across the landshyscape both within and outside of treated stands and have the potential to affect the likelihood of burning and fire intensity within protected Calishyfornia spotted owl habitat Underscoring the risk to sensitive habitat the 2014 King Fire encounshytered 31 PACs within our study area leading to the greatest single-year decline in habitat occushypancy recorded over a 23-yr study period (Jones et al 2016) Modest simulated treatments within activity centers significantly reduced potential fire intensity relative to both the no-treatment landscape and a treatment scenario that did not permit treatment within PACs indicating that active management may be desirable to protect habitat in the long term (Roloff et al 2012)
wwwesajournalsorg 17 January 2017 Volume 8(1) Article e01648
CHIONO ET AL
However treatments conducted outside of owl habitat also reduced wildfire hazard
ACKNOWLEDGMENTS
We are grateful to a number of individuals for sharshying their time and fuel treatment and fire modeling expertise Nicole Vaillant (ArcFuels) Alan Ager and Andrew McMahan (carbon estimation) and Coeli Hoover (harvest simulations in FVS-FFE) Brian Ebert and Dana Walsh of the Eldorado National Forest proshyvided invaluable advice on weather inputs for fire modeling and on designing fuel treatment prescripshytions Ken Somers Operations Forester on the Blodgett Forest Research Station gave advice concerning timshyber management on private land We also thank two anonymous reviewers whose comments greatly improved this article The California Energy Commisshysion provided funding for this project
LITERATURE CITED
Ager A A B Bahro and K Barber 2006 Automating the fireshed assessment process with ArcGIS Pages 163ndash167 in P L Andrews and B W Butler (Comps) Fuels ManagementndashHow to Measure Success Conference Proceedings Portland OR March 28ndash30 2006 Proceedings RMRS-P-41 USDA Forest Service Rocky Mountain Research Station Fort Collins Colorado USA
Ager A A M A Finney B K Kerns and H Maffei 2007 Modeling wildfire risk to northern spotted owl (Strix occidentalis caurina) habitat in Central Oregon USA Forest Ecology and Management 24645ndash56
Ager A A M A Finney A McMahan and J Cathcart 2010 Measuring the effect of fuel treatments on forshyest carbon using landscape risk analysis Natural Hazards and Earth System Science 102515ndash2526
Ager A A N M Vaillant D E Owens S Brittain and J Hamann 2012 Overview and example application of the Landscape Treatment Designer Pages 11 General Technical Report PNW-GTR-859 USDA Forest Service Pacific Northwest Research Station Portland Oregon USA
Barbour M G and R A Minnich 2000 Californian upland forests and woodlands Pages 131ndash164 in M Barbour and W Billings editors North Amerishycan terrestrial vegetation Cambridge University Press Cambridge UK
Bias M A and R Gutimerrez 1992 Habitat associations of California spotted owls in the central Sierra Nevada Journal of Wildlife Management 56584ndash595
Bond M L R Gutierrez A B Franklin W S LaHaye C A May and M E Seamans 2002
Short-term effects of wildfires on spotted owl surshyvival site fidelity mate fidelity and reproductive success Wildlife Society Bulletin 301022ndash1028
Brillinger D H Preisler and J Benoit 2006 Probashybilistic risk assessment for wildfires Environ-metrics 17623ndash633
Campbell J L and A A Ager 2013 Forest wildfire fuel reduction treatments and landscape carbon stocks a sensitivity analysis Journal of Environshymental Management 121124ndash132
Campbell J L M E Harmon and S R Mitchell 2011 Can fuel-reduction treatments really increase forest carbon storage in the western US by reducshying future fire emissions Frontiers in Ecology and the Environment 1083ndash90
Cathcart J A A Ager A McMahan M Finney and B Watt 2010 Carbon benefits from fuel treatshyments Pages 61ndash80 in T B Jain R T Graham and J Sandquist editors Integrated management of carbon sequestration and biomass utilization opportunities in a changing climate Proceedings of the 2009 National Silviculture Workshop Boise Idaho June 15ndash18 2009 USDA Forest Service Proshyceedings RMRS-P-61 Rocky Mountain Research Station Fort Collins Colorado USA
Chatfield A H 2005 Habitat selection by a California spotted owl population a landscape scale analysis using resource selection functions Thesis Univershysity of Minnesota St Paul Minnesota USA
Collins B M H A Kramer K Menning C Dilling-ham D Saah P A Stine and S L Stephens 2013 Modeling hazardous fire potential within a comshypleted fuel treatment network in the northern Sierra Nevada Forest Ecology and Management 310156ndash166
Collins B M S L Stephens J J Moghaddas and J Battles 2010 Challenges and approaches in planshyning fuel treatments across fire-excluded forested landscapes Journal of Forestry 10824ndash31
Collins B M S L Stephens G B Roller and J J Battles 2011 Simulating fire and forest dynamics for a landscape fuel treatment project in the Sierra Nevada Forest Science 5777ndash88
Coppoletta M K E Merriam and B M Collins 2016 Post-fire vegetation and fuel development influences fire severity patterns in reburns Ecologishycal Applications 26686ndash699
Crookston N L and A O Finley 2008 yaimpute an r package for knn imputation Journal of Statistical Software 231ndash16
Crookston N L M Moeur and D L Renner 2002 Userrsquos guide to the most similar neighbor imputashytion program version 2 General Technical Report RMRS-GTR-96 USDA Forest Service Rocky Mountain Research Station Ogden Utah USA
wwwesajournalsorg 18 January 2017 Volume 8(1) Article e01648
CHIONO ET AL
Crosby J and C Chandler 1966 Get the most from your windspeed observations Fire Control Notes 2712ndash13
Dailey S J Fites A Reiner and S Mori 2008 Fire behavior and effects in fuel treatments and proshytected habitat on the Moonlight fire Fire Behavior Assessment Team wwwfsfedusadaptivemana gementprojectsFBATdocsMoonlightFinal_8_6_08 pdf
Dennison P E S C Brewer J D Arnold and M A Moritz 2014 Large wildfire trends in the western United States 1984ndash2011 Geophysical Research Letters 412928ndash2933
Dixon G E 2002 Essential FVS a userrsquos guide to the forest vegetation simulator Pages 193 USDA Forest Service Forest Management Service Center Fort Collins Colorado USA
Dore S T E Kolb M Montes-Helu B W Sullivan W D Winslow S C Hart J P Kaye G W Koch and B A Hungate 2008 Long-term impact of a stand-replacing fire on ecosystem CO2 exchange of a ponderosa pine forest Global Change Biology 141ndash20
Dore S M Montes-Helu S C Hart B A Hungate G W Koch J B Moon A J Finkral and T E Kolb 2012 Recovery of ponderosa pine ecosystem carbon and water fluxes from thinning and stand-replacing fire Global Change Biology 183171ndash3185
Dow C J B M Collins and S L Stephens 2016 Incorporating resource protection constraints in an analysis of landscape fuel-treatment effectiveness in the Northern Sierra Nevada California USA Environmental Management 571ndash15
Eidenshink J B Schwind K Brewer Z Zhu B Quayle and S Howard 2007 A project for monshyitoring trends in burn severity Fire Ecology 33ndash21
Evans A M and A J Finkral 2009 From renewable energy to fire risk reduction a synthesis of biomass harvesting and utilization case studies in US forshyests GCB Bioenergy 1211ndash219
Finkral A J and A M Evans 2008 The effects of a thinning treatment on carbon stocks in a northern Arizona ponderosa pine forest Forest Ecology and Management 2552743ndash2750
Finney M A 2001 Design of regular landscape fuel treatment patterns for modifying fire growth and behavior Forest Science 47219ndash228
Finney M A 2002 Fire growth using minimum travel time methods Canadian Journal of Forest Research 321420ndash1424
Finney M A 2006 An overview of FlamMap fire modeling capabilities Pages 213ndash220 in P L Andrews and B W Butler editors Proceedings of Fuels ManagementndashHow to Measure Success Research Paper RMRS-P-41 USDA Forest Service
Rocky Mountain Research Station Portland Oregon USA
Finney M A R C Seli C W McHugh A A Ager B Bahro and J K Agee 2007 Simulation of longshyterm landscape-level fuel treatment effects on large wildfires International Journal of Wildland Fire 16712ndash727
Fulme P Z J E Crouse J P Roccaforte and E L Kalies 2012 Do thinning andor burning treatments in western USA ponderosa or Jeffrey pine-dominated forests help restore natural fire behavior Forest Ecology and Management 26968ndash81
Gaines W L R J Harrod J Dickinson A L Lyons and K Halupka 2010 Integration of Northern spotted owl habitat and fuels treatments in the eastern Cascades Washington USA Forest Ecolshyogy and Management 2602045ndash2052
Gaines W L R A Strand and S D Piper 1997 Effects of the hatchery complex fires on northern spotted owls in the eastern Washington Cascades Pages 123ndash129 in J N Greenlee editor Proceedings of the Fire Effects on Rare and Endangered Species and Habitats Conference Coeur DrsquoAlene Idaho International Association of Wildfire and Forestry Hot Springs South Dakota USA
Hall S A and I C Burke 2006 Considerations for characterizing fuels as inputs for fire behavior models Forest Ecology and Management 227 102ndash114
Hoover C and S Rebain 2008 The Kane Experimenshytal Forest carbon inventory carbon reporting with FVS Pages 13ndash15 in R N Havis and N L Crookston editors Third Forest Vegetation Simushylator Conference Fort Collins Colorado February 13ndash15 2007 USDA Forest Service Rocky Mountain Research Station Fort Collins Colorado USA
Hurteau M and M North 2009 Fuel treatment effects on tree-based forest carbon storage and emissions under modeled wildfire scenarios Fronshytiers in Ecology and the Environment 7409ndash414
Hurteau M D and M North 2010 Carbon recovery rates following different wildfire risk mitigation treatments Forest Ecology and Management 260 930ndash937
Hurteau M D M T Stoddard and P Z Fulme 2011 The carbon costs of mitigating high-severity wildshyfire in southwestern ponderosa pine Global Change Biology 171516ndash1521
Jenness J S P Beier and J L Ganey 2004 Associashytions between forest fire and Mexican spotted owls Forest Science 50765ndash772
Jones G M R Gutimerrez D J Tempel S A Whitmore W J Berigan and M Z Peery 2016 Megafires an emerging threat to old-forest species Frontiers in Ecology and the Environment 14300ndash306
wwwesajournalsorg 19 January 2017 Volume 8(1) Article e01648
CHIONO ET AL
Laymon S A 1988 Ecology of the spotted owl in the central Sierra Nevada California Dissertation University of California Berkeley California USA
Lenihan J M D Bachelet R P Neilson and R Drapek 2008 Response of vegetation distribution ecosystem productivity and fire to climate change scenarios for California Climatic Change 87215ndash230
Lydersen J M B M Collins E E Knapp G B Roller and S Stephens 2015 Relating fuel loads to overshystorey structure and composition in a fire-excluded Sierra Nevada mixed conifer forest International Journal of Wildland Fire 24484ndash494
Malmsheimer R J Bowyer J Fried E Gee R Islar R Miner I E Munn E Oneil and W C Stewart 2011 Managing forests because carbon matters integrating energy products and land manageshyment policy Journal of Forestry 109S7ndashS50
Marlon J R et al 2012 Long-term perspective on wildfires in the western USA Proceedings of the National Academy of Sciences of the United States of America 109E535ndashE543
Martinson E J and P N Omi 2002 Performance of fuel treatments subjected to wildfires Pages 7ndash13 in P N Omi and L A Joyce editors Conference on Fire Fuel Treatments and Ecological Restorashytion USDA Forest Service Rocky Mountain Research Station Fort Collins Colorado USA
Martinson E J and P N Omi 2013 Fuel treatments and fire severity a meta-analysis Pages 38 USDA Forest Service Rocky Mountain Research Station Fort Collins Colorado USA
Mayer K E and W F Laudenslayer 1988 A guide to wildlife habitats of California California Departshyment of Forestry and Fire Protection Sacramento California USA
McKenzie D Z Gedalof D L Peterson and P Mote 2004 Climatic change wildfire and conservation Conservation Biology 18890ndash902
Mercer D E and J P Prestemon 2005 Comparing production function models for wildfire risk analyshysis in the wildlandndashurban interface Forest Policy and Economics 7782ndash795
Miller J D and H Safford 2012 Trends in wildfire severity 1984 to 2010 in the Sierra Nevada Modoc Plateau and southern Cascades California USA Fire Ecology 841ndash57
Miller J H Safford M Crimmins and A Thode 2009 Quantitative evidence for increasing forest fire severity in the Sierra Nevada and southern Cascade mountains California and Nevada USA Ecosystems 1216ndash32
North M 2012 Managing Sierra Nevada forests PSWshyGTR-237 USDA Forest Service Pacific Southwest Research Station Albany California USA
North M P and M D Hurteau 2011 High-severity wildfire effects on carbon stocks and emissions in fuels treated and untreated forest Forest Ecology and Management 2611115ndash1120
North M M Hurteau and J Innes 2009a Fire supshypression and fuels treatment effects on mixed-conifer carbon stocks and emissions Ecological Applications 191385ndash1396
North M P A Stine K OrsquoHara W Zielinski and S Stephens 2009b An ecosystem management strategy for Sierran mixed-conifer forests General Technical Report PSW-GTR-220 USDA Forest Service Pacific Southwest Research Station Albany California USA
Parisien M-A S Snetsinger J A Greenberg C R Nelson T Schoennagel S Z Dobrowski and M A Moritz 2012 Spatial variability in wildfire probability across the western United States Intershynational Journal of Wildland Fire 21313ndash327
Penman J M Gytarsky T Hiraishi T Krug D Kruger R Pipatti L Buendia K Miwa T Ngara and K Tanabe 2003 Good practice guidance for land use land-use change and forestry Institute for Global Environmental Strategies for the Intergovshyernmental Panel on Climate Change Hayama Kanagawa Japan
Pollet J and P N Omi 2002 Effect of thinning and prescribed burning on crown fire severity in ponderosa pine forests International Journal of Wildland Fire 111ndash10
Prather J W R F Noss and T D Sisk 2008 Real versus perceived conflicts between restoration of ponderosa pine forests and conservation of the Mexican spotted owl Forest Policy and Economics 10140ndash150
Preisler H K D R Brillinger R E Burgan and J Benoit 2004 Probability based models for estimation of wildfire risk International Journal of Wildland Fire 13133ndash142
Rebain S E Reinhardt N Crookston S Beukema W Kurz and J Greenough 2009 The fire and fuels extension to the Forest Vegetation Simulator Addendum to RMRS-GTR-119 USDA Forest Service and ESSA Technologies Ltd Fort Collins Colorado USA
Reinhardt E D and N L Crookston 2003 The fire and fuels extension to the forest vegetation simulashytor Pages 209 RMRS-GTR-116 USDA Forest Sershyvice Rocky Mountain Research Station Ogden Utah USA
Reinhardt E and L Holsinger 2010 Effects of fuel treatments on carbon-disturbance relationshyships in forests of the northern Rocky Mountains Forest Ecology and Management 2591427ndash1435
wwwesajournalsorg 20 January 2017 Volume 8(1) Article e01648
CHIONO ET AL
Reinhardt E D R E Keane D E Calkin and J D Cohen 2008 Objectives and considerations for wildland fuel treatment in forested ecosystems of the interior western United States Forest Ecology and Management 2561997ndash2006
Ritchie M W C N Skinner and T A Hamilton 2007 Probability of tree survival after wildfire in an interior pine forest of northern California effects of thinning and prescribed fire Forest Ecolshyogy and Management 247200ndash208
Roloff G J S P Mealey and J D Bailey 2012 Comshyparative hazard assessment for protected species in a fire-prone landscape Forest Ecology and Manshyagement 2771ndash10
Rothermel R C 1972 A mathematical model for preshydicting fire spread in wildland fuels Research Paper INT-115 USDA Forest Service Intermounshytain Forest and Range Experiment Station Ogden Utah USA
Safford H D 2008 Fire severity in fuel treatments American River Complex fire Tahoe National Forest California Unpublished Report USDA Forest Service Pacific Southwest Region Vallejo California USA
Schmidt D A A H Taylor and C N Skinner 2008 The influence of fuels treatment and landscape arrangement on simulated fire behavior Southern Cascade range California Forest Ecology and Management 2553170ndash3184
Scott J H and R E Burgan 2005 Standard fire behavior fuel models a comprehensive set for use with Rothermelrsquos surface fire spread model General Technical Report RMRS-GTR-153 USDA Forest Service Rocky Mountain Research Station Fort Collins Colorado USA
Scott J H M P Thompson and J W Gilbertson-Day 2016 Examining alternative fuel management strategies and the relative contribution of National Forest System land to wildfire risk to adjacent homesndasha pilot assessment on the Sierra National Forest California USA Forest Ecology and Manshyagement 36229ndash37
Smith J E and L S Heath 2002 A model of forest floor carbon mass for United States forest types Research Paper NE-722 USDA Forest Service Northeastern Research Station Newtown Square Pennsylvania USA
Stephens S L 2005 Forest fire causes and extent on United States Forest Service lands International Journal of Wildland Fire 14213ndash222
Stephens S L B M Collins E Biber and P Z Fulme 2016a US federal fire and forest policy emphasizshying resilience in dry forests Ecosphere 7e01584
Stephens S L J D Miller B M Collins M P North J J Keane and S L Roberts 2016b Wildfire impacts on California Spotted Owl nesting habitat in the Sierra Nevada Ecosphere 7e01584
Stephens S L J J Moghaddas B R Hartsough E E Y Moghaddas and N E Clinton 2009 Fuel treatshyment effects on stand-level carbon pools treatshyment-related emissions and fire risk in a Sierra Nevada mixed-conifer forest Canadian Journal of Forest Research 391538ndash1547
Stephens S L et al 2012 Fuel treatment impacts on estimated wildfire carbon loss from forests in Monshytana Oregon California and Arizona Ecosphere 31ndash17
Tempel D et al 2015 Evaluating short- and longshyterm impacts of fuels treatments and simulated wildfire on an old-forest species Ecosphere 61ndash19
USDA Forest Service 2004 Sierra Nevada Forest Plan Amendment Final supplemental environmental impact statement Record of decision Publication R5-MB-046 USDA Forest Service Pacific Southshywest Region Vallejo California USA
Van Wagner C E 1977 Conditions for the start and spread of crown fire Canadian Journal of Forest Research 723ndash34
Verner J K S McKelvey B R Noon R Gutimerrez G I Gould Jr and T W Beck 1992 Assessment of the current status of the California spotted owl with recommendations for management Pages 3ndash27 in J Verner K S McKelvey B R Noon R Gutimerrez G I Gould Jr and T W Beck edishytors The California Spotted Owl a technical assessment of its current status PSW-GTR-133 USDA Forest Service Albany California USA
Westerling A B Bryant H Preisler T Holmes H Hidalgo T Das and S Shrestha 2011 Climate change and growth scenarios for California wildshyfire Climatic Change 109445ndash463
Westerling A L H G Hidalgo D R Cayan and T W Swetnam 2006 Warming and earlier Spring increase Western US Forest Wildfire Activity Science 313940ndash943
Wiedinmyer C and M D Hurteau 2010 Prescribed fire as a means of reducing forest carbon emissions in the Western United States Environmental Science amp Technology 441926ndash1932
SUPPORTING INFORMATION
Additional Supporting Information may be found online at httponlinelibrarywileycomdoi101002ecs2 1648full
wwwesajournalsorg 21 January 2017 Volume 8(1) Article e01648
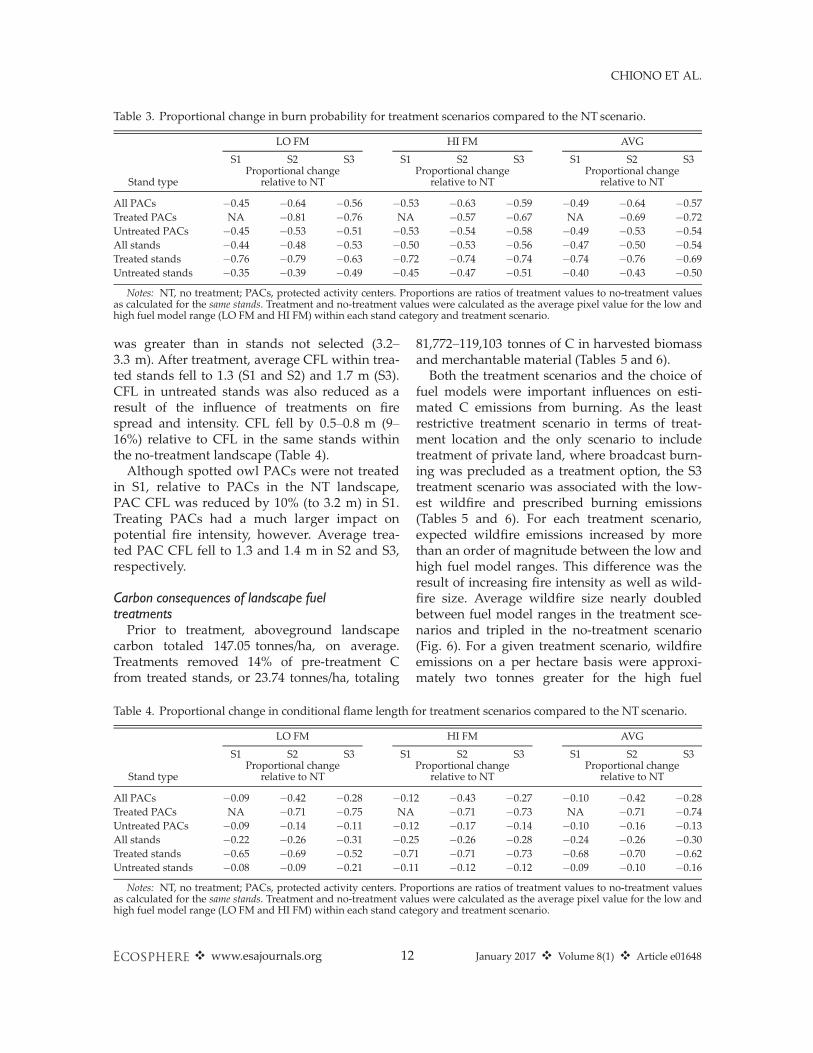
CHIONO ET AL
Table 3 Proportional change in burn probability for treatment scenarios compared to the NT scenario
LO FM HI FM AVG
Stand type
S1 S2 S3 Proportional change
relative to NT
S1 S2 S3 Proportional change
relative to NT
S1 S2 S3 Proportional change
relative to NT
All PACs -045 -064 -056 -053 -063 -059 -049 -064 -057 Treated PACs NA -081 -076 NA -057 -067 NA -069 -072 Untreated PACs -045 -053 -051 -053 -054 -058 -049 -053 -054 All stands Treated stands
-044 -076
-048 -079
-053 -063
-050 -072
-053 -074
-056 -074
-047 -074
-050 -076
-054 -069
Untreated stands -035 -039 -049 -045 -047 -051 -040 -043 -050
Notes NT no treatment PACs protected activity centers Proportions are ratios of treatment values to no-treatment values as calculated for the same stands Treatment and no-treatment values were calculated as the average pixel value for the low and high fuel model range (LO FM and HI FM) within each stand category and treatment scenario
was greater than in stands not selected (32ndash 33 m) After treatment average CFL within treashyted stands fell to 13 (S1 and S2) and 17 m (S3) CFL in untreated stands was also reduced as a result of the influence of treatments on fire spread and intensity CFL fell by 05ndash08 m (9ndash 16) relative to CFL in the same stands within the no-treatment landscape (Table 4)
Although spotted owl PACs were not treated in S1 relative to PACs in the NT landscape PAC CFL was reduced by 10 (to 32 m) in S1 Treating PACs had a much larger impact on potential fire intensity however Average treashyted PAC CFL fell to 13 and 14 m in S2 and S3 respectively
Carbon consequences of landscape fuel treatments
Prior to treatment aboveground landscape carbon totaled 14705 tonnesha on average Treatments removed 14 of pre-treatment C from treated stands or 2374 tonnesha totaling
81772ndash119103 tonnes of C in harvested biomass and merchantable material (Tables 5 and 6) Both the treatment scenarios and the choice of
fuel models were important influences on estishymated C emissions from burning As the least restrictive treatment scenario in terms of treatshyment location and the only scenario to include treatment of private land where broadcast burnshying was precluded as a treatment option the S3 treatment scenario was associated with the lowshyest wildfire and prescribed burning emissions (Tables 5 and 6) For each treatment scenario expected wildfire emissions increased by more than an order of magnitude between the low and high fuel model ranges This difference was the result of increasing fire intensity as well as wildshyfire size Average wildfire size nearly doubled between fuel model ranges in the treatment sceshynarios and tripled in the no-treatment scenario (Fig 6) For a given treatment scenario wildfire emissions on a per hectare basis were approxishymately two tonnes greater for the high fuel
Table 4 Proportional change in conditional flame length for treatment scenarios compared to the NT scenario
LO FM HI FM AVG
Stand type
S1 S2 S3 Proportional change
relative to NT
S1 S2 S3 Proportional change
relative to NT
S1 S2 S3 Proportional change
relative to NT
All PACs -009 -042 -028 -012 -043 -027 -010 -042 -028 Treated PACs NA -071 -075 NA -071 -073 NA -071 -074 Untreated PACs -009 -014 -011 -012 -017 -014 -010 -016 -013 All stands -022 -026 -031 -025 -026 -028 -024 -026 -030 Treated stands -065 -069 -052 -071 -071 -073 -068 -070 -062 Untreated stands -008 -009 -021 -011 -012 -012 -009 -010 -016
Notes NT no treatment PACs protected activity centers Proportions are ratios of treatment values to no-treatment values as calculated for the same stands Treatment and no-treatment values were calculated as the average pixel value for the low and high fuel model range (LO FM and HI FM) within each stand category and treatment scenario
wwwesajournalsorg 12 January 2017 Volume 8(1) Article e01648
CHIONO ET AL
Table 5 Expected biomass carbon expected wildfire C emissions and C harvested and emitted in fuel treatshyments for NT and treatment (S1 S2 S3) scenarios using the low fuel model range in fire modeling
Carbon pool NT S1 S2 S3
Untreated stands Tonnes C Live 5004505 3915044 3695489 3954131 Dead 1845659 1421704 1378824 1466202 Wildfire emissions 2372 1137 1039 904
Treated stands Live 881358 1072625 826366 Dead 260089 299244 220932 All harvested biomass 88773 81772 119103 Prescribed fire emissions 178530 169693 122599 Wildfire emissions 48 56 61
All stands Live 5004505 4796402 4768113 4780497 Dead 1845659 1681793 1678068 1687135 Treatment (harvested and emitted) 267303 251465 241702 Wildfire emissions 2372 1186 1095 965
Grand totals 6852536 6746684 6698741 6710299
Notes LF indicates the large fire scenarios Expected C is that remaining in the core study area following treatment if applishycable and a random ignition and wildfire in the larger buffered study area as estimated from the simulation of many wildfires Live C is that contained in live aboveground herb shrub and tree biomass dead C is the C contained in litter duff woody surshyface fuel and aboveground portions of tree snags NT no treatment
model range than for the low range In contrast to the large influence of fuel model choice on wildfire emissions the effect of fuel model range on prescribed fire emissions was minimal with only a 1 increase in emissions between the low and high fuel model ranges for a given treatment scenario
Although treatment significantly reduced wildshyfire emissions combined emissions from preshyscribed burning on 20 of the landscape and wildfire exceeded wildfire emissions in the no-treatment scenarios (Tables 5 and 6) Relative to the no-treatment scenarios treatment reduced estimated wildfire emissions by approximately 54 (low fuel model range) 59 (high fuel model range) and 45 (large fire scenarios) Yet preshyscribed burning was a far more significant source of emissions than were wildfires of moderate size with emissions from treatment exceeding wildfire emissions by 111259ndash177344 tonnes Even for the large wildfire simulations where landscape treatments nearly halved estimated wildfire emisshysions the combined carbon emissions from preshyscribed burning and wildfire in the treatment scenario surpassed wildfire emissions in the no-treatment scenario by 45 (Table 6 Fig 7)
The total quantity of aboveground C expected to remain on the landscape following treatment
and a randomly ignited wildfire was greatest for the no-treatment scenarios (Tables 5 and 6) For modeled wildfires of moderate size treatment reduced both the live and dead C pools relative to the no-treatment scenarios and terrestrial C in the no-treatment scenarios was 4ndash5 greater (323316 ndash434960 tonnes) than in any of the treatment scenarios (Tables 5 and 6) In comparison under large wildfire conditions the treatment scenario retained slightly more live biomass C~15000 tonshynes or 03 more than the no-treatment scenario However treatment also reduced necromass C by 288000 tonnes (12) resulting in a 3 overall decrease in onsite biomass C relative to an untreshyated landscape (Table 6) The proportional changes in aboveground
biomass C pools between the treatment and no-treatment scenarios are summarized in Table 7 For all treatment scenarios the consumption of duff litter and downed woody fuels with preshyscribed burning contributed to a net reduction in these C pools relative to the untreated landscape Conversely treatments protected more C in the live understory (herb and shrub) poolmdashthe result of reduced wildfire size and intensity in the treatshyment scenarios Treatments in the moderate wildshyfire scenarios reduced live tree biomass C in comparison with no-treatment levels (Fig 8)
wwwesajournalsorg 13 January 2017 Volume 8(1) Article e01648
CHIONO ET AL
Table 6 Expected biomass carbon expected wildfire C emissions and C harvested and emitted in fuel treatshyments for NT and treatment (S1 S2 S3) scenarios using the high fuel model range in fire modeling
Carbon pool NT S1 S2 S3 NT-LF S3-LF
Untreated stands Tonnes C Live 4910239 3879854 3664690 3923358 4586898 3750774 Dead 1912429 1448947 1403313 1489629 2130034 1605591 Wildfire emissions 31831 12934 12001 11293 137622 68061
Treated stands Live 896670 1115918 853503 847374 Dead 280182 325628 238130 247744 All harvested biomass 88773 81772 119103 119103 Prescribed fire emissions 180357 171247 123539 123539 Wildfire emissions 798 951 986 8285
All stands Live 4910239 4776524 4780607 4776861 4586898 4598148 Dead 1912429 1729129 1728941 1727759 2130034 1853334 Treatment (harvested and emitted) 282862 265971 254921 254921 Wildfire emissions 31831 13732 12952 12279 137622 76346
Grand totals 6854499 6802247 6788471 6771820 6854554 6782749
Notes LF indicates the large fire scenarios Expected terrestrial C is that remaining in the core study area following treatshyment if applicable and a random ignition and wildfire in the larger buffered study area as estimated from the simulation of many wildfires Live C is that contained in live aboveground herb shrub and tree biomass dead C is the C contained in litter duff woody surface fuel and aboveground portions of tree snags NT no treatment
Notably in the large modeled wildfire scenarios (NT-LF and S3-LF) treatments resulted in a 400000-tonne increase in landscape-level live tree C over the no-treatment scenario
DISCUSSION
Fuel treatments in protected habitat Because there are often competing objectives
between managing forests for resilience to fire and drought and protecting owl habitat we assessed potential fire occurrence and hazard based on treatment scenarios that included and omitted treatment of PACs Conducting fuels management outside of occupied owl habitat has been suggested as a means of reducing fire risk within occupied sites (Jenness et al 2004 Tempel et al 2015) Ager et al (2007) reported that fuel treatments on 20 of a western Oregon landscape reduced the probability of northern spotted owl nesting and roosting habitat loss by 44 even though that habitat type was not treated As in Ager et al (2007) we observed modifications in fire intensity and burn probability within owl habitat even when it was left untreated In the S1 treatment scenario in which owl activity centers were not eligible for treatment the effect of treatshying other stands reduced both fire hazard (by
9ndash12 for CFL or approximately 04 m) and CBP (by ~45) within PACs It is difficult to assess the significance of this proportional reduction in CBP given that the absolute differences in probabilities were relatively modest (Figs 3 4) Ager et al (2007) noted that allowing treatment of owl habishytat would have significantly reduced estimated habitat loss in their study In this study it is expected that habitat quality may be reduced within treated PACs in the short term through the removal of small-diameter trees (ie lower vertical structural heterogeneity) However two structural attributes for suitable spotted owl nestshying habitat identified by Tempel et al (2015) high canopy cover and large tree density would not be altered While we did not directly estimate habitat loss we did observe much larger reductions in fire hazard within PACs that were treated as meashysured by CFL (71ndash75 reduction equivalent to 2ndash3 m) It should be noted that the effect of wideshyspread treatments within PACs on spotted owl nesting and foraging behavior is unknown One concern with designating some land area
unavailable for treatment is that it may limit the potential for treatments to alter fire behavior across the landscape (eg Finney 2001) Including all stands in the potential treatment pool allows the highest-priority stands with respect to simulated
wwwesajournalsorg 14 January 2017 Volume 8(1) Article e01648
CHIONO ET AL
effects on landscape-level fire behavior The true effect of increasing the land area available for treatshyment may be partially obscured by the varying frequency of treatment prescriptions between sceshynarios For example the hand thinning treatments applied within PACs would be expected to have a milder effect on potential wildfire behavior than more severe prescriptions and hand thinning was twice as common in S2 as in the other scenarios
Terrestrial carbon and burning emissions Landscape treatments reduced wildfire emisshy
sions by reducing the emissions produced per area burned by wildfire as well as average wildfire size On average wildfires in the treated landscapes released 193ndash216 tonnes Cha while wildfires in the untreated landscapes released 234ndash254 tonnes Cha Modeled wildfires decreased in size by 7 (low fuel model range) 36 (high fuel model range) and 25 (large fire scenario) relative to untreated landscapes (Fig 6) Since the burn pershyiod for simulated wildfires was held constant between scenarios this reduction in average wildshyfire size is the result of reduced spread rates derived from fuel treatments Despite the influence of treatments on wildfire
intensity size and expected emissions treatment-related emissions exceeded the avoided wildfire emissions conferred by treatment Prescribed burning in our study a combination of broadcast
Fig 6 Wildfire size relative frequency distributions from wildfire simulations Bar color represents no-treatment (NT) and treatment scenarios (S1ndashS3)
fire spread to be treated which would be expected to achieve the greatest modification of landscape fire behavior and effects In the present study although the land area potentially available for treatment more than doubled between S1 and S3 landscape-level effects of treatment on modeled fire risk and hazard were fairly similar (compared with the no-treatment landscape all-stand CBP fell by 47 and 54 in S1 and S3 while CFL fell by 24 and 30) Dow et al (2016) also found that incorporating modest restrictions on treatment Fig 7 Carbon emissions (tonnes) from wildfire and
area availability (24 of the landscape unavail- prescribed burning X-axis labels indicate no-treatment able) had minimal consequences for modeled fire (NT) and treatment scenarios (S1ndashS3) subscripts size and hazard The modest changes in estimated denote fuel model ranges used in fire modeling
fire metrics we observed may also be due to simi- (L low H high) Large fire scenarios which were
larity in the general pattern of treatment placement modeled with the high fuel model range only are indishybetween scenarios which probably led to similar cated by LF
wwwesajournalsorg 15 January 2017 Volume 8(1) Article e01648
CHIONO ET AL
Table 7 Proportional change in expected carbon by biomass pool for treatment scenarios compared to the no-treatment landscape
Treatment Standing Down dead Forest Herb Live scenario dead wood floor shrub tree
S1 004 -017 -013 014 -004 S2 001 -016 -012 014 -004 S3 -001 -015 -010 016 -004 S3-LF -016 -013 -008 017 000
Notes For example a value of -010 represents a 10 decshyline in biomass C from the no-treatment scenario Treatment and no-treatment values were calculated as the average of low and high fuel model range values except in the case of the large fire (LF) scenarios which were modeled for the high fuel model range only Expected C is that remaining after a random ignition and wildfire in the buffered study area as estimated from simulating 80000 ignitions (LF 40000 ignitions)
C pool categories are those reported in Forest Vegetation Simulator Carbon Reports Standing dead aboveground porshytion of standing dead trees Down dead wood woody surface fuels Forest floor litter and duff Herbshrub herbs and shrubs Live tree aboveground portion of live trees
and pile burning released 111ndash163 tonnes Cha For comparison studies conducted in comparable forest types have estimated prescribed fire emisshysions of 127 tonnes Cha (warm dry ponderosa pine habitat types Reinhardt and Holsinger 2010)
Fig 8 Expected carbon contained in aboveground live and dead tree biomass Expected C is that remainshying in the core study area following treatment (if applishycable) and a single random ignition within the larger buffered study area X-axis labels indicate no-treatment (NT) and treatment scenarios (S1ndashS3) subshyscripts denote fuel model ranges used in fire modeling (L low H high) Large fire scenarios which were modeled for the high fuel model range only are indishycated by LF
and 148 tonnes Cha (an old-growth mixed-conifer reserve in the southern Sierra Nevada North et al 2009a) Relative to the approximately 158000 tonnes C emitted in prescribed burning avoided wildfire emissions at 1186ndash19551 tonnes for wildfires of moderate size were small A simishylar study in southern Oregon with average modshyeled wildfires of 2350 and 3500 ha (treatment and no-treatment scenarios respectively) found that treatments reduced expected wildfire emissions by 6157 tonnes of C (Ager et al 2010) Surface fuels represented with surface fuel
models in commonly used modeling software are the most influential inputs determining preshydicted fire behavior (Hall and Burke 2006) Fire behavior fire sizes and emissions in this study varied according to fuel model assignment highshylighting the importance of selecting the approprishyate fuel model to represent fuel conditions (see Collins et al 2013) We show a 12- to 14-fold change in wildfire emissions due solely to the choice of fuel models (Tables 5 and 6) Indeed the range of fuel models used in recent studies investigating fuel treatments and simulated fire behavior in mixed-conifer forests is noteworthy Incorporating a range of fuel models into analyshyses such that outcome variability can be reported facilitates comparison of effects across studies Our estimates of the aboveground C benefits
of treatment under the moderate wildfire scenarshyios with average fire sizes of le2133 ha are likely conservative The effect of modeled wildfire size on the C consequences of fuel treatment was conshysiderable emphasizing the importance of this variable in studies of the climate benefits of treatshyment Avoided wildfire emissions resulting from treatment increased to 61276 tonnes C when large wildfires (8070ndash10757 ha) were simulated The treatment scenario given large wildfires also protected a greater portion of live tree C If the ~40000-ha King Fire is representative of the magnitude of future wildfires in the region C accounting should improve with respect to treatshyment favorability Similarly if multiple wildfires were to encounter the study area within the effective lifespan of treatments the C gains assoshyciated with avoided emissions in the treatment scenarios would increase Our approach to estimating the C conseshy
quences of fuel treatments has a number of limitashytions A full accounting of treatment effects
wwwesajournalsorg 16 January 2017 Volume 8(1) Article e01648
CHIONO ET AL
would project through time the consequences of both treatment and wildfire Our analysis is static incorporating only the short-term C costs and benefits of treatment Simulating wildfire in the year immediately following treatment maximizes the apparent benefits of treatment Over time as surface fuels accumulate and vegetation regenershyates maintenance would be required to retain the effectiveness of treatments (Martinson and Omi 2013) increasing the C costs of reduced fire hazard In addition the C contained in fire-killed biomass will ultimately be emitted to the atmoshysphere although biomass decay could be delayed through conversion to long-lived wood products such as building materials (Malmsheimer et al 2011) It is also important to note that our analysis did not include stochastic wildfire occurrence Estimates of burn probability in the present study are not estimates of the likelihood of wildfire occurrence based on historical fire sizes and freshyquency (eg Preisler et al 2004 Mercer and Prestemon 2005 Brillinger et al 2006) but rather are conditional on a single randomly ignited wildfire within the buffered study area
CONCLUSIONS
Our findings generally support those of Campshybell et al (2011) who concluded from an analysis of fire-prone western forests that the C costs of treatments are likely to outweigh their benefits under current depressed fire frequencies In a more recent paper Campbell and Ager (2013) conshycluded that ldquonone of the fuel treatment simulation scenarios resulted in increased system carbonrdquo primarily from the low incidences of treated areas being burned by wildfire However our interpreshytation of these findings differs from those disshycussed in Campbell et al (2011) and Campbell and Ager (2013) especially in light of recent and projected future trends in fire activity (Westerling et al 2011 Miller and Safford 2012 Dennison et al 2014) The current divergence of increasing surface air temperatures and low fire activity is unlikely to be sustained further suggesting greater future fire activity (Marlon et al 2012) If increased fire activity is realized then the likelishyhood of a given area being burned in a wildfire increases This differs from the simple increase in stand-level fire frequency modeled by Campbell et al (2011) because increases in fire likelihood are
not necessarily associated with corresponding decreases in fire severity as assumed by Campbell et al (2011) Increased fire likelihood could very well lead to positive feedbacks in fire severity and ultimately to vegetation type conversion (Copposhyletta et al 2016)mdasheffects that would have signifishycant implications for carbon storage Due to the significant emissions associated
with treatment and the low likelihood that wildshyfire will encounter a given treatment area forest management that is narrowly focused on C accounting alone would favor the no-treatment scenarios Landscape treatments protected more C in live tree biomass only when large wildfires were simulated While treatment favorability improved with large wildfire simulation the no-treatment scenario still produced fewer emissions than the treatment scenario Given the potential for large wildfire in the region as demonstrated by the 2014 King Fire and the increasing freshyquency of large wildfires and area burned in Calishyfornia expected from climate modeling studies (Lenihan et al 2008 Westerling et al 2011) we suggest that future studies of fuel treatmentndashwildshyfirendashC relationships should incorporate the potenshytial for large wildfires at a frequency greater than those observed over the last 20ndash30 yr Others have argued that treatments to increase forest resilience should be a stand-alone top land management priority independent of other ecosystem values such as carbon sequestration and fire hazard reduction (Stephens et al 2016a) We also note that the potential benefits of fuels
management are not restricted to avoided wildshyfire emissions Here we show that landscape fuel treatments can alter fire hazard across the landshyscape both within and outside of treated stands and have the potential to affect the likelihood of burning and fire intensity within protected Calishyfornia spotted owl habitat Underscoring the risk to sensitive habitat the 2014 King Fire encounshytered 31 PACs within our study area leading to the greatest single-year decline in habitat occushypancy recorded over a 23-yr study period (Jones et al 2016) Modest simulated treatments within activity centers significantly reduced potential fire intensity relative to both the no-treatment landscape and a treatment scenario that did not permit treatment within PACs indicating that active management may be desirable to protect habitat in the long term (Roloff et al 2012)
wwwesajournalsorg 17 January 2017 Volume 8(1) Article e01648
CHIONO ET AL
However treatments conducted outside of owl habitat also reduced wildfire hazard
ACKNOWLEDGMENTS
We are grateful to a number of individuals for sharshying their time and fuel treatment and fire modeling expertise Nicole Vaillant (ArcFuels) Alan Ager and Andrew McMahan (carbon estimation) and Coeli Hoover (harvest simulations in FVS-FFE) Brian Ebert and Dana Walsh of the Eldorado National Forest proshyvided invaluable advice on weather inputs for fire modeling and on designing fuel treatment prescripshytions Ken Somers Operations Forester on the Blodgett Forest Research Station gave advice concerning timshyber management on private land We also thank two anonymous reviewers whose comments greatly improved this article The California Energy Commisshysion provided funding for this project
LITERATURE CITED
Ager A A B Bahro and K Barber 2006 Automating the fireshed assessment process with ArcGIS Pages 163ndash167 in P L Andrews and B W Butler (Comps) Fuels ManagementndashHow to Measure Success Conference Proceedings Portland OR March 28ndash30 2006 Proceedings RMRS-P-41 USDA Forest Service Rocky Mountain Research Station Fort Collins Colorado USA
Ager A A M A Finney B K Kerns and H Maffei 2007 Modeling wildfire risk to northern spotted owl (Strix occidentalis caurina) habitat in Central Oregon USA Forest Ecology and Management 24645ndash56
Ager A A M A Finney A McMahan and J Cathcart 2010 Measuring the effect of fuel treatments on forshyest carbon using landscape risk analysis Natural Hazards and Earth System Science 102515ndash2526
Ager A A N M Vaillant D E Owens S Brittain and J Hamann 2012 Overview and example application of the Landscape Treatment Designer Pages 11 General Technical Report PNW-GTR-859 USDA Forest Service Pacific Northwest Research Station Portland Oregon USA
Barbour M G and R A Minnich 2000 Californian upland forests and woodlands Pages 131ndash164 in M Barbour and W Billings editors North Amerishycan terrestrial vegetation Cambridge University Press Cambridge UK
Bias M A and R Gutimerrez 1992 Habitat associations of California spotted owls in the central Sierra Nevada Journal of Wildlife Management 56584ndash595
Bond M L R Gutierrez A B Franklin W S LaHaye C A May and M E Seamans 2002
Short-term effects of wildfires on spotted owl surshyvival site fidelity mate fidelity and reproductive success Wildlife Society Bulletin 301022ndash1028
Brillinger D H Preisler and J Benoit 2006 Probashybilistic risk assessment for wildfires Environ-metrics 17623ndash633
Campbell J L and A A Ager 2013 Forest wildfire fuel reduction treatments and landscape carbon stocks a sensitivity analysis Journal of Environshymental Management 121124ndash132
Campbell J L M E Harmon and S R Mitchell 2011 Can fuel-reduction treatments really increase forest carbon storage in the western US by reducshying future fire emissions Frontiers in Ecology and the Environment 1083ndash90
Cathcart J A A Ager A McMahan M Finney and B Watt 2010 Carbon benefits from fuel treatshyments Pages 61ndash80 in T B Jain R T Graham and J Sandquist editors Integrated management of carbon sequestration and biomass utilization opportunities in a changing climate Proceedings of the 2009 National Silviculture Workshop Boise Idaho June 15ndash18 2009 USDA Forest Service Proshyceedings RMRS-P-61 Rocky Mountain Research Station Fort Collins Colorado USA
Chatfield A H 2005 Habitat selection by a California spotted owl population a landscape scale analysis using resource selection functions Thesis Univershysity of Minnesota St Paul Minnesota USA
Collins B M H A Kramer K Menning C Dilling-ham D Saah P A Stine and S L Stephens 2013 Modeling hazardous fire potential within a comshypleted fuel treatment network in the northern Sierra Nevada Forest Ecology and Management 310156ndash166
Collins B M S L Stephens J J Moghaddas and J Battles 2010 Challenges and approaches in planshyning fuel treatments across fire-excluded forested landscapes Journal of Forestry 10824ndash31
Collins B M S L Stephens G B Roller and J J Battles 2011 Simulating fire and forest dynamics for a landscape fuel treatment project in the Sierra Nevada Forest Science 5777ndash88
Coppoletta M K E Merriam and B M Collins 2016 Post-fire vegetation and fuel development influences fire severity patterns in reburns Ecologishycal Applications 26686ndash699
Crookston N L and A O Finley 2008 yaimpute an r package for knn imputation Journal of Statistical Software 231ndash16
Crookston N L M Moeur and D L Renner 2002 Userrsquos guide to the most similar neighbor imputashytion program version 2 General Technical Report RMRS-GTR-96 USDA Forest Service Rocky Mountain Research Station Ogden Utah USA
wwwesajournalsorg 18 January 2017 Volume 8(1) Article e01648
CHIONO ET AL
Crosby J and C Chandler 1966 Get the most from your windspeed observations Fire Control Notes 2712ndash13
Dailey S J Fites A Reiner and S Mori 2008 Fire behavior and effects in fuel treatments and proshytected habitat on the Moonlight fire Fire Behavior Assessment Team wwwfsfedusadaptivemana gementprojectsFBATdocsMoonlightFinal_8_6_08 pdf
Dennison P E S C Brewer J D Arnold and M A Moritz 2014 Large wildfire trends in the western United States 1984ndash2011 Geophysical Research Letters 412928ndash2933
Dixon G E 2002 Essential FVS a userrsquos guide to the forest vegetation simulator Pages 193 USDA Forest Service Forest Management Service Center Fort Collins Colorado USA
Dore S T E Kolb M Montes-Helu B W Sullivan W D Winslow S C Hart J P Kaye G W Koch and B A Hungate 2008 Long-term impact of a stand-replacing fire on ecosystem CO2 exchange of a ponderosa pine forest Global Change Biology 141ndash20
Dore S M Montes-Helu S C Hart B A Hungate G W Koch J B Moon A J Finkral and T E Kolb 2012 Recovery of ponderosa pine ecosystem carbon and water fluxes from thinning and stand-replacing fire Global Change Biology 183171ndash3185
Dow C J B M Collins and S L Stephens 2016 Incorporating resource protection constraints in an analysis of landscape fuel-treatment effectiveness in the Northern Sierra Nevada California USA Environmental Management 571ndash15
Eidenshink J B Schwind K Brewer Z Zhu B Quayle and S Howard 2007 A project for monshyitoring trends in burn severity Fire Ecology 33ndash21
Evans A M and A J Finkral 2009 From renewable energy to fire risk reduction a synthesis of biomass harvesting and utilization case studies in US forshyests GCB Bioenergy 1211ndash219
Finkral A J and A M Evans 2008 The effects of a thinning treatment on carbon stocks in a northern Arizona ponderosa pine forest Forest Ecology and Management 2552743ndash2750
Finney M A 2001 Design of regular landscape fuel treatment patterns for modifying fire growth and behavior Forest Science 47219ndash228
Finney M A 2002 Fire growth using minimum travel time methods Canadian Journal of Forest Research 321420ndash1424
Finney M A 2006 An overview of FlamMap fire modeling capabilities Pages 213ndash220 in P L Andrews and B W Butler editors Proceedings of Fuels ManagementndashHow to Measure Success Research Paper RMRS-P-41 USDA Forest Service
Rocky Mountain Research Station Portland Oregon USA
Finney M A R C Seli C W McHugh A A Ager B Bahro and J K Agee 2007 Simulation of longshyterm landscape-level fuel treatment effects on large wildfires International Journal of Wildland Fire 16712ndash727
Fulme P Z J E Crouse J P Roccaforte and E L Kalies 2012 Do thinning andor burning treatments in western USA ponderosa or Jeffrey pine-dominated forests help restore natural fire behavior Forest Ecology and Management 26968ndash81
Gaines W L R J Harrod J Dickinson A L Lyons and K Halupka 2010 Integration of Northern spotted owl habitat and fuels treatments in the eastern Cascades Washington USA Forest Ecolshyogy and Management 2602045ndash2052
Gaines W L R A Strand and S D Piper 1997 Effects of the hatchery complex fires on northern spotted owls in the eastern Washington Cascades Pages 123ndash129 in J N Greenlee editor Proceedings of the Fire Effects on Rare and Endangered Species and Habitats Conference Coeur DrsquoAlene Idaho International Association of Wildfire and Forestry Hot Springs South Dakota USA
Hall S A and I C Burke 2006 Considerations for characterizing fuels as inputs for fire behavior models Forest Ecology and Management 227 102ndash114
Hoover C and S Rebain 2008 The Kane Experimenshytal Forest carbon inventory carbon reporting with FVS Pages 13ndash15 in R N Havis and N L Crookston editors Third Forest Vegetation Simushylator Conference Fort Collins Colorado February 13ndash15 2007 USDA Forest Service Rocky Mountain Research Station Fort Collins Colorado USA
Hurteau M and M North 2009 Fuel treatment effects on tree-based forest carbon storage and emissions under modeled wildfire scenarios Fronshytiers in Ecology and the Environment 7409ndash414
Hurteau M D and M North 2010 Carbon recovery rates following different wildfire risk mitigation treatments Forest Ecology and Management 260 930ndash937
Hurteau M D M T Stoddard and P Z Fulme 2011 The carbon costs of mitigating high-severity wildshyfire in southwestern ponderosa pine Global Change Biology 171516ndash1521
Jenness J S P Beier and J L Ganey 2004 Associashytions between forest fire and Mexican spotted owls Forest Science 50765ndash772
Jones G M R Gutimerrez D J Tempel S A Whitmore W J Berigan and M Z Peery 2016 Megafires an emerging threat to old-forest species Frontiers in Ecology and the Environment 14300ndash306
wwwesajournalsorg 19 January 2017 Volume 8(1) Article e01648
CHIONO ET AL
Laymon S A 1988 Ecology of the spotted owl in the central Sierra Nevada California Dissertation University of California Berkeley California USA
Lenihan J M D Bachelet R P Neilson and R Drapek 2008 Response of vegetation distribution ecosystem productivity and fire to climate change scenarios for California Climatic Change 87215ndash230
Lydersen J M B M Collins E E Knapp G B Roller and S Stephens 2015 Relating fuel loads to overshystorey structure and composition in a fire-excluded Sierra Nevada mixed conifer forest International Journal of Wildland Fire 24484ndash494
Malmsheimer R J Bowyer J Fried E Gee R Islar R Miner I E Munn E Oneil and W C Stewart 2011 Managing forests because carbon matters integrating energy products and land manageshyment policy Journal of Forestry 109S7ndashS50
Marlon J R et al 2012 Long-term perspective on wildfires in the western USA Proceedings of the National Academy of Sciences of the United States of America 109E535ndashE543
Martinson E J and P N Omi 2002 Performance of fuel treatments subjected to wildfires Pages 7ndash13 in P N Omi and L A Joyce editors Conference on Fire Fuel Treatments and Ecological Restorashytion USDA Forest Service Rocky Mountain Research Station Fort Collins Colorado USA
Martinson E J and P N Omi 2013 Fuel treatments and fire severity a meta-analysis Pages 38 USDA Forest Service Rocky Mountain Research Station Fort Collins Colorado USA
Mayer K E and W F Laudenslayer 1988 A guide to wildlife habitats of California California Departshyment of Forestry and Fire Protection Sacramento California USA
McKenzie D Z Gedalof D L Peterson and P Mote 2004 Climatic change wildfire and conservation Conservation Biology 18890ndash902
Mercer D E and J P Prestemon 2005 Comparing production function models for wildfire risk analyshysis in the wildlandndashurban interface Forest Policy and Economics 7782ndash795
Miller J D and H Safford 2012 Trends in wildfire severity 1984 to 2010 in the Sierra Nevada Modoc Plateau and southern Cascades California USA Fire Ecology 841ndash57
Miller J H Safford M Crimmins and A Thode 2009 Quantitative evidence for increasing forest fire severity in the Sierra Nevada and southern Cascade mountains California and Nevada USA Ecosystems 1216ndash32
North M 2012 Managing Sierra Nevada forests PSWshyGTR-237 USDA Forest Service Pacific Southwest Research Station Albany California USA
North M P and M D Hurteau 2011 High-severity wildfire effects on carbon stocks and emissions in fuels treated and untreated forest Forest Ecology and Management 2611115ndash1120
North M M Hurteau and J Innes 2009a Fire supshypression and fuels treatment effects on mixed-conifer carbon stocks and emissions Ecological Applications 191385ndash1396
North M P A Stine K OrsquoHara W Zielinski and S Stephens 2009b An ecosystem management strategy for Sierran mixed-conifer forests General Technical Report PSW-GTR-220 USDA Forest Service Pacific Southwest Research Station Albany California USA
Parisien M-A S Snetsinger J A Greenberg C R Nelson T Schoennagel S Z Dobrowski and M A Moritz 2012 Spatial variability in wildfire probability across the western United States Intershynational Journal of Wildland Fire 21313ndash327
Penman J M Gytarsky T Hiraishi T Krug D Kruger R Pipatti L Buendia K Miwa T Ngara and K Tanabe 2003 Good practice guidance for land use land-use change and forestry Institute for Global Environmental Strategies for the Intergovshyernmental Panel on Climate Change Hayama Kanagawa Japan
Pollet J and P N Omi 2002 Effect of thinning and prescribed burning on crown fire severity in ponderosa pine forests International Journal of Wildland Fire 111ndash10
Prather J W R F Noss and T D Sisk 2008 Real versus perceived conflicts between restoration of ponderosa pine forests and conservation of the Mexican spotted owl Forest Policy and Economics 10140ndash150
Preisler H K D R Brillinger R E Burgan and J Benoit 2004 Probability based models for estimation of wildfire risk International Journal of Wildland Fire 13133ndash142
Rebain S E Reinhardt N Crookston S Beukema W Kurz and J Greenough 2009 The fire and fuels extension to the Forest Vegetation Simulator Addendum to RMRS-GTR-119 USDA Forest Service and ESSA Technologies Ltd Fort Collins Colorado USA
Reinhardt E D and N L Crookston 2003 The fire and fuels extension to the forest vegetation simulashytor Pages 209 RMRS-GTR-116 USDA Forest Sershyvice Rocky Mountain Research Station Ogden Utah USA
Reinhardt E and L Holsinger 2010 Effects of fuel treatments on carbon-disturbance relationshyships in forests of the northern Rocky Mountains Forest Ecology and Management 2591427ndash1435
wwwesajournalsorg 20 January 2017 Volume 8(1) Article e01648
CHIONO ET AL
Reinhardt E D R E Keane D E Calkin and J D Cohen 2008 Objectives and considerations for wildland fuel treatment in forested ecosystems of the interior western United States Forest Ecology and Management 2561997ndash2006
Ritchie M W C N Skinner and T A Hamilton 2007 Probability of tree survival after wildfire in an interior pine forest of northern California effects of thinning and prescribed fire Forest Ecolshyogy and Management 247200ndash208
Roloff G J S P Mealey and J D Bailey 2012 Comshyparative hazard assessment for protected species in a fire-prone landscape Forest Ecology and Manshyagement 2771ndash10
Rothermel R C 1972 A mathematical model for preshydicting fire spread in wildland fuels Research Paper INT-115 USDA Forest Service Intermounshytain Forest and Range Experiment Station Ogden Utah USA
Safford H D 2008 Fire severity in fuel treatments American River Complex fire Tahoe National Forest California Unpublished Report USDA Forest Service Pacific Southwest Region Vallejo California USA
Schmidt D A A H Taylor and C N Skinner 2008 The influence of fuels treatment and landscape arrangement on simulated fire behavior Southern Cascade range California Forest Ecology and Management 2553170ndash3184
Scott J H and R E Burgan 2005 Standard fire behavior fuel models a comprehensive set for use with Rothermelrsquos surface fire spread model General Technical Report RMRS-GTR-153 USDA Forest Service Rocky Mountain Research Station Fort Collins Colorado USA
Scott J H M P Thompson and J W Gilbertson-Day 2016 Examining alternative fuel management strategies and the relative contribution of National Forest System land to wildfire risk to adjacent homesndasha pilot assessment on the Sierra National Forest California USA Forest Ecology and Manshyagement 36229ndash37
Smith J E and L S Heath 2002 A model of forest floor carbon mass for United States forest types Research Paper NE-722 USDA Forest Service Northeastern Research Station Newtown Square Pennsylvania USA
Stephens S L 2005 Forest fire causes and extent on United States Forest Service lands International Journal of Wildland Fire 14213ndash222
Stephens S L B M Collins E Biber and P Z Fulme 2016a US federal fire and forest policy emphasizshying resilience in dry forests Ecosphere 7e01584
Stephens S L J D Miller B M Collins M P North J J Keane and S L Roberts 2016b Wildfire impacts on California Spotted Owl nesting habitat in the Sierra Nevada Ecosphere 7e01584
Stephens S L J J Moghaddas B R Hartsough E E Y Moghaddas and N E Clinton 2009 Fuel treatshyment effects on stand-level carbon pools treatshyment-related emissions and fire risk in a Sierra Nevada mixed-conifer forest Canadian Journal of Forest Research 391538ndash1547
Stephens S L et al 2012 Fuel treatment impacts on estimated wildfire carbon loss from forests in Monshytana Oregon California and Arizona Ecosphere 31ndash17
Tempel D et al 2015 Evaluating short- and longshyterm impacts of fuels treatments and simulated wildfire on an old-forest species Ecosphere 61ndash19
USDA Forest Service 2004 Sierra Nevada Forest Plan Amendment Final supplemental environmental impact statement Record of decision Publication R5-MB-046 USDA Forest Service Pacific Southshywest Region Vallejo California USA
Van Wagner C E 1977 Conditions for the start and spread of crown fire Canadian Journal of Forest Research 723ndash34
Verner J K S McKelvey B R Noon R Gutimerrez G I Gould Jr and T W Beck 1992 Assessment of the current status of the California spotted owl with recommendations for management Pages 3ndash27 in J Verner K S McKelvey B R Noon R Gutimerrez G I Gould Jr and T W Beck edishytors The California Spotted Owl a technical assessment of its current status PSW-GTR-133 USDA Forest Service Albany California USA
Westerling A B Bryant H Preisler T Holmes H Hidalgo T Das and S Shrestha 2011 Climate change and growth scenarios for California wildshyfire Climatic Change 109445ndash463
Westerling A L H G Hidalgo D R Cayan and T W Swetnam 2006 Warming and earlier Spring increase Western US Forest Wildfire Activity Science 313940ndash943
Wiedinmyer C and M D Hurteau 2010 Prescribed fire as a means of reducing forest carbon emissions in the Western United States Environmental Science amp Technology 441926ndash1932
SUPPORTING INFORMATION
Additional Supporting Information may be found online at httponlinelibrarywileycomdoi101002ecs2 1648full
wwwesajournalsorg 21 January 2017 Volume 8(1) Article e01648
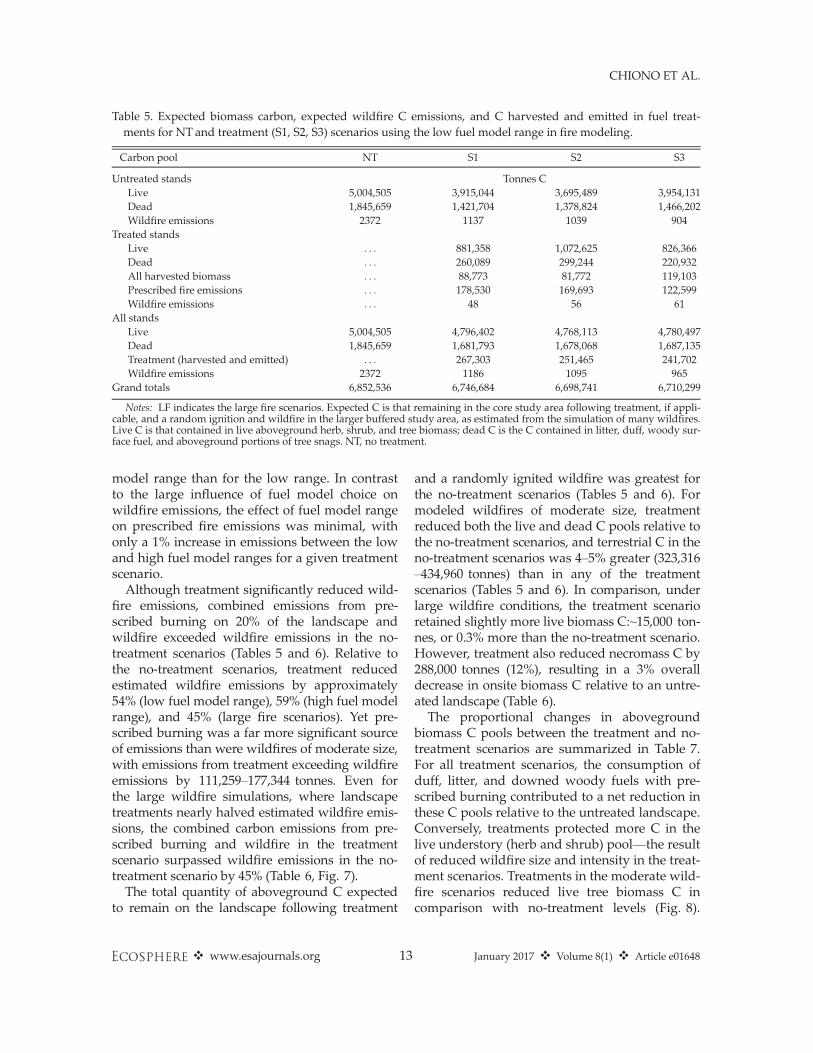
CHIONO ET AL
Table 5 Expected biomass carbon expected wildfire C emissions and C harvested and emitted in fuel treatshyments for NT and treatment (S1 S2 S3) scenarios using the low fuel model range in fire modeling
Carbon pool NT S1 S2 S3
Untreated stands Tonnes C Live 5004505 3915044 3695489 3954131 Dead 1845659 1421704 1378824 1466202 Wildfire emissions 2372 1137 1039 904
Treated stands Live 881358 1072625 826366 Dead 260089 299244 220932 All harvested biomass 88773 81772 119103 Prescribed fire emissions 178530 169693 122599 Wildfire emissions 48 56 61
All stands Live 5004505 4796402 4768113 4780497 Dead 1845659 1681793 1678068 1687135 Treatment (harvested and emitted) 267303 251465 241702 Wildfire emissions 2372 1186 1095 965
Grand totals 6852536 6746684 6698741 6710299
Notes LF indicates the large fire scenarios Expected C is that remaining in the core study area following treatment if applishycable and a random ignition and wildfire in the larger buffered study area as estimated from the simulation of many wildfires Live C is that contained in live aboveground herb shrub and tree biomass dead C is the C contained in litter duff woody surshyface fuel and aboveground portions of tree snags NT no treatment
model range than for the low range In contrast to the large influence of fuel model choice on wildfire emissions the effect of fuel model range on prescribed fire emissions was minimal with only a 1 increase in emissions between the low and high fuel model ranges for a given treatment scenario
Although treatment significantly reduced wildshyfire emissions combined emissions from preshyscribed burning on 20 of the landscape and wildfire exceeded wildfire emissions in the no-treatment scenarios (Tables 5 and 6) Relative to the no-treatment scenarios treatment reduced estimated wildfire emissions by approximately 54 (low fuel model range) 59 (high fuel model range) and 45 (large fire scenarios) Yet preshyscribed burning was a far more significant source of emissions than were wildfires of moderate size with emissions from treatment exceeding wildfire emissions by 111259ndash177344 tonnes Even for the large wildfire simulations where landscape treatments nearly halved estimated wildfire emisshysions the combined carbon emissions from preshyscribed burning and wildfire in the treatment scenario surpassed wildfire emissions in the no-treatment scenario by 45 (Table 6 Fig 7)
The total quantity of aboveground C expected to remain on the landscape following treatment
and a randomly ignited wildfire was greatest for the no-treatment scenarios (Tables 5 and 6) For modeled wildfires of moderate size treatment reduced both the live and dead C pools relative to the no-treatment scenarios and terrestrial C in the no-treatment scenarios was 4ndash5 greater (323316 ndash434960 tonnes) than in any of the treatment scenarios (Tables 5 and 6) In comparison under large wildfire conditions the treatment scenario retained slightly more live biomass C~15000 tonshynes or 03 more than the no-treatment scenario However treatment also reduced necromass C by 288000 tonnes (12) resulting in a 3 overall decrease in onsite biomass C relative to an untreshyated landscape (Table 6) The proportional changes in aboveground
biomass C pools between the treatment and no-treatment scenarios are summarized in Table 7 For all treatment scenarios the consumption of duff litter and downed woody fuels with preshyscribed burning contributed to a net reduction in these C pools relative to the untreated landscape Conversely treatments protected more C in the live understory (herb and shrub) poolmdashthe result of reduced wildfire size and intensity in the treatshyment scenarios Treatments in the moderate wildshyfire scenarios reduced live tree biomass C in comparison with no-treatment levels (Fig 8)
wwwesajournalsorg 13 January 2017 Volume 8(1) Article e01648
CHIONO ET AL
Table 6 Expected biomass carbon expected wildfire C emissions and C harvested and emitted in fuel treatshyments for NT and treatment (S1 S2 S3) scenarios using the high fuel model range in fire modeling
Carbon pool NT S1 S2 S3 NT-LF S3-LF
Untreated stands Tonnes C Live 4910239 3879854 3664690 3923358 4586898 3750774 Dead 1912429 1448947 1403313 1489629 2130034 1605591 Wildfire emissions 31831 12934 12001 11293 137622 68061
Treated stands Live 896670 1115918 853503 847374 Dead 280182 325628 238130 247744 All harvested biomass 88773 81772 119103 119103 Prescribed fire emissions 180357 171247 123539 123539 Wildfire emissions 798 951 986 8285
All stands Live 4910239 4776524 4780607 4776861 4586898 4598148 Dead 1912429 1729129 1728941 1727759 2130034 1853334 Treatment (harvested and emitted) 282862 265971 254921 254921 Wildfire emissions 31831 13732 12952 12279 137622 76346
Grand totals 6854499 6802247 6788471 6771820 6854554 6782749
Notes LF indicates the large fire scenarios Expected terrestrial C is that remaining in the core study area following treatshyment if applicable and a random ignition and wildfire in the larger buffered study area as estimated from the simulation of many wildfires Live C is that contained in live aboveground herb shrub and tree biomass dead C is the C contained in litter duff woody surface fuel and aboveground portions of tree snags NT no treatment
Notably in the large modeled wildfire scenarios (NT-LF and S3-LF) treatments resulted in a 400000-tonne increase in landscape-level live tree C over the no-treatment scenario
DISCUSSION
Fuel treatments in protected habitat Because there are often competing objectives
between managing forests for resilience to fire and drought and protecting owl habitat we assessed potential fire occurrence and hazard based on treatment scenarios that included and omitted treatment of PACs Conducting fuels management outside of occupied owl habitat has been suggested as a means of reducing fire risk within occupied sites (Jenness et al 2004 Tempel et al 2015) Ager et al (2007) reported that fuel treatments on 20 of a western Oregon landscape reduced the probability of northern spotted owl nesting and roosting habitat loss by 44 even though that habitat type was not treated As in Ager et al (2007) we observed modifications in fire intensity and burn probability within owl habitat even when it was left untreated In the S1 treatment scenario in which owl activity centers were not eligible for treatment the effect of treatshying other stands reduced both fire hazard (by
9ndash12 for CFL or approximately 04 m) and CBP (by ~45) within PACs It is difficult to assess the significance of this proportional reduction in CBP given that the absolute differences in probabilities were relatively modest (Figs 3 4) Ager et al (2007) noted that allowing treatment of owl habishytat would have significantly reduced estimated habitat loss in their study In this study it is expected that habitat quality may be reduced within treated PACs in the short term through the removal of small-diameter trees (ie lower vertical structural heterogeneity) However two structural attributes for suitable spotted owl nestshying habitat identified by Tempel et al (2015) high canopy cover and large tree density would not be altered While we did not directly estimate habitat loss we did observe much larger reductions in fire hazard within PACs that were treated as meashysured by CFL (71ndash75 reduction equivalent to 2ndash3 m) It should be noted that the effect of wideshyspread treatments within PACs on spotted owl nesting and foraging behavior is unknown One concern with designating some land area
unavailable for treatment is that it may limit the potential for treatments to alter fire behavior across the landscape (eg Finney 2001) Including all stands in the potential treatment pool allows the highest-priority stands with respect to simulated
wwwesajournalsorg 14 January 2017 Volume 8(1) Article e01648
CHIONO ET AL
effects on landscape-level fire behavior The true effect of increasing the land area available for treatshyment may be partially obscured by the varying frequency of treatment prescriptions between sceshynarios For example the hand thinning treatments applied within PACs would be expected to have a milder effect on potential wildfire behavior than more severe prescriptions and hand thinning was twice as common in S2 as in the other scenarios
Terrestrial carbon and burning emissions Landscape treatments reduced wildfire emisshy
sions by reducing the emissions produced per area burned by wildfire as well as average wildfire size On average wildfires in the treated landscapes released 193ndash216 tonnes Cha while wildfires in the untreated landscapes released 234ndash254 tonnes Cha Modeled wildfires decreased in size by 7 (low fuel model range) 36 (high fuel model range) and 25 (large fire scenario) relative to untreated landscapes (Fig 6) Since the burn pershyiod for simulated wildfires was held constant between scenarios this reduction in average wildshyfire size is the result of reduced spread rates derived from fuel treatments Despite the influence of treatments on wildfire
intensity size and expected emissions treatment-related emissions exceeded the avoided wildfire emissions conferred by treatment Prescribed burning in our study a combination of broadcast
Fig 6 Wildfire size relative frequency distributions from wildfire simulations Bar color represents no-treatment (NT) and treatment scenarios (S1ndashS3)
fire spread to be treated which would be expected to achieve the greatest modification of landscape fire behavior and effects In the present study although the land area potentially available for treatment more than doubled between S1 and S3 landscape-level effects of treatment on modeled fire risk and hazard were fairly similar (compared with the no-treatment landscape all-stand CBP fell by 47 and 54 in S1 and S3 while CFL fell by 24 and 30) Dow et al (2016) also found that incorporating modest restrictions on treatment Fig 7 Carbon emissions (tonnes) from wildfire and
area availability (24 of the landscape unavail- prescribed burning X-axis labels indicate no-treatment able) had minimal consequences for modeled fire (NT) and treatment scenarios (S1ndashS3) subscripts size and hazard The modest changes in estimated denote fuel model ranges used in fire modeling
fire metrics we observed may also be due to simi- (L low H high) Large fire scenarios which were
larity in the general pattern of treatment placement modeled with the high fuel model range only are indishybetween scenarios which probably led to similar cated by LF
wwwesajournalsorg 15 January 2017 Volume 8(1) Article e01648
CHIONO ET AL
Table 7 Proportional change in expected carbon by biomass pool for treatment scenarios compared to the no-treatment landscape
Treatment Standing Down dead Forest Herb Live scenario dead wood floor shrub tree
S1 004 -017 -013 014 -004 S2 001 -016 -012 014 -004 S3 -001 -015 -010 016 -004 S3-LF -016 -013 -008 017 000
Notes For example a value of -010 represents a 10 decshyline in biomass C from the no-treatment scenario Treatment and no-treatment values were calculated as the average of low and high fuel model range values except in the case of the large fire (LF) scenarios which were modeled for the high fuel model range only Expected C is that remaining after a random ignition and wildfire in the buffered study area as estimated from simulating 80000 ignitions (LF 40000 ignitions)
C pool categories are those reported in Forest Vegetation Simulator Carbon Reports Standing dead aboveground porshytion of standing dead trees Down dead wood woody surface fuels Forest floor litter and duff Herbshrub herbs and shrubs Live tree aboveground portion of live trees
and pile burning released 111ndash163 tonnes Cha For comparison studies conducted in comparable forest types have estimated prescribed fire emisshysions of 127 tonnes Cha (warm dry ponderosa pine habitat types Reinhardt and Holsinger 2010)
Fig 8 Expected carbon contained in aboveground live and dead tree biomass Expected C is that remainshying in the core study area following treatment (if applishycable) and a single random ignition within the larger buffered study area X-axis labels indicate no-treatment (NT) and treatment scenarios (S1ndashS3) subshyscripts denote fuel model ranges used in fire modeling (L low H high) Large fire scenarios which were modeled for the high fuel model range only are indishycated by LF
and 148 tonnes Cha (an old-growth mixed-conifer reserve in the southern Sierra Nevada North et al 2009a) Relative to the approximately 158000 tonnes C emitted in prescribed burning avoided wildfire emissions at 1186ndash19551 tonnes for wildfires of moderate size were small A simishylar study in southern Oregon with average modshyeled wildfires of 2350 and 3500 ha (treatment and no-treatment scenarios respectively) found that treatments reduced expected wildfire emissions by 6157 tonnes of C (Ager et al 2010) Surface fuels represented with surface fuel
models in commonly used modeling software are the most influential inputs determining preshydicted fire behavior (Hall and Burke 2006) Fire behavior fire sizes and emissions in this study varied according to fuel model assignment highshylighting the importance of selecting the approprishyate fuel model to represent fuel conditions (see Collins et al 2013) We show a 12- to 14-fold change in wildfire emissions due solely to the choice of fuel models (Tables 5 and 6) Indeed the range of fuel models used in recent studies investigating fuel treatments and simulated fire behavior in mixed-conifer forests is noteworthy Incorporating a range of fuel models into analyshyses such that outcome variability can be reported facilitates comparison of effects across studies Our estimates of the aboveground C benefits
of treatment under the moderate wildfire scenarshyios with average fire sizes of le2133 ha are likely conservative The effect of modeled wildfire size on the C consequences of fuel treatment was conshysiderable emphasizing the importance of this variable in studies of the climate benefits of treatshyment Avoided wildfire emissions resulting from treatment increased to 61276 tonnes C when large wildfires (8070ndash10757 ha) were simulated The treatment scenario given large wildfires also protected a greater portion of live tree C If the ~40000-ha King Fire is representative of the magnitude of future wildfires in the region C accounting should improve with respect to treatshyment favorability Similarly if multiple wildfires were to encounter the study area within the effective lifespan of treatments the C gains assoshyciated with avoided emissions in the treatment scenarios would increase Our approach to estimating the C conseshy
quences of fuel treatments has a number of limitashytions A full accounting of treatment effects
wwwesajournalsorg 16 January 2017 Volume 8(1) Article e01648
CHIONO ET AL
would project through time the consequences of both treatment and wildfire Our analysis is static incorporating only the short-term C costs and benefits of treatment Simulating wildfire in the year immediately following treatment maximizes the apparent benefits of treatment Over time as surface fuels accumulate and vegetation regenershyates maintenance would be required to retain the effectiveness of treatments (Martinson and Omi 2013) increasing the C costs of reduced fire hazard In addition the C contained in fire-killed biomass will ultimately be emitted to the atmoshysphere although biomass decay could be delayed through conversion to long-lived wood products such as building materials (Malmsheimer et al 2011) It is also important to note that our analysis did not include stochastic wildfire occurrence Estimates of burn probability in the present study are not estimates of the likelihood of wildfire occurrence based on historical fire sizes and freshyquency (eg Preisler et al 2004 Mercer and Prestemon 2005 Brillinger et al 2006) but rather are conditional on a single randomly ignited wildfire within the buffered study area
CONCLUSIONS
Our findings generally support those of Campshybell et al (2011) who concluded from an analysis of fire-prone western forests that the C costs of treatments are likely to outweigh their benefits under current depressed fire frequencies In a more recent paper Campbell and Ager (2013) conshycluded that ldquonone of the fuel treatment simulation scenarios resulted in increased system carbonrdquo primarily from the low incidences of treated areas being burned by wildfire However our interpreshytation of these findings differs from those disshycussed in Campbell et al (2011) and Campbell and Ager (2013) especially in light of recent and projected future trends in fire activity (Westerling et al 2011 Miller and Safford 2012 Dennison et al 2014) The current divergence of increasing surface air temperatures and low fire activity is unlikely to be sustained further suggesting greater future fire activity (Marlon et al 2012) If increased fire activity is realized then the likelishyhood of a given area being burned in a wildfire increases This differs from the simple increase in stand-level fire frequency modeled by Campbell et al (2011) because increases in fire likelihood are
not necessarily associated with corresponding decreases in fire severity as assumed by Campbell et al (2011) Increased fire likelihood could very well lead to positive feedbacks in fire severity and ultimately to vegetation type conversion (Copposhyletta et al 2016)mdasheffects that would have signifishycant implications for carbon storage Due to the significant emissions associated
with treatment and the low likelihood that wildshyfire will encounter a given treatment area forest management that is narrowly focused on C accounting alone would favor the no-treatment scenarios Landscape treatments protected more C in live tree biomass only when large wildfires were simulated While treatment favorability improved with large wildfire simulation the no-treatment scenario still produced fewer emissions than the treatment scenario Given the potential for large wildfire in the region as demonstrated by the 2014 King Fire and the increasing freshyquency of large wildfires and area burned in Calishyfornia expected from climate modeling studies (Lenihan et al 2008 Westerling et al 2011) we suggest that future studies of fuel treatmentndashwildshyfirendashC relationships should incorporate the potenshytial for large wildfires at a frequency greater than those observed over the last 20ndash30 yr Others have argued that treatments to increase forest resilience should be a stand-alone top land management priority independent of other ecosystem values such as carbon sequestration and fire hazard reduction (Stephens et al 2016a) We also note that the potential benefits of fuels
management are not restricted to avoided wildshyfire emissions Here we show that landscape fuel treatments can alter fire hazard across the landshyscape both within and outside of treated stands and have the potential to affect the likelihood of burning and fire intensity within protected Calishyfornia spotted owl habitat Underscoring the risk to sensitive habitat the 2014 King Fire encounshytered 31 PACs within our study area leading to the greatest single-year decline in habitat occushypancy recorded over a 23-yr study period (Jones et al 2016) Modest simulated treatments within activity centers significantly reduced potential fire intensity relative to both the no-treatment landscape and a treatment scenario that did not permit treatment within PACs indicating that active management may be desirable to protect habitat in the long term (Roloff et al 2012)
wwwesajournalsorg 17 January 2017 Volume 8(1) Article e01648
CHIONO ET AL
However treatments conducted outside of owl habitat also reduced wildfire hazard
ACKNOWLEDGMENTS
We are grateful to a number of individuals for sharshying their time and fuel treatment and fire modeling expertise Nicole Vaillant (ArcFuels) Alan Ager and Andrew McMahan (carbon estimation) and Coeli Hoover (harvest simulations in FVS-FFE) Brian Ebert and Dana Walsh of the Eldorado National Forest proshyvided invaluable advice on weather inputs for fire modeling and on designing fuel treatment prescripshytions Ken Somers Operations Forester on the Blodgett Forest Research Station gave advice concerning timshyber management on private land We also thank two anonymous reviewers whose comments greatly improved this article The California Energy Commisshysion provided funding for this project
LITERATURE CITED
Ager A A B Bahro and K Barber 2006 Automating the fireshed assessment process with ArcGIS Pages 163ndash167 in P L Andrews and B W Butler (Comps) Fuels ManagementndashHow to Measure Success Conference Proceedings Portland OR March 28ndash30 2006 Proceedings RMRS-P-41 USDA Forest Service Rocky Mountain Research Station Fort Collins Colorado USA
Ager A A M A Finney B K Kerns and H Maffei 2007 Modeling wildfire risk to northern spotted owl (Strix occidentalis caurina) habitat in Central Oregon USA Forest Ecology and Management 24645ndash56
Ager A A M A Finney A McMahan and J Cathcart 2010 Measuring the effect of fuel treatments on forshyest carbon using landscape risk analysis Natural Hazards and Earth System Science 102515ndash2526
Ager A A N M Vaillant D E Owens S Brittain and J Hamann 2012 Overview and example application of the Landscape Treatment Designer Pages 11 General Technical Report PNW-GTR-859 USDA Forest Service Pacific Northwest Research Station Portland Oregon USA
Barbour M G and R A Minnich 2000 Californian upland forests and woodlands Pages 131ndash164 in M Barbour and W Billings editors North Amerishycan terrestrial vegetation Cambridge University Press Cambridge UK
Bias M A and R Gutimerrez 1992 Habitat associations of California spotted owls in the central Sierra Nevada Journal of Wildlife Management 56584ndash595
Bond M L R Gutierrez A B Franklin W S LaHaye C A May and M E Seamans 2002
Short-term effects of wildfires on spotted owl surshyvival site fidelity mate fidelity and reproductive success Wildlife Society Bulletin 301022ndash1028
Brillinger D H Preisler and J Benoit 2006 Probashybilistic risk assessment for wildfires Environ-metrics 17623ndash633
Campbell J L and A A Ager 2013 Forest wildfire fuel reduction treatments and landscape carbon stocks a sensitivity analysis Journal of Environshymental Management 121124ndash132
Campbell J L M E Harmon and S R Mitchell 2011 Can fuel-reduction treatments really increase forest carbon storage in the western US by reducshying future fire emissions Frontiers in Ecology and the Environment 1083ndash90
Cathcart J A A Ager A McMahan M Finney and B Watt 2010 Carbon benefits from fuel treatshyments Pages 61ndash80 in T B Jain R T Graham and J Sandquist editors Integrated management of carbon sequestration and biomass utilization opportunities in a changing climate Proceedings of the 2009 National Silviculture Workshop Boise Idaho June 15ndash18 2009 USDA Forest Service Proshyceedings RMRS-P-61 Rocky Mountain Research Station Fort Collins Colorado USA
Chatfield A H 2005 Habitat selection by a California spotted owl population a landscape scale analysis using resource selection functions Thesis Univershysity of Minnesota St Paul Minnesota USA
Collins B M H A Kramer K Menning C Dilling-ham D Saah P A Stine and S L Stephens 2013 Modeling hazardous fire potential within a comshypleted fuel treatment network in the northern Sierra Nevada Forest Ecology and Management 310156ndash166
Collins B M S L Stephens J J Moghaddas and J Battles 2010 Challenges and approaches in planshyning fuel treatments across fire-excluded forested landscapes Journal of Forestry 10824ndash31
Collins B M S L Stephens G B Roller and J J Battles 2011 Simulating fire and forest dynamics for a landscape fuel treatment project in the Sierra Nevada Forest Science 5777ndash88
Coppoletta M K E Merriam and B M Collins 2016 Post-fire vegetation and fuel development influences fire severity patterns in reburns Ecologishycal Applications 26686ndash699
Crookston N L and A O Finley 2008 yaimpute an r package for knn imputation Journal of Statistical Software 231ndash16
Crookston N L M Moeur and D L Renner 2002 Userrsquos guide to the most similar neighbor imputashytion program version 2 General Technical Report RMRS-GTR-96 USDA Forest Service Rocky Mountain Research Station Ogden Utah USA
wwwesajournalsorg 18 January 2017 Volume 8(1) Article e01648
CHIONO ET AL
Crosby J and C Chandler 1966 Get the most from your windspeed observations Fire Control Notes 2712ndash13
Dailey S J Fites A Reiner and S Mori 2008 Fire behavior and effects in fuel treatments and proshytected habitat on the Moonlight fire Fire Behavior Assessment Team wwwfsfedusadaptivemana gementprojectsFBATdocsMoonlightFinal_8_6_08 pdf
Dennison P E S C Brewer J D Arnold and M A Moritz 2014 Large wildfire trends in the western United States 1984ndash2011 Geophysical Research Letters 412928ndash2933
Dixon G E 2002 Essential FVS a userrsquos guide to the forest vegetation simulator Pages 193 USDA Forest Service Forest Management Service Center Fort Collins Colorado USA
Dore S T E Kolb M Montes-Helu B W Sullivan W D Winslow S C Hart J P Kaye G W Koch and B A Hungate 2008 Long-term impact of a stand-replacing fire on ecosystem CO2 exchange of a ponderosa pine forest Global Change Biology 141ndash20
Dore S M Montes-Helu S C Hart B A Hungate G W Koch J B Moon A J Finkral and T E Kolb 2012 Recovery of ponderosa pine ecosystem carbon and water fluxes from thinning and stand-replacing fire Global Change Biology 183171ndash3185
Dow C J B M Collins and S L Stephens 2016 Incorporating resource protection constraints in an analysis of landscape fuel-treatment effectiveness in the Northern Sierra Nevada California USA Environmental Management 571ndash15
Eidenshink J B Schwind K Brewer Z Zhu B Quayle and S Howard 2007 A project for monshyitoring trends in burn severity Fire Ecology 33ndash21
Evans A M and A J Finkral 2009 From renewable energy to fire risk reduction a synthesis of biomass harvesting and utilization case studies in US forshyests GCB Bioenergy 1211ndash219
Finkral A J and A M Evans 2008 The effects of a thinning treatment on carbon stocks in a northern Arizona ponderosa pine forest Forest Ecology and Management 2552743ndash2750
Finney M A 2001 Design of regular landscape fuel treatment patterns for modifying fire growth and behavior Forest Science 47219ndash228
Finney M A 2002 Fire growth using minimum travel time methods Canadian Journal of Forest Research 321420ndash1424
Finney M A 2006 An overview of FlamMap fire modeling capabilities Pages 213ndash220 in P L Andrews and B W Butler editors Proceedings of Fuels ManagementndashHow to Measure Success Research Paper RMRS-P-41 USDA Forest Service
Rocky Mountain Research Station Portland Oregon USA
Finney M A R C Seli C W McHugh A A Ager B Bahro and J K Agee 2007 Simulation of longshyterm landscape-level fuel treatment effects on large wildfires International Journal of Wildland Fire 16712ndash727
Fulme P Z J E Crouse J P Roccaforte and E L Kalies 2012 Do thinning andor burning treatments in western USA ponderosa or Jeffrey pine-dominated forests help restore natural fire behavior Forest Ecology and Management 26968ndash81
Gaines W L R J Harrod J Dickinson A L Lyons and K Halupka 2010 Integration of Northern spotted owl habitat and fuels treatments in the eastern Cascades Washington USA Forest Ecolshyogy and Management 2602045ndash2052
Gaines W L R A Strand and S D Piper 1997 Effects of the hatchery complex fires on northern spotted owls in the eastern Washington Cascades Pages 123ndash129 in J N Greenlee editor Proceedings of the Fire Effects on Rare and Endangered Species and Habitats Conference Coeur DrsquoAlene Idaho International Association of Wildfire and Forestry Hot Springs South Dakota USA
Hall S A and I C Burke 2006 Considerations for characterizing fuels as inputs for fire behavior models Forest Ecology and Management 227 102ndash114
Hoover C and S Rebain 2008 The Kane Experimenshytal Forest carbon inventory carbon reporting with FVS Pages 13ndash15 in R N Havis and N L Crookston editors Third Forest Vegetation Simushylator Conference Fort Collins Colorado February 13ndash15 2007 USDA Forest Service Rocky Mountain Research Station Fort Collins Colorado USA
Hurteau M and M North 2009 Fuel treatment effects on tree-based forest carbon storage and emissions under modeled wildfire scenarios Fronshytiers in Ecology and the Environment 7409ndash414
Hurteau M D and M North 2010 Carbon recovery rates following different wildfire risk mitigation treatments Forest Ecology and Management 260 930ndash937
Hurteau M D M T Stoddard and P Z Fulme 2011 The carbon costs of mitigating high-severity wildshyfire in southwestern ponderosa pine Global Change Biology 171516ndash1521
Jenness J S P Beier and J L Ganey 2004 Associashytions between forest fire and Mexican spotted owls Forest Science 50765ndash772
Jones G M R Gutimerrez D J Tempel S A Whitmore W J Berigan and M Z Peery 2016 Megafires an emerging threat to old-forest species Frontiers in Ecology and the Environment 14300ndash306
wwwesajournalsorg 19 January 2017 Volume 8(1) Article e01648
CHIONO ET AL
Laymon S A 1988 Ecology of the spotted owl in the central Sierra Nevada California Dissertation University of California Berkeley California USA
Lenihan J M D Bachelet R P Neilson and R Drapek 2008 Response of vegetation distribution ecosystem productivity and fire to climate change scenarios for California Climatic Change 87215ndash230
Lydersen J M B M Collins E E Knapp G B Roller and S Stephens 2015 Relating fuel loads to overshystorey structure and composition in a fire-excluded Sierra Nevada mixed conifer forest International Journal of Wildland Fire 24484ndash494
Malmsheimer R J Bowyer J Fried E Gee R Islar R Miner I E Munn E Oneil and W C Stewart 2011 Managing forests because carbon matters integrating energy products and land manageshyment policy Journal of Forestry 109S7ndashS50
Marlon J R et al 2012 Long-term perspective on wildfires in the western USA Proceedings of the National Academy of Sciences of the United States of America 109E535ndashE543
Martinson E J and P N Omi 2002 Performance of fuel treatments subjected to wildfires Pages 7ndash13 in P N Omi and L A Joyce editors Conference on Fire Fuel Treatments and Ecological Restorashytion USDA Forest Service Rocky Mountain Research Station Fort Collins Colorado USA
Martinson E J and P N Omi 2013 Fuel treatments and fire severity a meta-analysis Pages 38 USDA Forest Service Rocky Mountain Research Station Fort Collins Colorado USA
Mayer K E and W F Laudenslayer 1988 A guide to wildlife habitats of California California Departshyment of Forestry and Fire Protection Sacramento California USA
McKenzie D Z Gedalof D L Peterson and P Mote 2004 Climatic change wildfire and conservation Conservation Biology 18890ndash902
Mercer D E and J P Prestemon 2005 Comparing production function models for wildfire risk analyshysis in the wildlandndashurban interface Forest Policy and Economics 7782ndash795
Miller J D and H Safford 2012 Trends in wildfire severity 1984 to 2010 in the Sierra Nevada Modoc Plateau and southern Cascades California USA Fire Ecology 841ndash57
Miller J H Safford M Crimmins and A Thode 2009 Quantitative evidence for increasing forest fire severity in the Sierra Nevada and southern Cascade mountains California and Nevada USA Ecosystems 1216ndash32
North M 2012 Managing Sierra Nevada forests PSWshyGTR-237 USDA Forest Service Pacific Southwest Research Station Albany California USA
North M P and M D Hurteau 2011 High-severity wildfire effects on carbon stocks and emissions in fuels treated and untreated forest Forest Ecology and Management 2611115ndash1120
North M M Hurteau and J Innes 2009a Fire supshypression and fuels treatment effects on mixed-conifer carbon stocks and emissions Ecological Applications 191385ndash1396
North M P A Stine K OrsquoHara W Zielinski and S Stephens 2009b An ecosystem management strategy for Sierran mixed-conifer forests General Technical Report PSW-GTR-220 USDA Forest Service Pacific Southwest Research Station Albany California USA
Parisien M-A S Snetsinger J A Greenberg C R Nelson T Schoennagel S Z Dobrowski and M A Moritz 2012 Spatial variability in wildfire probability across the western United States Intershynational Journal of Wildland Fire 21313ndash327
Penman J M Gytarsky T Hiraishi T Krug D Kruger R Pipatti L Buendia K Miwa T Ngara and K Tanabe 2003 Good practice guidance for land use land-use change and forestry Institute for Global Environmental Strategies for the Intergovshyernmental Panel on Climate Change Hayama Kanagawa Japan
Pollet J and P N Omi 2002 Effect of thinning and prescribed burning on crown fire severity in ponderosa pine forests International Journal of Wildland Fire 111ndash10
Prather J W R F Noss and T D Sisk 2008 Real versus perceived conflicts between restoration of ponderosa pine forests and conservation of the Mexican spotted owl Forest Policy and Economics 10140ndash150
Preisler H K D R Brillinger R E Burgan and J Benoit 2004 Probability based models for estimation of wildfire risk International Journal of Wildland Fire 13133ndash142
Rebain S E Reinhardt N Crookston S Beukema W Kurz and J Greenough 2009 The fire and fuels extension to the Forest Vegetation Simulator Addendum to RMRS-GTR-119 USDA Forest Service and ESSA Technologies Ltd Fort Collins Colorado USA
Reinhardt E D and N L Crookston 2003 The fire and fuels extension to the forest vegetation simulashytor Pages 209 RMRS-GTR-116 USDA Forest Sershyvice Rocky Mountain Research Station Ogden Utah USA
Reinhardt E and L Holsinger 2010 Effects of fuel treatments on carbon-disturbance relationshyships in forests of the northern Rocky Mountains Forest Ecology and Management 2591427ndash1435
wwwesajournalsorg 20 January 2017 Volume 8(1) Article e01648
CHIONO ET AL
Reinhardt E D R E Keane D E Calkin and J D Cohen 2008 Objectives and considerations for wildland fuel treatment in forested ecosystems of the interior western United States Forest Ecology and Management 2561997ndash2006
Ritchie M W C N Skinner and T A Hamilton 2007 Probability of tree survival after wildfire in an interior pine forest of northern California effects of thinning and prescribed fire Forest Ecolshyogy and Management 247200ndash208
Roloff G J S P Mealey and J D Bailey 2012 Comshyparative hazard assessment for protected species in a fire-prone landscape Forest Ecology and Manshyagement 2771ndash10
Rothermel R C 1972 A mathematical model for preshydicting fire spread in wildland fuels Research Paper INT-115 USDA Forest Service Intermounshytain Forest and Range Experiment Station Ogden Utah USA
Safford H D 2008 Fire severity in fuel treatments American River Complex fire Tahoe National Forest California Unpublished Report USDA Forest Service Pacific Southwest Region Vallejo California USA
Schmidt D A A H Taylor and C N Skinner 2008 The influence of fuels treatment and landscape arrangement on simulated fire behavior Southern Cascade range California Forest Ecology and Management 2553170ndash3184
Scott J H and R E Burgan 2005 Standard fire behavior fuel models a comprehensive set for use with Rothermelrsquos surface fire spread model General Technical Report RMRS-GTR-153 USDA Forest Service Rocky Mountain Research Station Fort Collins Colorado USA
Scott J H M P Thompson and J W Gilbertson-Day 2016 Examining alternative fuel management strategies and the relative contribution of National Forest System land to wildfire risk to adjacent homesndasha pilot assessment on the Sierra National Forest California USA Forest Ecology and Manshyagement 36229ndash37
Smith J E and L S Heath 2002 A model of forest floor carbon mass for United States forest types Research Paper NE-722 USDA Forest Service Northeastern Research Station Newtown Square Pennsylvania USA
Stephens S L 2005 Forest fire causes and extent on United States Forest Service lands International Journal of Wildland Fire 14213ndash222
Stephens S L B M Collins E Biber and P Z Fulme 2016a US federal fire and forest policy emphasizshying resilience in dry forests Ecosphere 7e01584
Stephens S L J D Miller B M Collins M P North J J Keane and S L Roberts 2016b Wildfire impacts on California Spotted Owl nesting habitat in the Sierra Nevada Ecosphere 7e01584
Stephens S L J J Moghaddas B R Hartsough E E Y Moghaddas and N E Clinton 2009 Fuel treatshyment effects on stand-level carbon pools treatshyment-related emissions and fire risk in a Sierra Nevada mixed-conifer forest Canadian Journal of Forest Research 391538ndash1547
Stephens S L et al 2012 Fuel treatment impacts on estimated wildfire carbon loss from forests in Monshytana Oregon California and Arizona Ecosphere 31ndash17
Tempel D et al 2015 Evaluating short- and longshyterm impacts of fuels treatments and simulated wildfire on an old-forest species Ecosphere 61ndash19
USDA Forest Service 2004 Sierra Nevada Forest Plan Amendment Final supplemental environmental impact statement Record of decision Publication R5-MB-046 USDA Forest Service Pacific Southshywest Region Vallejo California USA
Van Wagner C E 1977 Conditions for the start and spread of crown fire Canadian Journal of Forest Research 723ndash34
Verner J K S McKelvey B R Noon R Gutimerrez G I Gould Jr and T W Beck 1992 Assessment of the current status of the California spotted owl with recommendations for management Pages 3ndash27 in J Verner K S McKelvey B R Noon R Gutimerrez G I Gould Jr and T W Beck edishytors The California Spotted Owl a technical assessment of its current status PSW-GTR-133 USDA Forest Service Albany California USA
Westerling A B Bryant H Preisler T Holmes H Hidalgo T Das and S Shrestha 2011 Climate change and growth scenarios for California wildshyfire Climatic Change 109445ndash463
Westerling A L H G Hidalgo D R Cayan and T W Swetnam 2006 Warming and earlier Spring increase Western US Forest Wildfire Activity Science 313940ndash943
Wiedinmyer C and M D Hurteau 2010 Prescribed fire as a means of reducing forest carbon emissions in the Western United States Environmental Science amp Technology 441926ndash1932
SUPPORTING INFORMATION
Additional Supporting Information may be found online at httponlinelibrarywileycomdoi101002ecs2 1648full
wwwesajournalsorg 21 January 2017 Volume 8(1) Article e01648
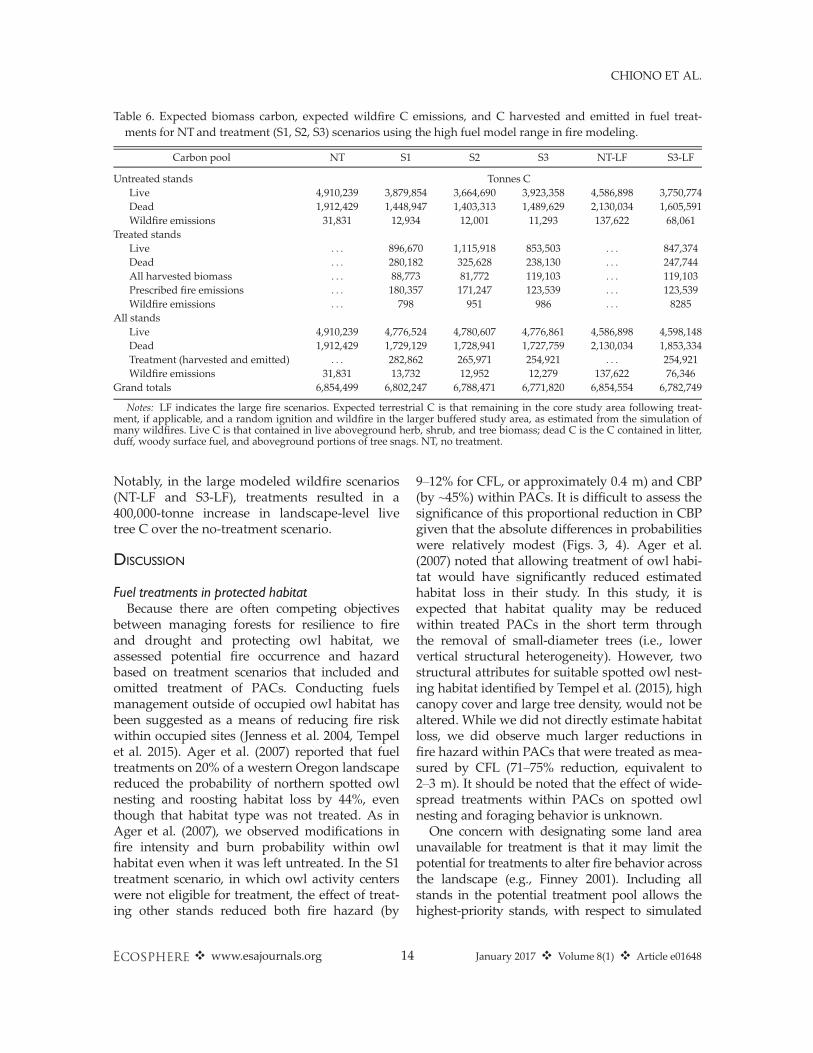
CHIONO ET AL
Table 6 Expected biomass carbon expected wildfire C emissions and C harvested and emitted in fuel treatshyments for NT and treatment (S1 S2 S3) scenarios using the high fuel model range in fire modeling
Carbon pool NT S1 S2 S3 NT-LF S3-LF
Untreated stands Tonnes C Live 4910239 3879854 3664690 3923358 4586898 3750774 Dead 1912429 1448947 1403313 1489629 2130034 1605591 Wildfire emissions 31831 12934 12001 11293 137622 68061
Treated stands Live 896670 1115918 853503 847374 Dead 280182 325628 238130 247744 All harvested biomass 88773 81772 119103 119103 Prescribed fire emissions 180357 171247 123539 123539 Wildfire emissions 798 951 986 8285
All stands Live 4910239 4776524 4780607 4776861 4586898 4598148 Dead 1912429 1729129 1728941 1727759 2130034 1853334 Treatment (harvested and emitted) 282862 265971 254921 254921 Wildfire emissions 31831 13732 12952 12279 137622 76346
Grand totals 6854499 6802247 6788471 6771820 6854554 6782749
Notes LF indicates the large fire scenarios Expected terrestrial C is that remaining in the core study area following treatshyment if applicable and a random ignition and wildfire in the larger buffered study area as estimated from the simulation of many wildfires Live C is that contained in live aboveground herb shrub and tree biomass dead C is the C contained in litter duff woody surface fuel and aboveground portions of tree snags NT no treatment
Notably in the large modeled wildfire scenarios (NT-LF and S3-LF) treatments resulted in a 400000-tonne increase in landscape-level live tree C over the no-treatment scenario
DISCUSSION
Fuel treatments in protected habitat Because there are often competing objectives
between managing forests for resilience to fire and drought and protecting owl habitat we assessed potential fire occurrence and hazard based on treatment scenarios that included and omitted treatment of PACs Conducting fuels management outside of occupied owl habitat has been suggested as a means of reducing fire risk within occupied sites (Jenness et al 2004 Tempel et al 2015) Ager et al (2007) reported that fuel treatments on 20 of a western Oregon landscape reduced the probability of northern spotted owl nesting and roosting habitat loss by 44 even though that habitat type was not treated As in Ager et al (2007) we observed modifications in fire intensity and burn probability within owl habitat even when it was left untreated In the S1 treatment scenario in which owl activity centers were not eligible for treatment the effect of treatshying other stands reduced both fire hazard (by
9ndash12 for CFL or approximately 04 m) and CBP (by ~45) within PACs It is difficult to assess the significance of this proportional reduction in CBP given that the absolute differences in probabilities were relatively modest (Figs 3 4) Ager et al (2007) noted that allowing treatment of owl habishytat would have significantly reduced estimated habitat loss in their study In this study it is expected that habitat quality may be reduced within treated PACs in the short term through the removal of small-diameter trees (ie lower vertical structural heterogeneity) However two structural attributes for suitable spotted owl nestshying habitat identified by Tempel et al (2015) high canopy cover and large tree density would not be altered While we did not directly estimate habitat loss we did observe much larger reductions in fire hazard within PACs that were treated as meashysured by CFL (71ndash75 reduction equivalent to 2ndash3 m) It should be noted that the effect of wideshyspread treatments within PACs on spotted owl nesting and foraging behavior is unknown One concern with designating some land area
unavailable for treatment is that it may limit the potential for treatments to alter fire behavior across the landscape (eg Finney 2001) Including all stands in the potential treatment pool allows the highest-priority stands with respect to simulated
wwwesajournalsorg 14 January 2017 Volume 8(1) Article e01648
CHIONO ET AL
effects on landscape-level fire behavior The true effect of increasing the land area available for treatshyment may be partially obscured by the varying frequency of treatment prescriptions between sceshynarios For example the hand thinning treatments applied within PACs would be expected to have a milder effect on potential wildfire behavior than more severe prescriptions and hand thinning was twice as common in S2 as in the other scenarios
Terrestrial carbon and burning emissions Landscape treatments reduced wildfire emisshy
sions by reducing the emissions produced per area burned by wildfire as well as average wildfire size On average wildfires in the treated landscapes released 193ndash216 tonnes Cha while wildfires in the untreated landscapes released 234ndash254 tonnes Cha Modeled wildfires decreased in size by 7 (low fuel model range) 36 (high fuel model range) and 25 (large fire scenario) relative to untreated landscapes (Fig 6) Since the burn pershyiod for simulated wildfires was held constant between scenarios this reduction in average wildshyfire size is the result of reduced spread rates derived from fuel treatments Despite the influence of treatments on wildfire
intensity size and expected emissions treatment-related emissions exceeded the avoided wildfire emissions conferred by treatment Prescribed burning in our study a combination of broadcast
Fig 6 Wildfire size relative frequency distributions from wildfire simulations Bar color represents no-treatment (NT) and treatment scenarios (S1ndashS3)
fire spread to be treated which would be expected to achieve the greatest modification of landscape fire behavior and effects In the present study although the land area potentially available for treatment more than doubled between S1 and S3 landscape-level effects of treatment on modeled fire risk and hazard were fairly similar (compared with the no-treatment landscape all-stand CBP fell by 47 and 54 in S1 and S3 while CFL fell by 24 and 30) Dow et al (2016) also found that incorporating modest restrictions on treatment Fig 7 Carbon emissions (tonnes) from wildfire and
area availability (24 of the landscape unavail- prescribed burning X-axis labels indicate no-treatment able) had minimal consequences for modeled fire (NT) and treatment scenarios (S1ndashS3) subscripts size and hazard The modest changes in estimated denote fuel model ranges used in fire modeling
fire metrics we observed may also be due to simi- (L low H high) Large fire scenarios which were
larity in the general pattern of treatment placement modeled with the high fuel model range only are indishybetween scenarios which probably led to similar cated by LF
wwwesajournalsorg 15 January 2017 Volume 8(1) Article e01648
CHIONO ET AL
Table 7 Proportional change in expected carbon by biomass pool for treatment scenarios compared to the no-treatment landscape
Treatment Standing Down dead Forest Herb Live scenario dead wood floor shrub tree
S1 004 -017 -013 014 -004 S2 001 -016 -012 014 -004 S3 -001 -015 -010 016 -004 S3-LF -016 -013 -008 017 000
Notes For example a value of -010 represents a 10 decshyline in biomass C from the no-treatment scenario Treatment and no-treatment values were calculated as the average of low and high fuel model range values except in the case of the large fire (LF) scenarios which were modeled for the high fuel model range only Expected C is that remaining after a random ignition and wildfire in the buffered study area as estimated from simulating 80000 ignitions (LF 40000 ignitions)
C pool categories are those reported in Forest Vegetation Simulator Carbon Reports Standing dead aboveground porshytion of standing dead trees Down dead wood woody surface fuels Forest floor litter and duff Herbshrub herbs and shrubs Live tree aboveground portion of live trees
and pile burning released 111ndash163 tonnes Cha For comparison studies conducted in comparable forest types have estimated prescribed fire emisshysions of 127 tonnes Cha (warm dry ponderosa pine habitat types Reinhardt and Holsinger 2010)
Fig 8 Expected carbon contained in aboveground live and dead tree biomass Expected C is that remainshying in the core study area following treatment (if applishycable) and a single random ignition within the larger buffered study area X-axis labels indicate no-treatment (NT) and treatment scenarios (S1ndashS3) subshyscripts denote fuel model ranges used in fire modeling (L low H high) Large fire scenarios which were modeled for the high fuel model range only are indishycated by LF
and 148 tonnes Cha (an old-growth mixed-conifer reserve in the southern Sierra Nevada North et al 2009a) Relative to the approximately 158000 tonnes C emitted in prescribed burning avoided wildfire emissions at 1186ndash19551 tonnes for wildfires of moderate size were small A simishylar study in southern Oregon with average modshyeled wildfires of 2350 and 3500 ha (treatment and no-treatment scenarios respectively) found that treatments reduced expected wildfire emissions by 6157 tonnes of C (Ager et al 2010) Surface fuels represented with surface fuel
models in commonly used modeling software are the most influential inputs determining preshydicted fire behavior (Hall and Burke 2006) Fire behavior fire sizes and emissions in this study varied according to fuel model assignment highshylighting the importance of selecting the approprishyate fuel model to represent fuel conditions (see Collins et al 2013) We show a 12- to 14-fold change in wildfire emissions due solely to the choice of fuel models (Tables 5 and 6) Indeed the range of fuel models used in recent studies investigating fuel treatments and simulated fire behavior in mixed-conifer forests is noteworthy Incorporating a range of fuel models into analyshyses such that outcome variability can be reported facilitates comparison of effects across studies Our estimates of the aboveground C benefits
of treatment under the moderate wildfire scenarshyios with average fire sizes of le2133 ha are likely conservative The effect of modeled wildfire size on the C consequences of fuel treatment was conshysiderable emphasizing the importance of this variable in studies of the climate benefits of treatshyment Avoided wildfire emissions resulting from treatment increased to 61276 tonnes C when large wildfires (8070ndash10757 ha) were simulated The treatment scenario given large wildfires also protected a greater portion of live tree C If the ~40000-ha King Fire is representative of the magnitude of future wildfires in the region C accounting should improve with respect to treatshyment favorability Similarly if multiple wildfires were to encounter the study area within the effective lifespan of treatments the C gains assoshyciated with avoided emissions in the treatment scenarios would increase Our approach to estimating the C conseshy
quences of fuel treatments has a number of limitashytions A full accounting of treatment effects
wwwesajournalsorg 16 January 2017 Volume 8(1) Article e01648
CHIONO ET AL
would project through time the consequences of both treatment and wildfire Our analysis is static incorporating only the short-term C costs and benefits of treatment Simulating wildfire in the year immediately following treatment maximizes the apparent benefits of treatment Over time as surface fuels accumulate and vegetation regenershyates maintenance would be required to retain the effectiveness of treatments (Martinson and Omi 2013) increasing the C costs of reduced fire hazard In addition the C contained in fire-killed biomass will ultimately be emitted to the atmoshysphere although biomass decay could be delayed through conversion to long-lived wood products such as building materials (Malmsheimer et al 2011) It is also important to note that our analysis did not include stochastic wildfire occurrence Estimates of burn probability in the present study are not estimates of the likelihood of wildfire occurrence based on historical fire sizes and freshyquency (eg Preisler et al 2004 Mercer and Prestemon 2005 Brillinger et al 2006) but rather are conditional on a single randomly ignited wildfire within the buffered study area
CONCLUSIONS
Our findings generally support those of Campshybell et al (2011) who concluded from an analysis of fire-prone western forests that the C costs of treatments are likely to outweigh their benefits under current depressed fire frequencies In a more recent paper Campbell and Ager (2013) conshycluded that ldquonone of the fuel treatment simulation scenarios resulted in increased system carbonrdquo primarily from the low incidences of treated areas being burned by wildfire However our interpreshytation of these findings differs from those disshycussed in Campbell et al (2011) and Campbell and Ager (2013) especially in light of recent and projected future trends in fire activity (Westerling et al 2011 Miller and Safford 2012 Dennison et al 2014) The current divergence of increasing surface air temperatures and low fire activity is unlikely to be sustained further suggesting greater future fire activity (Marlon et al 2012) If increased fire activity is realized then the likelishyhood of a given area being burned in a wildfire increases This differs from the simple increase in stand-level fire frequency modeled by Campbell et al (2011) because increases in fire likelihood are
not necessarily associated with corresponding decreases in fire severity as assumed by Campbell et al (2011) Increased fire likelihood could very well lead to positive feedbacks in fire severity and ultimately to vegetation type conversion (Copposhyletta et al 2016)mdasheffects that would have signifishycant implications for carbon storage Due to the significant emissions associated
with treatment and the low likelihood that wildshyfire will encounter a given treatment area forest management that is narrowly focused on C accounting alone would favor the no-treatment scenarios Landscape treatments protected more C in live tree biomass only when large wildfires were simulated While treatment favorability improved with large wildfire simulation the no-treatment scenario still produced fewer emissions than the treatment scenario Given the potential for large wildfire in the region as demonstrated by the 2014 King Fire and the increasing freshyquency of large wildfires and area burned in Calishyfornia expected from climate modeling studies (Lenihan et al 2008 Westerling et al 2011) we suggest that future studies of fuel treatmentndashwildshyfirendashC relationships should incorporate the potenshytial for large wildfires at a frequency greater than those observed over the last 20ndash30 yr Others have argued that treatments to increase forest resilience should be a stand-alone top land management priority independent of other ecosystem values such as carbon sequestration and fire hazard reduction (Stephens et al 2016a) We also note that the potential benefits of fuels
management are not restricted to avoided wildshyfire emissions Here we show that landscape fuel treatments can alter fire hazard across the landshyscape both within and outside of treated stands and have the potential to affect the likelihood of burning and fire intensity within protected Calishyfornia spotted owl habitat Underscoring the risk to sensitive habitat the 2014 King Fire encounshytered 31 PACs within our study area leading to the greatest single-year decline in habitat occushypancy recorded over a 23-yr study period (Jones et al 2016) Modest simulated treatments within activity centers significantly reduced potential fire intensity relative to both the no-treatment landscape and a treatment scenario that did not permit treatment within PACs indicating that active management may be desirable to protect habitat in the long term (Roloff et al 2012)
wwwesajournalsorg 17 January 2017 Volume 8(1) Article e01648
CHIONO ET AL
However treatments conducted outside of owl habitat also reduced wildfire hazard
ACKNOWLEDGMENTS
We are grateful to a number of individuals for sharshying their time and fuel treatment and fire modeling expertise Nicole Vaillant (ArcFuels) Alan Ager and Andrew McMahan (carbon estimation) and Coeli Hoover (harvest simulations in FVS-FFE) Brian Ebert and Dana Walsh of the Eldorado National Forest proshyvided invaluable advice on weather inputs for fire modeling and on designing fuel treatment prescripshytions Ken Somers Operations Forester on the Blodgett Forest Research Station gave advice concerning timshyber management on private land We also thank two anonymous reviewers whose comments greatly improved this article The California Energy Commisshysion provided funding for this project
LITERATURE CITED
Ager A A B Bahro and K Barber 2006 Automating the fireshed assessment process with ArcGIS Pages 163ndash167 in P L Andrews and B W Butler (Comps) Fuels ManagementndashHow to Measure Success Conference Proceedings Portland OR March 28ndash30 2006 Proceedings RMRS-P-41 USDA Forest Service Rocky Mountain Research Station Fort Collins Colorado USA
Ager A A M A Finney B K Kerns and H Maffei 2007 Modeling wildfire risk to northern spotted owl (Strix occidentalis caurina) habitat in Central Oregon USA Forest Ecology and Management 24645ndash56
Ager A A M A Finney A McMahan and J Cathcart 2010 Measuring the effect of fuel treatments on forshyest carbon using landscape risk analysis Natural Hazards and Earth System Science 102515ndash2526
Ager A A N M Vaillant D E Owens S Brittain and J Hamann 2012 Overview and example application of the Landscape Treatment Designer Pages 11 General Technical Report PNW-GTR-859 USDA Forest Service Pacific Northwest Research Station Portland Oregon USA
Barbour M G and R A Minnich 2000 Californian upland forests and woodlands Pages 131ndash164 in M Barbour and W Billings editors North Amerishycan terrestrial vegetation Cambridge University Press Cambridge UK
Bias M A and R Gutimerrez 1992 Habitat associations of California spotted owls in the central Sierra Nevada Journal of Wildlife Management 56584ndash595
Bond M L R Gutierrez A B Franklin W S LaHaye C A May and M E Seamans 2002
Short-term effects of wildfires on spotted owl surshyvival site fidelity mate fidelity and reproductive success Wildlife Society Bulletin 301022ndash1028
Brillinger D H Preisler and J Benoit 2006 Probashybilistic risk assessment for wildfires Environ-metrics 17623ndash633
Campbell J L and A A Ager 2013 Forest wildfire fuel reduction treatments and landscape carbon stocks a sensitivity analysis Journal of Environshymental Management 121124ndash132
Campbell J L M E Harmon and S R Mitchell 2011 Can fuel-reduction treatments really increase forest carbon storage in the western US by reducshying future fire emissions Frontiers in Ecology and the Environment 1083ndash90
Cathcart J A A Ager A McMahan M Finney and B Watt 2010 Carbon benefits from fuel treatshyments Pages 61ndash80 in T B Jain R T Graham and J Sandquist editors Integrated management of carbon sequestration and biomass utilization opportunities in a changing climate Proceedings of the 2009 National Silviculture Workshop Boise Idaho June 15ndash18 2009 USDA Forest Service Proshyceedings RMRS-P-61 Rocky Mountain Research Station Fort Collins Colorado USA
Chatfield A H 2005 Habitat selection by a California spotted owl population a landscape scale analysis using resource selection functions Thesis Univershysity of Minnesota St Paul Minnesota USA
Collins B M H A Kramer K Menning C Dilling-ham D Saah P A Stine and S L Stephens 2013 Modeling hazardous fire potential within a comshypleted fuel treatment network in the northern Sierra Nevada Forest Ecology and Management 310156ndash166
Collins B M S L Stephens J J Moghaddas and J Battles 2010 Challenges and approaches in planshyning fuel treatments across fire-excluded forested landscapes Journal of Forestry 10824ndash31
Collins B M S L Stephens G B Roller and J J Battles 2011 Simulating fire and forest dynamics for a landscape fuel treatment project in the Sierra Nevada Forest Science 5777ndash88
Coppoletta M K E Merriam and B M Collins 2016 Post-fire vegetation and fuel development influences fire severity patterns in reburns Ecologishycal Applications 26686ndash699
Crookston N L and A O Finley 2008 yaimpute an r package for knn imputation Journal of Statistical Software 231ndash16
Crookston N L M Moeur and D L Renner 2002 Userrsquos guide to the most similar neighbor imputashytion program version 2 General Technical Report RMRS-GTR-96 USDA Forest Service Rocky Mountain Research Station Ogden Utah USA
wwwesajournalsorg 18 January 2017 Volume 8(1) Article e01648
CHIONO ET AL
Crosby J and C Chandler 1966 Get the most from your windspeed observations Fire Control Notes 2712ndash13
Dailey S J Fites A Reiner and S Mori 2008 Fire behavior and effects in fuel treatments and proshytected habitat on the Moonlight fire Fire Behavior Assessment Team wwwfsfedusadaptivemana gementprojectsFBATdocsMoonlightFinal_8_6_08 pdf
Dennison P E S C Brewer J D Arnold and M A Moritz 2014 Large wildfire trends in the western United States 1984ndash2011 Geophysical Research Letters 412928ndash2933
Dixon G E 2002 Essential FVS a userrsquos guide to the forest vegetation simulator Pages 193 USDA Forest Service Forest Management Service Center Fort Collins Colorado USA
Dore S T E Kolb M Montes-Helu B W Sullivan W D Winslow S C Hart J P Kaye G W Koch and B A Hungate 2008 Long-term impact of a stand-replacing fire on ecosystem CO2 exchange of a ponderosa pine forest Global Change Biology 141ndash20
Dore S M Montes-Helu S C Hart B A Hungate G W Koch J B Moon A J Finkral and T E Kolb 2012 Recovery of ponderosa pine ecosystem carbon and water fluxes from thinning and stand-replacing fire Global Change Biology 183171ndash3185
Dow C J B M Collins and S L Stephens 2016 Incorporating resource protection constraints in an analysis of landscape fuel-treatment effectiveness in the Northern Sierra Nevada California USA Environmental Management 571ndash15
Eidenshink J B Schwind K Brewer Z Zhu B Quayle and S Howard 2007 A project for monshyitoring trends in burn severity Fire Ecology 33ndash21
Evans A M and A J Finkral 2009 From renewable energy to fire risk reduction a synthesis of biomass harvesting and utilization case studies in US forshyests GCB Bioenergy 1211ndash219
Finkral A J and A M Evans 2008 The effects of a thinning treatment on carbon stocks in a northern Arizona ponderosa pine forest Forest Ecology and Management 2552743ndash2750
Finney M A 2001 Design of regular landscape fuel treatment patterns for modifying fire growth and behavior Forest Science 47219ndash228
Finney M A 2002 Fire growth using minimum travel time methods Canadian Journal of Forest Research 321420ndash1424
Finney M A 2006 An overview of FlamMap fire modeling capabilities Pages 213ndash220 in P L Andrews and B W Butler editors Proceedings of Fuels ManagementndashHow to Measure Success Research Paper RMRS-P-41 USDA Forest Service
Rocky Mountain Research Station Portland Oregon USA
Finney M A R C Seli C W McHugh A A Ager B Bahro and J K Agee 2007 Simulation of longshyterm landscape-level fuel treatment effects on large wildfires International Journal of Wildland Fire 16712ndash727
Fulme P Z J E Crouse J P Roccaforte and E L Kalies 2012 Do thinning andor burning treatments in western USA ponderosa or Jeffrey pine-dominated forests help restore natural fire behavior Forest Ecology and Management 26968ndash81
Gaines W L R J Harrod J Dickinson A L Lyons and K Halupka 2010 Integration of Northern spotted owl habitat and fuels treatments in the eastern Cascades Washington USA Forest Ecolshyogy and Management 2602045ndash2052
Gaines W L R A Strand and S D Piper 1997 Effects of the hatchery complex fires on northern spotted owls in the eastern Washington Cascades Pages 123ndash129 in J N Greenlee editor Proceedings of the Fire Effects on Rare and Endangered Species and Habitats Conference Coeur DrsquoAlene Idaho International Association of Wildfire and Forestry Hot Springs South Dakota USA
Hall S A and I C Burke 2006 Considerations for characterizing fuels as inputs for fire behavior models Forest Ecology and Management 227 102ndash114
Hoover C and S Rebain 2008 The Kane Experimenshytal Forest carbon inventory carbon reporting with FVS Pages 13ndash15 in R N Havis and N L Crookston editors Third Forest Vegetation Simushylator Conference Fort Collins Colorado February 13ndash15 2007 USDA Forest Service Rocky Mountain Research Station Fort Collins Colorado USA
Hurteau M and M North 2009 Fuel treatment effects on tree-based forest carbon storage and emissions under modeled wildfire scenarios Fronshytiers in Ecology and the Environment 7409ndash414
Hurteau M D and M North 2010 Carbon recovery rates following different wildfire risk mitigation treatments Forest Ecology and Management 260 930ndash937
Hurteau M D M T Stoddard and P Z Fulme 2011 The carbon costs of mitigating high-severity wildshyfire in southwestern ponderosa pine Global Change Biology 171516ndash1521
Jenness J S P Beier and J L Ganey 2004 Associashytions between forest fire and Mexican spotted owls Forest Science 50765ndash772
Jones G M R Gutimerrez D J Tempel S A Whitmore W J Berigan and M Z Peery 2016 Megafires an emerging threat to old-forest species Frontiers in Ecology and the Environment 14300ndash306
wwwesajournalsorg 19 January 2017 Volume 8(1) Article e01648
CHIONO ET AL
Laymon S A 1988 Ecology of the spotted owl in the central Sierra Nevada California Dissertation University of California Berkeley California USA
Lenihan J M D Bachelet R P Neilson and R Drapek 2008 Response of vegetation distribution ecosystem productivity and fire to climate change scenarios for California Climatic Change 87215ndash230
Lydersen J M B M Collins E E Knapp G B Roller and S Stephens 2015 Relating fuel loads to overshystorey structure and composition in a fire-excluded Sierra Nevada mixed conifer forest International Journal of Wildland Fire 24484ndash494
Malmsheimer R J Bowyer J Fried E Gee R Islar R Miner I E Munn E Oneil and W C Stewart 2011 Managing forests because carbon matters integrating energy products and land manageshyment policy Journal of Forestry 109S7ndashS50
Marlon J R et al 2012 Long-term perspective on wildfires in the western USA Proceedings of the National Academy of Sciences of the United States of America 109E535ndashE543
Martinson E J and P N Omi 2002 Performance of fuel treatments subjected to wildfires Pages 7ndash13 in P N Omi and L A Joyce editors Conference on Fire Fuel Treatments and Ecological Restorashytion USDA Forest Service Rocky Mountain Research Station Fort Collins Colorado USA
Martinson E J and P N Omi 2013 Fuel treatments and fire severity a meta-analysis Pages 38 USDA Forest Service Rocky Mountain Research Station Fort Collins Colorado USA
Mayer K E and W F Laudenslayer 1988 A guide to wildlife habitats of California California Departshyment of Forestry and Fire Protection Sacramento California USA
McKenzie D Z Gedalof D L Peterson and P Mote 2004 Climatic change wildfire and conservation Conservation Biology 18890ndash902
Mercer D E and J P Prestemon 2005 Comparing production function models for wildfire risk analyshysis in the wildlandndashurban interface Forest Policy and Economics 7782ndash795
Miller J D and H Safford 2012 Trends in wildfire severity 1984 to 2010 in the Sierra Nevada Modoc Plateau and southern Cascades California USA Fire Ecology 841ndash57
Miller J H Safford M Crimmins and A Thode 2009 Quantitative evidence for increasing forest fire severity in the Sierra Nevada and southern Cascade mountains California and Nevada USA Ecosystems 1216ndash32
North M 2012 Managing Sierra Nevada forests PSWshyGTR-237 USDA Forest Service Pacific Southwest Research Station Albany California USA
North M P and M D Hurteau 2011 High-severity wildfire effects on carbon stocks and emissions in fuels treated and untreated forest Forest Ecology and Management 2611115ndash1120
North M M Hurteau and J Innes 2009a Fire supshypression and fuels treatment effects on mixed-conifer carbon stocks and emissions Ecological Applications 191385ndash1396
North M P A Stine K OrsquoHara W Zielinski and S Stephens 2009b An ecosystem management strategy for Sierran mixed-conifer forests General Technical Report PSW-GTR-220 USDA Forest Service Pacific Southwest Research Station Albany California USA
Parisien M-A S Snetsinger J A Greenberg C R Nelson T Schoennagel S Z Dobrowski and M A Moritz 2012 Spatial variability in wildfire probability across the western United States Intershynational Journal of Wildland Fire 21313ndash327
Penman J M Gytarsky T Hiraishi T Krug D Kruger R Pipatti L Buendia K Miwa T Ngara and K Tanabe 2003 Good practice guidance for land use land-use change and forestry Institute for Global Environmental Strategies for the Intergovshyernmental Panel on Climate Change Hayama Kanagawa Japan
Pollet J and P N Omi 2002 Effect of thinning and prescribed burning on crown fire severity in ponderosa pine forests International Journal of Wildland Fire 111ndash10
Prather J W R F Noss and T D Sisk 2008 Real versus perceived conflicts between restoration of ponderosa pine forests and conservation of the Mexican spotted owl Forest Policy and Economics 10140ndash150
Preisler H K D R Brillinger R E Burgan and J Benoit 2004 Probability based models for estimation of wildfire risk International Journal of Wildland Fire 13133ndash142
Rebain S E Reinhardt N Crookston S Beukema W Kurz and J Greenough 2009 The fire and fuels extension to the Forest Vegetation Simulator Addendum to RMRS-GTR-119 USDA Forest Service and ESSA Technologies Ltd Fort Collins Colorado USA
Reinhardt E D and N L Crookston 2003 The fire and fuels extension to the forest vegetation simulashytor Pages 209 RMRS-GTR-116 USDA Forest Sershyvice Rocky Mountain Research Station Ogden Utah USA
Reinhardt E and L Holsinger 2010 Effects of fuel treatments on carbon-disturbance relationshyships in forests of the northern Rocky Mountains Forest Ecology and Management 2591427ndash1435
wwwesajournalsorg 20 January 2017 Volume 8(1) Article e01648
CHIONO ET AL
Reinhardt E D R E Keane D E Calkin and J D Cohen 2008 Objectives and considerations for wildland fuel treatment in forested ecosystems of the interior western United States Forest Ecology and Management 2561997ndash2006
Ritchie M W C N Skinner and T A Hamilton 2007 Probability of tree survival after wildfire in an interior pine forest of northern California effects of thinning and prescribed fire Forest Ecolshyogy and Management 247200ndash208
Roloff G J S P Mealey and J D Bailey 2012 Comshyparative hazard assessment for protected species in a fire-prone landscape Forest Ecology and Manshyagement 2771ndash10
Rothermel R C 1972 A mathematical model for preshydicting fire spread in wildland fuels Research Paper INT-115 USDA Forest Service Intermounshytain Forest and Range Experiment Station Ogden Utah USA
Safford H D 2008 Fire severity in fuel treatments American River Complex fire Tahoe National Forest California Unpublished Report USDA Forest Service Pacific Southwest Region Vallejo California USA
Schmidt D A A H Taylor and C N Skinner 2008 The influence of fuels treatment and landscape arrangement on simulated fire behavior Southern Cascade range California Forest Ecology and Management 2553170ndash3184
Scott J H and R E Burgan 2005 Standard fire behavior fuel models a comprehensive set for use with Rothermelrsquos surface fire spread model General Technical Report RMRS-GTR-153 USDA Forest Service Rocky Mountain Research Station Fort Collins Colorado USA
Scott J H M P Thompson and J W Gilbertson-Day 2016 Examining alternative fuel management strategies and the relative contribution of National Forest System land to wildfire risk to adjacent homesndasha pilot assessment on the Sierra National Forest California USA Forest Ecology and Manshyagement 36229ndash37
Smith J E and L S Heath 2002 A model of forest floor carbon mass for United States forest types Research Paper NE-722 USDA Forest Service Northeastern Research Station Newtown Square Pennsylvania USA
Stephens S L 2005 Forest fire causes and extent on United States Forest Service lands International Journal of Wildland Fire 14213ndash222
Stephens S L B M Collins E Biber and P Z Fulme 2016a US federal fire and forest policy emphasizshying resilience in dry forests Ecosphere 7e01584
Stephens S L J D Miller B M Collins M P North J J Keane and S L Roberts 2016b Wildfire impacts on California Spotted Owl nesting habitat in the Sierra Nevada Ecosphere 7e01584
Stephens S L J J Moghaddas B R Hartsough E E Y Moghaddas and N E Clinton 2009 Fuel treatshyment effects on stand-level carbon pools treatshyment-related emissions and fire risk in a Sierra Nevada mixed-conifer forest Canadian Journal of Forest Research 391538ndash1547
Stephens S L et al 2012 Fuel treatment impacts on estimated wildfire carbon loss from forests in Monshytana Oregon California and Arizona Ecosphere 31ndash17
Tempel D et al 2015 Evaluating short- and longshyterm impacts of fuels treatments and simulated wildfire on an old-forest species Ecosphere 61ndash19
USDA Forest Service 2004 Sierra Nevada Forest Plan Amendment Final supplemental environmental impact statement Record of decision Publication R5-MB-046 USDA Forest Service Pacific Southshywest Region Vallejo California USA
Van Wagner C E 1977 Conditions for the start and spread of crown fire Canadian Journal of Forest Research 723ndash34
Verner J K S McKelvey B R Noon R Gutimerrez G I Gould Jr and T W Beck 1992 Assessment of the current status of the California spotted owl with recommendations for management Pages 3ndash27 in J Verner K S McKelvey B R Noon R Gutimerrez G I Gould Jr and T W Beck edishytors The California Spotted Owl a technical assessment of its current status PSW-GTR-133 USDA Forest Service Albany California USA
Westerling A B Bryant H Preisler T Holmes H Hidalgo T Das and S Shrestha 2011 Climate change and growth scenarios for California wildshyfire Climatic Change 109445ndash463
Westerling A L H G Hidalgo D R Cayan and T W Swetnam 2006 Warming and earlier Spring increase Western US Forest Wildfire Activity Science 313940ndash943
Wiedinmyer C and M D Hurteau 2010 Prescribed fire as a means of reducing forest carbon emissions in the Western United States Environmental Science amp Technology 441926ndash1932
SUPPORTING INFORMATION
Additional Supporting Information may be found online at httponlinelibrarywileycomdoi101002ecs2 1648full
wwwesajournalsorg 21 January 2017 Volume 8(1) Article e01648
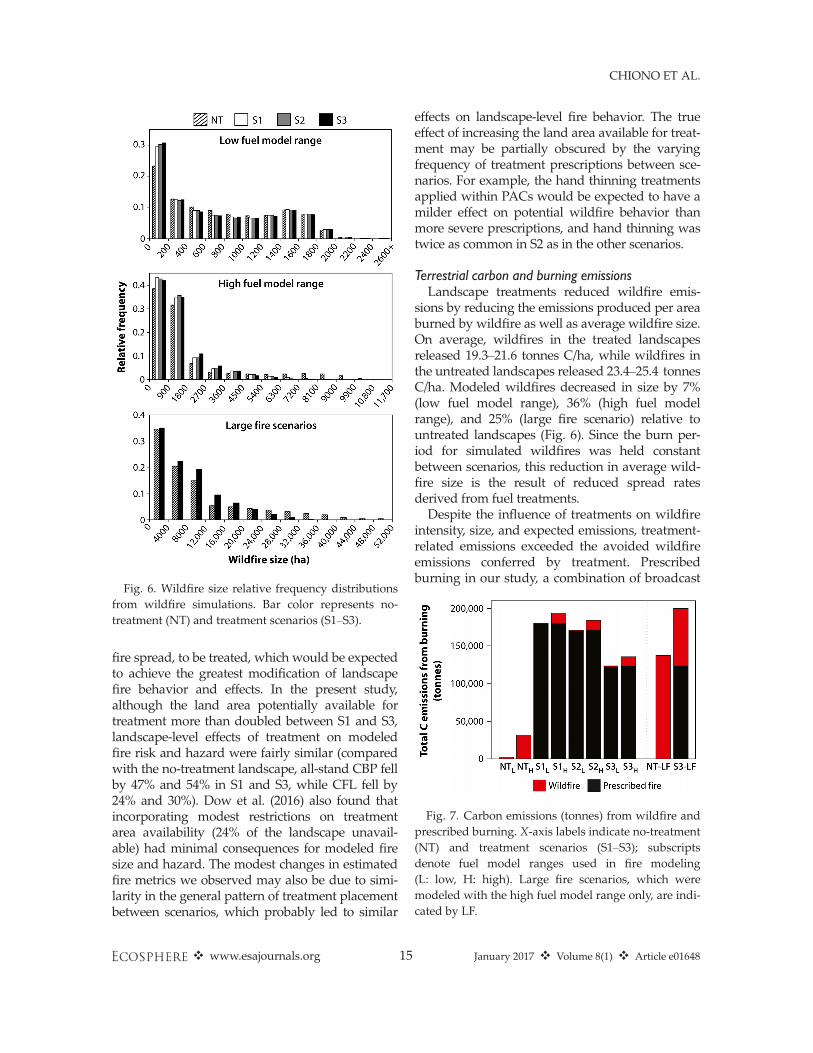
CHIONO ET AL
effects on landscape-level fire behavior The true effect of increasing the land area available for treatshyment may be partially obscured by the varying frequency of treatment prescriptions between sceshynarios For example the hand thinning treatments applied within PACs would be expected to have a milder effect on potential wildfire behavior than more severe prescriptions and hand thinning was twice as common in S2 as in the other scenarios
Terrestrial carbon and burning emissions Landscape treatments reduced wildfire emisshy
sions by reducing the emissions produced per area burned by wildfire as well as average wildfire size On average wildfires in the treated landscapes released 193ndash216 tonnes Cha while wildfires in the untreated landscapes released 234ndash254 tonnes Cha Modeled wildfires decreased in size by 7 (low fuel model range) 36 (high fuel model range) and 25 (large fire scenario) relative to untreated landscapes (Fig 6) Since the burn pershyiod for simulated wildfires was held constant between scenarios this reduction in average wildshyfire size is the result of reduced spread rates derived from fuel treatments Despite the influence of treatments on wildfire
intensity size and expected emissions treatment-related emissions exceeded the avoided wildfire emissions conferred by treatment Prescribed burning in our study a combination of broadcast
Fig 6 Wildfire size relative frequency distributions from wildfire simulations Bar color represents no-treatment (NT) and treatment scenarios (S1ndashS3)
fire spread to be treated which would be expected to achieve the greatest modification of landscape fire behavior and effects In the present study although the land area potentially available for treatment more than doubled between S1 and S3 landscape-level effects of treatment on modeled fire risk and hazard were fairly similar (compared with the no-treatment landscape all-stand CBP fell by 47 and 54 in S1 and S3 while CFL fell by 24 and 30) Dow et al (2016) also found that incorporating modest restrictions on treatment Fig 7 Carbon emissions (tonnes) from wildfire and
area availability (24 of the landscape unavail- prescribed burning X-axis labels indicate no-treatment able) had minimal consequences for modeled fire (NT) and treatment scenarios (S1ndashS3) subscripts size and hazard The modest changes in estimated denote fuel model ranges used in fire modeling
fire metrics we observed may also be due to simi- (L low H high) Large fire scenarios which were
larity in the general pattern of treatment placement modeled with the high fuel model range only are indishybetween scenarios which probably led to similar cated by LF
wwwesajournalsorg 15 January 2017 Volume 8(1) Article e01648
CHIONO ET AL
Table 7 Proportional change in expected carbon by biomass pool for treatment scenarios compared to the no-treatment landscape
Treatment Standing Down dead Forest Herb Live scenario dead wood floor shrub tree
S1 004 -017 -013 014 -004 S2 001 -016 -012 014 -004 S3 -001 -015 -010 016 -004 S3-LF -016 -013 -008 017 000
Notes For example a value of -010 represents a 10 decshyline in biomass C from the no-treatment scenario Treatment and no-treatment values were calculated as the average of low and high fuel model range values except in the case of the large fire (LF) scenarios which were modeled for the high fuel model range only Expected C is that remaining after a random ignition and wildfire in the buffered study area as estimated from simulating 80000 ignitions (LF 40000 ignitions)
C pool categories are those reported in Forest Vegetation Simulator Carbon Reports Standing dead aboveground porshytion of standing dead trees Down dead wood woody surface fuels Forest floor litter and duff Herbshrub herbs and shrubs Live tree aboveground portion of live trees
and pile burning released 111ndash163 tonnes Cha For comparison studies conducted in comparable forest types have estimated prescribed fire emisshysions of 127 tonnes Cha (warm dry ponderosa pine habitat types Reinhardt and Holsinger 2010)
Fig 8 Expected carbon contained in aboveground live and dead tree biomass Expected C is that remainshying in the core study area following treatment (if applishycable) and a single random ignition within the larger buffered study area X-axis labels indicate no-treatment (NT) and treatment scenarios (S1ndashS3) subshyscripts denote fuel model ranges used in fire modeling (L low H high) Large fire scenarios which were modeled for the high fuel model range only are indishycated by LF
and 148 tonnes Cha (an old-growth mixed-conifer reserve in the southern Sierra Nevada North et al 2009a) Relative to the approximately 158000 tonnes C emitted in prescribed burning avoided wildfire emissions at 1186ndash19551 tonnes for wildfires of moderate size were small A simishylar study in southern Oregon with average modshyeled wildfires of 2350 and 3500 ha (treatment and no-treatment scenarios respectively) found that treatments reduced expected wildfire emissions by 6157 tonnes of C (Ager et al 2010) Surface fuels represented with surface fuel
models in commonly used modeling software are the most influential inputs determining preshydicted fire behavior (Hall and Burke 2006) Fire behavior fire sizes and emissions in this study varied according to fuel model assignment highshylighting the importance of selecting the approprishyate fuel model to represent fuel conditions (see Collins et al 2013) We show a 12- to 14-fold change in wildfire emissions due solely to the choice of fuel models (Tables 5 and 6) Indeed the range of fuel models used in recent studies investigating fuel treatments and simulated fire behavior in mixed-conifer forests is noteworthy Incorporating a range of fuel models into analyshyses such that outcome variability can be reported facilitates comparison of effects across studies Our estimates of the aboveground C benefits
of treatment under the moderate wildfire scenarshyios with average fire sizes of le2133 ha are likely conservative The effect of modeled wildfire size on the C consequences of fuel treatment was conshysiderable emphasizing the importance of this variable in studies of the climate benefits of treatshyment Avoided wildfire emissions resulting from treatment increased to 61276 tonnes C when large wildfires (8070ndash10757 ha) were simulated The treatment scenario given large wildfires also protected a greater portion of live tree C If the ~40000-ha King Fire is representative of the magnitude of future wildfires in the region C accounting should improve with respect to treatshyment favorability Similarly if multiple wildfires were to encounter the study area within the effective lifespan of treatments the C gains assoshyciated with avoided emissions in the treatment scenarios would increase Our approach to estimating the C conseshy
quences of fuel treatments has a number of limitashytions A full accounting of treatment effects
wwwesajournalsorg 16 January 2017 Volume 8(1) Article e01648
CHIONO ET AL
would project through time the consequences of both treatment and wildfire Our analysis is static incorporating only the short-term C costs and benefits of treatment Simulating wildfire in the year immediately following treatment maximizes the apparent benefits of treatment Over time as surface fuels accumulate and vegetation regenershyates maintenance would be required to retain the effectiveness of treatments (Martinson and Omi 2013) increasing the C costs of reduced fire hazard In addition the C contained in fire-killed biomass will ultimately be emitted to the atmoshysphere although biomass decay could be delayed through conversion to long-lived wood products such as building materials (Malmsheimer et al 2011) It is also important to note that our analysis did not include stochastic wildfire occurrence Estimates of burn probability in the present study are not estimates of the likelihood of wildfire occurrence based on historical fire sizes and freshyquency (eg Preisler et al 2004 Mercer and Prestemon 2005 Brillinger et al 2006) but rather are conditional on a single randomly ignited wildfire within the buffered study area
CONCLUSIONS
Our findings generally support those of Campshybell et al (2011) who concluded from an analysis of fire-prone western forests that the C costs of treatments are likely to outweigh their benefits under current depressed fire frequencies In a more recent paper Campbell and Ager (2013) conshycluded that ldquonone of the fuel treatment simulation scenarios resulted in increased system carbonrdquo primarily from the low incidences of treated areas being burned by wildfire However our interpreshytation of these findings differs from those disshycussed in Campbell et al (2011) and Campbell and Ager (2013) especially in light of recent and projected future trends in fire activity (Westerling et al 2011 Miller and Safford 2012 Dennison et al 2014) The current divergence of increasing surface air temperatures and low fire activity is unlikely to be sustained further suggesting greater future fire activity (Marlon et al 2012) If increased fire activity is realized then the likelishyhood of a given area being burned in a wildfire increases This differs from the simple increase in stand-level fire frequency modeled by Campbell et al (2011) because increases in fire likelihood are
not necessarily associated with corresponding decreases in fire severity as assumed by Campbell et al (2011) Increased fire likelihood could very well lead to positive feedbacks in fire severity and ultimately to vegetation type conversion (Copposhyletta et al 2016)mdasheffects that would have signifishycant implications for carbon storage Due to the significant emissions associated
with treatment and the low likelihood that wildshyfire will encounter a given treatment area forest management that is narrowly focused on C accounting alone would favor the no-treatment scenarios Landscape treatments protected more C in live tree biomass only when large wildfires were simulated While treatment favorability improved with large wildfire simulation the no-treatment scenario still produced fewer emissions than the treatment scenario Given the potential for large wildfire in the region as demonstrated by the 2014 King Fire and the increasing freshyquency of large wildfires and area burned in Calishyfornia expected from climate modeling studies (Lenihan et al 2008 Westerling et al 2011) we suggest that future studies of fuel treatmentndashwildshyfirendashC relationships should incorporate the potenshytial for large wildfires at a frequency greater than those observed over the last 20ndash30 yr Others have argued that treatments to increase forest resilience should be a stand-alone top land management priority independent of other ecosystem values such as carbon sequestration and fire hazard reduction (Stephens et al 2016a) We also note that the potential benefits of fuels
management are not restricted to avoided wildshyfire emissions Here we show that landscape fuel treatments can alter fire hazard across the landshyscape both within and outside of treated stands and have the potential to affect the likelihood of burning and fire intensity within protected Calishyfornia spotted owl habitat Underscoring the risk to sensitive habitat the 2014 King Fire encounshytered 31 PACs within our study area leading to the greatest single-year decline in habitat occushypancy recorded over a 23-yr study period (Jones et al 2016) Modest simulated treatments within activity centers significantly reduced potential fire intensity relative to both the no-treatment landscape and a treatment scenario that did not permit treatment within PACs indicating that active management may be desirable to protect habitat in the long term (Roloff et al 2012)
wwwesajournalsorg 17 January 2017 Volume 8(1) Article e01648
CHIONO ET AL
However treatments conducted outside of owl habitat also reduced wildfire hazard
ACKNOWLEDGMENTS
We are grateful to a number of individuals for sharshying their time and fuel treatment and fire modeling expertise Nicole Vaillant (ArcFuels) Alan Ager and Andrew McMahan (carbon estimation) and Coeli Hoover (harvest simulations in FVS-FFE) Brian Ebert and Dana Walsh of the Eldorado National Forest proshyvided invaluable advice on weather inputs for fire modeling and on designing fuel treatment prescripshytions Ken Somers Operations Forester on the Blodgett Forest Research Station gave advice concerning timshyber management on private land We also thank two anonymous reviewers whose comments greatly improved this article The California Energy Commisshysion provided funding for this project
LITERATURE CITED
Ager A A B Bahro and K Barber 2006 Automating the fireshed assessment process with ArcGIS Pages 163ndash167 in P L Andrews and B W Butler (Comps) Fuels ManagementndashHow to Measure Success Conference Proceedings Portland OR March 28ndash30 2006 Proceedings RMRS-P-41 USDA Forest Service Rocky Mountain Research Station Fort Collins Colorado USA
Ager A A M A Finney B K Kerns and H Maffei 2007 Modeling wildfire risk to northern spotted owl (Strix occidentalis caurina) habitat in Central Oregon USA Forest Ecology and Management 24645ndash56
Ager A A M A Finney A McMahan and J Cathcart 2010 Measuring the effect of fuel treatments on forshyest carbon using landscape risk analysis Natural Hazards and Earth System Science 102515ndash2526
Ager A A N M Vaillant D E Owens S Brittain and J Hamann 2012 Overview and example application of the Landscape Treatment Designer Pages 11 General Technical Report PNW-GTR-859 USDA Forest Service Pacific Northwest Research Station Portland Oregon USA
Barbour M G and R A Minnich 2000 Californian upland forests and woodlands Pages 131ndash164 in M Barbour and W Billings editors North Amerishycan terrestrial vegetation Cambridge University Press Cambridge UK
Bias M A and R Gutimerrez 1992 Habitat associations of California spotted owls in the central Sierra Nevada Journal of Wildlife Management 56584ndash595
Bond M L R Gutierrez A B Franklin W S LaHaye C A May and M E Seamans 2002
Short-term effects of wildfires on spotted owl surshyvival site fidelity mate fidelity and reproductive success Wildlife Society Bulletin 301022ndash1028
Brillinger D H Preisler and J Benoit 2006 Probashybilistic risk assessment for wildfires Environ-metrics 17623ndash633
Campbell J L and A A Ager 2013 Forest wildfire fuel reduction treatments and landscape carbon stocks a sensitivity analysis Journal of Environshymental Management 121124ndash132
Campbell J L M E Harmon and S R Mitchell 2011 Can fuel-reduction treatments really increase forest carbon storage in the western US by reducshying future fire emissions Frontiers in Ecology and the Environment 1083ndash90
Cathcart J A A Ager A McMahan M Finney and B Watt 2010 Carbon benefits from fuel treatshyments Pages 61ndash80 in T B Jain R T Graham and J Sandquist editors Integrated management of carbon sequestration and biomass utilization opportunities in a changing climate Proceedings of the 2009 National Silviculture Workshop Boise Idaho June 15ndash18 2009 USDA Forest Service Proshyceedings RMRS-P-61 Rocky Mountain Research Station Fort Collins Colorado USA
Chatfield A H 2005 Habitat selection by a California spotted owl population a landscape scale analysis using resource selection functions Thesis Univershysity of Minnesota St Paul Minnesota USA
Collins B M H A Kramer K Menning C Dilling-ham D Saah P A Stine and S L Stephens 2013 Modeling hazardous fire potential within a comshypleted fuel treatment network in the northern Sierra Nevada Forest Ecology and Management 310156ndash166
Collins B M S L Stephens J J Moghaddas and J Battles 2010 Challenges and approaches in planshyning fuel treatments across fire-excluded forested landscapes Journal of Forestry 10824ndash31
Collins B M S L Stephens G B Roller and J J Battles 2011 Simulating fire and forest dynamics for a landscape fuel treatment project in the Sierra Nevada Forest Science 5777ndash88
Coppoletta M K E Merriam and B M Collins 2016 Post-fire vegetation and fuel development influences fire severity patterns in reburns Ecologishycal Applications 26686ndash699
Crookston N L and A O Finley 2008 yaimpute an r package for knn imputation Journal of Statistical Software 231ndash16
Crookston N L M Moeur and D L Renner 2002 Userrsquos guide to the most similar neighbor imputashytion program version 2 General Technical Report RMRS-GTR-96 USDA Forest Service Rocky Mountain Research Station Ogden Utah USA
wwwesajournalsorg 18 January 2017 Volume 8(1) Article e01648
CHIONO ET AL
Crosby J and C Chandler 1966 Get the most from your windspeed observations Fire Control Notes 2712ndash13
Dailey S J Fites A Reiner and S Mori 2008 Fire behavior and effects in fuel treatments and proshytected habitat on the Moonlight fire Fire Behavior Assessment Team wwwfsfedusadaptivemana gementprojectsFBATdocsMoonlightFinal_8_6_08 pdf
Dennison P E S C Brewer J D Arnold and M A Moritz 2014 Large wildfire trends in the western United States 1984ndash2011 Geophysical Research Letters 412928ndash2933
Dixon G E 2002 Essential FVS a userrsquos guide to the forest vegetation simulator Pages 193 USDA Forest Service Forest Management Service Center Fort Collins Colorado USA
Dore S T E Kolb M Montes-Helu B W Sullivan W D Winslow S C Hart J P Kaye G W Koch and B A Hungate 2008 Long-term impact of a stand-replacing fire on ecosystem CO2 exchange of a ponderosa pine forest Global Change Biology 141ndash20
Dore S M Montes-Helu S C Hart B A Hungate G W Koch J B Moon A J Finkral and T E Kolb 2012 Recovery of ponderosa pine ecosystem carbon and water fluxes from thinning and stand-replacing fire Global Change Biology 183171ndash3185
Dow C J B M Collins and S L Stephens 2016 Incorporating resource protection constraints in an analysis of landscape fuel-treatment effectiveness in the Northern Sierra Nevada California USA Environmental Management 571ndash15
Eidenshink J B Schwind K Brewer Z Zhu B Quayle and S Howard 2007 A project for monshyitoring trends in burn severity Fire Ecology 33ndash21
Evans A M and A J Finkral 2009 From renewable energy to fire risk reduction a synthesis of biomass harvesting and utilization case studies in US forshyests GCB Bioenergy 1211ndash219
Finkral A J and A M Evans 2008 The effects of a thinning treatment on carbon stocks in a northern Arizona ponderosa pine forest Forest Ecology and Management 2552743ndash2750
Finney M A 2001 Design of regular landscape fuel treatment patterns for modifying fire growth and behavior Forest Science 47219ndash228
Finney M A 2002 Fire growth using minimum travel time methods Canadian Journal of Forest Research 321420ndash1424
Finney M A 2006 An overview of FlamMap fire modeling capabilities Pages 213ndash220 in P L Andrews and B W Butler editors Proceedings of Fuels ManagementndashHow to Measure Success Research Paper RMRS-P-41 USDA Forest Service
Rocky Mountain Research Station Portland Oregon USA
Finney M A R C Seli C W McHugh A A Ager B Bahro and J K Agee 2007 Simulation of longshyterm landscape-level fuel treatment effects on large wildfires International Journal of Wildland Fire 16712ndash727
Fulme P Z J E Crouse J P Roccaforte and E L Kalies 2012 Do thinning andor burning treatments in western USA ponderosa or Jeffrey pine-dominated forests help restore natural fire behavior Forest Ecology and Management 26968ndash81
Gaines W L R J Harrod J Dickinson A L Lyons and K Halupka 2010 Integration of Northern spotted owl habitat and fuels treatments in the eastern Cascades Washington USA Forest Ecolshyogy and Management 2602045ndash2052
Gaines W L R A Strand and S D Piper 1997 Effects of the hatchery complex fires on northern spotted owls in the eastern Washington Cascades Pages 123ndash129 in J N Greenlee editor Proceedings of the Fire Effects on Rare and Endangered Species and Habitats Conference Coeur DrsquoAlene Idaho International Association of Wildfire and Forestry Hot Springs South Dakota USA
Hall S A and I C Burke 2006 Considerations for characterizing fuels as inputs for fire behavior models Forest Ecology and Management 227 102ndash114
Hoover C and S Rebain 2008 The Kane Experimenshytal Forest carbon inventory carbon reporting with FVS Pages 13ndash15 in R N Havis and N L Crookston editors Third Forest Vegetation Simushylator Conference Fort Collins Colorado February 13ndash15 2007 USDA Forest Service Rocky Mountain Research Station Fort Collins Colorado USA
Hurteau M and M North 2009 Fuel treatment effects on tree-based forest carbon storage and emissions under modeled wildfire scenarios Fronshytiers in Ecology and the Environment 7409ndash414
Hurteau M D and M North 2010 Carbon recovery rates following different wildfire risk mitigation treatments Forest Ecology and Management 260 930ndash937
Hurteau M D M T Stoddard and P Z Fulme 2011 The carbon costs of mitigating high-severity wildshyfire in southwestern ponderosa pine Global Change Biology 171516ndash1521
Jenness J S P Beier and J L Ganey 2004 Associashytions between forest fire and Mexican spotted owls Forest Science 50765ndash772
Jones G M R Gutimerrez D J Tempel S A Whitmore W J Berigan and M Z Peery 2016 Megafires an emerging threat to old-forest species Frontiers in Ecology and the Environment 14300ndash306
wwwesajournalsorg 19 January 2017 Volume 8(1) Article e01648
CHIONO ET AL
Laymon S A 1988 Ecology of the spotted owl in the central Sierra Nevada California Dissertation University of California Berkeley California USA
Lenihan J M D Bachelet R P Neilson and R Drapek 2008 Response of vegetation distribution ecosystem productivity and fire to climate change scenarios for California Climatic Change 87215ndash230
Lydersen J M B M Collins E E Knapp G B Roller and S Stephens 2015 Relating fuel loads to overshystorey structure and composition in a fire-excluded Sierra Nevada mixed conifer forest International Journal of Wildland Fire 24484ndash494
Malmsheimer R J Bowyer J Fried E Gee R Islar R Miner I E Munn E Oneil and W C Stewart 2011 Managing forests because carbon matters integrating energy products and land manageshyment policy Journal of Forestry 109S7ndashS50
Marlon J R et al 2012 Long-term perspective on wildfires in the western USA Proceedings of the National Academy of Sciences of the United States of America 109E535ndashE543
Martinson E J and P N Omi 2002 Performance of fuel treatments subjected to wildfires Pages 7ndash13 in P N Omi and L A Joyce editors Conference on Fire Fuel Treatments and Ecological Restorashytion USDA Forest Service Rocky Mountain Research Station Fort Collins Colorado USA
Martinson E J and P N Omi 2013 Fuel treatments and fire severity a meta-analysis Pages 38 USDA Forest Service Rocky Mountain Research Station Fort Collins Colorado USA
Mayer K E and W F Laudenslayer 1988 A guide to wildlife habitats of California California Departshyment of Forestry and Fire Protection Sacramento California USA
McKenzie D Z Gedalof D L Peterson and P Mote 2004 Climatic change wildfire and conservation Conservation Biology 18890ndash902
Mercer D E and J P Prestemon 2005 Comparing production function models for wildfire risk analyshysis in the wildlandndashurban interface Forest Policy and Economics 7782ndash795
Miller J D and H Safford 2012 Trends in wildfire severity 1984 to 2010 in the Sierra Nevada Modoc Plateau and southern Cascades California USA Fire Ecology 841ndash57
Miller J H Safford M Crimmins and A Thode 2009 Quantitative evidence for increasing forest fire severity in the Sierra Nevada and southern Cascade mountains California and Nevada USA Ecosystems 1216ndash32
North M 2012 Managing Sierra Nevada forests PSWshyGTR-237 USDA Forest Service Pacific Southwest Research Station Albany California USA
North M P and M D Hurteau 2011 High-severity wildfire effects on carbon stocks and emissions in fuels treated and untreated forest Forest Ecology and Management 2611115ndash1120
North M M Hurteau and J Innes 2009a Fire supshypression and fuels treatment effects on mixed-conifer carbon stocks and emissions Ecological Applications 191385ndash1396
North M P A Stine K OrsquoHara W Zielinski and S Stephens 2009b An ecosystem management strategy for Sierran mixed-conifer forests General Technical Report PSW-GTR-220 USDA Forest Service Pacific Southwest Research Station Albany California USA
Parisien M-A S Snetsinger J A Greenberg C R Nelson T Schoennagel S Z Dobrowski and M A Moritz 2012 Spatial variability in wildfire probability across the western United States Intershynational Journal of Wildland Fire 21313ndash327
Penman J M Gytarsky T Hiraishi T Krug D Kruger R Pipatti L Buendia K Miwa T Ngara and K Tanabe 2003 Good practice guidance for land use land-use change and forestry Institute for Global Environmental Strategies for the Intergovshyernmental Panel on Climate Change Hayama Kanagawa Japan
Pollet J and P N Omi 2002 Effect of thinning and prescribed burning on crown fire severity in ponderosa pine forests International Journal of Wildland Fire 111ndash10
Prather J W R F Noss and T D Sisk 2008 Real versus perceived conflicts between restoration of ponderosa pine forests and conservation of the Mexican spotted owl Forest Policy and Economics 10140ndash150
Preisler H K D R Brillinger R E Burgan and J Benoit 2004 Probability based models for estimation of wildfire risk International Journal of Wildland Fire 13133ndash142
Rebain S E Reinhardt N Crookston S Beukema W Kurz and J Greenough 2009 The fire and fuels extension to the Forest Vegetation Simulator Addendum to RMRS-GTR-119 USDA Forest Service and ESSA Technologies Ltd Fort Collins Colorado USA
Reinhardt E D and N L Crookston 2003 The fire and fuels extension to the forest vegetation simulashytor Pages 209 RMRS-GTR-116 USDA Forest Sershyvice Rocky Mountain Research Station Ogden Utah USA
Reinhardt E and L Holsinger 2010 Effects of fuel treatments on carbon-disturbance relationshyships in forests of the northern Rocky Mountains Forest Ecology and Management 2591427ndash1435
wwwesajournalsorg 20 January 2017 Volume 8(1) Article e01648
CHIONO ET AL
Reinhardt E D R E Keane D E Calkin and J D Cohen 2008 Objectives and considerations for wildland fuel treatment in forested ecosystems of the interior western United States Forest Ecology and Management 2561997ndash2006
Ritchie M W C N Skinner and T A Hamilton 2007 Probability of tree survival after wildfire in an interior pine forest of northern California effects of thinning and prescribed fire Forest Ecolshyogy and Management 247200ndash208
Roloff G J S P Mealey and J D Bailey 2012 Comshyparative hazard assessment for protected species in a fire-prone landscape Forest Ecology and Manshyagement 2771ndash10
Rothermel R C 1972 A mathematical model for preshydicting fire spread in wildland fuels Research Paper INT-115 USDA Forest Service Intermounshytain Forest and Range Experiment Station Ogden Utah USA
Safford H D 2008 Fire severity in fuel treatments American River Complex fire Tahoe National Forest California Unpublished Report USDA Forest Service Pacific Southwest Region Vallejo California USA
Schmidt D A A H Taylor and C N Skinner 2008 The influence of fuels treatment and landscape arrangement on simulated fire behavior Southern Cascade range California Forest Ecology and Management 2553170ndash3184
Scott J H and R E Burgan 2005 Standard fire behavior fuel models a comprehensive set for use with Rothermelrsquos surface fire spread model General Technical Report RMRS-GTR-153 USDA Forest Service Rocky Mountain Research Station Fort Collins Colorado USA
Scott J H M P Thompson and J W Gilbertson-Day 2016 Examining alternative fuel management strategies and the relative contribution of National Forest System land to wildfire risk to adjacent homesndasha pilot assessment on the Sierra National Forest California USA Forest Ecology and Manshyagement 36229ndash37
Smith J E and L S Heath 2002 A model of forest floor carbon mass for United States forest types Research Paper NE-722 USDA Forest Service Northeastern Research Station Newtown Square Pennsylvania USA
Stephens S L 2005 Forest fire causes and extent on United States Forest Service lands International Journal of Wildland Fire 14213ndash222
Stephens S L B M Collins E Biber and P Z Fulme 2016a US federal fire and forest policy emphasizshying resilience in dry forests Ecosphere 7e01584
Stephens S L J D Miller B M Collins M P North J J Keane and S L Roberts 2016b Wildfire impacts on California Spotted Owl nesting habitat in the Sierra Nevada Ecosphere 7e01584
Stephens S L J J Moghaddas B R Hartsough E E Y Moghaddas and N E Clinton 2009 Fuel treatshyment effects on stand-level carbon pools treatshyment-related emissions and fire risk in a Sierra Nevada mixed-conifer forest Canadian Journal of Forest Research 391538ndash1547
Stephens S L et al 2012 Fuel treatment impacts on estimated wildfire carbon loss from forests in Monshytana Oregon California and Arizona Ecosphere 31ndash17
Tempel D et al 2015 Evaluating short- and longshyterm impacts of fuels treatments and simulated wildfire on an old-forest species Ecosphere 61ndash19
USDA Forest Service 2004 Sierra Nevada Forest Plan Amendment Final supplemental environmental impact statement Record of decision Publication R5-MB-046 USDA Forest Service Pacific Southshywest Region Vallejo California USA
Van Wagner C E 1977 Conditions for the start and spread of crown fire Canadian Journal of Forest Research 723ndash34
Verner J K S McKelvey B R Noon R Gutimerrez G I Gould Jr and T W Beck 1992 Assessment of the current status of the California spotted owl with recommendations for management Pages 3ndash27 in J Verner K S McKelvey B R Noon R Gutimerrez G I Gould Jr and T W Beck edishytors The California Spotted Owl a technical assessment of its current status PSW-GTR-133 USDA Forest Service Albany California USA
Westerling A B Bryant H Preisler T Holmes H Hidalgo T Das and S Shrestha 2011 Climate change and growth scenarios for California wildshyfire Climatic Change 109445ndash463
Westerling A L H G Hidalgo D R Cayan and T W Swetnam 2006 Warming and earlier Spring increase Western US Forest Wildfire Activity Science 313940ndash943
Wiedinmyer C and M D Hurteau 2010 Prescribed fire as a means of reducing forest carbon emissions in the Western United States Environmental Science amp Technology 441926ndash1932
SUPPORTING INFORMATION
Additional Supporting Information may be found online at httponlinelibrarywileycomdoi101002ecs2 1648full
wwwesajournalsorg 21 January 2017 Volume 8(1) Article e01648
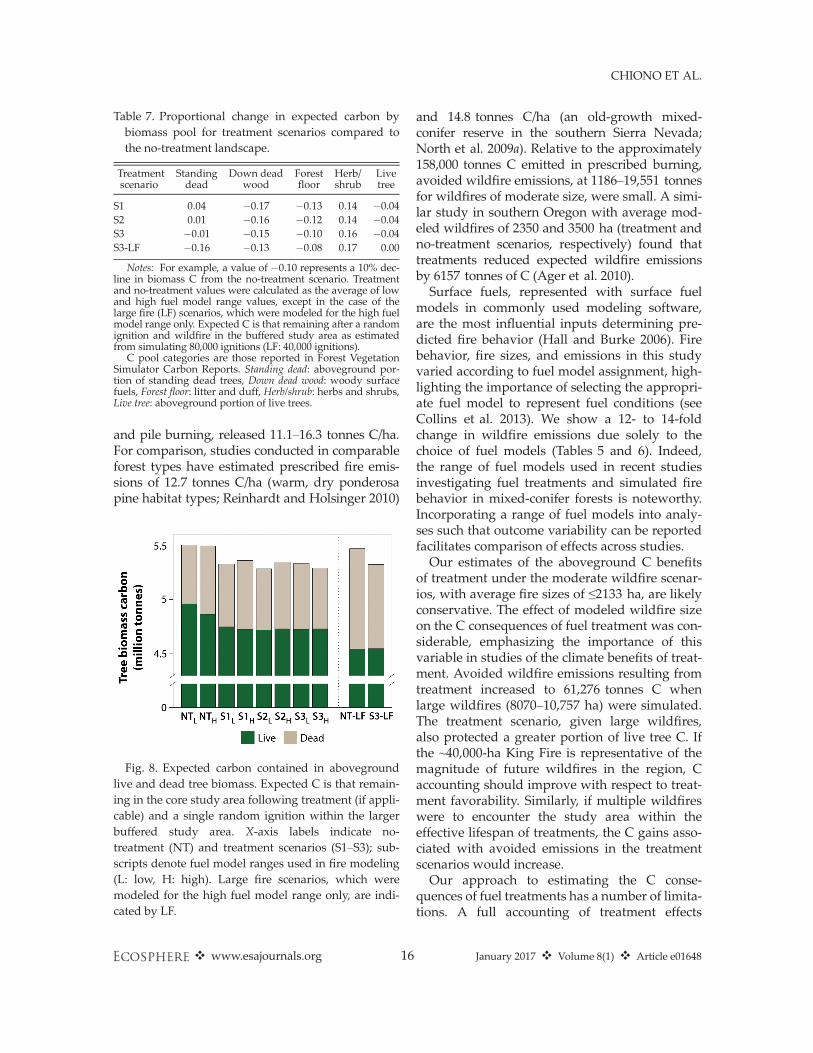
CHIONO ET AL
Table 7 Proportional change in expected carbon by biomass pool for treatment scenarios compared to the no-treatment landscape
Treatment Standing Down dead Forest Herb Live scenario dead wood floor shrub tree
S1 004 -017 -013 014 -004 S2 001 -016 -012 014 -004 S3 -001 -015 -010 016 -004 S3-LF -016 -013 -008 017 000
Notes For example a value of -010 represents a 10 decshyline in biomass C from the no-treatment scenario Treatment and no-treatment values were calculated as the average of low and high fuel model range values except in the case of the large fire (LF) scenarios which were modeled for the high fuel model range only Expected C is that remaining after a random ignition and wildfire in the buffered study area as estimated from simulating 80000 ignitions (LF 40000 ignitions)
C pool categories are those reported in Forest Vegetation Simulator Carbon Reports Standing dead aboveground porshytion of standing dead trees Down dead wood woody surface fuels Forest floor litter and duff Herbshrub herbs and shrubs Live tree aboveground portion of live trees
and pile burning released 111ndash163 tonnes Cha For comparison studies conducted in comparable forest types have estimated prescribed fire emisshysions of 127 tonnes Cha (warm dry ponderosa pine habitat types Reinhardt and Holsinger 2010)
Fig 8 Expected carbon contained in aboveground live and dead tree biomass Expected C is that remainshying in the core study area following treatment (if applishycable) and a single random ignition within the larger buffered study area X-axis labels indicate no-treatment (NT) and treatment scenarios (S1ndashS3) subshyscripts denote fuel model ranges used in fire modeling (L low H high) Large fire scenarios which were modeled for the high fuel model range only are indishycated by LF
and 148 tonnes Cha (an old-growth mixed-conifer reserve in the southern Sierra Nevada North et al 2009a) Relative to the approximately 158000 tonnes C emitted in prescribed burning avoided wildfire emissions at 1186ndash19551 tonnes for wildfires of moderate size were small A simishylar study in southern Oregon with average modshyeled wildfires of 2350 and 3500 ha (treatment and no-treatment scenarios respectively) found that treatments reduced expected wildfire emissions by 6157 tonnes of C (Ager et al 2010) Surface fuels represented with surface fuel
models in commonly used modeling software are the most influential inputs determining preshydicted fire behavior (Hall and Burke 2006) Fire behavior fire sizes and emissions in this study varied according to fuel model assignment highshylighting the importance of selecting the approprishyate fuel model to represent fuel conditions (see Collins et al 2013) We show a 12- to 14-fold change in wildfire emissions due solely to the choice of fuel models (Tables 5 and 6) Indeed the range of fuel models used in recent studies investigating fuel treatments and simulated fire behavior in mixed-conifer forests is noteworthy Incorporating a range of fuel models into analyshyses such that outcome variability can be reported facilitates comparison of effects across studies Our estimates of the aboveground C benefits
of treatment under the moderate wildfire scenarshyios with average fire sizes of le2133 ha are likely conservative The effect of modeled wildfire size on the C consequences of fuel treatment was conshysiderable emphasizing the importance of this variable in studies of the climate benefits of treatshyment Avoided wildfire emissions resulting from treatment increased to 61276 tonnes C when large wildfires (8070ndash10757 ha) were simulated The treatment scenario given large wildfires also protected a greater portion of live tree C If the ~40000-ha King Fire is representative of the magnitude of future wildfires in the region C accounting should improve with respect to treatshyment favorability Similarly if multiple wildfires were to encounter the study area within the effective lifespan of treatments the C gains assoshyciated with avoided emissions in the treatment scenarios would increase Our approach to estimating the C conseshy
quences of fuel treatments has a number of limitashytions A full accounting of treatment effects
wwwesajournalsorg 16 January 2017 Volume 8(1) Article e01648
CHIONO ET AL
would project through time the consequences of both treatment and wildfire Our analysis is static incorporating only the short-term C costs and benefits of treatment Simulating wildfire in the year immediately following treatment maximizes the apparent benefits of treatment Over time as surface fuels accumulate and vegetation regenershyates maintenance would be required to retain the effectiveness of treatments (Martinson and Omi 2013) increasing the C costs of reduced fire hazard In addition the C contained in fire-killed biomass will ultimately be emitted to the atmoshysphere although biomass decay could be delayed through conversion to long-lived wood products such as building materials (Malmsheimer et al 2011) It is also important to note that our analysis did not include stochastic wildfire occurrence Estimates of burn probability in the present study are not estimates of the likelihood of wildfire occurrence based on historical fire sizes and freshyquency (eg Preisler et al 2004 Mercer and Prestemon 2005 Brillinger et al 2006) but rather are conditional on a single randomly ignited wildfire within the buffered study area
CONCLUSIONS
Our findings generally support those of Campshybell et al (2011) who concluded from an analysis of fire-prone western forests that the C costs of treatments are likely to outweigh their benefits under current depressed fire frequencies In a more recent paper Campbell and Ager (2013) conshycluded that ldquonone of the fuel treatment simulation scenarios resulted in increased system carbonrdquo primarily from the low incidences of treated areas being burned by wildfire However our interpreshytation of these findings differs from those disshycussed in Campbell et al (2011) and Campbell and Ager (2013) especially in light of recent and projected future trends in fire activity (Westerling et al 2011 Miller and Safford 2012 Dennison et al 2014) The current divergence of increasing surface air temperatures and low fire activity is unlikely to be sustained further suggesting greater future fire activity (Marlon et al 2012) If increased fire activity is realized then the likelishyhood of a given area being burned in a wildfire increases This differs from the simple increase in stand-level fire frequency modeled by Campbell et al (2011) because increases in fire likelihood are
not necessarily associated with corresponding decreases in fire severity as assumed by Campbell et al (2011) Increased fire likelihood could very well lead to positive feedbacks in fire severity and ultimately to vegetation type conversion (Copposhyletta et al 2016)mdasheffects that would have signifishycant implications for carbon storage Due to the significant emissions associated
with treatment and the low likelihood that wildshyfire will encounter a given treatment area forest management that is narrowly focused on C accounting alone would favor the no-treatment scenarios Landscape treatments protected more C in live tree biomass only when large wildfires were simulated While treatment favorability improved with large wildfire simulation the no-treatment scenario still produced fewer emissions than the treatment scenario Given the potential for large wildfire in the region as demonstrated by the 2014 King Fire and the increasing freshyquency of large wildfires and area burned in Calishyfornia expected from climate modeling studies (Lenihan et al 2008 Westerling et al 2011) we suggest that future studies of fuel treatmentndashwildshyfirendashC relationships should incorporate the potenshytial for large wildfires at a frequency greater than those observed over the last 20ndash30 yr Others have argued that treatments to increase forest resilience should be a stand-alone top land management priority independent of other ecosystem values such as carbon sequestration and fire hazard reduction (Stephens et al 2016a) We also note that the potential benefits of fuels
management are not restricted to avoided wildshyfire emissions Here we show that landscape fuel treatments can alter fire hazard across the landshyscape both within and outside of treated stands and have the potential to affect the likelihood of burning and fire intensity within protected Calishyfornia spotted owl habitat Underscoring the risk to sensitive habitat the 2014 King Fire encounshytered 31 PACs within our study area leading to the greatest single-year decline in habitat occushypancy recorded over a 23-yr study period (Jones et al 2016) Modest simulated treatments within activity centers significantly reduced potential fire intensity relative to both the no-treatment landscape and a treatment scenario that did not permit treatment within PACs indicating that active management may be desirable to protect habitat in the long term (Roloff et al 2012)
wwwesajournalsorg 17 January 2017 Volume 8(1) Article e01648
CHIONO ET AL
However treatments conducted outside of owl habitat also reduced wildfire hazard
ACKNOWLEDGMENTS
We are grateful to a number of individuals for sharshying their time and fuel treatment and fire modeling expertise Nicole Vaillant (ArcFuels) Alan Ager and Andrew McMahan (carbon estimation) and Coeli Hoover (harvest simulations in FVS-FFE) Brian Ebert and Dana Walsh of the Eldorado National Forest proshyvided invaluable advice on weather inputs for fire modeling and on designing fuel treatment prescripshytions Ken Somers Operations Forester on the Blodgett Forest Research Station gave advice concerning timshyber management on private land We also thank two anonymous reviewers whose comments greatly improved this article The California Energy Commisshysion provided funding for this project
LITERATURE CITED
Ager A A B Bahro and K Barber 2006 Automating the fireshed assessment process with ArcGIS Pages 163ndash167 in P L Andrews and B W Butler (Comps) Fuels ManagementndashHow to Measure Success Conference Proceedings Portland OR March 28ndash30 2006 Proceedings RMRS-P-41 USDA Forest Service Rocky Mountain Research Station Fort Collins Colorado USA
Ager A A M A Finney B K Kerns and H Maffei 2007 Modeling wildfire risk to northern spotted owl (Strix occidentalis caurina) habitat in Central Oregon USA Forest Ecology and Management 24645ndash56
Ager A A M A Finney A McMahan and J Cathcart 2010 Measuring the effect of fuel treatments on forshyest carbon using landscape risk analysis Natural Hazards and Earth System Science 102515ndash2526
Ager A A N M Vaillant D E Owens S Brittain and J Hamann 2012 Overview and example application of the Landscape Treatment Designer Pages 11 General Technical Report PNW-GTR-859 USDA Forest Service Pacific Northwest Research Station Portland Oregon USA
Barbour M G and R A Minnich 2000 Californian upland forests and woodlands Pages 131ndash164 in M Barbour and W Billings editors North Amerishycan terrestrial vegetation Cambridge University Press Cambridge UK
Bias M A and R Gutimerrez 1992 Habitat associations of California spotted owls in the central Sierra Nevada Journal of Wildlife Management 56584ndash595
Bond M L R Gutierrez A B Franklin W S LaHaye C A May and M E Seamans 2002
Short-term effects of wildfires on spotted owl surshyvival site fidelity mate fidelity and reproductive success Wildlife Society Bulletin 301022ndash1028
Brillinger D H Preisler and J Benoit 2006 Probashybilistic risk assessment for wildfires Environ-metrics 17623ndash633
Campbell J L and A A Ager 2013 Forest wildfire fuel reduction treatments and landscape carbon stocks a sensitivity analysis Journal of Environshymental Management 121124ndash132
Campbell J L M E Harmon and S R Mitchell 2011 Can fuel-reduction treatments really increase forest carbon storage in the western US by reducshying future fire emissions Frontiers in Ecology and the Environment 1083ndash90
Cathcart J A A Ager A McMahan M Finney and B Watt 2010 Carbon benefits from fuel treatshyments Pages 61ndash80 in T B Jain R T Graham and J Sandquist editors Integrated management of carbon sequestration and biomass utilization opportunities in a changing climate Proceedings of the 2009 National Silviculture Workshop Boise Idaho June 15ndash18 2009 USDA Forest Service Proshyceedings RMRS-P-61 Rocky Mountain Research Station Fort Collins Colorado USA
Chatfield A H 2005 Habitat selection by a California spotted owl population a landscape scale analysis using resource selection functions Thesis Univershysity of Minnesota St Paul Minnesota USA
Collins B M H A Kramer K Menning C Dilling-ham D Saah P A Stine and S L Stephens 2013 Modeling hazardous fire potential within a comshypleted fuel treatment network in the northern Sierra Nevada Forest Ecology and Management 310156ndash166
Collins B M S L Stephens J J Moghaddas and J Battles 2010 Challenges and approaches in planshyning fuel treatments across fire-excluded forested landscapes Journal of Forestry 10824ndash31
Collins B M S L Stephens G B Roller and J J Battles 2011 Simulating fire and forest dynamics for a landscape fuel treatment project in the Sierra Nevada Forest Science 5777ndash88
Coppoletta M K E Merriam and B M Collins 2016 Post-fire vegetation and fuel development influences fire severity patterns in reburns Ecologishycal Applications 26686ndash699
Crookston N L and A O Finley 2008 yaimpute an r package for knn imputation Journal of Statistical Software 231ndash16
Crookston N L M Moeur and D L Renner 2002 Userrsquos guide to the most similar neighbor imputashytion program version 2 General Technical Report RMRS-GTR-96 USDA Forest Service Rocky Mountain Research Station Ogden Utah USA
wwwesajournalsorg 18 January 2017 Volume 8(1) Article e01648
CHIONO ET AL
Crosby J and C Chandler 1966 Get the most from your windspeed observations Fire Control Notes 2712ndash13
Dailey S J Fites A Reiner and S Mori 2008 Fire behavior and effects in fuel treatments and proshytected habitat on the Moonlight fire Fire Behavior Assessment Team wwwfsfedusadaptivemana gementprojectsFBATdocsMoonlightFinal_8_6_08 pdf
Dennison P E S C Brewer J D Arnold and M A Moritz 2014 Large wildfire trends in the western United States 1984ndash2011 Geophysical Research Letters 412928ndash2933
Dixon G E 2002 Essential FVS a userrsquos guide to the forest vegetation simulator Pages 193 USDA Forest Service Forest Management Service Center Fort Collins Colorado USA
Dore S T E Kolb M Montes-Helu B W Sullivan W D Winslow S C Hart J P Kaye G W Koch and B A Hungate 2008 Long-term impact of a stand-replacing fire on ecosystem CO2 exchange of a ponderosa pine forest Global Change Biology 141ndash20
Dore S M Montes-Helu S C Hart B A Hungate G W Koch J B Moon A J Finkral and T E Kolb 2012 Recovery of ponderosa pine ecosystem carbon and water fluxes from thinning and stand-replacing fire Global Change Biology 183171ndash3185
Dow C J B M Collins and S L Stephens 2016 Incorporating resource protection constraints in an analysis of landscape fuel-treatment effectiveness in the Northern Sierra Nevada California USA Environmental Management 571ndash15
Eidenshink J B Schwind K Brewer Z Zhu B Quayle and S Howard 2007 A project for monshyitoring trends in burn severity Fire Ecology 33ndash21
Evans A M and A J Finkral 2009 From renewable energy to fire risk reduction a synthesis of biomass harvesting and utilization case studies in US forshyests GCB Bioenergy 1211ndash219
Finkral A J and A M Evans 2008 The effects of a thinning treatment on carbon stocks in a northern Arizona ponderosa pine forest Forest Ecology and Management 2552743ndash2750
Finney M A 2001 Design of regular landscape fuel treatment patterns for modifying fire growth and behavior Forest Science 47219ndash228
Finney M A 2002 Fire growth using minimum travel time methods Canadian Journal of Forest Research 321420ndash1424
Finney M A 2006 An overview of FlamMap fire modeling capabilities Pages 213ndash220 in P L Andrews and B W Butler editors Proceedings of Fuels ManagementndashHow to Measure Success Research Paper RMRS-P-41 USDA Forest Service
Rocky Mountain Research Station Portland Oregon USA
Finney M A R C Seli C W McHugh A A Ager B Bahro and J K Agee 2007 Simulation of longshyterm landscape-level fuel treatment effects on large wildfires International Journal of Wildland Fire 16712ndash727
Fulme P Z J E Crouse J P Roccaforte and E L Kalies 2012 Do thinning andor burning treatments in western USA ponderosa or Jeffrey pine-dominated forests help restore natural fire behavior Forest Ecology and Management 26968ndash81
Gaines W L R J Harrod J Dickinson A L Lyons and K Halupka 2010 Integration of Northern spotted owl habitat and fuels treatments in the eastern Cascades Washington USA Forest Ecolshyogy and Management 2602045ndash2052
Gaines W L R A Strand and S D Piper 1997 Effects of the hatchery complex fires on northern spotted owls in the eastern Washington Cascades Pages 123ndash129 in J N Greenlee editor Proceedings of the Fire Effects on Rare and Endangered Species and Habitats Conference Coeur DrsquoAlene Idaho International Association of Wildfire and Forestry Hot Springs South Dakota USA
Hall S A and I C Burke 2006 Considerations for characterizing fuels as inputs for fire behavior models Forest Ecology and Management 227 102ndash114
Hoover C and S Rebain 2008 The Kane Experimenshytal Forest carbon inventory carbon reporting with FVS Pages 13ndash15 in R N Havis and N L Crookston editors Third Forest Vegetation Simushylator Conference Fort Collins Colorado February 13ndash15 2007 USDA Forest Service Rocky Mountain Research Station Fort Collins Colorado USA
Hurteau M and M North 2009 Fuel treatment effects on tree-based forest carbon storage and emissions under modeled wildfire scenarios Fronshytiers in Ecology and the Environment 7409ndash414
Hurteau M D and M North 2010 Carbon recovery rates following different wildfire risk mitigation treatments Forest Ecology and Management 260 930ndash937
Hurteau M D M T Stoddard and P Z Fulme 2011 The carbon costs of mitigating high-severity wildshyfire in southwestern ponderosa pine Global Change Biology 171516ndash1521
Jenness J S P Beier and J L Ganey 2004 Associashytions between forest fire and Mexican spotted owls Forest Science 50765ndash772
Jones G M R Gutimerrez D J Tempel S A Whitmore W J Berigan and M Z Peery 2016 Megafires an emerging threat to old-forest species Frontiers in Ecology and the Environment 14300ndash306
wwwesajournalsorg 19 January 2017 Volume 8(1) Article e01648
CHIONO ET AL
Laymon S A 1988 Ecology of the spotted owl in the central Sierra Nevada California Dissertation University of California Berkeley California USA
Lenihan J M D Bachelet R P Neilson and R Drapek 2008 Response of vegetation distribution ecosystem productivity and fire to climate change scenarios for California Climatic Change 87215ndash230
Lydersen J M B M Collins E E Knapp G B Roller and S Stephens 2015 Relating fuel loads to overshystorey structure and composition in a fire-excluded Sierra Nevada mixed conifer forest International Journal of Wildland Fire 24484ndash494
Malmsheimer R J Bowyer J Fried E Gee R Islar R Miner I E Munn E Oneil and W C Stewart 2011 Managing forests because carbon matters integrating energy products and land manageshyment policy Journal of Forestry 109S7ndashS50
Marlon J R et al 2012 Long-term perspective on wildfires in the western USA Proceedings of the National Academy of Sciences of the United States of America 109E535ndashE543
Martinson E J and P N Omi 2002 Performance of fuel treatments subjected to wildfires Pages 7ndash13 in P N Omi and L A Joyce editors Conference on Fire Fuel Treatments and Ecological Restorashytion USDA Forest Service Rocky Mountain Research Station Fort Collins Colorado USA
Martinson E J and P N Omi 2013 Fuel treatments and fire severity a meta-analysis Pages 38 USDA Forest Service Rocky Mountain Research Station Fort Collins Colorado USA
Mayer K E and W F Laudenslayer 1988 A guide to wildlife habitats of California California Departshyment of Forestry and Fire Protection Sacramento California USA
McKenzie D Z Gedalof D L Peterson and P Mote 2004 Climatic change wildfire and conservation Conservation Biology 18890ndash902
Mercer D E and J P Prestemon 2005 Comparing production function models for wildfire risk analyshysis in the wildlandndashurban interface Forest Policy and Economics 7782ndash795
Miller J D and H Safford 2012 Trends in wildfire severity 1984 to 2010 in the Sierra Nevada Modoc Plateau and southern Cascades California USA Fire Ecology 841ndash57
Miller J H Safford M Crimmins and A Thode 2009 Quantitative evidence for increasing forest fire severity in the Sierra Nevada and southern Cascade mountains California and Nevada USA Ecosystems 1216ndash32
North M 2012 Managing Sierra Nevada forests PSWshyGTR-237 USDA Forest Service Pacific Southwest Research Station Albany California USA
North M P and M D Hurteau 2011 High-severity wildfire effects on carbon stocks and emissions in fuels treated and untreated forest Forest Ecology and Management 2611115ndash1120
North M M Hurteau and J Innes 2009a Fire supshypression and fuels treatment effects on mixed-conifer carbon stocks and emissions Ecological Applications 191385ndash1396
North M P A Stine K OrsquoHara W Zielinski and S Stephens 2009b An ecosystem management strategy for Sierran mixed-conifer forests General Technical Report PSW-GTR-220 USDA Forest Service Pacific Southwest Research Station Albany California USA
Parisien M-A S Snetsinger J A Greenberg C R Nelson T Schoennagel S Z Dobrowski and M A Moritz 2012 Spatial variability in wildfire probability across the western United States Intershynational Journal of Wildland Fire 21313ndash327
Penman J M Gytarsky T Hiraishi T Krug D Kruger R Pipatti L Buendia K Miwa T Ngara and K Tanabe 2003 Good practice guidance for land use land-use change and forestry Institute for Global Environmental Strategies for the Intergovshyernmental Panel on Climate Change Hayama Kanagawa Japan
Pollet J and P N Omi 2002 Effect of thinning and prescribed burning on crown fire severity in ponderosa pine forests International Journal of Wildland Fire 111ndash10
Prather J W R F Noss and T D Sisk 2008 Real versus perceived conflicts between restoration of ponderosa pine forests and conservation of the Mexican spotted owl Forest Policy and Economics 10140ndash150
Preisler H K D R Brillinger R E Burgan and J Benoit 2004 Probability based models for estimation of wildfire risk International Journal of Wildland Fire 13133ndash142
Rebain S E Reinhardt N Crookston S Beukema W Kurz and J Greenough 2009 The fire and fuels extension to the Forest Vegetation Simulator Addendum to RMRS-GTR-119 USDA Forest Service and ESSA Technologies Ltd Fort Collins Colorado USA
Reinhardt E D and N L Crookston 2003 The fire and fuels extension to the forest vegetation simulashytor Pages 209 RMRS-GTR-116 USDA Forest Sershyvice Rocky Mountain Research Station Ogden Utah USA
Reinhardt E and L Holsinger 2010 Effects of fuel treatments on carbon-disturbance relationshyships in forests of the northern Rocky Mountains Forest Ecology and Management 2591427ndash1435
wwwesajournalsorg 20 January 2017 Volume 8(1) Article e01648
CHIONO ET AL
Reinhardt E D R E Keane D E Calkin and J D Cohen 2008 Objectives and considerations for wildland fuel treatment in forested ecosystems of the interior western United States Forest Ecology and Management 2561997ndash2006
Ritchie M W C N Skinner and T A Hamilton 2007 Probability of tree survival after wildfire in an interior pine forest of northern California effects of thinning and prescribed fire Forest Ecolshyogy and Management 247200ndash208
Roloff G J S P Mealey and J D Bailey 2012 Comshyparative hazard assessment for protected species in a fire-prone landscape Forest Ecology and Manshyagement 2771ndash10
Rothermel R C 1972 A mathematical model for preshydicting fire spread in wildland fuels Research Paper INT-115 USDA Forest Service Intermounshytain Forest and Range Experiment Station Ogden Utah USA
Safford H D 2008 Fire severity in fuel treatments American River Complex fire Tahoe National Forest California Unpublished Report USDA Forest Service Pacific Southwest Region Vallejo California USA
Schmidt D A A H Taylor and C N Skinner 2008 The influence of fuels treatment and landscape arrangement on simulated fire behavior Southern Cascade range California Forest Ecology and Management 2553170ndash3184
Scott J H and R E Burgan 2005 Standard fire behavior fuel models a comprehensive set for use with Rothermelrsquos surface fire spread model General Technical Report RMRS-GTR-153 USDA Forest Service Rocky Mountain Research Station Fort Collins Colorado USA
Scott J H M P Thompson and J W Gilbertson-Day 2016 Examining alternative fuel management strategies and the relative contribution of National Forest System land to wildfire risk to adjacent homesndasha pilot assessment on the Sierra National Forest California USA Forest Ecology and Manshyagement 36229ndash37
Smith J E and L S Heath 2002 A model of forest floor carbon mass for United States forest types Research Paper NE-722 USDA Forest Service Northeastern Research Station Newtown Square Pennsylvania USA
Stephens S L 2005 Forest fire causes and extent on United States Forest Service lands International Journal of Wildland Fire 14213ndash222
Stephens S L B M Collins E Biber and P Z Fulme 2016a US federal fire and forest policy emphasizshying resilience in dry forests Ecosphere 7e01584
Stephens S L J D Miller B M Collins M P North J J Keane and S L Roberts 2016b Wildfire impacts on California Spotted Owl nesting habitat in the Sierra Nevada Ecosphere 7e01584
Stephens S L J J Moghaddas B R Hartsough E E Y Moghaddas and N E Clinton 2009 Fuel treatshyment effects on stand-level carbon pools treatshyment-related emissions and fire risk in a Sierra Nevada mixed-conifer forest Canadian Journal of Forest Research 391538ndash1547
Stephens S L et al 2012 Fuel treatment impacts on estimated wildfire carbon loss from forests in Monshytana Oregon California and Arizona Ecosphere 31ndash17
Tempel D et al 2015 Evaluating short- and longshyterm impacts of fuels treatments and simulated wildfire on an old-forest species Ecosphere 61ndash19
USDA Forest Service 2004 Sierra Nevada Forest Plan Amendment Final supplemental environmental impact statement Record of decision Publication R5-MB-046 USDA Forest Service Pacific Southshywest Region Vallejo California USA
Van Wagner C E 1977 Conditions for the start and spread of crown fire Canadian Journal of Forest Research 723ndash34
Verner J K S McKelvey B R Noon R Gutimerrez G I Gould Jr and T W Beck 1992 Assessment of the current status of the California spotted owl with recommendations for management Pages 3ndash27 in J Verner K S McKelvey B R Noon R Gutimerrez G I Gould Jr and T W Beck edishytors The California Spotted Owl a technical assessment of its current status PSW-GTR-133 USDA Forest Service Albany California USA
Westerling A B Bryant H Preisler T Holmes H Hidalgo T Das and S Shrestha 2011 Climate change and growth scenarios for California wildshyfire Climatic Change 109445ndash463
Westerling A L H G Hidalgo D R Cayan and T W Swetnam 2006 Warming and earlier Spring increase Western US Forest Wildfire Activity Science 313940ndash943
Wiedinmyer C and M D Hurteau 2010 Prescribed fire as a means of reducing forest carbon emissions in the Western United States Environmental Science amp Technology 441926ndash1932
SUPPORTING INFORMATION
Additional Supporting Information may be found online at httponlinelibrarywileycomdoi101002ecs2 1648full
wwwesajournalsorg 21 January 2017 Volume 8(1) Article e01648
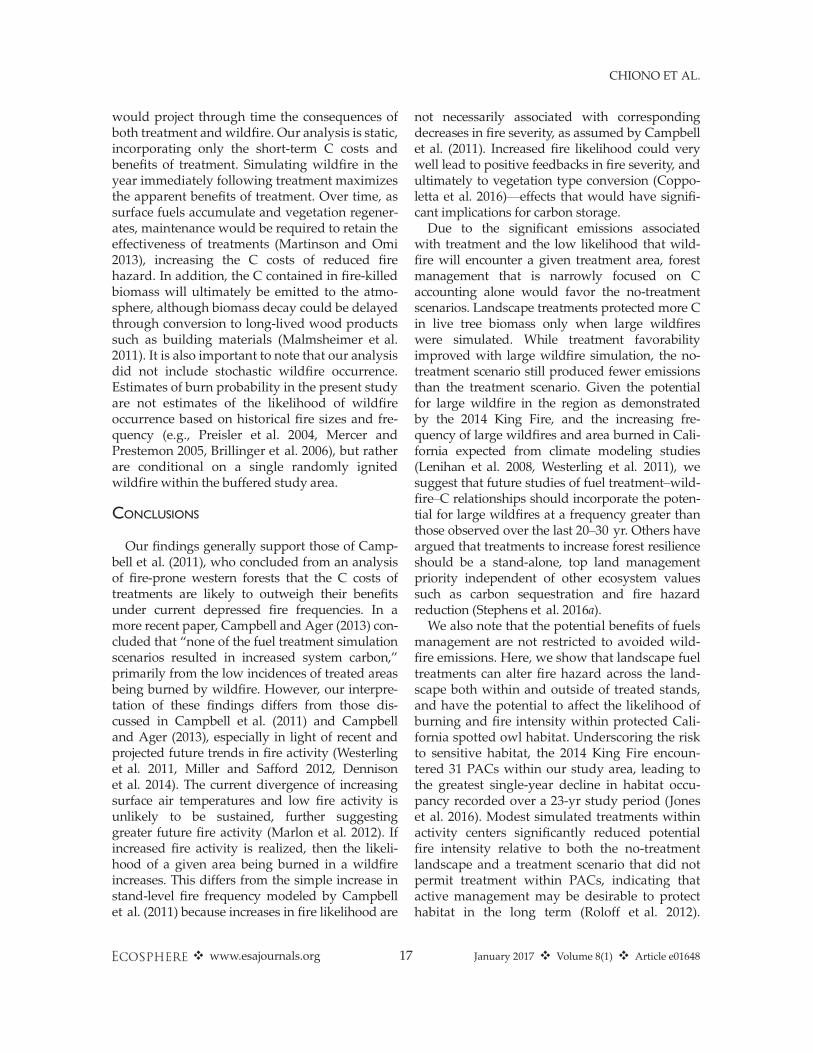
CHIONO ET AL
would project through time the consequences of both treatment and wildfire Our analysis is static incorporating only the short-term C costs and benefits of treatment Simulating wildfire in the year immediately following treatment maximizes the apparent benefits of treatment Over time as surface fuels accumulate and vegetation regenershyates maintenance would be required to retain the effectiveness of treatments (Martinson and Omi 2013) increasing the C costs of reduced fire hazard In addition the C contained in fire-killed biomass will ultimately be emitted to the atmoshysphere although biomass decay could be delayed through conversion to long-lived wood products such as building materials (Malmsheimer et al 2011) It is also important to note that our analysis did not include stochastic wildfire occurrence Estimates of burn probability in the present study are not estimates of the likelihood of wildfire occurrence based on historical fire sizes and freshyquency (eg Preisler et al 2004 Mercer and Prestemon 2005 Brillinger et al 2006) but rather are conditional on a single randomly ignited wildfire within the buffered study area
CONCLUSIONS
Our findings generally support those of Campshybell et al (2011) who concluded from an analysis of fire-prone western forests that the C costs of treatments are likely to outweigh their benefits under current depressed fire frequencies In a more recent paper Campbell and Ager (2013) conshycluded that ldquonone of the fuel treatment simulation scenarios resulted in increased system carbonrdquo primarily from the low incidences of treated areas being burned by wildfire However our interpreshytation of these findings differs from those disshycussed in Campbell et al (2011) and Campbell and Ager (2013) especially in light of recent and projected future trends in fire activity (Westerling et al 2011 Miller and Safford 2012 Dennison et al 2014) The current divergence of increasing surface air temperatures and low fire activity is unlikely to be sustained further suggesting greater future fire activity (Marlon et al 2012) If increased fire activity is realized then the likelishyhood of a given area being burned in a wildfire increases This differs from the simple increase in stand-level fire frequency modeled by Campbell et al (2011) because increases in fire likelihood are
not necessarily associated with corresponding decreases in fire severity as assumed by Campbell et al (2011) Increased fire likelihood could very well lead to positive feedbacks in fire severity and ultimately to vegetation type conversion (Copposhyletta et al 2016)mdasheffects that would have signifishycant implications for carbon storage Due to the significant emissions associated
with treatment and the low likelihood that wildshyfire will encounter a given treatment area forest management that is narrowly focused on C accounting alone would favor the no-treatment scenarios Landscape treatments protected more C in live tree biomass only when large wildfires were simulated While treatment favorability improved with large wildfire simulation the no-treatment scenario still produced fewer emissions than the treatment scenario Given the potential for large wildfire in the region as demonstrated by the 2014 King Fire and the increasing freshyquency of large wildfires and area burned in Calishyfornia expected from climate modeling studies (Lenihan et al 2008 Westerling et al 2011) we suggest that future studies of fuel treatmentndashwildshyfirendashC relationships should incorporate the potenshytial for large wildfires at a frequency greater than those observed over the last 20ndash30 yr Others have argued that treatments to increase forest resilience should be a stand-alone top land management priority independent of other ecosystem values such as carbon sequestration and fire hazard reduction (Stephens et al 2016a) We also note that the potential benefits of fuels
management are not restricted to avoided wildshyfire emissions Here we show that landscape fuel treatments can alter fire hazard across the landshyscape both within and outside of treated stands and have the potential to affect the likelihood of burning and fire intensity within protected Calishyfornia spotted owl habitat Underscoring the risk to sensitive habitat the 2014 King Fire encounshytered 31 PACs within our study area leading to the greatest single-year decline in habitat occushypancy recorded over a 23-yr study period (Jones et al 2016) Modest simulated treatments within activity centers significantly reduced potential fire intensity relative to both the no-treatment landscape and a treatment scenario that did not permit treatment within PACs indicating that active management may be desirable to protect habitat in the long term (Roloff et al 2012)
wwwesajournalsorg 17 January 2017 Volume 8(1) Article e01648
CHIONO ET AL
However treatments conducted outside of owl habitat also reduced wildfire hazard
ACKNOWLEDGMENTS
We are grateful to a number of individuals for sharshying their time and fuel treatment and fire modeling expertise Nicole Vaillant (ArcFuels) Alan Ager and Andrew McMahan (carbon estimation) and Coeli Hoover (harvest simulations in FVS-FFE) Brian Ebert and Dana Walsh of the Eldorado National Forest proshyvided invaluable advice on weather inputs for fire modeling and on designing fuel treatment prescripshytions Ken Somers Operations Forester on the Blodgett Forest Research Station gave advice concerning timshyber management on private land We also thank two anonymous reviewers whose comments greatly improved this article The California Energy Commisshysion provided funding for this project
LITERATURE CITED
Ager A A B Bahro and K Barber 2006 Automating the fireshed assessment process with ArcGIS Pages 163ndash167 in P L Andrews and B W Butler (Comps) Fuels ManagementndashHow to Measure Success Conference Proceedings Portland OR March 28ndash30 2006 Proceedings RMRS-P-41 USDA Forest Service Rocky Mountain Research Station Fort Collins Colorado USA
Ager A A M A Finney B K Kerns and H Maffei 2007 Modeling wildfire risk to northern spotted owl (Strix occidentalis caurina) habitat in Central Oregon USA Forest Ecology and Management 24645ndash56
Ager A A M A Finney A McMahan and J Cathcart 2010 Measuring the effect of fuel treatments on forshyest carbon using landscape risk analysis Natural Hazards and Earth System Science 102515ndash2526
Ager A A N M Vaillant D E Owens S Brittain and J Hamann 2012 Overview and example application of the Landscape Treatment Designer Pages 11 General Technical Report PNW-GTR-859 USDA Forest Service Pacific Northwest Research Station Portland Oregon USA
Barbour M G and R A Minnich 2000 Californian upland forests and woodlands Pages 131ndash164 in M Barbour and W Billings editors North Amerishycan terrestrial vegetation Cambridge University Press Cambridge UK
Bias M A and R Gutimerrez 1992 Habitat associations of California spotted owls in the central Sierra Nevada Journal of Wildlife Management 56584ndash595
Bond M L R Gutierrez A B Franklin W S LaHaye C A May and M E Seamans 2002
Short-term effects of wildfires on spotted owl surshyvival site fidelity mate fidelity and reproductive success Wildlife Society Bulletin 301022ndash1028
Brillinger D H Preisler and J Benoit 2006 Probashybilistic risk assessment for wildfires Environ-metrics 17623ndash633
Campbell J L and A A Ager 2013 Forest wildfire fuel reduction treatments and landscape carbon stocks a sensitivity analysis Journal of Environshymental Management 121124ndash132
Campbell J L M E Harmon and S R Mitchell 2011 Can fuel-reduction treatments really increase forest carbon storage in the western US by reducshying future fire emissions Frontiers in Ecology and the Environment 1083ndash90
Cathcart J A A Ager A McMahan M Finney and B Watt 2010 Carbon benefits from fuel treatshyments Pages 61ndash80 in T B Jain R T Graham and J Sandquist editors Integrated management of carbon sequestration and biomass utilization opportunities in a changing climate Proceedings of the 2009 National Silviculture Workshop Boise Idaho June 15ndash18 2009 USDA Forest Service Proshyceedings RMRS-P-61 Rocky Mountain Research Station Fort Collins Colorado USA
Chatfield A H 2005 Habitat selection by a California spotted owl population a landscape scale analysis using resource selection functions Thesis Univershysity of Minnesota St Paul Minnesota USA
Collins B M H A Kramer K Menning C Dilling-ham D Saah P A Stine and S L Stephens 2013 Modeling hazardous fire potential within a comshypleted fuel treatment network in the northern Sierra Nevada Forest Ecology and Management 310156ndash166
Collins B M S L Stephens J J Moghaddas and J Battles 2010 Challenges and approaches in planshyning fuel treatments across fire-excluded forested landscapes Journal of Forestry 10824ndash31
Collins B M S L Stephens G B Roller and J J Battles 2011 Simulating fire and forest dynamics for a landscape fuel treatment project in the Sierra Nevada Forest Science 5777ndash88
Coppoletta M K E Merriam and B M Collins 2016 Post-fire vegetation and fuel development influences fire severity patterns in reburns Ecologishycal Applications 26686ndash699
Crookston N L and A O Finley 2008 yaimpute an r package for knn imputation Journal of Statistical Software 231ndash16
Crookston N L M Moeur and D L Renner 2002 Userrsquos guide to the most similar neighbor imputashytion program version 2 General Technical Report RMRS-GTR-96 USDA Forest Service Rocky Mountain Research Station Ogden Utah USA
wwwesajournalsorg 18 January 2017 Volume 8(1) Article e01648
CHIONO ET AL
Crosby J and C Chandler 1966 Get the most from your windspeed observations Fire Control Notes 2712ndash13
Dailey S J Fites A Reiner and S Mori 2008 Fire behavior and effects in fuel treatments and proshytected habitat on the Moonlight fire Fire Behavior Assessment Team wwwfsfedusadaptivemana gementprojectsFBATdocsMoonlightFinal_8_6_08 pdf
Dennison P E S C Brewer J D Arnold and M A Moritz 2014 Large wildfire trends in the western United States 1984ndash2011 Geophysical Research Letters 412928ndash2933
Dixon G E 2002 Essential FVS a userrsquos guide to the forest vegetation simulator Pages 193 USDA Forest Service Forest Management Service Center Fort Collins Colorado USA
Dore S T E Kolb M Montes-Helu B W Sullivan W D Winslow S C Hart J P Kaye G W Koch and B A Hungate 2008 Long-term impact of a stand-replacing fire on ecosystem CO2 exchange of a ponderosa pine forest Global Change Biology 141ndash20
Dore S M Montes-Helu S C Hart B A Hungate G W Koch J B Moon A J Finkral and T E Kolb 2012 Recovery of ponderosa pine ecosystem carbon and water fluxes from thinning and stand-replacing fire Global Change Biology 183171ndash3185
Dow C J B M Collins and S L Stephens 2016 Incorporating resource protection constraints in an analysis of landscape fuel-treatment effectiveness in the Northern Sierra Nevada California USA Environmental Management 571ndash15
Eidenshink J B Schwind K Brewer Z Zhu B Quayle and S Howard 2007 A project for monshyitoring trends in burn severity Fire Ecology 33ndash21
Evans A M and A J Finkral 2009 From renewable energy to fire risk reduction a synthesis of biomass harvesting and utilization case studies in US forshyests GCB Bioenergy 1211ndash219
Finkral A J and A M Evans 2008 The effects of a thinning treatment on carbon stocks in a northern Arizona ponderosa pine forest Forest Ecology and Management 2552743ndash2750
Finney M A 2001 Design of regular landscape fuel treatment patterns for modifying fire growth and behavior Forest Science 47219ndash228
Finney M A 2002 Fire growth using minimum travel time methods Canadian Journal of Forest Research 321420ndash1424
Finney M A 2006 An overview of FlamMap fire modeling capabilities Pages 213ndash220 in P L Andrews and B W Butler editors Proceedings of Fuels ManagementndashHow to Measure Success Research Paper RMRS-P-41 USDA Forest Service
Rocky Mountain Research Station Portland Oregon USA
Finney M A R C Seli C W McHugh A A Ager B Bahro and J K Agee 2007 Simulation of longshyterm landscape-level fuel treatment effects on large wildfires International Journal of Wildland Fire 16712ndash727
Fulme P Z J E Crouse J P Roccaforte and E L Kalies 2012 Do thinning andor burning treatments in western USA ponderosa or Jeffrey pine-dominated forests help restore natural fire behavior Forest Ecology and Management 26968ndash81
Gaines W L R J Harrod J Dickinson A L Lyons and K Halupka 2010 Integration of Northern spotted owl habitat and fuels treatments in the eastern Cascades Washington USA Forest Ecolshyogy and Management 2602045ndash2052
Gaines W L R A Strand and S D Piper 1997 Effects of the hatchery complex fires on northern spotted owls in the eastern Washington Cascades Pages 123ndash129 in J N Greenlee editor Proceedings of the Fire Effects on Rare and Endangered Species and Habitats Conference Coeur DrsquoAlene Idaho International Association of Wildfire and Forestry Hot Springs South Dakota USA
Hall S A and I C Burke 2006 Considerations for characterizing fuels as inputs for fire behavior models Forest Ecology and Management 227 102ndash114
Hoover C and S Rebain 2008 The Kane Experimenshytal Forest carbon inventory carbon reporting with FVS Pages 13ndash15 in R N Havis and N L Crookston editors Third Forest Vegetation Simushylator Conference Fort Collins Colorado February 13ndash15 2007 USDA Forest Service Rocky Mountain Research Station Fort Collins Colorado USA
Hurteau M and M North 2009 Fuel treatment effects on tree-based forest carbon storage and emissions under modeled wildfire scenarios Fronshytiers in Ecology and the Environment 7409ndash414
Hurteau M D and M North 2010 Carbon recovery rates following different wildfire risk mitigation treatments Forest Ecology and Management 260 930ndash937
Hurteau M D M T Stoddard and P Z Fulme 2011 The carbon costs of mitigating high-severity wildshyfire in southwestern ponderosa pine Global Change Biology 171516ndash1521
Jenness J S P Beier and J L Ganey 2004 Associashytions between forest fire and Mexican spotted owls Forest Science 50765ndash772
Jones G M R Gutimerrez D J Tempel S A Whitmore W J Berigan and M Z Peery 2016 Megafires an emerging threat to old-forest species Frontiers in Ecology and the Environment 14300ndash306
wwwesajournalsorg 19 January 2017 Volume 8(1) Article e01648
CHIONO ET AL
Laymon S A 1988 Ecology of the spotted owl in the central Sierra Nevada California Dissertation University of California Berkeley California USA
Lenihan J M D Bachelet R P Neilson and R Drapek 2008 Response of vegetation distribution ecosystem productivity and fire to climate change scenarios for California Climatic Change 87215ndash230
Lydersen J M B M Collins E E Knapp G B Roller and S Stephens 2015 Relating fuel loads to overshystorey structure and composition in a fire-excluded Sierra Nevada mixed conifer forest International Journal of Wildland Fire 24484ndash494
Malmsheimer R J Bowyer J Fried E Gee R Islar R Miner I E Munn E Oneil and W C Stewart 2011 Managing forests because carbon matters integrating energy products and land manageshyment policy Journal of Forestry 109S7ndashS50
Marlon J R et al 2012 Long-term perspective on wildfires in the western USA Proceedings of the National Academy of Sciences of the United States of America 109E535ndashE543
Martinson E J and P N Omi 2002 Performance of fuel treatments subjected to wildfires Pages 7ndash13 in P N Omi and L A Joyce editors Conference on Fire Fuel Treatments and Ecological Restorashytion USDA Forest Service Rocky Mountain Research Station Fort Collins Colorado USA
Martinson E J and P N Omi 2013 Fuel treatments and fire severity a meta-analysis Pages 38 USDA Forest Service Rocky Mountain Research Station Fort Collins Colorado USA
Mayer K E and W F Laudenslayer 1988 A guide to wildlife habitats of California California Departshyment of Forestry and Fire Protection Sacramento California USA
McKenzie D Z Gedalof D L Peterson and P Mote 2004 Climatic change wildfire and conservation Conservation Biology 18890ndash902
Mercer D E and J P Prestemon 2005 Comparing production function models for wildfire risk analyshysis in the wildlandndashurban interface Forest Policy and Economics 7782ndash795
Miller J D and H Safford 2012 Trends in wildfire severity 1984 to 2010 in the Sierra Nevada Modoc Plateau and southern Cascades California USA Fire Ecology 841ndash57
Miller J H Safford M Crimmins and A Thode 2009 Quantitative evidence for increasing forest fire severity in the Sierra Nevada and southern Cascade mountains California and Nevada USA Ecosystems 1216ndash32
North M 2012 Managing Sierra Nevada forests PSWshyGTR-237 USDA Forest Service Pacific Southwest Research Station Albany California USA
North M P and M D Hurteau 2011 High-severity wildfire effects on carbon stocks and emissions in fuels treated and untreated forest Forest Ecology and Management 2611115ndash1120
North M M Hurteau and J Innes 2009a Fire supshypression and fuels treatment effects on mixed-conifer carbon stocks and emissions Ecological Applications 191385ndash1396
North M P A Stine K OrsquoHara W Zielinski and S Stephens 2009b An ecosystem management strategy for Sierran mixed-conifer forests General Technical Report PSW-GTR-220 USDA Forest Service Pacific Southwest Research Station Albany California USA
Parisien M-A S Snetsinger J A Greenberg C R Nelson T Schoennagel S Z Dobrowski and M A Moritz 2012 Spatial variability in wildfire probability across the western United States Intershynational Journal of Wildland Fire 21313ndash327
Penman J M Gytarsky T Hiraishi T Krug D Kruger R Pipatti L Buendia K Miwa T Ngara and K Tanabe 2003 Good practice guidance for land use land-use change and forestry Institute for Global Environmental Strategies for the Intergovshyernmental Panel on Climate Change Hayama Kanagawa Japan
Pollet J and P N Omi 2002 Effect of thinning and prescribed burning on crown fire severity in ponderosa pine forests International Journal of Wildland Fire 111ndash10
Prather J W R F Noss and T D Sisk 2008 Real versus perceived conflicts between restoration of ponderosa pine forests and conservation of the Mexican spotted owl Forest Policy and Economics 10140ndash150
Preisler H K D R Brillinger R E Burgan and J Benoit 2004 Probability based models for estimation of wildfire risk International Journal of Wildland Fire 13133ndash142
Rebain S E Reinhardt N Crookston S Beukema W Kurz and J Greenough 2009 The fire and fuels extension to the Forest Vegetation Simulator Addendum to RMRS-GTR-119 USDA Forest Service and ESSA Technologies Ltd Fort Collins Colorado USA
Reinhardt E D and N L Crookston 2003 The fire and fuels extension to the forest vegetation simulashytor Pages 209 RMRS-GTR-116 USDA Forest Sershyvice Rocky Mountain Research Station Ogden Utah USA
Reinhardt E and L Holsinger 2010 Effects of fuel treatments on carbon-disturbance relationshyships in forests of the northern Rocky Mountains Forest Ecology and Management 2591427ndash1435
wwwesajournalsorg 20 January 2017 Volume 8(1) Article e01648
CHIONO ET AL
Reinhardt E D R E Keane D E Calkin and J D Cohen 2008 Objectives and considerations for wildland fuel treatment in forested ecosystems of the interior western United States Forest Ecology and Management 2561997ndash2006
Ritchie M W C N Skinner and T A Hamilton 2007 Probability of tree survival after wildfire in an interior pine forest of northern California effects of thinning and prescribed fire Forest Ecolshyogy and Management 247200ndash208
Roloff G J S P Mealey and J D Bailey 2012 Comshyparative hazard assessment for protected species in a fire-prone landscape Forest Ecology and Manshyagement 2771ndash10
Rothermel R C 1972 A mathematical model for preshydicting fire spread in wildland fuels Research Paper INT-115 USDA Forest Service Intermounshytain Forest and Range Experiment Station Ogden Utah USA
Safford H D 2008 Fire severity in fuel treatments American River Complex fire Tahoe National Forest California Unpublished Report USDA Forest Service Pacific Southwest Region Vallejo California USA
Schmidt D A A H Taylor and C N Skinner 2008 The influence of fuels treatment and landscape arrangement on simulated fire behavior Southern Cascade range California Forest Ecology and Management 2553170ndash3184
Scott J H and R E Burgan 2005 Standard fire behavior fuel models a comprehensive set for use with Rothermelrsquos surface fire spread model General Technical Report RMRS-GTR-153 USDA Forest Service Rocky Mountain Research Station Fort Collins Colorado USA
Scott J H M P Thompson and J W Gilbertson-Day 2016 Examining alternative fuel management strategies and the relative contribution of National Forest System land to wildfire risk to adjacent homesndasha pilot assessment on the Sierra National Forest California USA Forest Ecology and Manshyagement 36229ndash37
Smith J E and L S Heath 2002 A model of forest floor carbon mass for United States forest types Research Paper NE-722 USDA Forest Service Northeastern Research Station Newtown Square Pennsylvania USA
Stephens S L 2005 Forest fire causes and extent on United States Forest Service lands International Journal of Wildland Fire 14213ndash222
Stephens S L B M Collins E Biber and P Z Fulme 2016a US federal fire and forest policy emphasizshying resilience in dry forests Ecosphere 7e01584
Stephens S L J D Miller B M Collins M P North J J Keane and S L Roberts 2016b Wildfire impacts on California Spotted Owl nesting habitat in the Sierra Nevada Ecosphere 7e01584
Stephens S L J J Moghaddas B R Hartsough E E Y Moghaddas and N E Clinton 2009 Fuel treatshyment effects on stand-level carbon pools treatshyment-related emissions and fire risk in a Sierra Nevada mixed-conifer forest Canadian Journal of Forest Research 391538ndash1547
Stephens S L et al 2012 Fuel treatment impacts on estimated wildfire carbon loss from forests in Monshytana Oregon California and Arizona Ecosphere 31ndash17
Tempel D et al 2015 Evaluating short- and longshyterm impacts of fuels treatments and simulated wildfire on an old-forest species Ecosphere 61ndash19
USDA Forest Service 2004 Sierra Nevada Forest Plan Amendment Final supplemental environmental impact statement Record of decision Publication R5-MB-046 USDA Forest Service Pacific Southshywest Region Vallejo California USA
Van Wagner C E 1977 Conditions for the start and spread of crown fire Canadian Journal of Forest Research 723ndash34
Verner J K S McKelvey B R Noon R Gutimerrez G I Gould Jr and T W Beck 1992 Assessment of the current status of the California spotted owl with recommendations for management Pages 3ndash27 in J Verner K S McKelvey B R Noon R Gutimerrez G I Gould Jr and T W Beck edishytors The California Spotted Owl a technical assessment of its current status PSW-GTR-133 USDA Forest Service Albany California USA
Westerling A B Bryant H Preisler T Holmes H Hidalgo T Das and S Shrestha 2011 Climate change and growth scenarios for California wildshyfire Climatic Change 109445ndash463
Westerling A L H G Hidalgo D R Cayan and T W Swetnam 2006 Warming and earlier Spring increase Western US Forest Wildfire Activity Science 313940ndash943
Wiedinmyer C and M D Hurteau 2010 Prescribed fire as a means of reducing forest carbon emissions in the Western United States Environmental Science amp Technology 441926ndash1932
SUPPORTING INFORMATION
Additional Supporting Information may be found online at httponlinelibrarywileycomdoi101002ecs2 1648full
wwwesajournalsorg 21 January 2017 Volume 8(1) Article e01648
CHIONO ET AL
However treatments conducted outside of owl habitat also reduced wildfire hazard
ACKNOWLEDGMENTS
We are grateful to a number of individuals for sharshying their time and fuel treatment and fire modeling expertise Nicole Vaillant (ArcFuels) Alan Ager and Andrew McMahan (carbon estimation) and Coeli Hoover (harvest simulations in FVS-FFE) Brian Ebert and Dana Walsh of the Eldorado National Forest proshyvided invaluable advice on weather inputs for fire modeling and on designing fuel treatment prescripshytions Ken Somers Operations Forester on the Blodgett Forest Research Station gave advice concerning timshyber management on private land We also thank two anonymous reviewers whose comments greatly improved this article The California Energy Commisshysion provided funding for this project
LITERATURE CITED
Ager A A B Bahro and K Barber 2006 Automating the fireshed assessment process with ArcGIS Pages 163ndash167 in P L Andrews and B W Butler (Comps) Fuels ManagementndashHow to Measure Success Conference Proceedings Portland OR March 28ndash30 2006 Proceedings RMRS-P-41 USDA Forest Service Rocky Mountain Research Station Fort Collins Colorado USA
Ager A A M A Finney B K Kerns and H Maffei 2007 Modeling wildfire risk to northern spotted owl (Strix occidentalis caurina) habitat in Central Oregon USA Forest Ecology and Management 24645ndash56
Ager A A M A Finney A McMahan and J Cathcart 2010 Measuring the effect of fuel treatments on forshyest carbon using landscape risk analysis Natural Hazards and Earth System Science 102515ndash2526
Ager A A N M Vaillant D E Owens S Brittain and J Hamann 2012 Overview and example application of the Landscape Treatment Designer Pages 11 General Technical Report PNW-GTR-859 USDA Forest Service Pacific Northwest Research Station Portland Oregon USA
Barbour M G and R A Minnich 2000 Californian upland forests and woodlands Pages 131ndash164 in M Barbour and W Billings editors North Amerishycan terrestrial vegetation Cambridge University Press Cambridge UK
Bias M A and R Gutimerrez 1992 Habitat associations of California spotted owls in the central Sierra Nevada Journal of Wildlife Management 56584ndash595
Bond M L R Gutierrez A B Franklin W S LaHaye C A May and M E Seamans 2002
Short-term effects of wildfires on spotted owl surshyvival site fidelity mate fidelity and reproductive success Wildlife Society Bulletin 301022ndash1028
Brillinger D H Preisler and J Benoit 2006 Probashybilistic risk assessment for wildfires Environ-metrics 17623ndash633
Campbell J L and A A Ager 2013 Forest wildfire fuel reduction treatments and landscape carbon stocks a sensitivity analysis Journal of Environshymental Management 121124ndash132
Campbell J L M E Harmon and S R Mitchell 2011 Can fuel-reduction treatments really increase forest carbon storage in the western US by reducshying future fire emissions Frontiers in Ecology and the Environment 1083ndash90
Cathcart J A A Ager A McMahan M Finney and B Watt 2010 Carbon benefits from fuel treatshyments Pages 61ndash80 in T B Jain R T Graham and J Sandquist editors Integrated management of carbon sequestration and biomass utilization opportunities in a changing climate Proceedings of the 2009 National Silviculture Workshop Boise Idaho June 15ndash18 2009 USDA Forest Service Proshyceedings RMRS-P-61 Rocky Mountain Research Station Fort Collins Colorado USA
Chatfield A H 2005 Habitat selection by a California spotted owl population a landscape scale analysis using resource selection functions Thesis Univershysity of Minnesota St Paul Minnesota USA
Collins B M H A Kramer K Menning C Dilling-ham D Saah P A Stine and S L Stephens 2013 Modeling hazardous fire potential within a comshypleted fuel treatment network in the northern Sierra Nevada Forest Ecology and Management 310156ndash166
Collins B M S L Stephens J J Moghaddas and J Battles 2010 Challenges and approaches in planshyning fuel treatments across fire-excluded forested landscapes Journal of Forestry 10824ndash31
Collins B M S L Stephens G B Roller and J J Battles 2011 Simulating fire and forest dynamics for a landscape fuel treatment project in the Sierra Nevada Forest Science 5777ndash88
Coppoletta M K E Merriam and B M Collins 2016 Post-fire vegetation and fuel development influences fire severity patterns in reburns Ecologishycal Applications 26686ndash699
Crookston N L and A O Finley 2008 yaimpute an r package for knn imputation Journal of Statistical Software 231ndash16
Crookston N L M Moeur and D L Renner 2002 Userrsquos guide to the most similar neighbor imputashytion program version 2 General Technical Report RMRS-GTR-96 USDA Forest Service Rocky Mountain Research Station Ogden Utah USA
wwwesajournalsorg 18 January 2017 Volume 8(1) Article e01648
CHIONO ET AL
Crosby J and C Chandler 1966 Get the most from your windspeed observations Fire Control Notes 2712ndash13
Dailey S J Fites A Reiner and S Mori 2008 Fire behavior and effects in fuel treatments and proshytected habitat on the Moonlight fire Fire Behavior Assessment Team wwwfsfedusadaptivemana gementprojectsFBATdocsMoonlightFinal_8_6_08 pdf
Dennison P E S C Brewer J D Arnold and M A Moritz 2014 Large wildfire trends in the western United States 1984ndash2011 Geophysical Research Letters 412928ndash2933
Dixon G E 2002 Essential FVS a userrsquos guide to the forest vegetation simulator Pages 193 USDA Forest Service Forest Management Service Center Fort Collins Colorado USA
Dore S T E Kolb M Montes-Helu B W Sullivan W D Winslow S C Hart J P Kaye G W Koch and B A Hungate 2008 Long-term impact of a stand-replacing fire on ecosystem CO2 exchange of a ponderosa pine forest Global Change Biology 141ndash20
Dore S M Montes-Helu S C Hart B A Hungate G W Koch J B Moon A J Finkral and T E Kolb 2012 Recovery of ponderosa pine ecosystem carbon and water fluxes from thinning and stand-replacing fire Global Change Biology 183171ndash3185
Dow C J B M Collins and S L Stephens 2016 Incorporating resource protection constraints in an analysis of landscape fuel-treatment effectiveness in the Northern Sierra Nevada California USA Environmental Management 571ndash15
Eidenshink J B Schwind K Brewer Z Zhu B Quayle and S Howard 2007 A project for monshyitoring trends in burn severity Fire Ecology 33ndash21
Evans A M and A J Finkral 2009 From renewable energy to fire risk reduction a synthesis of biomass harvesting and utilization case studies in US forshyests GCB Bioenergy 1211ndash219
Finkral A J and A M Evans 2008 The effects of a thinning treatment on carbon stocks in a northern Arizona ponderosa pine forest Forest Ecology and Management 2552743ndash2750
Finney M A 2001 Design of regular landscape fuel treatment patterns for modifying fire growth and behavior Forest Science 47219ndash228
Finney M A 2002 Fire growth using minimum travel time methods Canadian Journal of Forest Research 321420ndash1424
Finney M A 2006 An overview of FlamMap fire modeling capabilities Pages 213ndash220 in P L Andrews and B W Butler editors Proceedings of Fuels ManagementndashHow to Measure Success Research Paper RMRS-P-41 USDA Forest Service
Rocky Mountain Research Station Portland Oregon USA
Finney M A R C Seli C W McHugh A A Ager B Bahro and J K Agee 2007 Simulation of longshyterm landscape-level fuel treatment effects on large wildfires International Journal of Wildland Fire 16712ndash727
Fulme P Z J E Crouse J P Roccaforte and E L Kalies 2012 Do thinning andor burning treatments in western USA ponderosa or Jeffrey pine-dominated forests help restore natural fire behavior Forest Ecology and Management 26968ndash81
Gaines W L R J Harrod J Dickinson A L Lyons and K Halupka 2010 Integration of Northern spotted owl habitat and fuels treatments in the eastern Cascades Washington USA Forest Ecolshyogy and Management 2602045ndash2052
Gaines W L R A Strand and S D Piper 1997 Effects of the hatchery complex fires on northern spotted owls in the eastern Washington Cascades Pages 123ndash129 in J N Greenlee editor Proceedings of the Fire Effects on Rare and Endangered Species and Habitats Conference Coeur DrsquoAlene Idaho International Association of Wildfire and Forestry Hot Springs South Dakota USA
Hall S A and I C Burke 2006 Considerations for characterizing fuels as inputs for fire behavior models Forest Ecology and Management 227 102ndash114
Hoover C and S Rebain 2008 The Kane Experimenshytal Forest carbon inventory carbon reporting with FVS Pages 13ndash15 in R N Havis and N L Crookston editors Third Forest Vegetation Simushylator Conference Fort Collins Colorado February 13ndash15 2007 USDA Forest Service Rocky Mountain Research Station Fort Collins Colorado USA
Hurteau M and M North 2009 Fuel treatment effects on tree-based forest carbon storage and emissions under modeled wildfire scenarios Fronshytiers in Ecology and the Environment 7409ndash414
Hurteau M D and M North 2010 Carbon recovery rates following different wildfire risk mitigation treatments Forest Ecology and Management 260 930ndash937
Hurteau M D M T Stoddard and P Z Fulme 2011 The carbon costs of mitigating high-severity wildshyfire in southwestern ponderosa pine Global Change Biology 171516ndash1521
Jenness J S P Beier and J L Ganey 2004 Associashytions between forest fire and Mexican spotted owls Forest Science 50765ndash772
Jones G M R Gutimerrez D J Tempel S A Whitmore W J Berigan and M Z Peery 2016 Megafires an emerging threat to old-forest species Frontiers in Ecology and the Environment 14300ndash306
wwwesajournalsorg 19 January 2017 Volume 8(1) Article e01648
CHIONO ET AL
Laymon S A 1988 Ecology of the spotted owl in the central Sierra Nevada California Dissertation University of California Berkeley California USA
Lenihan J M D Bachelet R P Neilson and R Drapek 2008 Response of vegetation distribution ecosystem productivity and fire to climate change scenarios for California Climatic Change 87215ndash230
Lydersen J M B M Collins E E Knapp G B Roller and S Stephens 2015 Relating fuel loads to overshystorey structure and composition in a fire-excluded Sierra Nevada mixed conifer forest International Journal of Wildland Fire 24484ndash494
Malmsheimer R J Bowyer J Fried E Gee R Islar R Miner I E Munn E Oneil and W C Stewart 2011 Managing forests because carbon matters integrating energy products and land manageshyment policy Journal of Forestry 109S7ndashS50
Marlon J R et al 2012 Long-term perspective on wildfires in the western USA Proceedings of the National Academy of Sciences of the United States of America 109E535ndashE543
Martinson E J and P N Omi 2002 Performance of fuel treatments subjected to wildfires Pages 7ndash13 in P N Omi and L A Joyce editors Conference on Fire Fuel Treatments and Ecological Restorashytion USDA Forest Service Rocky Mountain Research Station Fort Collins Colorado USA
Martinson E J and P N Omi 2013 Fuel treatments and fire severity a meta-analysis Pages 38 USDA Forest Service Rocky Mountain Research Station Fort Collins Colorado USA
Mayer K E and W F Laudenslayer 1988 A guide to wildlife habitats of California California Departshyment of Forestry and Fire Protection Sacramento California USA
McKenzie D Z Gedalof D L Peterson and P Mote 2004 Climatic change wildfire and conservation Conservation Biology 18890ndash902
Mercer D E and J P Prestemon 2005 Comparing production function models for wildfire risk analyshysis in the wildlandndashurban interface Forest Policy and Economics 7782ndash795
Miller J D and H Safford 2012 Trends in wildfire severity 1984 to 2010 in the Sierra Nevada Modoc Plateau and southern Cascades California USA Fire Ecology 841ndash57
Miller J H Safford M Crimmins and A Thode 2009 Quantitative evidence for increasing forest fire severity in the Sierra Nevada and southern Cascade mountains California and Nevada USA Ecosystems 1216ndash32
North M 2012 Managing Sierra Nevada forests PSWshyGTR-237 USDA Forest Service Pacific Southwest Research Station Albany California USA
North M P and M D Hurteau 2011 High-severity wildfire effects on carbon stocks and emissions in fuels treated and untreated forest Forest Ecology and Management 2611115ndash1120
North M M Hurteau and J Innes 2009a Fire supshypression and fuels treatment effects on mixed-conifer carbon stocks and emissions Ecological Applications 191385ndash1396
North M P A Stine K OrsquoHara W Zielinski and S Stephens 2009b An ecosystem management strategy for Sierran mixed-conifer forests General Technical Report PSW-GTR-220 USDA Forest Service Pacific Southwest Research Station Albany California USA
Parisien M-A S Snetsinger J A Greenberg C R Nelson T Schoennagel S Z Dobrowski and M A Moritz 2012 Spatial variability in wildfire probability across the western United States Intershynational Journal of Wildland Fire 21313ndash327
Penman J M Gytarsky T Hiraishi T Krug D Kruger R Pipatti L Buendia K Miwa T Ngara and K Tanabe 2003 Good practice guidance for land use land-use change and forestry Institute for Global Environmental Strategies for the Intergovshyernmental Panel on Climate Change Hayama Kanagawa Japan
Pollet J and P N Omi 2002 Effect of thinning and prescribed burning on crown fire severity in ponderosa pine forests International Journal of Wildland Fire 111ndash10
Prather J W R F Noss and T D Sisk 2008 Real versus perceived conflicts between restoration of ponderosa pine forests and conservation of the Mexican spotted owl Forest Policy and Economics 10140ndash150
Preisler H K D R Brillinger R E Burgan and J Benoit 2004 Probability based models for estimation of wildfire risk International Journal of Wildland Fire 13133ndash142
Rebain S E Reinhardt N Crookston S Beukema W Kurz and J Greenough 2009 The fire and fuels extension to the Forest Vegetation Simulator Addendum to RMRS-GTR-119 USDA Forest Service and ESSA Technologies Ltd Fort Collins Colorado USA
Reinhardt E D and N L Crookston 2003 The fire and fuels extension to the forest vegetation simulashytor Pages 209 RMRS-GTR-116 USDA Forest Sershyvice Rocky Mountain Research Station Ogden Utah USA
Reinhardt E and L Holsinger 2010 Effects of fuel treatments on carbon-disturbance relationshyships in forests of the northern Rocky Mountains Forest Ecology and Management 2591427ndash1435
wwwesajournalsorg 20 January 2017 Volume 8(1) Article e01648
CHIONO ET AL
Reinhardt E D R E Keane D E Calkin and J D Cohen 2008 Objectives and considerations for wildland fuel treatment in forested ecosystems of the interior western United States Forest Ecology and Management 2561997ndash2006
Ritchie M W C N Skinner and T A Hamilton 2007 Probability of tree survival after wildfire in an interior pine forest of northern California effects of thinning and prescribed fire Forest Ecolshyogy and Management 247200ndash208
Roloff G J S P Mealey and J D Bailey 2012 Comshyparative hazard assessment for protected species in a fire-prone landscape Forest Ecology and Manshyagement 2771ndash10
Rothermel R C 1972 A mathematical model for preshydicting fire spread in wildland fuels Research Paper INT-115 USDA Forest Service Intermounshytain Forest and Range Experiment Station Ogden Utah USA
Safford H D 2008 Fire severity in fuel treatments American River Complex fire Tahoe National Forest California Unpublished Report USDA Forest Service Pacific Southwest Region Vallejo California USA
Schmidt D A A H Taylor and C N Skinner 2008 The influence of fuels treatment and landscape arrangement on simulated fire behavior Southern Cascade range California Forest Ecology and Management 2553170ndash3184
Scott J H and R E Burgan 2005 Standard fire behavior fuel models a comprehensive set for use with Rothermelrsquos surface fire spread model General Technical Report RMRS-GTR-153 USDA Forest Service Rocky Mountain Research Station Fort Collins Colorado USA
Scott J H M P Thompson and J W Gilbertson-Day 2016 Examining alternative fuel management strategies and the relative contribution of National Forest System land to wildfire risk to adjacent homesndasha pilot assessment on the Sierra National Forest California USA Forest Ecology and Manshyagement 36229ndash37
Smith J E and L S Heath 2002 A model of forest floor carbon mass for United States forest types Research Paper NE-722 USDA Forest Service Northeastern Research Station Newtown Square Pennsylvania USA
Stephens S L 2005 Forest fire causes and extent on United States Forest Service lands International Journal of Wildland Fire 14213ndash222
Stephens S L B M Collins E Biber and P Z Fulme 2016a US federal fire and forest policy emphasizshying resilience in dry forests Ecosphere 7e01584
Stephens S L J D Miller B M Collins M P North J J Keane and S L Roberts 2016b Wildfire impacts on California Spotted Owl nesting habitat in the Sierra Nevada Ecosphere 7e01584
Stephens S L J J Moghaddas B R Hartsough E E Y Moghaddas and N E Clinton 2009 Fuel treatshyment effects on stand-level carbon pools treatshyment-related emissions and fire risk in a Sierra Nevada mixed-conifer forest Canadian Journal of Forest Research 391538ndash1547
Stephens S L et al 2012 Fuel treatment impacts on estimated wildfire carbon loss from forests in Monshytana Oregon California and Arizona Ecosphere 31ndash17
Tempel D et al 2015 Evaluating short- and longshyterm impacts of fuels treatments and simulated wildfire on an old-forest species Ecosphere 61ndash19
USDA Forest Service 2004 Sierra Nevada Forest Plan Amendment Final supplemental environmental impact statement Record of decision Publication R5-MB-046 USDA Forest Service Pacific Southshywest Region Vallejo California USA
Van Wagner C E 1977 Conditions for the start and spread of crown fire Canadian Journal of Forest Research 723ndash34
Verner J K S McKelvey B R Noon R Gutimerrez G I Gould Jr and T W Beck 1992 Assessment of the current status of the California spotted owl with recommendations for management Pages 3ndash27 in J Verner K S McKelvey B R Noon R Gutimerrez G I Gould Jr and T W Beck edishytors The California Spotted Owl a technical assessment of its current status PSW-GTR-133 USDA Forest Service Albany California USA
Westerling A B Bryant H Preisler T Holmes H Hidalgo T Das and S Shrestha 2011 Climate change and growth scenarios for California wildshyfire Climatic Change 109445ndash463
Westerling A L H G Hidalgo D R Cayan and T W Swetnam 2006 Warming and earlier Spring increase Western US Forest Wildfire Activity Science 313940ndash943
Wiedinmyer C and M D Hurteau 2010 Prescribed fire as a means of reducing forest carbon emissions in the Western United States Environmental Science amp Technology 441926ndash1932
SUPPORTING INFORMATION
Additional Supporting Information may be found online at httponlinelibrarywileycomdoi101002ecs2 1648full
wwwesajournalsorg 21 January 2017 Volume 8(1) Article e01648
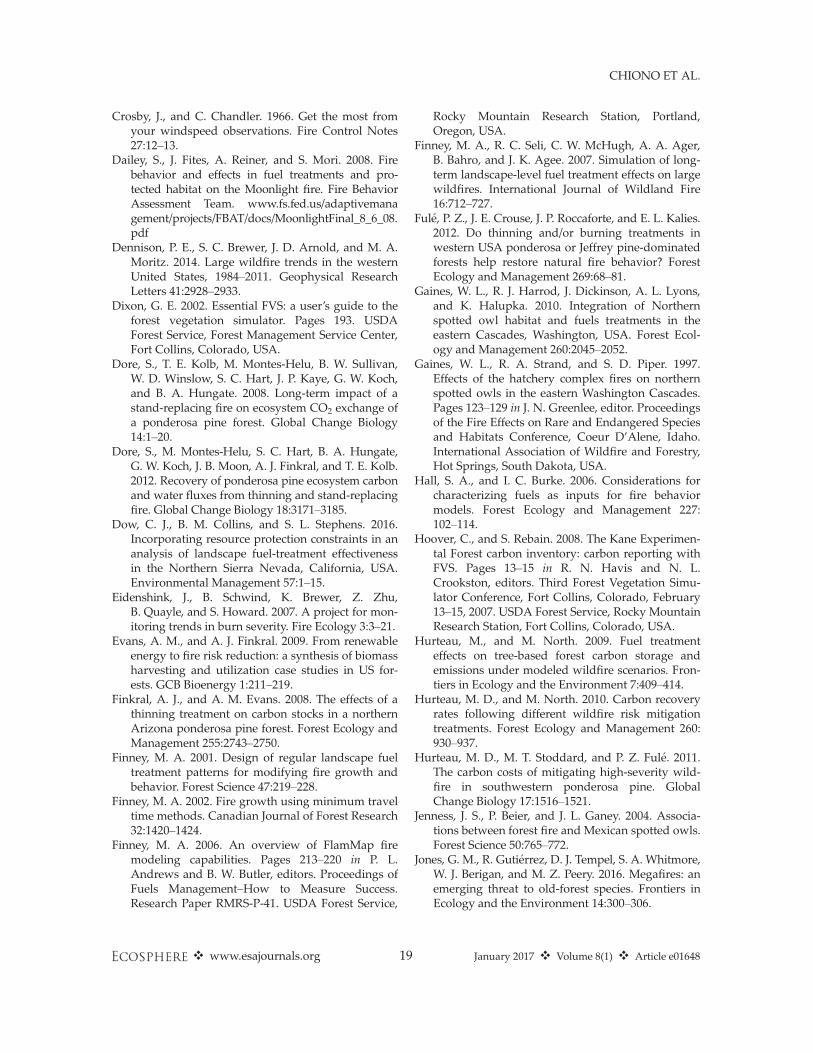
CHIONO ET AL
Crosby J and C Chandler 1966 Get the most from your windspeed observations Fire Control Notes 2712ndash13
Dailey S J Fites A Reiner and S Mori 2008 Fire behavior and effects in fuel treatments and proshytected habitat on the Moonlight fire Fire Behavior Assessment Team wwwfsfedusadaptivemana gementprojectsFBATdocsMoonlightFinal_8_6_08 pdf
Dennison P E S C Brewer J D Arnold and M A Moritz 2014 Large wildfire trends in the western United States 1984ndash2011 Geophysical Research Letters 412928ndash2933
Dixon G E 2002 Essential FVS a userrsquos guide to the forest vegetation simulator Pages 193 USDA Forest Service Forest Management Service Center Fort Collins Colorado USA
Dore S T E Kolb M Montes-Helu B W Sullivan W D Winslow S C Hart J P Kaye G W Koch and B A Hungate 2008 Long-term impact of a stand-replacing fire on ecosystem CO2 exchange of a ponderosa pine forest Global Change Biology 141ndash20
Dore S M Montes-Helu S C Hart B A Hungate G W Koch J B Moon A J Finkral and T E Kolb 2012 Recovery of ponderosa pine ecosystem carbon and water fluxes from thinning and stand-replacing fire Global Change Biology 183171ndash3185
Dow C J B M Collins and S L Stephens 2016 Incorporating resource protection constraints in an analysis of landscape fuel-treatment effectiveness in the Northern Sierra Nevada California USA Environmental Management 571ndash15
Eidenshink J B Schwind K Brewer Z Zhu B Quayle and S Howard 2007 A project for monshyitoring trends in burn severity Fire Ecology 33ndash21
Evans A M and A J Finkral 2009 From renewable energy to fire risk reduction a synthesis of biomass harvesting and utilization case studies in US forshyests GCB Bioenergy 1211ndash219
Finkral A J and A M Evans 2008 The effects of a thinning treatment on carbon stocks in a northern Arizona ponderosa pine forest Forest Ecology and Management 2552743ndash2750
Finney M A 2001 Design of regular landscape fuel treatment patterns for modifying fire growth and behavior Forest Science 47219ndash228
Finney M A 2002 Fire growth using minimum travel time methods Canadian Journal of Forest Research 321420ndash1424
Finney M A 2006 An overview of FlamMap fire modeling capabilities Pages 213ndash220 in P L Andrews and B W Butler editors Proceedings of Fuels ManagementndashHow to Measure Success Research Paper RMRS-P-41 USDA Forest Service
Rocky Mountain Research Station Portland Oregon USA
Finney M A R C Seli C W McHugh A A Ager B Bahro and J K Agee 2007 Simulation of longshyterm landscape-level fuel treatment effects on large wildfires International Journal of Wildland Fire 16712ndash727
Fulme P Z J E Crouse J P Roccaforte and E L Kalies 2012 Do thinning andor burning treatments in western USA ponderosa or Jeffrey pine-dominated forests help restore natural fire behavior Forest Ecology and Management 26968ndash81
Gaines W L R J Harrod J Dickinson A L Lyons and K Halupka 2010 Integration of Northern spotted owl habitat and fuels treatments in the eastern Cascades Washington USA Forest Ecolshyogy and Management 2602045ndash2052
Gaines W L R A Strand and S D Piper 1997 Effects of the hatchery complex fires on northern spotted owls in the eastern Washington Cascades Pages 123ndash129 in J N Greenlee editor Proceedings of the Fire Effects on Rare and Endangered Species and Habitats Conference Coeur DrsquoAlene Idaho International Association of Wildfire and Forestry Hot Springs South Dakota USA
Hall S A and I C Burke 2006 Considerations for characterizing fuels as inputs for fire behavior models Forest Ecology and Management 227 102ndash114
Hoover C and S Rebain 2008 The Kane Experimenshytal Forest carbon inventory carbon reporting with FVS Pages 13ndash15 in R N Havis and N L Crookston editors Third Forest Vegetation Simushylator Conference Fort Collins Colorado February 13ndash15 2007 USDA Forest Service Rocky Mountain Research Station Fort Collins Colorado USA
Hurteau M and M North 2009 Fuel treatment effects on tree-based forest carbon storage and emissions under modeled wildfire scenarios Fronshytiers in Ecology and the Environment 7409ndash414
Hurteau M D and M North 2010 Carbon recovery rates following different wildfire risk mitigation treatments Forest Ecology and Management 260 930ndash937
Hurteau M D M T Stoddard and P Z Fulme 2011 The carbon costs of mitigating high-severity wildshyfire in southwestern ponderosa pine Global Change Biology 171516ndash1521
Jenness J S P Beier and J L Ganey 2004 Associashytions between forest fire and Mexican spotted owls Forest Science 50765ndash772
Jones G M R Gutimerrez D J Tempel S A Whitmore W J Berigan and M Z Peery 2016 Megafires an emerging threat to old-forest species Frontiers in Ecology and the Environment 14300ndash306
wwwesajournalsorg 19 January 2017 Volume 8(1) Article e01648
CHIONO ET AL
Laymon S A 1988 Ecology of the spotted owl in the central Sierra Nevada California Dissertation University of California Berkeley California USA
Lenihan J M D Bachelet R P Neilson and R Drapek 2008 Response of vegetation distribution ecosystem productivity and fire to climate change scenarios for California Climatic Change 87215ndash230
Lydersen J M B M Collins E E Knapp G B Roller and S Stephens 2015 Relating fuel loads to overshystorey structure and composition in a fire-excluded Sierra Nevada mixed conifer forest International Journal of Wildland Fire 24484ndash494
Malmsheimer R J Bowyer J Fried E Gee R Islar R Miner I E Munn E Oneil and W C Stewart 2011 Managing forests because carbon matters integrating energy products and land manageshyment policy Journal of Forestry 109S7ndashS50
Marlon J R et al 2012 Long-term perspective on wildfires in the western USA Proceedings of the National Academy of Sciences of the United States of America 109E535ndashE543
Martinson E J and P N Omi 2002 Performance of fuel treatments subjected to wildfires Pages 7ndash13 in P N Omi and L A Joyce editors Conference on Fire Fuel Treatments and Ecological Restorashytion USDA Forest Service Rocky Mountain Research Station Fort Collins Colorado USA
Martinson E J and P N Omi 2013 Fuel treatments and fire severity a meta-analysis Pages 38 USDA Forest Service Rocky Mountain Research Station Fort Collins Colorado USA
Mayer K E and W F Laudenslayer 1988 A guide to wildlife habitats of California California Departshyment of Forestry and Fire Protection Sacramento California USA
McKenzie D Z Gedalof D L Peterson and P Mote 2004 Climatic change wildfire and conservation Conservation Biology 18890ndash902
Mercer D E and J P Prestemon 2005 Comparing production function models for wildfire risk analyshysis in the wildlandndashurban interface Forest Policy and Economics 7782ndash795
Miller J D and H Safford 2012 Trends in wildfire severity 1984 to 2010 in the Sierra Nevada Modoc Plateau and southern Cascades California USA Fire Ecology 841ndash57
Miller J H Safford M Crimmins and A Thode 2009 Quantitative evidence for increasing forest fire severity in the Sierra Nevada and southern Cascade mountains California and Nevada USA Ecosystems 1216ndash32
North M 2012 Managing Sierra Nevada forests PSWshyGTR-237 USDA Forest Service Pacific Southwest Research Station Albany California USA
North M P and M D Hurteau 2011 High-severity wildfire effects on carbon stocks and emissions in fuels treated and untreated forest Forest Ecology and Management 2611115ndash1120
North M M Hurteau and J Innes 2009a Fire supshypression and fuels treatment effects on mixed-conifer carbon stocks and emissions Ecological Applications 191385ndash1396
North M P A Stine K OrsquoHara W Zielinski and S Stephens 2009b An ecosystem management strategy for Sierran mixed-conifer forests General Technical Report PSW-GTR-220 USDA Forest Service Pacific Southwest Research Station Albany California USA
Parisien M-A S Snetsinger J A Greenberg C R Nelson T Schoennagel S Z Dobrowski and M A Moritz 2012 Spatial variability in wildfire probability across the western United States Intershynational Journal of Wildland Fire 21313ndash327
Penman J M Gytarsky T Hiraishi T Krug D Kruger R Pipatti L Buendia K Miwa T Ngara and K Tanabe 2003 Good practice guidance for land use land-use change and forestry Institute for Global Environmental Strategies for the Intergovshyernmental Panel on Climate Change Hayama Kanagawa Japan
Pollet J and P N Omi 2002 Effect of thinning and prescribed burning on crown fire severity in ponderosa pine forests International Journal of Wildland Fire 111ndash10
Prather J W R F Noss and T D Sisk 2008 Real versus perceived conflicts between restoration of ponderosa pine forests and conservation of the Mexican spotted owl Forest Policy and Economics 10140ndash150
Preisler H K D R Brillinger R E Burgan and J Benoit 2004 Probability based models for estimation of wildfire risk International Journal of Wildland Fire 13133ndash142
Rebain S E Reinhardt N Crookston S Beukema W Kurz and J Greenough 2009 The fire and fuels extension to the Forest Vegetation Simulator Addendum to RMRS-GTR-119 USDA Forest Service and ESSA Technologies Ltd Fort Collins Colorado USA
Reinhardt E D and N L Crookston 2003 The fire and fuels extension to the forest vegetation simulashytor Pages 209 RMRS-GTR-116 USDA Forest Sershyvice Rocky Mountain Research Station Ogden Utah USA
Reinhardt E and L Holsinger 2010 Effects of fuel treatments on carbon-disturbance relationshyships in forests of the northern Rocky Mountains Forest Ecology and Management 2591427ndash1435
wwwesajournalsorg 20 January 2017 Volume 8(1) Article e01648
CHIONO ET AL
Reinhardt E D R E Keane D E Calkin and J D Cohen 2008 Objectives and considerations for wildland fuel treatment in forested ecosystems of the interior western United States Forest Ecology and Management 2561997ndash2006
Ritchie M W C N Skinner and T A Hamilton 2007 Probability of tree survival after wildfire in an interior pine forest of northern California effects of thinning and prescribed fire Forest Ecolshyogy and Management 247200ndash208
Roloff G J S P Mealey and J D Bailey 2012 Comshyparative hazard assessment for protected species in a fire-prone landscape Forest Ecology and Manshyagement 2771ndash10
Rothermel R C 1972 A mathematical model for preshydicting fire spread in wildland fuels Research Paper INT-115 USDA Forest Service Intermounshytain Forest and Range Experiment Station Ogden Utah USA
Safford H D 2008 Fire severity in fuel treatments American River Complex fire Tahoe National Forest California Unpublished Report USDA Forest Service Pacific Southwest Region Vallejo California USA
Schmidt D A A H Taylor and C N Skinner 2008 The influence of fuels treatment and landscape arrangement on simulated fire behavior Southern Cascade range California Forest Ecology and Management 2553170ndash3184
Scott J H and R E Burgan 2005 Standard fire behavior fuel models a comprehensive set for use with Rothermelrsquos surface fire spread model General Technical Report RMRS-GTR-153 USDA Forest Service Rocky Mountain Research Station Fort Collins Colorado USA
Scott J H M P Thompson and J W Gilbertson-Day 2016 Examining alternative fuel management strategies and the relative contribution of National Forest System land to wildfire risk to adjacent homesndasha pilot assessment on the Sierra National Forest California USA Forest Ecology and Manshyagement 36229ndash37
Smith J E and L S Heath 2002 A model of forest floor carbon mass for United States forest types Research Paper NE-722 USDA Forest Service Northeastern Research Station Newtown Square Pennsylvania USA
Stephens S L 2005 Forest fire causes and extent on United States Forest Service lands International Journal of Wildland Fire 14213ndash222
Stephens S L B M Collins E Biber and P Z Fulme 2016a US federal fire and forest policy emphasizshying resilience in dry forests Ecosphere 7e01584
Stephens S L J D Miller B M Collins M P North J J Keane and S L Roberts 2016b Wildfire impacts on California Spotted Owl nesting habitat in the Sierra Nevada Ecosphere 7e01584
Stephens S L J J Moghaddas B R Hartsough E E Y Moghaddas and N E Clinton 2009 Fuel treatshyment effects on stand-level carbon pools treatshyment-related emissions and fire risk in a Sierra Nevada mixed-conifer forest Canadian Journal of Forest Research 391538ndash1547
Stephens S L et al 2012 Fuel treatment impacts on estimated wildfire carbon loss from forests in Monshytana Oregon California and Arizona Ecosphere 31ndash17
Tempel D et al 2015 Evaluating short- and longshyterm impacts of fuels treatments and simulated wildfire on an old-forest species Ecosphere 61ndash19
USDA Forest Service 2004 Sierra Nevada Forest Plan Amendment Final supplemental environmental impact statement Record of decision Publication R5-MB-046 USDA Forest Service Pacific Southshywest Region Vallejo California USA
Van Wagner C E 1977 Conditions for the start and spread of crown fire Canadian Journal of Forest Research 723ndash34
Verner J K S McKelvey B R Noon R Gutimerrez G I Gould Jr and T W Beck 1992 Assessment of the current status of the California spotted owl with recommendations for management Pages 3ndash27 in J Verner K S McKelvey B R Noon R Gutimerrez G I Gould Jr and T W Beck edishytors The California Spotted Owl a technical assessment of its current status PSW-GTR-133 USDA Forest Service Albany California USA
Westerling A B Bryant H Preisler T Holmes H Hidalgo T Das and S Shrestha 2011 Climate change and growth scenarios for California wildshyfire Climatic Change 109445ndash463
Westerling A L H G Hidalgo D R Cayan and T W Swetnam 2006 Warming and earlier Spring increase Western US Forest Wildfire Activity Science 313940ndash943
Wiedinmyer C and M D Hurteau 2010 Prescribed fire as a means of reducing forest carbon emissions in the Western United States Environmental Science amp Technology 441926ndash1932
SUPPORTING INFORMATION
Additional Supporting Information may be found online at httponlinelibrarywileycomdoi101002ecs2 1648full
wwwesajournalsorg 21 January 2017 Volume 8(1) Article e01648
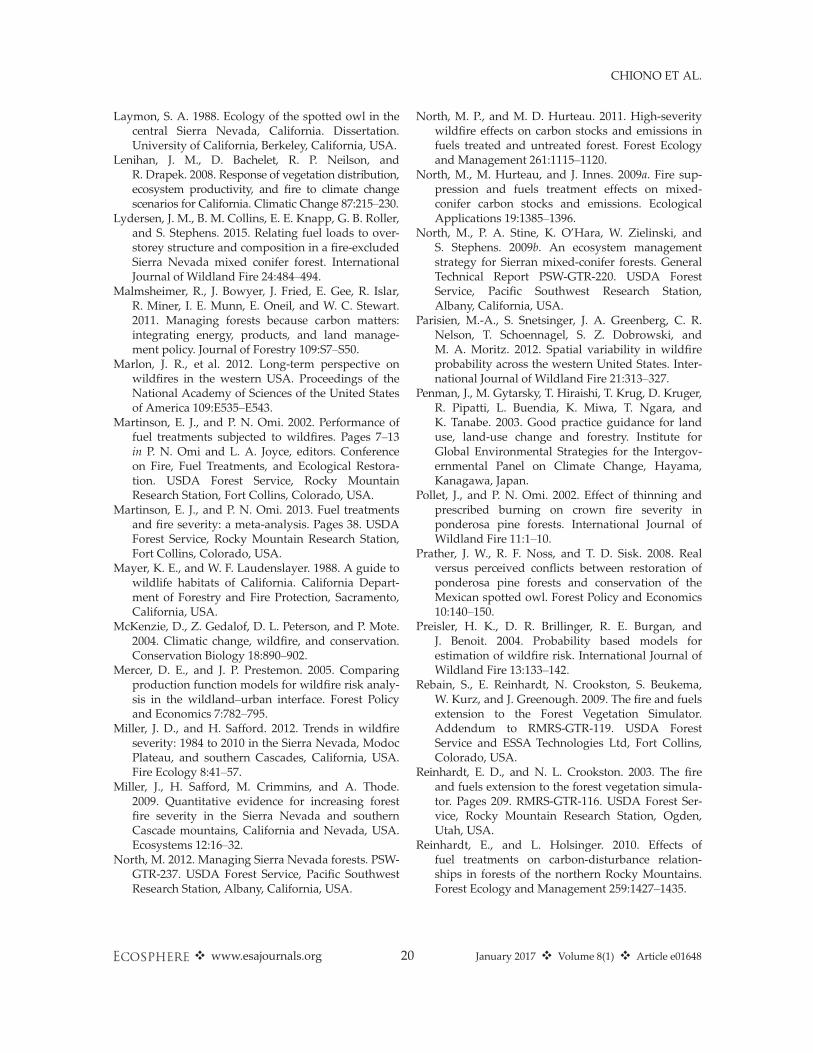
CHIONO ET AL
Laymon S A 1988 Ecology of the spotted owl in the central Sierra Nevada California Dissertation University of California Berkeley California USA
Lenihan J M D Bachelet R P Neilson and R Drapek 2008 Response of vegetation distribution ecosystem productivity and fire to climate change scenarios for California Climatic Change 87215ndash230
Lydersen J M B M Collins E E Knapp G B Roller and S Stephens 2015 Relating fuel loads to overshystorey structure and composition in a fire-excluded Sierra Nevada mixed conifer forest International Journal of Wildland Fire 24484ndash494
Malmsheimer R J Bowyer J Fried E Gee R Islar R Miner I E Munn E Oneil and W C Stewart 2011 Managing forests because carbon matters integrating energy products and land manageshyment policy Journal of Forestry 109S7ndashS50
Marlon J R et al 2012 Long-term perspective on wildfires in the western USA Proceedings of the National Academy of Sciences of the United States of America 109E535ndashE543
Martinson E J and P N Omi 2002 Performance of fuel treatments subjected to wildfires Pages 7ndash13 in P N Omi and L A Joyce editors Conference on Fire Fuel Treatments and Ecological Restorashytion USDA Forest Service Rocky Mountain Research Station Fort Collins Colorado USA
Martinson E J and P N Omi 2013 Fuel treatments and fire severity a meta-analysis Pages 38 USDA Forest Service Rocky Mountain Research Station Fort Collins Colorado USA
Mayer K E and W F Laudenslayer 1988 A guide to wildlife habitats of California California Departshyment of Forestry and Fire Protection Sacramento California USA
McKenzie D Z Gedalof D L Peterson and P Mote 2004 Climatic change wildfire and conservation Conservation Biology 18890ndash902
Mercer D E and J P Prestemon 2005 Comparing production function models for wildfire risk analyshysis in the wildlandndashurban interface Forest Policy and Economics 7782ndash795
Miller J D and H Safford 2012 Trends in wildfire severity 1984 to 2010 in the Sierra Nevada Modoc Plateau and southern Cascades California USA Fire Ecology 841ndash57
Miller J H Safford M Crimmins and A Thode 2009 Quantitative evidence for increasing forest fire severity in the Sierra Nevada and southern Cascade mountains California and Nevada USA Ecosystems 1216ndash32
North M 2012 Managing Sierra Nevada forests PSWshyGTR-237 USDA Forest Service Pacific Southwest Research Station Albany California USA
North M P and M D Hurteau 2011 High-severity wildfire effects on carbon stocks and emissions in fuels treated and untreated forest Forest Ecology and Management 2611115ndash1120
North M M Hurteau and J Innes 2009a Fire supshypression and fuels treatment effects on mixed-conifer carbon stocks and emissions Ecological Applications 191385ndash1396
North M P A Stine K OrsquoHara W Zielinski and S Stephens 2009b An ecosystem management strategy for Sierran mixed-conifer forests General Technical Report PSW-GTR-220 USDA Forest Service Pacific Southwest Research Station Albany California USA
Parisien M-A S Snetsinger J A Greenberg C R Nelson T Schoennagel S Z Dobrowski and M A Moritz 2012 Spatial variability in wildfire probability across the western United States Intershynational Journal of Wildland Fire 21313ndash327
Penman J M Gytarsky T Hiraishi T Krug D Kruger R Pipatti L Buendia K Miwa T Ngara and K Tanabe 2003 Good practice guidance for land use land-use change and forestry Institute for Global Environmental Strategies for the Intergovshyernmental Panel on Climate Change Hayama Kanagawa Japan
Pollet J and P N Omi 2002 Effect of thinning and prescribed burning on crown fire severity in ponderosa pine forests International Journal of Wildland Fire 111ndash10
Prather J W R F Noss and T D Sisk 2008 Real versus perceived conflicts between restoration of ponderosa pine forests and conservation of the Mexican spotted owl Forest Policy and Economics 10140ndash150
Preisler H K D R Brillinger R E Burgan and J Benoit 2004 Probability based models for estimation of wildfire risk International Journal of Wildland Fire 13133ndash142
Rebain S E Reinhardt N Crookston S Beukema W Kurz and J Greenough 2009 The fire and fuels extension to the Forest Vegetation Simulator Addendum to RMRS-GTR-119 USDA Forest Service and ESSA Technologies Ltd Fort Collins Colorado USA
Reinhardt E D and N L Crookston 2003 The fire and fuels extension to the forest vegetation simulashytor Pages 209 RMRS-GTR-116 USDA Forest Sershyvice Rocky Mountain Research Station Ogden Utah USA
Reinhardt E and L Holsinger 2010 Effects of fuel treatments on carbon-disturbance relationshyships in forests of the northern Rocky Mountains Forest Ecology and Management 2591427ndash1435
wwwesajournalsorg 20 January 2017 Volume 8(1) Article e01648
CHIONO ET AL
Reinhardt E D R E Keane D E Calkin and J D Cohen 2008 Objectives and considerations for wildland fuel treatment in forested ecosystems of the interior western United States Forest Ecology and Management 2561997ndash2006
Ritchie M W C N Skinner and T A Hamilton 2007 Probability of tree survival after wildfire in an interior pine forest of northern California effects of thinning and prescribed fire Forest Ecolshyogy and Management 247200ndash208
Roloff G J S P Mealey and J D Bailey 2012 Comshyparative hazard assessment for protected species in a fire-prone landscape Forest Ecology and Manshyagement 2771ndash10
Rothermel R C 1972 A mathematical model for preshydicting fire spread in wildland fuels Research Paper INT-115 USDA Forest Service Intermounshytain Forest and Range Experiment Station Ogden Utah USA
Safford H D 2008 Fire severity in fuel treatments American River Complex fire Tahoe National Forest California Unpublished Report USDA Forest Service Pacific Southwest Region Vallejo California USA
Schmidt D A A H Taylor and C N Skinner 2008 The influence of fuels treatment and landscape arrangement on simulated fire behavior Southern Cascade range California Forest Ecology and Management 2553170ndash3184
Scott J H and R E Burgan 2005 Standard fire behavior fuel models a comprehensive set for use with Rothermelrsquos surface fire spread model General Technical Report RMRS-GTR-153 USDA Forest Service Rocky Mountain Research Station Fort Collins Colorado USA
Scott J H M P Thompson and J W Gilbertson-Day 2016 Examining alternative fuel management strategies and the relative contribution of National Forest System land to wildfire risk to adjacent homesndasha pilot assessment on the Sierra National Forest California USA Forest Ecology and Manshyagement 36229ndash37
Smith J E and L S Heath 2002 A model of forest floor carbon mass for United States forest types Research Paper NE-722 USDA Forest Service Northeastern Research Station Newtown Square Pennsylvania USA
Stephens S L 2005 Forest fire causes and extent on United States Forest Service lands International Journal of Wildland Fire 14213ndash222
Stephens S L B M Collins E Biber and P Z Fulme 2016a US federal fire and forest policy emphasizshying resilience in dry forests Ecosphere 7e01584
Stephens S L J D Miller B M Collins M P North J J Keane and S L Roberts 2016b Wildfire impacts on California Spotted Owl nesting habitat in the Sierra Nevada Ecosphere 7e01584
Stephens S L J J Moghaddas B R Hartsough E E Y Moghaddas and N E Clinton 2009 Fuel treatshyment effects on stand-level carbon pools treatshyment-related emissions and fire risk in a Sierra Nevada mixed-conifer forest Canadian Journal of Forest Research 391538ndash1547
Stephens S L et al 2012 Fuel treatment impacts on estimated wildfire carbon loss from forests in Monshytana Oregon California and Arizona Ecosphere 31ndash17
Tempel D et al 2015 Evaluating short- and longshyterm impacts of fuels treatments and simulated wildfire on an old-forest species Ecosphere 61ndash19
USDA Forest Service 2004 Sierra Nevada Forest Plan Amendment Final supplemental environmental impact statement Record of decision Publication R5-MB-046 USDA Forest Service Pacific Southshywest Region Vallejo California USA
Van Wagner C E 1977 Conditions for the start and spread of crown fire Canadian Journal of Forest Research 723ndash34
Verner J K S McKelvey B R Noon R Gutimerrez G I Gould Jr and T W Beck 1992 Assessment of the current status of the California spotted owl with recommendations for management Pages 3ndash27 in J Verner K S McKelvey B R Noon R Gutimerrez G I Gould Jr and T W Beck edishytors The California Spotted Owl a technical assessment of its current status PSW-GTR-133 USDA Forest Service Albany California USA
Westerling A B Bryant H Preisler T Holmes H Hidalgo T Das and S Shrestha 2011 Climate change and growth scenarios for California wildshyfire Climatic Change 109445ndash463
Westerling A L H G Hidalgo D R Cayan and T W Swetnam 2006 Warming and earlier Spring increase Western US Forest Wildfire Activity Science 313940ndash943
Wiedinmyer C and M D Hurteau 2010 Prescribed fire as a means of reducing forest carbon emissions in the Western United States Environmental Science amp Technology 441926ndash1932
SUPPORTING INFORMATION
Additional Supporting Information may be found online at httponlinelibrarywileycomdoi101002ecs2 1648full
wwwesajournalsorg 21 January 2017 Volume 8(1) Article e01648
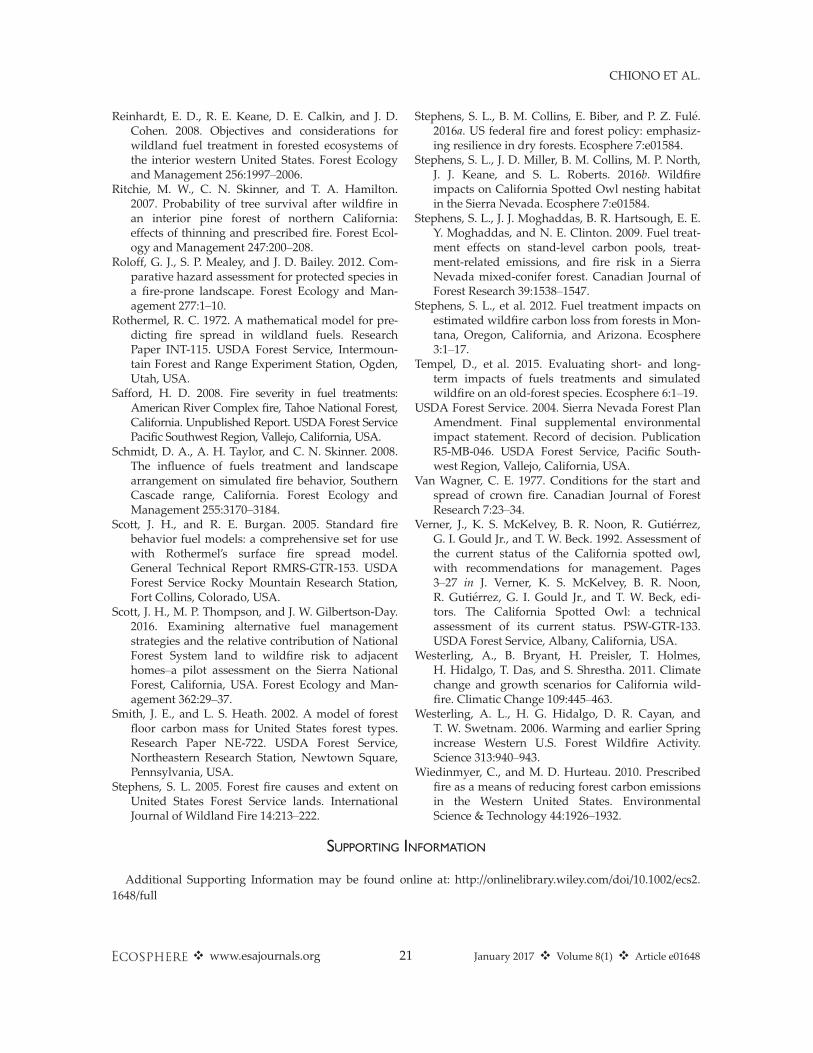
CHIONO ET AL
Reinhardt E D R E Keane D E Calkin and J D Cohen 2008 Objectives and considerations for wildland fuel treatment in forested ecosystems of the interior western United States Forest Ecology and Management 2561997ndash2006
Ritchie M W C N Skinner and T A Hamilton 2007 Probability of tree survival after wildfire in an interior pine forest of northern California effects of thinning and prescribed fire Forest Ecolshyogy and Management 247200ndash208
Roloff G J S P Mealey and J D Bailey 2012 Comshyparative hazard assessment for protected species in a fire-prone landscape Forest Ecology and Manshyagement 2771ndash10
Rothermel R C 1972 A mathematical model for preshydicting fire spread in wildland fuels Research Paper INT-115 USDA Forest Service Intermounshytain Forest and Range Experiment Station Ogden Utah USA
Safford H D 2008 Fire severity in fuel treatments American River Complex fire Tahoe National Forest California Unpublished Report USDA Forest Service Pacific Southwest Region Vallejo California USA
Schmidt D A A H Taylor and C N Skinner 2008 The influence of fuels treatment and landscape arrangement on simulated fire behavior Southern Cascade range California Forest Ecology and Management 2553170ndash3184
Scott J H and R E Burgan 2005 Standard fire behavior fuel models a comprehensive set for use with Rothermelrsquos surface fire spread model General Technical Report RMRS-GTR-153 USDA Forest Service Rocky Mountain Research Station Fort Collins Colorado USA
Scott J H M P Thompson and J W Gilbertson-Day 2016 Examining alternative fuel management strategies and the relative contribution of National Forest System land to wildfire risk to adjacent homesndasha pilot assessment on the Sierra National Forest California USA Forest Ecology and Manshyagement 36229ndash37
Smith J E and L S Heath 2002 A model of forest floor carbon mass for United States forest types Research Paper NE-722 USDA Forest Service Northeastern Research Station Newtown Square Pennsylvania USA
Stephens S L 2005 Forest fire causes and extent on United States Forest Service lands International Journal of Wildland Fire 14213ndash222
Stephens S L B M Collins E Biber and P Z Fulme 2016a US federal fire and forest policy emphasizshying resilience in dry forests Ecosphere 7e01584
Stephens S L J D Miller B M Collins M P North J J Keane and S L Roberts 2016b Wildfire impacts on California Spotted Owl nesting habitat in the Sierra Nevada Ecosphere 7e01584
Stephens S L J J Moghaddas B R Hartsough E E Y Moghaddas and N E Clinton 2009 Fuel treatshyment effects on stand-level carbon pools treatshyment-related emissions and fire risk in a Sierra Nevada mixed-conifer forest Canadian Journal of Forest Research 391538ndash1547
Stephens S L et al 2012 Fuel treatment impacts on estimated wildfire carbon loss from forests in Monshytana Oregon California and Arizona Ecosphere 31ndash17
Tempel D et al 2015 Evaluating short- and longshyterm impacts of fuels treatments and simulated wildfire on an old-forest species Ecosphere 61ndash19
USDA Forest Service 2004 Sierra Nevada Forest Plan Amendment Final supplemental environmental impact statement Record of decision Publication R5-MB-046 USDA Forest Service Pacific Southshywest Region Vallejo California USA
Van Wagner C E 1977 Conditions for the start and spread of crown fire Canadian Journal of Forest Research 723ndash34
Verner J K S McKelvey B R Noon R Gutimerrez G I Gould Jr and T W Beck 1992 Assessment of the current status of the California spotted owl with recommendations for management Pages 3ndash27 in J Verner K S McKelvey B R Noon R Gutimerrez G I Gould Jr and T W Beck edishytors The California Spotted Owl a technical assessment of its current status PSW-GTR-133 USDA Forest Service Albany California USA
Westerling A B Bryant H Preisler T Holmes H Hidalgo T Das and S Shrestha 2011 Climate change and growth scenarios for California wildshyfire Climatic Change 109445ndash463
Westerling A L H G Hidalgo D R Cayan and T W Swetnam 2006 Warming and earlier Spring increase Western US Forest Wildfire Activity Science 313940ndash943
Wiedinmyer C and M D Hurteau 2010 Prescribed fire as a means of reducing forest carbon emissions in the Western United States Environmental Science amp Technology 441926ndash1932
SUPPORTING INFORMATION
Additional Supporting Information may be found online at httponlinelibrarywileycomdoi101002ecs2 1648full
wwwesajournalsorg 21 January 2017 Volume 8(1) Article e01648