Embed Size (px)
Citation preview

13
Semestre Económico - Universidad de Medellín
Semestre Económico, volumen 14, No. 29, edición especial, p. 13-30 • ISSN 0120-6346, diciembre de 2011, Medellín, Colombia
ASSESSING THE VIABILITY OF PROTECTING COLOMBIAN CARIBBEAN COAST FROM SEA LEVEL RISE:
AN ECONOMIC VALUATION APPROACH*
Andrea Cardoso**
James Benhin***
Recibido: agosto 30 de 2010
Aceptado: septiembre 19 de 2011
ABSTRACTThe coastal areas of Colombia are highly susceptible to sea level rise (SLR) due to climate change. The degree of vulnerability has been determined and currently an adaptation plan is being evaluated. This study applied a Cost Benefit Analysis (CBA) over a 100 years scenario to assess the feasibility of the plan in the Colombian Caribbean Coast. A Contingent Valuation Method was used to estimate the market and the non-market benefits, using a random sam-ple of 504 respondents in Barranquilla, Cartagena and Santa Marta. The estimated benefits are weighted against the cost of the protection strategy as estimated by the Netherlands Climate Change Studies Assistance Programme. The CBA results indicate that carrying out the additional measures for protecting the Colombian Caribbean Coast from SLR is an economic and ecological feasible venture even if predictions of SLR are uncertain.
KEY WORDSValuation of environmental effects; environmental economics; climate change; sea level rise.
JEL CLASSIFICATIONQ51; Q54
CONTENT1. Introduction and background; 2. Methodology; 3. Results and discussion; 4. Conclusions; References.
* Research project. European Joint Master in Water and Coastal Management´s dissertation. School of Earth, Ocean and Environ-mental Sciences. University of Plymouth. Plymouth, United Kingdom. Erasmus Mundus Program. September 2007-March 2008.
** Economist, Universidad Javeriana, Bogotá Colombia. MSc in Water and Coastal Management University of Plymouth. Plymouth, United Kingdom. Full time Professor at the University of Magdalena, Santa Marta, Colombia. Socio-ecologic systems for Human Welfare Research Group. Carrera 32 # 22-08, Santa Marta, Colombia. Email: [email protected].
*** Economist, University of Cape Coast, Ghana. Mhil in Economics, University of Ghana, Accra, Ghana. PhD in Economics and Envi-ronmental Management, University of York. York, United Kingdom. Lecturer at the School of Management, University of Plymouth. Drake Circus, Plymouth, PL4 8AA, United Kingdom. Email: [email protected].

Assessing the viability of protecting colombian caribbean coast from sea level rise: an economic valuation approach
14 Universidad de Medellín
AVALIAÇÃO DA VIABILIDADE PARA A PROTEÇÃO DO LITORAL CARIBE COLOMBIANO DAS SUBIDAS DO NÍVEL DO MAR: UM ENFOQUE DE VALORAÇÃO ECONÔMICA RESUMO
As áreas do litoral colombiano são altamente susceptíveis as subidas do nível do mar (SNM) por causa das alterações climáticas. O nível de vulnerabilidade tem sido determinado e atualmente um plano de adaptação esta sendo avaliado. Este artigo usa uma Analise Custo Beneficio (ACB) sobre um cenário para avaliar a factibilidade do plano no Litoral Caribe Colombiano. Um método de Valoração Contingente foi usado para estimar os benefícios do mercado e do não-mercado, usando uma mostra aleatória de 504 inquiridos em Barran-quilla, Cartagena, e Santa Marta. Os benefícios estimados são comparados contra o custo da estratégia de proteção estimada pelo Programa de Estudos de Assistência de Alterações Climáticas da Holanda. Os resultados ACB indicam que implementar as medidas adicionais para a proteção do Litoral Caribe Colombiano das SNM é um projeto viável, inclusive se as predições das SNM sejam incertas.
PALAVRAS-CHAVEValoração de efeitos no médio ambiente: economia do médio ambiente; alterações climáti-cas, subidas do nível do mar
CLASSIFICAÇÃO JEL Q51; Q54
CONTEÚDO 1. Introdução e entorno; 2. Metodologia; 3. Resultados e discussão; 4. Conclusões e refe-rencias.
EVALUACIÓN DE VIABILIDAD PARA LA PROTECCIÓN DE LA COSTA CARIBE COLOMBIANA DE AUMENTOS EN EL NIVEL DEL MAR: UN ENFOQUE DE VALORACIÓN ECONÓMICARESUMEN
Las áreas costeras de Colombia son altamente susceptibles a aumentos en el nivel del mar (ANM) debido al cambio climático. El grado de vulnerabilidad ha sido determinado y actualmente un plan de adaptación está siendo evaluado. Este estudio utilizó un Análisis Costo Beneficio (ACB) sobre un escenario de 100 años para evaluar la factibilidad del plan en la Costa Caribe Colombiana. El Método de Valoración Contingente fue utilizado para estimar los beneficios del mercado y del no-mercado, utilizando una muestra aleatoria de 504 encuestados en Barranquilla, Cartagena y Santa Marta. Los beneficios estimados son comparados contra el costo de la estrategia de protección estimado por el Programa de Es-tudios de Asistencia de Cambio Climático de Holanda. Los resultados del ACB indican que implementar las medidas adicionales para la protección de la Costa Caribe Colombiana del ANM es un proyecto viable inclusive sí las predicciones del ANM son impredecibles.
PALABRAS CLAVEValoración de efectos medioambientales: economía medioambiental; cambio climático: aumentos en el nivel del mar
CLASIFICACIÓN JEL Q51; Q54
CONTENIDO 1. Introducción y entrono; 2. Metodología; 3. Resultados y discusión; 4. Conclusiones; Referencias

Andrea Cardoso - James Benhin
15Semestre Económico, volumen 14, No. 29, edición especial, p. 13-30 • ISSN 0120-6346, diciembre de 2011, Medellín, Colombia
1. INTRODUCTION AND BACKGROUND
1.1. The SLR Impacts in Colombia
Developing countries like Colombia which
have some of the lowest emissions of CO2 globally
(between 0.2 and 0.3% of greenhouse gases global
emissions) would however be highly vulnerable
to the effects of climate change especially with
respect to sea level rise (SLR). An increase of one
meter in the average sea level in the region, for
instance, would result in a permanent flooding of
4,900 km2 of low-lying coastal areas, with strong
pool formation in nearby areas of bodies of water
located in the coastal areas, to a complete flooding
of 5,100 km2 (IDEAM, 2001). In addition, flooding
would increase the rate of erosion, especially in
areas where anthropogenic impacts have reduced
the buffer capabilities of the coastal systems such
as beaches and marshes (INVEMAR, 2003).
Colombia’s First National Communication
to the United Nation Framework Convention on
Climate Change concluded that on the Caribbean
coast 49% of the 7,208,299 hectares of crops were
highly vulnerable. In the industrial sector, 75.3%
(475 hectares) of the area used for manufacturing
facilities in Barranquilla and 99.7% (877 hectares)
in Cartagena are under high-vulnerability. Mo-
reover, 44.8% of the road networks were highly
vulnerable, 5.2% are moderately vulnerable and
22.7% are slightly vulnerable (IDEAM, 2001). These
potential impacts and associated economic costs
will result in significant challenges for Colombia’s
environmental management. Consequently, urgent
environmental and socio-economic measures must
be taken to mitigate the impacts of SLR and to
provide sustainable development in the area.
Following these vulnerability assessments of
the Colombia coastal area to SLR, e critical areas
have been identified by the Colombian National
Institute for Marine and Coastal Research (IN-
VEMAR, 2003) under the project: “Netherlands
Climate Change Studies Assistance Programme-
(NCCSAP: Colombia): Defining the vulnerability of
bio-geophysical and socio-economic systems due
to sea level change in the Colombian coastal zone
(Pacific and Caribbean) and adaptation measures.”
A multi-criteria analysis also established the most
suitable protection strategy for each hot spot area.
Most of the strategies directly addressed the po-
tential flooding problem (see Table 1).
What is lacking is an evaluation of the feasi-
bility of the adaptation plan to help policy makers
decide if it should be implemented. This study
attempts to assess the viability of the protection
plan. Using a CBA approach, CVM estimated
benefits was weighed against the estimated cost
of the protection strategy using secondary data
from the NCCSAP study. The outcome provides
an economic framework to assess the adaptation
strategies to the SLR and climate change by integra-
ting CBA and economic valuation. This integration
implies the assessment of the adaptation strategy
itself and the non-market values related with it.
1.2. The economics of the climate change and SLR
Several studies have been undertaken to
analyse the physical process of climate change
impacts, but only since the 1990s have scientists
explored the economic impacts of these changes.
Gambarelli and Goria (2004) attribute this delay to
two main factors. First, economic valuation requi-
res a precise knowledge of the physical impacts;
but this knowledge is limited since the climate
change process from anthropogenic emissions is
still uncertain, because of the large temporal lag
between causes and effects. Second, valuing non-marketable goods by using monetary units can be
a difficult and controversial task. Nevertheless,
economic assessment studies serve as a tool for
policy makers to measure climate change pheno-
menon from an economic perspective, as well as to
obtain information about the economic responses
in terms of costs, benefits, equity, efficacy and
social feasibility.

Assessing the viability of protecting colombian caribbean coast from sea level rise: an economic valuation approach
16 Universidad de Medellín
Besides, according to Gibbs (1984), econo-
mists have divided welfare impacts into two main
categories: (i) market and (ii) non-market damages.
Market damages are the welfare impacts resulting
from productivity changes and reflected in changes
in prices or quantities of marketed goods. Non-market damages include the direct utility loss as
a result of less hospitable climate, loss ecosystem
services and biodiversity. Gibbs (1984) stated that
both the impacts of the SLR and the value of the
adaptation measures are large, because market and
non-market damages resulting from environmental
changes represented revisions in investment in
response to the SLR. As a consequence, climate
change impacts may influence the decision-making
process to reach sustainable development (Magrin
et al. 2007), since climate change and SLR bring
biophysical and environmental changes that affect
human welfare, because of the link between the
environment and the socio-economic systems
(Pizer and Goulder, 2005).
On the whole, human adaptive responses to
climate change are an investment decision (EPA,
1995). These actions protect public goods from
Planning Development Plan
Land Planning Strategy Additional Measures
Relocation of affected people
Beach nourishment
Construction of a marine dike at the Santa Marta and Cartagena waterfront
Support to a Research Program
Adapting the system of roads and bridges (elevation of highways) Retaining Walls (ports and roads)
Construction of river dike (Southeast of the Magdalena River)
Construction of artificial island
Warning systems implementation
Actions to apply Continuous action Planning phase
Table 1. Planning stages of the Action Plan.
Source: Study NCCSAP: Colombia. INVEMAR (2003)
Action Plan 2002-2012 2012-2030 2030-2100

Andrea Cardoso - James Benhin
17Semestre Económico, volumen 14, No. 29, edición especial, p. 13-30 • ISSN 0120-6346, diciembre de 2011, Medellín, Colombia
adverse impacts of climate change and generate
benefits (Leary, 1999), but their materialization
involves tradeoffs in allocating resources. Further-
more, investment choices are irreversible policies,
conditioned by the magnitude of the impacts and
the potential of the measures to reduce adverse
impacts of the SLR. However, because of the uncer-
tainties about the likelihood of global warming and
the time frame over which impacts may become
apparent, Titus (1990) suggested that governments
only carried out those adaptation measures
which significantly reduced the adverse impacts
of sea-level rise, but did not risk the investment if
the projected effects of global warming failed to
materialise.
Therefore, decision makers have a great need
for a framework to evaluate the adaptive responses
to achieve mitigation, such as the CBA. This analyti-
cal tool has the potential to advance the allocation
of a provision for environmental impacts in the
project cycle and to provide the means of com-
parison of projects, even when benefits and costs
are produced at different time periods (Wattage
et al, 2000). Thus, protection is advised only if its
benefits are greater than the costs (Ng and Men-
delsohn, 2006). Nevertheless, all projects linked
with the environment and applying this approach
face serious hurdles, since environmental benefits
are difficult to quantify due to the numerous non-market values attached to the natural resource
management and they cannot easily be measured
in monetary terms. Consequently, using traditional
economic approaches for these non-market goods
could be undervalued (Wattage et al, 2000).
In fact, Leary (1999) claimed the necessity for
an additional criterion to judge benefit estimation
from adaptation measures other than the pure
efficiency criterion, because information about
the future of climate, climate variability, and the
benefits and costs of adapting options have attri-
butes of public goods. Although, several objections
have been made regarding the idea of assessing
and putting a “price” on non-marketable goods,
literature has shown “economic valuation” as an
important tool in the process of managing natural
resources. Moreover, economic valuation can be
useful by providing a way to justify and set priorities
for programs, policies or action for protecting or
restoring ecosystems and their services.
As a result, there is a strong tendency among
scientists to use the framework that integrates CBA
and an economic valuation. For instance, Ng and
Mendelsohn’s (2006) integrated both methodolo-
gies to asses the economic impact of the SLR on
non-market lands such as beaches, marshes, man-
groves and estuaries in Singapore. They explored
two measures of the benefits of protecting natural
sites from the damage caused by SLR. Using CVM
and Travel Cost approaches, they weighed the be-
nefits of the non-market coastal resources against
the cost of protection. The results suggested that
it would be cost effective to protect the beaches
in every sea-level rise scenario. At the same time,
only the CVM analysis suggested that it would be
worth for Singapore to protect its marshes and
mangroves. The study concludes that in the long
run, mangroves and marshes can also survive by
migrating inland as the sea rises, but the high level
of development in Singapore makes other alterna-
tives such as hard structures more attractive. A
similar assessment could help policy makers in
Colombia in their decision to protect the coastal
areas against SLR.
2. METHODOLOGY
Relevant economic approaches are used to
measure the welfare changes associated with the
protection of the Colombian Caribbean coast from
SLR. To estimate the benefits of an adaptation plan,
this study uses a CVM to value the market and the
non-market benefits. The CVM approach involves
asking respondents their willingness to pay (WTP)
for the adaptation plan to be implemented. The

Assessing the viability of protecting colombian caribbean coast from sea level rise: an economic valuation approach
18 Universidad de Medellín
survey was carried out in the three main cities
of the Colombian Caribbean Coast: Barranquilla,
Cartagena and Santa Marta, which according to
INVEMAR (2003) are risky areas due to the SLR. In
order to assess the viability of the protection Plan
a CBA was carried out over a 100 year period; in
which the CVM estimated benefits were weighed
against the estimated cost of the protection. This
cost was provided by the “Netherlands Climate
Change Studies Assistance Programme-NCCSAP:
Colombia”.
2.1. Economic valuation
Non-market valuation techniques are clas-
sified into two major groups: On one hand, the
direct approach, also called “attitudinal approach”,
measures values from what people consider and
say about their preferences (Ng and Mendelsohn,
2006). This technique uses surveys to obtain
individual valuation for hypothetical changes in
environmental resources. The most used direct
method is the CVM, which is considered to be
the only methodology simultaneously capable of
obtaining “non-use values” and “use values” in the
estimation of the welfare changes (Hanemann,
1994; Mitchell and Carson, 1989; Chaudry, Singh
and Tewari 2007). On the other hand, the indirect
approach or “behavioural technique” analyses
the behaviour of the actual markets based on the
household decisions to consume commodities
connected with non-market goods, so those de-
cisions can reveal its value ((Ng and Mendelsohn,
2006; Chaudry, Singh and Tewari, 2007). Travel
Cost Method, for example, deduces the natural
resource values based on the decisions of visitors
to travel to the site from different distances (Ng
and Mendelsohn, 2006).
The CVM uses survey questions to estimate
people’s preferences for public goods by finding
out what they would be willing to pay for specified
improvements. “Willingness to Pay” has been
defined by Leary (1999) as the sum of money, paid
either by an individual or a household, which would
have an equivalent effect on the individual’s welfare
as would the policy. It represents a package of
commodities that the individual would be willing
to sacrifice or exchange for a different package of
commodities that would be made available to the
individual by the implementation of the policy.
Therefore, it is important to inform the respondents
about the valuation situation. The individual should
have complete information on the benefits of the
good, and they should understand the natural
resource present situation and the hypothetical
changes in quality or quantity terms (Chaudry,
Singh and Tewari, 2007), to ensure the uniformity of
the conceptualization (Mitchell and Carson, 1989).
This information is given by the survey as the crea-
tion of the hypothetical scenario which specifies a
variety of states of the good to be valued and the
conditions of its provision.
2.2. Survey data
2.2.1 Sample size
A contingent valuation study requires large
sample sizes because of the large variance in the
WTP responses. To obtain an acceptable degree
of precision in sample statistics, for the sample
needed it was decided to use a coefficient of va-
riation of 2.0; a percentage distribution between
the true WTP and the estimated WTP of 0.15 and
90% (1-α, α=0.1) confidence level with the t value of
1.69. These give a sample size of 508 (Mitchell and
Carson, 1989). This sample size was divided into
the three main cities of the Colombian Caribbean
Coast: Barranquilla, Cartagena and Santa Marta
(168 each).
In order to obtain reliable results and to ensu-
re the maximum positive response rate, the survey
was conducted by face-to-face interviews, following
Chaudry, Singh and Tewari (2007) suggestions. The
survey was conducted over a period of one week
in November of 2007 with the help of the students

Andrea Cardoso - James Benhin
19Semestre Económico, volumen 14, No. 29, edición especial, p. 13-30 • ISSN 0120-6346, diciembre de 2011, Medellín, Colombia
from the School of Economics of the “Universidad
del Magdalena-Colombia”.
2.3. Questionnaire
The questionnaire used in this survey consists
of 17 questions and took approximately from15 to
20 minutes to be completed. The questionnaire was
divided into five parts:
• Scenario Description: the scenario for thehypothetical market was created based on the study NCCSAP: Colombia. In the questionnaire, respondents were presented with possible con-sequences of the SLR in the Caribbean region. The Adaptation plan for protecting the coast from the SLR with the additional measures and their cost were also presented.
• Perceptionproblem:Questions1to5inquiredabout any direct effect of the SLR on respon-dents, which may influence their WTP. The di-rect effects of the SLR included floods, distan-ce between the respondents’ home and coast, and the number of years the respondent had livedinthelocation.Question6wasanattitu-dinal question to understand the opinion of the people about climate change consequences. In question 7 respondents were asked to evaluate the proposed additional measures according to their degree of urgency.
• TheWTPQuestion:Thescenarioorintroductionto the WTP question (question 8) was designed based on Whittington’s (1998) suggestion about constructing joint public-private CVM scenarios in developing countries to evaluate infrastructu-re projects. Whittington noted that a household in a developing country would vote in favour of a project and agree to pay some share of the capital costs if it were a collective decision. Therefore, the scenario for the WTP question needed to present information about the terms and conditions of both parts of the “deal”. In this study this “deal” was created between the government, non-governmental organizations (NGOs) and the people. In this scenario, the
government was in charge of carrying out the developmental plan for the cities and the NGO with the support of the people dealt with the additional measures. Moreover, to minimize non-responses, the chosen payment vehicle was the bill of one of the utilities instead of a direct tax. The WTP question was as follows: “How much would you be Willing To Pay per month, in one of your utility bills, to carry out the additional measures?”
• To obtain the WTP, values were created outof a combination of the bidding game which was an iterative dichotomous choice format (yes/no responses) and open-ended questions which asked for the maximum WTP. The initial bid was chosen by the “Delphi Method”, which incorporated experts’ judgment. The pool of ex-perts included scientists and professors from the School of Economics of the Universidad del Magdalena-Colombia.
• Socio-economic information:Questions10to16 sought data on respondents’ socio-economic status such as occupation, education and hou-seholdsize.Question17asksaboutthelevelofincome. Respondents were requested to select from a group of income bands, following again Chaudry, Singh and Tewari (2007) suggestions: in developing countries people are often not willing or able to precisely state their income during surveys.
2.4. Models and variables
To analyze the data collected from the survey,
Stata8 and SPSS were used. The WTP question
generated two dependent variables: levels of WTP
(duowtp) which has eight ordered categories given
by the iterative dichotomous choice format (yes/no
responses) and the Maximum WTP (maxwtp) given
by open-ended question. The variables included in
the regression models were based on the reviewed
studies presented in Table 2 plus the outcome of
the cross-tabulation analysis (Table 6) and the
correlation matrix.

Assessing the viability of protecting colombian caribbean coast from sea level rise: an economic valuation approach
20 Universidad de Medellín
The model to be estimated is given as:
WTP = f (V)
Where:
WTP = Willingness to Pay
V = Vector of explanatory variables (see
column 4 of Table 2)
2.4.1. Estimation of the mean maximum willingness to pay (WTP)
Before the estimation of the regressions it is
important to briefly discuss the descriptive statis-
tics and trends (histograms) for all the variables.
This is done to check the accuracy of the data.
Specifically the trend in the dependent variable,
maxwtp, needs to be analysed (see Figure 1A) to
exclude from the estimation unreasonably high
bids “outliers” which can occur due to a strategic
behavior or “yea-saying” and also exclude “protest
votes” when the respondents are not WTP because
they are not valuing the good as an objection to
Table 2. Variables included in the WTP model
Ng W. and Mendelsohn (2006) “The Economic Impact of Sea-level Rise on Nonmarket Lands in Singapore”
Wattage et al. (2000) “Inte-grating environmental impact, contingent valuation and cost-benefit analysis: empirical evi-dence for alternative perspective”
Chaudry, Singh and Tewari (2007) “Non-market econo-mic valuation in developing countries: Role of participant observation method in CVM analysis”
This StudyWTP=f(V)V=variables
• Age• Gender• Numberofchildren• Educationlevel• familysize• incomelevel
• GrossIncome• Education• Age• householdsize• Gender• presentwaterquality• Expectedlevelofwater
quality • Memberofanenviron-
mental organization• Distance
• Occupation• Nethousemonthlyinco-
me• householdsize• Educationalqualifica-
tion• Age• Environmental aware-
ness
• Income• Occupation• Educationlevel• Numberofchildren• Householdsize• Maritalstatus• Gender• Age• Distance• Yearslivinginthatloca-
tion• ActionPlanmeasures• City• Floods• Environmentalaware-
ness: Climate change
Source: Ng W. and Mendelsohn (2006), Wattage et al. (2000), Chaudry, Singh and Tewari (2007)
the payment vehicle or to the hypothetical scena-
rio. The outliers were identified as WTP amounts
greater than 10% of the income, while the protest
vote were identified by the respondents’ reasons
for not WTP. These are shown in Table 3.
It is evident from the responses that the main
reason for the non willingness to pay is not the low
income of the people. This is what Chaudry, Singh
and Tewari (2007), called the “Government Depen-
dence”, which is related to the majority of middle
and upper middle level of income respondents,
who argue that it is the duty of the government to
invest in environmental improvement. As a result,
respondents who answered that “the government
should pay for it”, “the utilities bills and taxes are
very expensive” and “a believe in the corruption of
government” were identified as reasons for being
protesters. Both outliers and protest votes were
removed from the dataset leaving a total of 434
respondents for the estimation (Figure 1B).

Andrea Cardoso - James Benhin
21Semestre Económico, volumen 14, No. 29, edición especial, p. 13-30 • ISSN 0120-6346, diciembre de 2011, Medellín, Colombia
Table 3. Reasons given for not WTP
WTP=0
Reasons Times Percent
Can not afford it 3 3.90%
Unemployed 3 3.90%
The damages are not notorious and it is not necessary 3 3.90%
Agreement between the government, NGO, international organization 3 3.90%
The government should pay for it 45 58.44%
The utilities bills and taxes are very expensive 8 10.39%
A believe in the corruption of government 12 15.58%
Total 77 100%
Source: made by the author
Figure 1. A: Histogram and descriptive statistics of the Initial maximum WTP. B: Histogram and descriptive statistics of the final maximum WTP (After removing outliers and protest vote)
Source: made by the author
A
B

Assessing the viability of protecting colombian caribbean coast from sea level rise: an economic valuation approach
22 Universidad de Medellín
Table 4. Tabulation of the variables introduced in the data set
Tabulation
Variables
maxwtp Marital status
wtp=0 15.28% Single 42.46%
1<wtp<2000 1.98% Married 41.27%
2000<=wtp<5000 9.13% Cohabiting 9.92%
5000<=duowtp<10000 24.60% Divorced 6.35%
10000<=wtp<15000 28.37% Occupation
15000<=wtp<20000 8.93% Students and part time employed 16.27%
wtp=20000 8.93% Employed 44.05%
wtp>20000 2.78% Self employed 25.00%
Income Retired 4.56%
Income=<500000 45.44% Housewife and others 10.12%
Income>500000-1mill 38.49% City
Income=1mill-2mill 10.91% Cartagena 33.33%
>2mill 5.16% Santa Marta 33.33%
Education Barranquilla 33.33%
Primary school 9.13% Distance
Secondary 38.69% Distance<=15min 32.14%
Technical training 23.61% 15min<distance <=30min 22.42%
Bachelor degree 23.41% 30min<distance <=60min 35.52%
Master degree 3.97% distance>60 9.92%
PhD 1.19% Age
Opinion: climate change age<=20 12.30%
Don’t know 4.56% 20<age<=30 37.10%
Not Noticeable 2.98% 30<age<=40 23.41%
Serious 38.4% age>40 27.18%
Very serious 53.97% Children
Respondents’ who had houses flooded 25.99% children=0 33.73%
Respondents’ who own the property where they live
50% 0<children<=3 53.17%
Gender children>3 13.10%
Female 54.37% Household size
Male 45.63%Household size<=5 64.29%
household>5 35.71%
Source: made by the author

Andrea Cardoso - James Benhin
23Semestre Económico, volumen 14, No. 29, edición especial, p. 13-30 • ISSN 0120-6346, diciembre de 2011, Medellín, Colombia
Finally, three types of models were estimated:
An ordinary Least Square (OLS), Ordered probit
(oprobit) and Ordered Logit (ologit). The OLS
was used to estimate the factors influencing the
amount of money that the respondents would be
willing to pay, while the Oprobit and Ologit models
determined factors influencing the respondents’
probability of willing to pay the WTP ordered cate-
gories. Oprobit and Ologit are ordered multinomial
models, where the dependent variable is an ordered
response, and the values assigned to each outcome
are not arbitrary but have highest and lowest rating
such as the levels of WTP (Wooldridge, 2002).
3. RESULTS
3.1 Descriptive statistics of the variables
Summary statistics of relevant variables are
presented in Table 4. All estimates in this study
were expressed in terms of 2007 United States
dollars (USD). The results indicate that 15.28% of
the respondents are not WTP and from those who
are WTP most (54.97%) would be willing to pay
between 2,41 USD to 7,22 USD per month. Addi-
tionally, although the sample was random, 83.93%
of the respondents have the two lowest levels of
income (less that 240,58 USD (45.43%) and between
240,58 USD to less than 481,15 USD (38.49%) ). This
is not surprising since the legal minimum wage in
Colombia for 2007 is 208,68 USD per month, and
most people (45.43%) in the surveyed areas fall in
the low income group.
Figure 2. Respondents opinion on consequences of
SLR and climate change.
Source: made by the author
Results also show a high degree of climate
change and SLR awareness among the respon-
dents. For instance, 53.97% of the respondents
observe that the consequences of SLR and climate
change in Colombia are “very serious” while 38.49%
think that they are “serious” (see figure 2) This high
degree of awareness relate closely with the degree
of urgency respondents attached to “Additional
Measures” that need to be taken in response to
SLR. Approximately 70% of respondents observed
that almost all the additional measure should be
carried out immediately (see Table 5).
Table 5. Degree of urgency of additional measures
Additional Measures Immedia-tely
In between
Even-tually
Relocation of affected people
83.33% 7.539% 9.12%
Adapting the system of roads and bridges
70.63% 13.69% 15.67%
Retaining Walls (ports and roads)
70. 83% 14.28% 14.88%
Construction of a ma-rine dike at the Santa Marta and Cartagena seafront
64.48% 13.29% 22.22%
Construction of river dike (Southeast of the Magdalena River)
67.65% 12.89% 19.44%
Beach nourishment 55.95% 16.07% 27.97%
Construction of Artifi-cial reefs
49.60% 16.26% 34.12%
Construction of artifi-cial island
44.04% 12.89% 43.05%
Warning systems im-plementation
90.67% 2.97% 06.34%
Support to a Research Program
80.95% 06.54% 12.5%
Source: made by the author
A cross tabulation analysis was undertaken
between relevant variables and the WTP levels to
assess the level of significance among difference
serious
not noticeable
don't know
very serious
Assessing the viability of protecting colombian caribbean coast from sea level rise: an economic valuation approach
24 Universidad de Medellín
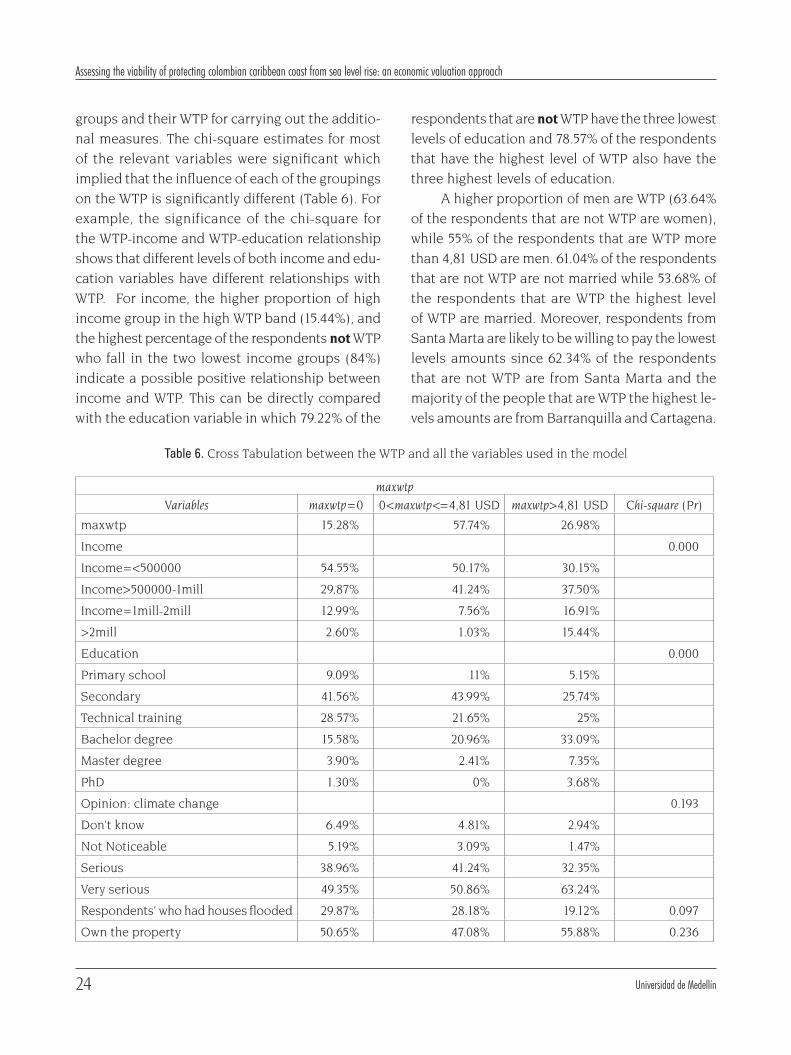
groups and their WTP for carrying out the additio-
nal measures. The chi-square estimates for most
of the relevant variables were significant which
implied that the influence of each of the groupings
on the WTP is significantly different (Table 6). For
example, the significance of the chi-square for
the WTP-income and WTP-education relationship
shows that different levels of both income and edu-
cation variables have different relationships with
WTP. For income, the higher proportion of high
income group in the high WTP band (15.44%), and
the highest percentage of the respondents not WTP
who fall in the two lowest income groups (84%)
indicate a possible positive relationship between
income and WTP. This can be directly compared
with the education variable in which 79.22% of the
respondents that are not WTP have the three lowest
levels of education and 78.57% of the respondents
that have the highest level of WTP also have the
three highest levels of education.
A higher proportion of men are WTP (63.64%
of the respondents that are not WTP are women),
while 55% of the respondents that are WTP more
than 4,81 USD are men. 61.04% of the respondents
that are not WTP are not married while 53.68% of
the respondents that are WTP the highest level
of WTP are married. Moreover, respondents from
Santa Marta are likely to be willing to pay the lowest
levels amounts since 62.34% of the respondents
that are not WTP are from Santa Marta and the
majority of the people that are WTP the highest le-
vels amounts are from Barranquilla and Cartagena.
Table 6. Cross Tabulation between the WTP and all the variables used in the model
maxwtp
Variables maxwtp=0 0<maxwtp<=4,81 USD maxwtp>4,81 USD Chi-square (Pr)
maxwtp 15.28% 57.74% 26.98%
Income 0.000
Income=<500000 54.55% 50.17% 30.15%
Income>500000-1mill 29.87% 41.24% 37.50%
Income=1mill-2mill 12.99% 7.56% 16.91%
>2mill 2.60% 1.03% 15.44%
Education 0.000
Primary school 9.09% 11% 5.15%
Secondary 41.56% 43.99% 25.74%
Technical training 28.57% 21.65% 25%
Bachelor degree 15.58% 20.96% 33.09%
Master degree 3.90% 2.41% 7.35%
PhD 1.30% 0% 3.68%
Opinion: climate change 0.193
Don’t know 6.49% 4.81% 2.94%
Not Noticeable 5.19% 3.09% 1.47%
Serious 38.96% 41.24% 32.35%
Very serious 49.35% 50.86% 63.24%
Respondents’ who had houses flooded 29.87% 28.18% 19.12% 0.097
Own the property 50.65% 47.08% 55.88% 0.236

Andrea Cardoso - James Benhin
25Semestre Económico, volumen 14, No. 29, edición especial, p. 13-30 • ISSN 0120-6346, diciembre de 2011, Medellín, Colombia
maxwtp
Variables maxwtp=0 0<maxwtp<=4,81 USD maxwtp>4,81 USD Chi-square (Pr)
Gender 0.017
Female 63.64% 56.36% 44.85%
Male 36.36% 43.64% 55.15%
Marital status 0.020
Single 38.96% 48.11% 32.35%
Married 38.96% 36.08% 53.68%
Cohabiting 12.99% 9.97% 8.09%
Divorced 9.09% 5.84% 5.88%
Occupation 0.001
Students and part time employed 11.69% 17.87% 15.44%
Employed 61.04% 37.46% 48.53%
Self employed 15.28% 30.58% 19.85%
Retired 5.19% 2.75% 8.09%
Housewife and others 9.09% 11.34% 8.09%
City 0.000
Cartagena 16.88% 34.71% 39.71%
Santa Marta 62.34% 30.93% 22.06%
Barranquilla 20.78% 34.36% 38.24%
Distance 0.138
Distance<=15min 44.16% 30.93% 27.94%
15min<distance <=30min 23.38% 21.31% 24.26%
30min<distance <=60min 25.97% 36.08% 39.71%
distance>60 6.49% 11.68% 8.09%
Age 0.047
age<=20 11.69% 15.46% 5.88%
20<age<=30 36.36% 36.43% 38.97%
30<age<=40 16.88% 24.74% 24.26%
age>40 35.06% 23.37% 30.88%
Children 0.301
children=0 27.27% 36.77% 30.88%
0<children<=3 59.74% 49.14% 58.09%
children>3 12.99% 14.09% 11.03%
Household size 0.493
Household size<=5 58.44% 64.95% 66.18%
household>5 41.56% 35.05% 33.82%
household>5 41.56% 35.05% 33.82%
Source: made by the author

Assessing the viability of protecting colombian caribbean coast from sea level rise: an economic valuation approach
26 Universidad de Medellín
3.2. Estimated regression models
Table 7. A. Regression with the category variables B. Regression with the subcategories of the significant variables
Source: made by the author
Two main estimations for the three models
were run. Regression A in Table 7, includes va-
riables indicated by studies presented in Table
2. The results show that, although, some of the
variables were not significant (gender, household
size, distance from home to coast, occupation
such as retired and employed) the signs can be
closely compared with Ng and Mendelsohn (2006)
findings. The signs are important because they
reflect the direction of the relationship between the
variables and the WTP for carrying the additional
measures. For instance, Ng and Mendelsohn (2006)
results and Regression A, suggest that respondents
with children are less likely to be willing to pay
for protection of the coast but large families and
married respondents are more likely to be willing.
Also, respondents with higher incomes were wi-
lling to pay more for protection of the coast. Ng
and Mendelsohn (2006) results show that men
were willing to pay more, as we find in the cross
tabulation analysis; but Regression A suggests
the opposite women are willing to pay more. This
may be the result of removing the outliers and the
protest vote. Additionally, Regression A shows an

Andrea Cardoso - James Benhin
27Semestre Económico, volumen 14, No. 29, edición especial, p. 13-30 • ISSN 0120-6346, diciembre de 2011, Medellín, Colombia
unexpected result. Respondents who have been
living less years in that location are willing to pay
more for carrying out the additional measures.
In relation to occupation and age the sign
shows that older and retired respondents were
willing to pay more for carrying out the additional
measures. In fact, in the cross-tabulation analysis
between WTP and the occupation subcategories,
the chi-square is significant for employed and
retired. However, the correlation matrix shows
that they are also highly correlated with income
as a result both variables were not significant in
Regression A.
In Regression B, the non-significant varia-
bles were removed and the subcategories of the
significant variables were included in the esti-
mation of the models. The interpretation of the
estimated coefficients for the oprobit and ologit
models in the Regression B is as follows: the
higher the value of the subcategory coefficient, the higher the
probability of the WTP for this subcategory in the specified
main group.
For example, if the oprobit model is fitted for
a respondent who has been living in that location
for 40 years, is married, does not have children, has
a bachelor degree and think that the consequences
of SLR and climate change in Colombia are “very se-
rious” and if his level of income is changed; it can be
seen in Figure 3A how the probability to be willing
to pay a higher level changes. This Figure shows
that if the respondent has an income 2 (240,58- 481,15 USD) the most probable level that he would
Figure 3. Change in the probability to pay WTP levels when a respondent change his level of income or education or his opinion about the consequences of climate change
1 2 3 4 5 6 7 8
0.0
0.1
0.2
0.3
0.4
0.5
WTP Category
Pro
babi
lity
Income 2Income 3Income 4
1 2 3 4 5 6 7 8
0.0
0.1
0.2
0.3
0.4
0.5
WTP Category
Pro
babi
lity
Education 4Education 6
1 2 3 4 5 6 7 8
0.0
0.1
0.2
0.3
Category
Pro
babi
lity
Climate Change 2Climate Change 4
A
B A
C
Source: made by the author

Assessing the viability of protecting colombian caribbean coast from sea level rise: an economic valuation approach
28 Universidad de Medellín
be willing to pay is level 5 ( 4,81 -7,22 USD) but if he
has an income 3 (481,15 USD- 962,30 USD) there are
two most probable levels that he would be willing
to pay level 5 and level 7( 9,62 USD). These results
may be explained by the influence of the initial bid
in the WTP question which was 4,81 USD. However,
this influence is very small when the respondent
has a high income and it is very probable that he
would be in the higher levels of WTP.
Figure 3B shows the changes of the probably to
be willing to pay when the same respondent change
his education from bachelor degree (education 4) to
PhD (education 6) and figure 1C when he changes
his opinion about the SLR and climate change
consequences in Colombia from “not noticeable”
(climate change 2) to “very serious” (climate change
4) the results from Figure 3C and the clichange_2
coefficient in Regression B suggest that respon-
dents who think that the consequences of SLR and
climate change in Colombia are “not noticeable”
are not willing to pay the highest levels of WTP.
3.3. Prediction
Finally, the oprobit model was fitted for all
the respondents in order to compare the values
of the predicted WTP with the observed WTP.
Table 8 shows the comparative matrix between
the oprobit predicted and the observed Values of
WTP. Both observed and predicted values show
that the majority of the respondents were willing
to pay from 2,41 USD to 7,22 for carrying out the
addition measures. The diagonal of this matrix
represent the R-square. The diagonal values su-
ggest that 169 (39%) respondents’ WTP (out of of
434) are explained by the variables of the oprobit
model. This value is not representative due to the
high variance associated with CVM which tends to
produce low R square. Mitchell and Carson (1989)
recommend using a R-square higher that 15%. As a
result the predicted matrix result proofs the validity
of the oprobit model and at the same time the
significance of the variables chosen in regression B.
Table 8. Comparative matrix: predicted and observed WTP
Predicted
1 2 3 4 5 6 7 8
Obs
erve
d
1 1 0 1 7 3 0 0 0
2 0 0 0 5 5 0 0 0
3 1 0 1 30 14 0 0 0
4 0 0 1 63 59 0 1 0
5 0 0 0 46 93 0 4 0
6 0 0 0 11 30 0 4 0
7 0 0 0 5 29 0 9 2
8 0 0 0 0 2 0 5 2
1 wtp=0 5 4,81<=wtp<7,22
2 0<wtp<0,96 6 7,22<=wtp<9,62
3 0,96<=wtp<2,41 7 wtp=9,96
4 2,41<=wtp<4,81 8 wtp>9,96
Source: made by the author
3.4. Costbenefitanalysis
The total value estimated by the CVM provides
a relatively better picture of the benefits for protec-
ting the Colombian Caribbean coast from SLR. This
includes both direct and non-use value benefits.
Consequently, after removing the outliers of the
Max WTP variable, the protest vote bias values
and strategic behaviour bias values, the mean res-
pondents’ Max WTP value can be extrapolated as
the marginal benefit of carrying out the additional
measures. In order to estimate the total benefit, the
marginal benefit was multiplied by the number of
households. As a result, the total benefit for 2007
for protecting the Colombian Caribbean Coast from
SLR was estimated at 30’952,504.40 USD.
The cost of carrying out the additional measu-
res of the protection strategy was estimated by the
“Netherlands Climate Change Studies Assistance
Programme-NCCSAP: Colombia” over a 100 year
period (2001- 2100) for each of the 3 cities in 2000
constant prices (INVEMAR, 2003). For this study
the cost was adjusted to 2007 constant prices by
using the inflation rate. The present value (PV) of

Andrea Cardoso - James Benhin
29Semestre Económico, volumen 14, No. 29, edición especial, p. 13-30 • ISSN 0120-6346, diciembre de 2011, Medellín, Colombia
the cost was given as 558’157.003 USD. Furthermo-
re, to estimate the PV of the total benefit for a 94
year period (2007-2100) the assumption was made
that the total benefits would remain constant for
each year.
Table 9. Estimation of the PV of Net Benefit
NPV Benefits 784’603.038
NPV Cost 558’157.004
NPV Net Benefit 226’446.034
Source: made by the author
The results of the CBA for the period 2007-2100 show that the benefits of protecting the
Colombia Caribbean Coast outweigh the cost (PV
Net Benefit>0). This implies that carrying out the
additional measures for protecting the Colombian
Caribbean coast are viable to implement if sea level
rise predictions are uncertain.
4. CONCLUSIONS
The response rate and consistency of the
answers from surveys carried out in this study
shows a high level of respondents’ support for the
additional measures to protect the Colombian Ca-
ribbean coast from SLR. In general, the results show
a high degree of climate change and SLR awareness
among the respondents. Relevant variables also
influence the WTP similar to the study by Ng and
Mendelsohn (2006) and others. These include,
levels of income and education, the opinion about
the consequences of SLR and climate change in
Colombia, the number of years respondents have
lived in the location, and the additional measures
to protect the coast by the “Construction of the Ar-
tificial Reefs.”. Respondents with children and those
who have been living in the location for a longer
period are less likely to be WTP for protection of
the coast while respondents’ married and with a
high level of income and education are more likely
to be WTP. In addition, respondents who think
that the consequences of climate change and SLR
in Colombia are “very serious” and the additional
measures “Construction of the Artificial Reefs”
must be implemented immediately were willing to
pay more for protection of the coast.
Estimates of the WTP shows that majority of
respondents were willing to pay 2,41 to 7,22 USD
for carrying out the additional measures. This band
may have been affected by the influence of the
initial bid (starting point bias) in the WTP question
which was 4,81 USD. In further studies this influen-
ce can be avoided by using spilt-sample techniques
where different prices will be assigned to randomly
selected respondents (Whittington, 1998). Howe-
ver, given the low incomes of the respondents the
results may not be significantly different from the
current outcome.
The total value estimated by the CVM helped
to estimate of the benefits for protecting the Co-
lombian Caribbean Coast from SLR including both
the direct and non-use benefits. The Cost-Benefit
Analysis shows that the benefits of protecting the
Colombia Caribbean Coast outweigh the imple-
mentation cost. This implies that carrying out the
additional measures for protecting the Colombian
Caribbean Coast is viable to implement even if
the SLR and its impacts are uncertain. As a re-
commendation for further studies, the uncertainty
surrounding the consequences of sea level rise
should be included.
It is hoped that the outcome of this study and
its methodological approach would help the state
and local governments to assess actions which
would significantly reduce potential adverse im-
pacts of SLR. Such protective measures may still
be the wise thing to do even if projected effects
of global warming fail materialise. However, the
scarcity of resources in a developing country like
Columbia must be taken into consideration in such
decision. To carry out such additional measures,
the local government should consider a joint stra-
tegy between public institutions, the private sector
Assessing the viability of protecting colombian caribbean coast from sea level rise: an economic valuation approach
30 Universidad de Medellín
and international organizations. At the same time
the government should create economic incentives
for those institutions which are willing to carry out
the protection plans.
REFERENCIAS
Chaudhry, Pradeep. Singh, Bilas and Tewari, Vindhya
(2007). Non-market economic valuation in deve-
loping countries: Role of participant observation
method in CVM analysis. In: Journal of Forest
Economics, Vol.13, No 4, p. 259-275.
EPA -Environmental Protection Agency- (1995). Antici-
patory planning for sea-level rise along the coast
of Maine. Costs and Benefits of Selected Policy
Response Options. Published September 1995
by the U.S. EPA Office of Policy, Planning, and
Evaluation, 155p.
Gambarelli, Gretel and Goria, Alessandra (2004).
Economic evaluation of climate change impacts
and adaptation in Italy. [Online] The Fondazione
Eni Enrico Mattei Note di Lavoro Series, lugar
de publicacion, editor, July 2004, <http://papers.
ssrn.com/sol3/papers.cfm?abstract_id=569122>.
[April, 2008]
Gibbs, Michael (1984). Economic analysis of sea level
rise: methods and results. In: Michael C. Barth and
James G. Titus, ed. Greenhouse effect and sea level
rise: a challenge for this generation. Van Nostrand
Reinhold Company Inc., Ch. 7, 29p.
Hanemann, W. Michael (1994). Valuing the environ-
mental through contingent valuation. In: Journal
of Economic Perspectives, Vol. 8, No 4, p. 19-43.
IDEAM -Institute of Hydrology, Meteorology and
Environmental Studies- (2001). Colombia’s First
National Communication to the United Nation
Framework Convention on Climate Change.
INVEMAR -Colombian National Institute for Marine and
Coastal Research- (2003). Netherlands Climate
Change. Studies Assistance Programme-NCCSAP:
Colombia. Defining vulnerability of bio-geophysi-
cal and social-economic systems due to sea level
change in Colombian coastal zone (Pacific and
Caribbean) and adaptation measures.
Leary, Neil A. (1999). A framework for benefit-cost analy-
sis o adaptation to climate change and climate
variability. In: Mitigation and Adaptation Strategies
for Global Change, Vol. 4, p. 307-318.
Mitchell, Robert C. and Carson, Richard T. (1989). Using
surveys to value public goods: The Contingent
Valuation Method. Resources for the Future,
Washington, DC., 463p.
Magrin, Graciela; Gay García, Carlos; Cruz Choque,
David; Giménez, Juan Carlos; Moreno, Ana Rosa;
Nagy, Gustavo J.; Nobre, Carlos and Villamizar,
Alicia (2007). Latin America. Climate Change 2007:
Impacts, Adaptation and Vulnerability. Contribu-
tion of Working Group II to the Fourth Assessment
Report of the Intergovernmental Panel on Climate
Change, M.L. Parry, O.F. Canziani, J.P. Palutikof, P.J.
van der Linden and C.E. Hanson, Eds.,Cambridge
University Press, Cambridge, UK, p. 581-615.
Ng, Wei-Shiuen and Mendelsohn, Robert (2006). The
economic impact of sea-level rise on nonmarket
lands in Singapore. In: AMBIO: A Journal of the
Human Environment, Vol. 35 No. 6, p. 289-296.
Pizer, William A. and Goulder, Lawrence H. (2005). The
economics of climate change, Working Paper 11923.
[Online] NBER Working Paper Series, Cambridge
MA, National Bureau of Economic Research,
January 2006, <http://www.nber.org/papers/
w11923.pdf>. [April, 2008].
Titus, James G. (1990). Strategies for adapting to the
greenhouse effect. In: APA Journal 311, 13p.
Wattage, Premachandra; Smith, Andrew; Pitts, Colin;
MacDonald, Adrian and Kay, David (2000). Inte-
grating environmental impact, contigent valuation
and cost-benefit analasis: empirical evidence for
alternative perspective. In: Impact Assesment and
Project Appraisal, Vol. 18, No 1, p. 5-14.
Whittington, Dale (1998). Administering contingent va-
luation surveys in developing countries. In: World
Development, Vol. 26, No 1, p. 21-30.
Wooldridge, Jeffrey M (2002). Econometric analysis of
cross section and panel data. MIT Press, Cambrid-
ge MA. 752p.