Embed Size (px)
Citation preview

“ASSESSING THE SOCIO-ECONOMIC
IMPACT OF IDENTIFYING THE L-BAND
FOR IMT SERVICES”
FINAL REPORT
Document prepared by BlueNote
Management Consulting for the
GSMA
- September 15th 2014 -

2
TABLE OF CONTENT
EXECUTIVE SUMMARY ......................................................................................... 5
I. Introduction ........................................................................................................... 7
II. Background ......................................................................................................... 8
II.a. Spectrum demand projections ...................................................................... 8
II.b. Initiatives and new frequency bands for IMT ............................................... 10
III. Services currently provided in the LAC region using L-band ............................ 14
IV. Impact assessment of identifying the L-band for IMT ....................................... 18
IV.a. Conceptual background and methodology ................................................ 18
IV.b. Assumptions used in modeling .................................................................. 24
IV.c. Key results and findings ............................................................................. 33
V. Appendix ........................................................................................................... 40
VI. Bibliography ..................................................................................................... 80

3
LIST OF FIGURES
Figure 1: Value gap between consumer surplus and migration costs......................... 6
Figure 2: Global mobile data traffic forecast, 2013 - 2018 ............................................ 8 Figure 3: IMT spectrum dashboard ................................................................................. 14
Figure 4: L-band spectrum dashboard ........................................................................... 16 Figure 5: Network model structure .................................................................................. 19
Figure 6: Total additional consumer surplus due to cost savings and retail price cuts ....................................................................................................................................... 21
Figure 7: L-band current use ............................................................................................ 25 Figure 8: Total migration costs per country ................................................................... 26
Figure 9: Network efficiency (IMT systems) and design parameters ........................ 27
Figure 10: Key inputs and outputs .................................................................................. 28
Figure 11: Information sources for modeling ................................................................. 29
Figure 12: Data traffic consumption profile .................................................................... 30
Figure 13: Subscribers and 4G penetration forecast (2026) ....................................... 31
Figure 14: Coefficient and multipliers ............................................................................. 32 Figure 15: Cost savings to network operators ............................................................... 35
Figure 16: Value gap between consumer surplus and migration costs .................... 36
Figure 17: Additional subscribers obtained from cost savings translated into retails price cut ............................................................................................................................... 37
Figure 18: Cost savings plus additional consumer surplus over time ....................... 37 Figure 19: Indirect impact from L-band´s identification for IMT .................................. 38
Figure 20: Band plan options for L-band ........................................................................ 45
Figure 21: Services allocation in bands mostly used for IMT in Brazil ...................... 47 Figure 22: Services allocation in bands mostly used for IMT in Brazil (Cont.) ......... 48
Figure 23: Brazil´s mobile market evolution .................................................................. 49 Figure 24: Brazil mobile market structure ...................................................................... 49
Figure 25: L-band´s services allocation in Brazil .......................................................... 50 Figure 26: Services allocation in bands mostly used for IMT in Mexico ................... 52
Figure 27: Mobile market structure in Mexico ............................................................... 53 Figure 28: Assignation roadmap for IMT bands in Mexico .......................................... 54 Figure 29: L-band´s services allocation in Mexico ....................................................... 55
Figure 30: Actual use of L-band in Mexico .................................................................... 55 Figure 31: Plans for L-band in Mexico ............................................................................ 56
Figure 32: Services allocation in bands mostly used for IMT in Colombia ............... 57
Figure 33: Services allocation in bands mostly used for IMT in Colombia (Cont.) .. 57
Figure 34: IMT spectrum holdings in Colombia ............................................................ 58 Figure 35: Mobile market evolution of Colombia .......................................................... 59 Figure 36: Main operators of the Colombian mobile market ....................................... 60
Figure 37: L-band´s services allocation in Colombia ................................................... 61 Figure 38: Timetable for L-band’s licenses expiration dates in Colombia ................ 62
Figure 39: Compatibility L-band current services and IMT ......................................... 63 Figure 40: Services allocation in bands mostly used for IMT in Ecuador ................. 64
Figure 41: Services allocation in bands mostly used for IMT in Ecuador (Cont.) .... 65

4
Figure 42: Mobile market structure and spectrum holding in Ecuador ...................... 65 Figure 43: L-band´s services allocation in Ecuador ..................................................... 67
Figure 44: L-band current usage in Ecuador ................................................................. 67 Figure 45: Services allocation in bands mostly used for IMT in Uruguay ................. 69
Figure 46: IMT spectrum holdings in Uruguay .............................................................. 69 Figure 47: Mobile market evolution of Uruguay ............................................................ 70 Figure 48: L-band´s services allocation ......................................................................... 71
Figure 49: Frequency allocation in bands mostly used for IMT in Argentina ........... 73
Figure 50: IMT spectrum holdings in Argentina ............................................................ 74
Figure 51: Mobile market evolution and structure in Argentina .................................. 74 Figure 52: L-band´s services allocation in Argentina ................................................... 75
Figure 53: Bands identified for IMT in the Dominican Republic ................................. 77 Figure 54: Evolution and structure of the mobile market in the Dom. Republic....... 78
Figure 55: L-band´s services allocation in the Dominican Republic .......................... 79

5
EXECUTIVE SUMMARY
An important ITU-R Resolution approved at the 2012 World Radiocommunication Conference (WRC-
12) invited members to study additional spectrum requirements for IMT, and to identify potential
candidate frequency bands. Members were asked to take into account the protection of existing
services and the need for harmonization.
The GSMA considers the L-band (1350-1400MHz/1427-1518MHz) as a potential candidate for IMT,
and has commissioned specialist spectrum consulting firm BlueNote Management Consulting
(BNMC) to prepare this report. This report estimates the socio-economic impact in Latin America and
the Caribbean (LAC) of using the L-band to provide mobile broadband services.
The research first investigates the current usage of the band, then briefly reviews its technical
suitability, and goes on to provide quantitative modeling of the socio-economic impacts. A sample of
seven countries was selected for in-depth analysis, and the results for the whole region were then
extrapolated.
In line with other GSMA commissioned studies, the underlying methodology focuses on the impact
on consumers. The report finds that identifying the L-band for IMT would create cost savings for
telecommunications operators, who would enjoy lower capital and operational expenditures when
deploying access networks. Given competitive market conditions these savings should be passed on
to end users, keeping the sector returns relatively stable.
The study estimates the socio-economic impact of identifying the L-band for IMT services in each of
the seven sample countries by comparing two scenarios -- having the L-band available for IMT, and
not having it available. The difference between these scenarios represents the incremental value, or
cost saving, of having the L-band available for IMT. The first scenario includes the migration costs of
current users as a capital expenditure for clearing the band.
Having estimated the cost savings per country, the analysis assumed that competition between
operators would assure those cost savings would ultimately be translated into retail price cuts. The
model also assumes dynamic behavior of market demand, with additional 4G users being attracted
by the lower prices. The combination of both impacts, that is additional consumers plus cost savings,
represents the total consumer surplus.

6
As of 2017, the model estimates the combined consumer surplus at US$4.5 billion in the seven
sample countries and US$6.6 billion for the whole LAC region1. In terms of investment payback, the
consumer surplus accounts for almost 20 times the total migration costs. Having the L-band available
for IMT will not only benefit the telecommunications sector, but it will also generate knock-on effects
in other sectors. It will boost aggregate demand, improve economic productivity, and fuel the labor
market. As of 2026, the model estimates 41.7 million new 4G users in the LAC region, resulting in
US$19.8 billion of incremental GDP2 and generating more than 13.000 new jobs in the LAC economy.
The quantitative analysis concludes that identifying the L-band for IMT will create material benefits
for the telecommunications sector, individual governments and society as a whole. The evidence of
the funding being available to create those benefits can be seen in the large gap between the
substantial cost savings and the comparatively very small migration costs if the band were made
available (the figure below graphically illustrates the gap).
Figure 1: Value gap between consumer surplus and migration costs Million US$ at 2017, NPV, Cash flows discounted at social discount rate
1 Estimates based on a 10-years period and using social discount rates 2 Including direct and indirect impacts
0,9164,6
0,9 6,0 39,6 23,5 1,1
458,1
2.403,8
394,0
81,7 105,2
959,7
51,2
Argentina Brazil Colombia DominicanRepublic
Ecuador Mexico Uruguay
Migration cost (2017)
Consumer surplus (2017)
• The cost of migrating the current L-band users to another band is not significant when compared
to the consumer surplus generated
• The outcome of identifying the L-band for IMT is positive in each sample country
Consumer Surplus ~ 20x Migration Costs

7
I. Introduction The development of new radio-access technologies for telecommunications, coupled with the wide
adoption of mobile services by consumers, has boosted spectrum requirements worldwide. Latin
America and the Caribbean, in line with the rest of the world, needs to pave the way for a timely
allocation of new spectrum to ensure the speedy development of advanced mobile services in the
region.
The GSMA considers the low-UHF band (470-698MHz), L-band (1350-1400/1427-1518MHz), the
2.7-2.9GHz band and C-band (3.4-4.2GHz), as potential candidates for enlarging the current IMT
group to ensure sufficient spectrum is available for the projected traffic growth.
In this context, the GSMA has commissioned BlueNote Management Consulting (BNMC) to estimate
the socio-economic impact of identifying the L-band for mobile data services in Latin America and the
Caribbean (LAC). In order to do this it has first been necessary to understand the potential efficiencies
derived from using the L-band for mobile services versus alternative usages.
This report is structured as follows:
- the second chapter looks at the current situation, presenting the global spectrum demand
and supply and ITU, and other stakeholders, initiatives;
- the third chapter describes the main findings of the research in the LAC region;
- the fourth chapter presents the results of the quantitative modeling, together with the
conceptual background and key assumptions;
- the fifth and the sixth chapters comprise the appendix and the bibliography.

8
II. Background
II.a. Spectrum demand projections
A few years ago consumers used their mobile devices only for voice and text communications, but in
recent times the situation has dramatically changed. The introduction of smartphones, notebooks and
tablets, alongside the development of innovative mobile applications, has resulted in an exponential
growth of data demand. The strong demand for data is expected to continue to be a growing trend
for the foreseeable future.
In 2013 global mobile data traffic grew by 81% over 2012, whilst in Latin America the figure was
105%, according to statistics compiled by infrastructure vendor Cisco3. Although smartphones, tablets
and other mobile devices have different usage profiles, video streaming is the most important data-
consumption activity. Videos account for 50% of global mobile data traffic and are expected to
account for 66% by 2018.
Global data traffic is expected to grow at 61% annually from 2013 to 2018, which represents an overall
ten-fold growth, climbing to almost 16 exabytes per month by 2018 (see the chart below).
Figure 2: Global mobile data traffic forecast, 2013 - 2018
Source: Cisco VNI Mobile, 2014
3 Cisco, 2013
1,52,6
4,4
7
10,8
15,9
2013 2014 2015 2016 2017 2018
21% 26% 32% 39% 46% 54%
79% 74% 68% 61% 54% 46%
2013 2014 2015 2016 2017 2018
Smart devices Non-smart devices
Global mobile data traffic Devices
Exabytes per month %
• 2018 Global mobile data traffic will reach 15.9EB/month
• Global mobile data traffic CAGR (2013-2018): 61%
• Smart devices as key drivers for supporting mobile data growth

9
LTE network deployment is accelerating the growth of data consumption as 4G users typically
consume six times more4 data than 3G user s. As well as 4G network deployment, rapid growth in
smartphone sales is another key driver explaining the boost in mobile data traffic.
The Report ITU-R M.2290-0 provides a “future spectrum requirements estimate for terrestrial IMT,
with projections on the spectrum requirement per country by 2020’. The required spectrum is
estimated for both lower-user-density markets and higher-user-density markets, based both on data
consumption levels and market development. The table below shows the ITU’s spectrum estimates
for 2020.
Density Total spectrum
requirements for pre-IMT, IMT-2000
Total spectrum requirements for IMT-Advanced
Total spectrum requirements
Lower-user-density settings
440MHz 900MHz 1340MHz
Higher-user-density settings
540MHz 1420MHz 1960MHz
The GSMA commissioned Coleago Consulting to develop a model to estimate future IMT spectrum
requirements based on existing networks for the year 2020. Their results for five Latin American
countries are in the table below.
Country Low Usage High Usage
Argentina 1093MHz 1628MHz
Brazil 1129MHz 1676MHz
Chile 893MHz 1327MHz
Colombia 1057MHz 1578MHz
Mexico 977MHz 1545MHz
Based on mobile data consumption projections and international estimates of spectrum requirements,
an urgent need to identify additional spectrum for the provision of IMT is obvious. Any agenda for the
identification procedure should factor in the significant time lags resulting both from often-lengthy
assignation processes and network roll out.
4 CISCO VNI 2014

10
II.b. Initiatives and new frequency bands for IMT
II.b.i. ITU initiatives
Because of spectrum demand growth and the demonstrable positive contribution of mobile
broadband services to society and the economy, the ITU is planning ahead. At WRC-12, a resolution
was adopted (ITU Resolution 807) to define the agenda for WRC-15. Agenda item 1.1 raises the
issue of “additional spectrum allocations to the mobile service on a primary basis and identification of
additional frequency bands for International Mobile Telecommunications (IMT) and related regulatory
provisions, to facilitate the development of terrestrial mobile broadband applications, in accordance
with Resolution 233 (WRC-12)”5.
Resolution 233 (WRC-12) invites ITU-R members to study additional spectrum requirements and
potential candidate frequency bands, taking into account the protection of existing services and the
need for harmonization. It also stipulates that appropriate and timely availability of spectrum will be
critical to support mobile broadband system growth (i.e. IMT development).
In response to this invitation, spectrum administrations, international telecoms associations, service
providers and operators from around the world have submitted contributions to ITU groups WP 5D
and JTG 4-5-6-7. They have recommended candidate frequencies to be used for IMT deployment,
and prepared studies on the compatibility between IMT and services now operating in the proposed
bands.
As administrations may deploy IMT systems only in specific portions of the band, it is useful to look
at which frequency bands are already identified for IMT. These are listed in the following table.
Band (MHz) Footnotes of RR identifying the band for IMT
450-470 5.286AA
698-960 5.313A, 5.317A
1710-2015 5.384A, 5.388
2110-2200 5.388
2300-2400 5.384A
2500-2690 5.384A
3400-3600 5.430A, 5.432A, 5.432B, 5.433A
5 ITU, 2012

11
Frequency bands identified for IMT6
The bands which have been identified for possible future mobile broadband use by ITU-R members
in response to Agenda Item 1.1 fall into the ranges which are shown below, along with their main
attributes:
- lower bands for coverage: below 698MHz and above 450MHz
- central bands for capacity and coverage: above 960MHz and below 1710MHz
- upper bands for capacity: around 2200MHz and 2500MHz
- very high frequency bands for performance: above 3600MHz.
The coverage attributes of the sub-1GHz bands are crucial in developing countries, as they can
provide cost-efficient broadband services in rural and low-population-density areas. The capacity
offered by higher-frequency bands addresses the high-traffic demand of new services and densely-
populated urban areas. Finally, the performance attribute of very high frequency bands is ideal for
very-high-density hotspots and indoor areas where substantial bandwidth is needed to support high
throughput.
The L-band falls in the middle and is suitable both for coverage and capacity. However in Latin
America coverage is usually provided using sub-1GHz spectrum, because of its widespread
geographical areas with low population densities in small rural communities.
The L-band has been the subject of often-spirited debates in international forums with existing users
of the band or adjacent bands (most of them providers of passive services) demanding protection
from potentially-harmful interference. This is what necessitates specific studies on compatibility
between the IMT systems and the other systems in the band.
II.b.ii. Other initiatives and recommendations
In the context of the WP 5D and JTG meetings, some regional organizations, such as the European
Conference of Postal and Telecommunications Administrations (CEPT), member states, technology
providers and vendors, have sent contributions regarding L-band suitability for IMT services.
This section comprises a summary of the recommendation from CEPT European Communications
Committee (ECC) Report 188.
6 ITU, 2013 Recommendation ITU-R M.1036-4 about Radio Regulations (RR) edition 2008

12
In 2010, the CEPT instructed its ECC to review possible future uses of L-band to investigate the
possibility of refarming 40MHz of spectrum for new services which might provide more social and
economic benefits to Europe.
In accordance with the ITU’s Radio Regulations, much of the upper part of L-band from 1452-
1492MHz is allocated to fixed, mobile (except aeronautical mobile), broadcasting and broadcasting
satellite services. The CEPT decided to investigate the feasibility of a range of new services in the
band including terrestrial broadcasting, mobile broadband, mobile supplemental downlink, satellite
digital audio broadcasting, program making and special events (PMSE), broadband public protection
and disaster relief (PPDR), and broadband direct air to ground communication.
The criteria for evaluating each service were7:
- Compatibility with the current regulatory framework
- Possibility of sharing the band with other applications/uses
- Maximisation of social and economic benefits
- Roadmap of equipment (on a large scale) and of applications deployment
- Potential economies of scale
Having completed its analysis, the ECC proposed the sub-band 1452-1492MHz be set aside for
Mobile/Fixed Communications Network (MFCN) supplemental downlink (SDL). The ECC report
defines the technical conditions for band harmonization based on 8 blocks of 5MHz each, and
proposes the elimination of designated sub-band 1479.5-1492MHz for Satellite Digital Audio
Broadcasting8.
In February 2013, Qualcomm, Ericsson and Orange successfully completed the world’s first live
demonstration of SDL in L-Band9 in 1484-1492MHz in combination with the 2.1GHz band. Following
the ECC report, 3GPP included the SDL feature in LTE and HSPA+ specifications. L-Band for SDL
in E-UTRA and UTRA was included in 3GPP Release 12 and the specification was completed in June
201410.
Although L-Band is widely associated with the 1GHz to 2GHz spectrum range, which is known
worldwide as the lower band for satellite services11, only a portion of this frequency range is actually
used for this type of service. In fact, the L-Band has a variety of other current uses including telemetry,
7 CEPT, 2013 8 idem 9 ERICSSON, 2013 10 3GPP, 2014 11 Marine Satellite Systems, 2010

13
radar, digital audio broadcasting (terrestrial and satellite), fixed links (point to point and point to
multipoint) and radioastronomy.
In Region 2 the 1452-1518MHz part of L-band is already allocated to mobile services. In Region 3
there are LTE commercial networks operating in part of the L-Band in line with 3GPP specifications12,
including the two Japanese operators NTT DOCOMO and Softbank.
12 Band 11 and Band 21 in 3GPP Specifications

14
III. Services currently provided in the LAC region using L-band To evaluate a new identification of the L-band, it is necessary to consider and thoroughly understand
the current usage of L-band in the LAC region. This includes current-user profiles, the feasibility of
migrating them to other bands, other IMT allocations and the public agenda, if any, regarding the L-
band.
BlueNote distributed information requests and held interviews with the local spectrum administrations
in the seven LAC countries being sampled for this survey in order to depict current usage and public
plans. Following this in-depth country-by-country analysis, results for the entire LAC region were then
extrapolated. The survey was split into two areas of investigation, the first of which was to understand
current IMT availability and the short-term roadmap for new assignments and the second was to
develop an understanding of current uses of the L-band.
The following table summarizes the results of the first part of the investigation which was
understanding the current availability and roadmap for IMT assignments in the sample countries.
Figure 3: IMT spectrum dashboard 2014
Note: Figures from Dominican Republic exclude AWS extension (1755-1770MHz and 2155-2170MHz) Current assignments estimated on national basis Sources: Local administration survey and web research
Total current
identification
for IMT (MHz)
IMT bands already assigned
Current
assignations
(MHz)
# BTS Assignation roadmap
660
450MHz
850MHz / 900MHz
1800MHz / 1900MHz
2100MHz 2500MHz
529 ~ 50,000• 700MHz band (80MHz, auction to take
place in 4Q 2014)
600850MHz / 1900MHz
AWS230 ~31,000
• 700MHz band (90MHz by end 2014)
• AWS band (30MHz by end 2015)
• 2.5GHz band (60MHz by end 2015)
590850MHz / 1900MHz
AWS / 2,5GHz415 ~ 20,000
• 900MHz (20MHz) and 1.9GHz (5MHz)
both in early 2015
• 700 MHz (total or a portion of the band)
• 2.5GHz (30MHz)
570850MHz / 1900MHz
AWS / 700MHz180 ~ 9,000
Late 2014 or early 2015:
• 700MHz (portion) and AWS (50MHz)
• 2.5GHz (190MHz)
• 1900MHz (60MHz)
310
850MHz / 1900MHz
1800MHz / 2100MHz
AWS / 900MHz
270 ~2,000 • 700MHz (90MHz by 2016)
380 850MHz / 1900MHz 136 ~ 16,000
• 700MHz and AWS (auction has already
been announced for 4Q 2014)
• 1900MHz (remaining 20MHz, by 2014)
710850MHz / 900MHz / 1900MHz
AWS / 2,5GHz450 N / A No defined agenda
Ecuador
Colombia
Uruguay
Mexico
Brazil
Argentina
Dom. Rep.

15
As can be seen above, Brazil is the country that has assigned the most spectrum for the provision of
IMT. The bands already assigned are 450MHz, 850MHz, 900MHz, 1800MHz, 1900MHz, 2.1GHz and
2.5GHz with the digital dividend 700MHz band scheduled for auction later in the year.
The variations in 4G spectrum assignments is a distinctive aspect of the Latin American market,
although Argentina is the only country yet to assign any spectrum for 4G13. All the other countries
have already assigned spectrum in the AWS band. Colombia, Brazil the Dominican Republic and
Ecuador have also assigned the 2.5GHz while the latter has also already assigned the digital dividend
band.
As for the assignation roadmap, most countries have short-term plans for assigning additional IMT
spectrum14. However, although these new assignments will improve the region’s IMT spectrum
availability, it will not yet match the ITU’s spectrum requirements mentioned in the ITU-R Report
M.229015.
Our specific research on the L-band has been structured into three main categories: the current usage
profile, the feasibility of migrating current users to another band (including both the operational and
the legal feasibility) and the administration position and plans regarding the band.
As can be seen in the table below, the most common use for L-band spectrum is point-to-point fixed
links. Although Brazil and Ecuador have significant numbers of users, there are few users in the other
countries sampled. The links belong to different industries (although telecommunications is the most
prevalent) and are widely-spread geographically with a significant number of users in rural areas. In
Brazil, where most available licenses have been assigned, the current users – aside from
telecommunications companies -- include private companies in a variety of other industries, such as
utilities and energy.
13 Though it was announced an spectrum auction for late October 2014 14 Some countries have already formally announced their 4G spectrum assignation process (e.g., Brazil, Argentina) whilst in other countries the formal announcement is still pending (e.g., Colombia, Ecuador). 15 According to this report, by 2020, there should be a total of 1,340MHz and 1,960MHz identified to IMT in low-density and high-density markets, respectively.

16
Figure 4: L-band spectrum dashboard 2014
Sources: Local administration survey and web research
Incumbent users of the L-band will probably be reluctant to move to other bands unless they are
compensated as they have already invested in frequency-specific equipment. Faced with this
opposition, administrations could either wait for the expiration of current licenses, and then migrate
the users, or enforce migration prior to the license expiry dates, although this is only possibly in a
handful of regulatory contexts. Some administrations might also decide to force the migration of the
current users based on spectrum efficiency fundamentals – in Uruguay, Argentina and Ecuador
licenses assure spectrum availability to their holders, but they do not assure a specific frequency.
None of these adversarial measures is likely however as the impact analysis shows the cost saving
of using the L-band for IMT amounts to almost 20 times the migration costs of users in the entire LAC
region. This means migration costs could be easily be absorbed by the reallocation beneficiaries.
There would be no significant trade-off between current users and new IMT users, since both would
have the spectrum they need without incurring in a net loss.
As for feasibility of migration out of the band, no major drawbacks have been identified aside from
operational issues in the two countries with a large numbers of current users. And in some cases,
Latin America: L Band dashboardCurrent use / usersMigration operational
feasibility
Migration enforcement
feasibilityL-band Links
Governments position
regarding L-band
• Point-to-point and point-to-
multipoint links
• Large number of licences and
users (telcos, oil&gas, utilities)
• Relatively complex,
due to the high
number of users
• Existing licenses last for
10 years (no automatic
renewal)
~ 2,800
• To be proposed for
IMT, in combination
with other bands
• Fixed service microwave point-
to-point systems
• Mainly private companies, few
state entities
• Relatively simple,
as the number of
users is limited
• Assignments last for 15
years
• Not possible to migrate
users from a portion of
the band
~367
(1427 to
1525 MHz)
• Potentially in agenda
• Main use: point-to-point
networks (telecommunication
support)
• Few number of users
• A priori, current
users would agree
to migrate to other
bands
• Simple, almost 100% of
the licenses will expire by
2020
~26 point-to-
point
~67 point-to-
multipoint
(DECT)
• To be proposed for
IMT, in combination
with other bands
• Radio links of fixed services
• Mainly wholesale carriers
• Relatively complex,
due to the high
number of users
• Assignments last for 5
years, thereafter they
should be renewed
~ 650 • Potentially in agenda
• Low level of use (no more than
10 users)
• Users are private and
government entities
• Simple, due to the
reduced number of
users
• Most users have
obsolete equipment
• No expiration date
• Awarded on a revocable
basis, having the
government the capacity
to modify these licenses
~ 10 • To be defined
• Point-to-point links
• Digital multichannel systems
(MXD) are authorized to
operate
• N/A
• Rule: no expiration date
• However, 10 years period
for telecommunications
support spectrum
N /A • To be defined
• Aeronautic radionavigation and
point-to-point links
• 12 users: public services,
religious organizations and
government offices
• No near plans to change the allocation of this
band nor to migrate its users
~ 100
(12 users)
• No near plans as for
this band
Ecuador
Colombia
Uruguay
Mexico
Brazil
Argentina
Dominican
Republic

17
Uruguay being an example, most of the equipment is already obsolete (and current users might have
already updated their plans).
Regarding the public agenda and plans for the identification of L-band for IMT services, most
countries are in favour. Brazil, Colombia, Mexico and Ecuador will presumably support such
identification, whilst Argentina and Uruguay have not yet adopted a definitive position and the topic
is still under analysis. The Dominican Republic is the only country not assessing the possibility so far.
Having completed the research in the seven sample countries the reports concludes there is no
material barrier to identifying L-band for IMT. Indeed most of the countries are positive towards the
relevant ITU-R reports and recommendations, are already assessing this initiative and are bullish
about the possibility of having the L-band available in the not-too-distant future.

18
IV. Impact assessment of identifying the L-band for IMT
This section comprises the estimation methodology of the economic impact of having the L-band
available for mobile services, the key assumptions for modelling this impact and the final results and
findings.
IV.a. Conceptual background and methodology
Having the L-band available for mobile services results in benefits for mobiles operators, for the
market and, ultimately, for consumers. If the band is made available, however, then incumbent users
must migrate to other frequencies, and so incur migration costs. The cornerstone of the underlying
approach is to compare the total benefits of reallocation against its cost, which is basically the
migration cost. Our calculation of total benefits involves both the cost savings for mobile operators
and the consumer surplus increment for end users.
The study first estimates the socio-economic impact of identifying the L-band for IMT in each of the
seven sample countries. The model compares two scenarios for each market, a first scenario where
the L-band is made available for wireless broadband, and a second scenario where it is not. The
difference between these scenarios is the incremental value, or cost saving, of identifying the L-band
for IMT. The first scenario includes the migration costs of current users as a capital expenditure for
clearing the band.
Having estimated the cost savings per country, the analysis assumed competition between operators
would assure the savings would ultimately be translated into retail price cuts. The model also
assumes dynamic behavior of market demand, with additional 4G users being attracted by the lower
prices. The combination of both impacts, that is additional consumers plus cost savings, represents
the total consumer surplus.
In the following paragraphs it is explained the methodology used to estimate firstly the cost savings,
secondly, the consumer surplus, and thirdly, the indirect impacts.
Cost saving estimates
As has already been noted, the demand for mobile services is increasing rapidly and, to meet this
growth, mobile operators need to expand their access network capabilities. Mobile operators can do

19
this either by the deploying additional infrastructure in the form of new base station or by utilizing
more spectrum. Many will need to do both.
The availability of new IMT bands allows mobile operators to reduce their total capital and operational
expenditures on radio stations or sites. This is because spectrum and radio access infrastructure are,
to some extent, substitutes16 for each other in the delivery of mobile services.
The model calculates the cost savings for mobile operators who have more spectrum by looking at
the difference in impact on their total capital and operating expenditures between a scenario having
the L-band available versus a scenario of not having it.
For these estimates a network model based was developed, based on the following structure:
Figure 5: Network model structure
Total LTE data traffic demand is one of the key inputs for the model. Once the total traffic projections
were developed, the total traffic per site was estimated. The per-site traffic depends on spectrum
efficiency (the more efficient, the more traffic per site) and the spectrum availability (the more
spectrum is available, the more traffic per site). The assumptions and considerations taken into
account when calculating total traffic per site are described below, in the key assumptions section.
The total traffic per site estimate enables a calculation of the number of sites an operator requires to
satisfy the traffic demand with a given amount of spectrum.
16 However, this substitution is far from perfect, due to several barriers: timing for setting up new sites, legal authorization constraints for urban sites and specific services demanding high traffic capacity (i.e., streaming).
Data traffic
per
subscriber
# subscribers
for data
services
Total
data
traffic
demand
# Traffic
per site
(capacity)
# Sites
Capex +
opex per
site
Total Costs
of Network
vs.
With L-band
• LTE
spectrum
efficiency
• total
spectrum
availability
x /
# Sites
Without L-band • site capex
• backaul
capex
• capex per
siteTotal Costs
of Network
Cost savings
of L-band
-

20
For a mobile operator, the benefits of having more spectrum are associated with an increase in
capacity and in coverage. However, these benefits depend on the specific frequency: the benefits
from low-frequency, sub-1GHz bands include both coverage and a certain amount of capacity, but
the benefits of high frequency bands are more associated with capacity due to their limited
propagation characteristics.
This is certainly the case in Latin America, where coverage is usually provided by sub-1GHz
spectrum, providing wireless broadband to low-density communities spread across large areas. So
for LAC a conservative scenario was assumed where the L-Band would be used to boost network
capacity. Qualcomm has proposed the L-Band be employed to increase downlink capacity through
supplemental downlink (SDL).
The total number of sites required depends on the amount of spectrum available for use, so having
more spectrum made available through reallocation of the L-band to mobile services will result in a
lower number of sites being needed until traffic has built up again.
The gap in the number of sites needed between having use of the L-band and not having use of it
points to the difference in total network costs, and, ultimately, the cost savings of having the L-band.
Consumer surplus
In a competitive market environment, the cost savings of having the L-band available for mobile
services should result in benefits for consumers. The underlying assumption here is that, when
competition is a factor, mobile operators do not enjoy extraordinary profits and are forced to pass on
the benefits of lower expenditures to their customers in the form of price cuts so as not to lose market
share.
In line with previous GSMA studies17, the consumer surplus concept was used for the impact
assessment methodology. Economic literature defines consumer surplus18 as the difference between
what a consumer is ready to pay for a service (“willingness to pay”) and what he actually pays for it
(the clear market price). The figure below describes this concept.
17 GSMA (2013) et al. 18 Varian Hal R. (1992)

21
Figure 6: Total additional consumer surplus due to cost savings and retail price cuts
As shown in the illustration above, the price a specific consumer is willing to pay (represented by the
dotted portion of the demand curve in the figure) exceeds the clearing market price (“E”). The amount
of this difference is consumer surplus.
Each consumer will enjoy different levels of consumer surplus. In the above illustration, the most
voracious consumer enjoys the highest consumer surplus, whilst the marginal consumer enjoys a
consumer surplus equal to zero. To obtain the total consumer surplus of the whole market, all
consumer surplus of each consumer is aggregated (the grey shadowed triangle).
The cost savings derived from having more spectrum available will reduce the cost to operators, and,
under competitive conditions, these reductions might be expected to be passed on to consumers via
price reductions. Assuming that once the L-band is allocated to IMT services, the operators are able
to cut prices, and so market prices fall from E to E´ (as in the figure above). The total consumer
surplus will be higher than the consumer surplus prior to the price cut. The additional consumer
surplus comprises two components: the net increase in the consumer surplus of each existing client
(the green rectangle in the figure above) plus the consumer surplus of new subscribers (the red
triangle in the figure above).
Quantity of
subscribers
Consumer surplus
before price cutPrice of
service
DemandAdditional consumer
surplus derived from
existent consumers
Cost savings per unitCu
Cu
Extra subs.
Additional consumer surplus
derived from new consumers
+ = Total additional consumer surplus
: Current market price
Eq
Eq
: New market priceEq Eq

22
To estimate the additional demand, which comes after cost savings are translated into price cuts,
consideration is given to demand price elasticity (see next section for this assumption) to estimate
how many additional consumers will enter the market as the prices drop. To calculate the final retail
price cuts assumption are made that the same value of cost savings to the operator is translated into
price reductions for the consumer.
Finally an assumption is made of a flat supply curve at the margin, or constant productivity at the
margin. That means that operators would have to pay the same cost per additional subscriber as they
had to pay for their existing subscribers. This may be viewed as a valid simplification as the total
number of new subscribers represents a limited portion of the total subscribers (roughly 2%).
To arrive at the net socio-economic impact of allocating the L-band for IMT, the net impact to the end
user is compared with the migration costs to other frequencies of the current users. In the next section
are the detailed assumptions used to arrive at the migration costs estimates.
Indirect impacts
Having the L-band available for IMT services will not only benefit the telecommunications sector and
the overall economy, but it will also generate indirect impacts on other sectors to boost economic
efficiency, the GDP and new employment opportunities in the labour market. The additional spectrum
from L-band availability means more mobile broadband subscriptions which will have knock-on effects
on domestic demand, on spending in other sectors and on the economic productivity in general.
The indirect impacts of reallocating the L-band into can be sub-divided into three categories:
- GDP impact
- Job creation impact
- Fiscal impact
The allocation of the L-band for mobile services creates economic value as it implies a better use of
scarce resources, originating cost savings for the telecoms sector hence boosting the domestic
economy and the total GDP.
GDP would also experience additional impacts from this reallocation because higher broadband
penetration rates improve the efficiency of the economy. There are several ITU studies19 which
19 ITU 2012

23
demonstrate the positive impact broadband penetration has on productivity, economic efficiency and,
ultimately, on GDP.
Identification of the L-band for IMT is expected to have a positive impact on each country’s job
creation capacity. Job creation happens when broadband network construction affects employment
by creating direct jobs in facility construction as well as jobs in telecom equipment industries. The
increase in household spending related to increased broadband activity also creates employment in
the wider economy.
It should be noted no specific analysis of the impact on GDP and job creation as a result of
identification of the L-band for IMT has been conducted. Instead reliance is made on the findings of
existing studies20 to set the parameters and make estimates.
Fiscal impact measures the additional taxes Governments are expected to be able to collect as a
consequence of making the L-band available for wireless broadband. The identification of the L-band
for IMT will, as previously noted, result in a price reduction which, considering the price elasticity, will
end up in a higher number of subscribers and, consequently, in higher tax collections.
Scaling the results up for the region
Although the scope of the study is the whole LAC region, in-depth analysis has only been conducted
within the stated seven countries. The results of the country-by-country analysis are used to scale up
to provide a regional viewpoint and present representatives findings for the entire region.
To extrapolate the results from the data gathered in the sample countries, a multiple-variable
regression analysis was used, including the explanatory variables shown in the next table.
Explanatory variable
Fundamental
4G subscribers
The spectrum value and the impact of having more spectrum are positively linked to the traffic market demand (the more the merrier), and the 4G subscribers are the ones with a higher data consumption profile
Markets size, in terms of total population
20 ITU 2012 and Telecom Advisory Services 2011

24
Estimates of consumers surplus and additional impacts included in this study depend on the market size, measured in terms of the country population
ARPU
The Average Revenue per User has a direct impact on the consumer surplus estimation based on the additional subscribers
These three explanatory variables were tested to estimate the socio-economic impacts for the entire
LAC region. The impacts to estimate are:
- cost savings
- additional subscribers
- efficiency impact and GDP growth
- job creation
- fiscal impact
Assessment of different combinations of explanatory variables by evaluating their level of significance
and explanatory power enabled elimination of the ARPU variable due to its lack of statistical
significance. The final version of the scale-up model consists of a multivariable regression based on
the total population and 4G subscribers variables21.
IV.b. Assumptions used in modeling
In this section the key assumptions underlying the modelling exercise as well as the relevant
parameters for the impact assessment are presented.
The modelling key assumptions can be structured into three categories: migration costs, technology
and financial and market variables.
IV.b.i. Other services operating in the band and migration costs
As previously noted, in Latin America the L-band is mostly used for fixed services (point-to-point and
point-to-multipoint), with Brazil having the largest number of licenses in the band (6,000 licenses and
close to 2800 radio links).
21 The ARPU variable shows statistical significance for the GDP estimation only.

25
There are a negligible number of radars operating in the sub-band 1350-1400MHz and
administrations in the sample countries do not have information about radars operating in this band
on record. Current radar users of the band have not been taken into account. Also ignored are
migration costs associated with radiolocation services because they are capable of operating below
the band floor of 1350MHz. The next figure shows the current use of L-Band by service allocated in
the sample countries.
Figure 7: L-band current use
Sources: Local administration survey
In the seven countries sampled there are 3,953 radio links and they operate in the sub-band at 1427-
1518MHz. Many of the existing licenses expire by 2017 and the services could be migrated to other
frequency bands. For those countries with limited or non-existent information on the expiration dates,
for modelling purposes a 30% of the radio links was assumed to turn off by 201722.
It is technically feasible to migrate current users to other frequency bands allocated for fixed services,
such as:
- Lower bands below 6GHz: namely 2GHz, 4GHz, 5GHz and 6GHz.
22 30% of radio links could be turned off by 2017 either because the license expires or because it is possible to remove.
Radiolocation
(1350-1400MHz)
Fixed Services
(1427 – 1518MHz)
Broadcasting
(Satellite and Terrestrial)Migration Feasibility
No Reports~6000 licenses
~2800 linksN.a. OK
No Reports367 links N.a. OK
No Reports26 links point-to-point
67 licenses point-to-
multipoint
N.a. OK
No Reports650 links
1 License
(200 subscriber)OK
No Reports10 links
N.a.OK
No ReportsN.a.
N.a.OK
No Reports100 links
N.a.OK
Ecuador
Colombia
Uruguay
Mexico
Brazil
Argentina
Dominican
Republic

26
- Higher bands above 6GHz: namely 7GHz, 11GHz, 15GHz, and 18GHz.
For modelling purposes, an assumption of 95% can be migrated to lower bands, while the remaining
links would have to be migrated to higher bands. For the latter, new repeater stations are required to
guarantee the quality of operation within the same distance between transmitter and receptor.
The model includes three main items for cost estimation:
- engineering services (including survey, zoning, new equipment installation or retuning of
current equipment) estimated for each country23.
- radio link equipment: US$64,000 per link (New equipment for transmission and reception
stations)24
- infrastructure for a new repeater station: US$200,000 per site25
On this basis, and considering the current price level of equipment and services in the market, the
next figure shows an estimate of the total migration cost per country.
Figure 8: Total migration costs per country 2017, US$ million, point-to-point radio links
Source: FCC (2010), U.S. Bureau of Labor Statistics, World Bank, IMF, radio link vendors benchmarking, ANATEL spectrum database, ANE Colombia, IFT, INDOTEL, SENATEL, CNC, BNMC estimates
IV.b.ii. Network design parameters
The core benefit of 4G technologies is the improvement in spectral efficiency, meaning more capacity
in the same bandwidth. Spectral efficiency parameters are determinant for network design and sizing,
23 FCC, “A Broadband Network Cost Model”, and BNMC analysis (benchmarking of engineering companies). The cost was adjusted to each country using PPP (Purchasing Power Parity). 24 FCC “A Broadband Network Cost Model” and BNMC estimates. 25 Benchmarking COFETEL, OfCom, ACMA, OPTA and BNMC analysis.
164,6
39,6
23,56,0 1,1 0,9 0,9
236,6
Brazil Ecuador Mexico DominicanRepublic
Uruguay Colombia Argentina Total
Mil
lare
s

27
as they allow an accurate estimate of the number of base stations required to support a given traffic
demand.
In addition to spectral efficiency, there are other design parameters which have a dramatic impact on
the number of base stations required. These include the traffic distribution factor, network load factor
for an appropriate performance, traffic concentration in peak hours, number of cells per site and the
traffic distribution between uplink (UL) and downlink (DL).
The next figure shows the spectral efficiency underlying the modelling exercise, in line with the 3GPP
TR 25.912 document and the assumptions mentioned above.
Figure 9: Network efficiency (IMT systems) and design parameters bps/Hz/cell
Source: 3GPP TR 25.912 / ITU-T M.2135 / NSN - "Mobile broadband with HSPA and LTE: Capacity and Cost aspects
A band plan of 2x35MHz is assumed (Option A, as described in the Annex), due to its higher
probability of equipment availability, as it is already commercially launched.
Finally, below is the formula to estimate the number of base stations (BTS) required to support the
traffic forecast and the design parameters mentioned above.
#𝐵𝑇𝑆 = 𝑇𝑜𝑡𝑎𝑙 𝐷𝐿 𝐷𝑎𝑡𝑎 𝑇𝑟𝑎𝑓𝑓𝑖𝑐 𝑖𝑛 𝐵𝑢𝑠𝑦 𝐻𝑜𝑢𝑟 (𝑀𝑏𝑝𝑠)
𝑆𝑝𝑒𝑐𝑡𝑟𝑎𝑙 𝐸𝑓𝑓𝑖𝑐.𝑖𝑛 𝐷𝐿 (
𝑏𝑝𝑠𝐻𝑧
𝑆𝑒𝑐𝑡𝑜𝑟)∗𝑆𝑝𝑒𝑐𝑡𝑟𝑢𝑚 𝑏𝑎𝑛𝑑𝑤𝑖𝑑𝑡ℎ 𝑖𝑛 𝐷𝐿(𝐻𝑧)∗
𝑐𝑒𝑙𝑙𝑠
𝑠𝑖𝑡𝑒∗𝐿𝑜𝑎𝑑 𝐹𝑎𝑐𝑡𝑜𝑟∗𝐷𝑖𝑠𝑡𝑟𝑖𝑏𝑢𝑡𝑖𝑜𝑛 𝐹𝑎𝑐𝑡𝑜𝑟
Additional Parameters
• Distribution Factor: 15% of sites carry 50% of traffic (15%/50% = 0.3)
• Load Factor: It’s inconvenient to operate a LTE network with 100% of load (SINR decreases in a high load
scenario), the design recommendation is to consider a factor of 50% - 70% in DL and 50% in UL.
• Relation UL/DL: 70% of total traffic is flowing in DL
• Cells per site: 3 cells per site is a common factor in mobile networks in Latam
• Traffic in BH/Daily traffic: 7%
Downlink Uplink
0,33
0,74
1,4
0,5
1,7
2,2
UMTS/HSPA LTE (Rel 8) LTE Adv

28
Where the total DL Data Traffic is calculated using the next formula
𝑇𝑜𝑡𝑎𝑙 𝐷𝐿 𝐷𝑎𝑡𝑎 𝑇𝑟𝑎𝑓𝑓𝑖𝑐 𝐵𝐻 = 𝑈𝑠𝑒𝑟𝑠 ∗ 𝑃𝑟𝑜𝑓𝑖𝑙𝑒 𝑈𝑠𝑒𝑟𝑠 (
𝐺𝐵𝑀𝑜𝑛𝑡ℎ
) ∗ 7%(𝐵𝑢𝑠𝑦 𝐻𝑜𝑢𝑟) ∗ 70%(𝐷𝑙 𝑇𝑟𝑎𝑓𝑓𝑖𝑐)
30 (𝑑𝑎𝑦𝑠
𝑚𝑜𝑛𝑡ℎ) ∗ 3600𝑆𝑒𝑐 ∗ 8192(
𝑀𝑏𝑖𝑡𝑠𝐺𝐵
)
IV.b.iii. Capex, opex and market parameters
A bottom-up model was developed based on cash-flow projections for a 10-year period (from 2017
until 2026) to estimate the impact of reallocating the L-band to IMT services. The model outcome is
fully dependent on the methodology previously detailed and on the assumptions and inputs adopted.
The key inputs for the model are those related to the BTS sizing (e.g., subscribers, traffic), the
technical inputs, the operational and capital expenditure amounts and the macroeconomic
projections. The following chart lists the key inputs feeding the model:
Figure 10: Key inputs and outputs
The model has six main outcomes: cost saving and consumer surplus, additional subscriber impacts,
fiscal impact, GDP indirect impact and job creation impact.
The following figure summarizes the main information sources that have been considered for the
inputs in the model build-up.
Inputs Outputs
• Subscriptions
• 4G penetration
• Subscriber data
consumption profile
• ARPU / CAPEX / OPEX
• Discount rate
• Elasticity
• BTS dimensioning
technical parameters
• ...
• Cost Saving
• Consumer surplus
• Additional subscribers
• Fiscal Impact
• GDP Impact
• Job creation impact
Economic
model

29
Figure 11: Information sources for modeling
The key BTS sizing drivers included in the model are:
- Data traffic subscriber profile: two different data traffic consumption profiles have been
addressed; smartphones and mobile PCs / routers / tablets (M/R/T). A typical subscriber
profile was assumed (expressed in terms of MB/month/subscriber) for the seven sample
countries. An Ericsson report26 was the main information source for traffic projections. Based
on Latin America’s subscriptions and data traffic total projections, and a 4G to 3G
consumption ratio of x6.327 (a 4G subscriber uses 6.3 times the data as a 3G one), the
average traffic generated by smartphones and M / R / T users is calculated. As the Ericsson
forecast goes only to 2019, projections from 2020 to 2026 were forecast using 2019 as the
baseline year and growth was predicted using the CAGR (compound annual growth rate) of
previous years for each country.
- Subscribers: Based on the GSMA Intelligence forecast to 2021. For the period going from
2021 to 2026, the growth rate was estimated based on the subscriber CAGR from previous
years and using an adoption curve that mimics the 3G adoption rate (+50% in 10 years).
26 Ericsson 2014 27 Based on 2018 data consumption per technology obtained from CISCO VNI 2014
Module Variables Sources
BTS sizing
Opex
Capex
• Subscriptions
• Traffic
• 4G penetration
• Technical specifications
• BTS cost
• BTS cost annual price erosion
• Migration cost per country
• Urban and non-urban BTS cost
• Urban and non-urban
infrastructure
• BTS sharing
• OVUM
• 3GPP
• Informa
• GSMA Intelligence
• Ericsson traffic
exploration
• Cisco VNI
• Benchmarking COFETEL,
OFCOM, ACMA, OPTA
• Ministerio de las tecnologías y
la información
• FCC
• Deloitte
• Informa
• Ministerio de las
tecnologías y la
información
Macroeconomic
• Inflation and PPP
• Exchange rate
• GDP
• Social discount rate
• Taxes
• Price-demand elasticity
• Multipliers
• World Bank
• IMF
• U.S. Bureau of Labour
Statistics
• United Nations
• Telecom Advisory
Services
• KPMG
• Deloitte
• Bank of
America
• Merrill Lynch
• CRC
• ITU

30
- Technical BTS sizing: such as efficiency, sectors, load factor, distribution factor, % downlink
and % peak hour (as described in the technology section).
The next figure shows the traffic forecast per subscriber and the different behaviour and consumption
patterns for smartphone users and M/R/T users,
Figure 12: Data traffic consumption profile MB/sub/month
In 2026, data traffic per user reaches the 7,000 MB/subscriber/month level for smartphone users and
32,000 MB/subscriber/month for M/R/T users. Both because they are at a different stage of
development to smartphones and the broader functionality they provide, there is still room for a lot of
growth in data per user for M/R/Ts. This can be seen in the 2017-2026 expected CAGR (10.5% for
M/R/T as opposed to 4.1% for smartphones).
The number of subscribers is the second key assumption to estimate the required number of BTS to
support expected traffic growth. The following chart shows the expected number of subscribers and
4G penetrations.
Smartphone Mobile PC / Router / Tablet
4.9097.050
0
5.000
10.000
15.000
20.000
25.000
30.000
35.000
4.1%
CAGR (2017-2026)x%
13.234
32.458
0
5.000
10.000
15.000
20.000
25.000
30.000
35.000 10.5%
• Data traffic reaches 7,000 MB/sub/month for smartphones in 2026 and 32,000 MB/sub/month for mobile pc,
router, tablet in 2026
• Mobile PC / Router / Tablet still shows bigger place for additional growth per user, which can be seen in the
2017-2026 expected growth CAGR
• Mobile PC / Router / Tablet have a higher per user data consumption, expected to reach a x4.6 ratio by 2026

31
Figure 13: Subscribers and 4G penetration forecast (2026) Thousand subscribers, 4G penetration vs. total subscribers
Source: GSMA Intelligence, Ericsson - Traffic exploration (Latam) - June 2014, BNMC estimate
The chart above shows subscriber projections for the last year of the period of analysis (2026). Taking
into account the current mobile services penetration rate, based on an Ericsson estimate, the number
of subscribers is expected to grow in the selected countries by a 2.2% annual rate. But 4G technology
is undergoing its start-up stage in the region, so 4G penetration rates are still low. 4G projections are
based on the GSMA Intelligence forecast to 2020, with the 3G historic adoption curve for later years.
By 2026 the 4G penetration rates are expected to be in the range of 64% to 85%.
Estimated Capex requirements are based on the following components:
- Initial Capex: US$90,000 for a 4G BTS, which includes: radio access, backhaul, core
network, backbone and installation costs. This amount has been estimated drawing on
models from Colombia’s MinTic, COFETEL, Ofcom, ACMA, Opta and the FCC.
- BTS Capex annual erosion. A 4.0% annual erosion cost to take into account the falling cost
of equipment has been factored into deployment of new BTSs in the future. The 4.0% erosion
figure is obtained from COFETEL, Ofcom, ACMA and Opta benchmarking models.
- Migration cost: the cost of migrating current L-band users was estimated for each of the seven
selected countries. The estimated amounts take into consideration the different cost
components required for the migration of these users namely backhaul, e-utran,
infrastructure, core network and spare parts.
84.807
360.797
69.335
13.55024.957
145.637
6.160
Argentina Brazil Colombia DominicanRepublic
Ecuador Mexico Uruguay
72% 85% 74% 64% 72% 78% 75%4G
penetration
• As mobile markets
are already
mature, it is
estimated a total
subscribers CAGR
of 2.2% for the
sample countries
• 4G penetration
rates are estimated
based on GSMA
Intelligence
forecast to 2020,
and then
replicating 3G’s
adoption curve on
its first years

32
As operational expenditures have a significant portion of non-tradable elements, the required Opex
on a per-country basis, adjusted by PPP28 is estimated. The Opex is estimated for urban and non-
urban BTSs, and the infrastructure operational costs can be shared with other existing BTSs in the
urban areas is assumed.
The following figure shows other key parameters that have been also considered in creating the
estimates, their use in the model and their source.
Figure 14: Coefficient and multipliers
Note that the GDP and jobs creation multipliers from previous estimates are based on the impact of
new users of mobile broadband, however an assumption that new 4G subscribers will originate similar
impacts was made29.
Elasticity measures how sensitive a variable is to changes in related variables. In this case, demand
price elasticity estimates the number of additional 4G subscribers entering the market once prices
are cut. Elasticity is calculated using the following formula:
𝑃𝑟𝑖𝑐𝑒 𝑣𝑠. 𝑑𝑒𝑚𝑎𝑛𝑑 𝑒𝑙𝑎𝑠𝑡𝑖𝑐𝑖𝑡𝑦 =
∆ 𝑠𝑢𝑏𝑠𝑐𝑟𝑖𝑏𝑒𝑟𝑠𝑠𝑢𝑏𝑠𝑐𝑟𝑖𝑏𝑒𝑟𝑠
∆ 𝑝𝑟𝑖𝑐𝑒𝑝𝑟𝑖𝑐𝑒
28 Purchasing Power Parity 29 Though they are not the same, this assumption was made since the traffic demand of a 4G subscriber is 6.3x the traffic demand of a 3G user, and hence having a new 4G subscriber is more close to having a new subscriber than upgrading the traffic capacity of a 3G subscriber only.
Coefficient / multiplier
Demand price elasticity
Description
Used to estimate the additional
subscribers the price reduction brings
as a consequence of the cost savings
Source
Katz, R. and Berry, T. Driving demand
for broadband networks and services
(2014)
GDP multiplier Estimates the impact on GDP the
increase in broadband penetration
originates
Per 1% increase in broadband
penetration, GDP grows 0.0158 pp
ITU. Impact of Broadband on the
economy. Broadband series. April (2012).
Job creation multiplier Estimates the impact on jobs the increase
in the number of subscribers originates
The job creation multiplier is different for
each country.
Telecom Advisory Services. Economic
Benefits of Digital Dividend for Latin
America (2011).
Social discount rate Used in computing the value of funds
spent on social projects.
Different rate for each country. In Latin
America the SDR ranges from 2.9% to
5.1%
The Social Discount Rate: Estimates for
Nine Latin American Countries. Humberto
Lopez. The World Bank Latin America
and the Caribbean Region Office of the
Chief Economist. June (2008)

33
In the model a demand price elasticity of -0.6x (the negative sign implies a reduction if one of the
variables results in an increase in the other variable) is assumed. The elasticity estimation is based
on a study from Katz and Berry30.
According to a report commissioned by ITU titled “Telecommunication Development
Sector. Broadband Series. Impact of Broadband on the Economy” (2012) there is consistent evidence
of the positive economic impact of mobile broadband services. They enhance economic efficiency,
boost GDP and activate job creation. The positive economic impact of broadband derives from higher
revenues for telecom operators, gains in productivity, employment generation and an increase in
consumer surplus. Drawing on this report, the Latin American multiplier is used, which indicates a
0.158x contribution to GDP growth derived from every increase of 10% in broadband penetration.
This impact includes direct effects from the telecommunications industry and indirect spill-overs.
Together with a positive impact on the economy, broadband penetration aids in job creation. In this
case, the multiplier estimates how many additional jobs will be created based on the number of
additional subscribers. A different ratio is used for Brazil, Mexico, Colombia and Argentina as specific
information was available for those countries.
The social discount rate measures the rate at which a society is willing to trade present for future
consumption. As such, it is one of the most critical inputs used in cost-benefit analysis of public
projects (and more generally public policies) and is used in computing the value of funds spent on
social projects. For the purposes of this report, a World Bank report, ‘The Social Discount Rate:
Estimates for Nine Latin American Countries” was used. The average social discount rate for the nine
countries considered in the report is 3.1%. Four of those countries are also the same sample countries
and enable use of exact figures but used the average regional discount rate for the other three. These
are the rates used
Argentina: 2.9%
Brazil: 5.1%
Colombia: 4.2%
Mexico: 3.3%
Ecuador, Dominican Republic and Uruguay: 3.1% (average)
IV.c. Key results and findings
30 Katz, R. and Berry (2014)

34
The quantitative analysis concludes that allocating the L-band to IMT services will originate material
benefits for the telecommunications sector, the government and society.
The report’s economic model estimates the impact of identifying the L-band for IMT according to the
following categories:
- Economic value
o Additional cost savings and consumer surplus to the sector
o Additional 4G subscribers
- Direct and indirect impact on:
o GDP and economy efficiency
o Job creation
o Fiscal and tax collections
The following table lists the key results of the quantitative analysis:
Variable
Quantitative impact
Cost savings to the sector
US$6.3 billion (NPV at 2017, cumulative
impact for the 10-year period)
Additional 4G subscribers
41.7 million new 4G subscribers (by
2026)
GDP indirect impact (through more efficiency)
US$19.8 billion (NPV at 2017, cumulative
impact for the 10-year period)
Job creation
13,120 jobs, to be created in the 10-year
period
Fiscal impact
US$3.2 billion (NPV at 2017, cumulative
impact for the 10 years period)
35
Cost savings to network operators
The cost savings to network operators incorporate savings from Capex and Opex resulting from a
lower number of BTS to be deployed. The main assumption here is that, if the L-band were not
identified for IMT, telecom operators would have less spectrum available and have to compensate
with additional BTSs.
The impact was estimated for every sample country for a 10-year period, starting in 2017 and ending
in 2026, and then extrapolating the findings for the entire LAC region. Final results have been
discounted as of 2017 at the social discount rate.
The following figure shows the economic impact of the L-band reallocation on the consumer surplus
based on cost savings only.
Figure 15: Cost savings to network operators US$ million, Net Present Value at 2017, cash flows discounted at social rate
As shown above, the cost savings amount to US$6.3 billion for the whole region. This is the net
present value (NPV) in 2017 of the cost savings in year-to-year cash flows. The cost savings comprise
operational expenditure and capital expenditure reductions, caused by the availability of extra
spectrum meaning less BTS to deploy.
If a total of 70MHz of the L-band were to be identified for IMT, the total estimated cost savings are far
above the total migration costs. None of the sample countries would experiences a loss from the
49 78 102 380
447
927
2.293
4.276
2.053
6.330
Uruguay DominicanRepublic
Ecuador Colombia Argentina Mexico Brazil Selectedcountries
Othercountries
CostSaving
Mil
lare
s
Cost savings amounts to USS 6,3 billion, with all selected countries showing positive outcomes

36
identification of the L-band for IMT, and all show positive outcomes, although some are more positive
than others
There is a strong correlation between total savings and 4G connections and the estimated traffic.
Brazil and Mexico account for most of the cost savings, particularly Brazil which accounts for more
than 35% of the total.
It is also important to highlight the fact migration costs are not significant when compared to consumer
surplus derived from the cost savings passed on to end users. The next chart compares migration
costs to discounted consumer surplus over a 10-year period.
Figure 16: Value gap between consumer surplus and migration costs Million USD at 2017, NPV, Cash flows discounted at social discount rate
Additional net 4G subscribers
As the model assumes cost savings are passed on to consumers under competitive conditions, this
will result in retail price cuts. Estimated retail price through ARPU levels and assumed cost savings
per subscriber imply a similar reduction in the retail price of 4G services. This price reduction
motivates the adoption of 4G by more subscribers, but by how many ultimately depends on the price
elasticity, which is -0.6 in this case. The following figure shows the impact in terms of price cuts and
the resultant additional subscribers for each sample country.
0,9164,6
0,9 6,0 39,6 23,5 1,1
458,1
2.403,8
394,0
81,7 105,2
959,7
51,2
Argentina Brazil Colombia DominicanRepublic
Ecuador Mexico Uruguay
Migration cost (2017)
Consumer surplus (2017)
• The cost of migrating the current L-band users to another band is not significant when compared
to the consumer surplus generation
• The outcome of identifying the L-band for IMT is positive in each sample country

37
Figure 17: Additional subscribers obtained from cost savings translated into retails price cut Million of additional 4G subscribers by 2026
By 2020, an increase in almost 42 million subscribers in the region as a consequence of the cost
savings derived from the identification of the L-band for IMT. These new subscribers would originate
an additional economic surplus of US$283 million, bringing the total savings to US$6.6 billion. The
retail price cut differs from country to country and ranges from 3.5% to 8.9%.
Highlighting the time scale of the cost savings and of the additional consumer surplus is also relevant,
as the benefits increase year after year with the major impact coming in the latter years. See the chart
in next page for the year to year consumer surplus evolution.
Figure 18: Cost savings plus additional consumer surplus over time Current US$ million
0,3 0,5 0,9 1,82,5
4,9
16,1
26,9
14,7
41,7
Uruguay DominicanRepublic
Ecuador Argentina Colombia Mexico Brazil Selectedcountries
Othercountries
Latam
8.9%Retail price
cut 6.6% 5.8% 3.5% 5.9% 5.6% 7.4%
• Based on demand price elasticity, price reduction leads to increase in subscribers
• Additionally, the new subscribers will originate US$ 283 million of additional consumer surplus
-143
184 249409
737980 1.098
1.4221.713
2.106
2017 2018 2019 2020 2021 2022 2023 2024 2025 2026
• Consumer surplus increases year-by-year as Opex and recurrent Capex cost savings start to impact on the
cumulative BTS deployment which is not required as a consequence of the L-band’s identification for IMT
• First year negative value shows current L-band users’ migration costs
year

38
Direct and indirect impacts
Finally, it is important to highlight the positive impact the identification of the L-band for IMT can have
on society because it causes an increase in the economic efficiency, GDP growth, job creation and
tax collection.
The estimates of the GDP31 and the job creation impacts based on multipliers to broadband
penetration and subscribers respectively, whilst the fiscal impact leading to an increase in VAT32
payments and income tax collection, is a consequence of the additional revenue generated by new
subscribers.
Figure 19: Indirect impact from L-band´s identification for IMT
13,120 new jobs could be created through the identification of the L-band for IMT, as well as an
increase of US$13.2 billion in the GDP of the region and US$ 2.2 billion in extra taxes.
A relevant assumption in this modelling is that 100% of the cost savings are passed on to end users.
But even if assuming just a portion of the total cost savings were transferred to retail prices that would
31 Including both direct and indirect impacts 32 Value added tax
Cumulative fiscal impact
Net present value at 2017
US$ billion
Cumulative GDP growth
Net present value at 2017
US$ billion
Yearly job creation
Yearly average
New jobs to be created per year
• Additional GDP accounts for US$20 Billion, obtained through higher efficiency ratios resulting from more mobile broadband
• 1,312 jobs to be created on average per year in Latin America as a consequence of identifying the L-band for IMT. Total
jobs to be created during the 10-year period (2017-2026) is 13,120
• Extra tax collection: US$ 3.2 billion (VAT and income tax)
0,2
0,3
0,5
1,1
1,1
3,2
4087
88
549
548
1.312
0,61,2
3,0
10,0
5,0
19,8

39
still have a major impact although, of course, the number of new subscribers and the three indirect
impacts will be reduced proportionally.

40
V. Appendix
V.a. Technical highlights
Current services
The following figure shows the allocation of L-Band (1350-1518MHz) in each region, in accordance
with the ITU’s Radio Regulations of 2012.
Note 1: The grey boxes are the adjacent bands to the spectrum range under analysis.
Note 2: The red box corresponds to the internationally-protected spectrum used for radioastronomy and passive services.
According to RR’s footnote 5.340, all emissions are prohibited in this band. Some countries are also conducting passive
research under a programme to search for intentional emissions of extra-terrestrial origin (RR footnote 5.341).
Note 3: In the USA and Canada, the sub-band 1350-1370MHz is also allocated for aeronautical radio navigation services
(RR footnote 5.334).
Note 4: The bands 1370-1400MHz, 2640-2655MHz, 4950-4990MHz and 15.20-15.35 GHz are also allocated to space
research (passive) and Earth exploration-satellite (passive) services on a secondary basis (RR footnote 5.339).
To protect the Earth Exploration-Satellite Service (EESS) from potential interference from active
services in adjacent bands, the Radio Regulations recommend mobile services operating in the bands
1350MHz
1400MHz
1427MHz
1429MHz
1452MHz
1492MHz
1518MHz
1300MHz
1525MHz
RADIOLOCATIONAERONAUTICAL RADIONAVIGATION
RADIONAVIGATION-SATELLITE
FIXEDMOBILE
RADIOLOCATIONRADIOLOCATION
EARTH EXPLORATION – SATELLITE (Passive)RADIO ASTRONOMY
SPACE RESEARCH (Passive)
FIXEDMOBILE except aeronautical mobile
SPACE OPERATION (Earth-to-Space)/FIXED/MOBILE except aeronautical mobile
FIXEDMOBILE
FIXEDMOBILE except aeronautical mobile
BROADCASTINGBROADCASTING-SATELLITE
FIXEDMOBILE
BROADCASTINGBROADCASTING-SATELLITE
FIXEDMOBILE except aeronautical mobile
FIXEDMOBILE
FIXEDMOBILE
FIXED/MOBILE except aeronautical mobile/MOBILE-SATELLITE (Space-to-Earth)
FIXED/MOBILE/MOBILE-SATELLITE (Space-to-Earth)
FIXED/MOBILE/MOBILE-SATELLITE (Space-to-Earth)
Region 1 (Europe) Region 2 (Americas) Region 3 (Asia Pacific)
41
1350-1400MHz and 1427-1452MHz, comply with the emission limits from stations along the 27MHz
of the EESS (Passive) band33:
- -60dbW for mobile service stations, except transportable radio-relay stations.
- -45dBW for transportable radio-relay stations.
In any case, however, mobile services based on IMT systems are likely to comply with these emission
limits34.
For ITU Region 2 (America), RR footnote 5.343 has prioritized the use of the 1435-1.535 MHz band
for aeronautical mobile service (for telemetry) over its being used for mobile services.
In the following sections, we outline the most relevant features of the allocated services.
Radiolocation
Radiolocation is a location service able to perform radiolocating35, that is finding a specific location
through the use of radio waves. Long-range radars and terrestrial radio relay are examples.
Radiolocation services include long-range aeronautical radionavigation radar systems. These radar
systems are used to monitor aircraft and other aerial objects inside the national airspace, along border
areas, and around military bases and airfields.
As well as radar systems used for aeronautical radionavigation, the armed forces of some countries
operate tactical radar systems in the 1300-1350MHz band36. Tactical radars are often used to operate
in a battlefield environment, alongside other systems. One such system is the Tethered Aerostat
Radar (TAR) system, which also operates in the band. The TAR consists of balloon-mounted radars
used for monitoring the US southern borders and Caribbean airspace for drug interdiction.
But long-range radars could also operate in the band 1215-1400MHz according to the technical
features mentioned in ITU-R M 1463-2 “Characteristics of and protection criteria for radars operating
in the radio-determination service in the frequency band 1215-1400MHz”.
33 ITU, Resolution 750 (Rev. WRC-12), 2012 34 Idem. Footnote 3 35 ITU, Radio Regulations Vol I, 2012 36 Specially from USA, Canada and Europe

42
There are also different types of radars, with land-based fixed or transportable platforms, operating
in the band 2700-2900MHz. The uses of these radar systems include Air Traffic Control and weather
observation. These radars use continuous wave (CW) pulses and frequency modulated (chirped)
pulses with typical transmitter RF emission bandwidths from 66 kHz to 6MHz.
Land-based radar systems could also operate at 3110-3400MHz; as already do, for example, radars
employed by US Army Field Artillery Units to detect and track incoming projectiles and provide the
locations of both the source and the point of impact37.
Broadcasting and Broadcasting-Satellite
According to the ITU’s Radio Regulations of 2012, broadcasting services are radio communication
services, whose transmissions are intended for direct reception by the general public. These services
may include sound transmissions, television transmissions and others (CS)38.
In broadcasting-satellite services, the signals are transmitted or retransmitted by space stations, and
therefore require international coordination. Satellite Digital Audio Broadcasting (S-DAB) is a
satellite-enabled system for the digital broadcasting of a wide variety of audio content to fixed and
mobile receivers (including portable, handheld and vehicular). The three main types of S-DAB
operation are:
- Standalone satellite component (i.e., without complementary terrestrial component);
- Satellite component of a hybrid solution with complementary terrestrial broadcasting
networks operating in the spectrum used by the satellite.
- Standalone satellite component, complementing nationally-licensed terrestrial broadcast
networks.
Fixed Services
A fixed service is a radio communications service between specific fixed points such as the
microwave links between two transmitter/receptor stations. The most-used bandwidths for these
services in the 1.5GHz band are 250KHz, 500KHz, 1MHz, 1.75MHz and 3.5MHz.
37 NTIA TR-99-361. Technical Characteristics of radiolocation system operating in the 3.1-3.7GHz band. (1999) 38 ITU, Radio Regulations Vol I, 2012

43
If L-Band is identified for IMT, current users operating fixed services in this band can be migrated to
other bands allocated to fixed services including 1.8GHz, 2GHz, 3.8GHz, 4.2GHz, 6GHz, 7GHz,
11GHz and 15GHz.
Mobile Service
According to the ITU Radio Regulations definitions, a mobile service is a radio-communication service
between mobile and land stations, or between mobile stations such as, for example, mobile
broadband based on IMT systems.
Mobile broadband is a terrestrial radio communications service connecting base stations with mobile
devices to provide various services and applications to end-users, including mobile Internet,
entertainment, and video on-demand.
In the figure below, we show a non-exhaustive list of technologies available for mobile broadband
based on IMT systems, and the spectrum required for their operation.
Radioastronomy
A Radioastronomy service is used for studies of astrophysical objects through radio frequencies and
as such the ITU invites administrations to cooperate in protecting radioastronomy services from
interference.
Carrier Size (Spectrum Quantity)
• FDD and TDD operation
• Carriers of 5MHz and 10MHz (Dual Carrier)
• Up to 20MHz in 3GPP Rel 9 and beyond
• FDD and TDD operation
• Carriers of 1.5MHz, 3MHz, 5MHz, 10MHz, 15MHz and
20MHz
• FDD and TDD operation
• Same carriers supported by LTE and up to
100MHz in 3GPP Rel 10 and beyond
• HSPA+
• LTE
• LTE - Advanced
Technology

44
Administrations must take into account the extremely high sensitivity which is a feature of
radioastronomy stations as well as the need for long periods of observation without harmful
interference. Because of these constraints, there are only a small number of radioastronomy stations
in each country39.
Article 29 of the ITU Radio Regulations specifies special considerations for radioastronomy services
in order to protect them from harmful interference. It is specified, for example, that the locations of
radioastronomy stations should be selected with due regard to the possibility of harmful interference,
and in the adjacent bands the administrations are urged to take all practicable steps to protect
radioastronomy services from harmful interference.
Passive Services: Earth Exploration-Satellite Service (EESS) and Space Research
Service
The ITU Radio Regulations define EESS as a radiocommunication service between earth stations
and one or more space stations, including links between space stations40.
EESS provide information about characteristics of the planet and natural phenomena. This is obtained
from sensors on Earth Satellites as well as collected from airborne or Earth-based platforms. The
information is then distributed to earth stations.
Resolution 673 (Rev.WRC-12), concerning the importance of earth observation radiocommunication
applications, states that the use of spectrum for earth observations has a material socio and economic
value, and urges administrations to protect these systems from harmful interference41.
Channelization plan options
Based on the spectrum range under analysis (i.e. 1350-1400/1427-1518MHz), we propose different
band plan scenarios, as shown in the next figure.
39 ITU, Radio Regulations Vol I, 2012 40 ITU, Radio Regulations Vol I, 2012 41 ITU, Radio Regulations Vol III - Resolutions, 2012

45
Figure 20: Band plan options for L-band
Note: *Unpaired spectrum available for Supplemental Downlink (SDL) o TDD Radio Access
The worst scenario in terms of the quantity of spectrum made available is the identification of 2 x
35MHz for IMT (Option A: 3GPP band 11 + band 21), while the best scenario is Option B: 100MHz
(2 x 50 MHz) paired and 40MHz unpaired. Following are special considerations which need to be
taken into account for each option.
- Option A: Band Plan based on 3GPP specifications for band 11 and band 21
This option allows the use up to 2 x 35MHz for IMT systems deployment. It does not allow taking
advantage of the spectrum available below 1400MHz.
The main advantage of this option is related to commercial availability of the equipment and terminals
ecosystem42.
- Option B: Band Plan includes all spectrum within the spectrum range under analysis.
It provides for 100MHz of paired spectrum and 40MHz of unpaired spectrum for use either with
Supplemental Downlink (SDL) or TDD technologies. Although this proposal allows using the entire
42 There are two LTE networks in this frequency band in Japan.
13
50
.0M
Hz
14
00
.0M
Hz
14
27
.0M
Hz
14
27
.9M
Hz
14
47
.9M
Hz
14
62
.9M
Hz
14
75
.9M
Hz
14
95
.9M
Hz
15
10
.9M
Hz
15
18
.0M
Hz
Option A:
3GPP Band 11
and Band 21
Option B
Option D
Option C
20MHz 20MHz
15MHz 15MHz
2x35MHz
50MHz 50MHz
25MHz 25MHz
40MHz (Unpaired*)2x50MHz
+ 40MHz
2x25MHz
+ 40MHz
35MHz 35MHz50MHz (Unpaired*)2x35MHz
+ 50MHz
40MHz (Unpaired*)
46
spectrum of frequency band 1350-1400 MHz and 1427-1518MHz, there are no technological
developments or any related trials or proposals linked with this channelization.
- Option C: Based on CEPT studies and Qualcomm’s proposal for SDL
Option C adopts the Qualcomm proposal for SDL development in frequency band 1452-1492MHz,
and additionally considers the results of a trial conducted by Orange, Qualcomm and Ericsson.
This option is also aligned with a proposal from Orange focusing on the utilization of 1375-1400 MHz
to accomplish harmonization and promote economics of scale.
- Option D: Based on 3GPP specification for band 11 and band 21
This option adds the band 1350-1400 MHz to the channelization defined by 3GPP. In this context,
the additional 50 MHz could be used as unpaired spectrum for SDL or TDD. Thus, it is possible to
leverage the technology development available for LTE in this frequency band, and use the spectrum
available below 1400 MHz.
Terminals ecosystem at a glance
In 2009, Japan assigned 70 MHz of spectrum within L-Band to mobile operators (i.e., Softbank and
NTT DoCoMo) to deploy LTE networks. Both operators launched their commercial networks between
2010 and 2012. So there are already two commercial LTE networks operating in the 1.5 GHz band
in accord with 3GPP specifications43, and so a limited amount of equipment for IMT services in L-
Band is already available.
43 Band 11 (1427.9 – -1447.9 MHz/1475.9-1495.9 MHz) and Band 21 (1447.9-1462.9 MHz/1495.9-1510.9 MHz) in 3GPP Specifications since Release 8.

47
V.b. Per country analysis
This section outlines the findings of the per country research, which entailed the review of public
sources as well as direct interviews with local administrations.
For each sample country there are a brief description of the IMT spectrum, a glance at the mobile
market and specific findings on the L-band.
Brazil
Frequency allocation and IMT services
Current allocation
In Brazil the ‘Agencia Nacional de Telecomunicaciones’ (Anatel) is responsible for the spectrum
management and planning. The bands identified for IMT services are: 450MHz, 700MHz, 850MHz,
900MHz, 1800MHz, 1900MHz, 2100MHz and 2500MHz.
The figure below shows the services allocation in the already assigned IMT bands 44.
Figure 21: Services allocation in bands mostly used for IMT in Brazil MHz
Source: Anatel
44 The figure includes only the already assigned bands.
450MHz band
Mobile
Fixed
Secondary usage
Satellite
Earth to space
Space to earths
850MHz and 900MHz bands 1800MHz and 1900MHz bands
Mobile
Fixed
Secondary usage
Radiolocation satellite
Meteorological aids
Mobile
Fixed
Satellite
Earth to space

48
Figure 22: Services allocation in bands mostly used for IMT in Brazil (Cont.) MHz
Source: Anatel
Brazil has a total of 660MHz identified for IMT services, positioning Brazil as one of the country with
most spectrum identified for IMT. However, to date Brazil reaches only between 34% and 49% of the
total spectrum requirements estimated by ITU45, for the high and low-density settings, respectively.
In the same line, when compared to the spectrum demand forecasted by GSMA46, Brazil reaches
only between 39% and 58% of the high or low total spectrum demand forecast, respectively.
IMT assignments
The bands of 450MHz, 850MHz, 900MHz, 1800MHz, 1900MHz, 2100MHz y 2500MHz have been
assigned to four national mobile operators (Vivo, TIM, Claro and Oi), to two regional mobile operators
(Algar and Sercomtel), and one yet to commence service as national mobile operator (Nextel).
In Brazil the IMT spectrum licensing is structured in 3 regions, 10 services areas and 34 sectors;
therefore, the assignments have regional reach, resulting in different spectrum holdings per region
per operator. Most of the current spectrum identified for IMT has been already assigned (i.e.
approximately 529 MHz).
The licenses timeframe is 20 years maximum; however, most of the IMT spectrum has been assigned
for a 15 years period, with a one-time renewal at finish.
45 Report ITU-R M.2290-0 46 Revised spectrum forecasts using the new spectrum model, prepared for GSMA by Coleago Consulting (2013)
2,1GHz band 2.5 GHz band
Mobile
Fixed
Satellite
Space research
Space operation
Earth to space
Earth exploration satellite
Space to space
Space to earth
Mobile
Fixed
Satellite
Space research
Radio astronomy
Radiolocation satellite
Meteorological aid
Space to earth
Secondary usage

49
There are more than 50 thousand base stations, with TIM, Vivo and Claro having approximately 15
thousand base stations each and Oi having approximately 4 thousand base stations.
The economic compensation for the IMT licenses comprises an up-front payment to be ultimately
determined through an auction process; thereafter, there are no additional economic obligations.
However, after the first (and unique) renewal, incumbent operators shall pay a biennial fee of 2% on
previous year gross income (net of taxes and contributions) and the TFI47.
The Brazilian mobile telecommunications market accounts for 27148 million subscribers (136% mobile
penetration). As most markets of the region, the Brazilian market has experienced a dramatic growth
in last years; it has more than doubled its number of subscribers between 2007 and 2013.
Figure 23: Brazil´s mobile market evolution
As a consequence of the market saturation, in last years the mobile market has slowed down its
growth rate.
There are four national operatores (Vivo, Claro, TIM and Oi) and two regional operators (Algar and
Sercomtel), while one national operator is yet to commence service (Nextel).
The following figure shows the current market structure in terms of subscribers.
Figure 24: Brazil mobile market structure
47 ‘Tasa de Fiscalización de Instalación’ 48 Anatel, December 2013.
121
151174
203
242262 271
2007 2008 2009 2010 2011 2012 2013
64
7891
105
124133 136
2007 2008 2009 2010 2011 2012 2013
Mobile services clients evolution Penetration
Million % (subscribers / population)

50
In subscribers
Source: Anatel
The Brazilian market is featured by its well-balanced structure and the absence of a dominant player
as Claro, TIM and Vivo have similar market shares (Oi is the fourth player in the market with 19%
market share).
IMT roadmap and new bands under study
The Brazilian administration has announced an auction of 80MHz in the 700MHz band (digital
dividend) to take place in late September 2014. In addition, Anatel is assessing new spectrum bands
for identification for IMT: 1350-1400MHz, 1427MHz-1518MHz and the 3400–3600MHz.
L-band frequencies (1350-1525 MHz)
Current allocation
L-band includes the frequencies from 1350MHz to 1525MHz, with this service allocation:
- 1350-1400MHz: radiolocation
- 1400-1427MHz: earth exploration satellite, radio astronomy, space research
- 1427-1429MHz: fixed, mobile, space operation (earth to space)
- 1429-1452MHz: fixed and mobile
- 1452-1492MHz: fixed, mobile, broadcasting and broadcasting-satellite
- 1492-1518MHz: fixed and mobile
- 1518-1525MHz: fixed, mobile and mobile-satellite (space to earth)
The figure below depicts the allocation ofr the L-band.
Figure 25: L-band´s services allocation in Brazil
77
73
69
50
2
27%
25%
19%29%
Others:
0,6%

51
MHz
Source: Anatel
The allocation to mobile services is shared with the allocation to fixed services (range 1427-
1525MHz), space operation (1427-1429MHz) and broadcasting (1452-1492MHz). In line with
international guidelines, the spectrum between 1350MHz and 1400MHz is allocated to radiolocation.
The frequencies ranging from 1400MHz to 1427MHz are reserved for earth exploration satellite,
radioastronomy and space research.
Assignments and actual use
The L band is used by a high number of stakeholders for point-to-point and point-to-multipoint links,
who belong to different industries including: telecommunications, oil and electricity and utilities.
Today, there are more than six thousand licenses assigned in the L-band; the vast majority being old
assignments with obsolete equipment deployed throughout the country and focused on rural areas.
Potential migration
Although feasible, the migration of existing users of the L-band to other bands faces some barriers:
the large number of users to migrate and the migration of users whose licenses that have not yet
• The range from 1427MHz to
1525MHz is allocated to mobile
services
• The mobile services allocation is
shared with fixed services
(1427MHz to 1525MHz)
• In compliance with international
standards, spectrum in the range
1350-1400MHz is allocated to
radiolocation
• Spectrum from 1400MHz to
1427MHz is reserved for earth
exploration satellite, radioastronomy
and space research
Radiolocation
Aeronautical radionavigation
Radionavigation
Earth exploration sate.
Space research
Radioastronomy
Fixed
Mobile
Space operation
Broadcasting
Satellite
Earth to space
Space to earth

52
expired49. However, note that while licenses could be assigned for a period of up to 20 years50 they
had instead been awarded for a period of 10 years only, excluding automatic renewal.
Public agenda regarding for the L-band
Anatel has pointed out that the bands 1350-1400MHz and 1427 MHz1525MHz should be taken into
account among the candidates bands for the provision of IMT services (to be proposed at the next
World Radiocommunication Conference (WRC-15)). Brazil has already submitted to CITEL a
proposal for identification of the L-band for IMT in Region 2.
Mexico
Frequency allocation and IMT services
Current allocation
In Mexico the Federal Telecommunications Institute (IFT) is responsible for the spectrum
management and planning. The following figure shows the services allocation in the currently
assigned IMT bands:
Figure 26: Services allocation in bands mostly used for IMT in Mexico
Source: Instituto Federal de Telecomunicaciones
49 Similar to the barriers for the assignation of the 700 MHz band. 50 Lei n.º 9.472/1997 (Lei Geral de Telecomunicações – LGT)
850MHz band 1900MHz band AWS band
FIX
ED
MO
BIL
E –
SA
TE
LL
ITE
(E
AR
TH
TO
SP
AC
E)
MO
BIL
E
MOBILE
FIX
ED
ME
TE
OR
OL
OG
HY
PE
R S
AT
EL
LIT
E
MO
BIL
E
FIX
ED
MO
BIL
E
FIX
ED
MO
BIL
E –
SA
TE
LL
ITE
(SP
AC
E T
O E
AR
TH
)M
OB
ILE
SP
AC
E I
NV
ES
TIG
AT
ION
FIX
ED
MO
BIL
E –
SA
TE
LL
ITE
(SP
AC
E T
O E
AR
TH
)M
OB
ILE

53
The mobile market in Mexico comprises four operators (Iuscacell, Movistar, Nextel and Telcel) and
two MVNO (Maxcom and Megacable). All operators offer mobile broadband through UMTS / HSPA+
networks whilst Movistar and Telcel have already launched LTE services in 2012.
The country has assigned approximately 230MHz of IMT spectrum. Licenses are structured on a
regional basis, with 9 regions for the entire country.
The 600MHz of the spectrum already identified for IMT services accounts only for a portion (between
31% and 45%, depending on the market density) of the total spectrum requirements estimated by
ITU51. According to GSMA estimates52, the 600MHz already identified for IMT represent between
39% and 61% of the total spectrum requirements by 2020.
As for the radio access infrastructure, incumbent operators have deployed almost thirty thousand
(29.249) radio stations throughout the country.
The economic compensation for the use and operation of radio spectrum is established on a year
basis and takes into account the parameters contained in the Federal Law Rights, articles 244-B,
244- D and 244-E.
In last years, the penetration of mobile market has reached a two-digit rate of growth, approaching a
saturation stage at the present time.
Figure 27: Mobile market structure in Mexico
51 Report ITU-R M. 2290-0 52 Coleago Study (2013)
3038
4757
6978 83 91 95 101 105
30%36%
45%
54%
63%70%
74%80% 82%
86% 89%
0%
10%
20%
30%
40%
50%
60%
70%
80%
90%
100%
0
20
40
60
80
100
120
2003 2004 2005 2006 2007 2008 2009 2010 2011 2012 2013
Mobile telecommunication services evolution
Mobile penetration
Numbers of suscriptors (milliom)
• Mobile telecommunication penetration has grown at a compound annual growth rate of 13%
• Over 90% of the market is concentrated in two operators
70%
22%
4%4%
Mobile telecommunications market share

54
The mobile market penetration has grown from 30% in 2003 to 89% in 2013. The market is highly
concentrated with 90% of the total at hands of two operators.
Spectrum roadmap and new bands under study
Even though the administration has not yet announced an assignation process, the following bands
are being considered for potential assignations:
Figure 28: Assignation roadmap for IMT bands in Mexico
Source: Instituto Federal de Telecomunicaciones
In addition, the 614-698MHz and the 1452-1492MHz bands will be proposed for identification for IMT
services.
Current allocation
In Mexico, the bands 1350-1400MHz and 1427-1518MHz are considered in the scope of the L-band.
The figure below shows the frequency allocation in the L-band.
Band (MHz) Sub band (MHz) IMT assignment date
450-470 -- To be defined
698-960698-806 Before the end of 2014
814-824/859-869 To be defined
1710-20251710-1725 Tentatively 2015
1755-1770 To be defined
2110-2200 2110-2125 Tentatively 2015
2300-2400 2155-2170 To be defined
2500-2690
2500-2530 Tentatively 2015
2530-2570 To be defined
2570-2620 To be defined
2620-2650 Tentatively 2015
2650-2690 To be defined

55
Figure 29: L-band´s services allocation in Mexico MHz
Source: Instituto Federal de Telecomunicaciones
The figure above shows that most of the band (i.e., 98MHz in the range 1427-1525MHz) is allocated
to fixed services whilst only 9MHz are allocated to mobile services. The range between 1350-
1400MHz follows the international trend of radiolocation allocation.
Assignments and actual use
The range 1427-1525MHz includes licenses for fixed services. The licenses were directly assigned
and have a different expiration timetable. The band is mostly used for microwave point to point links,
where the private companies are the main users and there is a handful of state-owned companies.
Figure 30: Actual use of L-band in Mexico
. Source: Instituto Federal de Telecomunicaciones
Potential migration
• Most of the band, 98MHz
(1427 – 1525MHz) is
allocated to fixed services
• Only 9MHz are allocated to
mobile service (on a shared
basis with fixed service)
• Radio spectral range between
1350 - 1400MHz follows the
international trend of
radiolocation allocation
SP
AC
E
RE
SE
AR
CH
RA
DIO
AS
TR
O-
NO
MY
EA
RT
H
EX
PL
OR
A
-S
AT
EL
.
(PA
SS
IVE
)
MO
BIL
EM
OB
ILE
–S
AT
EL
LIT
E
(SP
AC
E T
O E
AR
TH
)F
IXE
D
FIX
ED
BR
OA
D-
CA
ST
ING
BR
OA
DC
AS
T-
ING
SA
TE
LL
ITE
FIX
ED
FIX
ED
MO
BIL
EF
IXE
D
RA
DIO
LO
CA
TIO
N
Frequency band (MHz) Current uses
1350-1400Aeronautical radionavigation systems, aeronautical communications and
related uses.
1427-1429 Point to point fixed service systems
1429-1452 Point to point fixed service systems
1452-1492
Point to point fixed service systems
According to the note 5.345 of radio regulations this frequency band is limited
to digital audio broadcasting satellite service. However it is not expected to
use the band for such services in Mexico.
1492-1518 Point to point fixed service systems
1518-1525
This range is in the Mexico’s records that are being precessed by ITU for
mobile satellite service. However it is not expected to use the band for such
services in Mexico

56
The migration of users in the range 1300-1427MHz is not deemed possible as they operate protected
services. However, it would be possible migrating fixed service operating in the range 1427-1525MHz
As mentioned before, there are few licenses of fixed services in the range 1427-1525MHz.
Nevertheless, some of those users have also microwave point to point systems operating in other
bands: 928-960MHz, 7GHz, 15 GH and 23GHz.
Position regarding future use of the L-band
According to the answer submitted by the delegation of Mexico to the decision CCP.II / DEC. 162
(XXII-13)53, although it is not expected a modification of the current allocation of the range 1350-
1400MHz, the possibility of identifying the range 1427-1525MHz for IMT services is under analysis.
It is worth mentioning that there are no definite plans to migrate current users to another band. The
table below summarizes the plans for each portion of the L-band.
Figure 31: Plans for L-band in Mexico
Source: Instituto Federal de Telecomunicaciones
Colombia
53 Information request on current and planned uses of the bands 1350 - 1524 MHz and y 1427 – 1524 MHZ for satellite and land services to be submitted by OEA/CITEL administrations
Frequency band (MHz) Action
1350-1400 No changes are expected
1427-1429 The possibility of identifying this frequency range for IMT is under analysis
1429-1452 The possibility of identifying this frequency range for IMT is under analysis
1452-1492The possibility of identifying this frequency band for IMT is under analysis
(according to the discussions that are being held within the ITU-R and 3GPP.)
1492-1518 The possibility of identifying this frequency range for IMT is under analysis
1518-1525 The possibility of identifying this frequency range for IMT is under analysis

57
Frequency allocation and IMT services
Current allocation
Law 1341 of 2009 defines the structure and basic concepts of the telecommunications industry in this
country. This law establishes the framework of the telecommunications sector, the competition rules
and consumer protection, the coverage and quality of services, the promotion of domestic and foreign
investment in the sector, paving the road for the development of new technologies, the guidelines to
assure the efficient use of radio electronic spectrum as well as identifies the public entities responsible
for the sector administration.
The regulatory entities are described in the Law 1341/2009 and its structure follows a hierarchal
framework. At the top of the pyramid there is the Ministry of Information and Communications
Technologies (MINTIC), followed by the National Spectrum Agency (ANE). Article 26 of Law
1341/2009 describes the 13 functions of the National Spectrum Agency. The purpose of the ANE is
to provide technical support for the management, monitoring and control of the radio spectrum, in
coordination with other entities.
Colombia has identified for IMT the bands: 850MHz, 1900MHz, AWS, 700MHz, 900MHz and 2.5GHz
bands. The following figure shows the services allocations in the IMT bands currently assigned.
Figure 32: Services allocation in bands mostly used for IMT in Colombia MHz
* Excludes aeronautical mobile Source: ANE - CNABF, 2013
Figure 33: Services allocation in bands mostly used for IMT in Colombia (Cont.) MHz
850MHz band 1900MHz band
MO
BIL
EM
OB
ILE
–S
AT
EL
LIT
E
(SP
AC
E T
O E
AR
TH
)F
IXE
D
MO
BIL
E*
RA
DIO
LO
C.
FIX
ED
MO
BIL
E
MO
BIL
E
MO
BIL
E -
TR
UN
KIN
G
MO
BIL
E*
RA
DIO
LO
-
CA
TIO
FIX
ED
MO
BIL
E -
TR
UN
KIN
G
MO
BIL
E*
RA
DIO
LO
-
CA
TIO
NF
IXE
D
FIX
ED
FIX
ED
MO
BIL
E
FIX
ED
MO
BIL
E
MO
BIL
E
MO
BIL
E

58
Source: ANE - CNABF, 2013
Colombia is using 415MHz out of the total spectrum identified for IMT in the bands 850MHz (824-849
/ 869-894 / 894-905 / 894-905 / 939-950MHz), 1900 MHz (1850-1910 / 1930-1990MHz), AWS (1710-
1755 / 2110-2155MHz) and 2.5GHz (2500-2690MHz).
IMT assignments
The Colombian mobile market includes five mobile network operators (Claro, Movistar, Tigo-UNE,
Directv and Avantel54), and five MVNOs (ETB, Éxito, UNE, Uff! Mobile and Virgin Mobile). The number
of mobile operators has increased recently as a result of the spectrum auction held in June 2013, in
which three entrants won licenses: Avantel (2 x 15MHz in the AWS band) consortium ETB-Tigo (2 x
15 MHz AWS) and DirecTV (2 x 15MHz and 40MHz TDD in 2.5GHz band). In June 2012 UNE has
already began marketing LTE services. Additionally, the five companies that won spectrum blocks in
the 2013 4G auction (Avantel, Claro, Tigo ETB-Consortium, DirecTV and Movistar) will launch own
4G services during 2014.
Colombia has achieved a significant increase in the total assigned spectrum, climbing from 190MHz
in 2010 to 415MHz in 2014.
Figure 34: IMT spectrum holdings in Colombia
54 Also an iden operator
AWS band
FIX
ED
MO
BIL
E
FIX
ED
MO
BIL
ES
PA
. R
ES
.F
IXE
D
FIX
ED
MO
BIL
EM
OB
ILE
SA
TE
LL
IT.
FIX
ED
2,5GHz band
FIX
ED
MO
BIL
EF
IXE
D
SA
TE
LL
ITE
FIX
ED
MO
BIL
EF
IXE
D
SA
T.
RA
DIO
SA
T.
FIXED
FIXED
SATELLI.
MOBILE
RADIO
SAT.
SAT. EXP.
RADIO
SPA. RES.
SAT.
EXP.
RADIO
SPA.
RES.
FIX
ED
FIX
ED
SA
T.
MO
BIL
E

59
Source: Agencia Nacional de Espectro
The auction from June 2013 allowed increasing the assigned spectrum from 225MHz to 415MHz.
Even though its progress, the spectrum identified for IMT in Colombia (i.e., 590MHz) still accounts
only for a portion (between 30% and 44%) of the total spectrum requirements as estimated by ITU
by 2020 (Report ITU-R M. 2290-0) as well as a portion (between 37%-56%) of the GSMA total
spectrum demand estimates55.
Figure 35: Mobile market evolution of Colombia Mobile and fixed telecommunication services penetration, percentage
Source: EIU, World Celular Information Service, Informa T&M, Informe Primer Trimestre 2013 - MINTIC
55 Coleago (2013)
50 50 50 50 50
90115 115 120 120
5050 50
240 240
5 5
5 5
2010 2011 2012 2013 2014
190MHz
220MHz
415MHz 415Mhz1900MHz
850MHz 4G
Transitory
220MHz
• The IMT assigned spectrum has more than doubled in last five years: 225MHz has been
assigned
25%
48%
67%75%
89% 88%
98%102%
105%98%
17% 17% 17% 18% 17% 15% 15% 15% 14% 13%
2004 2005 2006 2007 2008 2009 2010 2011 2012 2013
Mobile penetration
Fixed penetration
• The mobile penetration climbed from 17% in 2004 to 98% in 2013
• Fixed penetration in the first quarter of 2013 was 13%, falling from 2003 at a 3% annual rate
-3 %
CAGR 04 - 13
17%
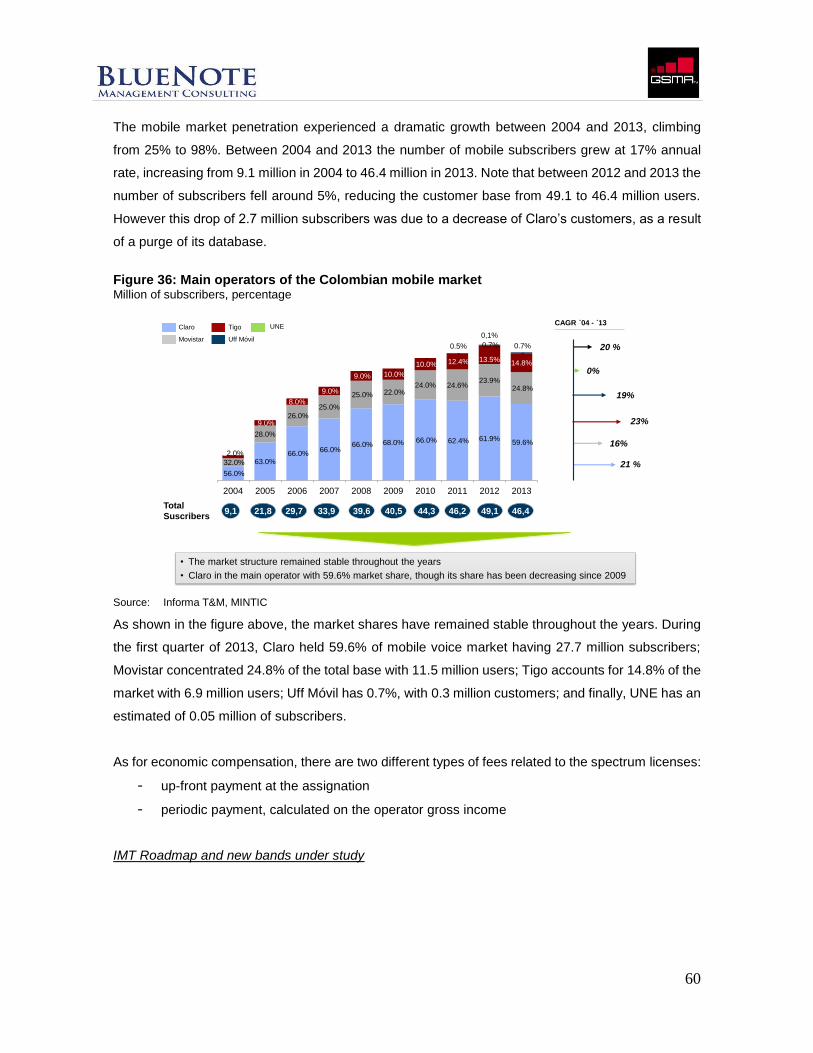
60
The mobile market penetration experienced a dramatic growth between 2004 and 2013, climbing
from 25% to 98%. Between 2004 and 2013 the number of mobile subscribers grew at 17% annual
rate, increasing from 9.1 million in 2004 to 46.4 million in 2013. Note that between 2012 and 2013 the
number of subscribers fell around 5%, reducing the customer base from 49.1 to 46.4 million users.
However this drop of 2.7 million subscribers was due to a decrease of Claro’s customers, as a result
of a purge of its database.
Figure 36: Main operators of the Colombian mobile market Million of subscribers, percentage
Source: Informa T&M, MINTIC
As shown in the figure above, the market shares have remained stable throughout the years. During
the first quarter of 2013, Claro held 59.6% of mobile voice market having 27.7 million subscribers;
Movistar concentrated 24.8% of the total base with 11.5 million users; Tigo accounts for 14.8% of the
market with 6.9 million users; Uff Móvil has 0.7%, with 0.3 million customers; and finally, UNE has an
estimated of 0.05 million of subscribers.
As for economic compensation, there are two different types of fees related to the spectrum licenses:
- up-front payment at the assignation
- periodic payment, calculated on the operator gross income
IMT Roadmap and new bands under study
21 %
16%
23%
19%
0%
20 %
56.0%
63.0%66.0%
66.0%66.0% 68.0% 66.0% 62.4% 61.9%
59.6%
32.0%
28.0%
26.0%
25.0%
25.0% 22.0%24.0% 24.6%
23.9%24.8%
12.0%
9.0%
8.0%
9.0%
9.0% 10.0%
10.0% 12.4% 13.5% 14.8%
0.5% 0.7% 0.7%
-
-
-
-
- -
--
0,1%
-
2004 2005 2006 2007 2008 2009 2010 2011 2012 2013
9,1 29,7 33,9 39,6 44,3Total
Suscribers21,8 40,5 46,2 49,1 46,4
• The market structure remained stable throughout the years
• Claro in the main operator with 59.6% market share, though its share has been decreasing since 2009
Claro
Movistar
Tigo
Uff Móvil
UNECAGR 04 - 13

61
In last years, the local administration has been assessing new bands to be identified for IMT services,
taking into account the next WRC coming in 2015; the ANE56 has carried out a study on six selected
bands, in order to analyse the suitability and opportunity of its potential future identification for IMT.
The frequency bands under analysis are:
- 512 - 698MHz
- 1400 - 1600MHz
- 2050 - 2110MHz
- 2700 - 2900MHz
- 3300 - 3400MHz
- 3600 - 3800MHz
The next step is recommending the strategy to implement the effective, timely and efficient release
of those frequency bands, with the core target that Colombia meeting the spectrum requirements by
2023.
L-band frequencies (1350-1525MHz)
Current allocation
For Colombia this study considers the ranges 1350-1400MHz and 1427-1518MHz. The figure below
shows the frequency allocation for different services in the band under analysis.
Figure 37: L-band´s services allocation in Colombia
MHz
Source: ANE - CNABF, 2013
56 Agencia Nacional del Espectro, the local technical entity responsible for the spectrum planning and management
• Most of the band, 98MHz
(1427 – 1525MHz,) is
allocated to fixed services
• Only 33 MHz (1492 -
1525MHz) are shared with
the mobile service
• Radio spectral range
between 350 - 1400MHz
follows the international trend
of radiolocation allocation
FIX
ED
MO
BIL
E
FIX
ED
FIX
ED
MO
BIL
EM
OB
ILE
SA
TE
LL
IT.
SA
TE
LLIT
E
EX
PLO
RA
TIO
N
RA
DIO
AS
TR
O-
NO
MY
SP
AC
E
RE
SE
AR
.
FIX
ED

62
Most of the band under analysis, 98MHz in the range of 1427-1525MHz, is allocated to fixed services
and only 33MHz (1492-1525MHz) are shared with mobile service. The band 1350-1400MHz follows
the international trend of radiolocation allocation.
Assignments
Today seven companies are operating in the range 1427-1530MHz. The band is being mostly used
for microwave transmission systems point to point and point to multipoint links for support services to
the mobile telecommunication operators. There is also another service operated by a local television
company that has two stations transmitting at the same frequency.
The figure below shows the number of licenses according to their expiration dates timetable during
the period 2014-2021.
Figure 38: Timetable for L-band’s licenses expiration dates in Colombia # licenses
Source: Agencia Nacional de Espectro
According to the previous figure, most licenses will expire by 2017. By 2020 more than 90% of the
licenses will automatically expire, and by the end of 2021 the total band will be clear57, paving the
way for the reallocation plans.
Actual use and potential migration
57 With an uncertainty of 4.3% since there are assignments with unknown due dates.
2 2 2 2
53
2
6
18
24
2%4%
7%9%
69%71%
78%
98%100%
0
10
20
30
40
50
60
mar-14 sep-15 nov-15 ene-16 sep-17 dic-18 dic-19 dic-20 dic-21 Sin vto.
Released licences (% accumulate)
Expired licences

63
According to a survey completed by the ANE in 2014, only one operator, the largest user of the L-
band, would be still interested in continuing operating within this band. However, the other point to
point links users would agree to migrate to other bands: 5GHz, 7GHz and 8GHz. From year 2021
onwards, there would be no migration barriers since 100% of the current licenses would be expired.
The following figure briefly shows the findings of the ANE´s study regarding the compatibility between
current services and IMT
Figure 39: Compatibility L-band current services and IMT MHz
Source: Agencia Nacional de Espectro
Additionally, it is worth mentioning that the range 1427-1518MHz is fully compatible with the industry
initiatives aimed at implementing Supplemental Downlink in 1452-1492MHz.
The identification for IMT services would provide about 91MHz of bandwidth, allowing for the
specification of very wide carriers. This would improve networks performance, coming close to the
estimated needs of data traffic.
Position regarding future use of the L-band
It would feasible to identify the L-band for the provision of IMT services, and the administration would
presumably propose this band for its identification to IMT.
1390 1399 1400 1425 1426 1427 1491 1492 1517 1518 1524 1525 1534 1535 1552 1559 1568 1569 1599 1600
Radioastronomy
Radiolocation
Exploration
Satellite
Space research
Space operation
Fixed
Aeronautical
Radionavigation
Radionavigation
Satellite
Mobile
Mobile Satellite
IMT Compatibility
Allocation on a primary basis
Allocation on a secondary basis
Possible compatibility with IMT

64
As a matter of fact, the ANE has already conducted a preliminary assessment on the compatibility
with IMT services provision in this band and the involved migration costs.
Ecuador
Frequency allocation and IMT services
Current allocation
The telecommunications sector in Ecuador is ruled by the Special Telecommunications Law enacted
in August 1992 together with its subsequent reforms. The Ministry of Telecommunications and of
Society Information (Mintel), the National Telecommunications Council (CONATEL) and the National
Telecommunications Secretary (SENATEL) are the main public agencies responsible for the sector
regulation and for the spectrum management and planning.
The National Telecommunications Council (CONATEL), in exercise of its authority set out in the
Special Telecommunications Reform Law, has approved58 the reforms and updates of the National
Frequencies Plan (NFP) of September 2008.
The figure below shows the services allocations in the currently assigned IMT bands.
Figure 40: Services allocation in bands mostly used for IMT in Ecuador
Source: CNAF - CONATEL
58 Resolution No.TEL-391-15-CONATEL-2012 of July 2012
850MHz band 1900MHz band
MOBILE
FIXED
FIX
ED
MO
BIL
E
698
MH
z
806
MH
z
894
MH
z
FIX
ED
MO
BIL
E
171
0 M
Hz
202
5 M
Hz

65
Figure 41: Services allocation in bands mostly used for IMT in Ecuador (Cont.)
Source: CNAF - CONATEL
IMT assignments
Mobile telecommunication operators providing services in Ecuador are CONECEL SA (CLARO)
OTECEL (MOVISTAR) and CNT. Ecuador has 180 MHz of IMT spectrum currently assigned. The
following figure shows the spectrum holdings per operator and the market structure.
Figure 42: Mobile market structure and spectrum holding in Ecuador
Source: SENATEL
CLARO and MOVISTAR operate only in the bands 850MHz and 1900MHz, holding each one a total
of 35MHz. CLARO is the operator with the highest penetration with almost 70%, followed by
MOVISTAR, and finally, by the state owned company, CNT.
700MHz band AWS band
FIX
ED
MO
BIL
E
698 M
Hz
806 M
Hz
MOBILE
FIXED
1710 M
Hz
2025 M
Hz
FIX
ED
MO
BIL
E
2100 M
Hz
2200 M
Hz
3025 25
40
10 10
40
Claro Movistar CNT EP
850MHz
700MHz
AWS
Spectrum holdings per operator (MHz)
• CLARO y MOVISTAR operate only in the 850MHz and 1900MHz bands
• CLARO is the operator with the highest penetration, with nearly 70% market share
1900MHz
69%
29%
2%
Mobile telecommunication market share

66
Mobile telecommunication bands should be assigned to the private operators by auction, procedure
known as Competitive Process. However, the radio spectrum for LTE services was assigned directly
to CNT, a public owned operator (in December 2012, the government assigned 70MHz of spectrum
- 30MHz in 700MHz band and 40MHz in AWS – to CNT). In addition, the spectrum cap per operator
is 65MHz; nevertheless this cap does not apply to state-owned operators.
Regarding the economic compensation for the licenses, the conditions included in last spectrum
renewal (2008) were:
- a fixed value for the renewal
- a monthly fee called ‘Tarifa A’, calculated according to the number of radio stations and
bandwidth as well as a payment per active customer
- a variable payment on the operator gross revenues (2.93%)
Regarding the number deployed base stations, Claro has almost 4,800 whilst Movistar around 3,000,
including in both cases GSM 850, GSM 1900 and UMT 850 technologies. In the case of CNT, it has
roughly 1,050 base stations with CDMA, UMTS 1900, LTE and LTE AWS 700 technologies.
In February 2013, Ecuador became the fourth country in Latin America (after Colombia, Chile and
Mexico) to adopt the APT band plan for the implementation of LTE technology in the 700 MHz band,
known as the Digital Dividend. However, this spectrum is still occupied by broadcasting systems and
will be released once the TV switch over is completed (analogue switch off commenced in 2010 and
should be completed by 2017, with a potential period extension to 2021).
IMT roadmap and new bands under study
Ecuador has a national broadband plan aimed at having at least 75% of the total population
connected by 2017. In order to meet the objectives outlined in this plan, the Ministry of
Telecommunications would have to ally with mobile operators to cover remote areas and hence more
IMT spectrum assignments are expected.
L-band frequencies (1350-1525 MHz)
Current allocation
The range of frequencies 1350-1400 and 1427-1518 MHz were considered for this study. The figure
below shows the current frequency allocation for different services in the band under analysis.

67
Figure 43: L-band´s services allocation in Ecuador
Source: SENATEL
The figure above shows that most of the band, 98 MHz (1427-1525MHz) is allocated to fixed services,
with no allocation to mobile service. The range between 1350-1400MHz follows the international trend
of radiolocation allocation.
Assignments and actual use
The band is being mostly used for national radio links of land fixe service, as detailed in the figure
below.
Figure 44: L-band current usage in Ecuador
Source: SENATEL
As shown in the figure above, the frequency range between 1350-1400MHz is not used, and the rest
of the band is being used by radio electronic links from fixed services. Note that these licences have
• Most of the band, 98MHz
(1427 - 1525MHz) is
allocated a fixed services
• There is no mobile service
allocation in the band
• Radio spectral range
between 1350 - 1400MHz
follows the international
trend of radiolocation
allocation
Frequency band (MHz) Current use
1350-1400 None
1427-1429 Radio electronic links of land fixed service
1429-1452 Radio electronic links of land fixed service
1452-1492 Radio electronic links of land fixed service
1492-1518 Radio electronic links of land fixed service
1518-1525 Radio electronic links of land fixed service and mobile satellite

68
a 5-year timeframe. The L-band links are used mainly by carriers and private and state-owned
companies.
There are approximately 650 links in the L-band. In the satellite mobile service there is a satellite
broadcaster operator with around 200 subscribers.
Potential migration
The following figure shows the plans for the L-band as informed by Senatel.
Source: SENATEL
In brief SENATEL is assessing the identification of almost the entire L-band for IMT, just excluding
the portion 1518-1525MHz.
Position regarding future use of the L-band
According to the answer submitted by the delegation of Ecuador to the decision CCP.II / DEC. 162
(XXII-13)59, the possibility of identifying the band for IMT is under analysis, and the administration will
presumable proposed such identification.
59 Information request on current and planned uses of the bands 1350 - 1524MHz and y 1427 – 1524MHZ for satellite and land services to be submitted by OEA/CITEL administrations
Frequency band (MHz) Plans
1350-1400 The possibility of identifying this frequency range for IMT services is being analyzed
1427-1429 The possibility of identifying this frequency range for IMT services is being analyzed
1429-1452 The possibility of identifying this frequency range for IMT services is being analyzed
1452-1492 The possibility of identifying this frequency range for IMT services is being analyzed
1492-1518 The possibility of identifying this frequency range for IMT services is being analyzed
1518-1525 None

69
Uruguay
Frequency allocation chart and IMT services
Current allocation
In Uruguay, the ‘Unidad Reguladora de Servicios de Comunicaciones’ (URSEC) is the responsible
entity for the management and planning of radio spectrum.
The next figure shows the services allocation in the already assigned IMT bands.
Figure 45: Services allocation in bands mostly used for IMT in Uruguay
Source: URSEC
The 850MHz, 1900MHz and AWS bands are used for IMT services. Spectrum in those bands has
been awarded in different processes, having the first one occurred in 2002, when, as per Resolution
No. 490, the provision of mobile telecommunications services was licensed for a 20 years period.
Subsequent assignations have taken place in 2004 and 2013, in both cases also for a 20 years period.
So far 310MHz are identified for IMT, accounting only for 16%-23% of the total spectrum requirements
as estimated by ITU (Report ITU-R M.2290-0).
IMT assignments
The following figure shows the spectrum holdings in Uruguay.
Figure 46: IMT spectrum holdings in Uruguay
850MHz band 1900MHz band
Radio amateurs
Broadcasting
Fixed
Mobile
RadiolocationMobile (except aeronautical)
Fixed
Mobile
Mobile satellite
2.1GHz band
FixedMobile Mobile satellite
Earth exploration satelliteSpace operation
Space research

70
* Extended AWS Source: URSEC, Dinatel
As shown, 270MHz have been assigned for the provision of IMT services. Whilst all the assignments
to private operators have been awarded through auctions, Antel, the state-owned operator, has been
directly awarded 115MHz. Taking into account that the licences have a period of 20 years, the
expiration of those licenses will take place in 2022, 2024 and 2033 respectively, having no precedents
for renewals.
There are around 700 base stations deployed by each operator in the country, totalling approximately
2,000 nationwide. Co-location ratio is low (below 20% of the installed base stations). Finally, the
economic compensation is an up-front payment at commencing the license with no additional fees or
annual payments.
The mobile market includes 5.3 million subscribers and the penetration reaches 155%. The following
figure shows the evolution of the mobile market.
Figure 47: Mobile market evolution of Uruguay
Source: URSEC, World Bank
Digital
dividend
850
MHz
900
MHz
1800
MHz
1900
MHzAWS 2,1 GHz 2.5GHz Total
- - - - 50 20 - 70
- 25 - - 60 - - 85
- 25 10 30 - 40 10 - 115
Non-
assigned90 - 10 - 10 30* - 190 330
• Last assignation
took place in March
2013
• Antel holds 43% of
the assigned
spectrum, followed
by Movistar (31%)
and Claro (26%)
• Digital dividend and
2.5 GHz bands still
to be assigned
Mobile services clients evolution Penetration
3,03,5
4,14,4
4,85,0
5,3
2007 2008 2009 2010 2011 2012 2013
90105
122132
141 147155
2007 2008 2009 2010 2011 2012 2013
Million % (subscribers / population)

71
The mobile market has three operators Antel (state-owned company), Movistar and Claro, with one
of them (Antel) concentrating more than 50% of the total market, followed by Movistar with 35%
market share and Claro with 16% market share.
Finally, as for new assignments, the Uruguayan government has already announced its decision to
bid additional spectrum in the digital dividend band (700MHz). However, so far there is no detailed
information about the plan.
IMT roadmap and new bands under study
Currently no new bands are being assessed by URSEC for the provision of IMT services.
Current allocation
The analysis of the L-band in Uruguay involves the 1350-1400MHz and 1427-1525MHz ranges. The
first range (i.e. 1350-1400MHz) has been allocated to radiolocation services. On the other hand, the
frequencies 1427-1429MHz have been allocated to space operation, fixed and mobile (except
aeronautical); the frequencies 1429-1525MHz has been allocated to fixed and mobile services, note
that frequencies 1452-1492MHz are also allocated to broadcasting and broadcasting-satellite
services and that the range going from 1492-1525 MHz is also allocated to mobile satellite services.
The following figure shows the services allocation in the L-band.
Figure 48: L-band´s services allocation
Source: URSEC
• A portion of the L-band
(1427-1525MHz) is
allocated to mobile
services
Fixed
MobileMobile satellite
Space operationSpace research
Earth exploration satellite
Mobile (except aeronautical)
Aeronautical radionavigation
Broadcasting
Radiolocation
Radioastronomy
Broadcasting satellite

72
The figure shows that mobile services are already included in the current services allocation of the L-
band (1427-1429MHz, 1429-1452MHz, 1452-1492MHz and 1492-1525MHz).
The band 1350-1400MHz is allocated to the radiolocation service while the band 1400-1427MHz are
reserved, as internationally recommended, to the following services: earth exploration-satellite,
radioastronomy and space research, and therefore cannot be identified for the provision of IMT
services.
Assignments and actual use
The utilization of the L-band is low, just used by private and government stakeholders for low capacity
point-to-point links (lower than 2 Mbps or 4 Mbps) in the range 1427-1525MHz. Although no in-depth
analysis of the actual usage of the band has been conducted it is estimated that the number of
incumbents is less than ten.
The assignments have occured during the 90s, under a FIFO (first in - first out) scheme and with no
expiration date. Nevertheless, these assignments have been awarded on revocable basis, having the
government the alternative to terminate these licenses at any time.
Finally, as for the economic compensation, it consists of a monthly payment based on the total
spectrum holding. The structure and calculation method for the fees date from 1993, having its prices
been updated but not its structure.
Potential migration
No relevant barriers to migrate have been identified. Nevertheless, once considered the technological
obsolescence of the installed equipment, it can be expected that the incumbents would voluntarily
migrate to other technological solutions in a non-distant future.
Position regarding future use of the L-band
Neither operational nor economic barriers were identified to use the L-band for the provision of IMT
services.
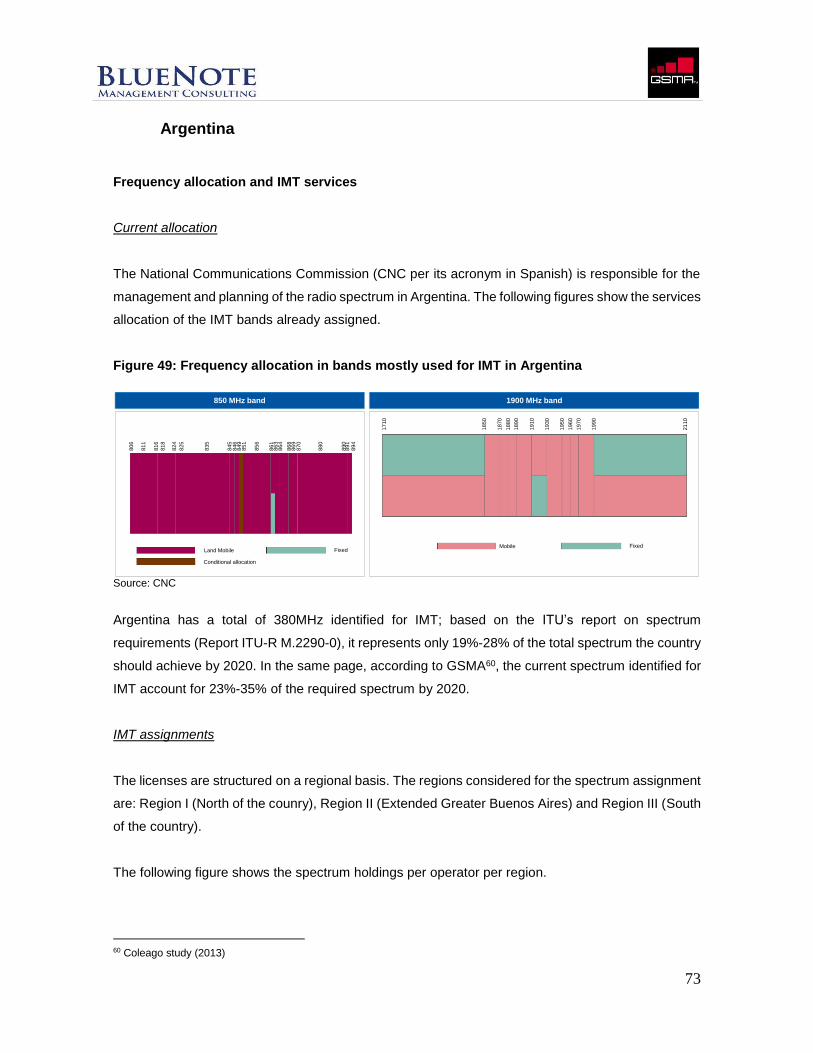
73
Argentina
Frequency allocation and IMT services
Current allocation
The National Communications Commission (CNC per its acronym in Spanish) is responsible for the
management and planning of the radio spectrum in Argentina. The following figures show the services
allocation of the IMT bands already assigned.
Figure 49: Frequency allocation in bands mostly used for IMT in Argentina
Source: CNC
Argentina has a total of 380MHz identified for IMT; based on the ITU’s report on spectrum
requirements (Report ITU-R M.2290-0), it represents only 19%-28% of the total spectrum the country
should achieve by 2020. In the same page, according to GSMA60, the current spectrum identified for
IMT account for 23%-35% of the required spectrum by 2020.
IMT assignments
The licenses are structured on a regional basis. The regions considered for the spectrum assignment
are: Region I (North of the counry), Region II (Extended Greater Buenos Aires) and Region III (South
of the country).
The following figure shows the spectrum holdings per operator per region.
60 Coleago study (2013)
850 MHz band
Land Mobile
Conditional allocation
Fixed
806
811
816
818
824
825
835
845
846
849
851
856
861
863
864
868
869
870
880
890
891
894
1900 MHz band
Mobile Fixed
1710
1850
1870
1880
1890
1910
1930
1950
1960
1970
1990
2110

74
Figure 50: IMT spectrum holdings in Argentina MHz
Source: CNC
The entire spectrum in the 850MHz and 1900MHz bands has been assigned, totalling 170MHz per
region (50MHz in the 850 MHz and 120 MHz in the 1900 MHz band).
The last spectrum auction in Argentina was held in the year 1999. In 2012, the government called for
a new auction in order to award the remaining spectrum from Movistar acquisition of Movicom, as
he had surpassed the 50 MHz per region spectrum cap. However, the auction was cancelled and the
spectrum assigned to ARSAT. Today, Argentina is one of the countries with less spectrum assigned
for IMT services. However, in mid-2014 the government announced a new auction to be held by the
end of 2014, in order to promote the deployment of LTE technologies and increase the current
available radio spectrum. The auction process has already started and the following frequencies are
included: 698-806 MHz (700MHz band) and 1710-1770MHz paired with 2110-2170MHz (AWS band),
having the spectrum cap per region been set at 60 MHz for the advanced wireless services (LTE).
Figure 51: Mobile market evolution and structure in Argentina
Source: Merrill Lynch Global Wireless Matrix 2Q 2014
Non –
assignedTotal
850MHZ
I - 25 25 - - 50
II 30 - 12,50 7,50 - 50
III 25 25 - - - 50
1900MHz
I 50 20 20 30 - 120
II 20 40 30 30 - 120
III 25 20 40 35 - 120
• The spectrum in the
850MHz and
1900MHz have
mostly been
assigned in the three
regions
• The three incumbent
private operators
have similar
spectrum holdings in
the three regions
Region
39 44 48 52 55 58 62
99%111%
122%129%
137% 141%151%
0%
20%
40%
60%
80%
100%
120%
140%
160%
0
20
40
60
80
2007 2008 2009 2010 2011 2012 2013
Mobile telecommunication services evolution
Mobile penetration
Numbers of subscribers (million)
• The mobile penetration has climbed from 99% un 2007 to 151% in 2014
• The Argentine market shows an evenly split market with three payers
34%
33%
33%
Mobile telecommunications market share (2013)

75
The mobile market has been growing at an 8.4% compound annual growth rate, having in 2008
surpassed the 100% penetration rate. Three players evenly share the market, having approximately
20 million subscribers each.
IMT Roadmap and new bands under study
Argentina shows a significant IMT spectrum shortfall, which is expected to be counteracted with the
forthcoming 4G auction. In this context and considering that Argentina is one of the few countries with
no spectrum assigned to 4G services, it is expected a focus on the 4G bands rather than already
assessing new IMT bands.
For the time being, the regulator has not formally provided definitive information with regards to the
assessment of new bands for the provision of IMT services.
Current allocation
In Argentina, the L- ranges from the 1350MHz to 1525MHz. The CNC has allocated 1350-1400 MHz,
in accordance with international guidelines, to radiolocation services. The following figure shows the
radio spectrum allocation for the L-band in Argentina.
Figure 52: L-band´s services allocation in Argentina MHz
Source: CNC
Radiolocation
Fixed
Earth exploration satellite
Radioastronomy
Space research
Coditional allocation
• The L-band has no
mobile services
allocation
• The 1427-1525MHz is
almost fully allocated
to fixed services
13
50
14
00
14
27
14
71
14
81
15
25

76
Note that the L-band has no allocation to mobile services whilst the range 1427-1525MHz is almost
fully allocated to fixed services.
Assignments and actual use
The National Frequency Allocation Chart61 show that ranges 1427-1471MHz and 1481-1525MHz are
used by digital multichannel systems62 (MXD).
The authorization to operate digital multichannel systems has no expiration date and remains in effect
while complying with the provisions of the regulation. On the other hand, when assigned to providers
of telecommunications services, these licenses have a 10 years period.
Potential migrations
There is no formal evidence of relevant barriers to migrate.
Position regarding future use of the L-band
The regulator has not yet formally submitted an answer.
Dominican Republic
Frequency allocation and IMT services
Current allocation
The Dominican Republic has 710MHz identified for IMT services on a primary basis.
When compared to other LAC countries, Dominican Republican has a relatively high amount of
spectrum identified for IMT. However, it is still below the ITU estimates for 2020; accounting for 36%-
53% of those estimates.
The following figure shows the bands identified for IMT in the Dominican Republic.
61 As set on ‘Disposición GI Nº 734/04’ 62 As per resolutions Nº 2860 CNT/92 and Nº 228 CNT/94

77
Figure 53: Bands identified for IMT in the Dominican Republic
Source: INDOTEL
The 700MHz band will be effective once the switch over to Digital Terrestrial Television (DTT) is
completed.
IMT assignments
The total spectrum currently assigned to mobile services operators in Dominican Republic are
450MHz: 50MHz in the 850MHz band, 40MHz in the 900MHz band, 40MHz in the 1700/2100MHz
band, 120MHz in the 1900MHz band and 900MHz in the 2500MHz band.
At the moment, there is no certain date for new assignments. However, there are still 50MHz in AWS
band available for future assignments.
As for economic compensation for the use of radio spectrum, as established by the General
Telecommunications Law No. 153-98, the use of spectrum will be taxed at an annual fee and its
calculation methodology is set out in the General Regulations of Radio Spectrum Use, approved by
Resolution No. 128-04
The mobile services market in Dominican Republic has grown at an 8.9% compound growth rate
since 2003, reaching a penetration of almost 90% in 2013.
Band (MHz)Mobile spectrum
2011 (MHz)
Mobile spectrum
2002 (MHz)

78
Figure 54: Evolution and structure of the mobile market in the Dom. Republic
Source: Indotel statistics, World Bank, Pyramid Research
The Dominican Republic market shows a dominant player, Claro, accounting for more than 50% of
the market. Orange has 35% of market share and Viva and Tricom share the remaining 14%.
IMT roadmap and new bands under study
The Dominican Republic has not defined yet its final position for the next World Radio communication
Conference (WRC) to be held 2015, partly because the INDOTEL is still participating in the cycle of
meetings of the Permanent Consultative Committee II (CCP.II) of CITEL, where the topic is being
assessed.
Current allocation
For Dominican Republic it was considered the ranges 1300-1400MHz and 1427-1525MHz as scope
of this study. The figure below shows the services allocation in the band under analysis.
2,1 2,53,6
4,65,5
7,28,6 8,9 8,8 8,9 9,2
23%28%
39%
49%
57%
74%
87% 89% 86% 87% 88%
20%
30%
40%
50%
60%
70%
80%
90%
0
12
2003 2004 2005 2006 2007 2008 2009 2010 2011 2012 2013
Mobile telecommunication services evolution
Mobile penetration
Numbers of suscriptors (milliom)
• Mobile subscribers have grown at a 8,9% compound annual growth rate in the period 2003 to 2013, climbing
from 23% penetration in 2003 to 88% in 2013
• The Dominican market has a dominant player, Claro, that accounts for more than half of the total subscribers
51%35%
9%
5%
Mobile telecommunications market share (2012)

79
Figure 55: L-band´s services allocation in the Dominican Republic
Source: INDOTEL
Most of the band under analysis, 98MHz in the range 1427-1525MHz, is allocated to fixed and mobile
services on a primary basis (shared with other services).The band 1350-1400MHz follows the
international trend of radiolocation and aeronautical radionavigation, but shared with fixed services
(on a secondary basis)
As for economic compensation for the use of spectrum in L-band, the terms and conditions are
established in the General Telecommunications Law. The L-band is assigned following the same
methodology as for the other services.
Actual use and potential migrations
A significant part of the L-band has been assigned and is being used; there are more than 130
licenses in the 1300-1525MHz range. There are 12 users including public agencies, religious
organizations and other stakeholders, accounting for approximately 100 links. The most relevant use
of this band is for aeronautic radionavigation and point-to-point links.
Position regarding future use of the L-band
There is no plan to modify the allocation to the L-band nor to migrate the current users out of this
band.
• Most of the band, 98MHz, is
allocated to fixed and mobile
services on a primary basis
(shared with other services)
• The range 1300-1400MHz
follows the international trend
of radiolocation but shared
with fixed services (on a
secondary basis)
RA
DIO
LO
CA
TIO
NF
ixe
d
MO
BIL
ES
PA
CE
OP
ER
AT
ION
FIX
ED
MO
BIL
EF
IXE
D
MOBILE
MOBILE
SATTELLITE
FIXEDMO
BIL
EF
IXE
DR
AD
IOL
OC
AT
ION
RA
DIO
LO
CA
TIO
N
SA
TE
LL
ITE
Rad
iolo
ca
tio
nF
ixed
AE
RO
NA
UT
ICA
L
RA
DIO
NA
VIG
AT
ION

80
VI. Bibliography
- GSMA, “Alternative use value of 700 MHz in Region 1”, a report prepared by PLUM, (2013)
- GSMA, “Economic benefits from making the 2.7-2.9GHz band available for mobile broadband services in Western Europe”, report prepared by AETHA, (2013)
- GSMA, “Revised spectrum forecasts using the new spectrum model”, a report prepared by
Coleago, (2013)
- GSMA, “Economic assessment of C-band re-allocation”, a report prepared by Frontier Economics, (2013)
- Varian Hal R., “Microeconomic Analysis”, third edition, (1992)
- 3GPP, “Active work programme – Feature list of release 10”, (2014)
- 4G Americas, “LTE Deployment Status”, (2014)
- CEPT, “Report 188: Future Harmonised Use of 1492 - 1492MHz in CEPT”, (2013)
- Ericsson, “Orange, Ericsson and Qualcomm have successfully completed the world's first live
demonstration of supplemental downlink technology on L-band frequencies”, (2013)
- GSMA, “Compatibility/sharing studies between IMT and radar in 1300-1400 and 2700-2900 MHz”, (2014)
- ITU, Radio Regulations Vol I, (2012)
- ITU, Radio Regulations Vol III – Resolutions, (2012)
- ITU, Resolution 750 (Rev. WRC-12), (2012)
- ITU, Recommendation ITU-R M.1036-4, (2013)
- ITU, Report ITU-R M.2290-0: Future spectrum requirements estimate for terrestrial IMT,
(2013)
- Ericsson, Traffic exploration (Latam), (June 2014)
- CISCO, VNI Mobile Forecast Highlights, (2013-2018)
- Marine Satellite Systems, “Satellite Frequency Bands”, (2010)
- QUALCOMM, “Supplemental Downlink”, (2013)
- Instituto Federal de telecomunicaciones (IFT), “El espectro radioeléctrico en México. Estudio y acciones”, (2013)
- Instituto Federal de telecomunicaciones (IFT), “National Frequency Allocation Chart”, (2013)
- The Organisation for Economic Co-operation and Development (OECD), “Estudio sobre
políticas y regulación de telecomunicaciones en México”, (2012)

81
- P2!R_3541 presented by Mexico’s delegation in reply to the decision CCP.II 162 (XXII-13).
Request of information regarding current and future use of the 1350 – 1400 MHz y 1427 – 1524 MHZ bands, (2014)
- Ministerio de tecnologías de la información y las comunicaciones (MINTIC), “National
Frequency Allocation Chart”
- Agencia Nacional del Espectro (ANE), “Estudio técnico y económico de las bandas de frecuencias identificadas para IMT según el reglamento de radio de la UIT edición del 2012 y que aún no han sido usadas para implementación de este tipo de sistemas en Colombia, así como de las nuevas bandas de frecuencia que se encuentren en análisis por parte de los grupos de estudio de la UIT dentro del marco del punto 1.1 de la agenda para Conferencia Mundial de Radiocomunicaciones del 2015 (CMR-15)”, (2014)
- Bank of America Merril Lynch, Global Wireless matrix 2Q2014
- Consejo Nacional de Telecomunicaciones (CONATEL), “National Frequency Allocation
Chart”, (2012)
- P2!R_3549 presented by Ecuador’s delegation in reply to the decision CCP.II 162 (XXII-13). Request of information regarding current and future use of the 1350 – 1400 MHz y 1427 – 1524 MHZ bands, (2014)
- Comisión de Regulación de Telecomunicaciones (CRT), Estudios de Elasticidades en
servicios de telecomunicaciones, República de Colombia (2005)
- The World Bank Latin American and the Caribbean Region, The Social Discount Rate: Estimates for Nine Latin American Countries (2008)
- KPMG International, Latin America Indirect Tax Country Guide (2012)
- ARHCIET y Deloitte, Tributación y Telecomunicaciones en Latinoamérica (2013)
- Telecom Advisory Services, Dividendo Digital (banda de 700MHz) en América Latina, Raúl
Katz y Ernesto Flores-Roux (2011)
- Katz, R. and Berry, T., Driving demand for broadband networks and services (2014)
- GSMA Intelligence, Reportes de información por país (2014)
- 4G Américas, Análisis de las Recomendaciones de la UIT sobre el espectro en la Región
América Latina-Agosto 2013 (2013)
- ITU, Impact of Broadband on the economy - Broadband series (April 2012)
- United Nations, Department of Economic and Social Affairs, Population Division (2013)
- Nokia Siemens Networks, Mobile broadband with HSPA and LTE - capacity and cost aspects.
- 3GPP, documento TR 25.912 (UTRA Baseline) - Regulators websites: SUPERTEL, SENATEL, ANATEL, URSEC, CNC, CRC, COFETEL
(IFT), ACMA, OPTA, INODETEL, FCC

82
- ANATEL, “Annual Report”, (2013)
- GSMA, “License Renewal in Latin América”, (2014)