Embed Size (px)
Citation preview
Nat. Hazards Earth Syst. Sci., 16, 103–122, 2016
www.nat-hazards-earth-syst-sci.net/16/103/2016/
doi:10.5194/nhess-16-103-2016
© Author(s) 2016. CC Attribution 3.0 License.
Assessing the performance of regional landslide
early warning models: the EDuMaP method
M. Calvello and L. Piciullo
Department of Civil Engineering, University of Salerno, Fisciano, Italy
Correspondence to: L. Piciullo ([email protected])
Received: 11 September 2015 – Published in Nat. Hazards Earth Syst. Sci. Discuss.: 8 October 2015
Revised: 14 December 2015 – Accepted: 22 December 2015 – Published: 18 January 2016
Abstract. A schematic of the components of regional early
warning systems for rainfall-induced landslides is herein pro-
posed, based on a clear distinction between warning mod-
els and warning systems. According to this framework an
early warning system comprises a warning model as well as
a monitoring and warning strategy, a communication strat-
egy and an emergency plan. The paper proposes the evalu-
ation of regional landslide warning models by means of an
original approach, called the “event, duration matrix, per-
formance” (EDuMaP) method, comprising three successive
steps: identification and analysis of the events, i.e., landslide
events and warning events derived from available landslides
and warnings databases; definition and computation of a du-
ration matrix, whose elements report the time associated with
the occurrence of landslide events in relation to the occur-
rence of warning events, in their respective classes; evalua-
tion of the early warning model performance by means of
performance criteria and indicators applied to the duration
matrix. During the first step the analyst identifies and clas-
sifies the landslide and warning events, according to their
spatial and temporal characteristics, by means of a number
of model parameters. In the second step, the analyst com-
putes a time-based duration matrix with a number of rows
and columns equal to the number of classes defined for the
warning and landslide events, respectively. In the third step,
the analyst computes a series of model performance indica-
tors derived from a set of performance criteria, which need
to be defined by considering, once again, the features of the
warning model. The applicability, potentialities and limita-
tions of the EDuMaP method are tested and discussed using
real landslides and warning data from the municipal early
warning system operating in Rio de Janeiro (Brazil).
1 Introduction
In generic terms, early warning constitutes a process
whereby information generated from tailored observations of
natural phenomena is provided to communities at risk, or to
institutions which are involved in emergency response oper-
ations, so that certain tasks may be executed before a catas-
trophic event impacts such communities (Villagrán de León
et al., 2013). Landslide early warning systems (LEWSs)
mitigate the risk to life associated with the occurrence of
landslides by temporarily removing people – i.e., the ele-
ments at risk – from hazardous areas whenever landslide risk
is considered to be unacceptable. According to Glade and
Nadim (2014), the installation of an early warning system is
often a cost-effective risk mitigation measure and in some
instances the only suitable option for sustainable manage-
ment of disaster risks. Within the landslide risk management
framework proposed by Fell et al. (2005), landslide early
warning systems may be considered a non-structural passive
mitigation option to be employed in areas where risk, occa-
sionally, rises above previously defined acceptability levels.
In the “priority for action 2” established by the Hyogo
Framework for Action – i.e., identify, assess and monitor dis-
aster risks and enhance early warning – the following key
activity is identified: establish institutional capacities to en-
sure that early warning systems are subject to regular sys-
tem testing and performance assessments (Hyogo Frame-
work for Action, 2005). Despite the fact that the scientific
literature reports many studies on landslide early warning
systems, either addressing a single landslide at slope scale
(Lollino et al., 2002; Blikra, 2008; Intrieri et al., 2012;
Michoud et al., 2013; Thiebes et al., 2013a; among oth-
ers) or concurrent phenomena in areas of relevant extension
at municipal/regional/national scale (NOAA-USGS (2005),
Published by Copernicus Publications on behalf of the European Geosciences Union.
104 M. Calvello and L. Piciullo: Performance of regional landslide early warning models: the EDuMaP method
Martelloni et al. (2012), Calvello et al. (2015a, b), Stähli
et al. (2015), Segoni et al. (2015), among others), no stan-
dard requirements exist for assessing their performance. To
this aim, many questions need to be addressed, among which
are the following: how are data of registered landslides and
warnings used to check on the performance of early warn-
ing models? How are model errors quantified? How are false
alerts (FAs) and missed alerts (MAs) defined when the warn-
ing model includes more than two warning levels? What are
the most relevant model performance indicators? All the pre-
vious questions may be summed up; how should model val-
idation be performed by LEWSs managers? The answer to
this question is not trivial, despite what it may seem at first
sight.
The performance quantification issue is often overlooked,
both by system managers and by researchers dealing with
warning models for LEWSs. For instance, the main focus
of researchers dealing with warning systems for rainfall-
induced landslides at regional scale, which are typically
based on empirical rainfall thresholds (Guzzetti et al. (2007)
and references therein), is on improving the correlation be-
tween rainfall indicators and landslides. However, literature
studies rarely back analyze the relationship between warn-
ings, which would have been issued adopting those corre-
lations, and landslides. Especially for LEWSs operating at
regional scale (ReLEWSs), empirical evaluations are often
carried out by simply analyzing the time frames during which
significant high-consequence landslides occurred in the test
area (Keefer et al., 1987; Baum and Godt, 2010; Capparelli
and Tiranti, 2010; Aleotti, 2004). Alternatively, the perfor-
mance evaluation is based on 2 by 2 contingency tables com-
puted for the joint frequency distribution of landslides and
alerts, both considered as dichotomous variables (Yu et al.,
2003; Cheung et al., 2006; Godt et al., 2006; Restrepo et
al., 2008; Tiranti and Rabuffetti, 2010; Kirschbaum et al.,
2012; Martelloni et al., 2012; Peres and Cancelliere, 2012;
Staley et al., 2013; Lagomarsino et al., 2013, 2015; Greco
et al., 2013; Segoni et al., 2014; Gariano et al., 2015; Stähli
et al., 2015). The four elements of these tables – i.e., cor-
rect alerts (CAs) or true positives; missed alerts, false nega-
tives or type II errors; false alerts, false positives or type I er-
rors; true negatives (TNs) – are then used to assess the weight
of the correct predictions in relation to the model errors by
means of a series of statistical indicators of the model perfor-
mance. In all these cases, however, model performance is as-
sessed, neglecting some important aspects that are peculiar to
ReLEWSs, such as the possible occurrence of multiple land-
slides in the warning zone, the duration of the warnings in
relation to the time of occurrence of the landslides, the level
of the issued warning in relation to the landslide spatial den-
sity in the warning zone and the relative importance system
managers attribute to different types of errors.
This paper proposes a methodology in which the analyst
is able to explicitly consider all the above-mentioned as-
pects for the performance assessment of a landslide regional
warning model to be employed within a ReLEWS. The orig-
inal approach, called the “event, duration matrix, perfor-
mance (EDuMaP) method, comprises three successive steps:
definition and temporal analysis of warning events (WE) and
landslide events (LE), computation of a duration matrix and
evaluation of the warning model performance. The key ele-
ment of the EDuMaP method is the definition and compu-
tation of a duration matrix, whose elements report the time
associated with the occurrence of landslide events in rela-
tion to the occurrence of warning events, in their respective
classes. The applicability of the EDuMaP method is tested
and discussed using both synthetic data and real landslides
and warnings data from the municipal early warning system
operating in Rio de Janeiro (Brazil).
2 Landslide early warning systems
2.1 Regional systems for rainfall-induced landslides
Warning systems for landslides can be designed and used at
different reference scales. Two categories of LEWSs can be
defined on the basis of their scale of analysis and operation:
“local” systems and “regional” systems (International Cen-
tre of Geohazards, 2012; Thiebes et al., 2012; Calvello et
al., 2015b). ReLEWSs are used to assess the probability of
occurrence of landslides over appropriately defined homo-
geneous alert zones of relevant extension, typically through
the prediction and monitoring of meteorological variables,
in order to give generalized warnings to the population. Dif-
ferently, the main aim of local landslide warning systems is
the temporary evacuation of people from areas where, at spe-
cific times, the risk level to which they are exposed is con-
sidered to be intolerably high. The scale inevitably also in-
fluences the stakeholders involved, the data to be used, the
type of forecasting, the emergency phases, the communica-
tion strategies and many other activities necessary for design-
ing and operating such systems.
The literature presents many examples of landslide early
warning systems operating at local scale (Lollino et al.,
2002; Blikra, 2008; Intrieri et al., 2012; Thiebes et al.,
2013b; among others), while the scientific references to
regional warning systems are much rarer (Wilson (2004),
NOAA-USGS (2005), Lagomarsino et al. (2013), Calvello et
al. (2015b), Stähli et al. (2015) and references therein). The
characteristics of landslide warning systems at local scale are
strongly affected by numerous constraints and factors, from
time to time different, related to the characteristics of the
boundary value problem to address. An interesting contri-
bution aiming at providing guidance for the design of such
systems is proposed by the International Centre of Geohaz-
ards (2012), wherein the authors deal with the technical and
practical issues related to monitoring and early warning for
landslides and identify the best technologies available in the
context of both hazard assessment and system design. Con-
Nat. Hazards Earth Syst. Sci., 16, 103–122, 2016 www.nat-hazards-earth-syst-sci.net/16/103/2016/
M. Calvello and L. Piciullo: Performance of regional landslide early warning models: the EDuMaP method 105
cerning regional warning systems, a few examples of systems
for rainfall-induced landslides currently operating around the
world are presented in the following.
In the USA, the US Geological Survey has long been
working on ReLEWSs in a number of states: California, Col-
orado, Oregon and Washington (Chleborad, 2000; Chleb-
orad et al., 2008; Baum and Godt, 2010; NOAA-USGS,
2005; Cannon et al., 2011). The state of knowledge and re-
sources available to issue alerts of precipitation-induced shal-
low, rapidly moving landslides and debris flows vary across
the USA; for instance, in the city of Seattle, WA, the alert sys-
tem includes four levels – Null, Outlook, Watch and Alarm
– and warnings are based on the measured or expected ex-
ceedance of cumulated rainfall and intensity-duration thresh-
olds combined with criteria using monitored soil moisture
(Godt et al., 2006). In Hong Kong (Chan and Pun, 2004;
Cheung et al., 2006; http://www.weather.gov.hk/wservice/
warning/landslip.htm), the correlation model between rain-
fall events and landslides is based on an increasing prob-
ability of landslide occurrence depending on the measured
rolling 24 h rainfall for four different types of man-made
slopes: soil cuts, rock cuts, fills and retaining structures. In
Japan, a nationwide early warning system for landslide dis-
asters was created by the government in 2005 (Osanai et al.,
2010); the occurrences of debris flows and slope failures are
related to several rainfall indices (e.g., 60′ cumulative rain-
fall, soil–water index), whose thresholds have been mainly
computed considering rainfall data recorded as not trigger-
ing disasters. In Brazil, the municipal system operating in
Rio de Janeiro (d’Orsi et al., 1997; d’Orsi, 2012; Calvello
et al., 2015a, b) issues two different co-existing alert sets,
rainfall warnings and landslide warnings; the landslide warn-
ings are based on the comparison between rainfall measured
by the monitoring stations and rainfall thresholds and they
are related to an expected spatial density of landslides. In
Europe, two national systems for rainfall-induced landslides
have been recently implemented: one in Norway, managed
by the Norwegian Water Resources and Energy Directorate
(Devoli et al., 2015), and the other in Italy, designed and op-
erated by the research center CNR-IRPI on behalf of the na-
tional civil protection (Rossi et al., 2012). The Norwegian
system is a national early warning system for landslides and
floods, with the aim of assisting road and railway authori-
ties, as well as local authorities and policy makers, in tak-
ing preventive measures before the occurrence of potentially
dangerous events. The Italian system, which is called SANF,
is based on sub-hourly rainfall measurements obtained by
a national network of 1950 rain gauges, quantitative rain-
fall forecasts and cumulated rainfall-duration rainfall thresh-
olds. Besides the national system, following a recent national
law written on this subject (DPCM, 2004), other relevant
experiences are also present in many Italian regions, such
as in Emilia Romagna (Berti et al., 2012; Lagomarsino et
al., 2013), Piemonte (Tiranti and Rabuffetti, 2010), Campa-
nia (DGR n. 299/2005), Toscana (DGR n. 895/2013, DGR
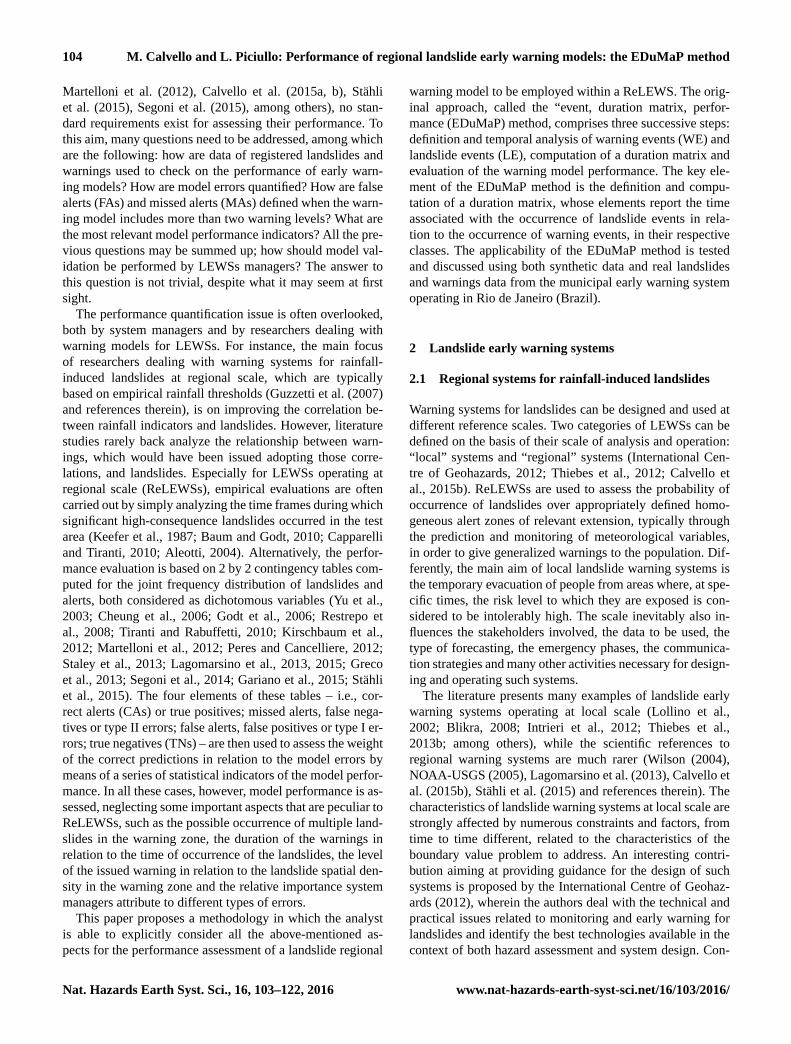
Figure 1. Scheme of the components of regional early warning sys-
tems for rainfall-induced landslides. Legend: RE is rainfall events;
LE is landslide events; WE is warning events; ReCoL is regional
correlation law; ReLWaM is regional landslide warning model;
ReLEWS is regional landslide early warning system.
n. 395/2015), Umbria (DGR n. 2312/2007) and Sicily (DPRS
n. 626/2014).
2.2 Early warning systems, warning models and
correlation laws
Di Biagio and Kjekstad (2007) use a block diagram to pro-
pose a schematic of the structure of landslide early warn-
ing systems in four main steps: monitoring, data analysis and
forecasting, warning and response. Bell et al. (2008) propose
a scheme of integrated LEWSs combining both the natural
scientific components (e.g., geotechnics, engineering, data
measurement, transmission and storage, analysis) and the so-
cial system (e.g., legal framework, demands from different
stakeholders). Intrieri et al. (2013) describe LEWSs as the
balanced combination of four main activities: design, mon-
itoring, forecasting and education. Calvello et al. (2015b)
state that the objectives of LEWSs should be defined by con-
sidering the scale of analysis and the type of landslides; they
also represent the process of designing and managing land-
slide early warning systems by a “wheel” with four concen-
tric rings identifying: the necessary skills, the activities to be
performed, the means to be used and the basic elements of
the system.
Figure 1 and Table 1 show an original schematic of the
components of regional early warning systems for rainfall-
induced landslides. The proposed scheme is based on a clear
distinction among correlation laws, warning models and
warning systems. Within this framework, a regional correla-
tion law for rainfall-induced landslides, is defined as a func-
tional relationship between RE and LE (see Sect. 3.1 for de-
tails on the definition, classification, identification and anal-
ysis of landslide events), eventually including other relevant
monitored variables. A regional landslide warning model in-
cludes the regional correlation law as well as warning events
www.nat-hazards-earth-syst-sci.net/16/103/2016/ Nat. Hazards Earth Syst. Sci., 16, 103–122, 2016
106 M. Calvello and L. Piciullo: Performance of regional landslide early warning models: the EDuMaP method
Table 1. Components of regional landslide early warning systems (ReLEWS) for rainfall-induced landslides, relevance for system parts
– i.e., regional correlation law (ReCoL), regional landslide warning model (ReLWaM) – and system actors – i.e., citizens, managers and
scientists.
Components Relevance for system parts Relevance for system actors
ReCoL ReLWaM ReLEWS Citizens Managers Scientists
Warning events yes yes yes yes yes
Landslide events yes yes yes yes yes
Other variables yes yes yes yes yes
Warning events yes yes yes yes partly
Decision-making yes yes yes yes partly
Monitoring and warning strategy yes yes yes
Communication strategy yes yes yes yes
Emergency plan yes yes yes partly
(see Sect. 3.1 for details on the definition, classification,
identification and analysis of warning events) and decision-
making procedures to issue the warnings. ReLEWS includes
the regional warning model and the following components:
monitoring and warning strategy, communication strategy
and emergency plan. Each component of ReLEWs may also
be related to a number of actors involved with their deploy-
ment, operational activities and management. As reported in
Table 1, three classes of such actors are herein identified: cit-
izens, managers and scientists. All the system components
are relevant for more than one class of actor. For instance, it
is important to highlight that both the decision-making and
emergency plan components, within which the evacuation
procedures and the procedures used to issue and withdraw
the warnings are defined, are significantly influenced by peo-
ple’s risk perception as well as by operational aspects the
managers need to address in cooperation with the scientists.
3 Framework for the performance analysis of regional
landslide warning models
Maskrey (1997) states that the effectiveness of an early warn-
ing system should be judged less on whether warnings are
issued per se but rather on the basis of whether the warnings
facilitate appropriate and timely decision-making by those
most at risk. Calvello et al. (2015b) state that the design of
landslide warning systems require synergy between techni-
cal and social skills. According to them, the main objective
of the designers of the technical subsystem is the definition
of efficient processes, while the procedures defined within
the social subsystem are important in making landslide early
warning systems an effective tool to reduce risk to life.
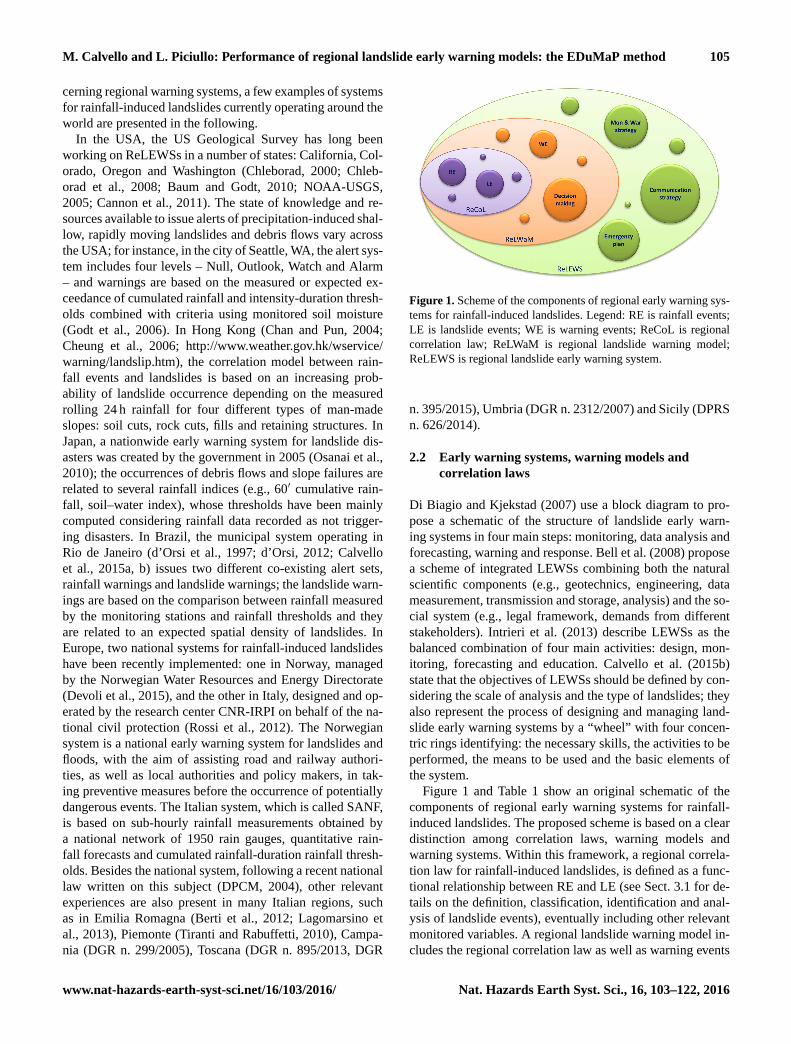
Following the previous statements and the scheme pro-
posed in Fig. 1, the technical performance of a regional land-
slide early warning system is herein evaluated by means of
the EDuMaP method (Fig. 2), which assesses the perfor-
mance of the warning model, employed by that system. The
Figure 2. Scheme of the “events, duration matrix, performance”
(EDuMaP) method.
EDuMaP method comprises the following three successive
steps:
– events analysis, i.e., LE and WE derived from available
landslides and warnings databases;
– definition and computation of a duration matrix, whose
elements report the time associated with the occurrence
of landslide events in relation to the occurrence of warn-
ing events, in their respective classes;
– evaluation of the early warning model performance by
means of performance criteria and indicators applied to
the duration matrix computed in the previous step.
Nat. Hazards Earth Syst. Sci., 16, 103–122, 2016 www.nat-hazards-earth-syst-sci.net/16/103/2016/
M. Calvello and L. Piciullo: Performance of regional landslide early warning models: the EDuMaP method 107
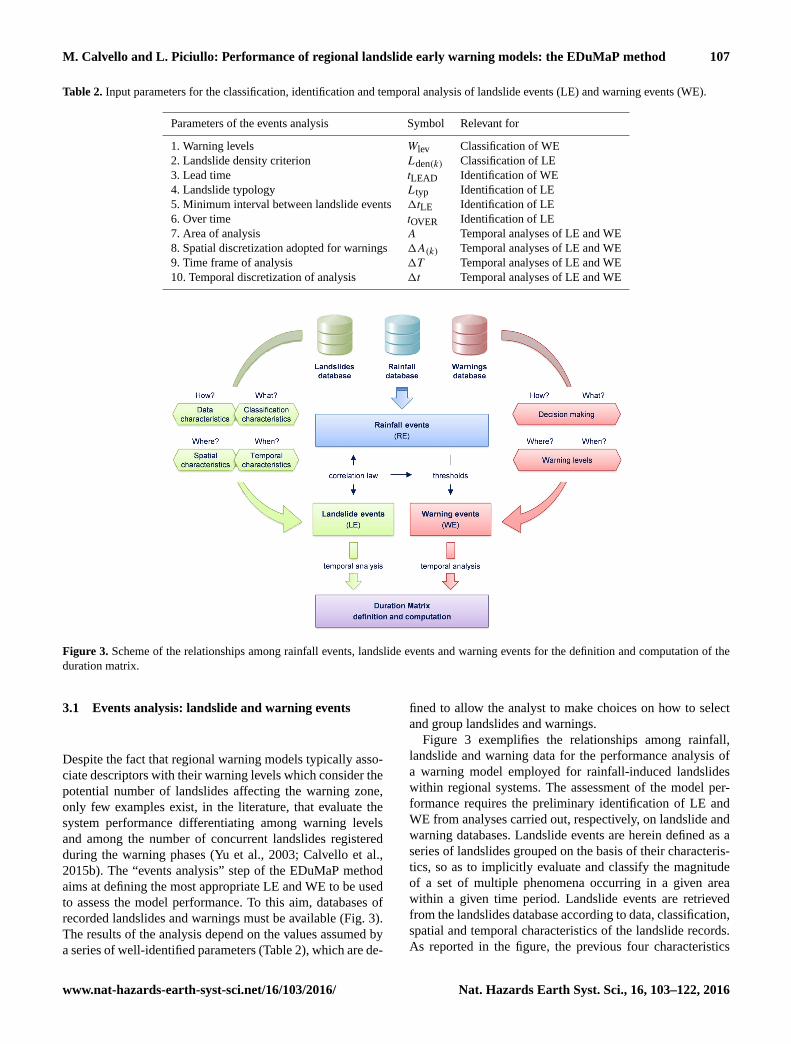
Table 2. Input parameters for the classification, identification and temporal analysis of landslide events (LE) and warning events (WE).
Parameters of the events analysis Symbol Relevant for
1. Warning levels Wlev Classification of WE
2. Landslide density criterion Lden(k) Classification of LE
3. Lead time tLEAD Identification of WE
4. Landslide typology Ltyp Identification of LE
5. Minimum interval between landslide events 1tLE Identification of LE
6. Over time tOVER Identification of LE
7. Area of analysis A Temporal analyses of LE and WE
8. Spatial discretization adopted for warnings 1A(k) Temporal analyses of LE and WE
9. Time frame of analysis 1T Temporal analyses of LE and WE
10. Temporal discretization of analysis 1t Temporal analyses of LE and WE
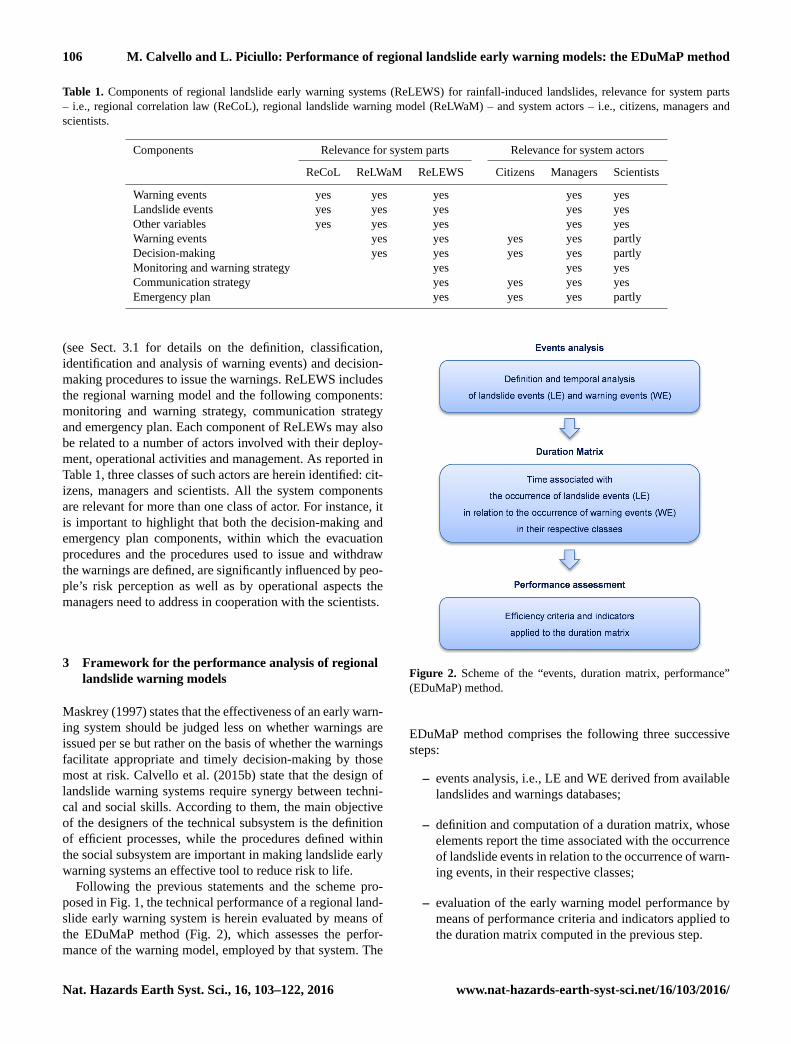
Figure 3. Scheme of the relationships among rainfall events, landslide events and warning events for the definition and computation of the
duration matrix.
3.1 Events analysis: landslide and warning events
Despite the fact that regional warning models typically asso-
ciate descriptors with their warning levels which consider the
potential number of landslides affecting the warning zone,
only few examples exist, in the literature, that evaluate the
system performance differentiating among warning levels
and among the number of concurrent landslides registered
during the warning phases (Yu et al., 2003; Calvello et al.,
2015b). The “events analysis” step of the EDuMaP method
aims at defining the most appropriate LE and WE to be used
to assess the model performance. To this aim, databases of
recorded landslides and warnings must be available (Fig. 3).
The results of the analysis depend on the values assumed by
a series of well-identified parameters (Table 2), which are de-
fined to allow the analyst to make choices on how to select
and group landslides and warnings.
Figure 3 exemplifies the relationships among rainfall,
landslide and warning data for the performance analysis of
a warning model employed for rainfall-induced landslides
within regional systems. The assessment of the model per-
formance requires the preliminary identification of LE and
WE from analyses carried out, respectively, on landslide and
warning databases. Landslide events are herein defined as a
series of landslides grouped on the basis of their characteris-
tics, so as to implicitly evaluate and classify the magnitude
of a set of multiple phenomena occurring in a given area
within a given time period. Landslide events are retrieved
from the landslides database according to data, classification,
spatial and temporal characteristics of the landslide records.
As reported in the figure, the previous four characteristics
www.nat-hazards-earth-syst-sci.net/16/103/2016/ Nat. Hazards Earth Syst. Sci., 16, 103–122, 2016
108 M. Calvello and L. Piciullo: Performance of regional landslide early warning models: the EDuMaP method
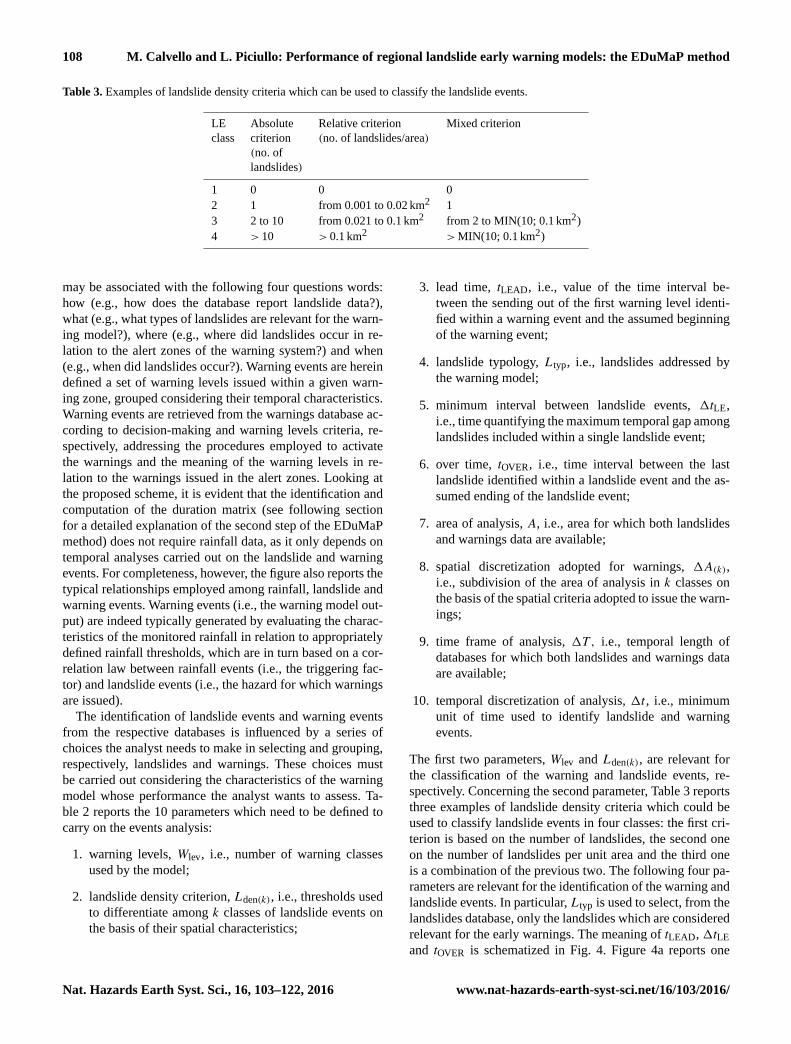
Table 3. Examples of landslide density criteria which can be used to classify the landslide events.
LE Absolute Relative criterion Mixed criterion
class criterion (no. of landslides/area)
(no. of
landslides)
1 0 0 0
2 1 from 0.001 to 0.02 km2 1
3 2 to 10 from 0.021 to 0.1 km2 from 2 to MIN(10; 0.1 km2)
4 > 10 > 0.1 km2 > MIN(10; 0.1 km2)
may be associated with the following four questions words:
how (e.g., how does the database report landslide data?),
what (e.g., what types of landslides are relevant for the warn-
ing model?), where (e.g., where did landslides occur in re-
lation to the alert zones of the warning system?) and when
(e.g., when did landslides occur?). Warning events are herein
defined a set of warning levels issued within a given warn-
ing zone, grouped considering their temporal characteristics.
Warning events are retrieved from the warnings database ac-
cording to decision-making and warning levels criteria, re-
spectively, addressing the procedures employed to activate
the warnings and the meaning of the warning levels in re-
lation to the warnings issued in the alert zones. Looking at
the proposed scheme, it is evident that the identification and
computation of the duration matrix (see following section
for a detailed explanation of the second step of the EDuMaP
method) does not require rainfall data, as it only depends on
temporal analyses carried out on the landslide and warning
events. For completeness, however, the figure also reports the
typical relationships employed among rainfall, landslide and
warning events. Warning events (i.e., the warning model out-
put) are indeed typically generated by evaluating the charac-
teristics of the monitored rainfall in relation to appropriately
defined rainfall thresholds, which are in turn based on a cor-
relation law between rainfall events (i.e., the triggering fac-
tor) and landslide events (i.e., the hazard for which warnings
are issued).
The identification of landslide events and warning events
from the respective databases is influenced by a series of
choices the analyst needs to make in selecting and grouping,
respectively, landslides and warnings. These choices must
be carried out considering the characteristics of the warning
model whose performance the analyst wants to assess. Ta-
ble 2 reports the 10 parameters which need to be defined to
carry on the events analysis:
1. warning levels, Wlev, i.e., number of warning classes
used by the model;
2. landslide density criterion, Lden(k), i.e., thresholds used
to differentiate among k classes of landslide events on
the basis of their spatial characteristics;
3. lead time, tLEAD, i.e., value of the time interval be-
tween the sending out of the first warning level identi-
fied within a warning event and the assumed beginning
of the warning event;
4. landslide typology, Ltyp, i.e., landslides addressed by
the warning model;
5. minimum interval between landslide events, 1tLE,
i.e., time quantifying the maximum temporal gap among
landslides included within a single landslide event;
6. over time, tOVER, i.e., time interval between the last
landslide identified within a landslide event and the as-
sumed ending of the landslide event;
7. area of analysis, A, i.e., area for which both landslides
and warnings data are available;
8. spatial discretization adopted for warnings, 1A(k),
i.e., subdivision of the area of analysis in k classes on
the basis of the spatial criteria adopted to issue the warn-
ings;
9. time frame of analysis, 1T, i.e., temporal length of
databases for which both landslides and warnings data
are available;
10. temporal discretization of analysis, 1t , i.e., minimum
unit of time used to identify landslide and warning
events.
The first two parameters, Wlev and Lden(k), are relevant for
the classification of the warning and landslide events, re-
spectively. Concerning the second parameter, Table 3 reports
three examples of landslide density criteria which could be
used to classify landslide events in four classes: the first cri-
terion is based on the number of landslides, the second one
on the number of landslides per unit area and the third one
is a combination of the previous two. The following four pa-
rameters are relevant for the identification of the warning and
landslide events. In particular, Ltyp is used to select, from the
landslides database, only the landslides which are considered
relevant for the early warnings. The meaning of tLEAD, 1tLE
and tOVER is schematized in Fig. 4. Figure 4a reports one
Nat. Hazards Earth Syst. Sci., 16, 103–122, 2016 www.nat-hazards-earth-syst-sci.net/16/103/2016/
M. Calvello and L. Piciullo: Performance of regional landslide early warning models: the EDuMaP method 109
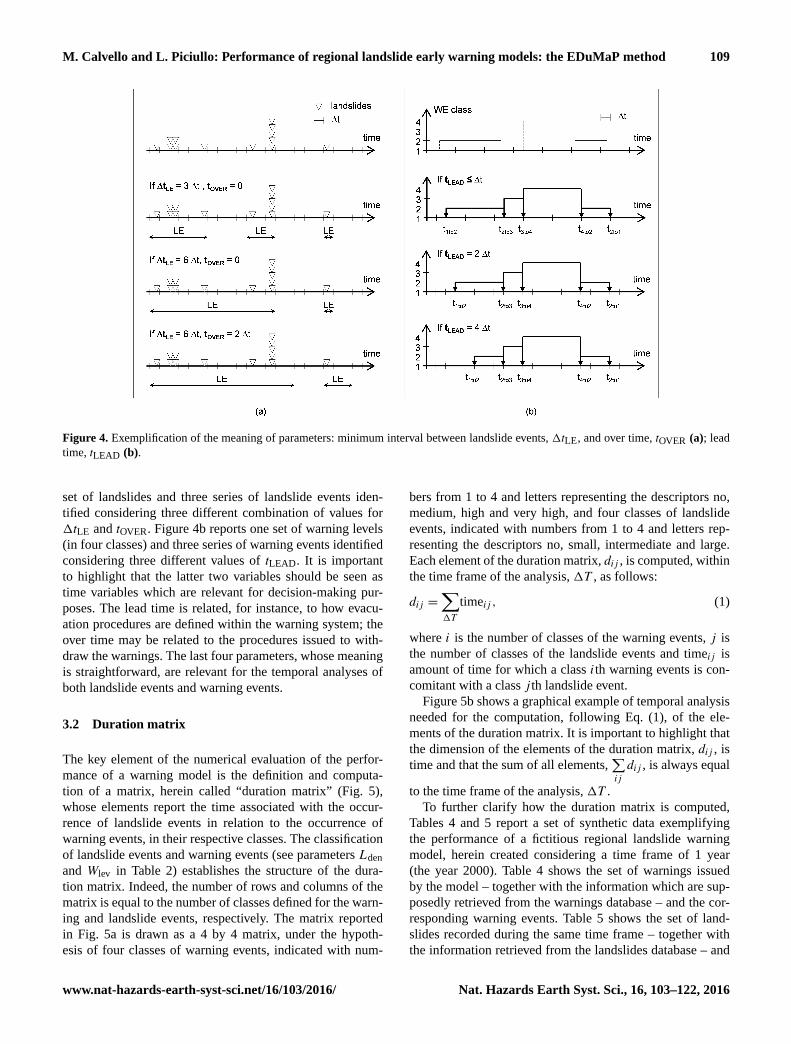
Figure 4. Exemplification of the meaning of parameters: minimum interval between landslide events, 1tLE, and over time, tOVER (a); lead
time, tLEAD (b).
set of landslides and three series of landslide events iden-
tified considering three different combination of values for
1tLE and tOVER. Figure 4b reports one set of warning levels
(in four classes) and three series of warning events identified
considering three different values of tLEAD. It is important
to highlight that the latter two variables should be seen as
time variables which are relevant for decision-making pur-
poses. The lead time is related, for instance, to how evacu-
ation procedures are defined within the warning system; the
over time may be related to the procedures issued to with-
draw the warnings. The last four parameters, whose meaning
is straightforward, are relevant for the temporal analyses of
both landslide events and warning events.
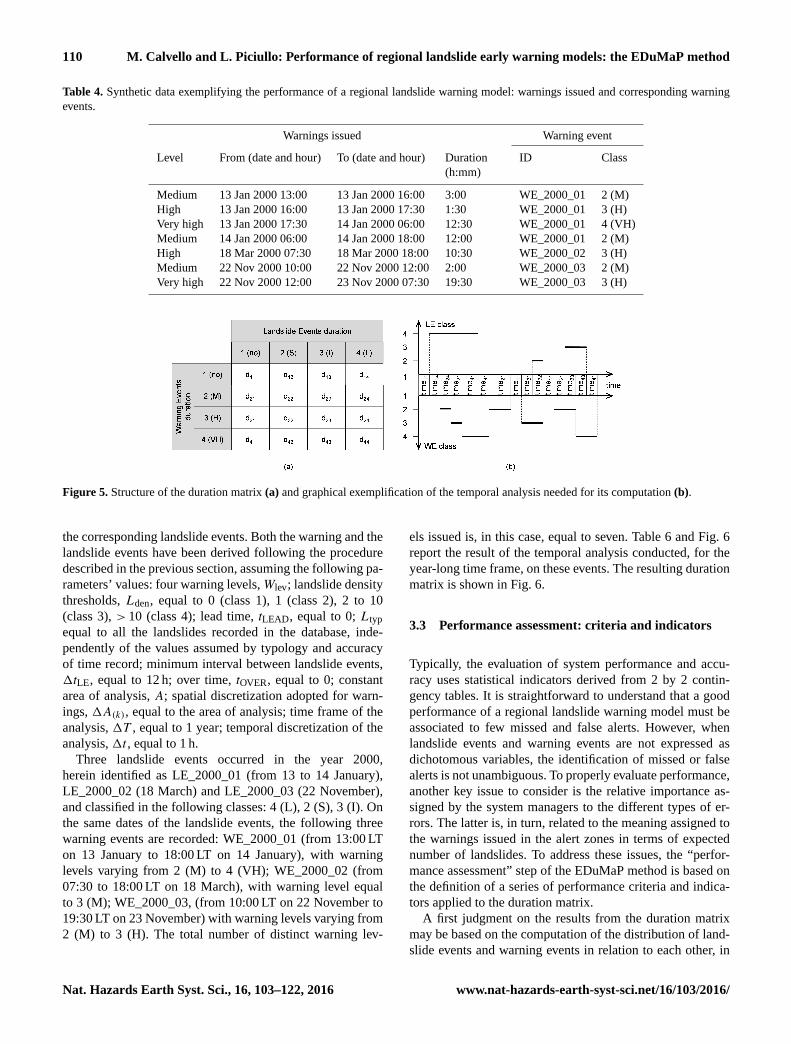
3.2 Duration matrix
The key element of the numerical evaluation of the perfor-
mance of a warning model is the definition and computa-
tion of a matrix, herein called “duration matrix” (Fig. 5),
whose elements report the time associated with the occur-
rence of landslide events in relation to the occurrence of
warning events, in their respective classes. The classification
of landslide events and warning events (see parameters Lden
and Wlev in Table 2) establishes the structure of the dura-
tion matrix. Indeed, the number of rows and columns of the
matrix is equal to the number of classes defined for the warn-
ing and landslide events, respectively. The matrix reported
in Fig. 5a is drawn as a 4 by 4 matrix, under the hypoth-
esis of four classes of warning events, indicated with num-
bers from 1 to 4 and letters representing the descriptors no,
medium, high and very high, and four classes of landslide
events, indicated with numbers from 1 to 4 and letters rep-
resenting the descriptors no, small, intermediate and large.
Each element of the duration matrix, dij , is computed, within
the time frame of the analysis, 1T , as follows:
dij =
∑1T
timeij , (1)
where i is the number of classes of the warning events, j is
the number of classes of the landslide events and timeij is
amount of time for which a class ith warning events is con-
comitant with a class j th landslide event.
Figure 5b shows a graphical example of temporal analysis
needed for the computation, following Eq. (1), of the ele-
ments of the duration matrix. It is important to highlight that
the dimension of the elements of the duration matrix, dij , is
time and that the sum of all elements,∑ij
dij , is always equal
to the time frame of the analysis, 1T .
To further clarify how the duration matrix is computed,
Tables 4 and 5 report a set of synthetic data exemplifying
the performance of a fictitious regional landslide warning
model, herein created considering a time frame of 1 year
(the year 2000). Table 4 shows the set of warnings issued
by the model – together with the information which are sup-
posedly retrieved from the warnings database – and the cor-
responding warning events. Table 5 shows the set of land-
slides recorded during the same time frame – together with
the information retrieved from the landslides database – and
www.nat-hazards-earth-syst-sci.net/16/103/2016/ Nat. Hazards Earth Syst. Sci., 16, 103–122, 2016
110 M. Calvello and L. Piciullo: Performance of regional landslide early warning models: the EDuMaP method
Table 4. Synthetic data exemplifying the performance of a regional landslide warning model: warnings issued and corresponding warning
events.
Warnings issued Warning event
Level From (date and hour) To (date and hour) Duration ID Class
(h:mm)
Medium 13 Jan 2000 13:00 13 Jan 2000 16:00 3:00 WE_2000_01 2 (M)
High 13 Jan 2000 16:00 13 Jan 2000 17:30 1:30 WE_2000_01 3 (H)
Very high 13 Jan 2000 17:30 14 Jan 2000 06:00 12:30 WE_2000_01 4 (VH)
Medium 14 Jan 2000 06:00 14 Jan 2000 18:00 12:00 WE_2000_01 2 (M)
High 18 Mar 2000 07:30 18 Mar 2000 18:00 10:30 WE_2000_02 3 (H)
Medium 22 Nov 2000 10:00 22 Nov 2000 12:00 2:00 WE_2000_03 2 (M)
Very high 22 Nov 2000 12:00 23 Nov 2000 07:30 19:30 WE_2000_03 3 (H)
Figure 5. Structure of the duration matrix (a) and graphical exemplification of the temporal analysis needed for its computation (b).
the corresponding landslide events. Both the warning and the
landslide events have been derived following the procedure
described in the previous section, assuming the following pa-
rameters’ values: four warning levels, Wlev; landslide density
thresholds, Lden, equal to 0 (class 1), 1 (class 2), 2 to 10
(class 3), > 10 (class 4); lead time, tLEAD, equal to 0; Ltyp
equal to all the landslides recorded in the database, inde-
pendently of the values assumed by typology and accuracy
of time record; minimum interval between landslide events,
1tLE, equal to 12 h; over time, tOVER, equal to 0; constant
area of analysis, A; spatial discretization adopted for warn-
ings, 1A(k), equal to the area of analysis; time frame of the
analysis, 1T , equal to 1 year; temporal discretization of the
analysis, 1t , equal to 1 h.
Three landslide events occurred in the year 2000,
herein identified as LE_2000_01 (from 13 to 14 January),
LE_2000_02 (18 March) and LE_2000_03 (22 November),
and classified in the following classes: 4 (L), 2 (S), 3 (I). On
the same dates of the landslide events, the following three
warning events are recorded: WE_2000_01 (from 13:00 LT
on 13 January to 18:00 LT on 14 January), with warning
levels varying from 2 (M) to 4 (VH); WE_2000_02 (from
07:30 to 18:00 LT on 18 March), with warning level equal
to 3 (M); WE_2000_03, (from 10:00 LT on 22 November to
19:30 LT on 23 November) with warning levels varying from
2 (M) to 3 (H). The total number of distinct warning lev-
els issued is, in this case, equal to seven. Table 6 and Fig. 6
report the result of the temporal analysis conducted, for the
year-long time frame, on these events. The resulting duration
matrix is shown in Fig. 6.
3.3 Performance assessment: criteria and indicators
Typically, the evaluation of system performance and accu-
racy uses statistical indicators derived from 2 by 2 contin-
gency tables. It is straightforward to understand that a good
performance of a regional landslide warning model must be
associated to few missed and false alerts. However, when
landslide events and warning events are not expressed as
dichotomous variables, the identification of missed or false
alerts is not unambiguous. To properly evaluate performance,
another key issue to consider is the relative importance as-
signed by the system managers to the different types of er-
rors. The latter is, in turn, related to the meaning assigned to
the warnings issued in the alert zones in terms of expected
number of landslides. To address these issues, the “perfor-
mance assessment” step of the EDuMaP method is based on
the definition of a series of performance criteria and indica-
tors applied to the duration matrix.
A first judgment on the results from the duration matrix
may be based on the computation of the distribution of land-
slide events and warning events in relation to each other, in
Nat. Hazards Earth Syst. Sci., 16, 103–122, 2016 www.nat-hazards-earth-syst-sci.net/16/103/2016/
M. Calvello and L. Piciullo: Performance of regional landslide early warning models: the EDuMaP method 111
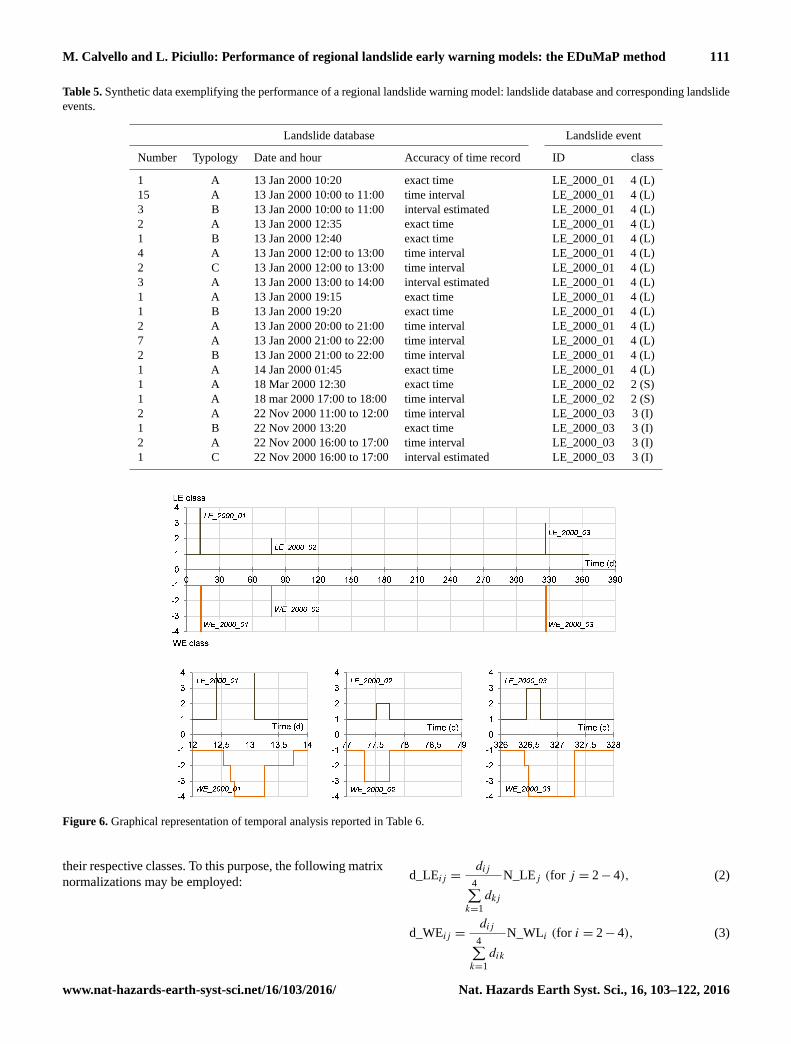
Table 5. Synthetic data exemplifying the performance of a regional landslide warning model: landslide database and corresponding landslide
events.
Landslide database Landslide event
Number Typology Date and hour Accuracy of time record ID class
1 A 13 Jan 2000 10:20 exact time LE_2000_01 4 (L)
15 A 13 Jan 2000 10:00 to 11:00 time interval LE_2000_01 4 (L)
3 B 13 Jan 2000 10:00 to 11:00 interval estimated LE_2000_01 4 (L)
2 A 13 Jan 2000 12:35 exact time LE_2000_01 4 (L)
1 B 13 Jan 2000 12:40 exact time LE_2000_01 4 (L)
4 A 13 Jan 2000 12:00 to 13:00 time interval LE_2000_01 4 (L)
2 C 13 Jan 2000 12:00 to 13:00 time interval LE_2000_01 4 (L)
3 A 13 Jan 2000 13:00 to 14:00 interval estimated LE_2000_01 4 (L)
1 A 13 Jan 2000 19:15 exact time LE_2000_01 4 (L)
1 B 13 Jan 2000 19:20 exact time LE_2000_01 4 (L)
2 A 13 Jan 2000 20:00 to 21:00 time interval LE_2000_01 4 (L)
7 A 13 Jan 2000 21:00 to 22:00 time interval LE_2000_01 4 (L)
2 B 13 Jan 2000 21:00 to 22:00 time interval LE_2000_01 4 (L)
1 A 14 Jan 2000 01:45 exact time LE_2000_01 4 (L)
1 A 18 Mar 2000 12:30 exact time LE_2000_02 2 (S)
1 A 18 mar 2000 17:00 to 18:00 time interval LE_2000_02 2 (S)
2 A 22 Nov 2000 11:00 to 12:00 time interval LE_2000_03 3 (I)
1 B 22 Nov 2000 13:20 exact time LE_2000_03 3 (I)
2 A 22 Nov 2000 16:00 to 17:00 time interval LE_2000_03 3 (I)
1 C 22 Nov 2000 16:00 to 17:00 interval estimated LE_2000_03 3 (I)
Figure 6. Graphical representation of temporal analysis reported in Table 6.
their respective classes. To this purpose, the following matrix
normalizations may be employed:d_LEij =
dij
4∑k=1
dkj
N_LEj (for j = 2− 4), (2)
d_WEij =dij
4∑k=1
dik
N_WLi (for i = 2− 4), (3)
www.nat-hazards-earth-syst-sci.net/16/103/2016/ Nat. Hazards Earth Syst. Sci., 16, 103–122, 2016
112 M. Calvello and L. Piciullo: Performance of regional landslide early warning models: the EDuMaP method
where dij is the element of the original duration matrix,
d_LEij is the element of the duration matrix normalized in
relation to the landslide events, N_LEj is the number of land-
slide events classified as class j within the time frame of the
analysis, d_WEij is the element of the duration matrix nor-
malized in relation to the warning events and N_WLi is the
number of warning levels of class i within in the time frame
of the analysis.
Figure 7 reports a graphical representation of a more com-
prehensive analysis of the duration matrix based on a set of
two performance criteria, both of them assigning a perfor-
mance meaning to all but one element of the matrix, d11,
which expresses the number of hours when no warnings are
issued and no landslides occur. Both criteria purposefully ne-
glect element d11, whose value is typically orders of magni-
tude higher than the values of the other elements, in order
to allow a more useful relative assessment of the informa-
tion located in the remaining part of the duration matrix. The
first criterion (A) fulfills the task of employing an alert clas-
sification scheme derived from a 2 by 2 contingency table,
thus identifying CAs, FAs, MAs and TNs. The second crite-
rion (B) assigns a color code to the elements of the matrix
in relation to their grade of correctness, herein classified in
four classes as follows: green (Gre) for the elements which
are assumed to be representative of the best model response,
yellow (Yel) for elements representative of minor model er-
rors, red (Red) for elements representative of a significant
model errors and purple (Pur) for elements representative of
the worst model errors.
A number of performance indicators may be derived from
the two performance criteria previously described. Table 8
reports their names, symbols, formulas and values (com-
puted using the duration matrix data from Table 7). The
performance indicators related to the alert classification cri-
terion (A) are a series of statistical indicators which are
commonly derived from contingency tables: efficiency in-
dex, also called efficiency (Martelloni et al., 2012; Lago-
marsino et al., 2013) or accuracy (Kirschbaum et al., 2012);
hit rate (Tiranti and Rabuffetti, 2010; Cheung et al., 2006),
also called sensitivity (Martelloni et al., 2012; Lagomarsino
et al., 2013), probability of detection (Kirschbaum et al.,
2012; Restrepo et al., 2008; Gariano et al., 2015) or true pos-
itive rate (Staley et al., 2013); predictive power, also called
positive predictive power (Martelloni et al., 2012); threat
score (Staley et al., 2013; Tiranti and Rabuffetti, 2010), also
called critical success index (Cheung et al., 2006); odds ratio
(Martelloni et al., 2012); misclassification rate (Martelloni et
al., 2012); missed alert rate, also called false negative rate
(Martelloni et al., 2012; Lagomarsino et al., 2013); and false
alert rate, also called probability of false alarms (Gariano et
al., 2015). The other performance indicators, either related
to the grade of correctness criterion (B) or to both criteria at
once, have been named and defined following a similar rea-
soning.
4 Application of proposed method to a case study
4.1 The Alerta Rio early warning system
The territory of the city of Rio de Janeiro (Brazil) has long
been affected by landslides which often caused, in the last
decades, widespread destruction and a significant number
of casualties in different areas of the city. The high fre-
quency of these phenomena is to be ascribed both to the
geologic, geomorphologic and climatic characteristics of the
city (i.e., weathered soils, extensive mountainous areas and
a tropical climate) and to the presence of areas characterized
by high density of population and by unplanned and spon-
taneous land occupation (e.g., Coelho Netto et al., 2007).
The “Alerta Rio” system (d’Orsi et al., 2004; Calvello et
al., 2015b) is a ReLEWS operated by the GEO-Rio Founda-
tion in the municipality of Rio de Janeiro, Brazil, designed
to inform stakeholders of the possible occurrence of rain-
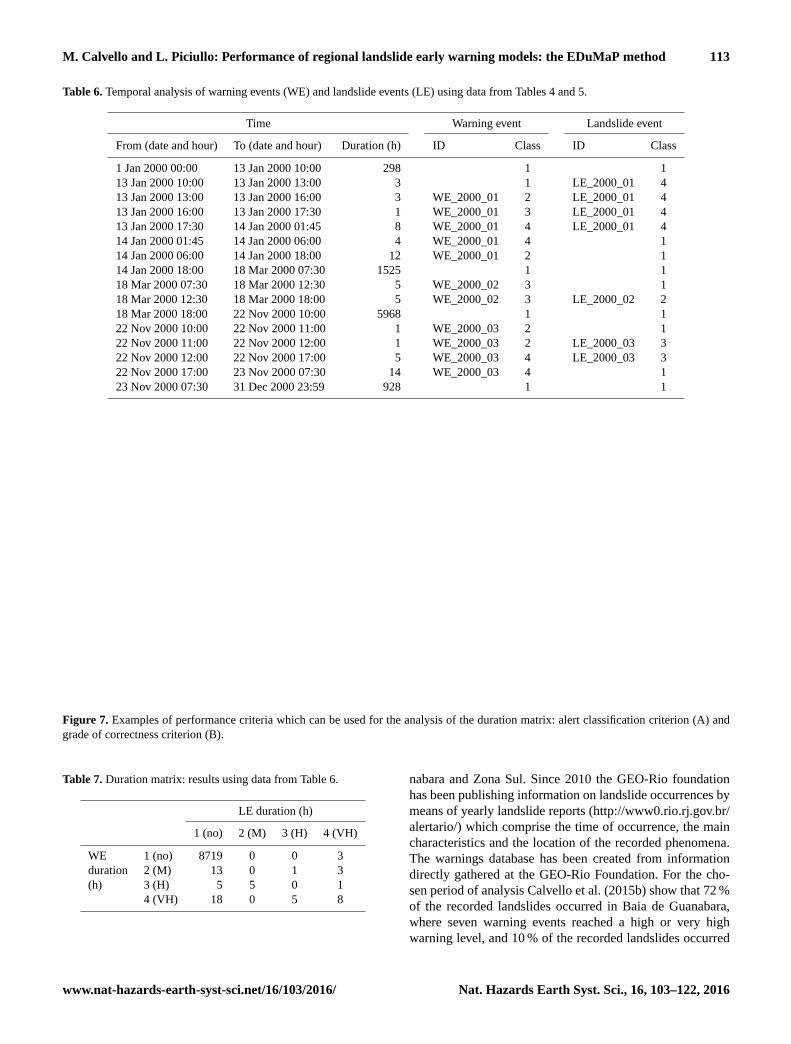
fall induced landslides. The municipality of Rio de Janeiro
covers around 1200 km2 and is divided, for warning pur-
poses, into four alert zones (Fig. 8): Baia de Guanabara
(390 km2), Zona Sul (40 km2), Baia de Sepetiba (492 km2)
and Jacarepaguà (302 km2). Landslide warnings are cur-
rently based on the comparison between rainfall measured
by a network of 33 rain gauges and rainfall thresholds de-
fined considering the antecedent cumulated rainfall for the
following three durations: 1, 24 and 96 h. The three cumu-
lated rainfall measures are treated independently by means of
a series of either/or rules which define warning levels asso-
ciated to four landslide probabilities of occurrence: (1) low,
if mass movements triggered by rainfall are not expected;
(2) medium, if only occasional occurrences of landslides
triggered by rainfall are expected, predominantly in artifi-
cial slopes; (3) high, for an expected diffuse occurrence of
landslides in both natural and artificial slopes; (4) very high,
if the expected areal distribution of landslides is significant
and the phenomena are expected to be widespread in slopes
and roads cuts. Landslide warnings are issued, at any given
time, over the whole affected alert zone without explicitly
differentiating among areas characterized by different levels
of landslide susceptibility, as defined by a municipal suscep-
tibility map available at 1 : 10 000 (D’Orsi, 2012). This land-
slide susceptibility map is also reported in Fig. 8 because
the parametric analysis presented in the following sections
to evaluate the performance of the Alerta Rio warning model
according to the EDuMaP method allows us to explicitly con-
sider the extent of the area most susceptible to landslides for
the classification of the landslide events (i.e., definition of the
input parameter Lden(k)).
4.2 Setup of parametric analysis
The analysis presented herein uses data on recorded land-
slides and issued warnings of the Alerta Rio system for the
3-year period 2010–2012 in two alert zones: Baia de Gua-
Nat. Hazards Earth Syst. Sci., 16, 103–122, 2016 www.nat-hazards-earth-syst-sci.net/16/103/2016/
M. Calvello and L. Piciullo: Performance of regional landslide early warning models: the EDuMaP method 113
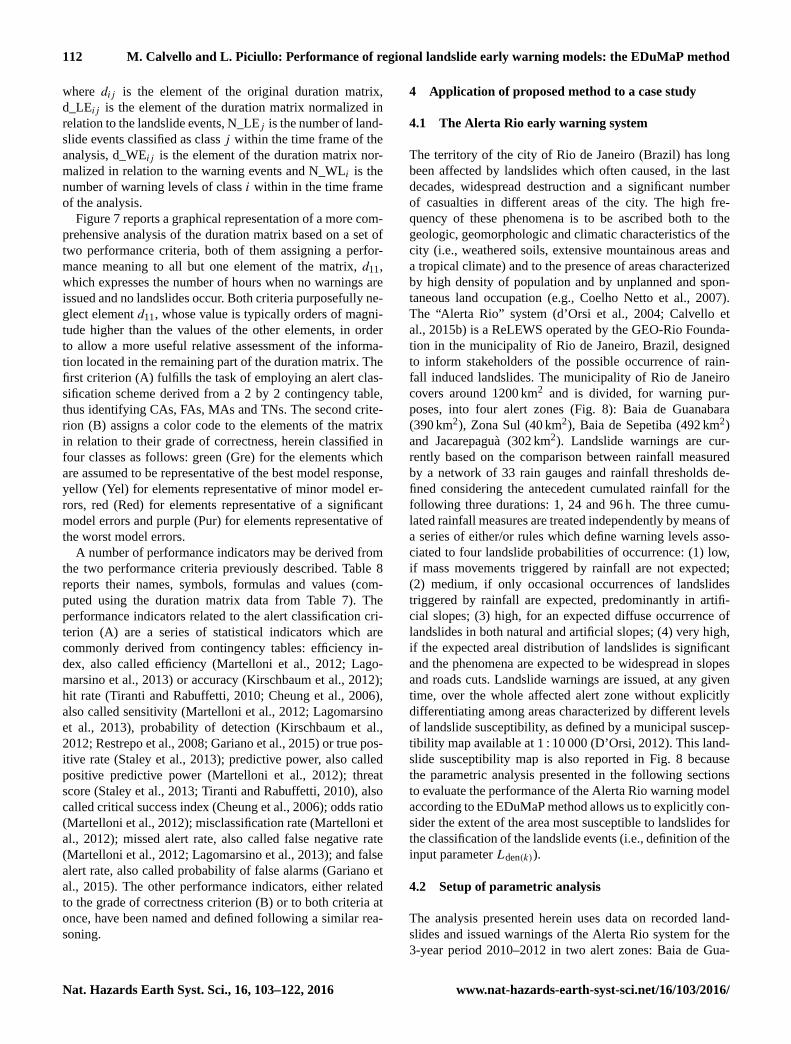
Table 6. Temporal analysis of warning events (WE) and landslide events (LE) using data from Tables 4 and 5.
Time Warning event Landslide event
From (date and hour) To (date and hour) Duration (h) ID Class ID Class
1 Jan 2000 00:00 13 Jan 2000 10:00 298 1 1
13 Jan 2000 10:00 13 Jan 2000 13:00 3 1 LE_2000_01 4
13 Jan 2000 13:00 13 Jan 2000 16:00 3 WE_2000_01 2 LE_2000_01 4
13 Jan 2000 16:00 13 Jan 2000 17:30 1 WE_2000_01 3 LE_2000_01 4
13 Jan 2000 17:30 14 Jan 2000 01:45 8 WE_2000_01 4 LE_2000_01 4
14 Jan 2000 01:45 14 Jan 2000 06:00 4 WE_2000_01 4 1
14 Jan 2000 06:00 14 Jan 2000 18:00 12 WE_2000_01 2 1
14 Jan 2000 18:00 18 Mar 2000 07:30 1525 1 1
18 Mar 2000 07:30 18 Mar 2000 12:30 5 WE_2000_02 3 1
18 Mar 2000 12:30 18 Mar 2000 18:00 5 WE_2000_02 3 LE_2000_02 2
18 Mar 2000 18:00 22 Nov 2000 10:00 5968 1 1
22 Nov 2000 10:00 22 Nov 2000 11:00 1 WE_2000_03 2 1
22 Nov 2000 11:00 22 Nov 2000 12:00 1 WE_2000_03 2 LE_2000_03 3
22 Nov 2000 12:00 22 Nov 2000 17:00 5 WE_2000_03 4 LE_2000_03 3
22 Nov 2000 17:00 23 Nov 2000 07:30 14 WE_2000_03 4 1
23 Nov 2000 07:30 31 Dec 2000 23:59 928 1 1
Figure 7. Examples of performance criteria which can be used for the analysis of the duration matrix: alert classification criterion (A) and
grade of correctness criterion (B).
Table 7. Duration matrix: results using data from Table 6.
LE duration (h)
1 (no) 2 (M) 3 (H) 4 (VH)
WE 1 (no) 8719 0 0 3
duration 2 (M) 13 0 1 3
(h) 3 (H) 5 5 0 1
4 (VH) 18 0 5 8
nabara and Zona Sul. Since 2010 the GEO-Rio foundation
has been publishing information on landslide occurrences by
means of yearly landslide reports (http://www0.rio.rj.gov.br/
alertario/) which comprise the time of occurrence, the main
characteristics and the location of the recorded phenomena.
The warnings database has been created from information
directly gathered at the GEO-Rio Foundation. For the cho-
sen period of analysis Calvello et al. (2015b) show that 72 %
of the recorded landslides occurred in Baia de Guanabara,
where seven warning events reached a high or very high
warning level, and 10 % of the recorded landslides occurred
www.nat-hazards-earth-syst-sci.net/16/103/2016/ Nat. Hazards Earth Syst. Sci., 16, 103–122, 2016
114 M. Calvello and L. Piciullo: Performance of regional landslide early warning models: the EDuMaP method
Table 8. Performance indicators derived from the two performance criteria reported in Fig. 7 using data from duration matrix reported in
Table 7.
Performance indicator Performance Symbol Formula Value
criterion
Efficiency index Criterion A Ieff (CA+TN)/6ij dij (excluding d11) 0.44
Hit rate Criterion A HRL CA/(CA+MA) 0.67
Predictive power Criterion A PPW CA/(CA+FA) 0.33
Threat score Criterion A TS CA/(CA+MA+FA) 0.29
Odds ratio Criterion A OR (CA+TN)/(MA+FA) 0.77
Misclassification rate Criterion A MR 1− Ieff 0.56
Missed alert rate Criterion A RMA 1−HR 0.33
False alert rate Criterion A RFA 1−PP 0.67
Error rate Criterion B ER (Red+Pur)/6ij dij (excluding d11) 0.56
Probability of serious mistakes Criterion B PSM Pur/6ij dij (excluding d11) 0.39
Probability of serious no-warning mistakes Criterion B PSM−NW Puri4/6ij dij (for i= 1, j = 2–4) 1
Probability of serious no-landslides mistakes Criterion B PSM−NL Pur4j /6ij dij (for i= 2–4, j = 1) 0.5
Index of severity of missed alerts Criteria A and B IMA (Pur & MA)/MA 0.86
Index of severity of false alerts Criteria A and B IFA (Pur & FA)/FA 0.64
Figure 8. Subdivision of the Rio de Janeiro municipal territory for early warning purposes, susceptibility map and location of the rainfall
monitoring stations.
in Zona Sul, where five warning events reached a high or very
high warning level.
The parametric analysis conducted herein has a twofold
purpose: to compare the performance of the Alerta Rio early
warning model in two different alert zones of the city and to
evaluate the effect of the choices the analyst needs to make to
define LE and WE on the performance indicators computed
according to the EDuMaP method within a given alert zone.
To investigate the latter, the Baia de Guanabara alert zone
was chosen.
Table 9 shows the values used for each simulation of the
parametric analysis for the 10 input parameters needed to
define the landslide and warning events. The values of the
input parameters chosen for simulations ZS_T1 and G_T1,
which refer to the two base cases for the alert zones Zona
Sul and Baia de Guanabara, respectively, adequately repre-
sent the structure and the operative procedures of the warn-
ing model employed within Alerta Rio. For these two simu-
lations, the following values of the 10 input parameters are
used: area of analysis, A, equal to ZS and G, respectively;
warning levels, Wlev, equal to 4; landslide density, Lden(k),
defined according to the mixed criterion shown in Table 3;
lead time, tLEAD, equal to 0; landslide typology, Ltyp, equal
to all recorded landslides; minimum interval between land-
slide events, 1tLE, equal to 12 h; over time, tOVER, equal to
0; spatial discretization adopted for warnings, 1A(k), equal
to the area of analysis A; time frame of analysis, 1T, equal
to the 3-year period 2010–2012; temporal discretization of
Nat. Hazards Earth Syst. Sci., 16, 103–122, 2016 www.nat-hazards-earth-syst-sci.net/16/103/2016/
M. Calvello and L. Piciullo: Performance of regional landslide early warning models: the EDuMaP method 115
Tab
le9.S
imu
lati
on
so
fth
ep
aram
etri
can
aly
sis:
val
ues
of
the
inp
ut
par
amet
ers
nee
ded
tod
efin
eth
ela
nd
slid
ean
dw
arn
ing
even
ts.
ZS
-T1
G-T
1G
-U1
G-T
2G
-T3
G-T
4G
-Z1
G-W
1G
-A1
G-B
1G
-C1
G-E
1G
-F1
G-W
5
Wle
v4
44
44
44
44
44
44
4
Lden
(k)
mix
ed(A
)m
ixed
(A)
mix
ed(A
susc
)m
ixed
(A)
mix
ed(A
)m
ixed
(A)
mix
ed(A
susc
)m
ixed
(Asu
sc)
mix
ed(A
)m
ixed
(A)
mix
ed(A
)m
ixed
(A)
mix
ed(A
)m
ixed
(A)
t LE
AD
00
00
00
00
01
h3
h1
h0
0
Lty
pA
LL
AL
LA
LL
AL
LA
LL
AL
LR
-IT
1A
LL
AL
LA
LL
AL
LA
LL
T1
1t L
E12
h12
h12
h12
h12
h12
h12
h12
h12
h12
h24
h12
h24
h12
h
t OV
ER
00
00
00
00
6h
6h
12
h0
00
AZ
SG
GG
GG
GG
GG
GG
GG
1A
(k)
ZS
GG
GG
GG
GG
GG
GG
G
1T
2010–12
2010–12
2010–12
2010
2011
2012
2010–12
2010–12
2010–12
2010–12
2010–12
2010–12
2010–12
2010–12
1t
1′
1′
1′
1′
1′
1′
1′
1′
1′
1′
1′
1′
1′
1′
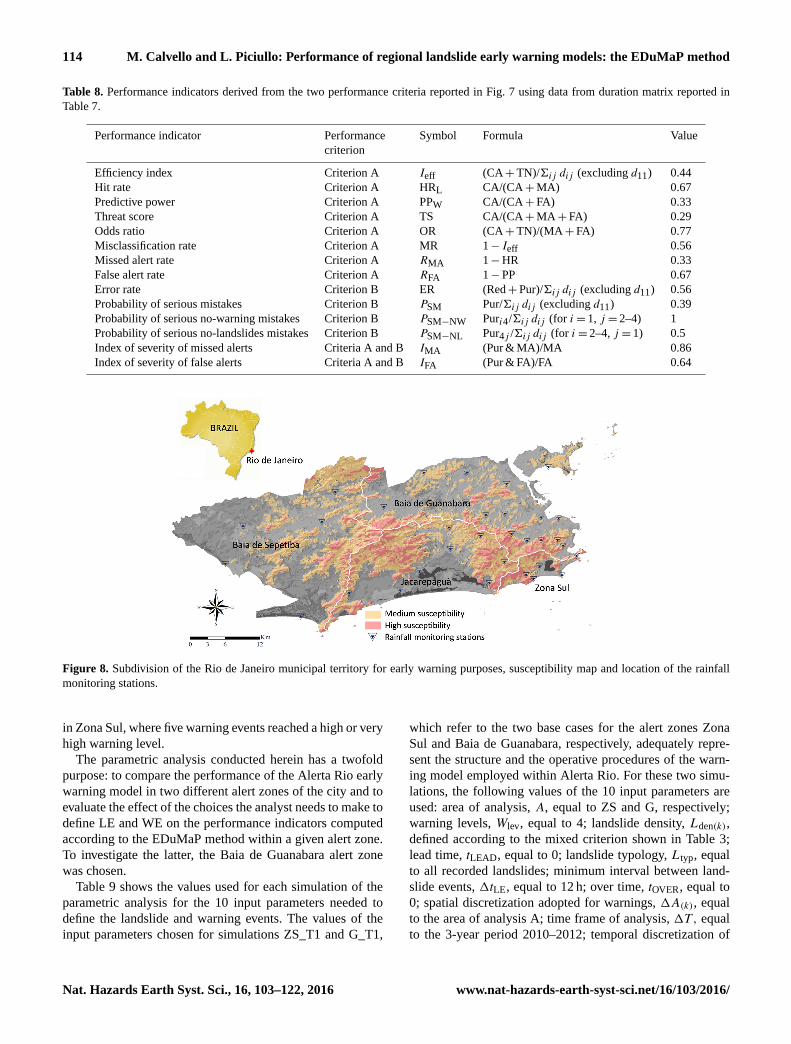
Table 10. Duration matrix of simulation ZS_T1.
LE duration (h)
1 (no) 2 (S) 3 (I) 4 (L)
WE 1 (no) 8185.1 19.1 20.4 0.0
duration 2 (M) 288.4 16.7 0.7 0.0
(h) 3 (H) 90.0 6.0 3.1 32.4
4 (VH) 28.5 0.1 38.1 31.4
Table 11. Duration matrix of simulation G_T1.
LE duration (h)
1 (no) 2 (S) 3 (I) 4 (L)
WE 1 (no) 8281.8 0.4 0.0 0.0
duration 2 (M) 302.0 0.0 0.0 5.4
(h) 3 (H) 100.1 0.2 0.0 2.8
4 (VH) 54.8 0.0 0.0 12.6
analysis, 1t , equal to 1 min. All the remaining simulations,
from G-U01 to G-W05, refer to the alert zone Baia de Guan-
abara. These simulations are used to explore the sensitivity of
the performance evaluation of the Alerta Rio regional warn-
ing model to changes in the input parameters, whose values
differ, depending on choices made by the analyst, also under
the same set of landslides and warnings data. To this pur-
pose, the input parameters investigated are landslide density,
Lden(k), defined according to the mixed criterion shown in
Table 3 either in relation to the whole area of analysis (A) or
in relation to the extent of the area most susceptible to land-
slides (Asusc); lead time, tLEAD, varying from 0 to 3 h; land-
slide typology, Ltyp, equal to all recorded landslides (ALL),
all typologies of landslides excluding rock falls (R-I) and
earth slides in artificial slopes (T1); minimum interval be-
tween landslide events, 1tLE, equal to 12 and 24 h; over time,
tOVER, varying from 0 to 12 h; and time frame of analysis,
1T, equal to the whole 3-year period 2010–2012 or to the
single years 2010, 2011 and 2012.
4.3 Results of parametric analysis
The duration matrices of Tables 10 and 11 report the results
of the first two simulations of the parametric analysis, ZS_T1
and G_T1, which only differ in relation to the area of analy-
sis, the Zona Sul and the Baia de Guanabara alert zones, re-
spectively. Figures 9 and 10 show a comparison of the results
of the first two simulations, ZS_T1 and G_T1. Considering
performance criterion A, Zona Sul and Baia de Guanabara
both present a high rate of TNs and a low rate of MAs. The
low rate of computed MAs also turns into a good predict-
ing capability in relation to intermediate and large landslide
events occurring in these zones. Baia de Guanabara shows
time values associated to CAs much higher than the corre-
www.nat-hazards-earth-syst-sci.net/16/103/2016/ Nat. Hazards Earth Syst. Sci., 16, 103–122, 2016
116 M. Calvello and L. Piciullo: Performance of regional landslide early warning models: the EDuMaP method
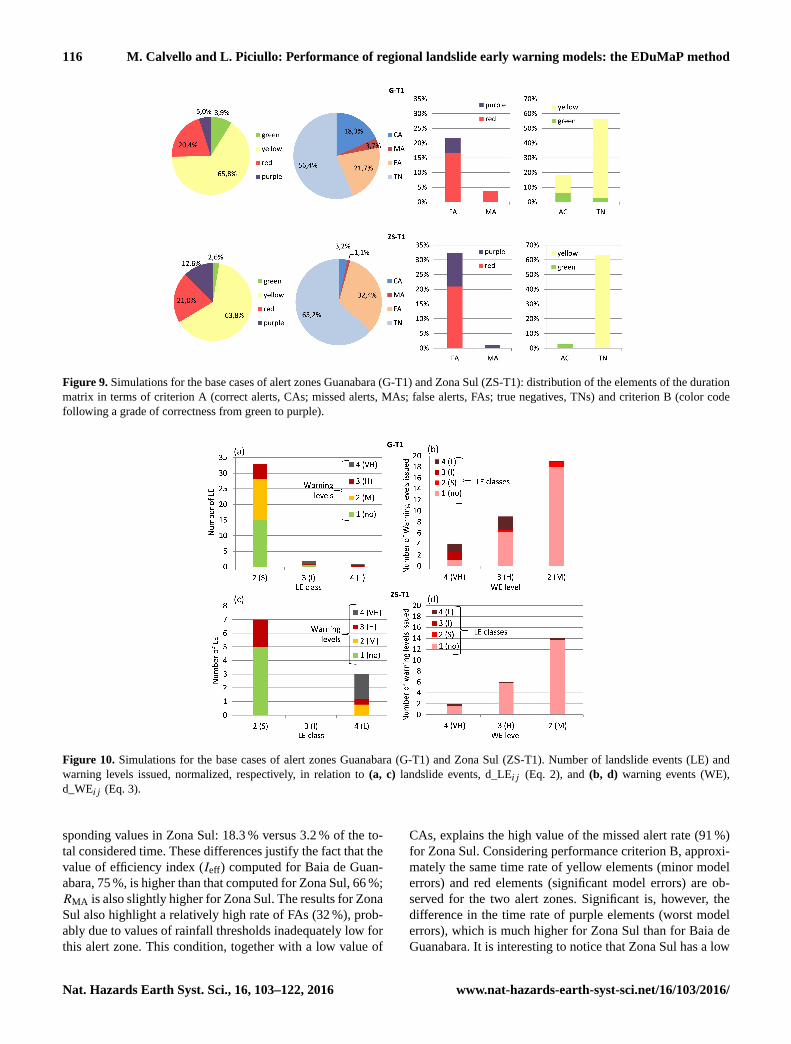
Figure 9. Simulations for the base cases of alert zones Guanabara (G-T1) and Zona Sul (ZS-T1): distribution of the elements of the duration
matrix in terms of criterion A (correct alerts, CAs; missed alerts, MAs; false alerts, FAs; true negatives, TNs) and criterion B (color code
following a grade of correctness from green to purple).
Figure 10. Simulations for the base cases of alert zones Guanabara (G-T1) and Zona Sul (ZS-T1). Number of landslide events (LE) and
warning levels issued, normalized, respectively, in relation to (a, c) landslide events, d_LEij (Eq. 2), and (b, d) warning events (WE),
d_WEij (Eq. 3).
sponding values in Zona Sul: 18.3 % versus 3.2 % of the to-
tal considered time. These differences justify the fact that the
value of efficiency index (Ieff) computed for Baia de Guan-
abara, 75 %, is higher than that computed for Zona Sul, 66 %;
RMA is also slightly higher for Zona Sul. The results for Zona
Sul also highlight a relatively high rate of FAs (32 %), prob-
ably due to values of rainfall thresholds inadequately low for
this alert zone. This condition, together with a low value of
CAs, explains the high value of the missed alert rate (91 %)
for Zona Sul. Considering performance criterion B, approxi-
mately the same time rate of yellow elements (minor model
errors) and red elements (significant model errors) are ob-
served for the two alert zones. Significant is, however, the
difference in the time rate of purple elements (worst model
errors), which is much higher for Zona Sul than for Baia de
Guanabara. It is interesting to notice that Zona Sul has a low
Nat. Hazards Earth Syst. Sci., 16, 103–122, 2016 www.nat-hazards-earth-syst-sci.net/16/103/2016/
M. Calvello and L. Piciullo: Performance of regional landslide early warning models: the EDuMaP method 117
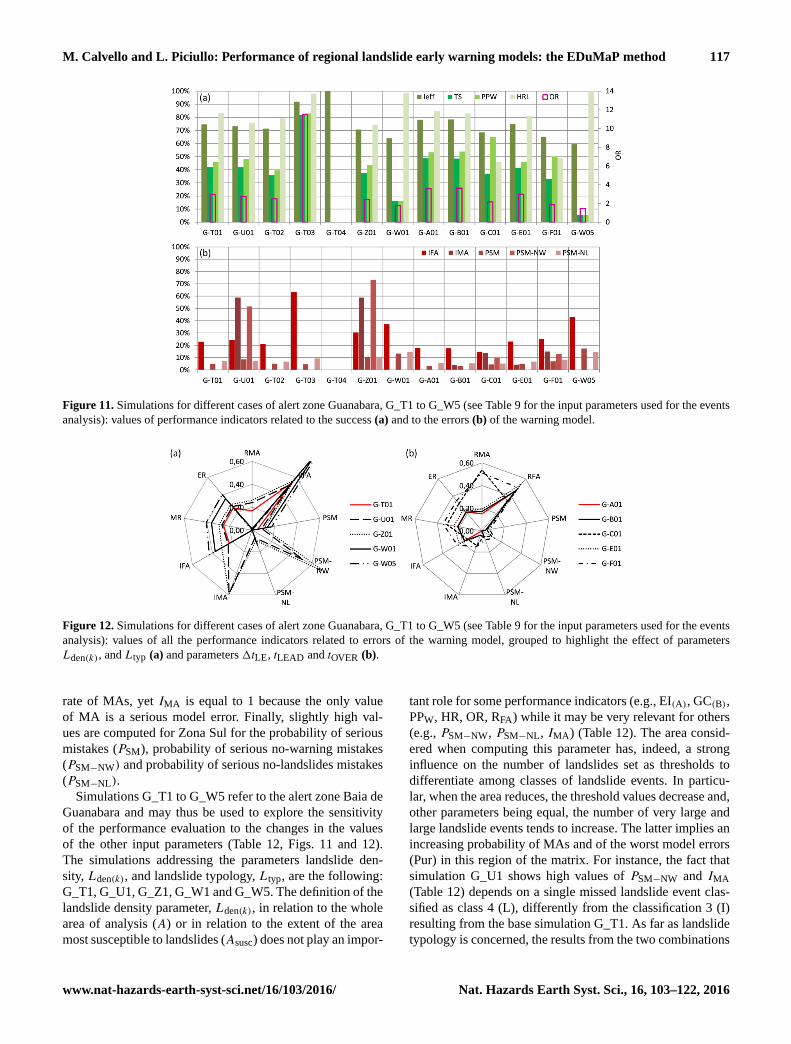
Figure 11. Simulations for different cases of alert zone Guanabara, G_T1 to G_W5 (see Table 9 for the input parameters used for the events
analysis): values of performance indicators related to the success (a) and to the errors (b) of the warning model.
Figure 12. Simulations for different cases of alert zone Guanabara, G_T1 to G_W5 (see Table 9 for the input parameters used for the events
analysis): values of all the performance indicators related to errors of the warning model, grouped to highlight the effect of parameters
Lden(k), and Ltyp (a) and parameters 1tLE, tLEAD and tOVER (b).
rate of MAs, yet IMA is equal to 1 because the only value
of MA is a serious model error. Finally, slightly high val-
ues are computed for Zona Sul for the probability of serious
mistakes (PSM), probability of serious no-warning mistakes
(PSM−NW) and probability of serious no-landslides mistakes
(PSM−NL).
Simulations G_T1 to G_W5 refer to the alert zone Baia de
Guanabara and may thus be used to explore the sensitivity
of the performance evaluation to the changes in the values
of the other input parameters (Table 12, Figs. 11 and 12).
The simulations addressing the parameters landslide den-
sity, Lden(k), and landslide typology, Ltyp, are the following:
G_T1, G_U1, G_Z1, G_W1 and G_W5. The definition of the
landslide density parameter, Lden(k), in relation to the whole
area of analysis (A) or in relation to the extent of the area
most susceptible to landslides (Asusc) does not play an impor-
tant role for some performance indicators (e.g., EI(A), GC(B),
PPW, HR, OR, RFA) while it may be very relevant for others
(e.g., PSM−NW, PSM−NL, IMA) (Table 12). The area consid-
ered when computing this parameter has, indeed, a strong
influence on the number of landslides set as thresholds to
differentiate among classes of landslide events. In particu-
lar, when the area reduces, the threshold values decrease and,
other parameters being equal, the number of very large and
large landslide events tends to increase. The latter implies an
increasing probability of MAs and of the worst model errors
(Pur) in this region of the matrix. For instance, the fact that
simulation G_U1 shows high values of PSM−NW and IMA
(Table 12) depends on a single missed landslide event clas-
sified as class 4 (L), differently from the classification 3 (I)
resulting from the base simulation G_T1. As far as landslide
typology is concerned, the results from the two combinations
www.nat-hazards-earth-syst-sci.net/16/103/2016/ Nat. Hazards Earth Syst. Sci., 16, 103–122, 2016
118 M. Calvello and L. Piciullo: Performance of regional landslide early warning models: the EDuMaP method
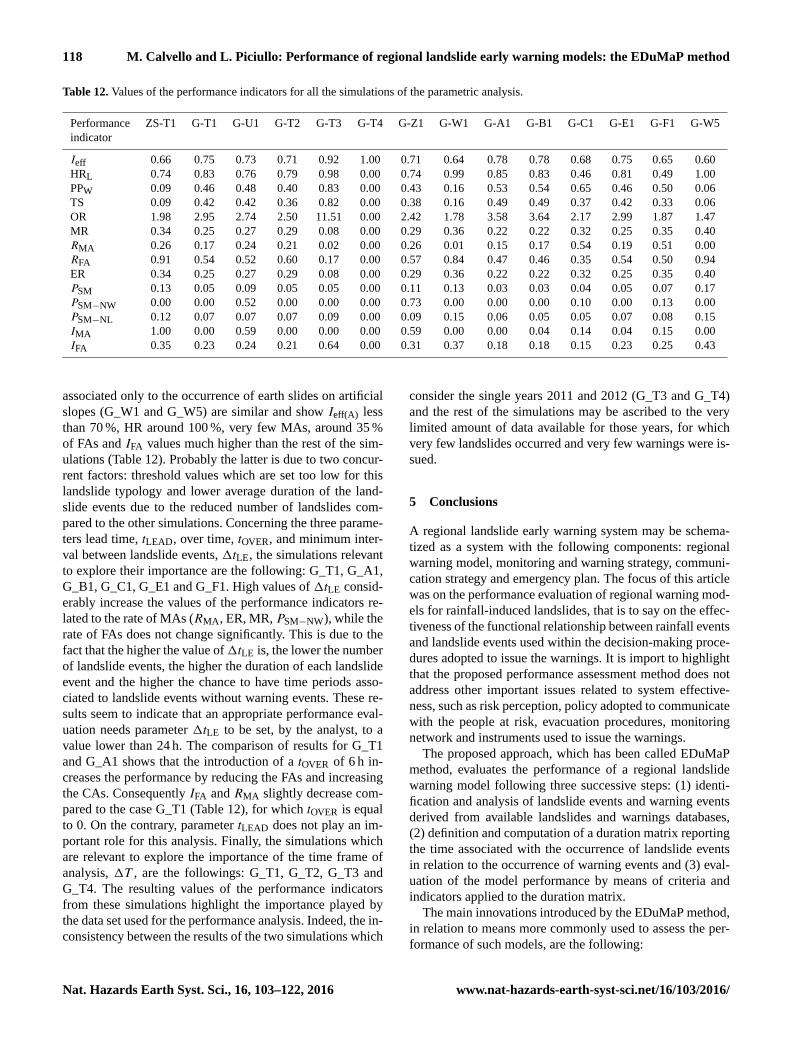
Table 12. Values of the performance indicators for all the simulations of the parametric analysis.
Performance ZS-T1 G-T1 G-U1 G-T2 G-T3 G-T4 G-Z1 G-W1 G-A1 G-B1 G-C1 G-E1 G-F1 G-W5
indicator
Ieff 0.66 0.75 0.73 0.71 0.92 1.00 0.71 0.64 0.78 0.78 0.68 0.75 0.65 0.60
HRL 0.74 0.83 0.76 0.79 0.98 0.00 0.74 0.99 0.85 0.83 0.46 0.81 0.49 1.00
PPW 0.09 0.46 0.48 0.40 0.83 0.00 0.43 0.16 0.53 0.54 0.65 0.46 0.50 0.06
TS 0.09 0.42 0.42 0.36 0.82 0.00 0.38 0.16 0.49 0.49 0.37 0.42 0.33 0.06
OR 1.98 2.95 2.74 2.50 11.51 0.00 2.42 1.78 3.58 3.64 2.17 2.99 1.87 1.47
MR 0.34 0.25 0.27 0.29 0.08 0.00 0.29 0.36 0.22 0.22 0.32 0.25 0.35 0.40
RMA 0.26 0.17 0.24 0.21 0.02 0.00 0.26 0.01 0.15 0.17 0.54 0.19 0.51 0.00
RFA 0.91 0.54 0.52 0.60 0.17 0.00 0.57 0.84 0.47 0.46 0.35 0.54 0.50 0.94
ER 0.34 0.25 0.27 0.29 0.08 0.00 0.29 0.36 0.22 0.22 0.32 0.25 0.35 0.40
PSM 0.13 0.05 0.09 0.05 0.05 0.00 0.11 0.13 0.03 0.03 0.04 0.05 0.07 0.17
PSM−NW 0.00 0.00 0.52 0.00 0.00 0.00 0.73 0.00 0.00 0.00 0.10 0.00 0.13 0.00
PSM−NL 0.12 0.07 0.07 0.07 0.09 0.00 0.09 0.15 0.06 0.05 0.05 0.07 0.08 0.15
IMA 1.00 0.00 0.59 0.00 0.00 0.00 0.59 0.00 0.00 0.04 0.14 0.04 0.15 0.00
IFA 0.35 0.23 0.24 0.21 0.64 0.00 0.31 0.37 0.18 0.18 0.15 0.23 0.25 0.43
associated only to the occurrence of earth slides on artificial
slopes (G_W1 and G_W5) are similar and show Ieff(A) less
than 70 %, HR around 100 %, very few MAs, around 35 %
of FAs and IFA values much higher than the rest of the sim-
ulations (Table 12). Probably the latter is due to two concur-
rent factors: threshold values which are set too low for this
landslide typology and lower average duration of the land-
slide events due to the reduced number of landslides com-
pared to the other simulations. Concerning the three parame-
ters lead time, tLEAD, over time, tOVER, and minimum inter-
val between landslide events, 1tLE, the simulations relevant
to explore their importance are the following: G_T1, G_A1,
G_B1, G_C1, G_E1 and G_F1. High values of 1tLE consid-
erably increase the values of the performance indicators re-
lated to the rate of MAs (RMA, ER, MR, PSM−NW), while the
rate of FAs does not change significantly. This is due to the
fact that the higher the value of 1tLE is, the lower the number
of landslide events, the higher the duration of each landslide
event and the higher the chance to have time periods asso-
ciated to landslide events without warning events. These re-
sults seem to indicate that an appropriate performance eval-
uation needs parameter 1tLE to be set, by the analyst, to a
value lower than 24 h. The comparison of results for G_T1
and G_A1 shows that the introduction of a tOVER of 6 h in-
creases the performance by reducing the FAs and increasing
the CAs. Consequently IFA and RMA slightly decrease com-
pared to the case G_T1 (Table 12), for which tOVER is equal
to 0. On the contrary, parameter tLEAD does not play an im-
portant role for this analysis. Finally, the simulations which
are relevant to explore the importance of the time frame of
analysis, 1T , are the followings: G_T1, G_T2, G_T3 and
G_T4. The resulting values of the performance indicators
from these simulations highlight the importance played by
the data set used for the performance analysis. Indeed, the in-
consistency between the results of the two simulations which
consider the single years 2011 and 2012 (G_T3 and G_T4)
and the rest of the simulations may be ascribed to the very
limited amount of data available for those years, for which
very few landslides occurred and very few warnings were is-
sued.
5 Conclusions
A regional landslide early warning system may be schema-
tized as a system with the following components: regional
warning model, monitoring and warning strategy, communi-
cation strategy and emergency plan. The focus of this article
was on the performance evaluation of regional warning mod-
els for rainfall-induced landslides, that is to say on the effec-
tiveness of the functional relationship between rainfall events
and landslide events used within the decision-making proce-
dures adopted to issue the warnings. It is import to highlight
that the proposed performance assessment method does not
address other important issues related to system effective-
ness, such as risk perception, policy adopted to communicate
with the people at risk, evacuation procedures, monitoring
network and instruments used to issue the warnings.
The proposed approach, which has been called EDuMaP
method, evaluates the performance of a regional landslide
warning model following three successive steps: (1) identi-
fication and analysis of landslide events and warning events
derived from available landslides and warnings databases,
(2) definition and computation of a duration matrix reporting
the time associated with the occurrence of landslide events
in relation to the occurrence of warning events and (3) eval-
uation of the model performance by means of criteria and
indicators applied to the duration matrix.
The main innovations introduced by the EDuMaP method,
in relation to means more commonly used to assess the per-
formance of such models, are the following:
Nat. Hazards Earth Syst. Sci., 16, 103–122, 2016 www.nat-hazards-earth-syst-sci.net/16/103/2016/
M. Calvello and L. Piciullo: Performance of regional landslide early warning models: the EDuMaP method 119
– recorded landslides and issued warnings are not ana-
lyzed as a series of individual occurrences but they are
grouped within landslide and warning events, respec-
tively, which consider their spatial and temporal charac-
teristics by means of 10 input parameters;
– the evaluation of the correlation between landslide and
warning events is based not on counting the pairs on
which the two data sets agree or disagree but rather on
computing the duration of the agreement/disagreement;
– the correspondence between landslide and warning
events is expressed not as a 2 by 2 confusion matrix
but as a matrix, herein called duration matrix, whose
number of columns and rows depends on the schemes
adopted to classify, respectively, landslide events and
warning events;
– the assessment of the duration matrix is based on per-
formance indicators derived from a set of performance
criteria, which must be defined by the system an-
alyst/manager considering the specific characteristics
and aims of the early warning system under evaluation.
Concerning the latter issue, two performance criteria have
been used herein. The first criterion is defined in accordance
to a standard alert classification scheme derived from a 2 by 2
contingency table, thus identifying correct alerts, false alerts,
missed alerts and true negatives. The second criterion is de-
fined by assigning a color code to the elements of matrix,
from green to purple, in relation to their grade of correct-
ness. Both criteria purposefully neglect the duration matrix
element d11, whose value is typically orders of magnitude
higher than the values of the other elements. Other criteria
could be used to assess the results of a duration matrix. It
is important to highlight, however, that a reasonable perfor-
mance criterion should keep the latter assumption. Indeed, if
a criterion does consider the value of the element d11, the re-
sulting performance indicators would be positively “biased”
for obvious reasons (i.e., rainfall-induced landslides do not
occur when it does not rain).
The applicability of the EDuMaP method has been tested
by conducting a parametric analysis using 3 years of land-
slides and warnings data from the municipal landslide early
warning system operating in Rio de Janeiro (Brazil). The in-
put parameters most affecting the results of the events anal-
ysis and, thus, the value of the elements of duration matrix
for the different simulations, are as follows: the landslide
density thresholds used to differentiate among the classes of
landslide events, the set of landslides considered in the sim-
ulations, the time set as the minimum time interval between
landslide events, the time interval between the last landslide
identified within a landslide event and the assumed ending
of the landslide event, the area of analysis and the time frame
of the analysis. For instance, the criterion herein employed to
define landslide density does not work well when the number
of landslides per unit area is computed using the area mapped
as the most susceptible instead of the whole area of analysis.
The latter does not mean that a higher number of landslides
occurs outside the most susceptible area; it only means that
the thresholds used in the criterion more adequately repre-
sent a landslide density computed over the whole alert zone.
Another parameter to which the results are very sensitive is
the time interval used to identify the number of landslides
to include within a single landslide event. When this period
becomes too long (equal to or higher than 24 h), the dura-
tion of some landslide events increases too much, and thus
some time intervals are misleadingly accounted for as seri-
ous missed alerts. Finally, as expected, the performance as-
sessment has proved to be very sensitive to the number of
data used, mainly function of the two parameters defining
the type of landslides and the time frame of the analysis. Of
course, the results of the performed analysis cannot be easily
generalized. This is true for a number of reasons: they have
to be considered specific of the warning model adopted by
the Rio de Janeiro early warning system; not all the input
parameters were tested in the parametric analysis; the time
for which both landslides and warnings data are available is
relatively short.
In conclusion, the EDuMaP method proved its applicabil-
ity to a real case study, by means of a sensitivity analysis
which also gave some preliminary indications on the relative
importance of the input parameters needed to apply it. The
EDuMaP method is proposed to be used for the performance
evaluation of any regional landslide early warning systems
for which landslides and warnings data are available. More-
over, given its characteristics, it may also be easily adapted
to evaluate the efficiency of regional early warning models
addressing other natural hazards.
Acknowledgements. The authors thank the GPE staff of the GEO-
Rio Foundation in Rio de Janeiro and Ricardo d’Orsi for their kind-
ness in sharing the databases used and their availability to share
information about the Alerta Rio early warning system.
The work described in this paper was financially supported by
the PhD programme of the civil engineering department at the Uni-
versity of Salerno and by the Project of National Relevance (PRIN)
“Landslide risk mitigation through sustainable countermeasures”,
funded by the Italian Ministry of Education (MIUR).
Edited by: T. Glade
Reviewed by: two anonymous referees
References
Aleotti, P.: A warning system for rainfall-induced shallow failures,
Eng. Geol., 73, 247–265, 2004.
Baum, R. L. and Godt, J. W.: Early warning of rainfall-induced shal-
low landslides and debris flows in the USA, Landslides, 7, 259–
272, 2010.
www.nat-hazards-earth-syst-sci.net/16/103/2016/ Nat. Hazards Earth Syst. Sci., 16, 103–122, 2016
120 M. Calvello and L. Piciullo: Performance of regional landslide early warning models: the EDuMaP method
Bell, R., Thiebes, B., Glade, T., Vinogradov, R., Kuhlmann, H.,
Schauerte, W., Burghaus, S., Krummel, H., Janik, M., and
Paulsen, H.: The technical concept within the Integrative Land-
slide Early Warning System (ILEWS), landslides and engineered
slopes, from the past to the future, in: Proceedings of the 10th In-
ternational Symposium on Landslides and Engineered Slopes,
30 June–4 July 2008, Xi’an, China, 1083–1088, 2008.
Berti, M., Martina, M. L. V., Franceschini, S., Pignone, A., Simoni,
A., and Pizziolo, M.: Probabilistic rainfall thresholds for land-
slide occurrence using a Bayesian approach, J. Geophys. Res.,
117, F04006, doi:10.1029/2012JF002367, 2012.
Blikra, L. H.: The Åknes rockslide: monitoring, threshold values
and early-warning, in: Landslides and Engineered Slopes, edited
by: Chen, Z., Zhang, J. M., Ho, K., Wu, F. Q., and Li, Z. K.,
Taylor & Francis Group, London, 1089–1094, 2008.
Calvello, M., d’Orsi, R., Piciullo, L., Paes, N. M., Magalhaes,
M. A., Coelho, R., and Lacerda, W. A.: The community-based
alert and alarm system for rainfall induced landslides in Rio de
Janeiro, Brazil, in: Engineering Geology for Society and Ter-
ritory “Landslide Processes”, Proc. XII Int. IAEG Congress,
Torino, Italy, 2, 653–657, doi:10.1007/978-3-319-09057-3_109,
2015a.
Calvello, M., d’Orsi, R. N., Piciullo, L., Paes, N., Magalhaes, M.,
and Lacerda, W. A.: The Rio de Janeiro early warning system for
rainfall-induced landslides: analysis of performance for the years
2010–2013, Int. J. Disast. Risk Reduc., 12, 3–15, 2015b.
Cannon, S., Boldt, E., Laber, J., Kean, J., and Staley, D.: Rainfall
intensity–duration thresholds for postfire debris-flow emergency
response planning, Nat. Hazards, 59, 209–236, 2011.
Capparelli, G. and Tiranti, D.: Application of the MoniFLaIR early
warning system for rainfall induced landslides in Piedmont re-
gion (Italy), Landslides, 7, 401–410, 2010.
Chan, R. K. S. and Pun, W. K.: Landslip warning system in Hong
Kong, Geotec. Instrum. News, 22, 33–35, 2004.
Cheung, P. Y., Wong, M. C., and Yeung, H. Y.: Application of rain-
storm nowcast to real-time warning of landslide hazards in Hong
Kong, in: WMO PWS, Workshop on Warnings of Real-Time
Hazards by Using Nowcasting Technology, 9–13 October 2006,
Sydney, Australia, 2006.
Chleborad, A. F.: A Method for Anticipating the Occurrence of Pre-
cipitation induced Landslides in Seattle, Washington, US Geo-
logical Survey, Open-File Report 00-469, US Geological Survey,
Denver, USA, 29 pp., 2000.
Chleborad, A. F., Baum, R. L., and Godt, J. W.: A prototype sys-
tem for forecasting landslides in the Seattle, Washington, Area.
in: Engineering Geology and Landslides of the Seattle, Washing-
ton, Area: Geological Society of America Reviews in Engineer-
ing Geology, edited by: Highland, L. M., Baum, R. L., and Godt,
J. W., Geological Society of America, Boulder, 103–120, 2008.
Coelho Netto, A. L., Avelar, A. S., Fernandes, M. C., and Lac-
erda, W. A.: Landslide susceptibility in a mountainous geoe-
cosystem, Tijuca Massif, Rio de Janeiro: The role of morpho-
metric subdivision of the terrain, Geomorphology, 87, 120–131,
doi:10.1016/j.geomorph.2006.03.041, 2007.
Devoli, G., Ingeborg, K., Monica, S., Nils-Kristian, O., Ragnar,
E., Erik, J., and Hervé, C.: Landslide early warning system and
web tools for real-time scenarios and for distribution of warning
messages in Norway, in: Engineering Geology for Society and
Territory “Landslide Processes”, Proc. XII Int. IAEG Congress,
Torino, Italy, 625–629, doi:10.1007/978-3-319-09057-3_104,
2015.
DGR: n. 2312 del 27/12/2007, Deliberazione di Giunta Regionale
dell’Umbria: Disposizioni in attuazione dell’art, 3 bis della
Legge 100/2012 e della Direttiva del Presidente del Consiglio
dei Ministri del 27.02.2004 – Sistema di Allertamento Regionale
e Centro Funzionale Regionale, Umbria, Italy, 2007.
DGR: n. 895 del 29/18/2013, Deliberazione di Giunta Regionale
della Toscana: Sistema di Allertamento Regionale e Centro Fun-
zionale Regionale, Bollettino ufficiale della regione Toscana,
n. 46 del 13/11/2013, Toscana, Italy, 2013.
DGR: n. 395 del 7/04/2015, Deliberazione di Giunta Regionale
della Toscana: Sistema di Allertamento Regionale e Centro Fun-
zionale Regionale, Bollettino ufficiale della regione Toscana,
n. 15 del 15/4/2015, Toscana, Italy, 2015.
Di Biagio, E. and Kjekstad, O.: Early Warning, Instrumentation
and Monitoring Landslides, in: Proceedings of the 2nd Regional
Training Course, RECLAIM II, 29 January–2 February 2007,
Phuket, Thailand, 2007.
d’Orsi, R. N.: Landslide risk reduction measures by the Rio
de Janeiro city government, in: Improving the Assessment
of Disaster Risks to Strengthen Financial Resilience, Spe-
cial Joint G20 Publication, Government of Mexico and
World Bank, 77–91, available at: http://www.preventionweb.net/
english/professional/publications/v.php?id=29011 (last access:
6 October 2015), 2012.
d’Orsi, R. N., D’Avila, C., Ortigao, J. A. R., Moraes, L., and San-
tos, M. D.: Rio-Watch: the Rio de Janeiro landslide watch, in:
Proceedings of the 2nd PSL Pan-Am Symposium on Landslides,
Rio de Janeiro, Brazil, 21–30, 1997.
d’Orsi, R. N., Feijó, R. L., and Paes, N. M.: 2,500 Operational days
of Alerta Rio system: history and technical improvements of Rio
de Janeiro warning system for severe weather, in: Landslides:
Evaluation and Stabilization, edited by: Lacerda, W. A., Ehrlich,
M., Fontoura, S. A. B., and Sayao, A. S. F., Taylor & Francis
Group, London, 831–836, 2004.
DPCM: 27/02/2004, Direttiva Presidente Consiglio dei Ministri: In-
dirizzi operativi per la gestione operativa e funzionale del sistema
di allertamento nazionale, statale e regionale per il rischio idro-
geologico ed idraulico ai fini di protezione civile, in: Gazzetta
Ufficiale n. 59 del 11/03/2004, Roma, Italy, 2004.
DPGR: n. 299 del 30/06/2005, Decreto del Presidente della Giunta
Regionale della Campania: Il Sistema di Allertamento Re-
gionale per il rischio Idrogeologico e Idraulico ai fini di pro-
tezione civile, Bollettino ufficiale della regione Campania, n. spe-
ciale 01/08/2005, Campania, Italy, 2005.
DPRS: n. 626/GAB del 30/10/2014, Direttiva del Presidente della
Regione Siciliana: Competenze, struttura organizzativa e proce-
dure di allertamento del Centro Funzionale Decentrato Multiris-
chio Integrato della Regione Siciliana – Settore IDRO, Sicilia,
Italy, 2014.
Fell, R., Ho, K. K. S., Lacasse, S., and Leroi, E.: A framework for
landslide risk assessment and management, in: Landslide Risk
Management, edited by: Hungr, O., Fell, R., Couture, R., and
Eberhardt, E., Taylor and Francis, London, 3–26, 2005.
Gariano, S. L., Brunetti, M. T., Iovine, G., Melillo, M., Peruccacci,
S., Terranova, O., Vennari, C., and Guzzetti, F.: Calibration and
validation of rainfall thresholds for shallow landslide forecasting
in Sicily, southern Italy, Geomorphology, 228, 653–665, 2015.
Nat. Hazards Earth Syst. Sci., 16, 103–122, 2016 www.nat-hazards-earth-syst-sci.net/16/103/2016/
M. Calvello and L. Piciullo: Performance of regional landslide early warning models: the EDuMaP method 121
Glade, T. and Nadim, F.: Early warning systems for natural hazards
and risks, Nat. Hazards, 70, 1669–1671, 2014.
Godt, J. W., Baum, R. L., and Chleborad, A. F.: Rainfall character-
istics for shallow landsliding in Seattle, Washington, USA, Earth
Surf. Proc. Land., 31, 97–110, 2006.
Greco, R., Giorgio, M., Capparelli, G., and Versace, P.: Early warn-
ing of rainfall-induced landslides based on empirical mobility
function predictor, Eng. Geol., 153, 68–79, 2013.
Guzzetti, F., Peruccacci, S., Rossi, M., and Stark, C. P.: Rainfall
thresholds for the initiation of landslides in central and southern
Europe, Meteorol. Atmos. Phys., 98, 239–67, 2007.
Hyogo Framework for Action 2005–2015: Building the Resilience
of Nations and Communities to Disasters, World Conference on
Disaster Reduction 18–22 January 2005, Kobe, Hyogo, Japan,
22 pp., 2005.
International Centre of Geohazards: Guidelines for landslide mon-
itoring and early warning systems in Europe – design and re-
quired technology, in: Project SafeLand “Living With Landslide
Risk in Europe: Assessment, Effects of Global Change, and Risk
Management Strategies”, D4.8, http://www.safeland-fp7.eu (last
access: April 2015), 2012.
Intrieri, E., Gigli, G., Mugnai, F., Fanti, R., and Casagli, N.: Design
and implementation of a landslide early warning system, Eng.
Geol., 147/148, 124–136, 2012.
Intrieri, E., Gigli, G., Casagli, N., and Nadim, F.: Brief com-
munication “Landslide Early Warning System: toolbox and
general concepts”, Nat. Hazards Earth Syst. Sci., 13, 85–90,
doi:10.5194/nhess-13-85-2013, 2013.
Keefer, D. K., Wilson, R. C., Mark, R. K., Brabb, E. E., Brown III,
W. M., Ellen, S. D., Harp, E. L., Wieczoreck, G. F., Alger, C.
S., and Zatkin, R. S.: Real-time landslide warning during heavy
rainfall, Science, 238, 921–926, 1987.
Kirschbaum, D. B., Adler, R., Hong, Y., Kumar, S., Peters-Lidard,
C., and Lerner-Lam, A.: Advances in landslide nowcasting:
evaluation of a global and regional modeling approach, Envi-
ron. Earth Sci., 66, 1683–1696, doi:10.1007/s12665-011-0990-3,
2012.
Lagomarsino, D., Segoni, S., Fanti, R., and Catani, F.: Updating and
tuning a regional-scale landslide early warning system, Land-
slides, 10, 91–97, 2013.
Lagomarsino, D., Segoni, S., Rosi, A., Rossi, G., Battistini, A.,
Catani, F., and Casagli, N.: Quantitative comparison between
two different methodologies to define rainfall thresholds for land-
slide forecasting, Nat. Hazards Earth Syst. Sci., 15, 2413–2423,
doi:10.5194/nhess-15-2413-2015, 2015.
Lollino, G., Arattano, M., and Cuccureddu, M.: The use of the auto-
matic inclinometric system for landslide early warning: the case
of Cabella Ligure (North-Western Italy), Phys. Chem. Earth, 27,
1545–1550, 2002.
Martelloni, G., Segoni, S., Fanti, R., and Catani, F.: Rainfall thresh-
olds for the forecasting of landslide occurrence at regional scale,
Landslides, 9, 485–495, 2012.
Maskrey, A.: Report on National and Local Capabilities for
Early Warning, IDNDR Early Warning Programme, avail-
able at: http://www.unisdr.org/2006/ppew/whats-ew/pdf/
national-and-local-capabilities-ew-maskrey.pdf last access:
15 July 2015, IDNDR Secretariat, Geneva, 33 pp., 1997.
Michoud, C., Bazin, S., Blikra, L. H., Derron, M.-H., and Jaboyed-
off, M.: Experiences from site-specific landslide early warn-
ing systems, Nat. Hazards Earth Syst. Sci., 13, 2659–2673,
doi:10.5194/nhess-13-2659-2013, 2013.
NOAA-USGS Debris Flow Task Force: NOAA-USGS Debris-Flow
Warning System, Final report, US Geological Survey Circu-
lar 1283, available at: http://pubs.usgs.gov/circ/2005/1283/pdf/
Circular1283.pdf, last access: November 2014, US Geological
Survey, Reston, Virginia, USA, 47 pp., 2005.
Osanai, N., Shimizu, T., Kuramoto, K., Kojima, S., and Noro, T.:
Japanese early-warning for debris flows and slope failures using
rainfall indices with Radial Basis Function Network, Landslides,
7, 325–338, 2010.
Peres, D. J. and Cancelliere, A.: Development of rainfall thresholds
for landslide early warning in Sicily: a method based on the use
of rainfall annual maxima series, Rend. Online Soc. Geol. It., 21,
580–582, 2012.
Restrepo, P., Jorgensen, D. P., Cannon, S. H., Costa, J., Laber,
J., Major, J., Martner, B., Purpura, J., and Werner, K.: Joint
NOAA/NWS/USGS prototype debris flow warning system for
recently burned areas in southern California, B. Am. Meteorol.
Soc., 89, 1845, doi:10.1175/2008BAMS2416.1, 2008.
Rossi, M., Peruccacci, S., Brunetti, M. T., Marchesini, I., Lu-
ciani, S., Ardizzone, F., Balducci, V., Bianchi, C., Cardinali, M.,
Fiorucci, F., Mondini, A. C., Reichenbach, P., Salvati, P., San-
tangelo, M., Bartolini, D., Gariano, S. L., Palladino, M., Ves-
sia, G., Viero, A., Antronico, L., Borselli, L., Deganutti, A. M.,
Iovine, G., Luino, F., Parise, M., Polemio, M., and Guzzetti, F.:
SANF: National warning system for rainfall-induced landslides
in Italy, in: Landslides and Engineered Slopes: Protecting Soci-
ety through Improved Understanding, edited by: Eberhardt, E.,
Froese, C., Turner, K., and Leroueil, S., Taylor & Francis, Lon-
don, 1895–1899, 2012.
Segoni, S., Rossi, G., Rosi, A., and Catani, F.: Landslides trig-
gered by rainfall: a semiautomated procedure to define consistent
intensity-duration thresholds, Comput. Geosci., 3063, 123–131,
2014.
Segoni, S., Battistini, A., Rossi, G., Rosi, A., Lagomarsino, D.,
Catani, F., Moretti, S., and Casagli, N.: Technical Note: An oper-
ational landslide early warning system at regional scale based on
space–time-variable rainfall thresholds, Nat. Hazards Earth Syst.
Sci., 15, 853–861, doi:10.5194/nhess-15-853-2015, 2015.
Stähli, M., Sättele, M., Huggel, C., McArdell, B. W., Lehmann, P.,
Van Herwijnen, A., Berne, A., Schleiss, M., Ferrari, A., Kos, A.,
Or, D., and Springman, S. M.: Monitoring and prediction in early
warning systems for rapid mass movements, Nat. Hazards Earth
Syst. Sci., 15, 905–917, doi:10.5194/nhess-15-905-2015, 2015.
Staley, D. M., Kean, J. W., Cannon, S. H., Schmidt, K. M., and
Laber, J. L.: Objective definition of rainfall intensity–duration
thresholds for the initiation of post-fire debris flows in southern
California, Landslides, 10, 547–562, doi:10.1007/s10346-012-
0341-9, 2013.
Thiebes, B., Glade, T., and Bell, R.: Landslide analysis and inte-
grative early warning-local and regional case studies, in: Land-
slides and Engineered Slopes: Protecting Society through Im-
proved Understanding, edited by: Eberhardt, E., Taylor & Francis
Group, London, 1915–1921, 2012.
Thiebes, B., Bell, R., Glade, T., Jäger, S., Mayer, J., Anderson,
M., and Holcombe, L.: Integration of a limit-equilibrium model
into a landslide early warning system, Landslides, 11, 859–875,
doi:10.1007/s10346-013-0416-2, 2013a.
www.nat-hazards-earth-syst-sci.net/16/103/2016/ Nat. Hazards Earth Syst. Sci., 16, 103–122, 2016
122 M. Calvello and L. Piciullo: Performance of regional landslide early warning models: the EDuMaP method
Thiebes, B., Glade, T., and Bell, R.: Landslide analysis and integra-
tive early warning local and regional case studies, in: Landslides
and Engineered Slopes, edited by: Eberhardt, E., Froese, C. R.,
Turner, A. K., and Leroueil, S., Taylor & Francis Group, London,
1915–1921, 2013b.
Tiranti, D. and Rabuetti, D.: Estimation of rainfall thresholds trig-
gering shallow landslides for an operational warning system im-
plementation, Landslides, 7, 471–481, 2010.
Villagrán de León, J. C., Pruessner, I., and Breedlove, H.: Alert
and Warning Frameworks in the Context of Early Warning Sys-
tems, a Comparative Review, Intersections No. 12, United Na-
tions University Institute for Environment and Human Security,
Bonn, 2013.
Wilson, R. C.: The rise and fall of a debris-flow warning system for
the San Francisco Bay Region, California, in: Landslide Hazard
and Risk, edited by: Glade, T., Anderson, M., and Crozier, M. J.,
Wiley, New York, 493–516, 2004.
Yu, Y. F., Lam, J. S., and Siu, C. K.: Interim Report on Review
of Landslip Warning Criteria, Special Projects Division, Special
Project Report 4/2003, Geotechnical Engineering Office, Civil
Engineering Department, SAR Government, Hong Kong, 20 pp.,
2003.
Nat. Hazards Earth Syst. Sci., 16, 103–122, 2016 www.nat-hazards-earth-syst-sci.net/16/103/2016/