Embed Size (px)
Citation preview

Hacettepe University Graduate School of Social Sciences
Department of Information Management
ASSESSING THE DIFFUSION OF NANOTECHNOLOGY IN TURKEY:
A SOCIAL NETWORK ANALYSIS APPROACH
Hamid Derviş
Ph.D. Dissertation
Ankara, 2014
TÜRKİYE' DE NANOTEKNOLOJİ YAYILIMININ DEĞERLENDİRİLMESİ:
BİR SOSYAL AĞ ANALİZİ YAKLAŞIMI
Hamid Derviş
Doktora Tezi
Hacettepe Üniversitesi Sosyal Bilimler Enstitüsü
Bilge ve Belge Yönetimi Bölümü
Ankara, 2014

KABUL VE ONAY
Hamid Derviş tarafından hazırlanan “Assessing the diffusion of nanotechnology in Turkey:
A social network analysis approach” başlıklı bu çalışma, 20 Ocak 2014 tarihinde yapılan
savunma sınavı sonucunda başarılı bulunarak jürimiz tarafından Doktora tezi olarak kabul
edilmiştir.
Prof. Dr. Aydın ERAR (Başkan)
Prof. Dr. Yaşar TONTA (Danışman)
Prof. Dr. Serap KURBANOĞLU
Doç. Dr. Umut AL
Doç. Dr. Yurdagül ÜNAL
Yukarıdaki imzaların adı geçen öğretim üyelerine ait olduğunu onaylarım.
Enstitü Müdürü
Prof. Dr. Yusuf ÇEİK


iii
ACKNOWLEDGEMENTS
I would like to express my gratitude toward Prof. Dr. Yaşar Tonta during my research for his
dedicated review and corrections; also, I would like to thank the members of the jury: Prof.
Dr. Serap Kurbanoğlu, Prof. Dr. Aydın Erar, Associate Prof. Dr. Umut Al and Associate
Prof. Dr. Yurdagül Ünal. Last, but not least, I would like to express my appreciation to the
Department of Information Management of Hacettepe University for their unwavering
support during my studies.

iv
ABSTRACT
Hamid Derviş. Assessing the Diffusion of Nanotechnology in Turkey: A Social Network
Analysis Approach. Ph.D. Dissertation, Ankara, 2014.
This dissertation assesses the diffusion of nanoscience and nanotechnology in the scientific
community in the last decade using Social Network Analysis (SNA) in Turkey. This
dissertation aims to evaluate the flow of knowledge diffusion of nanotechnology among
scientists by using ethnographic methods, co-words analysis and by focusing on an
invisible college in the scientific community in terms of citation analysis in Turkey. A total
of 10,062 articles and reviews were extracted from WoS (2664 between 2000 and 2005,
and 7398 between 2006 and 2011) using a compound text query. Results compiled from
co-authorship network analysis comprised a high closeness centrality indicating the small-
world phenomenon which facilitates the diffusion of nano-related technology in Turkey.
We discovered the scientists who are instrumental in the diffusion of nanotechnology
knowledge in the network. We test the hypotheses that: (1) prolific authors stimulate the
diffusion of nanotechnology in network structure; (2) dissemination of nanotechnology is
more diffusive within sub-clusters than that of the whole network structure; and (3)
taxonomy identified by co-word analysis in the research process matches the findings at
the global level. Universities with the highest co-occurrence in terms of centralities in the
network structure were studied. Then, we compared the results from each period to
investigate the rate of diffusion of nano-related technology in Turkey. We found out that
research on nano-related technology is done in a wide spectrum from Materials to
Biomedical Sciences. Moreover, we found that TÜBİTAK and the Ministry of
Development (MoD) have increased their funding support. We corroborate the findings by
interviewing the key scientists or authors who are instrumental in the diffusion of nano-
related technologies in Turkey. We collected and elaborated on 10 interviewees’ responses
using a qualitative method (Latent Semantic Analysis). Outcomes indicated that scientists’

v
behavior who participated in interviews share similar patterns matching their co-authorship
maps. It was concluded that the diffusion of nano-related technology is steadily
progressing due to scientific collaboration among scientists through social network.
Key words
Social network analysis, Nanotechnology, Science mapping, Latent semantic analysis,
overlay maps, Ethnographic interviews

vi
ÖZET
Hamid Derviş. Türkiye'de Nanoteknoloji Yayılımının Değerlendirilmesi: Bir Sosyal Ağ
Analizi Yaklaşımı. Doktora Tezi, Ankara, 2014.
Bu tez, Sosyal Ağ Analizi metodunu (SNA) kullanarak son on yılda Türkiye'de nanobilim
ve nanoteknolojinin yayılmasını ölçmektedir. Bu tez aynı zamanda, etnografik yöntemler,
eş kelime analizi, bilim dünyasındaki “invisible college” ilişkilerine odaklanarak ve atıfları
inceleyerek bilim insanları arasında nanoteknoloji bilgisinin yayılımını ve akışını
değerlendirmeyi amaçlamaktadır. Tezde bileşik bir sorgu cümlesi ile “Web of Science”da
yayınlanmış (WoS) 10.062 makale ve eleştiri yazısı (2664 tanesi 2000-2005 yılları
arasında, 7398 tanesi ise 2006-2010 yılları arasında yayınlanmış) incelenmiştir. Eş yazarlık
ağ analizi sonuçlarına göre yakınlık merkeziliği katsayısı yüksektir. Bu da Türkiye’de
nanoteknolojinin yayılımını kolaylaştıran “küçük dünya” olgusunun varlığına işaret
etmektedir. Ağda nanoteknolojinin yayılımında etkili olan bilimciler olduğunu bulduk.
Araştırma hipotezi nanoteknolojinin yayılımını gösteren sosyal ağ özellikleri incelenerek
test edilmiştir. Hipotez üç aşamada sınanmıştır: (1) Üretken yazarlar ağ yapısında
nanoteknoloji yayılımını tetiklemektedir; (2) Nanoteknolojinin yayılımı alt kümelerde daha
hızlıdır; ve (3) Eş kelime analiziyle elde edilen taksonomi küresel düzeydeki bulgularla
benzerlik göstermektedir. Ağ yapısı içinde en yüksek merkezilik derecesine sahip olan
üniversiteler üzerinde çalışılmıştır. Sonra, Türkiye'de nano teknolojilerin yayılma hızını
analiz etmek için her iki dönemin sonuçları karşılaştırılmıştır. Nanoteknoloji alanı ile ilgili
araştırmaların Malzeme Bilimi ile Biyomedikal Bilim arasında geniş bir yelpazede
yapıldığı sonucuna ulaşılmıştır. Bunun yanı sıra, TÜBİTAK ve Kalkınma Bakanlığının
nano teknolojilere yönelik mali desteklerinin arttığı gözlenmiştir. Türkiye’de nano
teknolojilerin yayılmasında etkili olan tanınmış bilimciler ile yapılan yüz yüze
görüşmelerle analiz sonuçları doğrulanmıştır. Yapılan 10 görüşmede verilen cevaplar
niteliksel analiz yöntemi olan Gizli Anlam Analizi yöntemi kullanılarak analiz edilmiştir.
Sonuçlar görüşmelere katılan bilimcilerin genellikle kendi grupları (küme) içinde
çalışmayı tercih ettiklerini göstermektedir. Bilimciler arasındaki bilimsel işbirliğinin sosyal

vii
ağlar aracılığıyla artmasına bağlı olarak nano teknolojinin yayılımının devam etmekte
olduğu sonucuna varılmıştır.
Anahtar Sözcükler
Sosyal ağ analizi, Nanoteknoloji, Bilim haritalama, Gizli anlam analizi, Bindirme haritalar,
Etnografik görüşmeler
TABLE OF CONTENTS
KABUL VE ONAY ......................................................................................................... i
BİLDİRİM ...................................................................................................................... ii
ACKNOWLEDGEMENTS .......................................................................................... iii
ABSTRACT ................................................................................................................... iv
ÖZET .............................................................................................................................. vi
TABLE OF CONTENTS ............................................................................................ viii
LIST OF TABLES ....................................................................................................... xii
LIST OF FIGURES .................................................................................................... xiii
CHAPTER 1: INTRODUCTION .................................................................................. 1
1.1 RATIONALE OF THE STUDY ............................................................................ 1
1.2 RESEARCH PROBLEM ....................................................................................... 2
1.3 CONCEPTUAL MODEL FOR RESEARCH PROBLEM: DIFFUSION
OF AN INNOVATION ......................................................................................... 4
1.4 RESEARCH QUESTIONS AND HYPOTHESES .............................................. 8
CHAPTER 2: LITERATURE REVIEW .................................................................... 10
2.1 SOCIAL NETWORK ANALYSIS AND ITS THEORETICAL BASICS ..... 10
2.2 THE “SMALL WORLD” PHENOMENON ..................................................... 11
2.3 THE DIFFUSION OF INNOVATIONS ............................................................ 15
2.4 THE GRAPH THEORY ..................................................................................... 16
2.5 CO-WORD ANALYSIS: MAPPING THE COGNITIVE STRUCTURE
OF NANO-RELATED TECHNOLOGIES ....................................................... 19
2.6 NANOTECHNOLOGY DEVELOPMENT IN TURKEY ............................... 19

ix
2.7 GROWTH AND DIFFUSION OF NANOTECHNOLOGY
AT THE GLOBAL LEVEL .............................................................................. 21
2.8 MAPPING THE DIFFUSION OF THE KNOWLEDGE ................................ 22
2.9 OVERLAY MAPS ............................................................................................... 23
2.10 ETHNOGRAPHIC METHOD: LATENT SEMANTIC ANALYSIS
APPROACH ......................................................................................................... 25
2.11 SUMMARY ........................................................................................................ 27
CHAPTER 3: RESEARCH METHOD AND DATA PROCESSING ..................... 28
3.1 SOCIAL NETWORK ANALYSIS: STATISTICAL RESULTS ..................... 29
3.2 ETHNOGRAPHIC INTERVIEWS .................................................................... 30
3.3 LATENT SEMANTIC ANALYSIS APPROACH ............................................. 31
3.4 SUMMARY ........................................................................................................... 31
CHAPTER4: FINDINGS ............................................................................................. 33
4.1 GOVERNMENTAL AGENCIES’ SUPPORT ................................................... 33
4.2 CO-UNIVERSITIES ANALYSIS ....................................................................... 37
4.3 THE RATE OF DIFFUSION: 2000-2011 ........................................................... 45
4.4 NETWORK OF NANO-RELATED TECHNOLOGY IN TURKEY:
2000-2005 AND 2006-2011 .................................................................................. 47
4.5 NETWORK OF PUBLICATIONS IN NANO-RELATED
TECHNOLOGY IN TURKEY: 2000-2005 AND 2006-2011 ........................... 50
4.6 NETWORK OF NANO-RELATED TECHNOLOGY IN SELECTED
UNIVERSITIES: 2000-2005 ...................................................................................
4.7 NETWORK OF NANO-RELATED TECHNOLOGY IN SELECTED
UNIVERSITIES: 2006-2011 ............................................................................... 66
4.8 SUMMARY OF NANO-RELATED TECHNOLOGY IN SELECTED
UNIVERSITIES ................................................................................................... 80

x
4.9 CO-AUTHORSHIP ANALYSIS OF UNIVERSITIES:
2000-2005 AND 2006-2011 .................................................................................. 81
4.10 CO-AUTHORSHIP ANALYSIS OF SELECTED AUTHORS:
2000-2005 AND 2006-2011 .................................................................................. 83
4.11 FRACTIONAL COUNTING OF CO-AUTHORSHIP:
2005-2005 AND 2006-2011 .................................................................................. 87
4.12 CO-CITATION ANALYSIS: 2000-2005 AND 2006-2011 .............................. 90
4.13 JOURNALS CO-CITATION ANALYSIS: 2000-2005 AND 2006-2011 ........ 92
4.14 CO-WORD ANALYSIS: 2000-2005 AND 2006-2011 ...................................... 94
4.15 GEOGRAPHICAL DIFFUSION ...................................................................... 97
4.16 ETHNOGRAPHIC INTERVIEWS:
RESULTS AND ELABORATIONS ................................................................ 100
4.17 ETHNOGRAPHIC ELABORATION OF THE CO-AUTHORSHIP
MAPS .................................................................................................................. 101
4.18 SUMMARY OF THE FINDINGS ................................................................... 107
4.19 COMPARISON OF FINDINGS WITH RELEVANT STUDIES ................ 107
CHAPTER 5: CONCLUSION .................................................................................. 110
5.1 SUMMARY ......................................................................................................... 110
5.2 CONCLUSIONS ................................................................................................. 111
5.3 STRENGTHS AND WEAKNESSES OF THE THESIS ................................. 113
5.4 RECOMMENDATIONS ................................................................................... 114
5.5 FUTURE WORK ................................................................................................ 114
BIBLIOGRAPHY ...................................................................................................... 115
APPENDICES ............................................................................................................. 120
APPENDIX A: QUERY FORMATION USED TO FIND THE
PUBLICATIONS OF TURKISH RESEARCHERS ON
NANOSCIENCE AND NANOTECHNOLOGY ON THE WEB ............... 120

xi
APPENDIX B: SUBJECT CONSENT FORM ........................................................ 123
APPENDIX C: STRUCTURED INTERVIEW QUESTIONS ............................... 124
APPENDIX D: SEMI-STRUCTURED INTERVIEW QUESTIONS .................... 125
APPENDIX E: LIST OF WORDS USED IN NANOTECHNOLOGY:
2000-2005 .............................................................................................................. 126
APPENDIX F: LIST OF WORDS USED IN NANOTECHNOLOGY:
2006-2011 .............................................................................................................. 128
APPENDIX G: THE MOST COLLABORATING UNIVERSITIES
WORKING ON NANO-RELATED TECHNOLOGY (2000-2011) ............... 129

xii
LIST OF TABLES
Table 1. Matrix presentation of the incomplete graph depicted in Figure 4 ........................ 18
Table 2. Number of nano-related articles published and total funds received by several
universities ............................................................................................................... 37
Table 3. Top 15 universities with highest co-occurrence in Turkey ................................... 42
Table 4. Centrality coefficients of the network structure: 2000-2005 and 2006-2011 ....... 44
Table 5. Number of new and cumulative adopters between 2000 and 2011 ....................... 46
Table 6. Degree centralities of network structure based on WoS categories ....................... 48
Table 7. Centralities coefficients of the top 15 universities’ publications on
nano-related technology, 2000-2005 and 2006-2011.............................................. 50
Table 8. Network properties of top 15 Turkish authors based on co-authorship degree
centralities: 2000-2005 ............................................................................................. 84
Table 9. Network properties of top 15 authors based on degree centralities: 2006-2011 .... 86
Table 10. Highly prolific scholars in nano-related technology: 2000-2005 and
2006-2011 ................................................................................................................. 89
Table 11. The most co-cited papers in nano-related technology in Turkey, 2000-2005 ..... 91
Table 12. The most co-cited papers in nano-related technology in Turkey, 2006-2011 ..... 91
Table 13. Factor analysis of co-words in the titles of nano-related articles produced in
Turkey between 2000 and 2005 ............................................................................... 94
Table 14. Eigenvalues of the top two factors from 2000-2005 ........................................... 95
Table 15. Factor analysis of co-words in the titles of nano-related articles produced in
Turkey: 2006-2011 ................................................................................................... 96
Table 16. Eigenvalues of the top three factors from 2006-2011 .......................................... 96
Table 17. One-to-many similarity comparison based on the question “Where would you
like to see yourself in this social structure map?” .................................................. 105
Table 18. One-to-many similarity comparison based on the question “With whom do you
usually collaborate in scientific activities? And why?” ......................................... 106

xiii
LIST OF FIGURES
Figure 1. The diffusion of innovations by time according to Rogers .................................... 5
Figure 2. (a) Random graph network, (b) Scale-free network ............................................. 13
Figure 3. (a) Directed Graph, (b) Scale-free network .......................................................... 17
Figure 4. Illustration of an incomplete graph ....................................................................... 17
Figure 5. Global map of science based on ISI subject categories ........................................ 24
Figure 6. Representation of matrix reduction in using Singular Value Decomposition ...... 26
Figure 7. Number of nano-related technologies publications in Turkey: 2000-2011 .......... 34
Figure 8. Number of scientific publications of universities in nano-related technologies in
Turkey between 2000 and 2011 Source: Web of Science (as of November
2013).................. ...................................................................................................... 35
Figure 9. Density map of collaboration on nano-related technology among universities in
Turkey: 2000-2005 .................................................................................................. 38
Figure 10. Cluster density map of collaboration on nano-related technology within
universities in Turkey: 2006-2011 ........................................................................... 39
Figure 11. Collaboration of universities based on their co-occurrences frequency in
Turkey: 2000-2005 ................................................................................................... 41
Figure 12. Collaboration of universities based on their co-occurrence frequency
in Turkey: 2006-2011 ............................................................................................... 41
Figure 13. Comparison of co-occurrence frequency of selected universities in two
periods: 2000-2005 and 2006-2011 ......................................................................... 43
Figure 14. Betweenness and closeness centrality of selected universities in two periods:
2000-2005 and 2006-2011 ....................................................................................... 45
Figure 15. Adoption rate of collaborations between 2000-2011.......................................... 46
Figure 16. Profile of universities based on subject category in nano-related technology

xiv
overlaid on map of science in Turkey: 2000-2005................................................... 47
Figure 17. Profile of universities based on subject category in nano-related technology
overlaid on map of science in Turkey: 2006-2011................................................... 49
Figure 18. Degree centralities of selected universities in two periods: 2000-2005
and 2006-2011 .......................................................................................................... 52
Figure 19. Publication profiles overlaid on the map of science of METU,
2000-2005 ............................................................................................................... 53
Figure 20. Publication profiles overlaid on the map of science of Bilkent University,
2000-2005 ................................................................................................................ 54
Figure 21. Publication profiles overlaid on the map of science of Hacettepe University,
2000-2005 ................................................................................................................ 55
Figure 22. Publication profiles overlaid on the map of science of Ondokuz Mayıs
University, 2000-2005 ............................................................................................. 56
Figure 23. Publication profiles overlaid on the map of science of Ankara University,
2000-2005 ................................................................................................................ 57
Figure 24. Publication profiles overlaid on the map of science of Gazi University,
2000-2005 ................................................................................................................ 57
Figure 25. Publication profiles overlaid on the map of science of ITU, 2000-2005............ 59
Figure 26. Publication profiles overlaid on the map of science of Gebze Institute of
Technology, 2000-2005 ........................................................................................... 59
Figure 27. Publication profiles overlaid on the map of science of Dokuz Eylül
University, 2000-2005 ............................................................................................. 60
Figure 28. Publication profiles overlaid on the map of science of Marmara University,
2000-2005 ................................................................................................................ 61
Figure 29. Publication profiles overlaid on the map of science of Abant Izzet Baysal
University, 2000-2005 ............................................................................................. 62

xv
Figure 30. Publication profiles overlaid on the map of science of Kırıkkale University,
2000-2005 ................................................................................................................ 62
Figure 31. Publication profiles overlaid on the map of science of Ege University,
2000-2005 ................................................................................................................ 63
Figure 32. Publication profiles overlaid on the map of science of Erciyes University,
2000-2005 ................................................................................................................ 64
Figure 33. Publication profiles overlaid on the map of science of Kocaeli University,
2000-2005 ............................................................................................................... 65
Figure 34. Publication profiles overlaid on the map of science of Bilkent University,
2006-2011 ................................................................................................................ 66
Figure 35. Publication profiles overlaid on the map of science of Gebze Inst Tech,
2000-2005 ................................................................................................................ 67
Figure 36. Publication profiles overlaid on the map of science of Hacettepe University,
2006-2011 ................................................................................................................ 68
Figure 37. Publication profiles overlaid on the map of science of METU,
2006-2011 ................................................................................................................ 69
Figure 38. Publication profiles overlaid on the map of science of Gazi University,
2006-2011 ............................................................................................................... 70
Figure 39. Publication profiles overlaid on the map of science of ITU, 2006-2011............ 71
Figure 40. Publication profiles overlaid on the map of science of Ankara University,
2006-2011 ................................................................................................................ 72
Figure 41. Publication profiles overlaid on the map of science of Ondokuz Mayıs
University, 2006-2011 ............................................................................................. 73
Figure 42. Publication profiles overlaid on the map of science of Ege University,
2006-2011 ................................................................................................................ 74

xvi
Figure 43. Publication profiles overlaid on the map of science of Istanbul University,
2006-2011 ................................................................................................................ 75
Figure 44. Publication profiles overlaid on the map of science of Erciyes University,
2006-2011 ................................................................................................................ 76
Figure 45. Publication profiles overlaid on the map of science of Dokuz Eylül
University, 2006-2011 ............................................................................................. 77
Figure 46. Publication profiles overlaid on the map of science of Anadolu University,
2006-2011 ................................................................................................................ 78
Figure 47. Publication profiles overlaid on the map of science of Atatürk University,
2006-2011 ................................................................................................................ 79
Figure 48. Publication profiles overlaid on the map of science of Fırat University,
2006-2011 ................................................................................................................ 80
Figure 49. Co-authorship network of scientists working on nano-related technology:
2000-2005 ................................................................................................................ 82
Figure 50. Co-authorship network of scientists working on nano-related technology:
2006-2011 ................................................................................................................ 82
Figure 51. Co-authorship map of scientists between 2000 and 2005 .................................. 85
Figure 52. Co-authorship map of scientists between 2006 and 2011 .................................. 86
Figure 53. Document co-citation map of nano-related technology from 2000 to 2005 ....... 90
Figure 54. Document co-citation map of nano-related technology from 2006 to 2011 ....... 92
Figure 55. Journal co-citation in nano-related technology articles in Turkey between
2000-2005 ................................................................................................................ 93
xvii
Figure 56. Journal co-citation in nano-related technology articles in Turkey between
2006-2011 ................................................................................................................ 93
Figure 57. Nodes are colored according to factor solution of this network: 2000-2005 ..... 95
Figure 58. Nodes are colored according to factor solution of this network: 2006-2011 ..... 97
Figure 59. Geographical distribution of nano-related research activities of cities in
Turkey, 2000-2005 ................................................................................................... 98
Figure 60. Geographical distribution of nano-related research activities of cities
in Turkey, 2006-2011 .............................................................................................. 98
Figure 61.The network of co-authors of international and Turkish scientists working on
nano-related technologies, 2000-2005 ..................................................................... 99
Figure 62.The network of co-authors of international and Turkish scientists working
on nano-related technologies.................................................................................... 99

CHAPTER 1
INTRODUCTION
1.1 RATIONALE OF THE STUDY
Nano-science is about the creation and manipulation of information, and
nanotechnology is the set of applications, which are based on Nanoscience principles
(Mehta, 2002). Nanotechnology is the study of materials at atomic levels within the 1 to
100 nm range. Simply, “nano” means “molecular sized” (i.e., at a magnitude of 10-9
of a
meter).1
Nanoscience and nanotechnology have implications in other scientific fields such as
physics, chemistry, medicine, biomedicine, manufacturing, and the food industry, to name
a few. Therefore, research in nanotechnology promises a great deal of innovation for, and
benefit to, society as a whole. According to the United Nations, nanotechnology is one of
the emerging research fields, which will have positive impact on both developing and
developed countries. For example, while nanotechnology is used for water purification in
poor countries, it is used for manufacturing better chips for computers in developed
countries. In this respect, countries are investing in research and development of
nanotechnology. The European Union (EU) has invested heavily in nanotechnology
through its framework programs (FPs) since 2000. The Turkish government has also
adopted a new approach by becoming the part of the EU’s FPs and has invested heavily in
research and development. The Supreme Council for Science and Technology
1 Although the term “nano” is used and applied in nanotechnology related research, not every nano-related
term actually is applicable to scientific research in nanotechnology. For example, the terms “nanoscale”,
“nanogram” or “nanoleakage” are irrelevant to nanotechnology-related research and therefore will not be
used in this dissertation.

2
BTYK / SCST) is the highest-ranking Science, Technology and Innovation (STI) policy
and decision-making body in Turkey.
Research and funding have significant roles in implementing scientific research in
universities and private research centers in Turkey. The number of nano-related
publications has increased since 2005. Recently, Aydoğan-Duda and Şener (2010)
conducted research regarding the state of nano-related technologies in Turkey. They found
out that there are 10 nanotechnology centers equipped with state-of-the-art technology,
employing researchers with PhD degrees from the USA. According to their findings, there
are 14 companies manufacturing nanotechnology-related materials in Turkey, whereas
there are 41 nanotechnology companies in China, 17 in India and 195 in Germany.
Aydoğan-Duda and Şener concluded that by establishing similar institutes participating in
the production of joint nano-related technologies and in patenting them, the
commercialization of nano-related technology will be enabled in Turkey. This dissertation
aims to map the social structure of well-established institutes in Turkish universities to
investigate the diffusion of nanoscience and nanotechnology at the micro level.
1.2 RESEARCH PROBLEM
Although scientometricians use citation analysis to forecast diffusion of knowledge in
scientific fields, citation analysis solely does not depict the true domain of knowledge in
scientific fields. Bibliometric methods alone do not expose the social structure of the
invisible college among scientists (Crane, 1972). Social network analysis was used by
scientists to study people from different scientific fields such as anthropologists,
psychologists, sociologists and recently physicists and mathematicians in order to measure
the communication or diffusion of knowledge in groups, organizations or even countries.
Bibliometrics is defined as “the application of mathematical and statistical methods to
books and other media of communication” (Pritchard, 1969, pp. 348-349). Citation
analysis and co-authorship analysis of diffusion are two methods used by bibliometricians
to track temporal and topological diffusion of scientific publications. Moreover, Crane
emphasized the social structure of scientists and concluded that
3
The existence of social organization could be inferred (a) if scientists who had
published in a particular research area had more social ties with one another than with
scientists who had not published in the area, and (b) if scientists who had published in
the area could be different in terms of degree of social participation within the area,
suggesting the existence of leadership in the field (Crane, 1972, p. 335).
Crane argued that the social structure of a group of scientists who work on research
activity is instrumental for the diffusion of knowledge. By utilizing diffusion theory and
applying the Social Network Analysis (SNA) technique, we will analyze and map the
social and cognitive structure of diffusion of nanotechnology in Turkey. We will elaborate
in the next section that a mixture of Rogers’ theory and formal usage of Social Network
Analysis with which we create a compound framework illustrates a sound picture of
diffusion of nanotechnology knowledge in Turkey.
In the coming years, nanotechnology will have potentially changed everyone’s lives. This
will be seen in fields such as biotechnology, ceramics, drugs, polymers and materials
technology, all of which are important in our daily lives. Nanotechnology will have a
positive impact on the formation and development of these fields.
In the past two decades, many countries have invested heavily in nano-related
technologies. The number of scholarly publications in nano-related technologies in North
America and in Europe and, more recently in Far Eastern countries has increased. The US
government has allocated $1.74 billion dollars to nano-related technologies in 2011.2
Closer to home, European countries under the 7th
Framework Program have also heavily
invested in joint projects among its members. Turkey as a developed country has
established its strategic plan regarding nano-related research and development. In this
respect, universities (research centers), funders and industries play an important role in this
evolution. The Triple Helix model proposed by Leydesdorff and Etzkowitz (1998) is a
collaborative model between universities, government and industry.
2http://www.fas.org/sgp/crs/misc/RL34511.pdf

4
This dissertation investigates the evolution of nano-related technologies as a research field
in terms of the social aspects of knowledge diffusion of nanotechnologies between 2000
and 2011 in Turkey. It utilizes bibliometrics, social network methods and co-word analysis
to shed light on knowledge production and its diffusion in academia and industry. We used
the above-mentioned methods to ascertain whether or not quantitative data responds
formally to the diffusion of nano-related technologies in Turkey.
1.3 CONCEPTUAL MODEL FOR RESEARCH PROBLEM: DIFFUSION OF AN
INNOVATION
In this thesis, we accept nano-related technologies as a wide-ranging area of knowledge.
Literature defines “knowledge” as refined and meaningful information or fact to provide
answers to specific problems. The diffusion of knowledge may follow different routes.
Scientists have investigated the diffusion of knowledge in societies from different
perspectives. To explain diffusion of knowledge, Rogers (2003) pioneered and studied the
diffusion of innovation in several fields. He argued explicitly that the social interactions
between scientific domains and practitioners are instrumental to the diffusion of
knowledge. An innovation can manifest itself in different forms or shapes. For example, an
innovation may be a new drug, new computer technology, a new mechanical device or
even a new fashion style.
Rogers (2003, p.5) defines the diffusion of an innovation as “the process by which an
innovation is communicated through certain channels over time among the members of a
social system.” According to Rogers, the key elements in the diffusion process are:
innovation, communication channels, time and social systems. Rogers (2003, p. 7) defined
these terms as follows:
An innovation as an idea, practice, or object that is perceived as new by an individual
or other unit of adoption… A communication channel is “the means by which
messages get from one individual to another”…Time of the innovation-decision
period is the length of time required to pass through the innovation-decision
process…Rate of adoption is the relative speed with which an innovation is adopted

5
by members of a social system… A social system is defined as a set of interrelated
units that are engaged in joint problem solving to accomplish a common goal.
Moreover, he concluded that the time and channels, which people use to spread an
innovation, are the main factors in its spreading. Rogers categorized the adopter of an
innovation as innovators (2.5%), early adopters (13.5%), early majority (34%), late
majority (34%) and laggards (16%), based on the mathematically based bell curve. Fig. 1
shows a Rogers’ diffusion process model.
Figure 1. The diffusion of innovations by time according to Rogers
Source: http://www.mbaskool.com/business-concepts/marketing-and-strategy-terms/
1889-innovation-adoption-curve-rogers.html
An innovation starts with a few people and has a few adopters, but eventually it gains the
momentum until it reaches its peak. For example, nanotechnology in the mid-1990s was
discovered as a research field and it quickly became an important research activity for
scientists in a broad scientific field. Rogers’ framework enables this dissertation to map the
diffusion of nano-related technologies.
From the sociological point of view, Wellman and Berkowitz (1997) argued that the Social
Network Analysis is a paradigm in which relational interaction among members signifies
the role of people in a network structure. By investigating the social structure (people),
especially social relations among members of a group, one can practically expose relations
in terms of certain variables (i.e., density, centrality, transitivity, and cluster coefficient).

6
Moreover, Emirbayer and Goodwin (1994) stated that network analysis is derived from
social theory by which manifests not only its members but also their relational structure.
Therefore, by measuring these variables, this dissertation assesses the diffusion of nano-
related technology in Turkey.
So, why is studying a social system so important? People tend to live in a social structure.
Scientists work and collaborate in a social system. Assessing social relations among
scientists reveals how collaborative they are. Moreover, bibliometric methods have been
used as tools to track scientific research. In spite of this, it is difficult for analysts to predict
a scientific breakthrough. Conventionally, Derek de Solla Price (1965) studied the
scholarly communication process between scientists, thereby opening the door to the
quantitative study of science. Indeed, scientific discovery and its evolution has been a
challenge for analysts. For example, Chen, Chen, Horowitz, Hou, Liu and Pellegrino
(2009) discussed several distinct scientific perspectives: Social Network Analysis, citation
analysis, sociological methods, information science and complex network analysis.
Furthermore, they argued that scientific discovery comes with a group of specialty, who
“attend, read and cite the same body of literature and attend the same conferences” (Chen
et al., 2009, p. 192). Furthermore, they argued that co-authorship stimulates the
knowledge diffusion in scientific communities.
Crane (1972) studied these groups from the co-citation perspective while Girvan and
Newman (2002) examined the network from the co-author perspective. Burt (1992) argued
that structural holes in social networks are crucial for connecting clusters in a network
structure, resulting in a diffusion of knowledge in the network. According to Burt,
structural holes in a social network are disconnected, or poorly connected, areas between
tightly and densely connected groups of people. The presence of such structural holes may
influence the importance of the positions in a social network. The value of a person in a
social network is therefore linked to the potential that person/individual has to establish
connections between groups that are separated by structural holes.

7
The conceptual model of this thesis is threefold. The model makes use of Rogers’
conventional theory of diffusion process as a paradigm. More specifically, it (I) utilizes
Social Network Analysis methods in order to map the cognitive structure of nano-related
technologies within a social network structure; (II) applies content analysis (co-word)
techniques in order to track the structural development of nano-related scientific literature
illustrating new research fronts in the network; and (III) further elaborates the process by
interviewing nanotechnology scientists as a control unit in the co-authorship network
structure. The framework enables us to assess the diffusion of nanotechnology in Turkey
between 2000 and 2011.
Social network analysis proposes that relations among its members (Wellman &
Berkowitz, 1997) create social life. According to Freeman (1996), “social networks are
formally defined as a set of nodes (or network members) that are tied by one or more types
of relations”. According to the outcome of the dissertation, the social network of scientists
includes properties of the (so-called) “small-world”. The term “small-world” was derived
from the result(s) of an experiment, which was conducted by Milgram (1967). Milgram
proved that an envelope is reached from point A to point B in a well-populated area in 6
steps through acquaintance. Therefore, the “small world” reveals the dynamic structure and
cohesion of the network over time. Furthermore Watts (1999) stated that the small world
phenomenon should have properties: (1) the network must have more than one member --
in real it could be billions; (2) the network is disseminated, that is to say each person is
associated to an average of only k other persons in the network; (3) the network is
decentralized, that is to say there are not well connected vertices – a member of the
network should be in the network; and (4) the network is made of well-connected clusters.
He stated that the above criteria are critical for a network for presence of a small world
phenomenon.
Ethnographic method is a qualitative research method in which the ethnographer captures
the meaning of social life and presents it graphically or in writing. One can apply one of
the ethnographic data gathering techniques to elaborate the social concept of collaboration

8
within a structure. Ethnographic method unravels the hidden agenda of interviewees may
feel regarding the subject; however, interviewees’ responses may not reveal their true
feelings about the subject. Therefore, the interviewing responses can be subjective which
make it difficult for the researcher to draw specific conclusion. Saville-Troike (2003),
states that the ethnographer should apply some sort of quantitative method to generalize
his/her qualitative research results. Knowledge in scientific communities is shared through
communication (i.e., physical behavior, verbal responses, and communicative speech)
which ethnographer should capture. The ethnographer may conduct open-ended or close-
ended interview by asking questions or collecting data in written formats- in case of
nonverbal communication, the ethnographer may elaborate on informants’ facial
expressions such as raising eyebrows or using body’s language (Saville-Troike, 2003).
1.4 RESEARCH QUESTIONS AND HYPOTHESES
The aim of this research is to answer the following research questions:
1) What are the key areas of nanotechnology in Turkey? For example, metallurgical,
pharmaceuticals, medical devices, high technical industry, and so on.
2) Do co-authorship network structures exhibit a “small world” network structure?
3) How significant is the rate of diffusion of nano-related technology, according to
network properties results in two periods: 2000-2005 and 2006-2011?
4) To what extent do scientists share a common vision (behavior) on nanotechnology?
By answering the above questions and by utilizing the diffusion theory framework
conceptually, we examine the dissemination of nanoscience and nanotechnology in
academia.
This dissertation postulates the following:
The diffusion of knowledge appears to occur more quickly where scientists have
strong positions in the network.

9
The diffusion of innovation occurs stronger within sub-components than that of the
whole network.
Taxonomy identified by co-word analysis in the research process matches the
findings at the global level.
Answering the above questions constructs a road map, which depicts not only the diffusion
of nano-related technology by means of scientific collaborations but also to some extent
assesses the impact of scientific collaborations on scientific outputs in terms of
publications in Turkey. We described nanotechnologies and their importance in recent
years as an innovation breakthrough and discussed its importance in developed and
developing countries. Moreover, we explained the framework of Rogers’ theory of
diffusion. Rogers’s theory expresses that the diffusion of an innovation takes place through
a channel of communication. In this thesis, the channel of communication is described as
“invisible college” where scientists collaborate on scientific activities.
We studied the diffusion of nanotechnology in Turkey and the collaboration of
nanotechnologists by using social network analysis, co-word analysis and interviews. In
addition, we compared the similarity of some selected discourses, which were collected
from ethnographic interviews by a quantitative method using Latent Semantic Analysis as
a text-processing tool.
Rogers’ theory of knowledge diffusion was used as a structure by which the conceptual
framework of this study is further explained in the next chapter along with literature and
the development of nanotechnology in Turkey.

CHAPTER 2
LITERATURE REVIEW
An overview of the methods used in this study is covered and the findings of the
related literature are discussed in this chapter along with the related topics. We start with
the theoretical foundations of Social Network Analysis and other techniques, followed by
mathematical formulas. We discuss the importance of mapping. Finally, ethnographic
method and its advantages are covered along with the Latent Semantic Analysis used to
analyze research data.
2.1 SOCIAL NETWORK ANALYSIS AND ITS THEORETICAL BASICS
Information scientists have studied the growth of science and communication using
bibliometrics and Social Network Analysis (SNA) methods. While the former deals mainly
with the effects of scientific productivity using citation analysis, the latter mainly focuses
on the pattern of relationships among scientists. The network composed of co-authorship
among scientists is a true indication of their cooperation in research activity.
According to Wellman and Berkowitz (1997), SNA is a paradigm. Theoretically, it is a
premise based on a structured study of human relations. Gestalt theory was instrumental in
shaping SNA by sociologists in the early 1920s. Jacob Moreno and Kurt Lewin were the
first scientists using SNA in the social sciences. Lewin (1951), who worked on group
behavior, argued that a person’s attitude or behavior is influenced by his/her position in the
social group. In addition, they integrated mathematical formulas from graph theory into
SNA. Moreno (1934) used network analysis to show social configurations among school
children. Moreover, Milgram (1967) proved that no matter how complex the network
structure is, it takes a maximum of six steps from one node

11
(person) in a social network structure for a message to be passed along to another node.
Combining social theory and mathematics (graph theory), SNA has become a potentially
promising tool for psychologists, and anthropologists, among others, to study
organizational settings. Their work stimulated other scientists to follow up, incorporating
application of SNA in their research (Cartwright & Harary, 1977). Watts and Strogatz
(1998) in their seminal paper proved formally that the six degree separation exists between
each node in a complex network. A network consists of nodes and ties, or links connecting
nodes. By analyzing the relationships between set(s) of nodes or a subgroup of nodes and
their ties in the social group, information scientists measure the social structure of
scientists. According to Freeman (2004), SNA can be viewed as:
Being motivated by a structural intuition based on ties linking social actors;
Being grounded in systematic empirical data;
Drawing heavily on graphic imagery; and
Relying on the use of mathematical and/or computational methods.
2.2 THE “SMALL WORLD” PHENOMENON
The “small world” phenomenon conjectures that each member in a society is linked
through friends. Literally, every node in a small world is connected through an
acquaintance. Why is the small world effect so important?
According to Newman (2000), the spread of news, rumors, jokes from one place to other
places over a social network in which the average degree of separation is six. The spread of
disease also occurs by person-to-person contact; therefore, the structure of networks of
such contacts has a huge impact on the nature of epidemics, for example, the spread of
HIV or flu in social structure. Hence, we can say that the small world phenomenon
emulates the diffusion of news, an innovation or knowledge. The small world should have
four properties: sparseness, clustered, traversable and egocentrics (i.e., star network). He

12
studied and found out that average distance from one person to another person by an
acquaintance is proportional to size of the community logarithmically which implies one of
the small world properties. Moreover, he found out that to traverse between two randomly
selected nodes takes an average of six steps. The longest line between two nodes is called
radius of the network. The small world effect is a phenomenon that has been studied by
scientists in different fields.
In social contexts, Moody (2004) analyzed the structure of a social science collaboration
network over a period. He discovered that collaboration between graduate students in a
specific topic creates a small world of scientists, which remove restrictions between them.
Small world networks may manifest themselves in several shapes and models. Therefore, a
good understanding of small world models helps us understand network characteristics.
For example, according to Watts (2003) a social network can be categorized as active or
passive. Granovetter (1974) studied former one in the perspective of finding a job, and by
Burt (1992) as social capital, which preludes the “rich get richer” phenomenon. In this
study, co-authorship network of structure is represented in a passive sense where the nodes
and the edges connecting them are treated as actors and their relationships.
One can model the small world as a random graph. A random graph may be defined as N
people in the world, and on average, they each have z acquaintances. This means that there
are connections between people in the entire population. The number z is called the
coordination number of the network. We can make a very simple model of a social
network by taking N dots (“nodes” or “vertices”) and drawing lines (“edges”)
between them by randomly choosing pairs to represent these connections. Such a network
is called a random graph (Newman, 2000, p. 407). On the other hand, in a scale-free
model, each actor (node) with a high degree (i.e., star node) in the network is connected to
another node which does not necessarily have a high degree. This approach leads to the
star network. Moreover, the degree distribution of a node in a co-operative scientific
network adheres to the power law (Fig. 2).

13
Figure 2. (a) Random graph network, (b) Scale-free network
Moreover, degree centrality can be defined in two ways: in-degree, out-degree centrality.
Whereas in-degree means the number of links a node can have coming to it, out-degree
means the number of links going out of the node. The former is known as an influential
node in the network, but the latter is interpreted as a popular node. Small-world models
are comprised of clusters or components. Clusters embedded in a network structure reveal
a property that scientists have defined as a clustering coefficient. According to Watts and
Strogatz (1998), one can define a clustering coefficient C, which is the average fraction of
pairs of neighbors of a node which are also neighbors. Meaning, if node A neighbors with
node B and B is a neighbor to node C, there is a probability that node A is a neighbor to
node C. The clustering coefficient is calculated by:
(1)
Wasserman and Faust (1994, p. 243) call the above method transitivity. Centrality of a
network is another important property of social structures. The degree of a node (vertex) in
the network is the total number of other nodes to which it is connected (Girvan &
Newman, 2002). Otte and Rousseau (2002, p. 443) define centrality, closeness and
betweenness thus:

14
(1) Degree centrality is equal to the number of connections that an actor (i.e., a
node) has with other actors; (2) Closeness takes the structural position of the
actors in the whole network into account. A high closeness for an actor means
that he or she is related to all others through a small number of paths; (3)
Betweenness measures the number of shortest paths passing through an actor.
Betweenness centrality plays an important role in the structures of the social network. One
can describe betweenness centrality as a pivotal point in the network structure. According
to Freeman (2004), the discovery of the structural properties of scientific papers is
measured by the betweenness centrality. Actors with a high level of betweenness centrality
play pivotal role in connecting different groups. One can say that betweenness centrality
characterizes preferential attachment, cliques, or brokers. As Barabasi and Albert (1999, p.
509) state, “preferential attachment play an important role in network development.” In
other words, people in social networks tend to work with well-known people that lead to
the concept of “strong and weak ties”, meaning the group of people who are attached to
one node with high centrality. According to Moody (2004) and Scott (2000), such a
network model is a star network.
Newman (2000) stated that collaboration among scientists in networks is a good example
of showing preferential attachment. As mentioned earlier, if a node has a higher degree,
there is a higher probability of being acquainted if they share a mutual friend. The former
conjecture may precisely result in the power square law such as Lotka’s law, where only
20% of people in the social network are well connected and the remaining 80% people in a
social network are loosely connected. Martin, Ball, Karrer, Newman3 reiterated the
authorship productivity resembles Lotka’s square law in the network. Mathematically, the
Lotka’s square law is defined as:
kaxxf )( (2)
where a is constant and k is 1 or 2.
3 Retrieved from http://arxiv.org/abs/1304.0473

15
Each group creates a community in which a node with a high degree of centrality is the
central node. Therefore, collaboration networks consist of separate clusters representing
different scientific fields where they may connect through lower degree connectors.
Newman (2000) referred to clustering as “community structure”. Each community
comprises several star networks and these clusters may be connected by a node of lesser
degree. Moreover, PageRank is a metric that was introduced first by Page and Brin (1989)
which measures the popularity of web page. In the thesis, it reflects the prestige of a
scientist in network structure.
2.3 THE DIFFUSION OF INNOVATIONS
Rogers studied the diffusion of new agricultural methods of farmers in Ohio, USA, in
1960. For example, he discussed the diffusion of hybrid corn seed in order to find a
solution to the famine in Ohio in 1936 in his seminal book The Diffusion of Innovations
(2003) which was the most-cited book in the social sciences. As mentioned in Chapter 1,
according to Rogers’ model, the innovation process passes through several levels:
innovators, communication channels (i.e., early adopters, late adopters), time, and social
system(s).
Valente (1995, 1996) described several network models for the diffusion of innovations.
He argued that each of the thresholds formed by clusters within a network as a (set of)
focal points which are instrumental to the diffusion of innovations. According to Valente
(1996), a/the social network thresholds coefficient indicates the diffusion of innovation in a
knowledge domain. He was (particularly) concerned about the behavioral aspect of the
diffusion of innovation between social networks, especially in health oriented
organizations. He argued that the diffusion of innovation is based on some early adopters
with a higher threshold in the network structure; that is to say, some proportions of the
social system facilitate the early adopters in the diffusion of innovation.

16
Many articles on the diffusion of information (knowledge) have focused on the social
context(s) of organizational settings. For example, Özel (2010) assessed the diffusion of
knowledge in business management among academia in Turkey. He calculated the co-
authorship relationships of those members of academia in business management from 1928
to 2010. Milojević (2009) studied the diffusion of nano-related technologies using SNA
techniques and mapped the evolution and socio-cognitive structure of
nanoscience/nanotechnology in the United States. Lievrouw, Rogers, Lowe and Nadel
(1987) studied the “invisible college” of health system using triangulation methods:
network analysis, citation analysis and survey. Zuccala (2004) applied same methods to
study the “invisible college” in the Singularity Theory community in Mathematics. Our
aim is to map the diffusion of nano-related technologies from social network perspectives.
2.4 THE GRAPH THEORY
Information scientists employ graph theory to investigate network structure quantitatively
and to model its organization. As pointed out earlier, Social Network Analysis (SNA) is
based on graph theory. In SNA, nodes can be represented as a set and each set may contain
subsets. Symbolically, the notation for a graph can be written G (V, E). G (V) describes the
number of nodes or vertices in the graph, whereas G (E) illustrates the number of links
(e.g., edges or arcs) in the graph. A graph may be directed (Fig. 3a) or undirected (Fig. 3b).
In an undirected graph, the link direction between the two nodes is not necessarily
important whereas in a directed graph there are reciprocal relationships between nodes.
According to Wasserman and Faust (1994), the most fundamental type of relationship
between nodes is the dyadic relationship. More complex relationships include triads,
cliques, subgroups, groups, positions, and clusters. Relations are generally plotted
according to three parameters: direction, strength, and content.

17
(a)
(b)
Figure 3. (a) Directed Graph, (b) Undirected graph
A node may have a relation tie with another node or be null; a node may have a
directed relation or undirected relation with another node. Co-author relationship is
an example of undirected graph. For example, Figure 4 below depicts a graph with 6
vertices and 6 edges. Its structural properties are defined as vertices and edges where
vertex set V={a,b,c,d,e,f} and edge set E = {(a,b),(b,c),(c,d),(c,e),(d,e),(e,f)}. We
can draw the Fig. 4 graph as n x n matrix, as shown below:
Figure 4. Illustration of an incomplete graph
a b
c
d
e fa b
c
d
e fa b
c
d
e f

18
Table 1. Matrix presentation of the incomplete graph depicted in Figure 4
a b c d e f
a 0 1 0 0 0 0
b 1 0 1 0 0 0
c 0 1 0 1 1 0
d 0 0 1 0 1 0
e 0 0 1 1 0 1
f 0 0 0 0 1 0
Node a is adjacent to node b, and node b to node c. Not all nodes are adjacent to each
other. If a graph contains nodes that all vertices are adjacent to each other, then it is a
complete graph (Table 1).
Fig. 4 is not a complete graph since not all nodes are connected to each other. The density
of the graph in Fig. 4 is calculated with 6 nodes the density of the graph is 6/15 = 0.40. A
clique is a subset of individuals in which every person is connected to every other person.
For example, nodes d, c, and e are all connected to each other. A clique is a maximal
complete sub graph. A complete sub graph of G is a section of G that is complete (i.e.,
density = 1). Cliques have been seen as a means to represent what social scientists have
called primary groups or ego centric groups. Prestige measures the reputations within
social networks and applies only to the networks comprising directed graphs. While not
every vertex in the graph in Fig. 4 is adjacent to each other, one can construct a sequence
of adjacent vertices from any vertex to any other. Graphs with this property are designated
completely connected. Similarly, any pair of vertices between which one vertex can reach
the other via a sequence of adjacent vertices is called reachable.

19
2.5 CO-WORD ANALYSIS: MAPPING THE COGNITIVE STRUCTURE OF
NANO-RELATED TECHNOLOGIES
In the last two decades, the number of publications in many scientific fields has grown
dramatically. In recent years, due to the advancement in computer technologies, the
amount of information generated in multi- or interdisciplinary research fields has likewise
increased. In order to study the scientific trends in a broad variety of multidisciplinary
fields, information scientists have created new techniques such as co-word analysis. Co-
word analysis of texts helps map scientific fields and reveals the cognitive structure of the
scientific domain (Chen, 2004). Callon, Courtial, Turner, and Bauin (1983) applied the co-
word analysis onto literature over time by analyzing the frequencies or co-occurrences of
words in titles, abstracts, or generally in text.
2.6 NANOTECHNOLOGY DEVELOPMENT IN TURKEY
Assessing the productivity of science is a major and difficult task for policy-makers.
Measuring scientific output is an important issue for governments around the world due to
the fact of the necessity for governments to allocate funds properly. Bibliometrics is used
to analyze the productivity of science and technology quantitatively. Although Turkey has
a national plan promoting nano-related technologies through university funding and the
private sector, the outcome of this plan has yet to be assessed. For example, Aydoğan-
Duda (2012b) has edited a book in which there are examples of developing countries’
investment in nano- related technology. She discusses that Turkey intended to approach
nanotechnology development in context of management in developing countries
(Aydoğan-Duda, 2012a; 2012b).
One can measure scientific output merely by calculating the number of researchers and
scientific outputs in terms of the number of publications. However, it is not clear whether
scientific output has had any impact on economic growth in the country. Furthermore,
Motoyama and Eisler (2011) argued that by calculating the number of publications divided

20
by the number of researchers and resources invested on nanotechnology shows more
accurate results in terms of scientific output. In addition, one may even use non-parametric
(percentile) statistics to measure citations of journal publications of nano-related
technologies (Leydesdorff & Welbers 2011).
The first detailed “Turkish Science Policy: 1983-2003” was published in 1983 -the first
report that created the groundwork that led to the “Vision 2013 Project”. The Supreme
Council of Science and Technology (SCST) has been vigorously supervising scientific
activities in Turkey since the mid-1990s, thus shifting Turkey’s science policy from
“building a national R&D infrastructure” to “innovation-oriented national policies” (Uzun,
2006). Moreover, the Ministry of Science, Industry and Technology oversees the scientific
development in Turkey. TÜBİTAK systematically supports research and development in
universities especially for institutes which take part in research and innovation. It was
stated previously that the United Nations has declared nanotechnology as the biggest
breakthrough in science in years to come. So, what is so significant about nanotechnology
and nanoscience which has gained the attention of scientific communities and industries?
Nanotechnology is not a new idea. It was first introduced by Feynman (1960), who started
a road map for nanotechnology/nanoscience research activity. According to Thompson
Reuters’ Web of Science (WoS), the first article containing the phrase “nano” in its title
was published in 1988 in Turkey. Since then, the number of scientific articles increased
tremendously. Some 500 scientific papers were published alone in 2009, generating a total
of 4500 citations. It is clear that nanotechnology has become a major field of research in
Turkey. As Özbay, a scientist at the Nanotechnology Research Center (NANOTAM) at
Bilkent University, Ankara, Turkey, has authored several nanotechnology related papers.
In addition, he is the guest editor of the Science Magazine. Along with TÜBİTAK, the
Ministry of Development is one of the governmental bodies which financially support
nanotechnology projects. For example, the Ministry of Development has established The
National Research Center for Nanotechnology on the Bilkent University campus. As of
2008, the Ministry of Development has invested a total of 58 million TL in two phases to

21
improve the infrastructure of the research facility. The center will act as a hub promoting
nanotechnology in Turkey. NANOTAM is another research center at Bilkent University
(not supported by the Ministry of Development directly) that collaborates with the
industry. Both institutes have published a substantial quantity of scientific papers. There
are 178 nanotechnology related files with patents pending at the Turkish Patent Institute
(TPE) and a few patents are filed at the US Patents Office which has been filed by research
associates from both research centers. Since 2000, Turkey’s road map for nanotechnology
has been set by combining two important elements: research and finance. Nanotechnology
is one of the strategic fields of research and technology mentioned in the new vision 2023
for science and technology for Turkey prepared by the Supreme Council of Science and
Technology. According to SCST, only 0.80% of the gross national product (GNP) was
allocated for research and development. In their annual plans (2007-2010), the Ministry of
Development supported several nanotechnology-related projects carried out by research
institutes such as Marmara Research Center and Gebze Institute of Technology and several
universities.
2.7 GROWTH AND DIFFUSION OF NANOTECHNOLOGY AT THE GLOBAL
LEVEL
Robert Solow, a Nobel Prize winning economist, formulated a theory that postulated the
impact of technological development on innovation back in 1950 (Garfield, 1988).
Recently, however, economists argue that a greater number of factors influence economic
growth, other than technology. For example, funding and the quality of researchers are
considered to be two of the more important elements providing an economic impact.
Another theory that endorses direct manipulation of research and development by
government is Endogenous Theory. The policies of governments directly shape research
activities by investing in research and development that result in (material) goods and
products or scientific publications.
In a global perspective, Kostoff, Stump, Johnson, Murday, Lau and Tolls (2006)
investigated the development and infrastructure of the nano-related technology in the

22
world by studying the global literature. China, Far Eastern countries and USA, Germany,
and France were selected the most productive countries in terms of number of publications.
Nano-related literature, prolific authors, journals, institutions and most cited
authors/papers/journals were analyzed by Kostoff et al. (2006) to measure the development
of nanotechnology in the world globally. In addition, a text mining was done on records to
properly retrieve records from Science Citation Index (SCI) and Social Science Citation
Index (SSCI). For example, most nano-related technology papers were appeared in
Science: Physics, Chemistry and Material and Surface. A literature research overview was
done by Kostoff, Koytcheff and Lau (2007) using a text query. It was found that Turkey’s
appearances become evident in nanotechnology development at the global level since
2002.
2.8 MAPPING THE DIFFUSION OF THE KNOWLEDGE
Derek de Solla Price paved the way for scientific visualization in his seminal work entitled
“Networks of Scientific Papers” by utilizing the bibliographic data of journals (Price,
1965). Later, White and McCain (1998) studied and mapped the scientific domain through
conventional methods. However, refining an immense set of bibliographic data manually
was a cumbersome task. Börner, Chen and Boyack (2003) explained the mapping
techniques thoroughly from historical, developmental and mathematical perspectives.
Mapping of science has been a method for discoveries of new trends or cognitive
development of scientific endeavors. According to Leydesdorff and Persson (2010), one
way to investigate the diffusion of an innovation and to study the spatial dynamics of
science discoveries is the geographical mapping of cities. Geographical mapping of cities
shows scientists working on nano-related technology, depicting a better picture of
collaboration on both national and international levels. Using Google Maps, Leydesdorff
and Persson (2010) mapped the cities in which information science (IS) journals were
published. The co-authorship network of cities is a testimonial of social network properties
such as the “small world” effects in science.

23
From a geographical perspective, the well-known institutes (centers) will tend to work with
other leading institutes (Leydesdorff & Rafols, 2009). In terms of social and organizational
distances, the map shows the diffusion of nano-related technology between centers in each
country. The co-authorship networks between cities provide us with consecutive matrices
for each year. These networks can be compared in terms of density, largest components,
degree distribution, and clustering coefficient using standard software for Social Network
Analysis such as Pajek4 and Gephi.
5 Our main questions (in this geographical dimension)
are: do patterns of diffusion change and how does this show in the development of various
network parameters? What types of networks emerge? When does a network stabilize, and
how?
Hence, the geographical diffusion of nano-related technologies by Turkish scientists
locally and internationally and by their counterparts defines the globalization of the
scientific field using Social Network Analysis.
2.9 OVERLAY MAPS
Scientometricians use visualizations in addition to other indicators to track or investigate
new scientific developments over time. However, sometimes it is difficult to track
scientific research fields within a map of science. Rafols, Porter and Leydesdorff (2010)
introduced a novel approach to illustrate bodies of research precisely surrounded by global
scientific domains. They stated that
maps position units in a network instead of ranking them on a list. Maps allow for the
representation of diverse and large sets of data in a succinct manner. They make it
possible to combine different types of data… (Rafols et al., 2010).
Science overlay maps “help benchmark, explore collaborations, and track temporal
changes” (Rafols et al., 2010, p. 1871).
4 Pajek was developed by Vladimir Batagelj and Andrej Mrvar both in University of Ljubljana in Slovenia.
5 Gephi is an open source software, leader in the visualization and analysis of large networks in real time
developed by consortium.
24
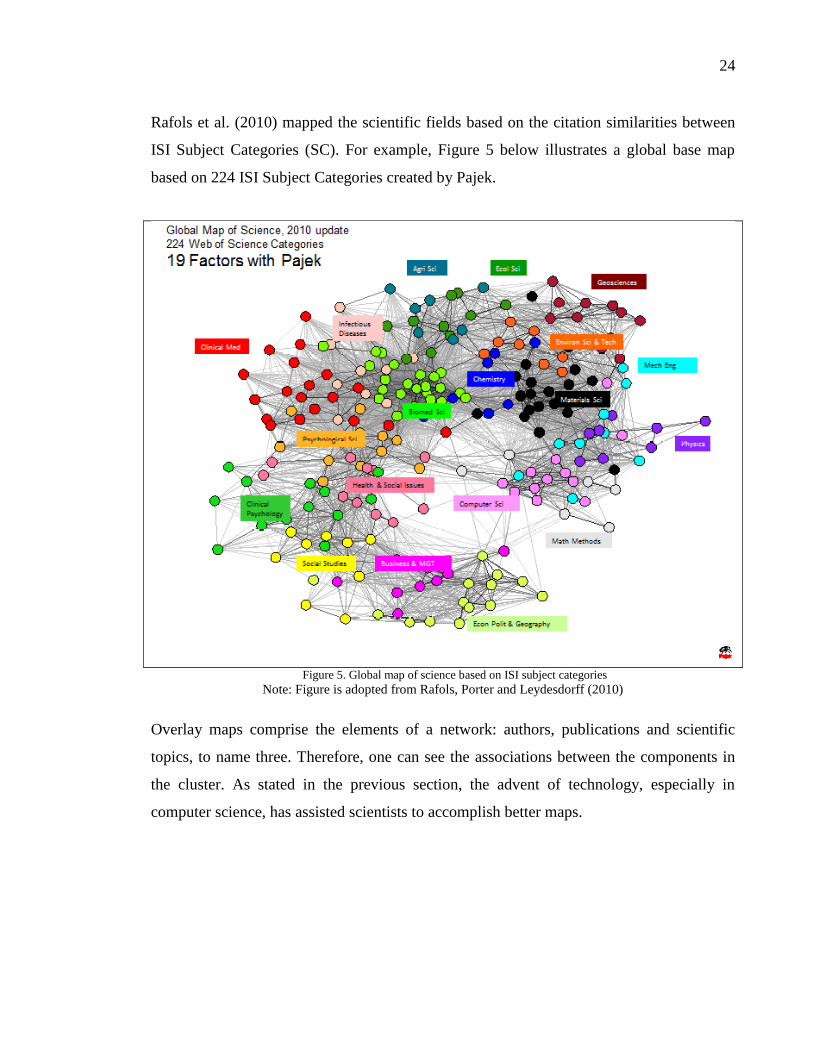
Rafols et al. (2010) mapped the scientific fields based on the citation similarities between
ISI Subject Categories (SC). For example, Figure 5 below illustrates a global base map
based on 224 ISI Subject Categories created by Pajek.
Figure 5. Global map of science based on ISI subject categories
Note: Figure is adopted from Rafols, Porter and Leydesdorff (2010)
Overlay maps comprise the elements of a network: authors, publications and scientific
topics, to name three. Therefore, one can see the associations between the components in
the cluster. As stated in the previous section, the advent of technology, especially in
computer science, has assisted scientists to accomplish better maps.

25
2.10 ETHNOGRAPHIC METHOD: LATENT SEMANTIC ANALYSIS
APPROACH
The term “ethnographic” is derived from the Greek roots ethno=folk and grapho to write.
Sociologists apply ethnographic methods to justify their quantitative research results.
Normally, social scientists and anthropologists employ ethnographic methods such as
interviewing or observing the sample data. For example, sample data may be an
organization or a tribe in remote areas in a country. An in-depth interview reveals the
interest of interviewees in the subject problem.
According to Kuhn, scientific communities create knowledge, the state of which is shaped
by a “paradigm”. The term “paradigm” is defined as “universally recognized scientific
achievements that, for a time, provide model problems and solutions for a community of
researchers” (Kuhn, 1970, p.123). Subsequently, Foucault argued that knowledge is power
that is represented by a discourse. In simple terms, discourse is a conversation among a
group of people in a society (Fulcher, 2005).
As mentioned earlier, a discourse is representation of knowledge in forms of
communication. For example, one can consider nanotechnology as the knowledge domain
in which scientists discuss or solve particular nano-related issues. Leydesdorff (2001)
argued in his book that “world of science” can be described using three dimensions:
scientists, texts and cognitions. He also emphasizes language usage coherently in
describing our scientific world that is a phenomenon at various levels of aggregation.
According to Leydesdorff and Welbers (2011), semantics measured in two ways: similarity
patterns (correlations) and latent variables (factor analysis). One example is latent semantic
analysis (LSA), which was invented by Deerwester, Furnas, Harshman, Landauer,
Lochbaum, and Streeter. It utilizes the singular value decomposition (SDV) technique to
create a mathematical representation of the relationship of words or text in a passage based
upon a semantic space (Landauer, Foltz, & Laham 1998, as cited in Tonta & Darvish,
2010).

26
It is not a traditional natural language processing or artificial intelligence program, as it
uses no humanly constructed dictionary, knowledge bases, semantic networks, grammars,
syntactic parsers, or morphologies. In other words, SDV is a factorization technique that
reduces a matrix to three smaller matrices in which each element in the matrix represents –
in one’s research- contextual meaning of words and their semantic relationships based on
large quantities of text6 (Fig. 6).
The following relies on Dumais:7 consider a rectangular t x p matrix of terms and passages,
X. Any rectangular matrix can be decomposed into the product of three other matrices
using the singular value decomposition. Thus,
(3)
where W is a w × m matrix with orthonormal columns (i.e., the columns are mutually
perpendicular vectors each of which sums to unity), S is an m × m diagonal matrix with its
entries sorted in decreasing order, P is an m × p matrix with orthonormal columns, T is a
transpose of P.
Figure 6. Representation of matrix reduction in using Singular Value Decomposition
6 http://lsa.colorado.edu/papers/dp1.LSAintro.pdf
7 http://www.scholarpedia.org/article/Latent_semantic_analysis
27
Moreover, LSA overcomes the problem of synonymy and polysemy problems in
information retrieval by capturing the latent semantic relations between terms (Deerwester
et al., 1990; Landauer, Foltz, & Laham, 1998).8 LSA compares one script to the other on
the same subject even though two scripts may not necessarily have any words in common.
For example, William (2012) used LSA to test the reading comprehension of a passage by
group of participants using a survey. Moreover, LSA was used as an application to analyze
open-ended responses in an epidemiologic survey study (Leleu et al., 2011).
Ethnographic methods were used to gather unstructured data from Turkish nanotechnology
scientists through structured interviews and the similarity of what they said was analyzed
by using LSA.
2.11 SUMMARY
In this chapter, we explained the historical development of Social Network Analysis,
followed by a brief introduction of graph theory underpinning SNA and co-word analysis.
We described the network structure and its properties; the small-world experience and
Rogers’ diffusion of innovation, Moreover, we discussed the role of overlay maps and
mapping tools in investigating the cognitive structure of institutions. Network centrality
was to track and identify most productive countries in terms of bibliographic data which
reveals the diffusion of nanotechnology development. We approached ethnographic
methods in terms of discourse analysis and briefly introduced Latent Semantic Analysis,
and then its usage in scientific researches. To some extent, literature on nanotechnology
was reviewed.
8 For more information on LSA, see http://lsa.colorado.edu.
CHAPTER 3
RESEARCH METHOD AND DATA PROCESSING
The aim of this research is to assess the diffusion of nano-related technology by
mapping of collaborative social structure of scientists in Turkey between 2000 and 2011.
Using Rogers’ diffusion model as a conceptual model, we attempt to answer the following
research questions:
1) What are the key areas of nanotechnology in Turkey? For example, metallurgical,
pharmaceuticals, medical devices, high technical industry, and so on.
2) Do co-authorship network structures exhibit a “small world” network structure?
3) How significant is the rate of diffusion of nano-related technology according to
network properties results in two periods: 2000-2005 and 2006-2011?
4) To what extent do scientists share a common vision (behavior) on nanotechnology?
In order to answer research questions, we used a compound textual query on
nanotechnology modified from Kostoff’s9 (see Appendix A) and searched the Web of
Science (WoS) in two periods: 2000-2005 and 2006-2011. We retrieved a total record of
2664 (articles and reviews) on nanotechnology from 2000 to 2005 and 7398 from 2006 to
201110
in which each record contains at least one (1) address of a Turkish university. We
calculated and analyzed records in order to assess the diffusion of nano-related technology
in Turkey. We illustrated the total number of scientific publications and nano-related
technology technologies using column bar graphs. Next paragraphs define a road map
describing the thesis’ explanatory approach.
9Personal communication with Prof. Kostoff 20 April 2012.
10 Data were extracted in November 2013 from WoS.

29
3.1 SOCIAL NETWORK ANALYSIS: STATISTICAL RESULTS
We used overlay maps to capture collaborations in network structures. VOSviewer was
used to implement the method of associative strength, which clusters bibliometric data
based on their similarities to map network structure. We used the above techniques to
overlay the interactions among journals, cities, people or addresses on a geographic map as
well.
A geocoder located at “http://www.gpsvisualizer.com/geocoder/” was used to get the geo-
coordinates for each city whereas Google Maps was used to overlay the relationships
among cities on a geographic map.
Bibexcel was used to create a list of related cities’ frequency from the records by feeding
the list onto the web page mentioned above in order to retrieve the Geo-coordinates of the
cities, and to calculate the most frequent collaborators from selected universities in the
thesis. Moreover, Bibexcel was utilized to create a co-authorship map based on the most
frequent first authors, and all authors from WoS and Scopus, respectively. We take an
explanatory approach for universities in terms of the number of nano-related publications
using overlay maps. We divided universities based on two periods. The top rank
universities were selected based on their degree centralities in terms of scientific
collaboration on nano-related technology. Additionally, we acknowledged scholars whose
publications accelerate the diffusion process, as prolific authors. Gephi (see
https://gephi.org/) was used to calculate the properties of the social network structure, for
example, the centrality (betweenness, closeness, degree & PageRank) of each node in the
social network structure, but also Gephi was used to depict the network’s features visually.
PageRank metric was used to track the significant and prestigious nodes in a network
structure. Co-word analysis and factor analysis were used to track the cognitive
development in social network analysis through years.11
11
The co-word analysis was conducted based on software:
http://www.leydesdorff.net/software/fulltext/index.htm

30
3.2 ETHNOGRAPHIC INTERVIEWS
First, we informed the scientists formally to read the purpose of our study and sign the
consent form (see Appendix B). We collected and conducted a qualitative research by
interviewing the senior and junior scientists. Scientists whose research activities span more
than 20 years were considered seniors whereas the rest were considered juniors. During an
interview while the junior scientists were asked structured questions (Appendix C) while
senior ones were asked semi-structured open-ended questions (see Appendix D). The main
reason that senior scientists were presented with semi-structured questions was their
positional and relational structure in the social network: we were interested in their opinion
on nanotechnology – past and future. Although we constructed questions in a semi-
structured manner for senior scientists, we also examined the hidden meaning in the
discourse collected from junior scientists, which reveals the semantic aspect of the words
in the discourse provided by several scientists. Furthermore, in the ethnographic inquiry
section, the relationship latency of each scientist’s (juniors) written replies has been
examined since their positional and relational perspective on the network is in a state of
shaping.
In this respect, we collected data from 10 interviewees who are key scientists: five
seniors, five juniors and their nano-related research activities through live interviews and
an online survey (only junior scientists were surveyed online). Results compiled from
juniors incubate a prototype, which may indicate their thoughts regarding co-authorship
network structure. In other words, from a linguistic point of view, we analyzed the
documented sources collected during the interviewing process from some key scientists in
the social network structure.

31
3.3 LATENT SEMANTIC ANALYSIS APPROACH
We used Latent Semantic Analysis method (http://lsa.colorado.edu) to find the similarity
between documents (scripts of interview) compiled from interviewees. For example, junior
scientists were asked structured questions regarding the co-authorship graph (Where would
you like to see yourself in this social structure map?) or regarding the nanotechnology
(When did you hear the term nano in your subject study?).
In addition, we captured and elaborated on the scientists’ response (seniors and juniors) to
her/his co-authorship map of nano-related technology. Semi-structured interviews were
carried out with scientists who are central in their research clusters or had participated in
research activities. Then, their verbal reaction was recorded by the researcher regarding the
co-authorship map of the social network in their university which was represented to them
during personal interviews. Thus, the semantic meaning sometimes hidden in the
interviewees’ words can be revealed. Studying scientists’ reactions to an image facilitated
better communication in discourse. The image (snapshot) of the map of co-authorships
among scientists elicited specific utterances from each person which we used for further
analysis. Seniors’ responses were elaborated upon and scripted by the researcher. Their
responses were analyzed by one of the latent semantic analysis methods called “one to
many” sentences located at “http://lsa.colorado.edu” with a topic space in “General-
reading_up_to_1st_year_college (300)” to capture their similarities.
3.4 SUMMARY
We utilized a text query to extract the records in nano-related technology from WoS in
Turkey. Gephi was used to analyze statistical data; VOSviewer was used to map the co-
citation maps and Microsoft Excel to draw figures and Google-Maps to overlay the
network structure on the map. We chose to apply a qualitative method by conducting
ethnographic interviews with junior and senior scientists. Senior scientists were subjected
to semi-structured interviews while junior scientists answered structured questions. Latent
semantic analysis method was used to capture the similarity of sentences in vector space

32
among junior scientists. In the next chapter, we present the findings of our study and
discuss their implications.

CHAPTER 4
FINDINGS
4.1 GOVERNMENT AGENCIES’ SUPPORT
As pointed out earlier, mainly two governmental bodies, TÜBİTAK and the
Ministry of Development (MoD) have been supporting research in Turkey. Since 2005,
TÜBİTAK has especially invested heavily in research and development in universities. In
other words, TÜBİTAK mostly provides funds for specific nano-related research projects
which may lead to scientific publications or patent submissions, whereas (MoD) mostly
provides funds for infrastructure development. For example, during the period 2000 to
2005, most funds were spent on buildings and laboratories. Moreover, MoD has
conventionally been investing in infrastructural development of institutes in which nano-
related technology research has been carried out. UNAM (National Institute of Material
Science & Nanotechnology) participates in the Clean Room Technology project with the
support of MoD. Istanbul Technical University (ITU) and Gebze Institute of Technology
have been actively involved in nano-related projects since 2005.
Turkey’s scientific publications in nano-related technologies increased from 215 articles in
2000 to 1748 articles in 2011, more than an eight-fold increase (Fig. 7).

34
Figure 7. Number of nano-related technologies publications in Turkey: 2000-2011
Source: Thomson’s ISI Web of Science as of November 2013
There are about 180 universities in Turkey, two-thirds being state-funded. Fig. 8 shows
the number of publications of nano-related technology in some universities in Turkey: the
Middle East Technical, Hacettepe, Istanbul Technical, Gazi, Bilkent and Ankara
Universities have published more articles than other universities. All but one of them
(Bilkent) are state funded universities. As we mentioned earlier, governmental agencies
support research institutes located in Bilkent University. Koç, Fatih and Sabanci as three
non-state universities have also published 193, 150 and 138 articles, respectively. In
general, newly established universities published fewer papers on nanotechnology.
215 280 368
462
696 643 776
959 1076
1311
1528
1748
0
500
1000
1500
2000
2500
2000 2001 2002 2003 2004 2005 2006 2007 2008 2009 2010 2011
Nu
mb
er o
f A
rtic
les
&
Rev
iew
s

35
Figure 8. Number of scientific publications of universities in nano-related technologies in Turkey between
2000 and 2011 Source: Web of Science as of November 2013
Universities mostly are funded by governmental agencies and since 2005 Turkish
government has increased its support12
in terms of funds and academic exchanges among
universities (locally, internationally, and post-doctoral programs), to name three. Nano-
related projects at the Middle East Technical University (METU) and Istanbul Technical
University (ITU) are distributed to various departments. Gazi and Hacettepe University
medical schools are actively involved in nano-related technology and its application in
medicine. In addition, scientists working at well-equipped research centers also have
shared their knowledge in the joint projects with other universities. For example, scientists
at Gebze Institute of Technology, ITU, Sabancı and Fatih Universities participate with
MAM (Marmara Research Center) research centers’ joint projects.
Based on our data collection and investigation, TÜBİTAK and the Ministry of
Development (MoD) have supported research activities in several universities in terms of
capitals. Table 2 provides data about the number of nano-related articles published and the
total funds received. Also, it shows that some universities have not been recipient of funds.
For example, Bilkent and Sabanci Universities have not received funds from MoD, yet
they both still have published scientific articles. Istanbul Tech, METU and Gazi
12
To see a list of all supports from TÜBİTAK: “ http://www.tubitak.gov.tr/tr/destekler/akademik/uluslararasi-
destek-programlari#destekler_akademik_ana_sayfa_akordiyon-block_1-1”

36
Universities benefit most from governmental agencies. We conjecture that funds stimulate
the growth in terms of publications in universities.
In this thesis, we elaborate on universities with the highest co-occurrence frequency and
scholars who are influential in the network structure. As we mentioned in the previous
chapter, we have selected universities from each period: 2000-2005 and 2006-2011 with
the highest degree centralities. First, we investigate universities with the highest degree
centralities which are mostly instrumental in diffusion of nano-related technology in terms
of number of publications. Second, by studying their collaborative network structure, we
identified scholars who are instrumental in knowledge diffusion in the network structure.
There might be scholars who do not appear in the universities with the highest degree
centrality but they may have collaborated with other scholars. Hence, we analyzed the
entire network in each period. The next sections contain statistical results for co-
universities and co-authorships analysis.

37
Table 2. Number of nano-related articles published and total funds received by several universities (as of
July 22, 2013)
University # of
Publications
MoD Funds
(×1000 TL)
TÜBİTAK Funds
(×1000 TL)
Total Funds
(×1000 TL) METU 1098 719 953 1672
Istanbul Technical 738 15.705 612 16.317
Hacettepe 849 359 742 1101
Gazi 610 13.356 512 13.868
Gebze Inst Technology 329 15.100 271 15.371
Bilkent 573 -- 868 868
Sabancı 138 -- 176 176
Anadolu 329 550 271 821
Marmara 264 920 212 1132
İzmir Advanced Tech Institute 234 920 205 1125
Boğaziçi 182 420 160 580
Kocaeli 160 192 130 322
Balıkesir 154 -- 553 553
Fatih 150 1230 90 690
Osmangazi 280 1230 90 1320
Akdeniz 106 796 80 876
Dumlupınar 97 608 74 682
Kahramanmaraş Sütçü İmam 73 392 63 455
Abant İzzet Baysal 72 1695 57 1752
Note: Data regarding funds were collected from the Ministry of Development and TÜBİTAK
4.2 CO-UNIVERSITIES ANALYSIS
As we mentioned earlier, the top rank universities were selected based on their degree
centralities in terms of scientific collaboration on nano-related technology. Fig. 9 and Fig.
10 show the network structure of co-universities in nano-related technologies between
2000-2005 and 2006-2011 in Turkey, respectively. VOSviewer creates clusters based on

38
the similarity of two items (nodes) in a vector space (low-dimensional space). Almost 6
different density clusters designated according to their similarity were created by
VOSviewer with an overall density of 0.064. Degree centralities were analyzed using
Gephi. Cluster density map reveals that universities with higher weight centrality are
mostly positioned in the center of the network whereas the ones with lower degrees are
lined towards peripheral: the Middle East Technical, Ankara, Hacettepe, Gazi and Istanbul
Technical and Bilkent are the densest sub clusters in the whole network structure. They
collaborate with Fırat, Yeditepe, Fatih and Çukurova Universities and Gebze Institute of
Technology, respectively. Bilkent University has collaborated with National Institute of
Standard & Technology in the United States of America, which indicates that Bilkent
University has collaborated internationally more than other universities in 2000-2005.
Furthermore, in the right side of the graph Anadolu and Osmangazi, at the top of the graph
Atatürk and Balıkesir, in the left corner Karadeniz Technical, Erciyes and Ondokuz
Mayıs, and in the right lower corner Cumhuriyet and Dokuz Eylül Universities have
collaborated during 2000-2005 in Turkey.
Figure 9. Density map of collaboration on nano-related technology among universities in Turkey: 2000-2005
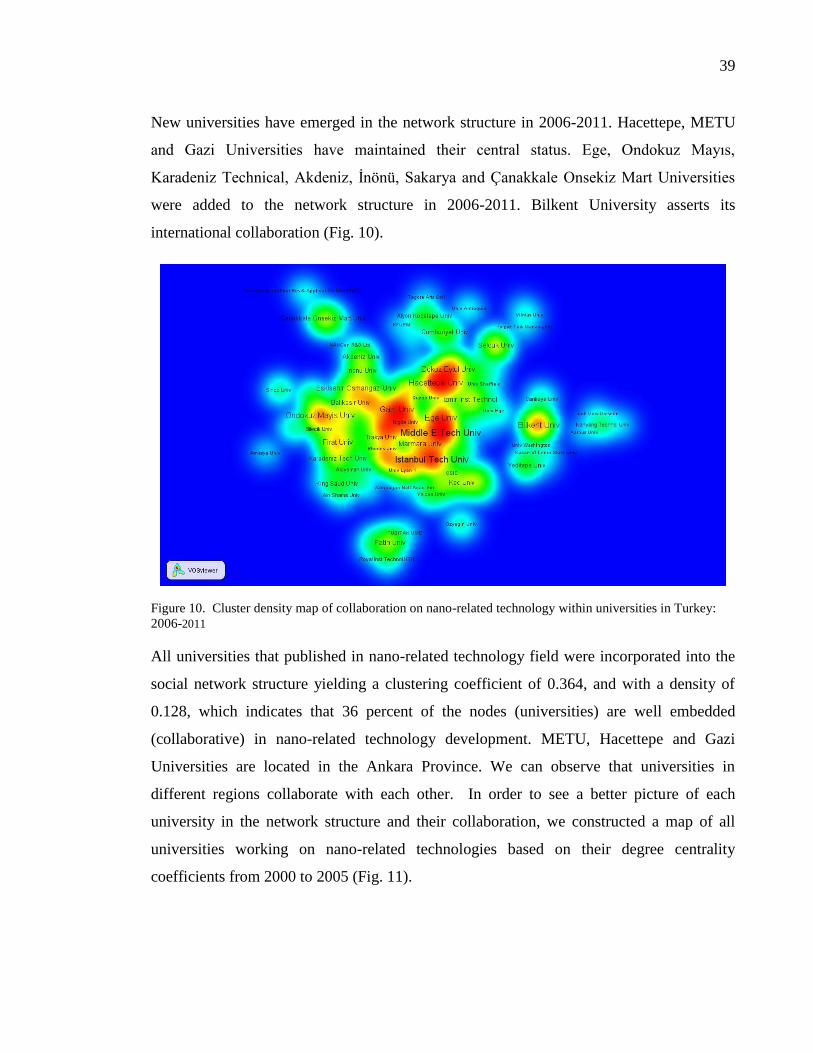
39
New universities have emerged in the network structure in 2006-2011. Hacettepe, METU
and Gazi Universities have maintained their central status. Ege, Ondokuz Mayıs,
Karadeniz Technical, Akdeniz, İnönü, Sakarya and Çanakkale Onsekiz Mart Universities
were added to the network structure in 2006-2011. Bilkent University asserts its
international collaboration (Fig. 10).
Figure 10. Cluster density map of collaboration on nano-related technology within universities in Turkey:
2006-2011
All universities that published in nano-related technology field were incorporated into the
social network structure yielding a clustering coefficient of 0.364, and with a density of
0.128, which indicates that 36 percent of the nodes (universities) are well embedded
(collaborative) in nano-related technology development. METU, Hacettepe and Gazi
Universities are located in the Ankara Province. We can observe that universities in
different regions collaborate with each other. In order to see a better picture of each
university in the network structure and their collaboration, we constructed a map of all
universities working on nano-related technologies based on their degree centrality
coefficients from 2000 to 2005 (Fig. 11).

40
The number of nodes has increased from 69 in 2000-2005 to 169 in 2006-2011 with a
density of 0.075 and clustering coefficient of 0.456, which indicates that 46% of clusters
are well-embedded within the network structure (Fig. 12). Although the density has
decreased slightly, clustering coefficient has increased in a higher rate. In other words, the
network structure is quite loose in both periods; however, sub-clusters within the whole
network are well-connected, which is an indication of the small-world phenomenon.
Fig. 12 illustrates the collaboration of Turkish Universities working on nano-related
technologies conferring to their co-occurrence frequency. As mentioned earlier, the
number of publications has increased since 2005 in Turkey. Growth in number of
universities and their collaboration in research on nano-related technologies from 2000-
2005 to 2006-2011 are two indications of diffusion of scientific knowledge in Turkey.
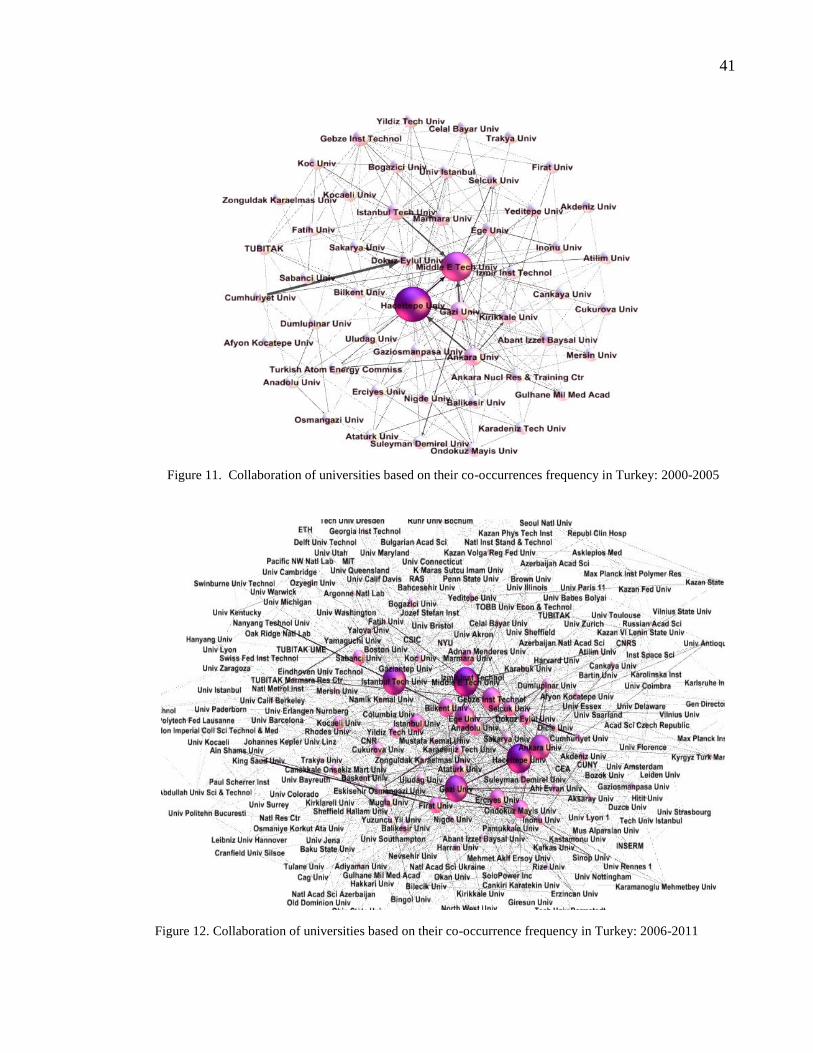
41
Figure 11. Collaboration of universities based on their co-occurrences frequency in Turkey: 2000-2005
Figure 12. Collaboration of universities based on their co-occurrence frequency in Turkey: 2006-2011
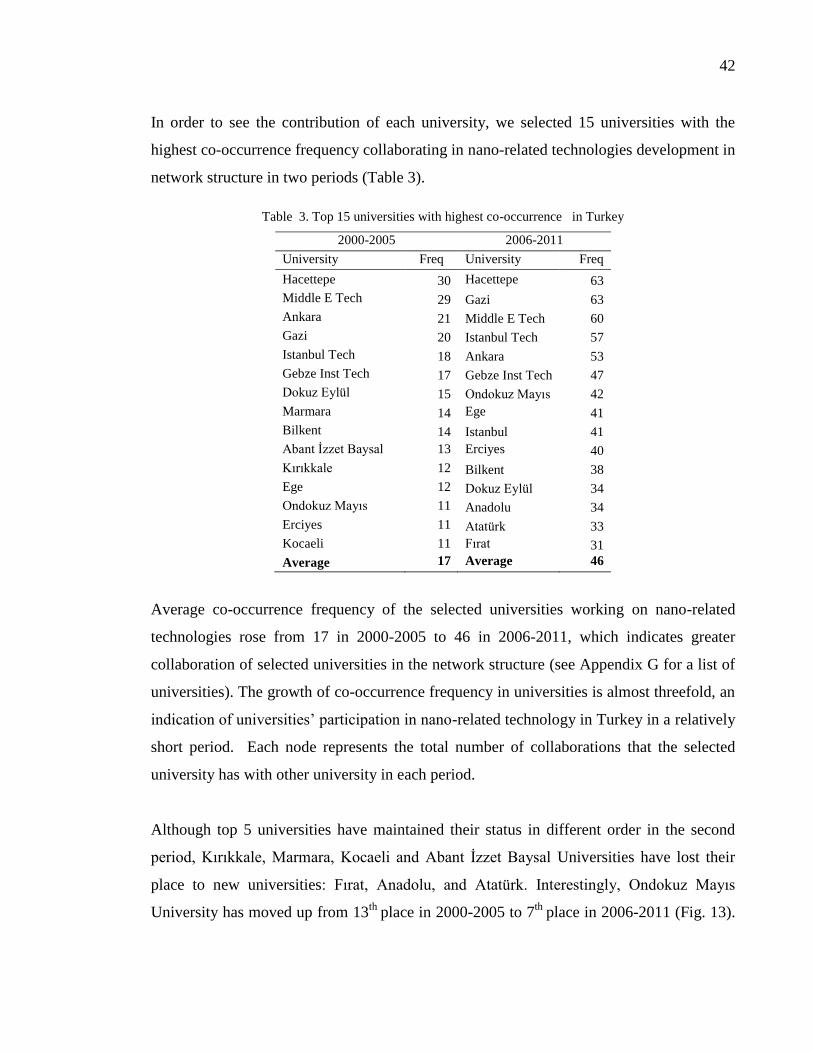
42
In order to see the contribution of each university, we selected 15 universities with the
highest co-occurrence frequency collaborating in nano-related technologies development in
network structure in two periods (Table 3).
Table 3. Top 15 universities with highest co-occurrence in Turkey
2000-2005 2006-2011
University Freq University Freq
Hacettepe 30 Hacettepe 63
Middle E Tech 29 Gazi 63
Ankara 21 Middle E Tech 60
Gazi 20 Istanbul Tech 57
Istanbul Tech 18 Ankara 53
Gebze Inst Tech 17 Gebze Inst Tech 47
Dokuz Eylül 15 Ondokuz Mayıs 42
Marmara 14 Ege 41
Bilkent 14 Istanbul 41
Abant İzzet Baysal 13 Erciyes 40
Kırıkkale 12 Bilkent 38
Ege 12 Dokuz Eylül 34
Ondokuz Mayıs 11 Anadolu 34
Erciyes 11 Atatürk 33
Kocaeli 11 Fırat 31
Average 17 Average 46
Average co-occurrence frequency of the selected universities working on nano-related
technologies rose from 17 in 2000-2005 to 46 in 2006-2011, which indicates greater
collaboration of selected universities in the network structure (see Appendix G for a list of
universities). The growth of co-occurrence frequency in universities is almost threefold, an
indication of universities’ participation in nano-related technology in Turkey in a relatively
short period. Each node represents the total number of collaborations that the selected
university has with other university in each period.
Although top 5 universities have maintained their status in different order in the second
period, Kırıkkale, Marmara, Kocaeli and Abant İzzet Baysal Universities have lost their
place to new universities: Fırat, Anadolu, and Atatürk. Interestingly, Ondokuz Mayıs
University has moved up from 13th
place in 2000-2005 to 7th
place in 2006-2011 (Fig. 13).

43
High degree of closeness centrality indicates the cohesiveness of subclusters within
network structure. We conjecture that selected nodes are in close (i.e., shortest path)
distance from each other.
Figure 13. Comparison of co-occurrence frequency of selected universities in two periods
Moreover, Table 4 summarizes the coefficient centralities (betweenness, closeness) of
universities working on nano-related technologies between 2000-2005 and 2006-2011,
respectively.

44
Table 4. Centrality coefficients of the network structure: 2000-2005 and 2006-2011
2000-2005 2006-2011
University Betweenness Closeness University Betweenness
Closeness
Hacettepe 0.192 0.652 Hacettepe 0.086 0.602
Middle E Tech 0.151 0.626 Gazi 0.098 0.598
Ankara 0.073 0.574 Middle E Tech 0.107 0.596
Gazi 0.075 0.574 Istanbul Tech 0.105 0.596
Istanbul Tech 0.051 0.539 Ankara 0.054 0.583
Gebze Inst Tech 0.050 0.500 Gebze Inst Tech 0.054 0.556
Dokuz Eylül 0.044 0.521 Ondokuz Mayıs 0.028 0.549
Marmara 0.024 0.512 Ege 0.044 0.564
Bilkent 0.061 0.504 Istanbul 0.044 0.547
Abant İzzet Baysal 0.022 0.521 Erciyes 0.033 0.540
Kırıkkale 0.024 0.500 Bilkent 0.080 0.551
Ege 0.026 0.508 Dokuz Eylül 0.033 0.537
Ondokuz Mayıs 0.045 0.512 Anadolu 0.025 0.542
Erciyes 0.043 0.521 Atatürk 0.023 0.535
Kocaeli 0.018 0.470 Fırat 0.036 0.505
Average 0.060 0.536 Average 0.057 0.560
The average degree of closeness centrality slightly rose from 0.536 in 2000-2005 to 0.560
in 2006-2011. Betweenness centrality, on the other hand, decreased from 0.060 in 2000-
2005 to 0.057 in 2006-2011, respectively.
Low betweenness centrality supports the notion that clusters in the network are not well-
connected. The network structures for both periods are loose. On the other hand, the
high closeness degree yields that sub-clusters within the network structure is well-
connected. For example, the network structure of Hacettepe University was more
connected in 2000-2005 than in 2006-2011.
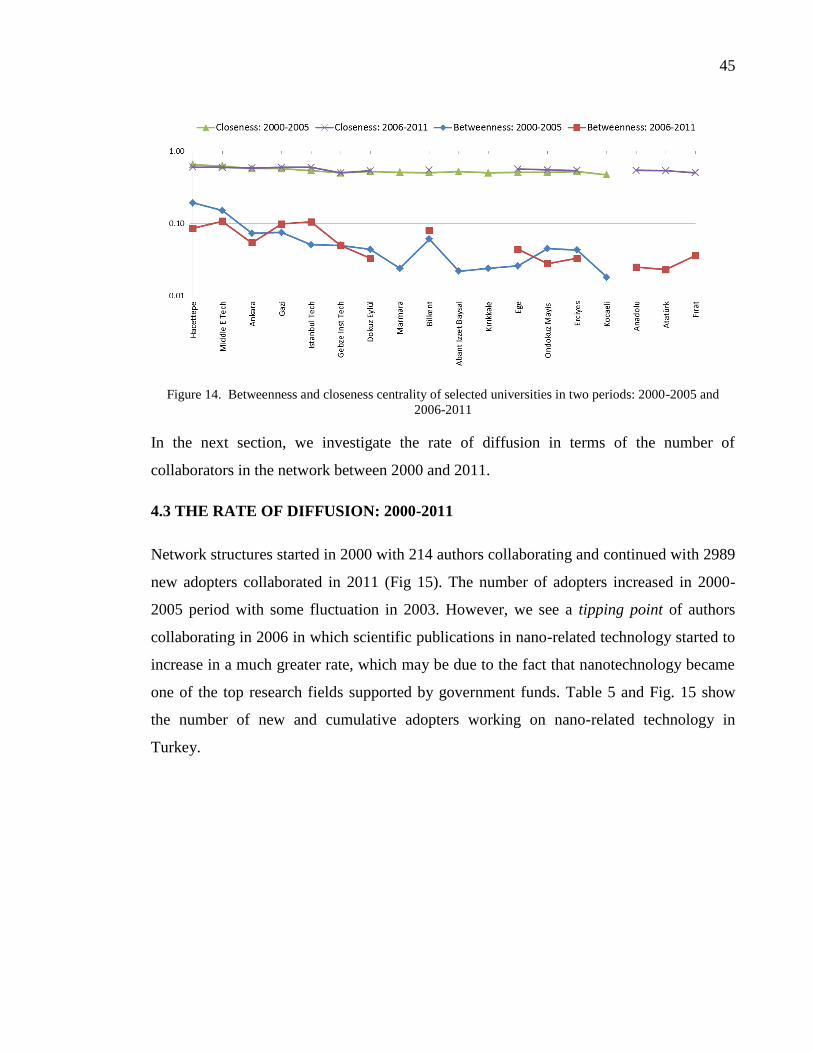
45
Figure 14. Betweenness and closeness centrality of selected universities in two periods: 2000-2005 and
2006-2011
In the next section, we investigate the rate of diffusion in terms of the number of
collaborators in the network between 2000 and 2011.
4.3 THE RATE OF DIFFUSION: 2000-2011
Network structures started in 2000 with 214 authors collaborating and continued with 2989
new adopters collaborated in 2011 (Fig 15). The number of adopters increased in 2000-
2005 period with some fluctuation in 2003. However, we see a tipping point of authors
collaborating in 2006 in which scientific publications in nano-related technology started to
increase in a much greater rate, which may be due to the fact that nanotechnology became
one of the top research fields supported by government funds. Table 5 and Fig. 15 show
the number of new and cumulative adopters working on nano-related technology in
Turkey.

46
Table 5. Number of new and cumulative adopters between 2000 and 2011
Year New adopters Cumulative adopters
2000 214 214
2001 177 391
2002 193 584
2003 381 965
2004 115 1080
2005 282 1362
2006 1622 2948
2007 1668 4652
2008 1907 6559
2009 1919 8478
2010 2225 10703
2011 2989 13692
Figure 15. Adoption rate of collaborations between 2000-2011
In the following sections, we overlay research activities based on WoS 224 Subject
Categories for selected universities on science map and their coefficient centralities from
2000-2005 to 2006-2011 in Turkey.
0
2000
4000
6000
8000
10000
12000
14000
16000
18000
20000
2000 2001 2002 2003 2004 2005 2006 2007 2008 2009 2010 2011
New Adopters Cumulative Adopters

47
4.4 NETWORK OF NANO-RELATED TECHNOLOGY IN TURKEY: 2000-2005
AND 2006-2011
An overlaid map of nano-related scientific activities on the map of science from records
based on WoS Categories was created (Fig. 16). Clearly, each color located in the map
represents a factor, which represents a subject category on the map. Node size in the graph
is proportional to its co-occurrences with other nodes.
Figure 16. Profile of universities based on subject category in nano-related technology overlaid on map of science in
Turkey: 2000-2005
Material Science, Chemistry, Physics followed by Clinical Medicine and Psychological
Science are scientific fields that have precedence over other scientific activities by Turkish
scientists. Ecological Science, Geosciences, Environmental Science & Technology,

48
Computer Science and Agricultural Science were also noticeable. To a lesser extent,
Mechanical Engineering, and Clinical Psychology Issues were investigated by Turkish
scientists between 2000 and 2005. The statistical results for the overlaid map based on
Subject Categories for all universities are following: betweenness centrality of 0.079,
degree centrality of 0.550 and closeness centrality of 0.477 (Table 6). We can deduce that
Material Sciences lead scientific field in which many applications of nano-related
technologies are utilized in 2000-2005.
Next figure (Fig. 17) illustrates an overlaid map of WoS Categories on the map of science
from 2006 to 2011 with degree centralities: betweenness centrality of 0.027, degree
centrality of 0.640 and, finally, closeness centrality of 0.625 (Table 6). In contrast with
2000-2005 network structure, degree and closeness coefficients centrality rose from 0.550
to 0.640 for the former and 0.477 to 0.625 for the latter while betweenness centrality
decreased to a lower degree. Betweenness centrality indicates that flow of information
among sub-clusters was reduced to some extent. We can interpret the increase in degree
centrality as an increase in the number of edges connected to each node.
Table 6. Degree centralities of network structure based on WoS subject categories
Years Betweenness Degree Closeness
2000-2005 0.079 0.550 0.477
2006-2011 0.027 0.640 0.625

49
Figure 17. Profile of universities based on subject category in nano-related technology overlaid on map of science in
Turkey: 2006-2011
We conjecture that the diffusion of nano-related technology has increased due to a higher
closeness degree in the network structure. However, there is a slight decrease of
collaboration among research fields in the network structure.
In the next sections, we present the statistical results for 15 selected universities in details
in each period: 2000-2005 and 2006-2011. Then, we compare and contrast their coefficient
centralities following by overlaid maps of each selected university.

50
4.5 NETWORK OF PUBLICATIONS IN NANO-RELATED TECHNOLOGY IN
TURKEY: 2000-2005 AND 2006-2011
Table 7 shows the top 15 universities and their publications’ centrality coefficients in
nano-related technology of the network structure.
Table 7. Centralities coefficients of the top 15 universities’ publications on
nano-related technology, 2000-2005 and 2006-2011
2000-2005 2006-2011
University Degree Degree Closeness Betweenness University Degree Closeness Betweenness
Middle E Tech 0.523 0.467 0.113 Bilkent 0.620 0.588 0.069
Bilkent 0.515 0.495 0.124 Gebze Inst 0.603 0.541 0.068
Hacettepe 0.401 0.495 0.072 Hacettepe 0.574 0.524 0.022
Ondokuz Mayis 0.357 0.359 0.106 Middle E Tech 0.562 0.511 0.054
Dokuz Eylül 0.323 0.322 0.060 Istanbul Tech 0.534 0.468 0.031
Gebze Inst Tech 0.314 0.499 0.110 Anadolu 0.470 0.379 0.042
Kirikkale 0.288 0.457 0.119 Gazi 0.457 0.373 0.070
Ege 0.276 0.359 0.126 Ondokuz Mayis 0.455 0.415 0.067
Abant İzzet Baysal 0.252 0.612 0.184 Istanbul 0.445 0.415 0.067
Gazi 0.244 0.373 0.156 Ege 0.431 0.382 0.035
Marmara 0.225 0.336 0.215 Ankara 0.418 0.363 0.071
Ankara 0.224 0.373 0.072 Dokuz Eylül 0.323 0.322 0.060
Kocaeli 0.218 0.325 0.425 Firat 0.317 0.452 0.051
Erciyes 0.162 0.466 0.098 Erciyes 0.256 0.452 0.049
Istanbul Tech 0.109 0.363 0.151 Atatürk 0.230 0.316 0.091
Avg 0.295 0.420 0.142 Avg 0.446 0.433 0.056
The average degree and closeness centrality coefficients rose from 0.295 to 0.466 for the
former and from 0.420 to 0.433 for the latter; however, betweenness centrality decreased
from 0.142 to 0.056 indicating that there is less connectivity within sub-clusters in the
network structure. METU, Bilkent and Hacettepe Universities are at the pinnacle of the list

51
while Istanbul Technical, Erciyes and Kocaeli Universities are at the bottom with the
lowest degree centrality coefficients in the 2000-2005 period.
Dokuz Eylül, Hacettepe and Ankara Universities have the lowest betweenness centrality
coefficients indicating that sub-clusters within the whole network structure are not well-
connected. However, their higher closeness centrality coefficients indicate a higher
propensity for well-connected clusters during 2000-2005 in Turkey. High betweenness
centrality of Kocaeli University yields the flow of knowledge among its three subject
fields: Clinical Medicine, Materials Science and Ecological Science.
Moreover, the higher degree centrality yields more participation of a node in the network
than that a node with a lower degree centrality. For example, Bilkent, METU and
Hacettepe Universities have the highest degree centrality coefficients in the network,
which is an indication of their greater contribution to the network structure in terms of
number of publications. Therefore, we conjecture that network structure adheres to the
small-world phenomenon.
Kırıkkale, Abant İzzet Baysal, Marmara and Kocaeli Universities are no longer in the top
15 universities in the 2006-2011 period in terms of their production of nanotechnology
papers. Instead, Anadolu, İstanbul, Fırat and Atatürk Universities rose to the first 15
universities.
Bilkent is at the top of the 2006-2011 list with the highest betweenness and closeness
centralities followed by Gebze Institute of Technology (Gebze was in the 6th
place in 2000-
2005). Hacettepe University and METU are also at the top of the 2006-2011 lists (Fig.
18). These four universities form a cohesive network structure in 2006-2011. In general,
betweenness centrality coefficients are much lower for all universities except Bilkent
University and Gebze Institute of Technology. Atatürk, Erciyes and Fırat Universities are
at the bottom of the list with the lowest coefficients of degree and closeness.

52
Figure 18. Degree centralities of selected universities in two periods: 2000-2005 and 2006-2011
What follows are the network centrality of 15 universities in 2006-2011. The order of
universities does not strictly follow the order in Table 7. We present 15 overlay maps of
selected universities mentioned above in details in each period: 2000-2005 and 2006-2011.
Overlay maps generated for each university illustrates each university’s publication, which
signifies nano-related technology in terms of WoS Subject Categories, and then, by
analyzing and comparing their statistical results in each period, we explored the diffusion
of nano-related technologies in Turkey

53
4.6 NETWORK OF NANO-RELATED TECHNOLOGY IN SELECTED
UNIVERSITIES: 2000-2005
The Middle East Technical University (METU) is a leader in nano-related technologies in
terms of number of publications. METU participates mostly in science subjects: Material
Sciences, Chemistry, Environmental Science and Technology (Fig. 19), followed by the
Biomedical Science in the center, Geosciences in the upper right corner, Computer Science
and Mathematics in the lower right part of the map. Social Studies are noticeable in lower
left part of the graph. We can say that there is collaboration between Engineering Science
and Medicine at both universities. The statistical results for the overlaid map based on
Subject Categories for METU are following: betweenness of 0.113, degree centrality of
0.523, and closeness of 0.467. Results indicate that flow of knowledge between sub-
clusters is higher than that of base map. Similarly, flow of information within sub-clusters
is high, too. METU plays an important role in the diffusion of nano-related technology in
the whole network structure.
Figure 19. Publication profiles overlaid on the map of science of METU 2000-2005

54
Overlay map for Bilkent University is distributed containing several scientific subject
fields. Although Material Science, Physics, and Chemistry appear dense, Biomedical
Science is in the center of the map. Bilkent University is also active in Mechanical
Engineering, Environmental Science & Technology and Geoscience in which the use of
nano-related technology is vast. Bilkent University collaborates mostly with universities in
Europe and North America in research. The statistical results for the overlaid map based
on Subject Categories for Bilkent are as follows: betweenness of 0.124, degree centrality
of 0.515, and closeness centrality of 0.495 (Fig. 20).
Figure 20. Publication profiles overlaid on the map of science of Bilkent University, 2000-2005

55
Hacettepe University is more active in nano-related technology applications of Clinical
Medicine. In addition, Hacettepe University is actively involved in other scientific fields
such as Chemistry and Material Science. At Hacettepe University, Medical and Biomedical
Science applications are a focal point in the network structure indicating
nanotechnology/Nanoscience growth in the medical sciences. Black, red and green mostly
occupies the network structure with the biggest node size in the network structure. The
statistical results from the overlaid map based on Subject Categories for Hacettepe
University are following: betweenness of 0.072, degree centrality of 0.401 and closeness
centrality of 0.495 (Fig 21).
In contrast to the base map, betweenness centrality indicates that the flow of information in
the network did not decrease at a higher rate. Importantly, all indicators yield that
Hacettepe University plays an important role in the diffusion of nano-related technology in
the whole network structure.
Figure 21. Publication profiles overlaid on the map of science of Hacettepe University 2000-2005

56
Materials Sciences, Chemistry, Physics, Environmental Science & Technology, and
Clinical Medicine are the research subject fields in Ondokuz Mayis University. Knowledge
diffusion in the network structure according to its centralities is slow, but it is higher within
sub-components (Fig. 22). The statistical results from the overlaid map based on Subject
Categories for Ondokuz Mayis University are as follows: betweenness centrality of 0.106,
degree centrality of 0.357 and closeness centrality of 0.359.
Figure 22. Publications, profiles overlaid on the map of science of Ondokuz Mayis University, 2000-2005
The next overlay maps are of Ankara and Gazi Universities (Fig. 23 & Fig. 24). They work
almost in the same research domains. However, they are more productive than others are at
some research subject fields. For example, Gazi University produced more output in
Infectious Diseases (rose-pink color node at the top of the graph) whereas Ankara
University produced more output in Clinical Psychology. The Material Science and

57
Clinical Science disciplines are central, whereas Computer Science and Clinical
Psychology are peripheral.
Figure 23. Publication profiles overlaid on the map of science of Ankara University, 2000-2005
Figure 24. Publication profiles overlaid on the map of science of Gazi University, 2000-2005

58
The statistical results from the overlaid map based on Subject Categories for Ankara
University are as following: betweenness centrality of 0.072, degree centrality of 0.224 and
closeness centrality of 0.373. Results indicate that the flow of information is high both
among and within sub-clusters.
On the other hand, Gazi University’s centralities results are following: betweenness degree
of 0.156, degree centrality of 0.244 and closeness centrality of 0.373. Interestingly, Gazi
and Ankara’s University centralities are almost equal except their betweenness centrality,
which indicates that the flow of information in Gazi University diffuses in a higher rate
than that in Ankara University does. Moreover, the number of red nodes is (Clinical
Medicine) higher in Gazi University as is in Ankara University. In both universities,
Material Sciences are the most populated nodes in the network.
Fig. 25 displays that Istanbul Technical University (ITU), which is active in technical
sciences mostly, is similar to METU. Material Science and Environmental Science &
Technology are focal points in the overlay map. Moreover, ITU is active in Economic
Politics & Geography, Science in the lower part of the map. Biomedical Science is obvious
in the center of the map with two nodes, and, to the right, three Clinical nodes are
displayed in the network structure.
The statistical results from the overlaid map based on WoS Subject Categories for Istanbul
Technical University are following: betweenness centrality of 0.151, degree centrality of
0.109 and closeness centrality of 0.363. Comparing to the base map’s result in Table 6,
knowledge spreads between sub-clusters faster due to higher betweenness centrality.
Nevertheless, degree centrality and closeness centralities affect the network in diffusion at
a lower rate in ITU’s network structure.
Gebze Institute of Technology is mostly active in several research subject fields: Materials
Science, Environmental Science and Technology and, noticeably, on Clinical Medicine,
which indicates that nanotechnology growth in a multidisciplinary research area (Fig 26).
Moreover, it has published scientific articles in Health & Social Issues, Psychological
Science and Computer Science to a lesser extent. The statistical results of Gebze Institute

59
of Technology are following betweenness centrality of 0.110, degree centrality of 0.314
and closeness of 0.499.
Figure 25. Publication profiles overlaid on the map of science of ITU, 2000-2005
Figure 26. Publication profiles overlaid on the map of science of Gebze Institute of Technology, 2005-2005

60
Dokuz Eylül University (Fig. 27) has created less output in terms of publication in
Biomedical Science and Clinical Medicine than that of Marmara University (Fig 28). For
example, there are 6 nodes in Biomedical Science and 2 nodes in Clinical Medicine at
Dokuz Eylül University whereas there are 9 and 6 nodes each in Biomedical Science and
Clinical Medicine at Marmara University, respectively. Statistical results for Dokuz Eylül
University are following: betweenness centrality of 0.060, degree centrality of 0.323 and
closeness centrality of 0.322 (Fig. 27).
Figure 27. Publication profiles overlaid on the map of science of Dokuz Eylül University, 2000-2005
Marmara University is not only active in Clinical Medicine, Biomed Science and Material
Science, but also in the subject field: Infectious Diseases, Agricultural Science,
Psychological Science and Health & Social Sciences. Nevertheless, Material Science is the
most populated cluster in terms of nodes in which nano-related research fields are most
applicable. Statistical results for Marmara University are following: betweenness centrality
of 0.215, degree centrality of 0.225 and closeness centrality of 0.336 (Fig. 28).
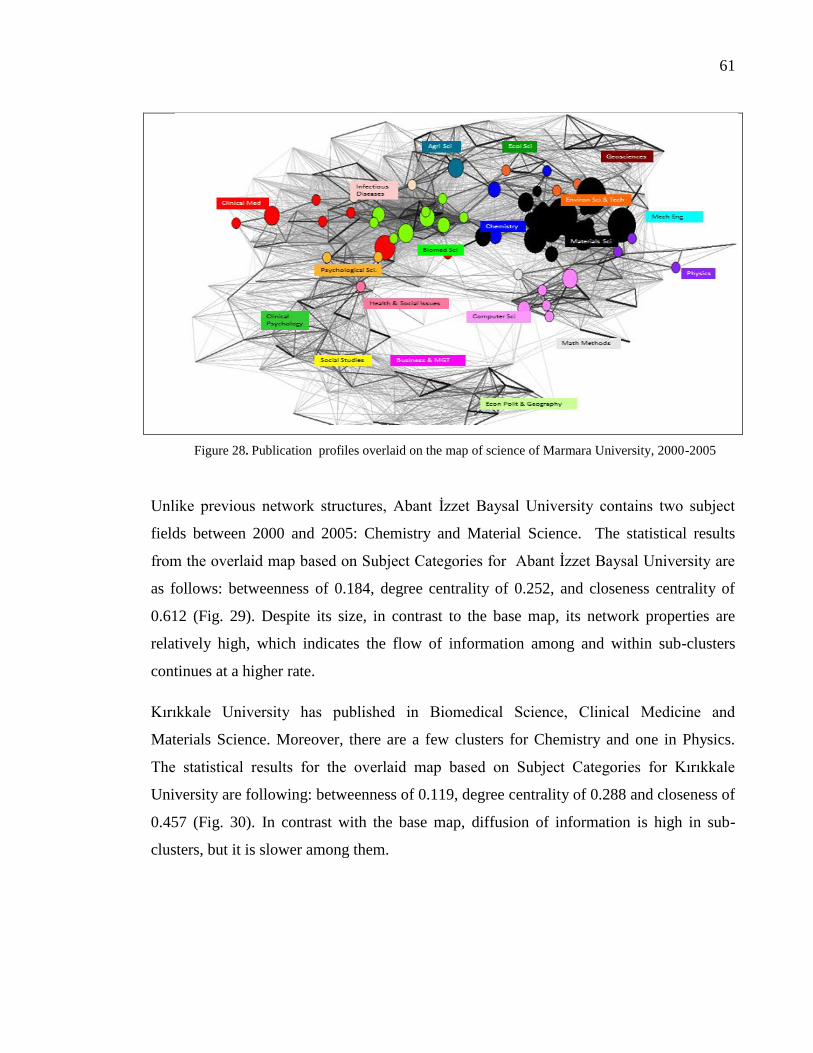
61
Figure 28. Publication profiles overlaid on the map of science of Marmara University, 2000-2005
Unlike previous network structures, Abant İzzet Baysal University contains two subject
fields between 2000 and 2005: Chemistry and Material Science. The statistical results
from the overlaid map based on Subject Categories for Abant İzzet Baysal University are
as follows: betweenness of 0.184, degree centrality of 0.252, and closeness centrality of
0.612 (Fig. 29). Despite its size, in contrast to the base map, its network properties are
relatively high, which indicates the flow of information among and within sub-clusters
continues at a higher rate.
Kırıkkale University has published in Biomedical Science, Clinical Medicine and
Materials Science. Moreover, there are a few clusters for Chemistry and one in Physics.
The statistical results for the overlaid map based on Subject Categories for Kırıkkale
University are following: betweenness of 0.119, degree centrality of 0.288 and closeness of
0.457 (Fig. 30). In contrast with the base map, diffusion of information is high in sub-
clusters, but it is slower among them.

62
Figure 29. Publication profiles overlaid on the map of science of Abant İzzet Baysal University, 2000-2005
Figure 30. Publication profiles overlaid on the map of science of Kırıkkale University, 2000-2005

63
In contrast with most of earlier universities, which are mostly productive in Materials
Science, Ege University is productive in Clinical Medicine, Biomedical Science, Infectious
Diseases and Materials Science. The statistical results for the overlaid map based on
Subject Categories for Ege University are as follows: betweenness centrality of 0.126,
degree centrality of 0.276 and closeness centrality of 0.359 (Fig. 31).
Figure 31. Publication profiles overlaid on the map of science of Ege University, 2000-2005

64
Infectious Diseases, Chemistry, Environmental Science & Technology, Geoscience,
Computer Science, Physics, Mechanical Engineering and Materials Science occupied
Erciyes’ network structure between 2000 and 2005 in Turkey (Fig. 32). Erciyes
University’s network properties of betweenness of 0.098, degree centrality of 0.162 and
closeness centrality of 0.466 make it less influential in terms of flow of information within
its sub-clusters in the network structure.
Figure 32. Publication profiles overlaid on the map of science of Erciyes University, 2000-2005

65
Although Kocaeli University being active only in three subject fields( Materials Science
with highest numbers of node, Clinical Medicine and Economical Science & Technology),
it has the highest betweenness centrality of 0.425, which illustrates that the flow of
information among its sub-clusters is higher compared to the base map (Fig. 33).
Moreover, degree centrality and closeness centralities are 0.218 and 0.325, respectively.
Figure 33. Publication profiles overlaid on the map of science of Kocaeli University, 2000-2005
In the next section, we review the overlay map of universities with the highest degree
centrality coefficients based on their WoS subject categories on the scientific map from
2006 to 2011.

66
4.7 NETWORK OF NANO-RELATED TECHNOLOGY IN SELECTED
UNIVERSITIES: 2006-2011
Materials Science, Chemistry, Physics and Computer Science and to some extent,
Environmental Science, Physiological Science are research subject fields in Bilkent
University. The statistical results for the overlaid map based on Subject Categories for
Bilkent University are as follows: betweenness of 0.069, degree centrality of 0.620 and
closeness centrality of 0.558 (Fig. 34).
Figure 34. Publications profiles overlaid on the map of science of Bilkent University, 2006-2011
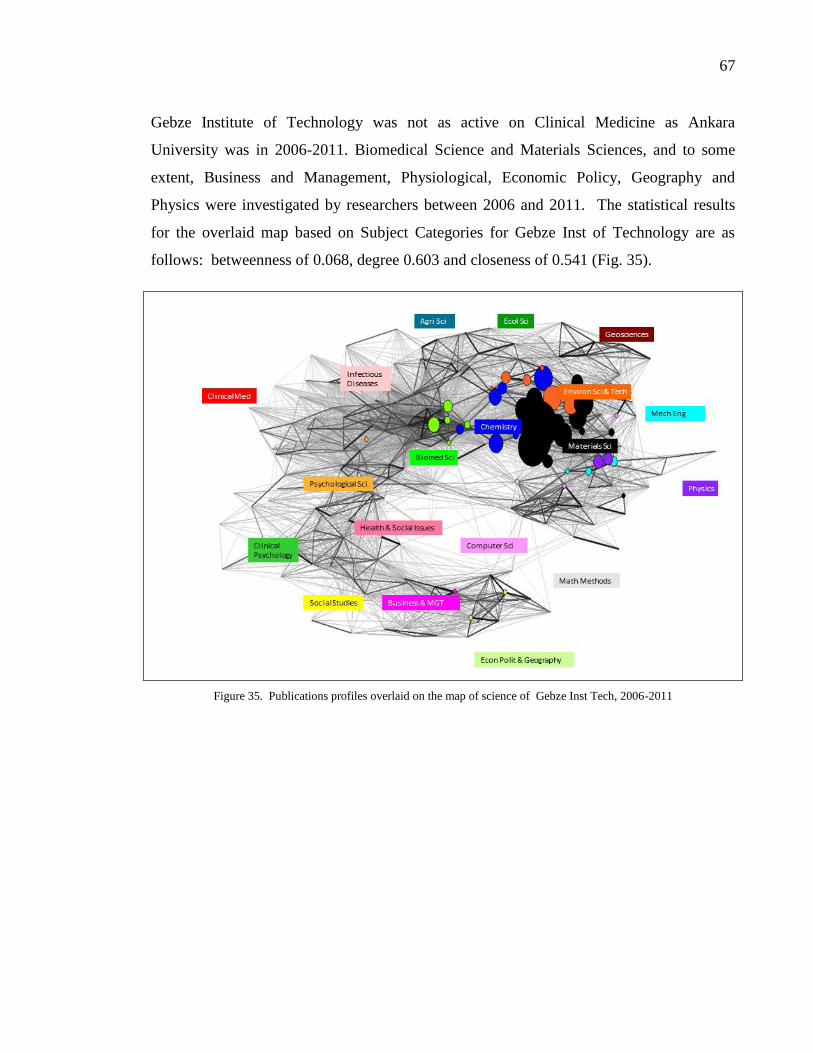
67
Gebze Institute of Technology was not as active on Clinical Medicine as Ankara
University was in 2006-2011. Biomedical Science and Materials Sciences, and to some
extent, Business and Management, Physiological, Economic Policy, Geography and
Physics were investigated by researchers between 2006 and 2011. The statistical results
for the overlaid map based on Subject Categories for Gebze Inst of Technology are as
follows: betweenness of 0.068, degree 0.603 and closeness of 0.541 (Fig. 35).
Figure 35. Publications profiles overlaid on the map of science of Gebze Inst Tech, 2006-2011

68
Hacettepe University has the third highest degree coefficient centrality in the network
structure: 2006-2011 (Table 7). Psychological Science and Infectious Diseases have
become more apparent in the second period at Hacettepe University. Still, Materials
Sciences and Clinical Medicine have grown in number of nodes. The number of nodes in
Clinical Medicine has increased in the second period, 2006-2011. The statistical results for
the overlaid map based on Subject Categories for Hacettepe University are following:
betweenness of 0.022 (which is the lowest betweenness degree among 15 universities)
(Fig. 36).
Figure 36. Publications profiles overlaid on the map of science of Hacettepe University, 2006-2011

69
METU has published more articles in Clinical Psychology, Psychological Science and
Social Studies; however, Materials Science, and Chemistry and Physics research fields are
still front-runners in METU. The statistical results for the overlaid map based on Subject
Categories for METU as follows: betweenness of 0.054, degree centrality of 0.562 and
closeness coefficient of 0.511 (Fig. 37).
Figure 37. Publication profiles overlaid on the map of science of METU University, 2006-2011

70
There are fewer nodes of Clinical Medicine in the center of the map in Gazi University;
however, existing nodes are denser. Psychological Science, Health & Social Issues and
Clinical Psychology are denser in the second period for Gazi University The statistical
results for the overlaid map based on Subject Categories for Gazi University are as
follows: betweenness of 0.070, degree centrality of 0.457, and closeness centrality of
0.373 (Fig. 38).
Figure 38. Publications profiles overlaid on the map of science of Gazi University, 2006-2011

71
Istanbul Tech University (ITU) is illustrated in Figure 39. The right side of the graph is
made up of Materials Science and so on. Business & Management is shown in the bottom
of the map. In the center of the graph, there is a reciprocity between a node of Clinical
Medicine and a node of Materials Sciences designated with a black line, we can conjecture
that there is a multi/inter disciplinary among Clinical and Materials Sciences. The
statistical results for the overlaid map based on Subject Categories for ITU are as follows:
betweenness of 0.031, degree centrality of 0.534, and closeness centrality of 0.468.
Figure 39. Publication profiles overlaid on the map of science of ITU, 2006-2011
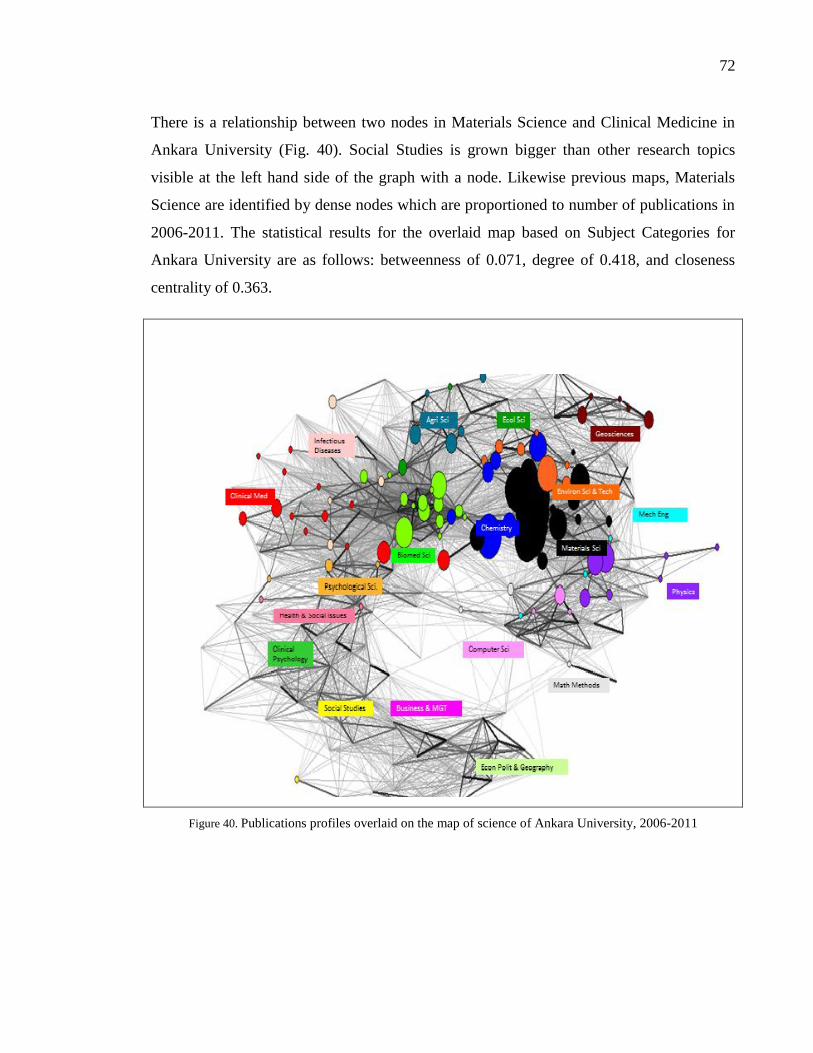
72
There is a relationship between two nodes in Materials Science and Clinical Medicine in
Ankara University (Fig. 40). Social Studies is grown bigger than other research topics
visible at the left hand side of the graph with a node. Likewise previous maps, Materials
Science are identified by dense nodes which are proportioned to number of publications in
2006-2011. The statistical results for the overlaid map based on Subject Categories for
Ankara University are as follows: betweenness of 0.071, degree of 0.418, and closeness
centrality of 0.363.
Figure 40. Publications profiles overlaid on the map of science of Ankara University, 2006-2011
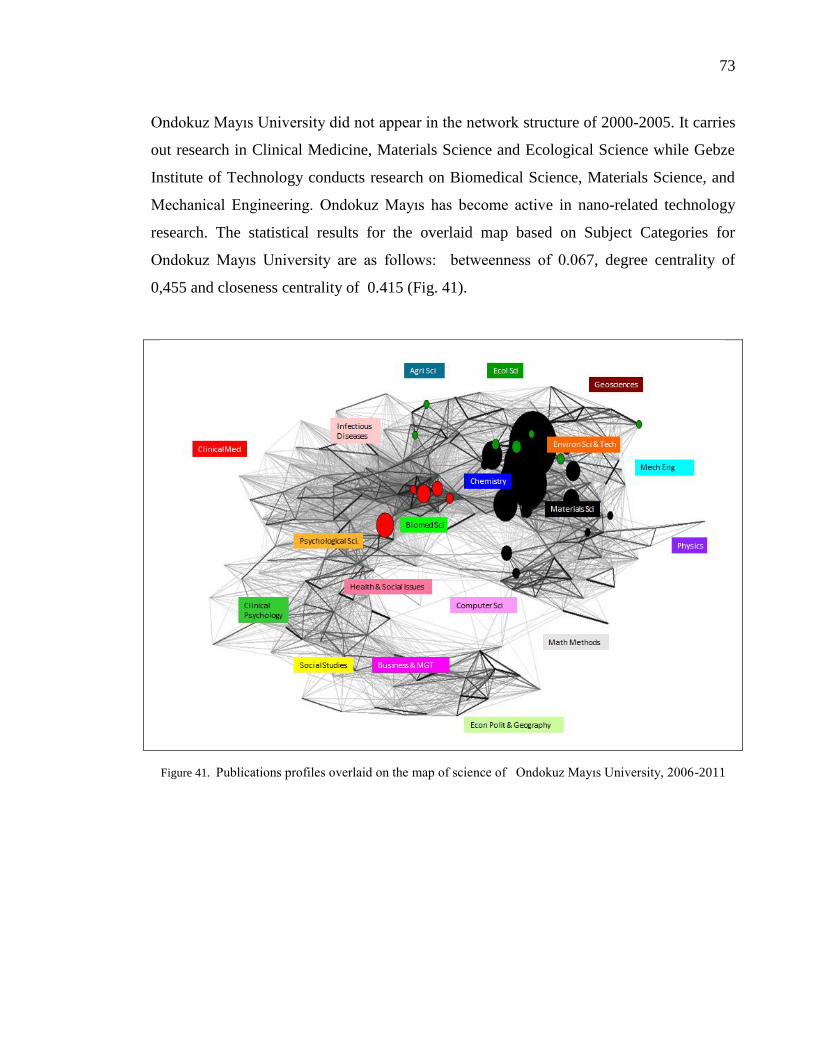
73
Ondokuz Mayıs University did not appear in the network structure of 2000-2005. It carries
out research in Clinical Medicine, Materials Science and Ecological Science while Gebze
Institute of Technology conducts research on Biomedical Science, Materials Science, and
Mechanical Engineering. Ondokuz Mayıs has become active in nano-related technology
research. The statistical results for the overlaid map based on Subject Categories for
Ondokuz Mayıs University are as follows: betweenness of 0.067, degree centrality of
0,455 and closeness centrality of 0.415 (Fig. 41).
Figure 41. Publications profiles overlaid on the map of science of Ondokuz Mayıs University, 2006-2011

74
Ege University research activities spans on variety of subject fields: Clinical Medicine,
Biomedical Science, Chemistry, Infectious Diseases, Agricultural Science, Ecological
Science and so on. In contrast to a few preceding universities, Ege University participates
in more research. The statistical results for the overlaid map based on Subject Categories
for Ege University are as following: betweenness of 0.035, degree centrality of 0.431 and
closeness centrality of 0.382 (Fig. 42).
Figure 42. Publications profiles overlaid on the map of science of Ege University, 2006-2011
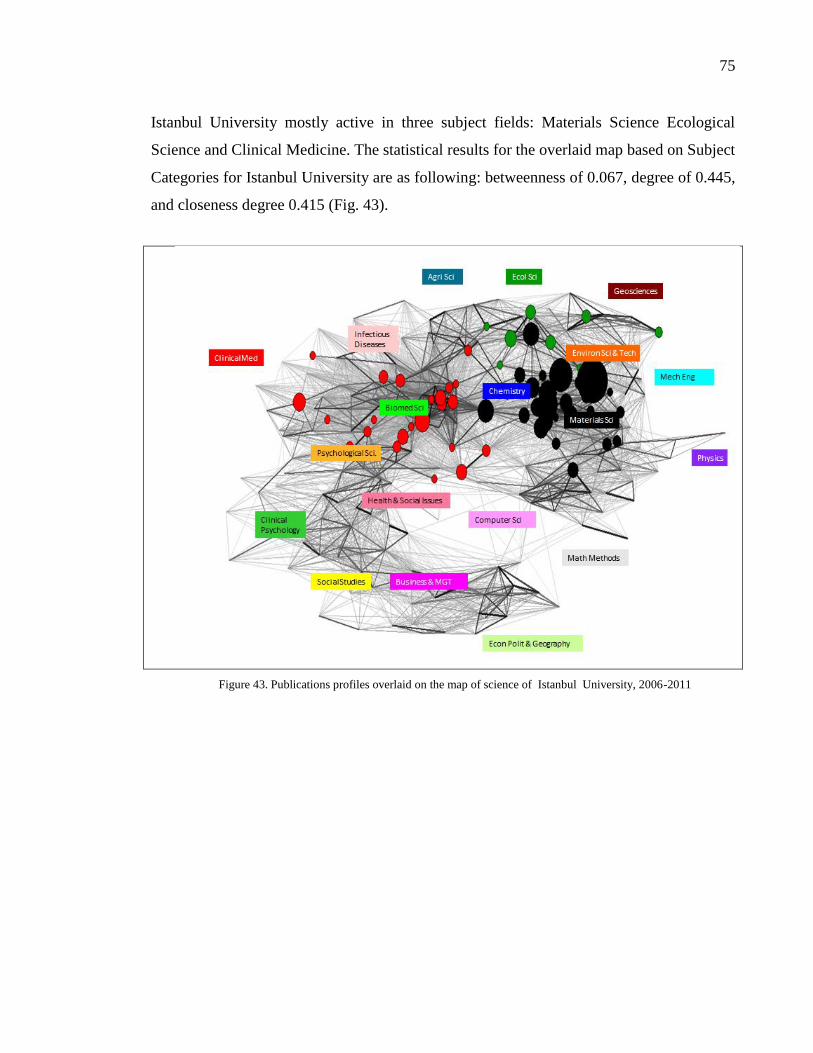
75
Istanbul University mostly active in three subject fields: Materials Science Ecological
Science and Clinical Medicine. The statistical results for the overlaid map based on Subject
Categories for Istanbul University are as following: betweenness of 0.067, degree of 0.445,
and closeness degree 0.415 (Fig. 43).
Figure 43. Publications profiles overlaid on the map of science of Istanbul University, 2006-2011

76
Ecological Science, Agricultural Science, Clinical Medicine Biomedical Science,
Chemistry, Physics and, to some extent, Computer Science and Mathematics Methods are
some of the research subject fields investigated by researchers in Erciyes University.
There is collaboration between Materials Science and Biomedical Science. However,
Biomedical Science has not reached its final potential forming a node yet (see the center of
the graph). The statistical results for the overlaid map based on Subject Categories for
Erciyes University are as follows: betweenness of 0.049, degree centrality of 0.256 and
closeness centrality of 0.452 (Fig. 44).
Figure 44. Publications profiles overlaid on the map of science of Erciyes University, 2006-2011

77
In contrast to Dokuz Eylül University’s network structure in 2000-2005 regarding its
research subject areas (Fig. 45), growth in almost all research fields are noticeable. For
example, the tie between Materials Science and Clinical Medicine is stronger, and is
shown by a line. Moreover, we can see a relationship between Mathematics Methods and
Materials Science. The statistical results for the overlaid map based on Subject Categories
for Dokuz Eylül University are as follows: betweenness of 0.060, degree centrality of
0.323, and closeness centrality of 0.322.
Figure 45. Publications profiles overlaid on the map of science of Dokuz Eylül University, 2006-2011

78
Anadolu University appeared with high degree centrality in the second period in network
structure with Biomedical Science, Agricultural Science, Chemistry, Physics,
Environmental Science and Technology, Materials Science and, to some extent,
Geosciences, Computer Science and Mechanical Engineering. Statistical results for the
overlaid map based on Subject Categories for Anadolu University are as follows:
betweenness of 0.042, degree centrality of 0.470 and closeness centrality of 0.379 (Fig.
46).
Figure 46. Publications profiles overlaid on the map of science of Anadolu University, 2006-2011

79
Atatürk University’s publications profiles consist of Clinical Medicine, Chemistry,
Agricultural Science, Environmental Science, Physics, and Materials Science. We see that
there is a tie between Chemistry and Agricultural Science, Mechanical Engineering and
Physics in Atatürk University. Statistical results for the overlaid map based on Subject
Categories for Atatürk University are as follows: betweenness of 0.091, degree centrality
of 0.230 and closeness centrality of 0.316 (Fig 47).
Figure 47. Publications profiles overlaid on the map of science of Atatürk University, 2006-2011

80
Finally, Firat University researchers are active on Infectious Diseases, Biomedical Science,
Chemistry, Environmental Science and Technology, Materials Science and Physics.
Moreover, we see that in the center of the graph there is a relationship between Clinical
Medicine and Materials Science, and, at the bottom right side, between Mathematical
Methods and Materials Science. Statistical results for the overlaid map based on Subject
Categories for Firat University are as follows: betweenness of 0.051, degree centrality of
0.317 and closeness centrality of 0.452 (Fig 48).
Figure 48. Publications profiles overlaid on the map of science of Fırat University, 2006-2011
4.8 SUMMARY OF NANO-RELATED TECHNOLOGY IN SELECTED
UNIVERSITIES
The overlay map for all universities revealed that the Materials Science is a new
trend in research endeavors that is a multidisciplinary research subject that has many
applications in nano-related technology research area. For example, most of nano-related
technologies’ publications are multidisciplinary or interdisciplinary, which indicates that

81
nano-related technology research fields are composed of the basic sciences, explicitly
Mathematics, Physics, Chemistry, and Biology. However, Management and Economics
and Social Studies also have their share in term, of describing nano-related technologies
and its applications to the public at large.
As mentioned earlier, high betweenness centrality indicates flow of information among
sub-clusters while high closeness centrality yields cohesiveness of clusters in a network
structure.
Despite the growth in the network structure in the second period (2006-2011), the overall
density of the network structure is still low. The mean value of betweenness centrality of
selected universities decreased from 0.142 to 0.056. However, the degree and closeness
centrality coefficients rose from 0.295 to 0.446, and from 0.420 to 0.433, respectively. We
infer that network structures in both periods have characteristics of a small-word existence.
In the next section, we review the network structure of co-authorship in both periods. Co-
authorship network structure reveals the authors who may act as “brokers” who facilitate
the flow of information among sub-clusters.
4.9 CO-AUTHORSHIP ANALYSIS OF UNIVERSITIES: 2000-2005 AND 2006-2011
Previously, overlay science maps revealed the profiles of publications of nano-related
technologies in each university with the highest degree centralities. In addition, the maps
below (Fig. 49 and Fig. 50) are blueprints for all universities, which have participated, in
nano-related technology mapped by Gephi.
Network of co-authorship in 2000-2005 consists of clusters with high degree centralities,
which are centered in the middle of the graph. Away from the center, we see several
isolated sub-clusters in the periphery. Yet, some of the sub-clusters are connected through
some precise nodes, which are instrumental in the diffusion of nano-related technology in
the whole network structure (Fig. 49).

82
Figure 49. Co-authorship network of scientists working on nano-related technology: 2005-2011
Figure 50. Co-authorship network of scientists working on nano-related technology: 2006-2011

83
The numbers of nodes and edges rose from 470 and 1042 in 2000-2005 to 945 and 4915 in
2006-2011. The network structure has grown in number of nodes and ties almost two-
folds for the former and four folds for the latter between the two periods, but the level of
collaboration has not changed so much. Although, there is a minimal change in density
(from 0.009 to 0.011) between the two periods, the network is still quite sparse.
Nonetheless, the average degree and clustering coefficients show that clusters within the
network are somehow connected for both periods. For example, the average clustering
coefficient for 2000-2005 is 0.75, indicating that 75% of the nodes are connected.
However, as the network has grown in the second period, the rate of connectedness has
decreased (0.51), indicating that newly formed clusters were not that cohesive in the
second period.
The network in the second period adheres to transitivity relations, indicating that the
network at meso level is well connected, even though the sub-clusters are not that well
connected, especially in the periphery of the network (Fig. 50).
The results indicate that there have been progresses in new sub clusters in the co-
authorship network. However, there are no links among sub clusters, yet. In other words,
almost all scientists have co-authored with one or more other authors in their own cluster.
4.10 CO-AUTHORSHIP ANALYSIS OF SELECTED AUTHORS: 2000-2005 AND
2006-2011
Table 8 below shows the top 15 Turkish authors having the highest centralities (closeness,
betweenness, degree, and PageRank) and their affiliations between 2000 and 2005 who
have contributed to the diffusion of nano-technology in terms of scientific publications in
the last decade. Some scientists appear in more than one centrality lists due to their high
collaboration in the network structure. For example, Yakuphanoğlu has the high centrality:
betweenness centrality (broker & gate keeper), degree centrality (high collaborator), and
PageRank (productive). Co-authorship map of first authors is shown in Fig. 51. Most of the
authors listed in table are also seen in the map. Although most participants are from

84
universities with high degree centralities, we found other authors (Yilgor E and Yilgor I
from Koç, Koralay H from Fırat, Yakuphanoğlu E from Fırat and Kasapoğlu E from
Cumhuriyet Universities) who are instrumental in the diffusion of nano-related technology
in the network structure during 2000-2005 in Turkey, even though their universities did not
have high degree centralities.
Table 8. Network properties of the top 15 Turkish authors based on co-authorship degree centralities:
2000-2005
Rank Closeness Betweenness Degree PageRank
1 Sarı H (Bilkent) Yilmaz F( METU) Balkan N (Fatih) Ovecoğlu MN (ITU)
2 Sökmen I (Dokuz Eylül) Gencer A (Hacettepe) Teke A (Balıkesir) Çelik E (Dokuz Eylül)
3 Kasapoğlu E (Cumhuriyet) Koralay H (Firat) Yağci Y (ITU) Denizli A (Hacettepe)
4 Çiraci S (Bilkent) Okur S (Izmir Inst
Tech)
Yakuphanoğlu F(Firat) Hasçiçek YS (Gazi)
5 Aytor O (Bilkent) Denizli A
(Hacettepe)
Ovecoğlu MN (ITU) Yağci Y (ITU)
6 Biyikli N (METU) Yavuz H (Hacettepe) Çelik E (Dokuz Eylül) Yakuphanoğlu F(Firat)
7 Özbay E (Bilkent) Güneş M (Kirikkale) Yilmaz F (METU) Toppare L (METU)
8 Doğan S (Bilkent) Yakuphanoğlu F
(Firat)
Toppare L (METU) Yilmaz VT (Ondokuz Mayıs)
9 Morkoç H (Atatürk) Balkan N (Fatih) Doğan S (Bilkent) Peşkin E (Hacettepe)
10 Sari B (Gazi ) Çelik E (Dokuz Eylül) Morkoç H (Atatürk) Erkoç Ş (METU)
11 Talu M (Gazi) Pişkin E (Hacettepe) Denizli A (Hacettepe) Kurt A ( Koç)
12 Kartaloğlu (Bilkent) Güven K (Erciyes) Erol A (Istanbul) Elmali A (Ankara)
13 Yilgor E (Koç) Yağci Y (ITU) Özdemir I (Dokuz Eylül) Hincall AA (Hacettepe)
14 Yilgor I (Koç) Ovecoğlu MN (ITU) Turan R ( METU) Ozdemir I (Dokuz Eylül)
15 Andaç O (Ondokuz Mayıs) Menceloğlu YZ
(Sabancı)
Dag O ( Bilkent) Oral A (Sabancı)
Table 9 shows the top 15 authors who are influential in diffusion of nano-related
technology in Turkey in 2006-2011. Interestingly, Büyükgüngör almost has the highest
degree centrality in all categories, except the betweenness centrality. He can be seen in the
center of the graph (Fig. 52). Not only is he a prestigious author, but also he plays an
important role in the dissemination of knowledge, in the network structure. His research
field is Crystallography. However, there are scientists who might do not have high degree
centrality coefficient although they are placed in important positions in the network. For

85
example, Yeşilel Öz from Eskisehir Osmangazi University does not have a high degree
centrality, but his/her position is prestigious in the network structure. Moreover, Fatih
University fails to have the highest degree centrality in neither period; yet, its scientists
play an important role in the diffusion of nanotechnology in the network structure. For
example, Yildiz A. appearance is in degree and betweenness centralities. Bacaksiz E. in
Karadeniz Technical University is another example. Further, we infer that co-authorship
analysis using SNA enables the information scientists to discern nodes, which might be
crucial to the diffusion of nanotechnology or to any other topics.
Figure 51. Co-authorship map of scientists between 2000 and 2005

86
Table 9. Network properties of the top 15 authors based on degree centralities: 2006-2011
Rank Closeness Betweenness Degree Page Rank
1 Büyükgüngör O
(Ondokuz Mayis)
Yilmaz F (METU) Büyükgüngör O (Ondokuz
Mayis)
Büyükgüngör O (Ondokuz
Mayis)
2 Yeşilel ÖZ
(Osmangazi)
Büyükgüngör O (Ondokuz
Mayis)
Şahin E (Gazi) Özbay E (Bilkent)
3 Demir HV (Bilkent) Özçelik S (Gazi) Toppare L (METU) Özçelik S (Gazi)
4 Nizamoğlu S
(Bilkent)
Toppare L (METU) Yilmaz F (METU) Toppare L (METU)
5 Çağlar Y (Anadolu) Yağcı Y (ITU) Özçelik S (Gazi) Denizli A (Hacettepe)
6 İlican S (Anadolu) Şahin E (Gazi) Yağci Y(ITU) Turan R (Ege)
7 Çağlar M (Anadolu) Yildiz A ( Fatih) Özbay E (Bilkent) Şahin E (Gazi)
8 Özbay (Bilkent) Çakmak M (Koç) Turan R (Ege) Çıracı S (Bilkent)
9 Özçelik S (Gazi) Şahin O (Dokuz Eylül) Çakmak M (Kirikkale) Yeşilel ÖZ (Osmangazi)
10 Baykal A (Fatih) Yilmaz M (Istanbul) Yerli A (Sakarya ) Yağci Y (ITU)
11 Köseoğlu Y(Fatih) Turan R (METU) Yildiz A(Fatih) Sökmen I (Dokuz Eylül)
12 Toprak MS (Fatih) Bacaksiz E (Karadeniz) Çetin K (Ege) Arslan H ( Hacettepe)
13 Çiraci S (Bilkent) Denizli A (Hacettepe) Çiraci S (Bilkent) Oskar S (METU)
14 Durgun E (Bilkent) Şen S (Yalova) Denizli A (Hacettepe) Çakmak M (Koç)
15 Akgol S (Adnan
Menderes )
Balkan A( Fatih) Sari H (ITU) Baykal A (Fatih)
Figure 52. Co-authorship map of scientists between 2006 and 2011

87
Although almost all universities hold higher network clustering coefficients indicating that
sub-clusters in the system are embedded and that the small world effect is present in the
network structure. We can categorize the collaboration among scientists who work on nano
related technologies in Turkey in the last decade on three levels following:
Micro Level: Since co-authorship networks of selected universities comprise high
closeness degree centrality coefficients, we can infer that sub-clusters at the micro level are
well embedded. In other words, there is a high probability of any one node collaborating
with another node.
Meso Level: Although clustering coefficients are high in all networks mentioned above,
networks are not dense at all. The overall co-authorship network structure is not as dense
as it is at the micro level.
Macro Level: The number of scientific publications on nanotechnology has increased
from 2664 in 2000-2005 to 7398 in 2006-2011 in Turkey. It has increased in three folds,
which is impressive in a short period. Yet, findings from co-authorship networks of
universities indicate that social networks are not well connected.
4.11 FRACTIONAL COUNTING OF CO-AUTHORSHIP: 2005-2005 AND 2006-
2011
Almost all scientists have collaborated with other scientists and most have participated in
research activities. Interestingly, as the numbers of collaboration increases, the clustering
coefficients do, too, indicating that sub clusters within network are connected which
supports the small-world phenomenon. Table 10 shows the 30 most prolific first authors
appearing in 2000-2005 and 2006-2011 with their co-authors. Bibexcel was used to count
the fractional counting of co-authorship.
Table 10 shows the top thirty prolific authors who appeared between 2000-2005 and 2006-
2011 in nano-related network structure. Interestingly, some authors became less

88
collaborative in 2006-2011 than in 2000-2005. For example, Erkoç dropped from number 1
in 2000-2005 to number 26 in 2006-2011, even though his frequency is still high. Some of
the authors who appeared in the first period became more collaborative in the second
period or appeared for the first time with a high centrality coefficient. Denizli, Yağci and
Toppare for the former and Büyükgüngor for the latter are a few examples to name.
Incidentally, the correlation between frequency and the number of co-authors rose from
0.77 in 2000-2005 to 0.90 in 2006-2011. Moreover, Table 10 shows the overall frequency
and numbers of collaborates of the first frequent authors, and the total number of co-
authors in 2000-2011. We conjecture that due to higher collaboration rate in the second
period stimulates the diffusion of nano-related technology in the network structure.
Researchers who appeared with high centrality coefficient in the networks also co-authored
more with other researchers. For example, Erkoç (METU) has the highest number of co-
authors in 2000-2005 begin an influential person in his cluster. Incidentally, he appears 7th
in the 2000-2011 networks. Exceptionally, Büyükgüngör who did not appear in the first
period turns out to be the person to be collaborated with in the second period. He has
collaborated with more authors, which makes Crystallography an important subject field in
nano-related technology development.

89
Table 10. Highly prolific scholars in nano-related technology: 2000-2005 and 2006-2011
Source: WoS (as of November 2013) 2000-20005 2006-2011
Freq First author & Affiliation # of
co- authors Freq First author & Affiliation
# of co-authors
Total # of co-
authors 53 Erkoc S (METU) 29 149 Buyukgungor O (Ondokuz Mayıs)
ayısısO(Ondokuz Mayis)
37 66
49 Sokmen I (Dokuz Eylül) 16 78 Yagci Y (ITU) 19 35
42 Ciraci S (Bilkent) 13 75 Denizli A(Hacettepe) 18 31
39 Denizli A (Hacettepe) 12 72 Yakuphanoglu F (Firat) 28 40
38 Yagci Y (ITU) 10 67 Ozkar S (METU) 23 33
37 Celik E (Bilkent) 11 67 Toppare L (METU) 15 26
37 Sari H (Bilkent) 11 64 Ozbay E (Bilkent) 13 24
36 Turker L (METU) 28 62 Yesilel OZ (Eskisehir Osmangazi) 17 45
30 Yilmaz VT (Dokuz Eylül) 8 61 Sokmen I (Dokuz Eylül) 17 25
30 Toppare L (METU) 7 58 Ozcelik S (Gazi ) 12 19
29 Hascicek YS (Gazi) 8 52 Demir HV (Bilkent) 13 21
28 Ovecoglu ML (ITU) 7 49 Baykal A (Bilkent) 10 17
27 Elmali A (Ankara) 8 45 Turan R (METU) 10 18
26 Elerman Y (Ankara) 8 44 Sahin E (Bilkent) 11 19
26 Piskin E (Hacettepe) 8 44 Yilmaz VT (Dokuz Eylül) 13 21
26 Kasapoglu E (Cumhuriyet) 8 43 Caykara T (Gazi ) 15 23
26 Balkan N (Bilkent) 5 41 Sari H (Ankara) 9 14
22 Yilmaz F (METU) 6 40 Ciraci S (Bilkent) 12 18
22 Turan S ( Marmara) 8 39 Kasapoglu E (Cumhuriyet) 12 20
22 Ozbay E (Bilkent) 5 39 Albayrak C (Ondokuz Mayıs) 11 16
20 Yildirim T (Penn Univ) 5 39 Bozkurt A (Fatih) 12 17
19 Dag S (California) 5 38 Gasanly NM (METU) 23 28
19 Ozturk E (Gülhane Mil) 7 38 Yildiz A (Ahi Evran) 9 16
19 Oral A (Çanakkale Onsekiz Mart )
MArtMartMart
4 38 Sen S (Yalova) 12 16
19 Kara A (Florida State) 7 37 Caglar M (Firat ) 10 17
18 Ozdemir I (Dokuz Eylül) 4 36 Erkoc S (METU) 17 21
17 Suzer S (Bilkent Univ) 6 35 Ahsen V (Gebze Inst Tech) 7 13
17 Sarac AS (ITU) 5 35 Ilican S (Anadolu Univ) 9 14
17 Tanatar B (Bilkent ) 7 35 Caglar Y (Anadolu Univ) 9 16
17 Erkoc F (METU) 7 39 Bozkurt A (Yildiz) Technical) 12 19
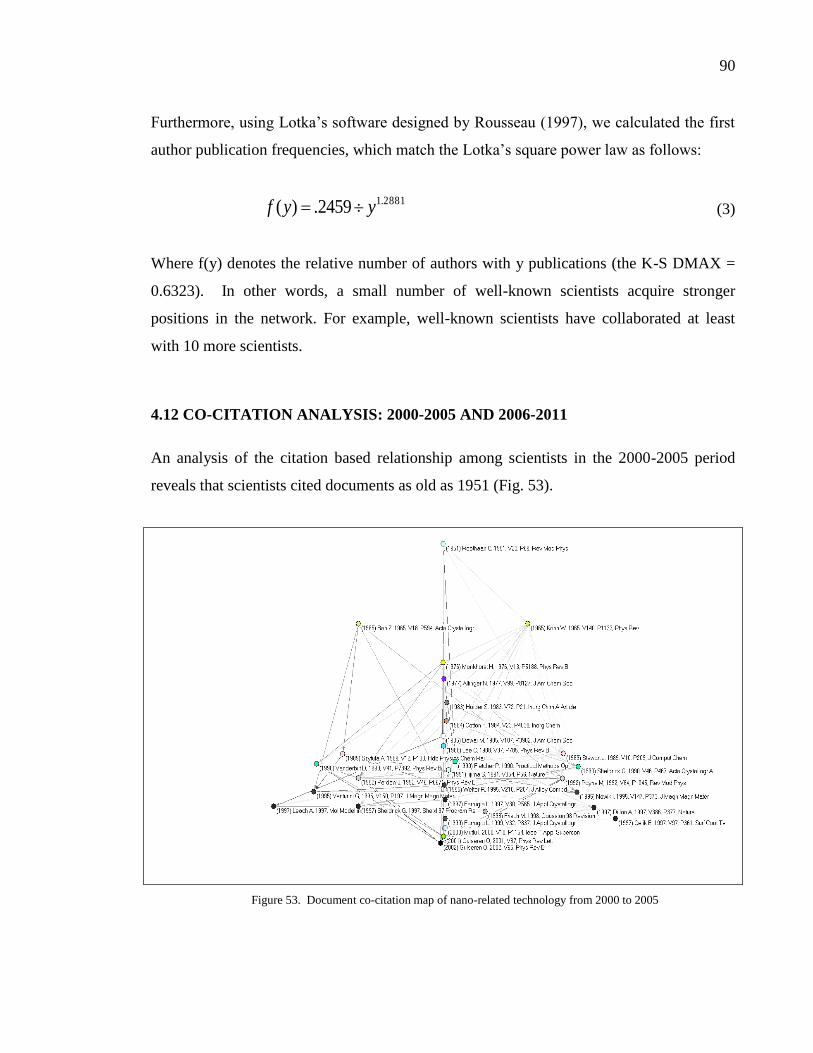
90
Furthermore, using Lotka’s software designed by Rousseau (1997), we calculated the first
author publication frequencies, which match the Lotka’s square power law as follows:
2881.12459.)( yyf (3)
Where f(y) denotes the relative number of authors with y publications (the K-S DMAX =
0.6323). In other words, a small number of well-known scientists acquire stronger
positions in the network. For example, well-known scientists have collaborated at least
with 10 more scientists.
4.12 CO-CITATION ANALYSIS: 2000-2005 AND 2006-2011
An analysis of the citation based relationship among scientists in the 2000-2005 period
reveals that scientists cited documents as old as 1951 (Fig. 53).
Figure 53. Document co-citation map of nano-related technology from 2000 to 2005

91
Table 11 and 12 summarize the document co-citation of Turkish scientists based on WoS
data. Scientists are mostly from Bilkent University, who participated in research among
each other. It is noticeable that scientists frequently publish in high impact factor journals
such as Physical Rev B. Gülseren’s papers are the most co-cited ones in the first period
(Table 11). Similarly, Demir and Nizamoğlu of Bilkent University are the authors of the
most co-cited papers in the 2006-2011 period (Table 12). Data from Scopus database also
shows that papers by scientists in Bilkent University are more visible in international
arena. Demir, Özbay, Gülseren and Aydin have been co-cited more often while Özbay
appears three times in the network (Fig. 54). Özbay collaborates with local and
international scientists extensively, which contributes positively to his positional and
relational standpoints in the network effectively. We can infer that even though Turkish
articles are not the most cited documents in nano-related technology, their presence in the
2006-2011 period is an indication of the diffusion of nano-technology in Turkey.
Table 11. The most co-cited papers in nano-related technology in Turkey, 2000-2005
# of co-
cocitations
Co-cited document
29 Gulseren O, 2002, V65, Phys Rev B Perdew J, 1992, V46, P6671, Phys Rev B
27 Gulseren O, 2001, V87, Phys Rev Lett Gulseren O, 2002, V65, Phys Rev B
24 Gulseren O, 2002, V65, Phys Rev B Payne M, 1992, V64, P1045, Rev Mod Phys
22 Szytula A, 1989, V12, P133, Hdb Physics
Chem Rar
Venturini G, 1995, V150, P197, J Magn Magn Mater
20 Gulseren O, 2002, V65, Phys Rev B Vanderbilt D, 1990, V41, P7892, Phys Rev B
20 Fletcher P, 1990, Practical Methods Op Roothaan C, 1951, V23, P69, Rev Mod Phys
19 Dewar M, 1985, V107, P3902, J Am Chem
Soc
Leach A, 1997, Mol Modelling
Table 12. The most co-cited papers in nano-related technology in Turkey, 2006-2011
# of co-citations Co-cited document 22 Nizamoglu S; Demir HV Nizamoglu S; Ozel T; Sari E; Demir HV
13 Demirbas A Saidur R; Lai YK
10 Nizamoglu S; Ozel T; Sari E; Demir HV Schubert EF
9 Aydin K; Ozbay E Veselago VG
10 Nizamoglu S; Ozel T; Sari E; Demir HV Schubert EF
4 Aydin K; Ozbay E Pendry JB
1 Caglayan H; Bulu I; Ozbay E Shelby RA; Smith DR; Schultz S

92
Figure 54. Document co-citation map of nano-related technology from 2006 to 2011
4.13 JOURNALS CO-CITATION ANALYSIS: 2000-2005 AND 2006-2011
Journal-to-journal citation relations illustrate knowledge diffusion among disciplines and
their developments. Four main clusters appear in the social network structure in four
different colors: red, green, blue and yellow (Fig. 55). The journal co-citation map reveals
the leading journals: Phys Rev B (red), Journal of American Chemistry Society (yellow),
Polymer (light blue), Biomaterials (green) and the list goes on. We can infer that
Chemistry, Polymer Science, Biomaterials and their derivatives are leading research areas
for scientists in 2000-2005 with a density of 0.205 and clustering coefficient of 0.289.
More journals are included in the network structure in 2006-2011. Fig. 56 shows scientists
published in nano-related subject fields, which indicate the diffusion of nanotechnology in
the multidisciplinary research area in Turkey. The network of journals in the second period
has expanded, encompassing more journals between 2006 and 2011 with a density of 0.160
and clustering coefficient of 0.570. Although the density has decreased, the clustering
coefficient has increased which endorses the small-world model.

93
Figure 55. Journal co-citation in nano-related technology articles in Turkey between 2000-2005
Figurre 56. Journal co-citation in nano-related technology articles in Turkey between 2006 and 2011

94
4.14 CO-WORD ANALYSIS: 2000-2005 AND 2006-2011
In Chapter 2, we discussed how the latent semantic analysis of the words in vector space
reveals the meaning of “communication” in a network structure of a scientific domain. A
factor analysis was conducted on the words that appear in the titles of records extracted
from WoS. The most frequently used words in the title of the records between 2000 and
2005 were gathered together. The most frequently occurring 75 words in the title of the
nano-related technology articles between 2000 and 2005 were collected, processed and
compiled by the software.13
Non-trivial words were eliminated. Then, in order to analyze
the word/document occurrence matrix in terms of its latent structure, SPSS software
version 16.0 was used to factor analyze the co-occurrence of words. Factor analysis creates
a different component for each word. SPSS created two factors from the list of the co-
words. Table 13 shows the output of two factors for 2000-2005 and loading of different
words in each component (see Appendix E for the list of all words in nano-related
technology between 2000 and 2005).
Table 13. Factor analysis of co-words in the titles of nano-related articles produced in Turkey between 2000
and 2005
Extraction Method: Principal Component Analysis.
The first factor explains 56% of variance in the entire data while the second explains the
rest of the variance. Visualization is based on Kamada & Kawai embedded in Pajek. Each
component is formed of a color representing a factor, for example, pink and green.
13
Software at http://www.leydesdorff.net/software/fulltext/index.htm was used to create a normalized
cosine symmetric co-occurrence matrix of labels.
Words 1 Words 2
CHEMICAL .999 PLASMA .999
QUANTUM .999 TREATMENT .999
STEEL .998 CONDUCTING .990
HYDROGEN .997 CERAMIC .982
COPOLYMER .992 SOL-GEL .982
FIELD .992 LAYER .945
PROPERTIES .984 OPTICAL .945
ELECTRICAL .973 SURFACE .945

95
Table 14. Eigenvalues of the top two factors from 2000-2005
Factor Eigenvalue Percent of variance Cumulative Percent
1 41.8 56.4 56.4
2 32.2 43.5 100.0
In Figure 57, Table 14, factor 1 and factor 2 show that scientists mostly work on Material
Science and its derivatives: Physics and Chemistry. Network structure is made of almost
two evenly distributed partitions, green in the bottom left side and pink in up right side.
After sharing the result with professors in Material Science Department at Çankaya
University, they are certain that words “Quantum” and “Optics” in Physics whereas
“Crystal” and “Sol-Gel” are used in Chemistry.
Figure 57. Nodes are colored according to factor solution of this network: 2000-2005
Similarly, a factor analysis was done on words in the abstract of articles to see the
topological development in 2006-2011. To be consistent with the previous map, we also
utilized about 75 frequently co-occurred words. However, we noticed the new words used
in 2006-2011 indicating that scientists’ works have taken a new horizon. Three factors
were extracted from the co-occurrence network of words. Table 15 shows several words,

96
which are loaded on three factors identified by factor analysis (see Appendix F for the
complete list of words used in nano-related technology between 2006 and 2011).
Table 15. Factor analysis of co-words in the titles of nano-related articles produced in Turkey: 2006-2011
Extraction Method: Principal Component Analysis.
Table 16 shows the first factor explains 35% of the variance in the entire data while the
second explains 33% and the third explains 32% of the variance. Visualization is based on
Kamada & Kawai embedded in Pajek. Each component is shaped after a color representing
a factor, for example, pink, green and blue.
Table 16. Eigenvalues of the top three factors from 2006-2011
Factor Eigenvalue Percent of Variance Cumulative Percent
1 24.402 34.8 34.8
2 22.891 32.7 67.5
3 22.316 31.8 99.4
Fig. 58 graphically depicts the network made of three factors: (1) Pink, which occupies
most of the network, (2) Green in the right side with a fewer nodes and (3) finally, the blue
one that located on the left hand side in the periphery. We categorize the topological
development mainly in three components. The green one (“Doped”, “Alloy”, and
“Plasma”) represents research fields in Surface Material. The pink one (“Coating”,
“Crystal” and “Catalyst”) represents research fields in Chemistry and its sub-fields. The
blue one (“Quantum”, “Dot” and “Nanotube”) represents research fields in Physics.
Words 1 Words 2 Words 3 COPOLYMER .766 STEEL .673 DOT .687
COMPLEXES .697 WELL .655 MORPHOLOGY .676
CRYSTAL .674 AQUEOU .651 ADSORPTION .654
THERMAL .653 ZNO .642 ENERGY .644
SPECTROSCOPIC .650 PARTICLE .626 PREPARED .641
CHARACTERISTIC .643 MATERIAL .625 QUANTUM .620
COPOLYMER .766 TEMPERATURE .620 ELECTRICAL .619
METAL .636 CELL .618 MODIFIED .610
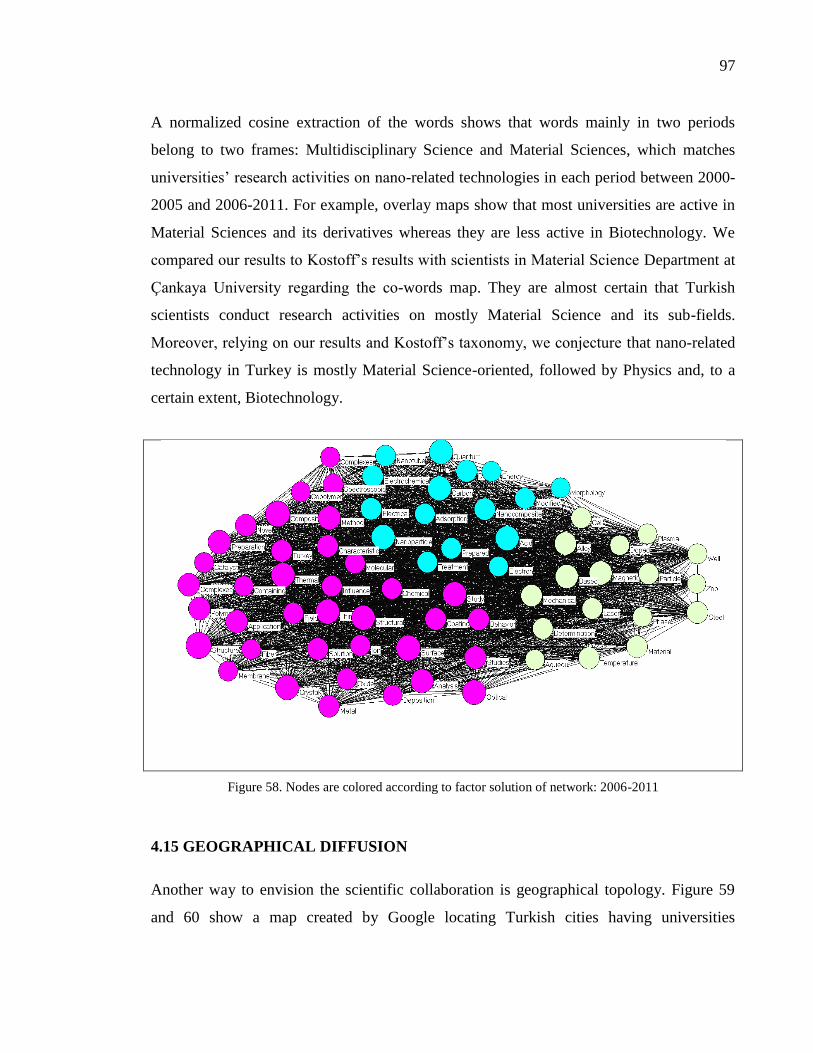
97
A normalized cosine extraction of the words shows that words mainly in two periods
belong to two frames: Multidisciplinary Science and Material Sciences, which matches
universities’ research activities on nano-related technologies in each period between 2000-
2005 and 2006-2011. For example, overlay maps show that most universities are active in
Material Sciences and its derivatives whereas they are less active in Biotechnology. We
compared our results to Kostoff’s results with scientists in Material Science Department at
Çankaya University regarding the co-words map. They are almost certain that Turkish
scientists conduct research activities on mostly Material Science and its sub-fields.
Moreover, relying on our results and Kostoff’s taxonomy, we conjecture that nano-related
technology in Turkey is mostly Material Science-oriented, followed by Physics and, to a
certain extent, Biotechnology.
Figure 58. Nodes are colored according to factor solution of network: 2006-2011
4.15 GEOGRAPHICAL DIFFUSION
Another way to envision the scientific collaboration is geographical topology. Figure 59
and 60 show a map created by Google locating Turkish cities having universities

98
publishing papers on nanoscience and nanotechnology. Number of cities have increased
from 2000-2005 to 2006-201. Almost the number of the cities has doubled. Several
universities in Turkey to have participated in nano-related technology projects or have
published an article on nanoscience and nanotechnology. Number of cities has increased in
which nano-related technology related especially in eastern part of Turkey.
Figure 59. Geographical distribution of nano-related research activities of cities in Turkey, 2000-2005
Figure 60. Geographical distribution of nano-related research activities of cities in Turkey, 2006-2011
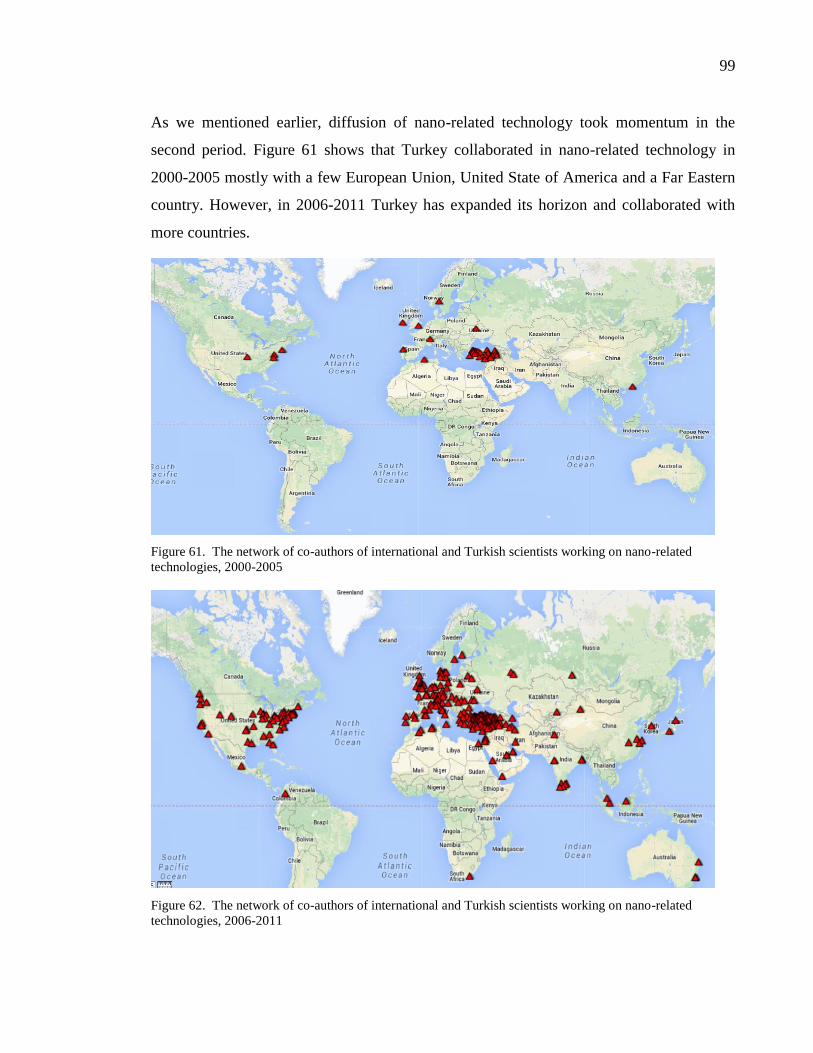
99
As we mentioned earlier, diffusion of nano-related technology took momentum in the
second period. Figure 61 shows that Turkey collaborated in nano-related technology in
2000-2005 mostly with a few European Union, United State of America and a Far Eastern
country. However, in 2006-2011 Turkey has expanded its horizon and collaborated with
more countries.
Figure 61. The network of co-authors of international and Turkish scientists working on nano-related
technologies, 2000-2005
Figure 62. The network of co-authors of international and Turkish scientists working on nano-related
technologies, 2006-2011

100
One of the reasons, which make Turkish scientists collaborate with the European Union
countries and the United States, is that their articles are published in well-known journals.
Another reason is funding. The European Union and United States tend to invest in nano-
related technologies, which create big opportunities as joint projects that draw
collaborators from Turkey. Figure 62 illustrates that Turkey also collaborates with South
Africa, a South American Country, India, Australia, to some extent with several Middle
Eastern and North African countries.
The network density of network structure in 2000-2005 rose from 0.014 to 0.018 in 2006-
2011 indicating the growth in the Turkish scientists’ community internationally.
4.16 ETHNOGRAPHIC INTERVIEWS: RESULTS AND ELABORATIONS
Formal interviews were conducted with 10 interviewees composing of 5 senior and 5
junior scientists. A form regarding interviewees’ consent is found in Appendix B. One of
the advantages of a formal interview is that the questions define certain goals and specific
outcomes. For example, junior interviewees were asked to answer specific structured
questions regarding their educational background, their supervisors or the topics about
which they are conducting research, whereas senior faculty were just interviewed and
informed of co-authorship maps. The first part of the interview consists of an informal
conversation followed by the interviewee’s specific response on the co-authorship graph.
The interviewees were selected from METU, Bilkent, Hacettepe, Sabancı, TOBB-ETU and
Çankaya Universities. A full ethnographic structured and semi-structured interview scripts
can be found in Appendices C and D, respectively.

101
4.17 ETHNOGRAPHIC ELABORATION OF THE CO-AUTHORSHIP MAPS
We asked the researchers about their opinion regarding co-authorship maps. Each
researcher was shown his or her co-authorship map. Following statements are their verbal
responses to the co-authorship maps compiled by the researcher.
Prof. A, a senior scientist from the Middle East Technical University (METU)
Physics Department, was interviewed. He published his first scientific article in 1977. His
research area is theoretical physics and he utilizes computers as research tools for
simulation techniques. Prof. A. is the founder of the graduate level Nanotechnology
program at METU. Prof. A. has supervised several PhD students from different
universities in Turkey (for example, Gazi and Fırat Universities). Moreover, he
participates in programs in which students from other universities (i.e., Anatolian
Universities) are trained for their PhD degrees. It is therefore not surprising that he and his
co-authors compose a dense cluster in the social network structure. For his research
purposes, he uses a cluster of computers at ULAKBİM remotely. As a research scientist,
financial support is one of the factors for scientific endeavors. However, it has never been
a constraint for him. In other words, his group has had access to financial support from
TÜBİTAK, international organizations or from METU itself. His response to the map was
somewhat casual since his co-authors are mostly PhD students conducting research
activities at local or international universities.
Associate Prof. B. is originally from the United States of America. She states that
there are talented people in Turkey, and, therefore, they are able to publish scientific
articles. Prof. B states that in order to commercialize nano-related technologies in Turkey,
the need for nanotechnologies must be identified. Her response to the map was that
whoever initiates an article initially, her/his name ought to appear first in the publication -
hence her name does not appear as a hub in the network cluster.
Assistant Prof. C. from the Metallurgy Department at the Middle East Technical
University was concerned about the procurement of materials in Turkey. He complained

102
that it is easier to obtain materials from abroad. In his opinion, financial support is as
important as trained staff in the laboratory. His response to the map was such that
academic promotion ought to be based on publications, especially single-authored ones.
Assistant Prof. D. of the Bio-Engineering Department from TOBB-ETU University
has recently returned from the USA. He is new here but has already secured several
research projects from TÜBİTAK. In his opinion, it is too early to assess the diffusion of
nano-related technologies in Turkey since nanotechnology is new in Turkey. His response
to the map was vague in that his name appearing in the network was deemed adequate for
him.
Prof. F. is from UNAM (National Nanotechnology Research Center). He is in
charge of UMRAM (National Magnetic Resonance Imaging Research Center), which is
regarded as a highly important research institute at Bilkent University. His team is carrying
out cutting-edge research that no other research institute is. This creates leverage and
advantage when applying for different projects locally and abroad. They mostly work on
nano-related projects in collaboration with European and North American universities. For
example, their projects have been supported by NIH (National Institute of Health in the
United States), European Commission (FP7), TÜBİTAK and the Ministry of Development.
Regarding finance, Prof. F. emphasized that funding plays an important role in research.
However, if a research group is formed properly, “finding funds is trivial”. For example, to
publish scientific articles for his team is trivial, since the financial return on investments
for his research team is substantial. In terms of collaboration with other universities in
Turkey, he agreed that their cluster is isolated. That is, they prefer to work within their own
sphere. In order to disseminate their knowledge more actively to other universities, their
institutes have recently and eagerly been recruiting students for Master’s, PhD and post-
doctoral programs from other universities in Turkey. They also lease out their equipment in
laboratories on an hourly basis to students from other universities. His response to the map
was that in order to be cooperative, they need to interact with other scientific communities.

103
Prof. G. from Hacettepe University’s Chemistry Department was aware of the
content of our conversation since one of his PhD students had brought up my paper
“Diffusion of nanotechnology in Turkey: a social network analysis” (Darvish, 2011). Prof.
G. was surprised how his name appeared with students who recently started their PhD
programs in the Department. He constantly informed me about his team and research. To
my observation, his collaborative attitude has made him to be a star in the whole network
structure. He is not only the Head of the Biochemistry Research Group but also was the
Head of the Faculty of Science Program at Hacettepe University at that time. Therefore, he
shared several statistical facts about Hacettepe University regarding its output rates in
terms of students’ graduations. Prof. G. works with 20 PhD students actively. This year
Hacettepe University held a national conference on nanoscience and nanotechnology. Prof.
G. published his first scientific article in 1984. His PhD adviser is still at Hacettepe
University. Although he finished his PhD studies in 1984, he still keeps in contact with his
PhD advisor, and occasionally co-operates with him in scientific publications. They have a
direct link between the nodes which represent them in social network. Prof. G. was not
certain that financial support provided by TÜBİTAK reaches the right place. He, however,
argued that financial support has motivated many scientists to publish more research
articles. Finally, he stated that money spent on research and development is unsatisfactory
compared with that in other OECD countries. He also shared the relevant statistical data
with me to support his claim(s). He added that Turkey’s financial contribution is not
commensurate with its scientific outputs. Prof. G. mentioned that nano-related
technologies are expensive and finance plays an important role in production output. His
response was that there is an open door policy to collaborate with other scientists locally to
the extent that his location in the network is pivotal.
We interviewed Prof. H., a senior at the Engineering Chemistry Department of
Hacettepe University, who was not as informative as the previous interviewee. He was
reluctant to express his response on the map. His concern generally focused on the
diffusion of education in Turkey.

104
Prof. I. from the Chemistry Department of the same University was more
informative. Prof. I. published his first paper in 1974. According to him, Istanbul Technical
University was the first to motivate his staff financially in order to publish scientific
articles. Since then, scientific publication trends have become more fashionable. He argued
that since faculty members spend a great amount of time teaching undergraduate courses,
the quality of research decreases. For example, in terms of number of patents and scientific
publications, UNAM and NANOTAM (research institutes) are more productive, since
most researchers spend most of their time exclusively on research. Finally, his response to
the graph was that, since he participates in publications which were initiated by other
researchers mostly, his name does not appear as much as other researchers do in the map.
We interviewed Assistant Prof. J. from the Metallurgy Department at Çankaya
University. Although new in the Department, she has published scientific articles. Her
response to the graph was that she wishes to have a collaborative cluster in the near future.
On the other hand, she stated that she is in the network structure even though on the edge
of the network where she has collaborated with a few authors.
In summary, every interviewee responded differently to the map. There is no consistency
in their responses. Every interviewee seems to have perceived the image according to the
structure in which the interviewee was situated. For example, if a cluster is connected and
dense, the applicant’s response is more informative. However, this is not always the case
as one of the applicants is placed as pivotal point.
We discussed earlier that knowledge can be presented in terms of a discourse. Moreover,
discourse is presented as a message that facilitates the flow of information in a society. A
more qualitative approach is applied to applicants’ responses. An online survey was
conducted using the Google Docs website. Participants: five junior scientists from Sabanci,
METU, Bilkent, TOBB-ETU and Çankaya universities were asked to answer several semi-
structured open-ended questions (see Appendix D). After interviews, they were shown the
co-authorship map of their own university. Then, answers were compared with each other
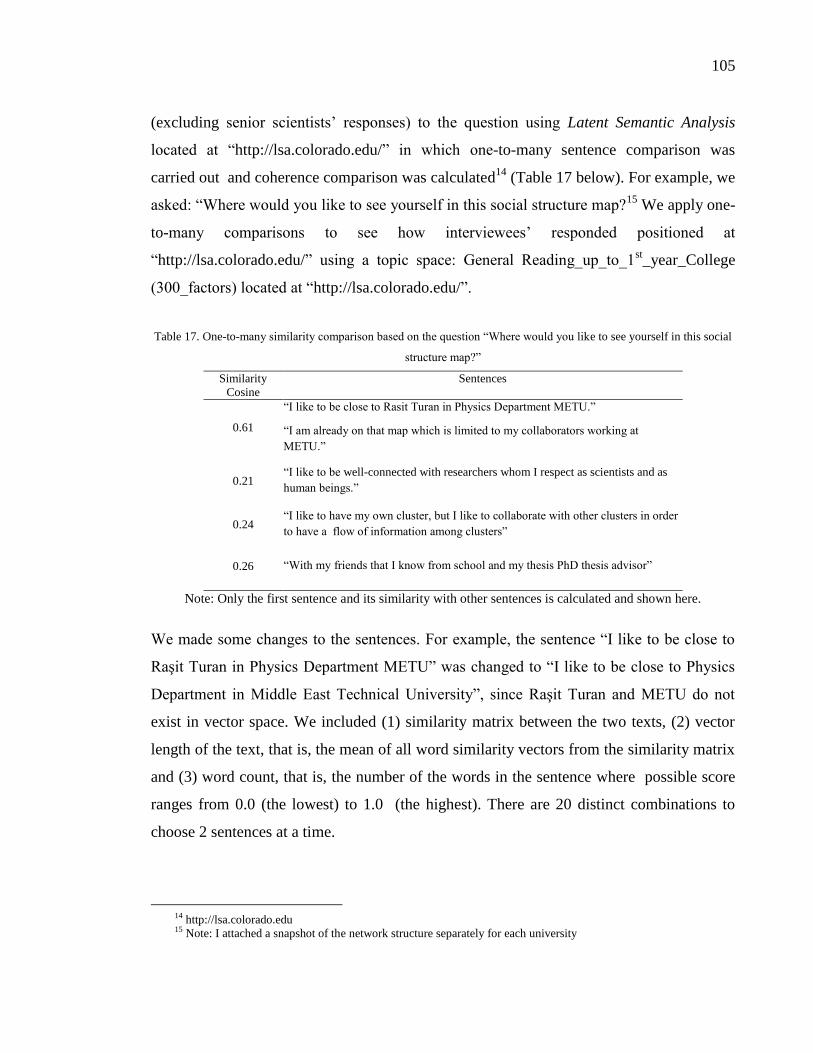
105
(excluding senior scientists’ responses) to the question using Latent Semantic Analysis
located at “http://lsa.colorado.edu/” in which one-to-many sentence comparison was
carried out and coherence comparison was calculated14
(Table 17 below). For example, we
asked: “Where would you like to see yourself in this social structure map?15
We apply one-
to-many comparisons to see how interviewees’ responded positioned at
“http://lsa.colorado.edu/” using a topic space: General Reading_up_to_1st_year_College
(300_factors) located at “http://lsa.colorado.edu/”.
Table 17. One-to-many similarity comparison based on the question “Where would you like to see yourself in this social
structure map?”
Similarity
Cosine
Sentences
0.61
“I like to be close to Rasit Turan in Physics Department METU.”
“I am already on that map which is limited to my collaborators working at
METU.”
0.21 “I like to be well-connected with researchers whom I respect as scientists and as
human beings.”
0.24 “I like to have my own cluster, but I like to collaborate with other clusters in order
to have a flow of information among clusters”
0.26 “With my friends that I know from school and my thesis PhD thesis advisor”
Note: Only the first sentence and its similarity with other sentences is calculated and shown here.
We made some changes to the sentences. For example, the sentence “I like to be close to
Raşit Turan in Physics Department METU” was changed to “I like to be close to Physics
Department in Middle East Technical University”, since Raşit Turan and METU do not
exist in vector space. We included (1) similarity matrix between the two texts, (2) vector
length of the text, that is, the mean of all word similarity vectors from the similarity matrix
and (3) word count, that is, the number of the words in the sentence where possible score
ranges from 0.0 (the lowest) to 1.0 (the highest). There are 20 distinct combinations to
choose 2 sentences at a time.
14 http://lsa.colorado.edu 15 Note: I attached a snapshot of the network structure separately for each university

106
(4)
The mean of all observations resulted roughly in 0.31, which may be interpreted as 31% of
similarity among sentences occurred without redundancy in a vector space. We also
applied pairwise comparison to answer the question: “With whom do you usually
collaborate in scientific activities? And why?” (Table 18). Informants were informed about
our research and had seen the co-authorship map network who work on nano-related
technology in Turkey.
The mean of the sentence-to-sentence pairwise similarity is 0.35, which is slightly higher
than that from previous sentences. We also re-arranged the list and the results were the
same. Furthermore, a regression analysis on three variables resulted in a positive
correlation. We can conjecture that there is a similarity of sentence-to-sentence within a
vector space.
Table 18. One-to-many similarity comparison based on the question “With whom do you usually collaborate in
scientific activities? And why?”
Similarity
Cosine Sentences
0.41 “Colleagues who work on related areas.”
“With my friends that I know from school and my thesis PhD thesis advisor.”
0.21 “I prefer ones having strong theoretical background rather than experimental groups”
0.21
“I prefer to collaborate with friends in the field, both domestic and international, Trust is essential
and supersede expertise in importance. This also comes from colleagues with similar work habits
and expectations on the right way to conduct scientific research. For example, authorship in
manuscripts is a minefield and can easily give rise to misunderstandings.”
0.35 “Nanotechnology and materials science are both collaborative subjects. Therefore, one needs to
collaborate.”
Note: Only the first sentence and its similarity with other sentences is calculated and shown here.

107
4.18 SUMMARY OF THE FINDINGS
In chapter 4, we discovered that Turkish Government has been investing heavily on nano-
related technology since 2005, and has included nanotechnology as its national
development plan. In order to shed light on diffusion of the nano-related technology in
Turkey, we downloaded records using a compound query from WoS in two periods: 2000-
2005 and 2006-2011, and then we applied SNA methods, co-citation analysis and co-words
analysis to map and investigate the relational properties and cognitive development of
nano-related technology.
We selected the top 15 universities with highest co-occurrences in terms of centrality in
each period: 2000-2005 and 2006-2011, and then we calculated their network properties,
degree centralities and PageRank coefficient using Gephi. Furthermore, we overlaid the
map of profile publications for selected universities according to WoS categories on
science map of two periods: 2000-2005 and 2006-2011, and then mapped the scientists
who were instrumental in diffusion of nano-related technology in Turkey. Similarly, we
applied co-word, and later on, factor analysis on selected topic abstracts of scientific
articles published in periods 2000-2005 and 2006-2011 to investigate, and to map of the
cognitive development of nano-technology in Turkey. We provided the author co-citation
analysis. Last but not least, the Latent Semantic Analysis was applied on sentences
compiled form informants in order to quantify their responses.
4.19 COMPARISON OF FINDINGS WITH RELEVANT STUDIES
Özel (2010) studied and mapped the knowledge diffusion among scientists in the subject
field of “Business Management” throughout 1923-2008. He emphasized that his
exemplary case enabled him to elaborate on the socio-political, economical and historical
facts, which have had an impact on a scientist’s collaboration in terms of scholarly
publications. He argued that citation analysis lacks data on interpersonal communication or
relationships among scientists. However, it can be discussed by co-authorship analysis. In
this thesis, as mentioned earlier, the co-citation analysis can be supplemented by co-
authorship analysis. Therefore, we did not investigate co-citation analysis in detail.
108
However, co-citation analysis was used to some extent in terms of Turkish scientist,
collaboration in periods 2000-2005 and 2006-2011. Moreover, Özel extensively applied
co-word and co-authorship methods to map the trends and properties of network structure
while he did not elaborate why scientists collaborate. In this thesis, we applied
ethnographic methods to shed light on the preceding question. We applied Latent Semantic
Analysis technique to measure the words latency in the document. Hence, we shed light on
scientists’ attitudes who conduct research on nano-related technology toward collaborative
work in Turkey.
In this endeavor, research questions pertinent to some of the Zuccala's (2004) study on
Singularity theory: (1) what are the topics that comprise the intellectual structure of
Singularity Theory research? (2) What is the co-authorship structure of Singularity Theory
research and how does it relate to the intellectual structure of this subject? Although she
interviewed scientists who work on Singularity theory as a qualitative method, in this
dissertation we attempted to quantify the interview results by using Latent Semantic
Analysis to investigate the researchers’ collaborative behavior in the network structure.
In another exemplary case, Milosevic (2009) studied the development of nanotechnology
and nanoscience over a 35 year period (1970-2004) using Nano Bank database in the
United State of America. She approached the problem by investigating the following
questions; to name just two, (1) what are the social network properties of
nanoscience/nanotechnology? (2) What are the trends in journals publishing
nanoscience/nanotechnology related research? In this research endeavor, we also applied
the relevant questions. In addition, we measured to some extent, the scientist’s behavior by
utilizing Latent Semantic Analysis technique.
In the context of ethnographic methods, Leleu et al. (2011) applied LSA to open-ended
responses collected from the Millennium Coherent Study participants composed in 2001-
2006 to explore substantial health concerns that may not have been covered by the
structured survey. They were able to extract the significant meaning of their responses, and
then draw words that they then grouped, in a cluster to be categorized to an area of concern

109
to be studied further. As mentioned earlier in this study, we attempted to apply LSA
technique on semi-structured questions in order to find, to some extent, the scientists’
similarity behavior in terms of collaboration in a scientific area.
William (2012) used the Latent Semantic Analysis software located at
(http://lsa.colorado.edu), in order to apply one-to-many comparison on the text. He utilized
the "General_Reading_up_to_1st_year_college" corpus of which is relevant to the method
used in this dissertation in the ethnographic analysis section.
At the national (macro) level, Aydoğan-Duda (2012b) gathered a group of authors who
discussed the emergence of nanotechnology in developing countries explicitly, Turkey,
Latin America, India, China, and Iran. Moreover, case studies from each country attempt to
show the importance of nanotechnology has on his/her country national development plan.
Hence, they have explained the importance of knowledge diffusion of nano-related
technology from academia to the main stream of society, more importantly, its
commercialization.

CHAPTER 5
CONCLUSION
5.1 SUMMARY
The hypothesis of this research was the statement that facilitating the diffusion of
nano-related technology in the scientific community was effected by interaction among
scientists in research projects, and researchers’ attitudes toward collaborative works, which
create substantive bonds between them. We applied a compound text query to extract
records from WoS in nano-related technology from 2000-2005 and 2006-2011 in Turkey.
First, we used Rogers’ theory of diffusion of an innovation where channel of
communication is accepted as co-authorships among scientists locally and internationally.
Second, to test the first hypothesis we examined the “small world” phenomenon within the
social network structure of scientific field and its attributes in namely two periods: 2000-
2005 and 2006-2011. Third, we measured and contrasted network properties of each period
in terms of their degree centralities (betweenness, degree, closeness and PageRank). In
addition, we applied co-word analysis and factor analysis to track scientific trends in nano-
related technology between 2000-2005 and 2006-2011 in Turkey. Finally, using Latent
Semantic Analysis method, we asserted the hypothesis that scientists whose behavior
towards collaboration is almost similar in the social network are inclined to have stronger
positions in the network structure.
Rogers’ model of the diffusion process was used to conceptualize the procedure in terms of
the co-authorship of scientists who work on nano-related technologies. Furthermore, we
overlaid the top 15 universities’ map, which have the highest degree centralities in the
network structure on science map using Web of Science categories to shed light on
scientific subject fields, which are instrumental in the diffusion of nanotechnology in
Turkey. We conducted ethnographic interviews: 5 senior and 5 junior

111
scientists whose activities on nano-related technologies were reflected on co-authorship
maps. We recognized the prominent scientists in the co-authorship network structure who
are instrumental in nano-related technology in Turkey. Furthermore, by utilizing journal-
to-journal citation and co-citation analysis, we have identified those knowledge domains
in which scientists have participated.
5.2 CONCLUSIONS
The first research question was: “What are the key areas of nanotechnology in Turkey, for
example, metallurgical, pharmaceuticals, medical devices, high technical industry, and so
on?” We approached this question by analyzing the bibliometric data from WoS, and then,
we overlaid 15 universities’ research activities maps using WoS subject categories on the
map of science. The overlaid maps show each university’s publication of nano-related
technologies in each subject category. Even universities with low degree centrality
published in multidisciplinary subjects involving nano-related technologies. Then, co-word
and factor analysis was applied to words that appeared in the title of articles in each
period: 2000-2005 and 2006-2011. Results showed that nanotechnology/nanoscience is a
trans-, inter-disciplinary research field dealing with Materials Science, Physics, Chemistry
and Biology, among others. We can infer that Materials Science and its subfields and to a
lesser extent, Medical Sciences are key areas of nanotechnology. Crystallography is also an
important subject field in nano-related technology in Turkey.
The second question was that: “Do co-authorship social network structures exhibit small-
world network structure? We approached this question by assessing social organization
(relationships) among scholars who collaborate with each other in developing scientific
outputs in terms of scientific articles. Results indicate that co-authorship network of
scientists comprises small world properties in that the network structure is composed of
well-connected nodes, although the overall connectedness of the network structures is low.
Furthermore, we mapped the co-authorship of each university, identifying each
university’s prominent and influential scientists using degree centrality and PageRank.
Although the overall density of the social network is low for both periods, there are dense

112
sub-clusters within the entire network structure which resulted in “small world”
phenomenon in the social network structure. For instance, we showed that while
betweenness centrality is low, the closeness and degree centralities increased in each
period, which are the indication of small-world phenomenon in the network structure.
The third question was: “How significant is the rate of diffusion of nano-related
technology according to network properties results in two periods: 2000-2005 and 2006-
2001?” We approached this question by contrasting number of new adopters in each
period. Although the number of new adopters rose gradually in each period; nevertheless,
the number of multiple fraction authored papers have increased from 2000-2005 to 2006-
2011, reflecting collaborations among scientists whose work included nano-related
technology in Turkey. For example, we found out that Büyükgüngör has authored
scientific papers with more than those other scientists in the network structure including
scientists who did not appear at the top 15 authors in terms of degree centralities. However,
they were recognized as instrumental nodes in the diffusion of nanotechnology in the
network structure.
The fourth question was: “To what extent do scientists share a common vision (behavior)
on nano technology?” We interviewed five junior scientists and five senior scientist
collected, analyzed and elaborated on their responses to two questions using Latent
Semantic Analysis method. The overall mean of similarity between responses was about
30%. However, the goodness of the fit was more than 0.75, indicating that both senior and
junior scientists perceive collaboration in a similar manner.
In other words, the aim of the research was to unravel the diffusion process in Turkey by
investigating extracted records from WoS between 2000-2005 and 2006-2011 using both
qualitative and quantitative research methods. Rogers’ theory of diffusion process was
used as a blueprint to track nano-related technology in academia by means of co-
authorship network analysis. Moreover, it was observed that scientists have intentions to
work both internationally and nationally. For example, scientists prefer to collaborate with
their counterparts in European countries and North America. In addition, locally,

113
nanotechnology institutes at prolific universities mostly collaborate with their sister
universities within the networks, thus creating cohesive clusters in the network structure.
5.3 STRENGTHS AND WEAKNESSES OF THE THESIS
This is the first study carried out in Turkey assessing the diffusion of nano-related
technologies. Although information scientists have used mixed methods to study scientific
indicators, which we mentioned in relevant studies in the preceding chapter, no one has yet
applied the Latent Semantic Analysis in analyzing ethnographic discourses. As mentioned
earlier, there have been articles or theses in which LSA was utilized. The qualitative
results show that the level of similarity among scientists’ behaviors is at 30%. The number
of interviews was small, however. The responses compiled from interviewees have created
an incubator-prototype which can be enhanced further. The co-authorship network may not
necessarily illustrate the diffusion process holistically. Nevertheless, it describes the notion
of information sharing and collaboration behavior of nanotechnology scientists. In this
endeavor, co-citation analysis was briefly covered; nevertheless, it was revealed that co-
citation analysis solely does not illuminate the diffusion of nano-related technology in
Turkey. Network of scientific collaboration manifests “small-world” which facilitates the
diffusion of nano-related technology structure through acquaintance.
TÜBİTAK and the MoD are two of the governmental agencies that support research
institutes in universities. One way to expand collaboration is through communication
which accelerates the diffusion of nano-related technologies in Turkey. Yet, we discovered
that scientists seem to be reluctant to collaborate, unless they become more observant of
the teamwork. We collected and assessed their comprehension of co-authorship network
regarding collaboration through interviews and by using Latent Semantic Analysis
methods. We can say that the longevity plays an important role for a person to become a
hub in his/her cluster. However, becoming a hub in a cluster does not necessarily mean that
one becomes a pivotal point, thereby facilitating the flow of information from one cluster
to another cluster in the network.

114
5.4 RECOMMENDATIONS
Although Turkey has included research and development in nano-technology in her
national plan, there are some key points to be implemented which would accelerate the
diffusion of nano-related technology. They are as follows:
Applying new methods (i.e., ethnographic interviews) in evaluating research activities;
Encouraging scientists whose positions are not significant in the network to participate
in research activities in order to create synergy among research institutes;
Utilizing brokers to participate more in research activities to stimulate academic
exchange among all institutes, nationally and internationally; and
Promoting research on Bio-Nanotechnology fields and its derivatives in Health
Sciences.
5.5 FUTURE WORK
As revealed earlier, governmental agencies have invested on research and technology,
specifically nano-related technology. Our personal observation is that TÜBİTAK and MoD
have been supporting research in universities. However, further studies are needed to
investigate other variables that may affect the level of outputs in terms of scientific articles
in academia. Latent Semantic Analysis technique was used as a tool for exploring
discourses in this dissertation. It could be useful to apply this technique to other research
involving discourse analysis. The current study can be enhanced or extended by
interviewing more scientists or by contrasting results with other countries for a better
picture of Turkey’s performance in nano-related technologies.

BIBLIOGRAPHY
Aydoğan-Duda, N. (2012a). Branding Innovation: The Case Study of Turkey in Ekekwe,
N. & Islam, N. (Eds.). Disruptive Technologies, Innovation and Global Redesign
Emerging Implications.(pp. 238-248)., Hershey, PA: IGI Global.
Aydoğan-Duda, N. (2012b). Nanotechnology: A Descriptive Account. Making it to the
Forefront in Aydogan-Duda, N. (Ed). Nanotechnology: A Developing Country
Perspective. 1, (pp. 1-4). New York: Springer.
Aydoğan-Duda, N., & Şener, I. (2010). Entry Barriers to the Nanotechnology Industry in
Turkey in Ekekwe, N. (Ed). Nanotechnology and Microelectronics: Global Diffusion,
Economics and Policy. (pp. 167-173). Hershey, PA: IGI Global.
Barabasi, AL., & Albert, R. (1999). Emergence of Scaling in Random Networks. Science
Magazine, 286 (5439), 509-512
Börner, K., Chen, C., & Boyack, K. (2003). Visualizing Knowledge Domains. Annual
Review of Information Science and Technology, 37(1), 179-255.
Burt, R.S. (1992). Structural Holes: The Social Structure of Competition, Cambridge, MA:
Harvard University Press
Callon, M., Courtial, J.P., Turner, W. A., & Bauin, S. (1983). From Translations to
Problematic Networks: An Introduction to Co-word Analysis. Social Science
Information, 22(2), 191-235.
Cartwright, D., & Harary, F. (1977). A Graph Theoretic Approach to the Investigation of
System-Environment Relationships. Journal of Mathematical Sociology, 5(1) 87-111.
Chen, C. (2004). Searching for Intellectual Turning Points: Progressive Knowledge
Domain Visualization. PNAS, 101 (Suppl. 1), 5303-5310.
Chen, C., Chen, Y., Horowitz, M., Hou, H., Liu, Z., & Pellegrino, D. (2009). Towards
an Explanatory and Computational Theory of Scientific Discovery. Journal of
Informetrics, 3(3), 191-209.
Crane, D. (1972). Invisible Colleges: Diffusion of Knowledge in Scientific Communities.
Chicago, IL: University of Chicago Press.
Darvish, H.R. (2011). Assessing the Diffusion of Nanotechnology in Turkey: A Social
Network Analysis. Collnet Journal of Scientometrics and Information Management,
6(1),175-183.
Deerwester, S.T., Furnas, G.W., Harshman, R.A., Landauer, T.K., Lochbaum, K.E., &
Streeter, L.A. (1989). Computer Information Retrieval Using Latent Semantic
Structure. United States Patent 4,839,853 (June 13, 1989).

116
Deerwester, S.T., Furnas, G.W., Landauer, T.K., & Harshman, R. (1990). Indexing by
Latent Semantic Analysis. Journal of the American Society for Information Science,
41(6), 321-407.
Emirbayer, M., & Goodwin, J. (1994). Network Analysis, Culture, and the Problem of
Agency. American Journal of Sociology, 99(6), 1411-54.
Feynman, R.P. (1960). There’s Plenty of Room at the Bottom. Caltech Engineering &
Science. Retrieved, Feb.14, 2014, from
http://calteches.library.caltech.edu/1976/1/1960Bottom.pdf
Foucault, M. (1991). Discipline and Punish: The Birth of a Prison. London: Penguin.
Freeman, L.C. (1996). Some Antecedents of Social Network Analysis, Connections, 19(1)
39-42.
Freeman, L.C. (2004). The Development of Social Network Analysis: A Study in the
Sociology of Science. Vancouver: Empirical Press.
Fulcher, E. (2005). What is Discourse Analysis? Retrieved, Feb. 14, 2014, from
http://www.eamonfulcher.com/discourse_analysis.html
Garfield, E. (1988). Theory of Technology’s Role in Economic Growth Brings MIT’s
Robert M Solow the 1987 Nobel Prize in Economic Sciences, Current Contents
11(17), 123-128.
Girvan, M., & Newman., M. E. J.(2002). Community Structure in Social and Biological
Networks, PNAS, 99(12), 7821–7826.
Granovetter, M.(1974). Getting A Job: A Study of Contacts and Careers. Cambridge,
Mass: Harvard University.
Kostoff, R.N., Koytcheff, R.G., & Lau, C.G.Y. (2007). Global Nanotechnology Research
Literature Overview, Technological Forecasting & Social Change, (74), 1733-1747.
Kostoff, R.N., Stump, J. A., Johnson, D., Murday, J.S. , Lau, C.G.Y., & Tolls, W.M.
(2006). The Structure and Infrastructure of Global Nanotechnology Literature. Journal
of Nanoparticles Research, (8), 301-321
Kuhn, T. S. (1970). The Structure of Scientific Revolutions. Chicago, IL: University of
Chicago Press.
Landauer, T. K., Foltz, P. W., & Laham, D. (1998). An introduction to Latent Semantic
Analysis. Discourse Processes, 25(2-3), 259-284.
Leleu, T.D., Jacobson, I.G., LeardMann, C.A., Smith, B., Foltz, P.W., Amoroso, P.J., Derr,
M.A. & Ryan, M.A.K. & Smith, T.C. (2011). Application of Latent Semantic Analysis

117
for Open-ended Responses in a Large, Epidemiologic Study. BMC Medical Research
Methodology, 11(36).
Lewin, K. (1951). Field Theory in Social Science. New York: Harper.
Leydesdorff, L. (2001). The Challenge of Scientometrics, The Development, Measurement,
and Self-Organization of Scientific Communications. Florida: Universal-Publishers.
Leydesdorff, L. & Etzkowitz, H. (1998). The Triple Helix as a Model for Innovation
Studies (Conference Report), Science & Public Policy, Research Policy 25(3), 195-
203.
Leydesdorff, L., & Persson, O. (2010). Mapping the Geography of Science: Distribution
Patterns and Networks of Relations among Cities and Institutes. Journal of the
American Society for Information Science & Technology, 61(8), 1622-1634.
Leydesdorff, L., & Rafols, I. (2009). A Global Map of Science Based on the ISI Subject
Categories, Journal of the American Society for Information Science and Technology,
60(2) 348-362.
Leydesdorff, L., Welbers, K. (2011). The Semantic Mapping of Words and Co-words in
Contexts, Journal of Informetrics, 5(3) 469-475.
Lievrouw, L.A., Rogers, E.M., Lowe., C.U., & Nadel, E. (1987). Triangulation as a
research strategy for identifying invisible colleges among biomedical scientists. Social
Networks, 9(3), 217-248.
Mehta, M., (2002). Nanoscience and Nanotechnology: Assessing the Nature of Innovation
in These Fields. Bulletin of Science, Technology and Society, 22(4), 269-273.
Milgram, S. (1967). The Small World Problem. Psychology Today, 1(1), 61–67.
Milojević, S. (2009), Big Science, Nano Science? Mapping the Evolution and Socio-
Cognitive Structure of Nanoscience/nanotechnology Using Mixed Methods. PhD
Dissertation, University of California, Los Angeles.
Moody, J. (2004). The Structure of a Social Science Collaboration Network: Disciplinary
Cohesion from 1963 to 1999. American Sociological Review, 69(2), 213-238.
Moreno, J. (1934). Who shall Survive? Sociometry, 6(3), 206-213.
Motoyama, Y., & Eisler. M.N (2011). Bibliometry and Nanotechnology: A Meta-analysis.
Technological Forecasting & Social Change, 78(7), 1174–1182.
Newman, M. E. J. (2000). The Structure of Scientific Collaboration Networks. PNAS, 98
(2), 404–409.
Page, L., & Brin, S. (1998). The Anatomy of a Large-scale Hypertextual Web Search
Engine. Computer Networks and ISDN Systems, 30, 107-117.

118
Otte, E., & Rousseau, R. (2002). Social Network Analysis: A Powerful Strategy, also for
the Information Sciences. Journal of information Science, 28(6), 443–455.
Özel, B. (2010). Scientific Collaboration Networks: Knowledge Diffusion and
Fragmentation in Turkish Management Academia, PhD Dissertation, Bilgi University,
Istanbul.
Pritchard, A. (1969). Statistical Bibliography or Bibliometrics? Journal of Documentation,
25(4), 348-349.
Price, D. J. de Solla. (1965). Networks of Scientific Papers. Science, 49(3683), 510–515.
Rafols, I., & Leydesdorff, L. (2011). The Local Emergence and Global Diffusion of
Research Technologies: An Exploration of Patterns of Network Formation, Journal of
the American Society for Information Science and Technology. 62(5), 846-850.
Rafols, I., Porter, A. L., & Leydesdorff, L. (2010). Science Overlay Maps: a New Tool for
Research Policy and Library Management. Journal of the American Society for
Information Science and Technology, 61(9), 1871–1887.
Rogers, E. M. (2003). Diffusion of Innovations. 5th ed. New York: The Free Press.
Rousseau, R. (1997). Sitations: an Exploratory Study. Cybermetrics. Retrieved, Feb.14,
2014, from http://cybermetrics.cindoc.csic.es/articles/v4i1p4.pdf
Saville-Troike, M. (2003). The Ethnography of Communication: An Introduction, 3d ed.
Malden, MA: Blackwell Publishers.
Scott, J. (2000). Social Network Analysis: A Handbook. 2nd ed. London: Sage.
Tonta, Y., & Darvish, H.R. (2010). Diffusion of Latent Semantic Analysis as a Research
Tool: A Social Network Analysis Approach. Journal of Informetrics, 4 (2), 166-174.
Uzun, A. (2006). Science and technology policy in Turkey: National strategies for
innovation and change during the 1983-2003 periods and beyond. Scientometrics,
66(3), 551-559.
Valente, T. (1995). Network Models of the Diffusion of Innovations. Creskill, NJ:
Hampton.
Valente, T. (1996). Social Network Thresholds in the Diffusion of Information. Social
Networks, 18(1), 69-89.
Wasserman, S., & Faust, K. (1994). Social Network Analysis: Methods and Applications.
Cambridge: Cambridge University Press.
Watts, D. (2003). Six Degrees: The Science of a Connected Age. New York: W. W. Norton
& Company.

119
Watts, D.J. (1999). Networks, Dynamics, and the Small-World Phenomenon. American
Journal of Sociology. 105 (2), 493–527.
Watts, D. J., & Strogatz, S. (1998). Collective Dynamics of “small-world” Networks.
Nature, 393 (6684), 440-441.
Wellman, B., & Berkowitz, S. D. (1997). Social Structures: A Network Approach. 2nd ed.
Cambridge: University of Cambridge.
White, H. D., & McCain, K. W. (1998). Visualizing a Discipline: An Author Co-citation
Analysis of Information Science, 1972-1995. Journal of the American Society for
Information Science, 49(4), 327-355.
William, MA. (2012). Intrinsic Advance Primers: An Investigation of the Effects of
Personalized Extraneous Multimedia Upon Intrinsic Interest and Student
Achievement, PhD Dissertation, Kent State University. Retrieved, Feb. 14, 2014, from https://etd.ohiolink.edu/ap:10:0::NO:10:P10_ACCESSION_NUM:kent1342732010
Zuccala, A.A. (2004). Revisiting the Invisible College: A Case Study of the Intellectual
Structure and Social Process of Singularity Theory Research in Mathematics, PhD
Dissertation, University of Toronto. Retrieved, Feb. 14, 2014, from
http://individual.utoronto.ca/azuccala_web/AZuccala-Thesis.pdf

120
APPENDICES
APPENDIX A: QUERY FORMATION USED TO FIND THE PUBLICATIONS OF
TURKISH RESEARCHERS ON NANOSCIENCE AND NANOTECHNOLOGY
ON THE WEB
TS=(NANOPARTICLE* OR NANOTUB* OR NANOSTRUCTURE* OR NANOCOMPOSITE* OR NANO-
COMPOSITE* OR NANOWIRE* OR NANOCRYSTAL* OR NANOFIBER* OR NANOFIBRE* OR
NANOSPHERE* OR NANOROD* OR NANOTECHNOLOG* OR NANOCLUSTER* OR NANOCAPSULE*
OR NANOMATERIAL* OR NANOFABRICAT* OR NANOPOR* OR NANOPARTICULATE* OR
NANOPHASE OR NANOPOWDER* OR NANOLITHOGRAPHY OR NANO-PARTICLE* OR NANODEVICE*
OR NANODOT* OR NANOINDENT* OR NANO-INDENT* OR NANOLAYER* OR NANOSCIENCE OR
NANOSIZE* OR NANO-SIZE* OR NANOSCALE* OR NANO-SCALE* OR NANOROBOT*) AND
AD=(TURKEY) NOT TS=(NANOMET* OR NANO2 OR NANO3 OR NANO4 OR NANO5 OR NANOSEC* OR
NANOSECOND* OR NANOMETERSCALE* OR NANOMETER LENGTH*)
TS=((NM OR NANOMETER* OR NANOMETRE*) SAME (SURFACE* OR FILM* OR GRAIN* OR
POWDER* OR SILICON OR DEPOSITION OR LAYER* OR DEVICE* OR CLUSTER* OR CRYSTAL* OR
MATERIAL* OR SUBSTRATE* OR STRUCTURE* OR ROUGHNESS OR MONOLAYER* OR
RESOLUTION OR PARTICLE* OR ATOMICFORCE MICROSCOP* OR TRANSMISSION ELECTRON
MICROSCOP* OR SCANNING TUNNELING MICROSCOP*)) AND AD= (TURKEY) NOT TS=(NANOMET*
OR NANO2 OR NANO3 OR NANO4 OR NANO5 OR NANOSEC* OR NANOSECOND* OR
NANOMETERSCALE* OR NANOMETER LENGTH*)
TI=(nano*) AND SO=((BULK “AND” GRADED NANOMETALS OR CURRENT NANOSCIENCE OR FROM
NANOPOWDERS TO FUNCTIONAL MATERIALS OR FULLERENES NANOTUBES “AND” CARBON
NANOSTRUCTURES OR FULLERENES NANOTUBES “AND” CARBON NANOSTRUCTURES OR
FUNCTIONAL MOLECULAR NANOSTRUCTURES OR IEEE TRANSACTIONS ON NANOBIOSCIENCE OR
IEEE TRANSACTIONS ON NANOTECHNOLOGY OR INORGANIC POLYMERIC NANOCOMPOSITES
“AND” MEMBRANES OR JOURNAL OF COMPUTATIONAL “AND” THEORETICAL NANOSCIENCE OR
JOURNAL OF NANOPARTICLE RESEARCH OR JOURNAL OF NANOSCIENCE “AND”
NANOTECHNOLOGY OR MICROSYSTEM TECHNOLOGIES MICRO “AND” NANOSYSTEMS
INFORMATION STORAGE “AND” PROCESSING SYSTEMS OR NANO LETTERS OR NANOPOROUS
MATERIALS IV OR NANOTECHNOLOGY OR ON THE CONVERGENCE OF BIO INFORMATION
ENVIRONMENTAL ENERGY SPACE “AND” NANO TECHNOLOGIES PTS 1 “AND” 2 OR PHYSICA E
LOW DIMENSIONAL SYSTEMS NANOSTRUCTURES OR PRECISION ENGINEERING JOURNAL OF THE
INTERNATIONAL SOCIETIES FOR PRECISION ENGINEERING “AND” NANOTECHNOLOGY OR
SYNTHESIS “AND” REACTIVITY IN INORGANIC METAL ORGANIC “AND” NANO METAL CHEMISTRY
OR JOURNAL OF NANOSCIENCE AND NANOTECHNOLOGY OR NANOTECHNOLOGY OR ACS NANO

121
OR NANO LETTERS OR JOURNAL OF NANOPARTICLE RESEARCH OR NANOSCALE OR NANOSCALE
RESEARCH LETTERS OR SMALL OR PHYSICA E LOW DIMENSIONAL SYSTEMS NANOSTRUCTURES
OR INTERNATIONAL JOURNAL OF NANOMEDICINE OR JOURNAL OF COMPUTATIONAL AND
THEORETICAL NANOSCIENCE OR JOURNAL OF NANOMATERIALS OR MICRO NANO LETTERS OR
MICROSYSTEM TECHNOLOGIES MICRO AND NANOSYSTEMS INFORMATION STORAGE AND
PROCESSING SYSTEMS OR IEEE TRANSACTIONS ON NANOTECHNOLOGY OR JOURNAL OF
BIOMEDICAL NANOTECHNOLOGY OR SYNTHESIS AND REACTIVITY IN INORGANIC METAL
ORGANIC AND NANO METAL CHEMISTRY OR NANO RESEARCH OR DIGEST JOURNAL OF
NANOMATERIALS AND BIOSTRUCTURES OR NATURE NANOTECHNOLOGY OR NANOMEDICINE OR
NANOMEDICINE NANOTECHNOLOGY BIOLOGY AND MEDICINE OR NANOSCIENCE AND
NANOTECHNOLOGY LETTERS OR MICROFLUIDICS AND NANOFLUIDICS OR PRECISION
ENGINEERING JOURNAL OF THE INTERNATIONAL SOCIETIES FOR PRECISION ENGINEERING AND
NANOTECHNOLOGY OR CURRENT NANOSCIENCE OR JOURNAL OF NANOPHOTONICS OR NANO OR
NANOTOXICOLOGY)) AND AD=(TURKEY) NOT TI=(NANOMET* OR NANO2 OR NANO3 OR NANO4
OR NANO5 OR NANOSEC* OR NANOSECOND* OR NANOMETERSCALE* OR NANOMETER LENGTH*)
TS=((NSOM OR CHEMICAL VAPOR DEPOSITION OR CVD OR CHEMICAL VAPOUR DEPOSITION OR X-
RAY PHOTOELECTRON SPECTROSCOPY OR DIFFERENTIAL SCANNING CALORIMETRY OR X-RAY
DIFFRACTION OR XRD OR SURFACE PLASMON RESONANCE OR “NEAR” FIELD SCANNING OPTICAL
MICROSCOP*) SAME (SURFACE* OR FILM* OR LAYER* OR SUBSTRATE* OR ROUGHNESS OR
MONOLAYER* OR MOLECUL* OR STRUCTURE* OR RESOLUTION OR ETCH* OR GROW* OR SILICON
OR SI OR DEPOSIT* OR PARTICLE* OR FORMATION OR TIP OR ATOM* OR GOLD OR AU OR
POLYMER* OR COPOLYMER* OR GAAS OR INAS OR SUPERLATTICE* OR ADSORPTION OR
ADSORB* OR ISLAND* OR SIZE OR POWDER OR RESOLUTION OR QUANTUM OR MULTILAYER* OR
ARRAY* OR NANO*)) AND AD=(TURKEY) NOT TS=(NANOMET* OR NANO2 OR NANO3 OR NANO4
OR NANO5 OR NANOSEC* OR NANOSECOND* OR NANOMETERSCALE* OR NANOMETER LENGTH*)
TS=((AFM OR ATOMIC FORCE MICROSCOP* OR SCANNING ELECTRON MICROSCOP* OR SEM OR
SCANNING TUNNELING MICROSCOP* OR STM OR SELF-ASSEMBL* OR SELF-ORGANIZ* OR
TRANSMISSION ELECTRON MICROSCOP* OR TEM ) SAME (SURFACE* OR FILM* OR LAYER* OR
SUBSTRATE* OR ROUGHNESS OR MONOLAYER* OR MOLECUL* OR STRUCTURE* OR RESOLUTION
OR ETCH* OR GROW* OR SILICON OR SI OR DEPOSIT* OR PARTICLE* OR FORMATION OR TIP OR
ATOM* OR GOLD OR AU OR POLYMER* OR COPOLYMER* OR GAAS OR INAS OR SUPERLATTICE*
OR ADSORPTION OR ADSORB* OR ISLAND* OR SIZE OR POWDER* OR RESOLUTION OR QUANTUM
OR MULTILAYER* OR ARRAY* OR NANO*)) AND AD=(TURKEY) NOT TS=(NANOMET* OR NANO2
OR NANO3 OR NANO4 OR NANO5 OR NANOSEC* OR NANOSECOND* OR NANOMETERSCALE* OR
NANOMETER LENGTH*)

122
TS=(NANOMECHANICAL OR NANOELECTRONIC* OR NANOHARDNESS OR NANORIBBON* OR
NANOBELT* OR NANOGRAIN* OR NANOCABLE* OR NANOCHANNEL* OR NANOSHEET* OR
NANODIAMOND* OR NANOMAGNET* OR NANODISK* OR NANOSHELL* OR NANOCONTACT* OR
NANOREACTOR* OR NANOIMPRINT* OR NANOHOLE* OR NANOWHISKER* OR NANOCHEMISTRY
OR NANOGRAPHITE OR NANOELECTRODE* OR NANOGRANULAR OR NANOFOAM* OR
NANOMETER-SIZE* OR NANOCOLLOID* OR NANORING* OR NANOPHOTONIC* OR NANOSENSOR*
OR NANOELECTROSPRAY* OR NANOBRIDGE* OR NANOMETER-SCALE* OR NANOBIO* OR
BIONANO* OR HIPCO) AND AD=(TURKEY) NOT TS=(NANOMET* OR NANO2 OR NANO3 OR NANO4
OR NANO5 OR NANOSEC* OR NANOSECOND* OR NANOMETERSCALE* OR NANOMETER LENGTH*)
TS=(MOLECUL* MOTOR* OR MOLECUL* RULER* OR MOLECUL* DEVICE* OR MOLECULAR
ENGINEERING OR MOLECULAR ELECTRONIC* OR COULOMB STAIRCASE* OR QUANTUM DOT* OR
QUANTUM WELL* OR QUANTUM WIRE* OR COULOMB BLOCKADE* OR MOLECULAR WIRE*) AND
AD=(TURKEY) NOT TS=(NANOMET* OR NANO2 OR NANO3 OR NANO4 OR NANO5 OR NANOSEC* OR
NANOSECOND* OR NANOMETERSCALE* OR NANOMETER LENGTH*)
TS=(NANO*) AND AD=( NANO* NOT NANOPHOTON*) AND AD=(TURKEY)

123
APPENDIX B: SUBJECT CONSENT FORM
The purpose of this research is to assess the diffusion of nanotechnology in Turkey using
social network analysis. The objective of this research is to understand the collaborative
structure of scientific domain.
Hamid Derviş ([email protected], [email protected]) is conducting this
interview for his PhD thesis. His advisor is Prof. Dr. Yaşar Tonta of the Department of
Information Management from Hacettepe University. Also, other jury members are Prof.
Dr. Serap Kurbanoğlu from the same Department and Prof. Dr. Aydın ERAR from Mimar
Sinan University.
SUBJECT CONSENT:
As a candidate for this study:
1) I understand that there are no misuses of the information under any circumstances
with my role as a candidate
2) I understand that I have the option of refusing to answer
3) I have the option of continuing or not continuing my role as an informer
4) I understand that I have the voluntary option of allowing or not allowing my name
to appear in the thesis
5) I the undersigned: agree / do not agree (circle one) to allow the researcher,
Hamid Derviş to use my name in his written Ph.D. research report.
Interviewees’ Signature:
E-mail address:

124
APPENDIX C: STRUCTURED INTERVIEW QUESTIONS
1) When did you hear the term nano in your subject study?
2) How long have you been working on nano-related technologies?
3) Which area of nano-technology are you working now?
4) The term “nano” is a relatively new terminology, what would you be working on if
the term nano was not introduced? Describe a collaborative nano-related project
that you are working on?
5) Does each project get supported financially? If your answer is yes, to what extent?
If no, what has been the outcome of the scientific output (Journal Article)?
6) Is there a relationship between financial support and the publication output of the
project you have been working on?
7) With whom do you usually collaborate in scientific activities? And why?
8) Is there any one that you would like to collaborate in the field of nano-related
technology locally or internationally?
9) Where would you like to see yourself in this social structure map? I would like to
see myself as having graduate students. Consequently as being more productive,
who was your PhD advisor?
10) Have you kept working on your PhD thesis or new topics? Do you collaborate still
with your advisor?
11) Are you advising any graduate or under graduate students currently?
12) Do you easily communicate with everyone in your field in your university or
outside university? Who are they?

125
APPENDIX D: SEMI-STRUCTURED INTERVIEW QUESTIONS
1. Would you elaborate on state of nanotechnology research in Turkey?
2. Do you see a major correlation between financial support and research activities in
terms of scientific publications in your department?
3. Would you please share your opinion about scientific collaboration after seeing the
co-authorship map of your university?
4. Do you collaborate nationally or internationally on research activities? What is
your preference?
5. How can we improve the nanotechnology awareness in Turkey especially in
academia?

126
APPENDIX E LIST OF WORDS USED IN NANOTECHNOLOGY: 2000-2005 Rotated Component Matrix
a
Component
Words 1 Words 2
CHEMICAL .999 PLASMA .999
QUANTUM .999 TREATMENT .999
STEEL .998 CONDUCTING .990
HYDROGEN .997 CERAMIC .982
COPOLYMER .992 SOLGEL .982
FIELD .992 LAYER .945
PROPERTIE .984 OPTICAL .945
ELECTRICAL .973 SURFACE .945
COATING -.968 WEAR .901
LASER .954 NANOPARTICLE -.901
TURKEY .951 POLYMERIZATION .894
ION .941 POLYMER -.891
ALLOY .928 POWDER .885
BEHAVIOR .928 MECHANICAL .883
THIN .925 MOLECULAR .883
SYNTHESIS .920 SCANNING .883
METHACRYLATE .920 CHARACTERISTIC .879
CRYSTAL .916 CELL .866
OXIDE .914 WIRE -.866
FILM .913 MICROSCOPY .845
DOT .912 BASED .826
NANOTUBE .902 COMPOSITE .825
CARBON .891 MATERIAL .817
ACID .873 MAGNETIC .786
CHARACTERIZATION .872 ELECTRIC -.764
ADSORPTION .866 PREPARATION .754
SPECTROSCOPIC .866 ELECTROCHEMICAL .737
THERMAL .866 SILICON .721
STRUCTURAL .840 MEMBRANE .721
ANALYSIS .836
ELECTRON .830
FIBER .826
PROCE .817
ATOMIC .807
STRUCTURE .800
ELECTRONIC .796
METAL .792
COMPLEXE .772
RESIN -.756
SUBSTRATE .756
MICROSTRUCTURE .756
SPECTRA .756
TEMPERATURE .756

127
EFFECT .746
METHOD .729
WEAR .901
NANOPARTICLE - .901
POLYMERIZATION .894
POLYMER -.891
POWDER .885
MECHANICAL .883
MOLECULAR .883
SCANNING .883
CHARACTERISTIC .879
Extraction Method: Principal Component Analysis.
Rotation Method: Varimax with Kaiser Normalization.
a. Rotation converged in 8 iterations.

128
APPENDIX F: LIST OF WORDS USED IN NANOTECHNOLOGY: 2006-2011
Rotated Component Matrixa
Component
Words 1 Words 2 Words 3
COPOLYMER .766 DETERMINATION .683 ELECTRON .687
COMPLEXES .697 STEEL .673 DOT .676
CRYSTAL .674 WELL .655 MORPHOLOGY .654
THERMAL .653 AQUEOU .651 ADSORPTION .644
SPECTROSCOPIC .650 ZNO .642 ENERGY .641
CHARACTERISTIC .643 PARTICLE .626 PREPARED .620
PREPARATION .641 MATERIAL .625 QUANTUM .619
METAL .636 TEMPERATURE .620 ELECTRICAL .610
POLYMER .636 CELL .618 MODIFIED .610
OXIDE .629 BASED .617 CARBON .608
STRUCTURE .629 MECHANICAL .683 NANOTUBE .599
TURKEY .627 PHASE .673 ELECTROCHEMICAL .598
COMPLEXES .626 COMPOSITE .655 TREATMENT .598
FIBER .625 MAGNETIC .651 NANOCOMPOSITE .597
STUDIES .621 DOPED .642 ACID .594
STRUCTURAL .619 PLASMA .626 NANOPARTICLE .591
SURFACE .616 ALLOY .625
MEMBRANE .615 LASER .620
SOLUTION .611 BASED .618
CATALYST .610 MECHANICAL .617
FIELD .608
OPTICAL .605
THIN .604
NOVEL .604
ION .603
BEHAVIOR .602
MOLECULAR .599
APPLICATION .590
CONTAINING .590
METHOD .589
CHEMICAL .589
COATING .587
INFLUENCE .587
DEPOSITION .580
Extraction Method: Principal Component Analysis.
Rotation Method: Varimax with Kaiser Normalization.
a. Rotation converged in 3 iterations.

129
APPENDIX G: THE MOST COLLABORATING UNIVERSITIES WORKING ON
NANO-RELATED TECHNOLOGY (2000-2011)
Freq Universities
56 Cumhuriyet Univ Dokuz Eylul Univ
52 Eskisehir Osmangazi Univ Ondokuz Mayis Univ
50 Ankara Univ Hacettepe Univ
48 Gazi Univ Middle E Tech Univ
47 Ankara Univ Gazi Univ
40 Gazi Univ Hacettepe Univ
35 Bilkent Univ Gazi Univ
34 Dokuz Eylul Univ Ege Univ
30 Gebze Inst Technol TUBITAK Marmara Res Ctr
28 Ondokuz Mayis Univ Uludag Univ
27 Fatih Univ Gebze Inst Technol
27 Celal Bayar Univ Ege Univ
26 Anadolu Univ Hacettepe Univ
25 Firat Univ King Saud Univ
25 Dicle Univ Middle E Tech Univ
25 Ankara Univ Selcuk Univ
23 Dumlupinar Univ Eskisehir Osmangazi Univ
23 Akdeniz Univ Inonu Univ
22 Ahi Evran Univ Gazi Univ
22 Bilkent Univ Nanyang Technol Univ
22 Hacettepe Univ Middle E Tech Univ
22 Baskent Univ Hacettepe Univ
22 Adnan Menderes Univ Hacettepe Univ
22 Atilim Univ Middle E Tech Univ
21 Ankara Univ Cankaya Univ
21 Istanbul Tech Univ Koc Univ
21 Istanbul Tech Univ Univ Washington
21 Dumlupinar Univ Ondokuz Mayis Univ
20 Ege Univ Hacettepe Univ
20 Adnan Menderes Univ Ege Univ
19 Ondokuz Mayis Univ Sinop Univ
19 Istanbul Tech Univ Marmara Univ
19 Fatih Univ Royal Inst Technol KTH
19 Bilkent Univ Middle E Tech Univ
19 Balikesir Univ Uludag Univ
19 Istanbul Tech Univ Yildiz Tech Univ
19 Ankara Univ Middle E Tech Univ
18 Anadolu Univ Firat Univ
18 Anadolu Univ Eskisehir Osmangazi Univ


![[PPT]Osmosis, Diffusion, Active Transport - Lake Shore … · Web viewOsmosis, Diffusion, Active Transport Diffusion, Osmosis and Concentration Gradient Diffusion – the movement](https://img.dokumen.tips/doc/110x75/5b257b6a7f8b9ae13b8b469c/pptosmosis-diffusion-active-transport-lake-shore-web-viewosmosis-diffusion.jpg)