Embed Size (px)
Citation preview

Assessing Symbiodinium diversity in scleractinian coralsvia next-generation sequencing-based genotyping of theITS2 rDNA region
CHATCHANIT ARIF, * CAMILLE DANIELS,* TILL BAYER,† EULALIA BANGUERA-HINESTROZA,*
ADRIAN BARBROOK,‡ CHRISTOPHER J . HOWE,‡ TODD C. LAJEUNESSE§ and CHRISTIAN R.
VOOLSTRA*
*Red Sea Research Center, King Abdullah University of Science and Technology (KAUST), 23955 Thuwal, Saudi Arabia,
†GEOMAR Helmholtz Centre for Ocean Research Kiel, 24105 Kiel, Germany, ‡Department of Biochemistry, University of
Cambridge, Building O, Downing Site, Tennis Court Road, Cambridge, CB2 1QW, UK, §Department of Biology, Penn State
University, University Park, PA 16802, USA
Abstract
The persistence of coral reef ecosystems relies on the symbiotic relationship between
scleractinian corals and intracellular, photosynthetic dinoflagellates in the genus
Symbiodinium. Genetic evidence indicates that these symbionts are biologically diverse
and exhibit discrete patterns of environmental and host distribution. This makes the
assessment of Symbiodinium diversity critical to understanding the symbiosis ecology
of corals. Here, we applied pyrosequencing to the elucidation of Symbiodinium diver-
sity via analysis of the internal transcribed spacer 2 (ITS2) region, a multicopy genetic
marker commonly used to analyse Symbiodinium diversity. Replicated data generated
from isoclonal Symbiodinium cultures showed that all genomes contained numerous,
yet mostly rare, ITS2 sequence variants. Pyrosequencing data were consistent with
more traditional denaturing gradient gel electrophoresis (DGGE) approaches to the
screening of ITS2 PCR amplifications, where the most common sequences appeared as
the most intense bands. Further, we developed an operational taxonomic unit (OTU)-
based pipeline for Symbiodinium ITS2 diversity typing to provisionally resolve ecolog-
ically discrete entities from intragenomic variation. A genetic distance cut-off of 0.03
collapsed intragenomic ITS2 variants of isoclonal cultures into single OTUs. When
applied to the analysis of field-collected coral samples, our analyses confirm that much
of the commonly observed Symbiodinium ITS2 diversity can be attributed to intrage-
nomic variation. We conclude that by analysing Symbiodinium populations in an OTU-
based framework, we can improve objectivity, comparability and simplicity when
assessing ITS2 diversity in field-based studies.
Keywords: coral reefs, dinoflagellates, internal transcribed spacer 2, next-generation sequencing,
operational taxonomic unit, Symbiodinium
Received 16 April 2014; revision received 17 July 2014; accepted 18 July 2014
Introduction
Coral reef communities depend critically on the relation-
ship between scleractinian corals and photosynthetic
endosymbionts in the genus Symbiodinium. While the
coral host provides a light-rich, sheltered environment
and inorganic nutrients, the dinoflagellate algae provide
photosynthetically fixed carbon (Muscatine & Cernich-
iari 1969). Some corals seem to rely strictly on a distinct
symbiont type, whereas others harbour different types
of Symbiodinium (Rowan & Knowlton 1995). Although
host identity is the primary predictor of symbiont
identity, coral-associated Symbiodinium diversity also
covaries with geographical location, water depth and
health state (Rodriguez-Lanetty et al. 2001; Toller et al.Correspondence: Christian R. Voolstra, Fax: +966 2 808 2377;
E-mail: [email protected]
© 2014 The Authors. Molecular Ecology Published by John Wiley & Sons Ltd.This is an open access article under the terms of the Creative Commons Attribution License,which permits use, distribution and reproduction in any medium, provided the original work is properly cited.
Molecular Ecology (2014) doi: 10.1111/mec.12869
2001; LaJeunesse et al. 2004, 2010; Sampayo et al. 2007;
Macdonald et al. 2008; Finney et al. 2010; Tonk et al.
2013b). The current decline in coral reef cover resulting
from global (e.g. ocean warming) and local (e.g. pollu-
tion, overfishing) anthropogenic factors has intensified
the need to examine the spatial, geographical and eco-
logical distribution of Symbiodinium–coral associations
and how these relate to environmental extremes.
Various DNA markers have been used to describe
genetic diversity within Symbiodinium (Sampayo et al.
2009). Rowan & Powers (1991) were the first to examine
Symbiodinium evolutionary relationships using restric-
tion fragment length polymorphisms (RFLPs) of the
small ribosomal subunit RNA (SSU) gene from dinofla-
gellates from various marine invertebrate hosts. Their
phylogeny identified divergent lineages within this
genus, which exhibited sequence differences compara-
ble to those observed among dinoflagellates from differ-
ent taxonomic families and orders (Rowan & Powers
1992). These lineages are commonly referred to as
clades. So far, nine clades are identified (clades A–I), of
which representatives in six clades (i.e. A, B, C, D, F
and G) have been shown to persist in association with
corals, other cnidarians, giant clams and sponges (Baker
2003; Pochon et al. 2006). It was soon recognized that
the conserved SSU gene is not able to resolve species
(Rowan & Powers 1991; McNally et al. 1994; LaJeunesse
2001). Researchers turned to more variable DNA
regions, including the nuclear large subunit (LSU) (Wil-
cox 1998; Loh et al. 2001), the internal transcribed spacer
regions (Hunter et al. 1997; LaJeunesse 2001; van Oppen
et al. 2001), the chloroplast large subunit (cp23S) (Santos
et al. 2002; Pochon et al. 2006) and cytochrome oxidase
b (Sampayo et al. 2009). A systematic survey by Sam-
payo et al. (2009) targeting ribosomal, mitochondrial
and chloroplast genes employing 13 distinct genetic
analyses found that different markers showed remark-
able concordance, but differed in their relative ability to
resolve ecologically distinct units. Other rapidly evolv-
ing markers, including the chloroplast psbA noncoding
region (Moore et al. 2003; LaJeunesse & Thornhill 2011)
and microsatellites, were recently employed, often in
combination with each other, to improve genetic resolu-
tion further and delimit species boundaries (Thornhill
et al. 2014). Only recently, Barbrook et al. (2014)
sequenced the entire chloroplast genome of a Symbiodi-
nium sp. type C3, where individual genes reside on
minicircles that will provide additional genetic markers.
Currently, however, the ITS2 region is still the most
commonly employed DNA marker used to assess Sym-
biodinium diversity from a diverse array of hosts and
over large geographical distances (LaJeunesse et al.
2010; Wicks et al. 2010; Silverstein et al. 2011; Putnam
et al. 2012; Tonk et al. 2013a).
LaJeunesse (2002) determined that ITS2, when analy-
sed through targeting of numerically dominant intrage-
nomic variants, provides sufficient resolution to resolve
many ecologically distinct Symbiodinium spp. To achieve
this, denaturing gradient gel electrophoresis (DGGE)
was used to screen PCR amplifications for common
ITS2 sequence variants diagnostic of a particular Symbi-
odinium ‘type’ (LaJeunesse 2002; Sampayo et al. 2007;
LaJeunesse et al. 2010; Silverstein et al. 2011). More
recently, researchers have also employed bacterial clon-
ing and sequencing and found more sequence diversity
within the populations of Symbiodinium residing in a
host than identified with DGGE (Apprill & Gates 2007;
Stat et al. 2009, 2011, 2013). Because rDNA represents
an extreme example of a multicopy gene arrayed in tan-
dem, intragenomic variation in the form of pseudogenes
or numerous low-abundant functional variants affect
how ITS2 data are interpreted (Thornhill et al. 2007;
Sampayo et al. 2009; LaJeunesse & Thornhill 2011). For
instance, it has been shown that cloning-and-sequenc-
ing-based approaches are potentially prone to inflated
diversity estimates through the technique’s tendency to
recover intragenomic variants that are of low abun-
dance (i.e. limited diagnostic value), as well as by intro-
ducing additional sequence artefacts generated during
the PCR and cloning steps (Thornhill et al. 2007). How-
ever, sequencing a substantial number of clones may
resolve how rDNA data are best analysed and inter-
preted by allowing differentiation between intragenom-
ic and interspecific ITS2 sequence variants, albeit at a
high cost (Sampayo et al. 2009). Assessment has also
shown that individuals from different species possess
widely differing amounts of intragenomic variation
(Thornhill et al. 2007), yet the full extent of this varia-
tion is at present unknown. In both regards, the appli-
cation of pyrosequencing-based methods is projected to
overcome the limited resolution and high cost associ-
ated with Sanger-based ITS2 diversity assessments, as a
high number of sequences are produced at compara-
tively low cost per sequence.
While the study of prokaryotic diversity is now rou-
tinely conducted via pyrosequencing-based amplicon
typing of the 16S ribosomal RNA gene (Sogin et al.
2006; Roesch et al. 2007), only a limited number of stud-
ies have utilized high-throughput sequencing to assess
eukaryotic diversity. For instance, Stoeck et al. (2010,
2009) and Amaral-Zettler et al. (2009) sequenced the
variable regions of the small subunit (SSU) and large
subunit (LSU) of the 18S region to estimate eukaryotic
diversity.
Pyrosequencing is now being applied to assess Symbi-
odinium diversity (Green et al. 2014; Quigley et al. 2014;
Thomas et al. 2014), but there is a need to ground
truth this new approach. In this study, we applied
© 2014 The Authors. Molecular Ecology Published by John Wiley & Sons Ltd.
2 C. ARIF ET AL.
pyrosequencing of ITS2 rDNA amplicons (320–360 bp)
to genotype Symbiodinium diversity in several isoclonal
and replicated cultures, two cultured isolates mixed at
different ratios and field-collected coral specimens. The
application of a high-throughput pyrosequencing
approach holds the promise to improve assessment of
the relative degree of sequence variation found in
these eukaryotic genomes. Further, a pyrosequencing
approach may provide a more accurate detection of
low-abundance background Symbiodinium. Our aim was
to understand diversity of the ITS2 gene at the genome
level and to compare pyrosequencing results to data
obtained from DGGE typing. Furthermore, we sought to
analyse Symbiodinium diversity in an OTU-based frame-
work in order to improve objectivity, comparability and
simplicity when assessing ITS2 to study Symbiodinium
composition in environmental samples of corals.
Materials and methods
Sample collection and processing
Isoclonal cultures of Symbiodinium sp. (CCMP2467: Sym-
biodinium microadriaticum, KB8: S. microadriaticum, rt-147:
undescribed clade B type and rt-064: undescribed B1
type) were cultured at 23 °C in f/2 medium (Guillard
& Ryther 1962) on a 12 h/12 h light–dark cycle (day-
time: 6 am to 6 pm; night-time: 6 pm to 6 am, light
intensity 80 lmol/m2/s). The salt content in the med-
ium was set to 40 g/L, matching the average salinity
characteristic of the Red Sea. Coral samples were col-
lected from various reefs in the Red Sea between 2011
and 2012 with SCUBA at depths between 4 and 12 m.
More specifically, five specimens of Pocillopora verrucosa
were collected from reefs at Maqna (n = 2), Al Wajh
(n = 2) and Doga (n = 1) as well as one specimen of
Acropora hemprichii from Al Fahal reef at Thuwal. Speci-
mens of about 1–3 cm2 tissue were collected with ham-
mer and chisel and stored in Whirl-Paks during diving,
subsequently washed with 0.22-lm-filtered sea water
(FSW), preserved in DMSO/NaCl buffer (Gaither et al.
2010) and stored at 4 °C until further processing. For
Symbiodinium culture DNA extraction, cells from each
culture were counted using a haemocytometer (Hausser
Scientific, Horsham, PA) under a light microscope (Leica
DM2500, Wetzlar, Germany), and ~8 9 106 cells per cul-
ture were used for DNA extraction. Mixed samples were
generated by combining cells of two Symbiodinium spe-
cies (a strain of S. microadriaticum CCMP2467 from clade
A and strain rt-147 from clade B) in a ratio of 1:1
(4 9 106 cells : 4 9 106 cells) and in a ratio of 1:3
(2 9 106 cells : 6 9 106 cells), respectively. Cells were
spun at 1934 g for 10 min and subsequently washed
with DNase-free water. Five hundred microlitres of
0.5-mm sterile glass beads (BioSpec, Bartlesville, OK)
was added to the pelleted cells together with 400 lL of
buffer AP1 and 4 lL RNAse (Qiagen, Hilden, Germany).
Samples were bead-beaten for 90 s with a Tissue Lyser II
(Qiagen). DNA was isolated with the Qiagen DNeasy
Plant Mini Kit (Qiagen) according to the manufacturer’s
instructions. For the analysis of technical variation, DNA
from isoclonal cultures of CCMP2467 and rt-147 was iso-
lated once but amplified in distinct PCRs with a different
barcoded primer. For DNA extraction of environmental
samples, ~50 mg of coral tissue was transferred to 1.5-
mL tubes (Eppendorf, Hamburg, Germany). Five hun-
dred microlitres of 0.5-mm sterile glass beads (BioSpec)
was added together with 400 lL of buffer AP1 and 4 lLRNAse (Qiagen). Samples were bead-beaten for 90 s
with a Tissue Lyser II (Qiagen). DNA was isolated with
the Qiagen DNeasy Plant Mini Kit (Qiagen) according to
the manufacturer’s protocol.
DGGE analysis of Symbiodinium ITS2 rDNA
DGGE ITS2 diversity typing was performed following
the protocol detailed in LaJeunesse (2002). Briefly, the
Symbiodinium ITS2 region was amplified with the primer
pair ITSintfor2 and ITS2CLAMP using PCR conditions
described in LaJeunesse et al. (2003) with the following
modifications: the annealing temperature was main-
tained at 52 °C for 27 cycles after 20 cycles of touch-
down amplification. PCR products were mixed with
10 lL Ficoll-based loading buffer and concentrated by a
speed vacuum before loading on an 8% polyacrylamide
gel using a Cipher DGGE kit (CBS Scientific Company,
Del Mar, CA). Gels were run at 150 V for 15 h, stained
for 30 min with 19 SYBR Green (Invitrogen, Carlsbad,
CA) and visualized on a Dark Reader Transilluminator
(Clare Chemical Research, Dolores, CO). Prominent
band(s) were excised from the DGGE gel with a sterile
scalpel. Each band was transferred into an Eppendorf
tube that contained 500 lL DNase-free water and incu-
bated at 4 °C for 24 h. Two microlitres of this were used
for reamplification as described in LaJeunesse (2002)
and purified with Illustra ExoStar (SelectScience, Bath,
UK) enzyme mix following the manufacturer’s instruc-
tions. Successful amplification was verified by running
products on a 1% agarose gel stained with 19 SYBR
Safe (Invitrogen). Samples were sent for bidirectional
Sanger sequencing at the KAUST BioScience Core Labo-
ratory (Thuwal, Saudi Arabia). Sequences were pro-
cessed in CodonCode Aligner (CodonCode Corporation,
Centerville, MA). After quality trimming, forward and
reverse sequences were assembled into contigs. For
phylogenetic assignment of ITS2 sequences, we built a
custom BLAST database (File S1, Supporting informa-
tion) of ITS2 types collected from 409 ITS2 sequences
© 2014 The Authors. Molecular Ecology Published by John Wiley & Sons Ltd.
NEXT- GENERATION SEQUENCING OF SYMBIODINIUM ITS2 3

taken from GeoSymbio (Franklin et al. 2012) (denoted
as GS), 7 ITS2 sequences from Scott Santos’
database (www.auburn.edu/~santosr/sequencedatasets.
htm) (denoted as ST) and 17 DGGE ITS2 sequences
from Todd LaJeunesse’s SD2-GED database (https://
131.204.120.103/srsantos/symbiodinium/sd2_ged/data-
base/views.php) denoted as LJ. ITS2 sequences were
assigned to the ITS2 types that represented highest
identity in the BLASTN hits.
454 pyrosequencing of Symbiodinium ITS2 rDNA
PCR amplification of the ITS2 gene for pyrosequencing
was performed using primers ITSintfor2 and ITS2-
reverse that generated an amplicon of around 320 bp.
The primer sequences were 50- CCATCTCATCCCTGCG-
TGTCTCCGACTCAG(N)8GAATTGCAGAACTCCGTG-30
(454-ITSintfor2) and 50- CCTATCCCCTGTGTGCCTTGG-
CAGTCTCAGGGGATCCATATGCTTAAGTTCAGCGG-
GT-30 (454-ITS2-reverse). Primers included 454 Lib-L
library adapters (underlined) and a barcode (shown as
N) (Hamady et al. 2008). PCRs were run in triplicate
per sample with 12.5 lL of Qiagen Multiplex PCR Kit
(Qiagen), 0.1 lM primers, 20–50 ng DNA and DNase-
free water to make a total volume of 25 lL. The follow-
ing PCR conditions were used: initial denaturation for
15 min at 94 °C, followed by 35 cycles of 94 °C for 30 s,
51 °C for 30 s, 72 °C for 30 s and a final extension step
of 10 min at 72 °C. PCR products were run on a 1%
agarose gel stained with 19 SYBR Safe (Invitrogen) to
visualize successful amplification. For each sample, trip-
licate PCR products were pooled, and their DNA
concentrations were measured using a Qubit 2.0 (Invi-
trogen). Twenty nanograms of the triplicated PCR sam-
ples from all specimens was combined and ran on a 1%
agarose gel to remove excess primers. The gel band was
excised, purified with the Qiagen MinElute Gel Extrac-
tion Kit (Qiagen) according to the manufacturer’s
instructions, quantified with Qubit 2.0 (Invitrogen) and
quality checked via Bioanalyzer (Agilent, Santa Clara,
CA). Forty nanograms of this pooled library (i.e. pooled
triplicated PCRs from all samples) was submitted to
KAUST BioScience Core Laboratory for sequencing
using Titanium FLX chemistry on a quarter of a picoti-
ter plate. Raw sequencing data were retrieved with
Roche 454 amplicon-processing pipeline.
454 pyrosequencing data analysis
A total of 218 475 reads with a median length of 314 bp
were obtained from sequencing and processed using
the software MOTHUR version.1.31.2 (Schloss et al. 2009).
Sequences were denoised using PyroNoise (Quince et al.
2011). Forward primer and barcode sequence were
removed from reads by the trim.seqs function in
mothur. All sequences that met the following criteria
were discarded: barcodes (>0 mismatches), forward
primer (>2 mismatches), ambiguities (>0 bp), homo-
polymers (>4 bp) and short sequence length (<250 bp).
CUTADAPT version 1.1 (Martin 2011) was applied to
remove the reverse primer (overall error rate set to
0.15). All identical sequences were subsequently col-
lapsed, and representative sequences were retained via
unique.seqs command in mothur. After chimera
removal with UCHIME as implemented in mothur
(Edgar et al. 2011), singletons (i.e. sequences detected
only once across the entire data set) were also dis-
carded. A total of 197 181 sequences were retained for
the remainder of the analyses. From these data, fre-
quency distributions of ITS2 variants for all samples
were obtained via count.seqs command in mothur.
Genetic distances for within-culture ITS2 diversity were
calculated with the dist.seqs command in mothur based
on MUSCLE-aligned ITS2 copies that were represented
by at least 100 reads in any given isoclonal culture.
For the OTU-based framework analysis, ITS2
sequences were assorted into their respective clades
based on pairwise distances via pairwise.seqs com-
mand, and subsequent clustering with average neigh-
bour algorithm using a cut-off value of 0.15 (empirically
determined to effectively cluster sequences into clades).
Sequences assigned to distinct clades were aligned
using MUSCLE (Edgar 2004) and trimmed to equal
length using the screen.seqs and filter.seqs commands
in mothur. Sequences that were shorter than 90% of
sequences in each clade were discarded, resulting in
197 128 sequences. A distance matrix was calculated
using the aligned sequences within each clade.
Sequences were clustered with the average neighbour
algorithm (Schloss & Westcott 2011) at a 97% similarity
cut-off, as this cut-off clustered ITS2 variants from isocl-
onal cultures into a single OTU (i.e. species). The most
abundant sequence in each OTU was chosen as the rep-
resentative ITS2 copy and was annotated via BLASTN
against the custom ITS2 database to determine a specific
Symbiodinium type. In addition, the most abundant ITS2
copy from each pyrosequenced sample was aligned to
the sequence derived from the most prominent DGGE
band of the same sample to verify whether they were
identical. A list of succession of commands and an
unattended script are available as supplementary infor-
mation (Files S2 and S3).
Single-cell PCRs on Symbiodinium cells
To conduct single-cell PCRs on Symbiodinium, we devel-
oped an approach modified from Frommlet & Iglesias-
Rodr�ıguez (2008). Cells from cultures CCMP2467, KB8,
© 2014 The Authors. Molecular Ecology Published by John Wiley & Sons Ltd.
4 C. ARIF ET AL.

rt-064 and rt-147 were harvested with the following
changes: 1 mL of each culture was filtered through a
40-lm cell strainer (BD Biosciences, San Jose, CA), spun
down at 1934 g for 10 min and washed 3 times with
1 mL of 19 TE buffer. Cell pellets were subsequently
resuspended with 500 ll of 19 TE, counted using a
haemocytometer (Hausser Scientific) and diluted to a
concentration of 1 cell/lL (‘dilution-to-extinction’
approach). One microlitre was subsequently transferred
into wells of 96-well plates, and the presence of single
cells was confirmed using an inverted microscope (Le-
ica DMI3000B). Cells were disrupted by triplicate freez-
ing of cells for 2 min in liquid nitrogen and immediate
thawing for 2 min at 95 °C. Next, a single 0.5-mm glass
bead (BioSpec) was added to each well, and the cell
was homogenized with a Tissue-Lyzer II (Qiagen) for
1 min. PCR master mix containing 12.5 lL Qiagen Mul-
tiplex PCR Kit, 0.1 lM of ITSintfor2 and ITS2-reverse
(LaJeunesse 2002) and DNase-free water was added to
make a total volume of 25 lL. PCR conditions were
identical to the conditions used for 454 sequencing.
Subsequently, 1 lL of the PCR product was used as
template in a 25 lL clade-specific PCR containing
12.5 lL Qiagen Multiplex PCR Kit, DNase-free water,
0.1 lM of degenerated reverse primer (50- TCWC
YTGTCTGACTTCATGC-30) and 0.1 lM of clade A (50-TGGCACTGGCATGC-30)-, B (50- ATTGCTGCTTCGCTTT
CC-30)- or C (50- TGCTTAACTTGCCCCAAC-30)-specificforward primers generating 100, 180 and 210 bp ampli-
cons, respectively. PCR conditions were 94 °C for 15 min
followed by 35 cycles of 30 s at 94 °C, 30 s at 53 °C and
30 s at 72 °C and a final step of 10 min at 72 °C. Ampli-
cons were checked on a 1% agarose gel, cloned with
Invitrogen TOPO-TA cloning kit and sent for Sanger
sequencing to the KAUST BioScience Core Laboratory.
CodonCode Aligner (CodonCode Corporation, Center-
ville, MA) was used to process sequences and annotated
via BLASTN using the local Symbiodinium ITS2 database.
Results
Sequence variation among ITS2 copies in the genomesof Symbiodinium
We applied 454-based amplicon sequencing of the ITS2
rDNA region from Symbiodinium to a collection of repli-
cated isoclonal cultures (n = 7), pooled cultures (n = 2)
and environmental samples (n = 6) (Table 1). A total of
218 475 reads were obtained from pyrosequencing with
a median length of 314 bp (mean length = 323.11 �32.61 SD). After filtering of sequences, 197 181 reads
were retained with an average of 13 145.40 sequences
per sample, representing 1487 unique ITS2 sequences
(Table 1, File S4, Supporting information).
Depending on the taxon investigated, we identified
between 102 and 331 distinct ITS2 sequence variants,
including cultured strains and field-collected specimens
(mean = 219.67). Taking only isoclonal culture samples
into account, we identified on average 230.86 ITS2
sequence variants per culture, indicating that there is a
substantial number of distinct ITS2 sequence variants
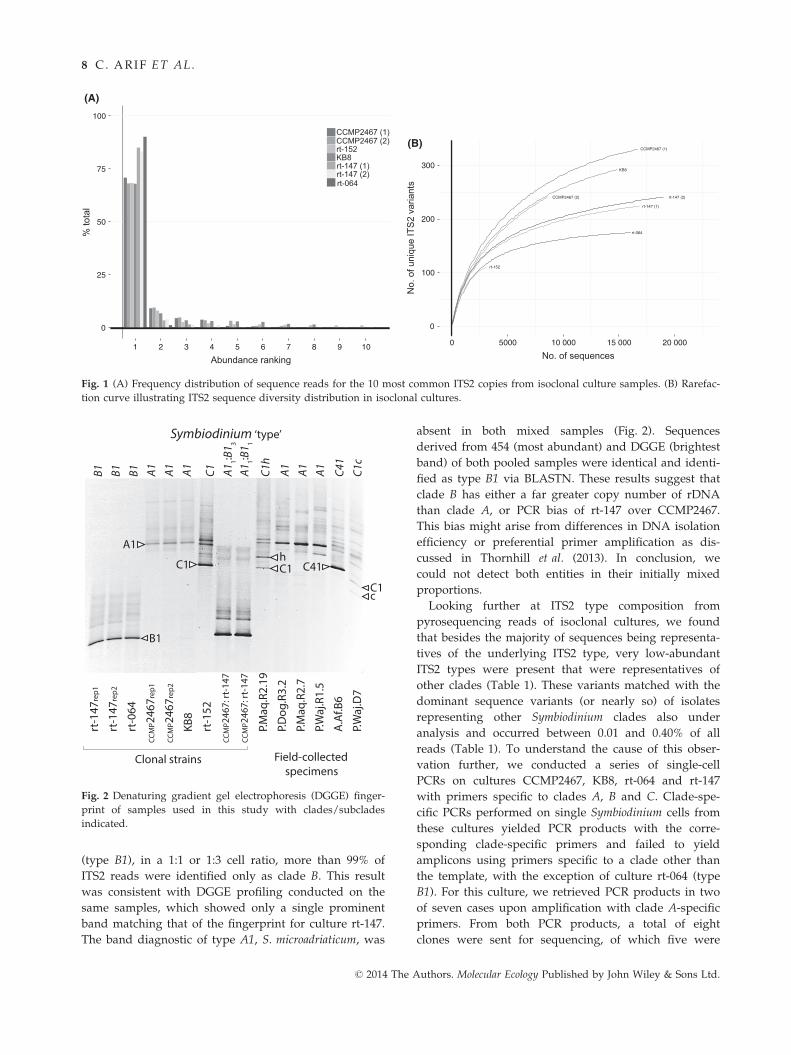
found within Symbiodinium genomes (Table 1). Despite
the high number of distinct ITS2 copies, read counts for
the different ITS2 copies showed a highly uneven distri-
bution (Fig. 1A). When sorting ITS2 variants of isoclo-
nal cultures by sequence read abundance, the most
abundant ITS2 copies were on average ~20 times more
prevalent than the second most common ITS2 copy (all
clades: 21.84-fold, clade A’s: 8.25-fold, clade B’s: 39.88-
fold, clade C’s: 8.49-fold). Further, the five most abun-
dant ITS2 copies from any culture made up >80% of
associated reads, indicating that only few distinct ITS2
genes make up the majority of genomic gene copies.
This was substantiated by a rarefaction analysis, which
indicated that most of the numerous ITS2 copies were
captured at very low abundance in each genome
(Fig. 1B). For instance, subsampling of isoclonal cultures
to 2000 reads yielded on average less than half of the
distinct ITS2 copies we were able to recover taking all
sequence reads into account. Additionally, the rarefac-
tion curves at this sampling depth did not approach
saturation. This effectively illustrates that intragenomic
diversity lies in low-abundant genomic ITS2 copies,
which also seems to far exceed what could be captured
by ‘traditional’ sequencing methods. Comparison of py-
rosequencing data of culture CCMP2467 (type A1) with
25 sequences generated by cloning and sequencing
showed that both techniques identified the same most
dominant sequence, but numerical ranking of the next
most common sequences did not particularly match up
well between cloning and 454 data (not shown). Com-
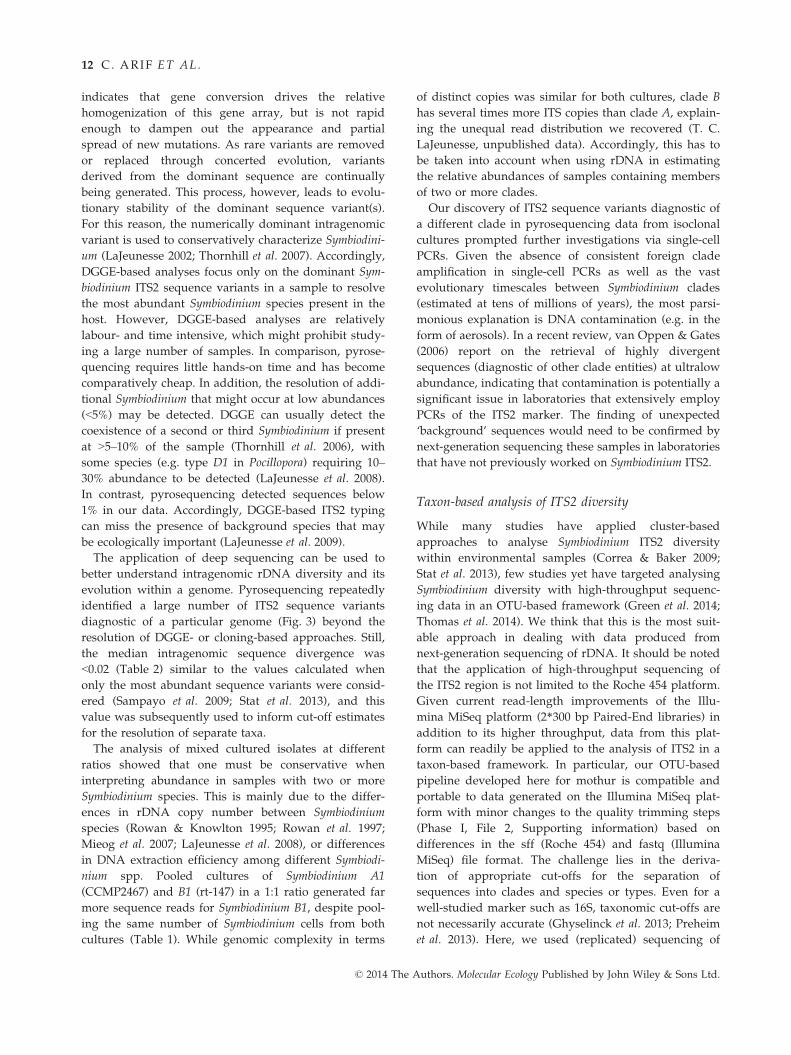
paring pyrosequencing data to DGGE fingerprinting of
isoclonal Symbiodinium cultures, DGGE yielded a single
dominant band accompanied by few, faint, background
bands. The dominant ITS2 variants produced by 454
pyrosequencing (numerically abundant) and DGGE
(brightest band) were identical in sequence and were
representative sequences of the Symbiodinium type anal-
ysed (Table 1, Fig. 2). Accordingly, 454 pyrosequencing,
cloning and sequencing and DGGE produced uniform
results in regard to identifying the ITS2 variants most
representative of the genome.
To further assess levels of intragenomic ITS2 diver-
sity, we calculated uncorrected genetic distances
between all ITS2 variants of a given isoclonal culture
(Table 2). For each sample, we only considered ITS2
types represented by at least 100 reads. This was done
to avoid diversity inflation by potential contamination,
© 2014 The Authors. Molecular Ecology Published by John Wiley & Sons Ltd.
NEXT- GENERATION SEQUENCING OF SYMBIODINIUM ITS2 5

Table
1Sym
biodinium
ITS2pyrosequen
cing
overview.Dep
icted
areclad
etypes
(when
cultureswereused),
theresp
ectivean
imal
host
and
collection
site,an
dDGGE
typing
resu
lts(based
onthebrightest
ban
d).ForITS2pyrosequen
cingdata,
thetotalnumber
ofsequen
ceread
s(after
filtering)an
dthenumber
ofdistinct
ITS2copiesforeach
sample
areprovided
.Seq
uen
ceread
sforeach
sample
arefurther
assigned
toclad
etypes
detailingnumber
ofsequen
ceread
s,number
ofdistinct
ITS2copieswithin
clad
esan
dclad
e
typeofthemost
abundan
tITS2copy.In
caseswheretheclad
etypeofthemost
abundan
tITS2copyis
differentfrom
thedatab
asesequen
ce,thepercentageiden
tity
isindicated
.
Incaseswheretherearetw
oormore
equally
abundan
tITS2copies,
allclad
etypes
areindicated
Culture
orSam
ple
nam
e
Clade
type
Anim
alHost
andCollection
Site
DGGE
typing
ITS2
pyrosequen
cing
Seq
uen
cesassigned
toclad
eA
Seq
uen
cesassigned
toclad
eB
Seq
uen
cesassigned
toclad
eC
No.of
sequen
ces
No.of
distinct
ITS2
copies
No.of
sequen
ces
No.of
distinct
ITS2
copies
Clade
typeof
most
abundan
t
ITS2copy
No.of
sequen
ces
No.of
distinct
ITS2
copies
Clade
typeof
most
abundan
t
ITS2copy
No.of
sequen
ces
No.of
distinct
ITS2
copies
Clade
typeof
most
abundan
t
ITS2copy
Isoclonal
Cultures
CCMP2467
(1)
A1
Stylophora
pistillata,Gulf
ofAqab
a
A1
16681
331
16589
309
A1
265
B1
6617
C1
CCMP2467
(2)
A1
Stylophora
pistillata,Gulf
ofAqab
a
A1
8565
241
8537
229
A1
144
B1
148
C1;
C1h
KB8
A1
Cassiopea
xamachana,
Haw
aii
A1
14894
292
14882
286
A1
94
B1
32
C41 (99.65%)
rt-147
(1)
B1
Pseudoterogorgia
bipinnata,
Jamaica
B1
16843
225
63
A1
16837
222
B1
0—
—
rt-147
(2)
B1
Pseudoterogorgia
bipinnata,
Jamaica
B1
18989
241
0—
—18
989
241
B1
0—
—
rt-064
B1
Cassiopea
xamachana,
Jamaica
B1
16042
175
21
A1
16040
174
B1
0—
—
rt-152
C1
Discosoma
sanctithomae,
Jamaica
C1
3116
111
11
A1 (99.61%)
114
B1
3104
106
C1
Pooled
Cultures
CCMP2467
:
rt-147
(1:1)
A1:B1
Pooledcu
ltures
CCMP2467:rt-
147(1:1)
B1
15234
233
100
12A1
15134
221
B1
0—
—
CCMP2467
:
rt-147
(1:3)
A1:B1
Pooledcu
ltures
CCMP2467:rt-
147(1:3)
B1
14915
223
187
A1
14897
216
B1
0—
—
Field-
collected
Coral
specim
ens
P.D
og.R3.2
—Pocillopora
verrucosa,
Doga,
Red
Sea
A1
22733
299
22724
297
A1
71
B1
21
C1 (99.29%)
P.M
aq.R2.19
—P.verrucosa,
Maq
na,
Red
Sea
C1h
3683
142
4112
A1
303
B1
3612
127
C1
© 2014 The Authors. Molecular Ecology Published by John Wiley & Sons Ltd.
6 C. ARIF ET AL.

methodological artefacts or ultralow-abundant ITS2 cop-
ies. The resulting median genetic distance between ITS2
copies from isoclonal cultures was in all cases below
0.02, and median intragenomic variation ranged from
0.003 to 0.017 (Table 2). Therefore, most sequence vari-
ants within any culture differed by only one or two
nucleotide substitutions from each other.
The reproducibility of pyrosequencing rDNA varied
depending on the scale of comparison. In some cases,
different tallies of distinct ITS2 copies were calculated
between the sequencing of different PCR amplifications
conducted from the same DNA extract. Our replicated
analysis of culture CCMP2467 recovered 331 and 241
distinct ITS2 sequences from 16 681 and 8565 sequence
reads, respectively. Of these ITS2 sequences, 184 were
identical (55.59 and 76.35%, respectively). Repeated
sequencing of the culture rt-147 was less variable and
retrieved 225 and 241 distinct ITS2 variants at a compa-
rable sequencing depth, of which 168 were identical
(74.67 and 69.71%, respectively) (Table 1). The compari-
son between the top 10 most abundant sequence
variants showed consistency, but there were some
discrepancies between replicated samples (Fig. 3).
Sequence variants that represented 2–3% of the total
variation were typically recovered between replicates,
but not always in the same relative abundance. The top
three most common sequences, however, were always
recovered, and in the same order of abundance between
replicates (Fig. 3). To further elucidate this pattern, the
top 10 most common variants from pyrosequencing
ITS2 of culture rt-152 (Symbiodinium goreaui or type C1)
were compared to the composition of top 10 variants
identified from several field-collected samples repre-
senting clade C Symbiodinium, including types C1c, C1h
and C41 (Fig. 4). For each of these samples, there were
one to five common sequence variants representing
>5% of sequence reads for the respective specimen.
Each sequence set contained the C1 sequence, sensu
LaJeunesse (2001), but in very different proportions.
The C1 sequence comprised 68.36% of the genome of
S. goreaui (rt-152 or type C1), 34.00% for type C1c
(P.Waj.D7), 34.08% for type C1 h (P.Maq.R2.19) and
11.82% in type C41 (A.Af.B6). These proportions were
similar to the relative band intensities observed from
their respective DGGE fingerprint profile (Fig. 2). The
‘c’ sequence found in codominance with C1 (19.95% vs.
34.00%) in the ribosomal array of Symbiodinium type
C1c also was detected in two other types (C1h and C1)
at significantly lower concentrations and explains
why this sequence variant was not resolved by DGGE
fingerprinting (Fig. 2).
Among sequences recovered from PCRs of
DNA extracted from the artificially mixed cultures,
CCMP2467 (S. microadriaticum or type A1) and rt-147Table
1Continued
Culture
orSam
ple
nam
e
Clade
type
Anim
alHost
andCollection
Site
DGGE
typing
ITS2
pyrosequen
cing
Seq
uen
cesassigned
toclad
eA
Seq
uen
cesassigned
toclad
eB
Seq
uen
cesassigned
toclad
eC
No.of
sequen
ces
No.of
distinct
ITS2
copies
No.of
sequen
ces
No.of
distinct
ITS2
copies
Clade
typeof
most
abundan
t
ITS2copy
No.of
sequen
ces
No.of
distinct
ITS2
copies
Clade
typeof
most
abundan
t
ITS2copy
No.of
sequen
ces
No.of
distinct
ITS2
copies
Clade
typeof
most
abundan
t
ITS2copy
P.M
aq.R2.7
—P.verrucosa,
Maq
na,
Red
Sea
A1
18331
247
18224
230
A1
393
B1
6814
C1
P.W
aj.R1.5
—P.verrucosa,Al
Wajh,Red
Sea
A1
20284
297
20080
282
A1
198
14B1
61
C1h (98.57%)
P.W
aj.D
7—
P.verrucosa,Al
Wajh,Red
Sea
C1c
3579
136
3813
A1
335
B1
3508
118
C1
A.A
f.B6
—Acropora
hemprichii,Al
Fah
alReef,
Red
Sea
C41
3292
102
43
A1
254
B1
3263
95C41
© 2014 The Authors. Molecular Ecology Published by John Wiley & Sons Ltd.
NEXT- GENERATION SEQUENCING OF SYMBIODINIUM ITS2 7
(type B1), in a 1:1 or 1:3 cell ratio, more than 99% of
ITS2 reads were identified only as clade B. This result
was consistent with DGGE profiling conducted on the
same samples, which showed only a single prominent
band matching that of the fingerprint for culture rt-147.
The band diagnostic of type A1, S. microadriaticum, was
absent in both mixed samples (Fig. 2). Sequences
derived from 454 (most abundant) and DGGE (brightest
band) of both pooled samples were identical and identi-
fied as type B1 via BLASTN. These results suggest that
clade B has either a far greater copy number of rDNA
than clade A, or PCR bias of rt-147 over CCMP2467.
This bias might arise from differences in DNA isolation
efficiency or preferential primer amplification as dis-
cussed in Thornhill et al. (2013). In conclusion, we
could not detect both entities in their initially mixed
proportions.
Looking further at ITS2 type composition from
pyrosequencing reads of isoclonal cultures, we found
that besides the majority of sequences being representa-
tives of the underlying ITS2 type, very low-abundant
ITS2 types were present that were representatives of
other clades (Table 1). These variants matched with the
dominant sequence variants (or nearly so) of isolates
representing other Symbiodinium clades also under
analysis and occurred between 0.01 and 0.40% of all
reads (Table 1). To understand the cause of this obser-
vation further, we conducted a series of single-cell
PCRs on cultures CCMP2467, KB8, rt-064 and rt-147
with primers specific to clades A, B and C. Clade-spe-
cific PCRs performed on single Symbiodinium cells from
these cultures yielded PCR products with the corre-
sponding clade-specific primers and failed to yield
amplicons using primers specific to a clade other than
the template, with the exception of culture rt-064 (type
B1). For this culture, we retrieved PCR products in two
of seven cases upon amplification with clade A-specific
primers. From both PCR products, a total of eight
clones were sent for sequencing, of which five were
0
25
50
75
100
1 2 3 4 5 6 7 8 9 10
Abundance ranking
% to
tal
CCMP2467 (1)CCMP2467 (2)rt-152KB8rt-147 (1)rt-147 (2)rt-064
CCMP2467 (2)
rt-152
KB8
rt-147 (1)
rt-147 (2)
rt-064
0
100
200
300
0 5000 10 000 15 000 20 000
No. of sequences
No.
of u
niqu
e IT
S2
varia
nts
CCMP2467 (1)(B)
(A)
Fig. 1 (A) Frequency distribution of sequence reads for the 10 most common ITS2 copies from isoclonal culture samples. (B) Rarefac-
tion curve illustrating ITS2 sequence diversity distribution in isoclonal cultures.
A1
B1
rt-1
47re
p1
rt-1
47re
p2
rt-0
64
CCM
P246
7rep
1
CCM
P 246
7rep
2
KB8
B1B1 B1 A1A1 A1
Symbiodinium ‘type’
rt-1
52
P.Maq
.R2.
19
P.Dog
.R3.
2
P.Maq
.R2.
7
P.Waj
.R1.
5
A.A
f.B6
P.Waj
.D7
C1 A11:B
1 3
C1h
A1A1 A1 C41
C1c
A11:B
1 1
C1h
c
C1
C1
C41
Clonal strains Field-collected specimens
CCM
P246
7: rt
-147
CCM
P246
7: rt
-147
Fig. 2 Denaturing gradient gel electrophoresis (DGGE) finger-
print of samples used in this study with clades/subclades
indicated.
© 2014 The Authors. Molecular Ecology Published by John Wiley & Sons Ltd.
8 C. ARIF ET AL.

identical to the identified clade B1 in 454 sequences and
three were discarded due to reduced quality.
Taxon-based analysis of Symbiodinium ITS2 diversityin isoclonal cultures
Studies of microbial diversity in an OTU framework
based on pyrosequencing of the 16S rRNA gene have
revolutionized our understanding of bacterial diversity
and distribution (Sogin et al. 2006). Similarly, the ITS2
gene is amenable to analysis in a taxon-based frame-
work under the premise of derivation of appropriate
cut-offs to denoting clades and species/types. Given the
deep divergence between Symbiodinium species from
different clades (comparable to differences between
orders in other dinoflagellates), we had to devise a
strategy where taxonomic delineation was conducted
on the clade level first and subsequently at the type
level.
Clade separation was empirically determined by pair-
wise similarity calculation of all sequences and subse-
quent clustering using a similarity cut-off of >0.10. Thisapproach consistently clustered reads into different
clades, which was confirmed by BLASTing representa-
tives of each cluster against our custom ITS2 database.
As mothur calculates exact distance cut-offs, the next
higher distant cut-off from 0.10 was chosen for data
analysis (here: 0.15). After aligning, trimming and dis-
carding sequences that were shorter than 90% of the
reads in each clade, 197 128 sequences remained, of
which 101 239 sequences belonged to clade A, 82 273
belonged to clade B, and 13 616 sequences belonged to
clade C (Table 3).
For the determination of species- or type-level cut-
offs, we used data from isoclonal cultures. Our aim
was to determine a cut-off that effectively clustered all
reads from culture samples assorted to a clade (step
above) into one corresponding OTU at the ‘species’
level. Average neighbour clustering of reads based on
uncorrected pairwise distances at 0.03 provided the
cut-off where all cultures collapsed into one OTU for
a given clade (Table 3). Therefore, 97% sequence simi-
larity was implemented as a cut-off value for species/
type-level OTU-based analyses within clades. Compar-
ing results from sequence- (Table 1) and OTU-based
(Table 3) analyses effectively illustrates that the high
number of distinct ITS2 copies that we identified in
isoclonal culture samples could be collapsed to within-
species (i.e. within OTU0.03) ITS2 variation in a taxon-
based analysis. Three distinct OTUs0.03 (1 of each
clade A, B and C) represented data from all cultures.
For the pooled culture samples, two OTUs0.03 were
Table 2 Intragenomic diversity of ITS2 genes in isoclonal cultures (only ITS2 copies represented by at least 100 reads were consid-
ered). Differences are calculated as uncorrected pairwise distances between aligned DNA sequences. The difference between the min-
imum and maximum genetic distance of ITS2 variants within cultures can be used to derive a similarity cut-off for an operational
taxonomic unit (OTU)-based framework, upon which intragenomic diversity is contained within a given OTU
Symbiodinium
culture
Symbiodinium
culture type
Mean uncorrected
genetic distance
Median uncorrected
genetic distance Minimum Maximum
Difference
(Max-Min)
CCMP2467 (1) A1 0.006 0.008 0.004 0.008 0.004
CCMP2467 (2) A1 0.006 0.008 0.004 0.008 0.004
KB8 A1 0.013 0.008 0.004 0.031 0.027
rt-147 (1) B1 0.005 0.003 0.003 0.007 0.003
rt-147 (2) B1 0.017 0.017 0.003 0.031 0.027
rt-064 B1 0.003 0.003 0.003 0.003 0.000
rt-152 C1 0.003 0.003 0.003 0.003 0.000
*
*
*
*
Rep 1 Rep 2
(A) (CCMP2467)
Rep 1 Rep 2
(B) (rt-147)
*
*
*
* *
*
*
Fig. 3 Reproducibility of pyrosequencing rDNA variants for
replicated PCRs (using the same DNA extract) of isoclonal cul-
tures (A) CCMP2467 and (B) rt-147 taking the top 10 most
abundant sequence variants into account. The sizes of the
circles represent relative abundance; circles with an asterisk
represent distinct ITS2 variants.
© 2014 The Authors. Molecular Ecology Published by John Wiley & Sons Ltd.
NEXT- GENERATION SEQUENCING OF SYMBIODINIUM ITS2 9

correctly identified, but the relative abundances of
reads did not reflect the initial ratio of cells used.
Accordingly, while diversity was correctly recovered
for cells from pooled isoclonal cultures, the relative
abundances were not.
Taxon-based analysis of ITS2 diversity inenvironmental samples
We applied our OTU-based framework to analyse
ITS2 diversity in environmental samples based on the
(B) (C1c)
(C1h)
3
4
6
9
C1
1h
1 change
3
5
6
9
4
1c
5
10
C18
7
8
(A)
(D)(C)
(C1)
1b
10
6
4
8
5
9
27
1c
C1
1c
C1
C41
3
4
5
6
7
9
10
1b
(C41)
3
1
1
2
10
7
1
1
2
2
Fig. 4 Comparison of top 10 most com-
mon variants found from pyrosequencing
ITS2 from (A) culture rt-152 (Symbiodini-
um goreaui or type C1) and several field-
collected samples representing clade C
Symbiodinium: (B) C1c (sample P.Waj.D7),
(C) C1h (sample P.Maq.R2.19) and (D)
C41 (sample A.Af.B6). The size of the cir-
cles represents relative abundance, and
numbers in circles represent order of dis-
tinct ITS2 variants for a given sample.
Shared ITS2 variants are depicted in a
black outer circle representing ITS2 type
C1, and a grey outer circle representing
ITS2 subtype c.
Table 3 Symbiodinium ITS2 OTU-based analysis overview. Depicted are samples used in this study and the designated clade type
based on DGGE typing. For ITS2 pyrosequencing data, the total number of sequence reads (after filtering and clade-based alignment)
and the number of OTUs at a 97% similarity cut-off for each sample are provided. Distribution of sequence reads over OTUs on a
clade basis and the ITS2 clade type most similar to an OTU are detailed. In cases where the OTU is different from the ITS2 clade
type database sequence, the percentage identity is indicated
Culture or
Sample name
DGGE
typing
ITS2
pyrosequencing Clade A OTUs Clade B OTUs Clade C OTUs
No. of
sequences
No. of
OTUs
No. of
sequences
OTU1A0.03
No. of
sequences
OTU2A0.03
No. of
sequences
OTU3A0.03
No. of
sequences
OTU1B0.03
No. of
sequences
OTU2B0.03
No. of
sequences
OTU1C0.03
Isoclonal
cultures
CCMP2467 (1) A1 16 681 3 16 589 0 0 26 0 66
CCMP2467 (2) A1 8565 3 8537 0 0 14 0 14
KB8 A1 14 891 3 14 879 0 0 9 0 3
rt-147 (1) B1 16 836 2 6 0 0 16 830 0 0
rt-147 (2) B1 18 987 1 0 0 0 18 987 0 0
rt-064 B1 16 042 2 2 0 0 16 040 0 0
rt-152 C1 3116 3 1 0 0 11 0 3104
Pooled
Cultures
CCMP2467:
rt-147 (1:1)
B1 15 231 2 100 0 0 15 131 0 0
CCMP2467:
rt-147 (1:3)
B1 14 911 2 18 0 0 14 893 0 0
Field-
collected
Coral
specimens
P.Dog.R3.2 A1 22 733 4 22 663 61 0 7 0 2
P.Maq.R2.19 C1h 3653 3 41 0 0 30 0 3582
P.Maq.R2.7 A1 18 327 6 18 146 70 4 31 8 68
P.Waj.R1.5 A1 20 284 4 20 080 0 0 143 55 6
P.Waj.D7 C1c 3579 3 38 0 0 33 0 3508
A.Af.B6 C41 3292 3 4 0 0 25 0 3263
ITS2 clade type A1 A1
(97.27%)
A13
(98.04%)
B1 B2 C1
© 2014 The Authors. Molecular Ecology Published by John Wiley & Sons Ltd.
10 C. ARIF ET AL.

cut-offs we derived from the isoclonal cultures (File S5,
Supporting information). Similar to the results for the
isoclonal culture samples, the amount of type-level
OTUs0.03 was dramatically lower than the number of dis-
tinct ITS2 copies. Diversity in environmental samples
was comprised of only six OTUs0.03 that represented
a total of 841 distinct ITS2 sequences, demonstrating that
taxon-based framework analyses drastically and effec-
tively reduce complexity and diversity of primary
sequence data. Of the six OTUs0.03 that we identified
across all environmental samples, three OTUs could
be assigned to clade A (referred to as OTU1A0.03,
OTU2A0.03 and OTU3A0.03), two OTUs to clade B
(referred to as OTU1B0.03 and OTU2B0.03) and one
OTU to clade C (referred to as OTU1C0.03) (Table 3).
OTU1A0.03, OTU1B0.03 and OTU1C0.03 were the most com-
mon ITS2 types representing >99% of all sequences for a
given clade. These OTUs were classified belonging to
Symbiodinium types A1, B1 and C1, each with 100%
sequence identity (Table 3). Interestingly, all environ-
mental samples were dominated by a single OTU0.03. At
the same time, all environmental samples comprised
more than one OTU, but the fraction of sequence reads
representing additional OTUs was low. This diversity
was not captured in the DGGE fingerprint. For instance,
DGGE fingerprinting of samples P.Dog.R3.2 and
P.Maq.R2.7 only showed association with Symbiodinium
A1. In our pyrosequencing data, although both sam-
ples were dominated by OTU1A0.03 representing clade
A1 (~99% of all reads), 0.27 and 0.38% of reads repre-
sented OTU2A0.03 and 0.02% of all reads from sample
P.Maq.R2.7 represented OTU3A0.03 (Table 3). Similarly,
while P.Maq.R2.19 was dominated by OTU1C0.03 in
pyrosequencing data (98.06% of sequence reads), it was
also associated with clade A1 (OTU1A0.03: 1.12%) and
clade B1 (OTU1B0.031: 0.82%). Finally, even though
P.Maq.R2.7 was the most diverse sample, it still could be
represented by only six OTUs, effectively demonstrating
how OTU-based analyses collapse the majority of genetic
diversity into intragenomic (i.e. within OTU) variation.
Comparing the OTU-based analysis to DGGE finger-
printing, we found that for the majority of samples, the
representative OTUs were identical to the Symbiodinium
ITS2 type derived from DGGE rDNA fingerprinting
when the most prominent band was sequenced. For
sample A.Af.B6, however, the most prominent DGGE
band was represented by ITS2 type C41. While this type
was also the most abundant pyrosequencing read in that
sample, C41 collapsed into a single OTU (i.e. OTU1C0.03)
with the C1 ITS2 type. Similarly, in some cases DGGE
fingerprinting identified ITS2 types that were not readily
identified as distinct OTUs from pyrosequencing data.
For instance, while P.Maq.R2.19 was primarily associ-
ated with clade C1 ITS2 type, it was also associated with
clade C1h based on the DGGE profile. Further, sample
P.Waj.D.7 showed an association with C1c in addition to
clade C1 in the DGGE profile. C1h and C1c were readily
detected in pyrosequencing data, but represented by/
collapsed to a single OTU (i.e. OTU1C0.03). This can be
attributed to a single-base pair difference between C1,
C41, C1h and C1c. From a taxon-based analysis point of
view, intergenomic divergence did not exceed intrage-
nomic divergence and accordingly could not be resolved
into distinct OTUs.
Discussion
Sequence variation among ITS2 copies in the genomesof Symbiodinium
We applied 454 pyrosequencing to analyse intra- and
intergenomic Symbiodinium rDNA diversity in order to
gain an in-depth perspective on the relative homogene-
ity of this high multicopy gene (Thornhill et al. 2007).
By utilizing isoclonal cultures, we further resolved the
degree of genomic homogeneity relative to abundance
of ITS2 sequence variants across the ribosomal array. In
addition, we extended sequencing resolution in
comparison with classical cloning-and-sequencing-based
approaches, and we were able to empirically derive cut-
offs for application of these types of data in a taxon-
based framework. Our analysis protocol was then
applied to environmental samples to assess overall fea-
sibility of the approach.
A concern regarding utilization of ITS2 genes for esti-
mating Symbiodinium diversity is the multicopy nature
of ribosomal DNA (LaJeunesse 2002). The genomes of
eukaryotes contain one to several numerically dominant
sequence variants (Dover 1986; Hillis & Dixon 1991;
LaJeunesse & Pinzon 2007). Species lineages of Symbiodi-
nium exist that have two or more codominant ITS2 cop-
ies that together are diagnostic of the species (Sampayo
et al. 2009). The rank abundance plot of ITS2 variants
from isoclonal samples (Fig. 1A) revealed that while
there seems to be extensive intragenomic variation in
ITS2 sequences, each genome was characterized (in
these particular examples) by the presence of one
numerically dominant ITS2 sequence. Provided that the
process of concerted evolution is correctly understood
(Dover 1986), common intragenomic variants persist in
the genomes among the individuals of a genetically
recombining population over long evolutionary time-
scales (Sampayo et al. 2009; Thornhill et al. 2014). The
number of ITS2 sequence variants follows a long-tail
abundance distribution with dominant variants (often
one or two) being present at high frequency and a high
number of rare variants at much lower frequencies
(Fig. 1). This disparity among intragenomic variants
© 2014 The Authors. Molecular Ecology Published by John Wiley & Sons Ltd.
NEXT- GENERATION SEQUENCING OF SYMBIODINIUM ITS2 11
indicates that gene conversion drives the relative
homogenization of this gene array, but is not rapid
enough to dampen out the appearance and partial
spread of new mutations. As rare variants are removed
or replaced through concerted evolution, variants
derived from the dominant sequence are continually
being generated. This process, however, leads to evolu-
tionary stability of the dominant sequence variant(s).
For this reason, the numerically dominant intragenomic
variant is used to conservatively characterize Symbiodini-
um (LaJeunesse 2002; Thornhill et al. 2007). Accordingly,
DGGE-based analyses focus only on the dominant Sym-
biodinium ITS2 sequence variants in a sample to resolve
the most abundant Symbiodinium species present in the
host. However, DGGE-based analyses are relatively
labour- and time intensive, which might prohibit study-
ing a large number of samples. In comparison, pyrose-
quencing requires little hands-on time and has become
comparatively cheap. In addition, the resolution of addi-
tional Symbiodinium that might occur at low abundances
(<5%) may be detected. DGGE can usually detect the
coexistence of a second or third Symbiodinium if present
at >5–10% of the sample (Thornhill et al. 2006), with
some species (e.g. type D1 in Pocillopora) requiring 10–
30% abundance to be detected (LaJeunesse et al. 2008).
In contrast, pyrosequencing detected sequences below
1% in our data. Accordingly, DGGE-based ITS2 typing
can miss the presence of background species that may
be ecologically important (LaJeunesse et al. 2009).
The application of deep sequencing can be used to
better understand intragenomic rDNA diversity and its
evolution within a genome. Pyrosequencing repeatedly
identified a large number of ITS2 sequence variants
diagnostic of a particular genome (Fig. 3) beyond the
resolution of DGGE- or cloning-based approaches. Still,
the median intragenomic sequence divergence was
<0.02 (Table 2) similar to the values calculated when
only the most abundant sequence variants were consid-
ered (Sampayo et al. 2009; Stat et al. 2013), and this
value was subsequently used to inform cut-off estimates
for the resolution of separate taxa.
The analysis of mixed cultured isolates at different
ratios showed that one must be conservative when
interpreting abundance in samples with two or more
Symbiodinium species. This is mainly due to the differ-
ences in rDNA copy number between Symbiodinium
species (Rowan & Knowlton 1995; Rowan et al. 1997;
Mieog et al. 2007; LaJeunesse et al. 2008), or differences
in DNA extraction efficiency among different Symbiodi-
nium spp. Pooled cultures of Symbiodinium A1
(CCMP2467) and B1 (rt-147) in a 1:1 ratio generated far
more sequence reads for Symbiodinium B1, despite pool-
ing the same number of Symbiodinium cells from both
cultures (Table 1). While genomic complexity in terms
of distinct copies was similar for both cultures, clade B
has several times more ITS copies than clade A, explain-
ing the unequal read distribution we recovered (T. C.
LaJeunesse, unpublished data). Accordingly, this has to
be taken into account when using rDNA in estimating
the relative abundances of samples containing members
of two or more clades.
Our discovery of ITS2 sequence variants diagnostic of
a different clade in pyrosequencing data from isoclonal
cultures prompted further investigations via single-cell
PCRs. Given the absence of consistent foreign clade
amplification in single-cell PCRs as well as the vast
evolutionary timescales between Symbiodinium clades
(estimated at tens of millions of years), the most parsi-
monious explanation is DNA contamination (e.g. in the
form of aerosols). In a recent review, van Oppen & Gates
(2006) report on the retrieval of highly divergent
sequences (diagnostic of other clade entities) at ultralow
abundance, indicating that contamination is potentially a
significant issue in laboratories that extensively employ
PCRs of the ITS2 marker. The finding of unexpected
‘background’ sequences would need to be confirmed by
next-generation sequencing these samples in laboratories
that have not previously worked on Symbiodinium ITS2.
Taxon-based analysis of ITS2 diversity
While many studies have applied cluster-based
approaches to analyse Symbiodinium ITS2 diversity
within environmental samples (Correa & Baker 2009;
Stat et al. 2013), few studies yet have targeted analysing
Symbiodinium diversity with high-throughput sequenc-
ing data in an OTU-based framework (Green et al. 2014;
Thomas et al. 2014). We think that this is the most suit-
able approach in dealing with data produced from
next-generation sequencing of rDNA. It should be noted
that the application of high-throughput sequencing of
the ITS2 region is not limited to the Roche 454 platform.
Given current read-length improvements of the Illu-
mina MiSeq platform (2*300 bp Paired-End libraries) in
addition to its higher throughput, data from this plat-
form can readily be applied to the analysis of ITS2 in a
taxon-based framework. In particular, our OTU-based
pipeline developed here for mothur is compatible and
portable to data generated on the Illumina MiSeq plat-
form with minor changes to the quality trimming steps
(Phase I, File 2, Supporting information) based on
differences in the sff (Roche 454) and fastq (Illumina
MiSeq) file format. The challenge lies in the deriva-
tion of appropriate cut-offs for the separation of
sequences into clades and species or types. Even for a
well-studied marker such as 16S, taxonomic cut-offs are
not necessarily accurate (Ghyselinck et al. 2013; Preheim
et al. 2013). Here, we used (replicated) sequencing of
© 2014 The Authors. Molecular Ecology Published by John Wiley & Sons Ltd.
12 C. ARIF ET AL.

isoclonal cultures representing clades A, B and C to bet-
ter understand inter- and intragenomic diversity and
empirically derive taxonomic cut-offs. Future studies
should sequence rDNA from additional cultures repre-
senting a diverse set of Symbiodinium species.
On the clade level, due to the large evolutionary dis-
tance in the genus Symbiodinium, ITS2 sequences from
different clades are difficult if not impossible to align
correctly. Accordingly, taxon-based framework analyses
will fail to separate ITS2 sequences into ecological and
evolutionarily discrete entities when sequences from all
clades are considered at the same time. Rather, it will
lead to exaggerated genetic distance estimates retrieved
from the alignment of nonhomologous DNA characters.
To resolve ITS2 types more accurately, we found that
sequences need to be separated into distinct clades first,
and a subsequent OTU-based analysis has to be carried
out for each clade separately. For our data, ITS2
sequences separated into clades upon applying a cut-off
value of 0.15. However, application of this cut-off to
ITS2 sequences from our database considering all clades
(i.e. A–I) did not correctly cluster ITS2 sequences into
all distinct clades (data not shown). This might be due
to difficulties in calculating pairwise similarities
between sequences when all subtypes of Symbiodinium,
for example A1, A2, A3 or B1, B2, B3 are present in one
data set. To separate ITS2 sequences into Symbiodinium
clade levels, we suggest manual binning upon determi-
nation of an appropriate similarity cut-off before con-
ducting OTU-based ITS2 type analyses (File S5,
Supporting information).
Similarly as for the separation of ITS2 reads into
clades, there is no a priori cut-off value that consistently
sorts ITS2 sequences into distinct species (Thornhill
et al. 2014). In fact, Symbiodinium species classification
should not be conducted using ITS2 sequence diver-
gence alone, as ITS2 may not consistently resolve spe-
cies. For instance, two distinct Symbiodinium lineages
that are not undergoing genetic exchange can have the
same ITS2 sequence (Thornhill et al. 2014). Accordingly,
a taxonomic cut-off value that clusters existent ITS2
variants into OTUs should be regarded as provisional,
pending subsequent analysis with independent and
more rapidly evolving markers. For this reason, group-
ing of ITS2 variants into provisional OTUs for the (ini-
tial) characterization and comparison of Symbiodinium
diversity seems a more feasible approach than trying to
definitely resolve ITS2 sequence differences into species.
As ITS2 rDNA is not a single-copy gene, a cut-off
value that clusters intragenomic ITS2 variants into a sin-
gle OTU might be indicated as a valid cut-off value. In
our data, clustering sequences from isoclonal cultures
assorted to clades with the average neighbour algorithm
(Schloss & Westcott 2011) at a pairwise genetic distance
cut-off of 0.03 collapsed intragenomic ITS2 variation
into a single OTU. For this reason, we adopted 0.03 as a
cut-off to determine Symbiodinium community composi-
tion from pyrosequencing data retrieved from field-
collected coral specimens. The application of this cut-off
to samples from coral host tissues resulted in only six
distinct OTUs describing Symbiodinium diversity,
despite numerous sequenced ITS2 variants. This pro-
vides an indication of how much of the variation we
sequenced might be attributable to actual intra- rather
than intergenomic diversity. Applying an OTU-based
approach to the analysis of coral symbiont diversity
suggests that most coral colonies appear to be domi-
nated by a single genetic entity (Sampayo et al. 2009;
Pettay et al. 2011; Baums et al. 2014; Thornhill et al.
2014). However, ITS2 sequences of types C1, C1h, C1c
and C41 were represented by the same OTU at a 0.03
cut-off underscoring the difficulties that are associated
with matching ITS2 sequence variants to closely related
Symbiodinium with separate ecological distributions.
Because these entities share a recent common ancestor
as members of the C1 radiation (sensu Thornhill et al.
2014), the genomes of these Symbiodinium shared the
ancestral sequence, C1, at different relative abundances
(Fig. 4). An exception was a Pocillopora verrucosa speci-
men (P.Maq.R2.7, Table 3): in this sample, we detected
all six OTUs representing the entire OTU diversity from
our data. The significance of colonies possibly harbour-
ing highly mixed Symbiodinium assemblages is not fully
understood and should be the effort of future studies.
Considerations for the application of an OTU-basedpipeline to the analysis of Symbiodinium ITS2 diversity
There is probably no single genetic marker that can cor-
rectly classify all Symbiodinium diversity into distinct
species (LaJeunesse et al. 2012; Pochon et al. 2012). Typi-
cally, a distinct ITS2 variant that is numerically domi-
nant in the genome is tentatively regarded as a new
type, or ‘species’, of Symbiodinium (LaJeunesse 2002;
LaJeunesse et al. 2010), and only when diagnostic of an
ecologically distinct population. However, for (initial)
characterization of Symbiodinium diversity in a large
number of samples, elucidation of Symbiodinium species
using multimarker molecular evidence in combination
with morphological, ecological and physiological data
(as detailed in, e.g., LaJeunesse et al. 2012) is not (yet)
feasible. Here, we suggest adoption of an OTU-based
framework to analyse high-throughput Symbiodinium
ITS2 sequence data to provisionally assess species diver-
sity (similar to the use of DGGE fingerprinting of ITS2
rDNA) until ‘true’ species are formally described using
the convergence of independent lines of genetic,
ecological and in some cases morphological evidence
© 2014 The Authors. Molecular Ecology Published by John Wiley & Sons Ltd.
NEXT- GENERATION SEQUENCING OF SYMBIODINIUM ITS2 13

(LaJeunesse et al. 2014). Although the application of a
taxon-based framework will miss some ecologically and
evolutionarily distinct entities, most importantly, it pro-
vides a conservative and comparable estimate of Symbi-
odinium diversity based on rDNA. The development of
sensible cut-offs to delineate Symbiodinium diversity in
an OTU-based framework allows harmonization and
reanalysis of existing and new data under a common set
of rules. We specifically acknowledge that some Symbio-
dinium species will be contained in a single OTU and
not resolve at a cut-off of >97% similarity. For instance,
clade C, which is by far the most diverse clade with a
broad radiation, would require higher cut-off values to
resolve species. But as ITS2 data alone are unable to
unequivocally diagnose species, our intentions were to
provide a reasonable cut-off that investigators can apply
to compare diversity within and between their samples
and that deflates rather than inflates Symbiodinium spe-
cies diversity estimates. Further, continuing efforts in
the (genetic) description of Symbiodinium species (LaJeu-
nesse et al. 2012, 2014; Jeong et al. 2014) and the ease of
typing a large number of samples might encourage the
use of multiple markers in the analysis of Symbiodinium
diversity, which will facilitate analysis of high-through-
put sequencing data in a phylogeny-based context. This
perspective stimulates further comparative analyses of
ocean basins and species in a standardized framework
that might provide greater insight into symbiont diver-
sity of marine invertebrates and the acclimation of
corals to environmental change.
Acknowledgements
We would like to thank the KAUST BioScience Core Lab and
S. Neelamegam for 454 library generation and sequencing. We
would also like to thank Y. Sawall and A. Al-Sofyani for provi-
sion and collection of coral samples, and three anonymous
reviewers for helpful comments. This project was funded by a
KAUST Academic Excellence Alliance (AEA) Award to CRV
and CJH, baseline research funds to CRV and a National
Science Foundation grant to TCL (OCE-09287664).
References
Amaral-Zettler LA, McCliment EA, Ducklow HW, Huse SM
(2009) A method for studying protistan diversity using mas-
sively parallel sequencing of V9 hypervariable regions of
small-subunit ribosomal RNA genes. PLoS One, 4, e6372.
Apprill AM, Gates RD (2007) Recognizing diversity in coral
symbiotic dinoflagellate communities. Molecular Ecology, 16,
1127–1134.Baker AC (2003) Flexibility and specificity in coral-algal symbio-
sis: diversity, ecology, and biogeography of Symbiodinium.
Annual Review of Ecology, Evolution, and Systematics, 34, 661–689.
Barbrook AC, Voolstra CR, Howe CJ (2014) The chloroplast gen-
ome of a Symbiodinium sp. clade C3 isolate. Protist, 165, 1–13.
Baums IB, Devlin-Durante MK, LaJeunesse TC (2014) New
insights into the dynamics between reef corals and their
associated dinoflagellate endosymbionts from population
genetic studies. Molecular ecology, doi: 10.1111/mec.12788.
[Epub ahead of print].
Correa AMS, Baker AC (2009) Understanding diversity in
coral-algal symbiosis: a cluster-based approach to interpret-
ing fine-scale genetic variation in the genus Symbiodinium.
Coral Reefs, 28, 81–93.
Dover GA (1986) Molecular drive in multigene families: how
biological novelties arise, spread and are assimilated. Trends
in Genetics, 2, 159–165.Edgar RC (2004) MUSCLE: a multiple sequence alignment
method with reduced time and space complexity. BMC Bio-
informatics, 5, 113.
Edgar RC, Haas BJ, Clemente JC, Quince C, Knight R (2011)
UCHIME improves sensitivity and speed of chimera detec-
tion. Bioinformatics, 27, 2194–2200.Finney JC, Pettay DT, Sampayo EM et al. (2010) The relative
significance of host-habitat, depth, and geography on the
ecology, endemism, and speciation of coral endosymbionts
in the genus Symbiodinium. Microbial Ecology, 60, 250–263.Franklin EC, Stat M, Pochon X, Putnam HM, Gates RD (2012)
GeoSymbio: a hybrid, cloud-based web application of global
geospatial bioinformatics and ecoinformatics for Symbiodi-
nium-host symbioses.Molecular Ecology Resources, 12, 369–373.Frommlet JC, Iglesias-Rodr�ıguez MD (2008) Microsatellite
genotyping of single cells of the Dinoflagellate Species Lingu-
lodinium polyedrum (Dinophyceae): a novel approach for mar-
ine microbial population genetic studies. Journal of Phycology,
44, 1116–1125.Gaither MR, Szab�o Z, Crepeau MW, Bird CE, Toonen RJ (2010)
Preservation of corals in salt-saturated DMSO buffer is supe-
rior to ethanol for PCR experiments. Coral Reefs, 30, 329–333.
Ghyselinck J, Pfeiffer S, Heylen K, Sessitsch A, De Vos P (2013)
The effect of primer choice and short read sequences on the
outcome of 16S rRNA gene based diversity studies. PLoS
One, 8, e71360.
Green EA, Davies SW, Matz MV, Medina M (2014) Quantifying
cryptic Symbiodinium diversity within Orbicella faveolata and
Orbicella franksi at the Flower Garden Banks, Gulf of Mexico.
PeerJ, 2, e386.
Guillard RRL, Ryther JH (1962) Studies of marine planktonic
diatoms. I. Cyclotella nana Hustedt and Detonula confervacea
Cleve. Canadian Journal of Microbiology, 8, 229–239.Hamady M, Walker JJ, Harris JK, Gold NJ, Knight R (2008)
Error-correcting barcoded primers for pyrosequencing hun-
dreds of samples in multiplex. Nature Methods, 5, 235–237.
Hillis DM, Dixon MT (1991) Ribosomal DNA: molecular
evolution and phylogenetic inference. The Quarterly Review of
Biology, 66, 411–453.Hunter CL, Morden CW, Smith CM (1997) The utility of ITS
sequences in assessing relationships among zooxanthellae
and corals. In: Proceedings of the 8th International Coral Reef
Symposium, vol. 2, pp. 1599–1602.Jeong HJ, Lee SY, Kang NS et al. (2014) Genetics and morphol-
ogy characterize the dinoflagellate Symbiodinium voratum, n.
sp., (Dinophyceae) as the sole representative of Symbiodinium
Clade E. Journal of Eukaryotic Microbiology, 61, 75–94.LaJeunesse TC (2001) Investigating the biodiversity, ecology,
and phylogeny of endosymbiotic dinoflagellates in the genus
© 2014 The Authors. Molecular Ecology Published by John Wiley & Sons Ltd.
14 C. ARIF ET AL.
Symbiodinium using the its region: in search of a “species”
level marker. Journal of Phycology, 37, 866–880.LaJeunesse T (2002) Diversity and community structure of
symbiotic dinoflagellates from Caribbean coral reefs. Marine
Biology, 141, 387–400.
LaJeunesse TC, Pinzon JH (2007) Screening intragenomic rDNA
for dominant variants can provide a consistent retrieval of
evolutionarily persistent ITS (rDNA) sequences. Molecular
Phylogenetics and Evolution, 45, 417–422.
LaJeunesse TC, Thornhill DJ (2011) Improved resolution of
reef-coral endosymbiont Symbiodinium Species diversity, ecol-
ogy, and evolution through psbA non-coding region geno-
typing. PLoS One, 6, e29013.
LaJeunesse TC, Loh WKW, Van Woesik R et al. (2003) Low
Symbiont Diversity in Southern Great Barrier Reef Corals, Rela-
tive to Those of the Caribbean. American Society of Limnology
and Oceanography, Waco, TX, ETATS-UNIS.
LaJeunesse TC, Thornhill DJ, Cox EF et al. (2004) High diver-
sity and host specificity observed among symbiotic dinofla-
gellates in reef coral communities from Hawaii. Coral Reefs,
23, 596–603.
LaJeunesse TC, Bonilla HR, Warner ME et al. (2008) Specificity
and stability in high latitude eastern Pacific coral-algal sym-
bioses. Limnology and Oceanography, 53, 719.
LaJeunesse TC, Smith RT, Finney J, Oxenford H (2009) Outbreak
and persistence of opportunistic symbiotic dinoflagellates dur-
ing the 2005 Caribbean mass coral ‘bleaching’ event. Proceed-
ings of the Royal Society B: Biological Sciences, 276, 4139–4148.
LaJeunesse TC, Pettay DT, Sampayo EM et al. (2010) Long-
standing environmental conditions, geographic isolation and
host-symbiont specificity influence the relative ecological
dominance and genetic diversification of coral endosymbionts
in the genus Symbiodinium. Journal of Biogeography, 37, 785–800.LaJeunesse TC, Parkinson JE, Reimer JD (2012) A genetics-
based description of Symbiodinium minutum sp. nov. and
S. psygmophilum sp. nov. (Dinophyceae), two dinoflagellates
symbiotic with cnidaria. Journal of Phycology, 48, 1380–1391.LaJeunesse TC, Wham DC, Pettay DT et al. (2014) Ecologically
differentiated stress-tolerant endosymbionts in the dinofla-
gellate genus Symbiodinium (Dinophyceae) Clade D are dif-
ferent species. Phycologia, 53, 305–319.Loh WKW, Loi T, Carter D, Hoegh-Guldberg O (2001) Genetic
variability of the symbiotic dinoflagellates from the wide
ranging coral species Seriatopora hystrix and Acropora longicy-
athus in the Indo-West Pacific. Marine Ecology Progress Series,
222, 97–107.
Macdonald AH, Sampayo E, Ridgway T, Schleyer M (2008)
Latitudinal symbiont zonation in Stylophora pistillata from
southeast Africa. Marine Biology, 154, 209–217.Martin M (2011) Cutadapt removes adapter sequences from high-
throughput sequencing reads.
McNally KL, Govind NS, Thom�e PE, Trench RK (1994) Small-sub-
unit ribosomal DNA sequence analyses and a reconstruction
of the inferred phylogeny among symbiotic dinoflagellates
(Pyrrophyta). Journal of Phycology, 30, 316–329.Mieog JC, Oppen MJH, Cantin NE, Stam WT, Olsen JL (2007)
Real-time PCR reveals a high incidence of Symbiodinium
clade D at low levels in four scleractinian corals across the
Great Barrier Reef: implications for symbiont shuffling. Coral
Reefs, 26, 449–457.
Moore RB, Ferguson KM, Loh WKW, Hoegh-Guldberg C, Car-
ter DA (2003) Highly organized structure in the non-coding
region of the psbA minicircle from clade C Symbiodinium.
International Journal of Systematic and Evolutionary Microbiol-
ogy, 53, 1725–1734.
Muscatine L, Cernichiari E (1969) Assimilation of photosyn-
thetic products of zooxanthellae by a reef coral. Biological
Bulletin, 137, 506–523.van Oppen MJ, Gates RD (2006) Conservation genetics and the
resilience of reef-building corals. Molecular Ecology, 15, 3863–3883.
van Oppen MJ, Palstra FP, Piquet AM, Miller DJ (2001) Pat-
terns of coral-dinoflagellate associations in Acropora: signifi-
cance of local availability and physiology of Symbiodinium
strains and host-symbiont selectivity. Proceedings of the Royal
Society B: Biological Sciences, 268, 1759–1767.Pettay DT, Wham DC, Pinzon JH, LaJeunesse TC (2011) Geno-
typic diversity and spatial-temporal distribution of Symbi-
odinium clones in an abundant reef coral. Molecular Ecology,
20, 5197–5212.Pochon X, Montoya-Burgos JI, Stadelmann B, Pawlowski J
(2006) Molecular phylogeny, evolutionary rates, and diver-
gence timing of the symbiotic dinoflagellate genus Symbiodi-
nium. Molecular Phylogenetics and Evolution, 38, 20–30.Pochon X, Putnam HM, Burki F, Gates RD (2012) Identifying
and characterizing alternative molecular markers for the
symbiotic and free-living dinoflagellate genus Symbiodinium.
PLoS One, 7, e29816.
Preheim SP, Perrotta AR, Martin-Platero AM, Gupta A, Alm EJ
(2013) Distribution-based clustering: using ecology to refine
the operational taxonomic unit. Applied and Environmental
Microbiology, 79, 6593–6603.
Putnam HM, Stat M, Pochon X, Gates RD (2012) Endosymbi-
otic flexibility associates with environmental sensitivity in
scleractinian corals. Proceedings of the Royal Society B: Biologi-
cal Sciences, 279, 4352–4361.
Quigley KM, Davies SW, Kenkel CD et al. (2014) Deep-
sequencing method for quantifying background abundances
of symbiodinium types: exploring the rare symbiodinium
biosphere in reef-building corals. PLoS One, 9, e94297.
Quince C, Lanzen A, Davenport R, Turnbaugh P (2011)
Removing noise from pyrosequenced amplicons. BMC Bioin-
formatics, 12, 38.
Rodriguez-Lanetty M, Loh W, Carter D, Hoegh-Guldberg O
(2001) Latitudinal variability in symbiont specificity within
the widespread scleractinian coral Plesiastrea versipora. Marine
Biology, 138, 1175–1181.Roesch LF, Fulthorpe RR, Riva A et al. (2007) Pyrosequencing
enumerates and contrasts soil microbial diversity. ISME Jour-
nal, 1, 283–290.
Rowan R, Knowlton N (1995) Intraspecific diversity and eco-
logical zonation in coral-algal symbiosis. Proceedings of the
National Academy of Sciences, 92, 2850–2853.Rowan R, Powers DA (1991) A molecular genetic classification
of zooxanthellae and the evolution of animal-algal symbio-
ses. Science, 251, 1348–1351.
Rowan R, Powers DA (1992) Ribosomal RNA sequences and
the diversity of symbiotic dinoflagellates (zooxanthellae).
Proceedings of the National Academy of Sciences of the United
States of America, 89, 3639–3643.
© 2014 The Authors. Molecular Ecology Published by John Wiley & Sons Ltd.
NEXT- GENERATION SEQUENCING OF SYMBIODINIUM ITS2 15
Rowan R, Knowlton N, Baker A, Jara J (1997) Landscape ecol-
ogy of algal symbionts creates variation in episodes of coral
bleaching. Nature, 388, 265–269.
Sampayo EM, Franceschinis L, Hoegh-Guldberg O, Dove S
(2007) Niche partitioning of closely related symbiotic dinofla-
gellates. Molecular Ecology, 16, 3721–3733.Sampayo EM, Dove S, Lajeunesse TC (2009) Cohesive molecu-
lar genetic data delineate species diversity in the dinoflagel-
late genus Symbiodinium. Molecular Ecology, 18, 500–519.
Santos SR, Taylor DJ, Kinzie RA et al. (2002) Molecular
phylogeny of symbiotic dinoflagellates inferred from partial
chloroplast large subunit (23S)-rDNA sequences. Molecular
Phylogenetics and Evolution, 23, 97–111.
Schloss PD, Westcott SL (2011) Assessing and improving meth-
ods used in operational taxonomic unit-based approaches for
16S rRNA gene sequence analysis. Applied and Environmental
Microbiology, 77, 3219–3226.
Schloss PD, Westcott SL, Ryabin T et al. (2009) Introducing
mothur: open-source, platform-independent, community-
supported software for describing and comparing microbial
communities. Applied and Environmental Microbiology, 75,
7537–7541.Silverstein RN, Correa AMS, LaJeunesse TC, Baker AC (2011)
Novel algal symbiont (Symbiodinium spp.) diversity in reef
corals of Western Australia. Marine Ecology Progress Series,
422, 63–75.Sogin ML, Morrison HG, Huber JA et al. (2006) Microbial
diversity in the deep sea and the underexplored “rare bio-
sphere”. Proceedings of the National Academy of Sciences of the
United States of America, 103, 12115–12120.
Stat M, Pochon X, Cowie RO, Gates RD (2009) Specificity in
communities of Symbiodinium in corals from Johnston Atoll.
Marine Ecology Progress Series, 386, 83–96.Stat M, Bird CE, Pochon X et al. (2011) Variation in Symbiodi-
nium ITS2 sequence assemblages among coral colonies. PLoS
One, 6, e15854.
Stat M, Pochon X, Franklin EC et al. (2013) The distribution of the
thermally tolerant symbiont lineage (Symbiodinium clade D)
in corals from Hawaii: correlations with host and the history
of ocean thermal stress. Ecology and Evolution, 3, 1317–1329.
Stoeck T, Behnke A, Christen R et al. (2009) Massively parallel
tag sequencing reveals the complexity of anaerobic marine
protistan communities. BMC Biology, 7, 72.
Stoeck T, Bass D, Nebel M et al. (2010) Multiple marker parallel
tag environmental DNA sequencing reveals a highly com-
plex eukaryotic community in marine anoxic water. Molecu-
lar Ecology, 19, 21–31.Thomas L, Kendrick GA, Kennington WJ, Richards ZT, Stat M
(2014) Exploring Symbiodinium diversity and host specificity
in Acropora corals from geographical extremes of Western
Australia with 454 amplicon pyrosequencing. Molecular Ecol-
ogy, 23, 3113–3126.
Thornhill DJ, LaJeunesse TC, Kemp DW, Fitt WK, Schmidt GW
(2006) Multi-year, seasonal genotypic surveys of coral-algal
symbioses reveal prevalent stability or post-bleaching rever-
sion. Marine Biology, 148, 711–722.
Thornhill DJ, LaJeunesse TC, Santos SR (2007) Measuring
rDNA diversity in eukaryotic microbial systems: how intrag-
enomic variation, pseudogenes, and PCR artifacts confound
biodiversity estimates. Molecular Ecology, 16, 5326–5340.
Thornhill DJ, Xiang Y, Pettay DT, Zhong M, Santos SR (2013)
Population genetic data of a model symbiotic cnidarian system
reveal remarkable symbiotic specificity and vectored introduc-
tions across ocean basins.Molecular Ecology, 22, 4499–4515.Thornhill DJ, Lewis AM, Wham DC, LaJeunesse TC (2014)
Host-specialist lineages dominate the adaptive radiation of
reef coral endosymbionts. Evolution, 68, 352–367.
Toller WW, Rowan R, Knowlton N (2001) Zooxanthellae of the
Montastraea annularis species complex: patterns of distribu-
tion of four taxa of Symbiodinium on different reefs and
across depths. Biological Bulletin, 201, 348–359.
Tonk L, Bongaerts P, Sampayo EM, Hoegh-Guldberg O (2013a)
SymbioGBR: a web-based database of Symbiodinium associ-
ated with cnidarian hosts on the Great Barrier Reef. BMC
Ecology, 13, 7.
Tonk L, Sampayo EM, Weeks S, Magno-Canto M, Hoegh-Guldberg
O (2013b) Host-specific interactions with environmental factors
shape the distribution of symbiodinium across the Great Barrier
Reef. PLoS One, 8, e68533.
Wicks LC, Sampayo E, Gardner JPA, Davy SK (2010) Local
endemicity and high diversity characterise high-latitude
coral–Symbiodinium partnerships. Coral Reefs, 29, 989–1003.Wilcox TP (1998) Large-subunit ribosomal RNA systematics of
symbiotic dinoflagellates: morphology does not recapitulate
phylogeny. Molecular Phylogenetics and Evolution, 10, 436–448.
C.R.V., C.H. and A.B. designed and conceived the
experiments. C.A., C.D., E.B.H. and C.R.V. generated
data. C.R.V., C.A., T.B., C.D. and T.C.L. analysed data.
C.R.V., C.A., T.C.L. and C.D. wrote the manuscript.
Data accessibility
ITS2 DNA variants were uploaded as online supple-
mental material. Pyrosequencing analysis pipeline over-
view and mothur script were uploaded as online
supplemental material. The sequences determined in
this study have been deposited in the NCBI Sequence
Read Archive under accession no. PRJNA244965.
Supporting information
Additional supporting information may be found in the online ver-
sion of this article.
File S1 ITS2 BLAST database.
File S2 Symbiodinium ITS2 analysis pipeline with mothur (ver-
sion 1.31.2).
File S3 Script file for unattended mothur ITS2 analysis.
File S4 Overview over ITS2 classification, read counts, and ref-
erence sequence for all ITS2 variants identified.
File S5 Overview over ITS2 Symbiodinium 454 Data Analysis
Pipeline.
© 2014 The Authors. Molecular Ecology Published by John Wiley & Sons Ltd.
16 C. ARIF ET AL.