Embed Size (px)
Citation preview

sensors
Article
Assessing MMA Welding Process Stability Using MachineVision-Based Arc Features Tracking System
Wojciech Jamrozik 1,* and Jacek Górka 2
�����������������
Citation: Jamrozik, W.; Górka, J.
Assessing MMA Welding Process
Stability Using Machine Vision-Based
Arc Features Tracking System. Sensors
2021, 21, 84. https://dx.doi.org/
10.3390/s21010084
Received: 14 December 2020
Accepted: 22 December 2020
Published: 25 December 2020
Publisher’s Note: MDPI stays neu-
tral with regard to jurisdictional claims
in published maps and institutional
affiliations.
Copyright: © 2020 by the authors. Li-
censee MDPI, Basel, Switzerland. This
article is an open access article distributed
under the terms and conditions of the
Creative Commons Attribution (CC BY)
license (https://creativecommons.org/
licenses/by/4.0/).
1 Department of Fundamentals of Machinery Design, Silesian University of Technology, 44-100 Gliwice, Poland2 Department of Welding Engineering, Silesian University of Technology, 44-100 Gliwice, Poland;
[email protected]* Correspondence: [email protected]
Abstract: Arc length is a crucial parameter of the manual metal arc (MMA) welding process, as itinfluences the arc voltage and the resulting welded joint. In the MMA method, the process’ stabilityis mainly controlled by the skills of a welder. According to that, giving the feedback about the arclength as well as the welding speed to the welder is a valuable property at the stage of weld trainingand in the production of welded elements. The proposed solution is based on the application ofrelatively cheap Complementary Metal Oxide Semiconductor (CMOS) cameras to track the weldingelectrode tip and to estimate the geometrical properties of welding arc. All measured parameters arevarying during welding. To validate the results of image processing, arc voltage was measured as areference value describing in some part the process stability.
Keywords: MMA welding; welding arc; vision system; process monitoring; welding arc stability
1. Introduction
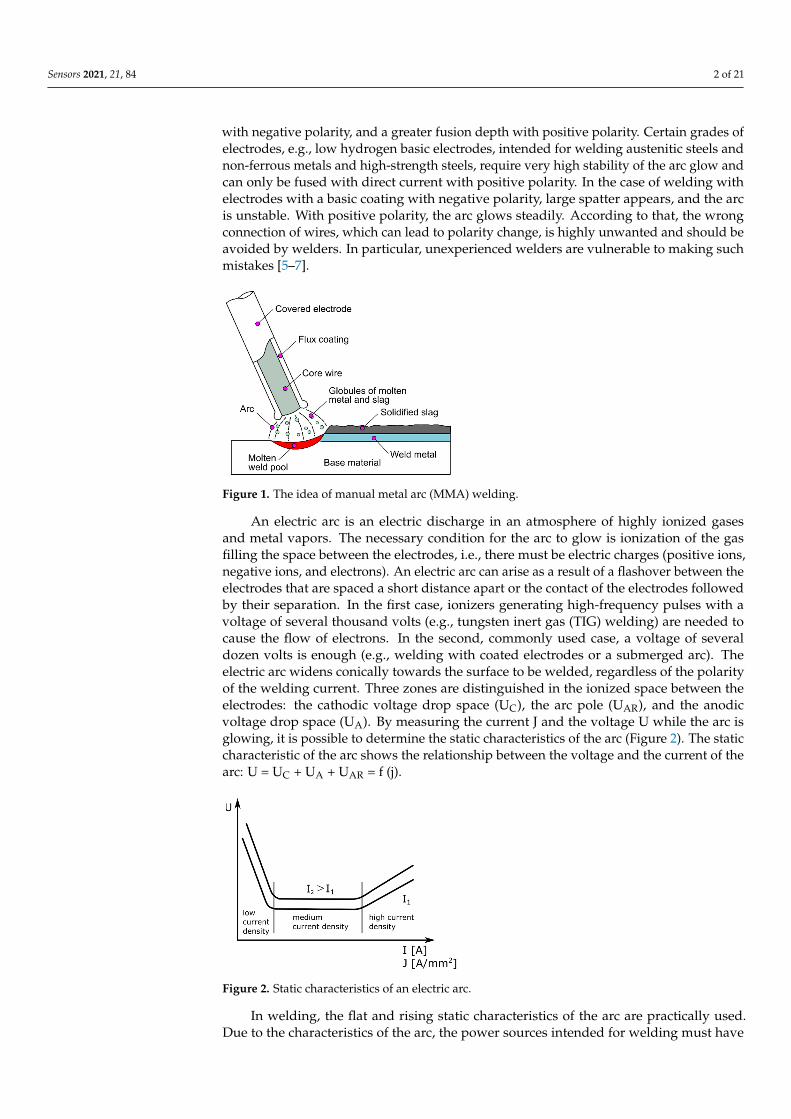
Manual metal arc welding (MMA—manual metal arc—111) is a process of perma-nently joining metals by melting a filler material, called a binder, and the edges of the basematerial using a heat source (Figure 1). The coated electrode welding method is used to joinpractically all types of steel (unalloyed steels, high-strength steels, energy steels, high-alloysteels), copper, nickel, and even grey cast iron in repair welding [1,2]. The heat source inthis method is an electric arc glowing between the core of the coated electrode and thesurface of the welded material. The temperature of this arc is between 2400 and 5000 ◦C.The arc length should be constant and equal to the core diameter. Changes in the arc voltagecause instability of the welding process and the formation of welding imperfections. MMAarc welding can be conducted with direct current with negative DC(−) or positive DC(+)polarity and with alternating current. The welder, guiding the electrode along the joint,moves it in at least two directions, downwards, as the electrode fuses, towards the weldpool, keeping the arc length constant, and along the joint, filling the weld groove withfiller [3,4]. Additionally, the welder can perform transverse, swinging movements withthe tip of the electrode. This creates conditions in which it is very difficult to maintain aconstant arc length and therefore a constant arc voltage. The arc voltage is proportional tothe arc length and affects the nature of metal transfer in the arc, welding speed and the de-positing efficiency of the weld metal. As the arc voltage increases, the arc energy and hencethe volume of the weld pool increases, but especially the width and length of the weld pool.At a constant current intensity, the increase in the arc voltage slightly affects the penetrationdepth. When the arc is too long, the heat is intensively dissipated to the atmosphere andthe metal flux transferred from the electrode to the weld pool is significantly splashed. DCcurrent provides a more stable arc and even metal transfer throughout the arc, even at lowcurrents. The edge fusion of the sheets is also higher and the arc shortening tendency islower. The polarity of the direct current determines the nature of the metal transfer in thearc, the fusion rate of the electrode and the depth of fusion. A higher fusion rate is obtained
Sensors 2021, 21, 84. https://dx.doi.org/10.3390/s21010084 https://www.mdpi.com/journal/sensors
Sensors 2021, 21, 84 2 of 21
with negative polarity, and a greater fusion depth with positive polarity. Certain grades ofelectrodes, e.g., low hydrogen basic electrodes, intended for welding austenitic steels andnon-ferrous metals and high-strength steels, require very high stability of the arc glow andcan only be fused with direct current with positive polarity. In the case of welding withelectrodes with a basic coating with negative polarity, large spatter appears, and the arcis unstable. With positive polarity, the arc glows steadily. According to that, the wrongconnection of wires, which can lead to polarity change, is highly unwanted and should beavoided by welders. In particular, unexperienced welders are vulnerable to making suchmistakes [5–7].
Sensors 2021, 20, x FOR PEER REVIEW 2 of 21
the nature of the metal transfer in the arc, the fusion rate of the electrode and the depth of fusion. A higher fusion rate is obtained with negative polarity, and a greater fusion depth with positive polarity. Certain grades of electrodes, e.g., low hydrogen basic electrodes, intended for welding austenitic steels and non-ferrous metals and high-strength steels, require very high stability of the arc glow and can only be fused with direct current with positive polarity. In the case of welding with electrodes with a basic coating with negative polarity, large spatter appears, and the arc is unstable. With positive polarity, the arc glows steadily. According to that, the wrong connection of wires, which can lead to po-larity change, is highly unwanted and should be avoided by welders. In particular, unex-perienced welders are vulnerable to making such mistakes [5–7].
Figure 1. The idea of manual metal arc (MMA) welding.
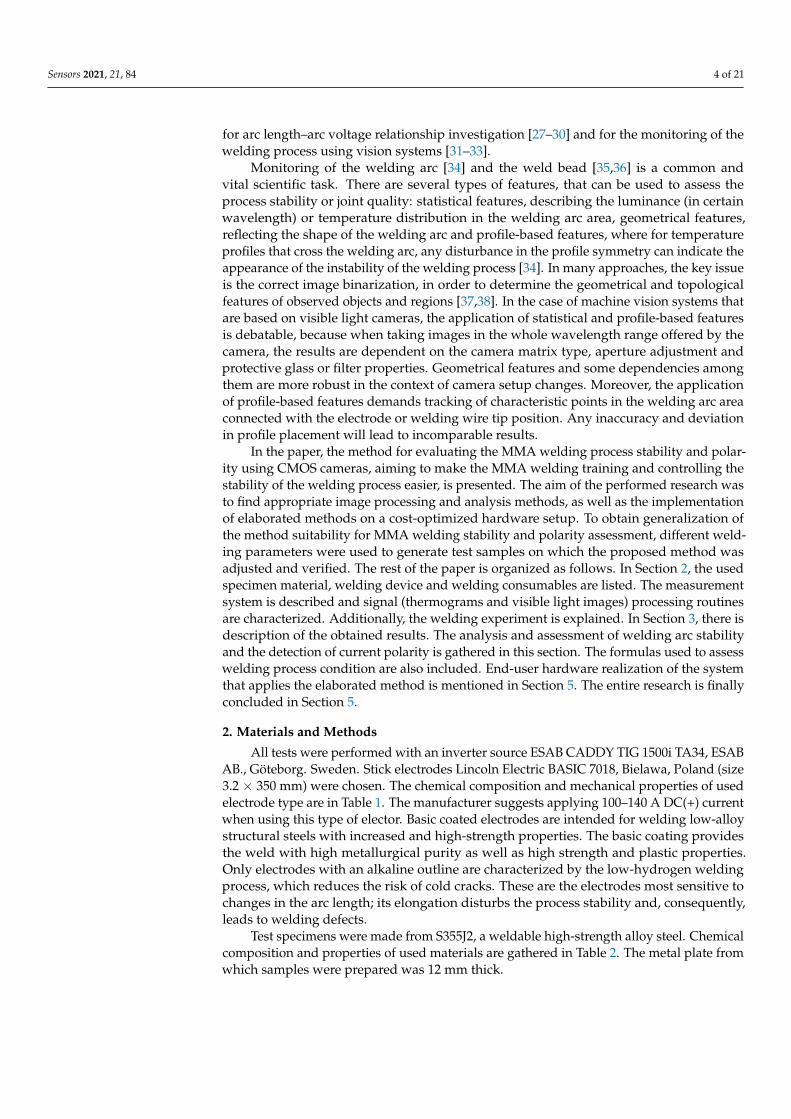
An electric arc is an electric discharge in an atmosphere of highly ionized gases and metal vapors. The necessary condition for the arc to glow is ionization of the gas filling the space between the electrodes, i.e., there must be electric charges (positive ions, nega-tive ions, and electrons). An electric arc can arise as a result of a flashover between the electrodes that are spaced a short distance apart or the contact of the electrodes followed by their separation. In the first case, ionizers generating high-frequency pulses with a volt-age of several thousand volts (e.g., tungsten inert gas (TIG) welding) are needed to cause the flow of electrons. In the second, commonly used case, a voltage of several dozen volts is enough (e.g., welding with coated electrodes or a submerged arc). The electric arc wid-ens conically towards the surface to be welded, regardless of the polarity of the welding current. Three zones are distinguished in the ionized space between the electrodes: the cathodic voltage drop space (UC), the arc pole (UAR), and the anodic voltage drop space (UA). By measuring the current J and the voltage U while the arc is glowing, it is possible to determine the static characteristics of the arc (Figure 2). The static characteristic of the arc shows the relationship between the voltage and the current of the arc: U = UC + UA + UAR = f (j).
Figure 2. Static characteristics of an electric arc.
In welding, the flat and rising static characteristics of the arc are practically used. Due to the characteristics of the arc, the power sources intended for welding must have special
Figure 1. The idea of manual metal arc (MMA) welding.
An electric arc is an electric discharge in an atmosphere of highly ionized gasesand metal vapors. The necessary condition for the arc to glow is ionization of the gasfilling the space between the electrodes, i.e., there must be electric charges (positive ions,negative ions, and electrons). An electric arc can arise as a result of a flashover between theelectrodes that are spaced a short distance apart or the contact of the electrodes followedby their separation. In the first case, ionizers generating high-frequency pulses with avoltage of several thousand volts (e.g., tungsten inert gas (TIG) welding) are needed tocause the flow of electrons. In the second, commonly used case, a voltage of severaldozen volts is enough (e.g., welding with coated electrodes or a submerged arc). Theelectric arc widens conically towards the surface to be welded, regardless of the polarityof the welding current. Three zones are distinguished in the ionized space between theelectrodes: the cathodic voltage drop space (UC), the arc pole (UAR), and the anodicvoltage drop space (UA). By measuring the current J and the voltage U while the arc isglowing, it is possible to determine the static characteristics of the arc (Figure 2). The staticcharacteristic of the arc shows the relationship between the voltage and the current of thearc: U = UC + UA + UAR = f (j).
Sensors 2021, 20, x FOR PEER REVIEW 2 of 21
the nature of the metal transfer in the arc, the fusion rate of the electrode and the depth of fusion. A higher fusion rate is obtained with negative polarity, and a greater fusion depth with positive polarity. Certain grades of electrodes, e.g., low hydrogen basic electrodes, intended for welding austenitic steels and non-ferrous metals and high-strength steels, require very high stability of the arc glow and can only be fused with direct current with positive polarity. In the case of welding with electrodes with a basic coating with negative polarity, large spatter appears, and the arc is unstable. With positive polarity, the arc glows steadily. According to that, the wrong connection of wires, which can lead to po-larity change, is highly unwanted and should be avoided by welders. In particular, unex-perienced welders are vulnerable to making such mistakes [5–7].
Figure 1. The idea of manual metal arc (MMA) welding.
An electric arc is an electric discharge in an atmosphere of highly ionized gases and metal vapors. The necessary condition for the arc to glow is ionization of the gas filling the space between the electrodes, i.e., there must be electric charges (positive ions, nega-tive ions, and electrons). An electric arc can arise as a result of a flashover between the electrodes that are spaced a short distance apart or the contact of the electrodes followed by their separation. In the first case, ionizers generating high-frequency pulses with a volt-age of several thousand volts (e.g., tungsten inert gas (TIG) welding) are needed to cause the flow of electrons. In the second, commonly used case, a voltage of several dozen volts is enough (e.g., welding with coated electrodes or a submerged arc). The electric arc wid-ens conically towards the surface to be welded, regardless of the polarity of the welding current. Three zones are distinguished in the ionized space between the electrodes: the cathodic voltage drop space (UC), the arc pole (UAR), and the anodic voltage drop space (UA). By measuring the current J and the voltage U while the arc is glowing, it is possible to determine the static characteristics of the arc (Figure 2). The static characteristic of the arc shows the relationship between the voltage and the current of the arc: U = UC + UA + UAR = f (j).
Figure 2. Static characteristics of an electric arc.
In welding, the flat and rising static characteristics of the arc are practically used. Due to the characteristics of the arc, the power sources intended for welding must have special
Figure 2. Static characteristics of an electric arc.
In welding, the flat and rising static characteristics of the arc are practically used.Due to the characteristics of the arc, the power sources intended for welding must have

Sensors 2021, 21, 84 3 of 21
special properties. In the case of welding with coated electrodes, the power source musthave a steep characteristic. When welding with coated electrodes, it is desirable to maintaina constant welding current with the inevitable changes in the arc length and the relatedchanges in the arc voltage. To allow the arc to be struck and maintained, the voltage at theterminals of the current source must vary with the intensity of the current in such a waythat the static characteristics of the current source intersect the static characteristics of thearc at two points (Figure 3).
Sensors 2021, 20, x FOR PEER REVIEW 3 of 21
properties. In the case of welding with coated electrodes, the power source must have a steep characteristic. When welding with coated electrodes, it is desirable to maintain a constant welding current with the inevitable changes in the arc length and the related changes in the arc voltage. To allow the arc to be struck and maintained, the voltage at the terminals of the current source must vary with the intensity of the current in such a way that the static characteristics of the current source intersect the static characteristics of the arc at two points (Figure 3).
Figure 3. Changes in parameters in the case of welding with average current densities.
Welding arcs glow brightly, and that glow comes from the radiation that the arc pro-duces. Part of the radiation is visible light, in the 400 to 700 nm range, while the other part of the radiation is infrared (700 to 1400 nm) and is the part that produces heat. There is also some UV radiation in the range of 200 to 400 nm.
Monitoring of MMA is a crucial task, as the quality is highly dependent on the skills of a welder who must maintain the arc length and the welding speed at a constant level. During the arc welding process, there are various kinds of information, such as electric arc voltage, welding current, welding sound, weld pool shape, etc., which are closely re-lated to the welding quality. A skilled welder can generally evaluate the condition of the seam, judging several signals based on the experience. Considering the highly nonlinear and time-varying complex welding process with a high number of degrees of freedom MMA is not often a subject of research. Several methods utilizing one or more sources of information about the welding process condition and stability was elaborated for different welding techniques [8–10].
In [11–13], a technique of modelling the welder response to welding pool surface was presented. The welding current as a response to the 3D weld pool surface, as characterized by its width, length, and convexity, was studied, and human welder behavior modelled. A method of welding skill evaluation using high-speed welding current and arc voltage in MMA was also elaborated [14,15]. In this method, the probability density distributions was calculated based on recorded electrical signals and the differentiation between expe-rienced and novice welders was made. Other sensing and reasoning techniques are also proposed to limit or reduce the appearance of defects like the arc voltage sensor [16–18], acoustic emission measurements [19], thermography [20,21], vision light cameras [22] and sound [23,24]. Additionally, there are many multisensory techniques that are often sup-ported by artificial intelligence, showing in some cases of welding monitoring an impres-sive performance regarding accuracy and robustness. As an example, the multisensor in-formation fusion technology was applied to predict the penetration status in pulsed TIG [22–25]. In [26], the depth and width estimation of the weld bead in TIG based on multi-sensor information fusion and an artificial neural network was proposed. Most studies presented results obtained on mechanized and robotized stands for welding methods that are carried out in an automated manner, such as gas metal arc (GMA) and TIG welding. This is the case for arc length–arc voltage relationship investigation [27–30] and for the monitoring of the welding process using vision systems [31–33].
Figure 3. Changes in parameters in the case of welding with average current densities.
Welding arcs glow brightly, and that glow comes from the radiation that the arcproduces. Part of the radiation is visible light, in the 400 to 700 nm range, while the otherpart of the radiation is infrared (700 to 1400 nm) and is the part that produces heat. Thereis also some UV radiation in the range of 200 to 400 nm.
Monitoring of MMA is a crucial task, as the quality is highly dependent on the skillsof a welder who must maintain the arc length and the welding speed at a constant level.During the arc welding process, there are various kinds of information, such as electricarc voltage, welding current, welding sound, weld pool shape, etc., which are closelyrelated to the welding quality. A skilled welder can generally evaluate the condition of theseam, judging several signals based on the experience. Considering the highly nonlinearand time-varying complex welding process with a high number of degrees of freedomMMA is not often a subject of research. Several methods utilizing one or more sources ofinformation about the welding process condition and stability was elaborated for differentwelding techniques [8–10].
In [11–13], a technique of modelling the welder response to welding pool surface waspresented. The welding current as a response to the 3D weld pool surface, as characterizedby its width, length, and convexity, was studied, and human welder behavior modelled.A method of welding skill evaluation using high-speed welding current and arc voltage inMMA was also elaborated [14,15]. In this method, the probability density distributions wascalculated based on recorded electrical signals and the differentiation between experiencedand novice welders was made. Other sensing and reasoning techniques are also proposedto limit or reduce the appearance of defects like the arc voltage sensor [16–18], acoustic emis-sion measurements [19], thermography [20,21], vision light cameras [22] and sound [23,24].Additionally, there are many multisensory techniques that are often supported by artificialintelligence, showing in some cases of welding monitoring an impressive performanceregarding accuracy and robustness. As an example, the multisensor information fusiontechnology was applied to predict the penetration status in pulsed TIG [22–25]. In [26], thedepth and width estimation of the weld bead in TIG based on multisensor informationfusion and an artificial neural network was proposed. Most studies presented resultsobtained on mechanized and robotized stands for welding methods that are carried outin an automated manner, such as gas metal arc (GMA) and TIG welding. This is the case
Sensors 2021, 21, 84 4 of 21
for arc length–arc voltage relationship investigation [27–30] and for the monitoring of thewelding process using vision systems [31–33].
Monitoring of the welding arc [34] and the weld bead [35,36] is a common andvital scientific task. There are several types of features, that can be used to assess theprocess stability or joint quality: statistical features, describing the luminance (in certainwavelength) or temperature distribution in the welding arc area, geometrical features,reflecting the shape of the welding arc and profile-based features, where for temperatureprofiles that cross the welding arc, any disturbance in the profile symmetry can indicate theappearance of the instability of the welding process [34]. In many approaches, the key issueis the correct image binarization, in order to determine the geometrical and topologicalfeatures of observed objects and regions [37,38]. In the case of machine vision systems thatare based on visible light cameras, the application of statistical and profile-based featuresis debatable, because when taking images in the whole wavelength range offered by thecamera, the results are dependent on the camera matrix type, aperture adjustment andprotective glass or filter properties. Geometrical features and some dependencies amongthem are more robust in the context of camera setup changes. Moreover, the applicationof profile-based features demands tracking of characteristic points in the welding arc areaconnected with the electrode or welding wire tip position. Any inaccuracy and deviationin profile placement will lead to incomparable results.
In the paper, the method for evaluating the MMA welding process stability and polar-ity using CMOS cameras, aiming to make the MMA welding training and controlling thestability of the welding process easier, is presented. The aim of the performed research wasto find appropriate image processing and analysis methods, as well as the implementationof elaborated methods on a cost-optimized hardware setup. To obtain generalization ofthe method suitability for MMA welding stability and polarity assessment, different weld-ing parameters were used to generate test samples on which the proposed method wasadjusted and verified. The rest of the paper is organized as follows. In Section 2, the usedspecimen material, welding device and welding consumables are listed. The measurementsystem is described and signal (thermograms and visible light images) processing routinesare characterized. Additionally, the welding experiment is explained. In Section 3, there isdescription of the obtained results. The analysis and assessment of welding arc stabilityand the detection of current polarity is gathered in this section. The formulas used to assesswelding process condition are also included. End-user hardware realization of the systemthat applies the elaborated method is mentioned in Section 5. The entire research is finallyconcluded in Section 5.
2. Materials and Methods
All tests were performed with an inverter source ESAB CADDY TIG 1500i TA34, ESABAB., Göteborg. Sweden. Stick electrodes Lincoln Electric BASIC 7018, Bielawa, Poland (size3.2 × 350 mm) were chosen. The chemical composition and mechanical properties of usedelectrode type are in Table 1. The manufacturer suggests applying 100–140 A DC(+) currentwhen using this type of elector. Basic coated electrodes are intended for welding low-alloystructural steels with increased and high-strength properties. The basic coating providesthe weld with high metallurgical purity as well as high strength and plastic properties.Only electrodes with an alkaline outline are characterized by the low-hydrogen weldingprocess, which reduces the risk of cold cracks. These are the electrodes most sensitive tochanges in the arc length; its elongation disturbs the process stability and, consequently,leads to welding defects.
Test specimens were made from S355J2, a weldable high-strength alloy steel. Chemicalcomposition and properties of used materials are gathered in Table 2. The metal plate fromwhich samples were prepared was 12 mm thick.

Sensors 2021, 21, 84 5 of 21
Table 1. Chemical composition in % of weight and typical mechanical properties of BASIC 7018electrodes.
C Mn Si HDM
0.05% 1.3% 0.4% 4 mL/100 gYield strength [N/mm2] Tensile strength [N/mm2] Elongation [%] Impact ISO-V [J]
475 540 27 105 (at −40 ◦C)
Table 2. Chemical composition in % of weight and typical mechanical properties of S355J2 steel.
C Mn Si P S Cr Ni Mo W V Al Cu
0.2 1.5 0.2–0.5 ≤0.04 ≤0.04 ≤0.3 ≤0.3 - - - ≤0.02 ≤0.03Yield strength [N/mm2] Tensile strength [N/mm2] Elongation [%] Hardness [HB]
>355 490 >25 230
The arc voltage was measured using a NI USB-6009, NI, Austin, TX, USA card withacquisition rate of 25 kHz. Before feeding the measuring transducer, the voltage wasconditioned using LEM LV 25P voltage transducer to a voltage range 0–10 V, that wassuitable for acquiring. Sequences of the welding arc were recorded using a visible lightcamera, as well as an infrared camera (thermographic camera). A Dalsa Genie Nano C2050,Teledyne DALSA, Waterloo, Canada with a CMOS matrix and 25 mm lens was used to asthe visible light camera (VIS CAM). The recording was performed with a rate of 30 fps,and the frame size was 2064 × 1544 pixels with the 8-bit colour depth. To protect thecamera sensor against blinding by the welding arc a protective glass with shading grade12 was applied. No additional filters were applied. Thermograms were acquired with aninfrared FLIR A655sc camera, FLIR Systems, Wilsonville, USA (Infrared Radiation (IR)CAM, spectral range 7.5–14.0 µm) with a 25 mm lens. Thermograms were taken with200 fps and the spatial resolution was 640 × 120 pixels. Because there was no need toknow the exact temperature in the arc or the welding pool, a constant emissivity ε = 0.95was used. This assumption allowed further comparison of geometrical and topologicalproperties of welding arc in different welding process conditions. Optical axes of bothcameras were perpendicular to the surface of the metal plate used for cladding. Measuringdevices were triggered to start acquisition simultaneously. The acquisition software waswritten in NI LabVIEW 2017. For the IR camera, a dedicated software FLIR ResearchIR x64was used. The PC used as the system central unit was equipped with: Intel Core i7-7700K,4.2 GHz, ASUS TUF Z270 MARK 2 motherboard, Corsair Vengeance LPX 16 GB DDR43000 MHz RAM.
Two test scenarios were taken into consideration to assess the behavior of the weldingarc in different conditions. In the first scenario, a test stand for the examination of themaximal welding arc length were used (Figure 4a). In this case, the welding rod was fixedon a constant height, with a gap between the welding rod tip and the welded plate of about2 mm. After the ignition of the welding arc using an external metal plate to induce thecontact between the electrode and the welded metal, the welding arc glows until its lengthexceeds a critical value that causes the breaking of the arc. In this case, DC(+) and DC(−)polarities were used and the welding current was set to 110, 130 and 150 A DC. For theused rod, the optimal welding current should be 130–140 A DC, and the arc length shouldbe 4.0 mm. For each welding current and polarity, three attempts were made. Finally,18 trials were made and acquired.
The second procedure was an MMA cladding (Figure 4b). In this case, the welding cur-rent was set to 140 A DC and both DC(+) and DC(−) polarities were applied. Cladding wasperformed in three different ways:
• Stable—short arc. The welder kept a constant arc length, which was optimal for theselected welding stick.

Sensors 2021, 21, 84 6 of 21
• Unstable—long arc. The welder tried to conduct cladding with the longest possiblearc. If the air gap becomes too large for the voltage, the arc may be extinguishedduring this procedure.
• Mixed stability. The welder changed the arc length during the procedure.
Sensors 2021, 20, x FOR PEER REVIEW 5 of 21
Test specimens were made from S355J2, a weldable high-strength alloy steel. Chem-ical composition and properties of used materials are gathered in Table 2. The metal plate from which samples were prepared was 12 mm thick.
Table 2. Chemical composition in % of weight and typical mechanical properties of S355J2 steel.
C Mn Si P S Cr Ni Mo W V Al Cu 0.2 1.5 0.2–0.5 ≤0.04 ≤0.04 ≤0.3 ≤0.3 - - - ≤0.02 ≤0.03
Yield strength [N/mm2] Tensile strength [N/mm2] Elongation [%] Hardness [HB] >355 490 >25 230
The arc voltage was measured using a NI USB-6009, NI, Austin, TX, USA card with acquisition rate of 25 kHz. Before feeding the measuring transducer, the voltage was con-ditioned using LEM LV 25P voltage transducer to a voltage range 0–10 V, that was suitable for acquiring. Sequences of the welding arc were recorded using a visible light camera, as well as an infrared camera (thermographic camera). A Dalsa Genie Nano C2050, Teledyne DALSA, Waterloo, Canada with a CMOS matrix and 25 mm lens was used to as the visible light camera (VIS CAM). The recording was performed with a rate of 30 fps, and the frame size was 2064 × 1544 pixels with the 8-bit colour depth. To protect the camera sensor against blinding by the welding arc a protective glass with shading grade 12 was applied. No additional filters were applied. Thermograms were acquired with an infrared FLIR A655sc camera, FLIR Systems, Wilsonville, USA (Infrared Radiation (IR) CAM, spectral range 7.5–14.0 µm) with a 25 mm lens. Thermograms were taken with 200 fps and the spatial resolution was 640 × 120 pixels. Because there was no need to know the exact tem-perature in the arc or the welding pool, a constant emissivity ε = 0.95 was used. This as-sumption allowed further comparison of geometrical and topological properties of weld-ing arc in different welding process conditions. Optical axes of both cameras were per-pendicular to the surface of the metal plate used for cladding. Measuring devices were triggered to start acquisition simultaneously. The acquisition software was written in NI LabVIEW 2017. For the IR camera, a dedicated software FLIR ResearchIR x64 was used. The PC used as the system central unit was equipped with: Intel Core i7-7700K, 4.2GHz, ASUS TUF Z270 MARK 2 motherboard, Corsair Vengeance LPX 16GB DDR4 3000MHz RAM.
Two test scenarios were taken into consideration to assess the behavior of the weld-ing arc in different conditions. In the first scenario, a test stand for the examination of the maximal welding arc length were used (Figure 4a). In this case, the welding rod was fixed on a constant height, with a gap between the welding rod tip and the welded plate of about 2 mm. After the ignition of the welding arc using an external metal plate to induce the contact between the electrode and the welded metal, the welding arc glows until its length exceeds a critical value that causes the breaking of the arc. In this case, DC(+) and DC(−) polarities were used and the welding current was set to 110, 130 and 150 A DC. For the used rod, the optimal welding current should be 130–140 A DC, and the arc length should be 4.0 mm. For each welding current and polarity, three attempts were made. Fi-nally, 18 trials were made and acquired.
(a) (b)
Figure 4. Illustration of test stands used in research: (a) stand for welding arc examination; (b) manualcladding process.
All data acquired during the research were processed in order to create signals thatcan be used to assess process stability in terms of welding arc length and change dynamicswhat was connected to the used polarity. The main issue was to elaborate a processingand analysis method for the VIS images that will allow the evaluation of welding processproperties during welding (cladding). All processing and analysis methods were elaboratedin a MATLAB 2020b environment.
Arc voltage and thermogram sequences were used as benchmark data sources, thatcan be used to confirm the usefulness of features that were extracted from VIS imagesequences. Voltage signals were filtered with a low pass filter with the passband frequencyof 5 kHz. A sliding window was applied to the filtered signal to calculate voltage RMS.The width of the window was 100 samples.
To assess infrared images, a set of geometrical features were extracted for each frame.Before the feature extraction stage, each thermogram was thresholder to obtain a binaryimage (Figure 5). Thermograms were binarized with a fixed threshold, that was the samefor all sequences trIR = 1890 ◦C (apparent). The temperature value was selected as a resultof the searching algorithm. The searching algorithm was elaborated to find a thresholdthat will produce binary images with the largest continuous binary object that wouldrepresent the welding arc and the elimination of the hot seam that is also visible in theIR image at the same moment. The boundary conditions for the threshold were set to1500–2000 ◦C. For the binary IR images with one object that can be regarded as a regionof interest (ROI), basic geometrical and topological properties were calculated. The setof features contained centroids (coordinates of center of mass of the region), lengths ofthe major and minor axes of the ellipse that has the same normalized second centralmoments as the ROI, perimeter and area of ROI. Centroids were used to evaluate thestability of the process, taking into consideration welder skills such as ability to keep aconstant arc length and constant travel (welding) speed. Other geometrical features wereused to assess the arc length and polarity in a way that would be independent of theconfiguration of measuring equipment, especially absolute values of temperature anddistance between the IR camera and stick electrode. To minimize the influence of highfrequency disturbances that were present in the features, signals peak envelopes werecalculated and then analyzed. Pixel sizes on the thermogram were converted to real lifeunits. Taking into consideration camera configuration, PS = 17µm and distance to targetWD = 500 mm (Working Distance), horizontal field-of-view (HFOV) = 220 mm, and VFOV170 mm (Vertical Field-Of-View), as well as IFOV = 0.35 mm (Instantaneous Field-Of-View,the size of smallest recognizable object).

Sensors 2021, 21, 84 7 of 21
Sensors 2021, 20, x FOR PEER REVIEW 7 of 21
(a) (b)
Figure 5. Processing steps of IR CAM images: (a) original image; (b) binarized and cropped image.
Sequences taken by the VIS camera were first processed in order to remove artefacts which were the result of Bayer filtering (Figure 6a). Because there were no filters used, a full band of camera acquisition was used (about 400 to 950 nm). Because the brightness of the arc is connected with the amount of heat in high temperature iron vapor, which has a strong peak emission line at a 516.74 nm wavelength [39], and to also consider the outer cone of the electronic arc, that has a spectrum above 800 nm, and to reduce the influence of radiation that is close to UV (<500 nm), only the green and red camera channels were used. A low-pass filter was employed to remove high-frequency noisy pattern from the images. The next step was image thresholding (Figure 6b) to obtain binary (BW) arc rep-resentation. In the case of VIS images, the threshold was chosen arbitrarily on a level trVIS = 0.4 to keep high continuity of regions and to avoid reflexes that can lead to the multipli-cation of extracted ROIs. To overcome the situation when more than one objects were present in the binary image (Figure 6c), the larger object (with higher area) was always chosen for further analysis (Figure 6d). This was assumed as a sufficient representation of welding arc geometrical properties, because the proposed approach is not aimed at the exact measurement of welding arc length and orientation, but at assessing the welding process realization in a short time window based on the properties of the BW region con-taining representation of the welding arc in a broad wavelength range.
(a) (b) (c) (d)
Figure 6. Processing steps of visible light camera (VIS CAM) images: (a) original image—arc luminance; (b) low-pass filtered image—arc luminance; (c) binarized image; (d) binarized image with only the arc region of interest (ROI) remain-ing.
To ease the results’ implementation, VIS camera calibration was made in order to recalculate pixel size-based images to the real-life units. Taking into consideration camera parameters (resolution, pixel size on the camera matrix PS = 3.45 µm, focal length of the lens FL = 25 mm) and the working distance—the distance from the front of the lens to the electrode tip, WB = 500 mm—the field of view (FOV) and the pixel size in millimeters were calculated. The obtained results were: HFOV = 141.31 mm, VFOV = 105.98 mm, and IFOV = 0.069 mm.
3. Results and Discussion 3.1. Influence of Welding Current on Electric Arc Behaviour
Image sequences obtained on the test stand for arc length measuring (Figure 4a) were subjected to a processing procedure described in Section 2. In Figure 7, there are plots of
Figure 5. Processing steps of IR CAM images: (a) original image; (b) binarized and cropped image.
Sequences taken by the VIS camera were first processed in order to remove artefactswhich were the result of Bayer filtering (Figure 6a). Because there were no filters used, afull band of camera acquisition was used (about 400 to 950 nm). Because the brightnessof the arc is connected with the amount of heat in high temperature iron vapor, whichhas a strong peak emission line at a 516.74 nm wavelength [39], and to also considerthe outer cone of the electronic arc, that has a spectrum above 800 nm, and to reducethe influence of radiation that is close to UV (<500 nm), only the green and red camerachannels were used. A low-pass filter was employed to remove high-frequency noisypattern from the images. The next step was image thresholding (Figure 6b) to obtain binary(BW) arc representation. In the case of VIS images, the threshold was chosen arbitrarilyon a level trVIS = 0.4 to keep high continuity of regions and to avoid reflexes that canlead to the multiplication of extracted ROIs. To overcome the situation when more thanone objects were present in the binary image (Figure 6c), the larger object (with higherarea) was always chosen for further analysis (Figure 6d). This was assumed as a sufficientrepresentation of welding arc geometrical properties, because the proposed approach isnot aimed at the exact measurement of welding arc length and orientation, but at assessingthe welding process realization in a short time window based on the properties of the BWregion containing representation of the welding arc in a broad wavelength range.
Sensors 2021, 20, x FOR PEER REVIEW 7 of 21
(a) (b)
Figure 5. Processing steps of IR CAM images: (a) original image; (b) binarized and cropped image.
Sequences taken by the VIS camera were first processed in order to remove artefacts which were the result of Bayer filtering (Figure 6a). Because there were no filters used, a full band of camera acquisition was used (about 400 to 950 nm). Because the brightness of the arc is connected with the amount of heat in high temperature iron vapor, which has a strong peak emission line at a 516.74 nm wavelength [39], and to also consider the outer cone of the electronic arc, that has a spectrum above 800 nm, and to reduce the influence of radiation that is close to UV (<500 nm), only the green and red camera channels were used. A low-pass filter was employed to remove high-frequency noisy pattern from the images. The next step was image thresholding (Figure 6b) to obtain binary (BW) arc rep-resentation. In the case of VIS images, the threshold was chosen arbitrarily on a level trVIS = 0.4 to keep high continuity of regions and to avoid reflexes that can lead to the multipli-cation of extracted ROIs. To overcome the situation when more than one objects were present in the binary image (Figure 6c), the larger object (with higher area) was always chosen for further analysis (Figure 6d). This was assumed as a sufficient representation of welding arc geometrical properties, because the proposed approach is not aimed at the exact measurement of welding arc length and orientation, but at assessing the welding process realization in a short time window based on the properties of the BW region con-taining representation of the welding arc in a broad wavelength range.
(a) (b) (c) (d)
Figure 6. Processing steps of visible light camera (VIS CAM) images: (a) original image—arc luminance; (b) low-pass filtered image—arc luminance; (c) binarized image; (d) binarized image with only the arc region of interest (ROI) remain-ing.
To ease the results’ implementation, VIS camera calibration was made in order to recalculate pixel size-based images to the real-life units. Taking into consideration camera parameters (resolution, pixel size on the camera matrix PS = 3.45 µm, focal length of the lens FL = 25 mm) and the working distance—the distance from the front of the lens to the electrode tip, WB = 500 mm—the field of view (FOV) and the pixel size in millimeters were calculated. The obtained results were: HFOV = 141.31 mm, VFOV = 105.98 mm, and IFOV = 0.069 mm.
3. Results and Discussion 3.1. Influence of Welding Current on Electric Arc Behaviour
Image sequences obtained on the test stand for arc length measuring (Figure 4a) were subjected to a processing procedure described in Section 2. In Figure 7, there are plots of
Figure 6. Processing steps of visible light camera (VIS CAM) images: (a) original image—arc luminance; (b) low-passfiltered image—arc luminance; (c) binarized image; (d) binarized image with only the arc region of interest (ROI) remaining.
To ease the results’ implementation, VIS camera calibration was made in order torecalculate pixel size-based images to the real-life units. Taking into consideration cameraparameters (resolution, pixel size on the camera matrix PS = 3.45 µm, focal length of thelens FL = 25 mm) and the working distance—the distance from the front of the lens tothe electrode tip, WB = 500 mm—the field of view (FOV) and the pixel size in millimeterswere calculated. The obtained results were: HFOV = 141.31 mm, VFOV = 105.98 mm, andIFOV = 0.069 mm.
3. Results and Discussion3.1. Influence of Welding Current on Electric Arc Behaviour
Image sequences obtained on the test stand for arc length measuring (Figure 4a) weresubjected to a processing procedure described in Section 2. In Figure 7, there are plots of
Sensors 2021, 21, 84 8 of 21
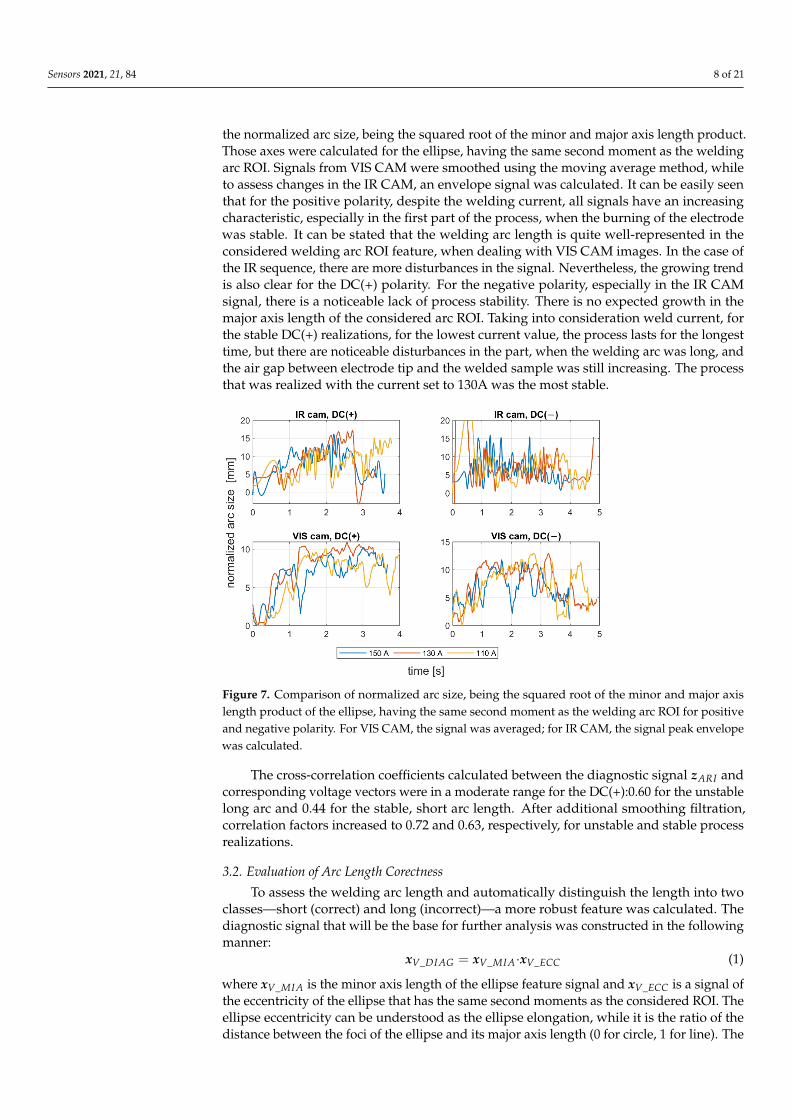
the normalized arc size, being the squared root of the minor and major axis length product.Those axes were calculated for the ellipse, having the same second moment as the weldingarc ROI. Signals from VIS CAM were smoothed using the moving average method, whileto assess changes in the IR CAM, an envelope signal was calculated. It can be easily seenthat for the positive polarity, despite the welding current, all signals have an increasingcharacteristic, especially in the first part of the process, when the burning of the electrodewas stable. It can be stated that the welding arc length is quite well-represented in theconsidered welding arc ROI feature, when dealing with VIS CAM images. In the case ofthe IR sequence, there are more disturbances in the signal. Nevertheless, the growing trendis also clear for the DC(+) polarity. For the negative polarity, especially in the IR CAMsignal, there is a noticeable lack of process stability. There is no expected growth in themajor axis length of the considered arc ROI. Taking into consideration weld current, forthe stable DC(+) realizations, for the lowest current value, the process lasts for the longesttime, but there are noticeable disturbances in the part, when the welding arc was long, andthe air gap between electrode tip and the welded sample was still increasing. The processthat was realized with the current set to 130A was the most stable.
Sensors 2021, 20, x FOR PEER REVIEW 8 of 21
the normalized arc size, being the squared root of the minor and major axis length prod-uct. Those axes were calculated for the ellipse, having the same second moment as the welding arc ROI. Signals from VIS CAM were smoothed using the moving average method, while to assess changes in the IR CAM, an envelope signal was calculated. It can be easily seen that for the positive polarity, despite the welding current, all signals have an increasing characteristic, especially in the first part of the process, when the burning of the electrode was stable. It can be stated that the welding arc length is quite well-repre-sented in the considered welding arc ROI feature, when dealing with VIS CAM images. In the case of the IR sequence, there are more disturbances in the signal. Nevertheless, the growing trend is also clear for the DC(+) polarity. For the negative polarity, especially in the IR CAM signal, there is a noticeable lack of process stability. There is no expected growth in the major axis length of the considered arc ROI. Taking into consideration weld current, for the stable DC(+) realizations, for the lowest current value, the process lasts for the longest time, but there are noticeable disturbances in the part, when the welding arc was long, and the air gap between electrode tip and the welded sample was still increas-ing. The process that was realized with the current set to 130A was the most stable.
Figure 7. Comparison of normalized arc size, being the squared root of the minor and major axis length product of the ellipse, having the same second moment as the welding arc ROI for positive and negative polarity. For VIS CAM, the signal was averaged; for IR CAM, the signal peak enve-lope was calculated.
The cross-correlation coefficients calculated between the diagnostic signal 𝒛 and corresponding voltage vectors were in a moderate range for the DC(+):0.60 for the unsta-ble long arc and 0.44 for the stable, short arc length. After additional smoothing filtration, correlation factors increased to 0.72 and 0.63, respectively, for unstable and stable process realizations.
3.2. Evaluation of Arc Length Corectness To assess the welding arc length and automatically distinguish the length into two
classes—short (correct) and long (incorrect)—a more robust feature was calculated. The diagnostic signal that will be the base for further analysis was constructed in the following manner: 𝒙 _ = 𝒙 _ ∙ 𝒙 _ (1)
where 𝒙 _ is the minor axis length of the ellipse feature signal and 𝒙 _ is a signal of the eccentricity of the ellipse that has the same second moments as the considered ROI. The ellipse eccentricity can be understood as the ellipse elongation, while it is the ratio of the distance between the foci of the ellipse and its major axis length (0 for circle, 1 for line).
Figure 7. Comparison of normalized arc size, being the squared root of the minor and major axislength product of the ellipse, having the same second moment as the welding arc ROI for positiveand negative polarity. For VIS CAM, the signal was averaged; for IR CAM, the signal peak envelopewas calculated.
The cross-correlation coefficients calculated between the diagnostic signal zARI andcorresponding voltage vectors were in a moderate range for the DC(+):0.60 for the unstablelong arc and 0.44 for the stable, short arc length. After additional smoothing filtration,correlation factors increased to 0.72 and 0.63, respectively, for unstable and stable processrealizations.
3.2. Evaluation of Arc Length Corectness
To assess the welding arc length and automatically distinguish the length into twoclasses—short (correct) and long (incorrect)—a more robust feature was calculated. Thediagnostic signal that will be the base for further analysis was constructed in the followingmanner:
xV_DIAG = xV_MIA·xV_ECC (1)
where xV_MIA is the minor axis length of the ellipse feature signal and xV_ECC is a signal ofthe eccentricity of the ellipse that has the same second moments as the considered ROI. Theellipse eccentricity can be understood as the ellipse elongation, while it is the ratio of thedistance between the foci of the ellipse and its major axis length (0 for circle, 1 for line). The

Sensors 2021, 21, 84 9 of 21
xV_DIAG underwent a moving average smoothing (xV_DIAG called mean). Additionally, amoving standard deviation (σV_DIAG called std) was calculated for the diagnostic signal. Inboth cases, the length of moving window was 30 samples. In Figure 8, there is a comparisonof xV_DIAG and σV_DIAG signals for DC(+) tests taken with different values of the weldingcurrent. It was found that with the increase in arc length, the span between the mean andstandard deviation signals increases. Moreover, while the mean increases, the standarddeviation remains on the same level. This phenomenon was the basis for the elaborationof a simple welding arc length indicator (zALI). The indicator takes the span between thexV_DIAG and σV_DIAG signals. The threshold value, which is used to distinguish betweenshort and long arc welding, was given by a formula:
zALI =
{1 when xV_DIAG > A and σV_DIAG > B
0 otherwise(2)
where zALI = 1 for the long welding arc. The decision constants A and B were foundusing a genetic algorithm. Finally, A = 15 mm and B = 5.2 mm, but it has to be assumedthat these values are only valid for the layout of the used test stand. The camera detectorresolution, lens focal length and the distance from the camera to the welding rod areespecially important to maintain. The binary arc length condition signal zALI can raise thealarm in two modes. In the first, the raw values of the zALI were used to trigger the firealarm when a maximal acceptable level is exceeded. In the second mode, a response delaywas set. In this mode, the arc overlength indicator was activated after the limit value wasconsecutively exceeded for the configured number of response delays (Figure 8).
Sensors 2021, 20, x FOR PEER REVIEW 9 of 21
The 𝒙 _ underwent a moving average smoothing (𝒙 _ called mean). Additionally, a moving standard deviation (𝝈 _ called std) was calculated for the diagnostic signal. In both cases, the length of moving window was 30 samples. In Figure 8, there is a com-parison of 𝒙 _ and 𝝈 _ signals for DC(+) tests taken with different values of the welding current. It was found that with the increase in arc length, the span between the mean and standard deviation signals increases. Moreover, while the mean increases, the standard deviation remains on the same level. This phenomenon was the basis for the elaboration of a simple welding arc length indicator (𝒛 ). The indicator takes the span between the 𝒙 _ and 𝝈 _ signals. The threshold value, which is used to distin-guish between short and long arc welding, was given by a formula: 𝒛 = 1 when 𝒙 _ > A and 𝝈 _ > B0 otherwise (2)
where 𝒛 =1 for the long welding arc. The decision constants A and B were found using a genetic algorithm. Finally, A = 15 mm and B = 5.2 mm, but it has to be assumed that these values are only valid for the layout of the used test stand. The camera detector resolution, lens focal length and the distance from the camera to the welding rod are especially im-portant to maintain. The binary arc length condition signal 𝒛 can raise the alarm in two modes. In the first, the raw values of the 𝒛 were used to trigger the fire alarm when a maximal acceptable level is exceeded. In the second mode, a response delay was set. In this mode, the arc overlength indicator was activated after the limit value was consecu-tively exceeded for the configured number of response delays (Figure 8).
Figure 8. Change in arc length for DC(+) polarity on the test stand and the arc length indicator 𝒛 for welding current: (a,b) 110A; (c,d) 130A; (e,f) 150A
3.3. Evaluation of Polarity Type Influence of polarity on arc shape is also visible when comparing several consecutive
VIS frames acquired for the same electrode position with a horizontal plane (Figure 9). For the positive polarity, all images look very similar in terms of shape dimensions and luminance distribution in the arc area. For negative polarity, there are considerable changes in how the arcs behave. The flame moves around the welding tip in all directions. The arc cone changes its dimensions, so all geometry-based features vary, including area, perimeter, extent, etc.
Figure 8. Change in arc length for DC(+) polarity on the test stand and the arc length indicator zALI for welding current:(a,b) 110A; (c,d) 130A; (e,f) 150A.
3.3. Evaluation of Polarity Type
Influence of polarity on arc shape is also visible when comparing several consecutiveVIS frames acquired for the same electrode position with a horizontal plane (Figure 9).For the positive polarity, all images look very similar in terms of shape dimensions andluminance distribution in the arc area. For negative polarity, there are considerable changesin how the arcs behave. The flame moves around the welding tip in all directions. The arccone changes its dimensions, so all geometry-based features vary, including area, perimeter,extent, etc.

Sensors 2021, 21, 84 10 of 21Sensors 2021, 20, x FOR PEER REVIEW 10 of 21
(a)
(b)
Figure 9. Five consecutive frames representing welding arc luminance taken by the VIS CAM: (a) short arc DC(+) cladding; (b) short arc DC(−) cladding.
Assessment of polarity was made in a different way than in the case of arc length. The metrics used were chosen to be independent of the absolute values of the thresholds. The same diagnostic signal 𝒙 _ was used in this case, but the averaging and standard deviation calculations were made in a short window, ∆𝑛 = 10 samples. The polarity in-dicator is defined as follows: 𝒛 = 1 when 𝒙 _ _ − 𝝈 _ 3𝝈 _ 0 otherwise , (3)
where 𝒛 =1 for the negative polarity. Exceeding the limit may be also signaled in two ways: immediately after crossing the limit value and in the second approach after the sig-nal exceeds the limit for certain number of response delays.
3.4. Arc Length-and Polarity Estimation in Real Process Visual evaluation of welds revealed typical faults that are provoked by the arc length.
When the arc is too long—in other words, when there is too great a distance between the rod and the work—the voltage will increase. This results in a flat and wide weld with a great deal of spatter. As the arc is quite unstable, there will be a real problem to remove risen slag from the edges of the weld. Too short an arc (at the begin of sample 11, Figure 10) produces a weld face that is uneven where it has been dragged along by the rod. For the short arc, the weld has a consistent profile, and the spatter rate is minimal.
Figure 9. Five consecutive frames representing welding arc luminance taken by the VIS CAM: (a) short arc DC(+) cladding;(b) short arc DC(−) cladding.
Assessment of polarity was made in a different way than in the case of arc length.The metrics used were chosen to be independent of the absolute values of the thresholds.The same diagnostic signal xV_DIAG was used in this case, but the averaging and standarddeviation calculations were made in a short window, ∆n = 10 samples. The polarityindicator is defined as follows:
zPLI =
{1 when xV_DIAG_2 − σV_DIAG2 > 3σV_DIAG2
0 otherwise(3)
where zPLI = 1 for the negative polarity. Exceeding the limit may be also signaled in twoways: immediately after crossing the limit value and in the second approach after thesignal exceeds the limit for certain number of response delays.
3.4. Arc Length-and Polarity Estimation in Real Process
Visual evaluation of welds revealed typical faults that are provoked by the arc length.When the arc is too long—in other words, when there is too great a distance between therod and the work—the voltage will increase. This results in a flat and wide weld with agreat deal of spatter. As the arc is quite unstable, there will be a real problem to removerisen slag from the edges of the weld. Too short an arc (at the begin of sample 11, Figure 10)produces a weld face that is uneven where it has been dragged along by the rod. For theshort arc, the weld has a consistent profile, and the spatter rate is minimal.
During the welding process it was noticed on the inverter welding machine screenthat for the 140 A DC current, the voltage varied in the range 24–25 V when there was acorrect and stable arc length. Measurements revealed (Figure 11) that this was the valuefor the optimal arc length. When the arc was long, the voltage was as high as 35–40 V. Onthe contrary, when the arc was too short, the voltage was as low as 20 V. This shows thatthe voltage change caused by welding arc length variations can exceed 20 V.
The applied polarity substantially influences the arc length and dynamics of arcchange. Analyzing the position of centroids of arc ROI in the IR camera sequences, it wasfound that the negative polarity is characterized with fast changes in arc length, and dueto highly unstable process realization, there is a difficulty in keeping the welding speedconstant (Figure 12). For the positive polarity, when the arc is too long, the dynamics of arcgeometry changes are also high, but the travel speed is easier to maintain on the same levelduring the whole process (Figure 13). The constant welding speed would be represented inthe X travel path as a straight line. Adding a trend line to all X travel scenarios, the R2 forthe positive polarity was around R2 = 0.98, while for negative polarity R2 < 0.93.

Sensors 2021, 21, 84 11 of 21
Sensors 2021, 20, x FOR PEER REVIEW 10 of 21
(a)
(b)
Figure 9. Five consecutive frames representing welding arc luminance taken by the VIS CAM: (a) short arc DC(+) cladding; (b) short arc DC(−) cladding.
Assessment of polarity was made in a different way than in the case of arc length. The metrics used were chosen to be independent of the absolute values of the thresholds. The same diagnostic signal 𝒙 _ was used in this case, but the averaging and standard deviation calculations were made in a short window, ∆𝑛 = 10 samples. The polarity in-dicator is defined as follows: 𝒛 = 1 when 𝒙 _ _ − 𝝈 _ 3𝝈 _ 0 otherwise , (3)
where 𝒛 =1 for the negative polarity. Exceeding the limit may be also signaled in two ways: immediately after crossing the limit value and in the second approach after the sig-nal exceeds the limit for certain number of response delays.
3.4. Arc Length-and Polarity Estimation in Real Process Visual evaluation of welds revealed typical faults that are provoked by the arc length.
When the arc is too long—in other words, when there is too great a distance between the rod and the work—the voltage will increase. This results in a flat and wide weld with a great deal of spatter. As the arc is quite unstable, there will be a real problem to remove risen slag from the edges of the weld. Too short an arc (at the begin of sample 11, Figure 10) produces a weld face that is uneven where it has been dragged along by the rod. For the short arc, the weld has a consistent profile, and the spatter rate is minimal.
Figure 10. View of test clads made during the experiment with the constant welding current 140 A.In the top row, cladding was performed using DC(−) polarity, while for the samples in the bottomrow, DC(+) polarity was applied. The welder performing the experiment made welds using three arclengths: samples 1,2,7,8—a short, stable arc was used, and arc length was about 3.5 mm; samples3,4,9,10—too long an arc was applied, and arc length was longer than 6mm; samples 5,6,11,12—thewelder changed the arc length during the process, it has changed from short, stable arc, to long,unstable one.
Sensors 2021, 20, x FOR PEER REVIEW 11 of 21
Figure 10. View of test clads made during the experiment with the constant welding current 140 A. In the top row, cladding was performed using DC(−) polarity, while for the samples in the bot-tom row, DC(+) polarity was applied. The welder performing the experiment made welds using three arc lengths: samples 1,2,7,8—a short, stable arc was used, and arc length was about 3.5 mm; samples 3,4,9,10—too long an arc was applied, and arc length was longer than 6mm; samples 5,6,11,12—the welder changed the arc length during the process, it has changed from short, stable arc, to long, unstable one.
During the welding process it was noticed on the inverter welding machine screen that for the 140 A DC current, the voltage varied in the range 24–25 V when there was a correct and stable arc length. Measurements revealed (Figure 11) that this was the value for the optimal arc length. When the arc was long, the voltage was as high as 35–40 V. On the contrary, when the arc was too short, the voltage was as low as 20 V. This shows that the voltage change caused by welding arc length variations can exceed 20 V.
(a) (b) (c)
Figure 11. Voltage change caused by arc length variations for the DC(+) polarity: (a) stable—short arc (s2); (b) unstable—long arc (s3); (c) varying length arc (s5).
The applied polarity substantially influences the arc length and dynamics of arc change. Analyzing the position of centroids of arc ROI in the IR camera sequences, it was found that the negative polarity is characterized with fast changes in arc length, and due to highly unstable process realization, there is a difficulty in keeping the welding speed constant (Figure 12). For the positive polarity, when the arc is too long, the dynamics of arc geometry changes are also high, but the travel speed is easier to maintain on the same level during the whole process (Figure 13). The constant welding speed would be repre-sented in the X travel path as a straight line. Adding a trend line to all X travel scenarios, the R2 for the positive polarity was around R2 = 0.98, while for negative polarity R2 < 0.93.
(a) (b)
Figure 12. Centroid changes of welding arc ROI in IR image during negative polarity cladding with varying arc length (s12): (a) welding arc length estimate; (b) welding speed estimate.
Figure 11. Voltage change caused by arc length variations for the DC(+) polarity: (a) stable—short arc (s2); (b) unstable—longarc (s3); (c) varying length arc (s5).
Sensors 2021, 20, x FOR PEER REVIEW 11 of 21
Figure 10. View of test clads made during the experiment with the constant welding current 140 A. In the top row, cladding was performed using DC(−) polarity, while for the samples in the bot-tom row, DC(+) polarity was applied. The welder performing the experiment made welds using three arc lengths: samples 1,2,7,8—a short, stable arc was used, and arc length was about 3.5 mm; samples 3,4,9,10—too long an arc was applied, and arc length was longer than 6mm; samples 5,6,11,12—the welder changed the arc length during the process, it has changed from short, stable arc, to long, unstable one.
During the welding process it was noticed on the inverter welding machine screen that for the 140 A DC current, the voltage varied in the range 24–25 V when there was a correct and stable arc length. Measurements revealed (Figure 11) that this was the value for the optimal arc length. When the arc was long, the voltage was as high as 35–40 V. On the contrary, when the arc was too short, the voltage was as low as 20 V. This shows that the voltage change caused by welding arc length variations can exceed 20 V.
(a) (b) (c)
Figure 11. Voltage change caused by arc length variations for the DC(+) polarity: (a) stable—short arc (s2); (b) unstable—long arc (s3); (c) varying length arc (s5).
The applied polarity substantially influences the arc length and dynamics of arc change. Analyzing the position of centroids of arc ROI in the IR camera sequences, it was found that the negative polarity is characterized with fast changes in arc length, and due to highly unstable process realization, there is a difficulty in keeping the welding speed constant (Figure 12). For the positive polarity, when the arc is too long, the dynamics of arc geometry changes are also high, but the travel speed is easier to maintain on the same level during the whole process (Figure 13). The constant welding speed would be repre-sented in the X travel path as a straight line. Adding a trend line to all X travel scenarios, the R2 for the positive polarity was around R2 = 0.98, while for negative polarity R2 < 0.93.
(a) (b)
Figure 12. Centroid changes of welding arc ROI in IR image during negative polarity cladding with varying arc length (s12): (a) welding arc length estimate; (b) welding speed estimate. Figure 12. Centroid changes of welding arc ROI in IR image during negative polarity cladding withvarying arc length (s12): (a) welding arc length estimate; (b) welding speed estimate.

Sensors 2021, 21, 84 12 of 21
Sensors 2021, 20, x FOR PEER REVIEW 12 of 21
(a) (b)
(c) (d)
Figure 13. Centroid changes of welding arc ROI in IR image during positive polarity cladding with a constant arc length: (a) welding arc length estimate for short arc (s5); (b) welding speed estimate for short arc; (c) welding arc length estimate for long arc (s3); (d) welding speed estimate for long arc.
Quantification of the welding arc length and polarity type was performed on all available samples. In Figures 14–19, exemplary results are presented. In each figure, there are: a. Sliding window mean 𝒙 _ and sliding windows standard deviation 𝝈 _
calculated for window length ∆𝑛 = 30 samples. b. Sliding window mean 𝒙 _ and sliding windows standard deviation 𝝈 _
calculated for window length ∆𝑛 = 10 samples and difference among them 𝒙 _ − 𝝈 _ . c. Welding arc length indicator (𝒛 ) as a raw value and with a hysteresis lasting 30
response delays (samples). d. Polarity indicator (𝒛 ) as a raw value and with a hysteresis lasting 30 response de-
lays (samples). Comparing means and standard deviations of the diagnostic signal in the longer time
window (Figures 14–19a), the mean feature value is always strongly connected with the arc length. It can be seen in Figure 16a that the increase in arc length around the 13th second is significant. In this moment, the welder had lifted the rod tip and as a result the arc length was so long that it neatly caused the arc’s extinction. Moreover, problems with arc ignition are also visible at the welding procedure’s beginning, where the mean feature value is 0 (same the standard deviation). A similar situation can be found when analyzing the DC(−) polarity (Figure 19a). The standard deviation 𝝈 _ signal values were also elevated when welding with a long arc. It is generally lower for the negative polarity, which is caused by the smoothing in feature calculation, because high impulses, provoked by arc instability, are in this case removed. Applying the welding arc length indicator (𝒛 ) with the limits mentioned in Section 3.2., a decisive signal can be extracted. When dealing with raw 𝒛 values, in each procedure a smaller or larger number of regions suspected of exceeding the optimal arc length can be found.
Figure 13. Centroid changes of welding arc ROI in IR image during positive polarity cladding with aconstant arc length: (a) welding arc length estimate for short arc (s5); (b) welding speed estimate forshort arc; (c) welding arc length estimate for long arc (s3); (d) welding speed estimate for long arc.
Quantification of the welding arc length and polarity type was performed on allavailable samples. In Figures 14–19, exemplary results are presented. In each figure, thereare:
a. Sliding window mean xV_DIAG and sliding windows standard deviation σV_DIAGcalculated for window length ∆n = 30 samples.
b. Sliding window mean xV_DIAG2 and sliding windows standard deviation σV_DIAG2calculated for window length ∆n = 10 samples and difference among them(xV_DIAG2 − σV_DIAG2).
c. Welding arc length indicator (zALI) as a raw value and with a hysteresis lasting 30response delays (samples).
d. Polarity indicator (zPLI) as a raw value and with a hysteresis lasting 30 responsedelays (samples).
Comparing means and standard deviations of the diagnostic signal in the longer timewindow (Figures 14, 15, 16, 17, 18 and 19a), the mean feature value is always stronglyconnected with the arc length. It can be seen in Figure 16a that the increase in arc lengtharound the 13th second is significant. In this moment, the welder had lifted the rod tip andas a result the arc length was so long that it neatly caused the arc’s extinction. Moreover,problems with arc ignition are also visible at the welding procedure’s beginning, where themean feature value is 0 (same the standard deviation). A similar situation can be foundwhen analyzing the DC(−) polarity (Figure 19a). The standard deviation σV_DIAG signalvalues were also elevated when welding with a long arc. It is generally lower for thenegative polarity, which is caused by the smoothing in feature calculation, because highimpulses, provoked by arc instability, are in this case removed. Applying the weldingarc length indicator (zALI) with the limits mentioned in Section 3.2., a decisive signal canbe extracted. When dealing with raw zALI values, in each procedure a smaller or largernumber of regions suspected of exceeding the optimal arc length can be found.
In the trails made on the arc length test stand, for the DC(+) process carried out withcurrent set on 150 A, the maximal arc length was equal to about 250% of the electrodediameter (Figure 20). The same ratio can be observed in the feature presented in Figures 13,14 and 15a. The stable arc glows when the feature is below the 10 mm level, while for thelong arc, the value tends to 40 mm. For the negative polarity, arc elongation can be even

Sensors 2021, 21, 84 13 of 21
higher in terms of deviation from the optimal arc length (more than 300%). This makes itpossible to calibrate the VIS CAM measurement to track arc length in the dimension units.Sensors 2021, 20, x FOR PEER REVIEW 13 of 21
Figure 14. VIS CAM arc length ROI features for DC(+) short arc length process: (a) Sliding window mean 𝒙 _ and sliding windows standard deviation 𝝈 _ calculated for window length ∆𝑛 = 30 samples; (b) sliding window mean 𝒙 _ and sliding windows standard deviation 𝝈 _ calculated for window length ∆n=10 samples and difference among them 𝒙 _ −𝝈 _ ; (c) Welding arc length indicator (𝒛 ) as a raw value and with a hysteresis lasting 30 re-sponse delays (samples); (d) Polarity indicator (𝒛 ) as a raw value and with a hysteresis lasting 30 response delays (samples).
Figure 15. VIS CAM arc length ROI features for DC(+) long arc length process: (a) Sliding window mean 𝒙 _ and sliding windows standard deviation 𝝈 _ calculated for window length ∆𝑛 = 30 samples; (b) sliding window mean 𝒙 _ and sliding windows standard deviation 𝝈 _ calculated for window length ∆n=10 samples and difference among them 𝒙 _ −𝝈 _ ; (c) Welding arc length indicator (𝒛 ) as a raw value and with a hysteresis lasting 30 re-sponse delays (samples); (d) Polarity indicator (𝒛 ) as a raw value and with a hysteresis lasting 30 response delays (samples).
Figure 14. VIS CAM arc length ROI features for DC(+) short arc length process: (a) Slidingwindow mean xV_DIAG and sliding windows standard deviation σV_DIAG calculated for win-dow length ∆n = 30 samples; (b) sliding window mean xV_DIAG2 and sliding windows standarddeviation σV_DIAG calculated for window length ∆n = 10 samples and difference among themxV_DIAG − σV_DIAG; (c) Welding arc length indicator (zALI) as a raw value and with a hysteresislasting 30 response delays (samples); (d) Polarity indicator (zPLI) as a raw value and with a hysteresislasting 30 response delays (samples).
Sensors 2021, 20, x FOR PEER REVIEW 13 of 21
Figure 14. VIS CAM arc length ROI features for DC(+) short arc length process: (a) Sliding window mean 𝒙 _ and sliding windows standard deviation 𝝈 _ calculated for window length ∆𝑛 = 30 samples; (b) sliding window mean 𝒙 _ and sliding windows standard deviation 𝝈 _ calculated for window length ∆n=10 samples and difference among them 𝒙 _ −𝝈 _ ; (c) Welding arc length indicator (𝒛 ) as a raw value and with a hysteresis lasting 30 re-sponse delays (samples); (d) Polarity indicator (𝒛 ) as a raw value and with a hysteresis lasting 30 response delays (samples).
Figure 15. VIS CAM arc length ROI features for DC(+) long arc length process: (a) Sliding window mean 𝒙 _ and sliding windows standard deviation 𝝈 _ calculated for window length ∆𝑛 = 30 samples; (b) sliding window mean 𝒙 _ and sliding windows standard deviation 𝝈 _ calculated for window length ∆n=10 samples and difference among them 𝒙 _ −𝝈 _ ; (c) Welding arc length indicator (𝒛 ) as a raw value and with a hysteresis lasting 30 re-sponse delays (samples); (d) Polarity indicator (𝒛 ) as a raw value and with a hysteresis lasting 30 response delays (samples).
Figure 15. VIS CAM arc length ROI features for DC(+) long arc length process: (a) Slidingwindow mean xV_DIAG and sliding windows standard deviation σV_DIAG calculated for win-dow length ∆n = 30 samples; (b) sliding window mean xV_DIAG2 and sliding windows standarddeviation σV_DIAG calculated for window length ∆n = 10 samples and difference among themxV_DIAG − σV_DIAG; (c) Welding arc length indicator (zALI) as a raw value and with a hysteresislasting 30 response delays (samples); (d) Polarity indicator (zPLI) as a raw value and with a hysteresislasting 30 response delays (samples).

Sensors 2021, 21, 84 14 of 21
Sensors 2021, 20, x FOR PEER REVIEW 14 of 21
Figure 16. VIS CAM arc length ROI features for DC(+) varying arc length process.: (a) Sliding win-dow mean 𝒙 _ and sliding windows standard deviation 𝝈 _ calculated for window length ∆𝑛 = 30 samples; (b) sliding window mean 𝒙 _ and sliding windows standard devia-tion 𝝈 _ calculated for window length ∆n=10 samples and difference among them 𝒙 _ −𝝈 _ ; (c) Welding arc length indicator (𝒛 ) as a raw value and with a hysteresis lasting 30 re-sponse delays (samples); (d) Polarity indicator (𝒛 ) as a raw value and with a hysteresis lasting 30 response delays (samples).
Figure 17. VIS CAM arc length ROI features for DC(−) short arc length process.: (a) Sliding win-dow mean 𝒙 _ and sliding windows standard deviation 𝝈 _ calculated for window length ∆𝑛 = 30 samples; (b) sliding window mean 𝒙 _ and sliding windows standard devia-tion 𝝈 _ calculated for window length ∆n=10 samples and difference among them 𝒙 _ −𝝈 _ ; (c) Welding arc length indicator (𝒛 ) as a raw value and with a hysteresis lasting 30 re-sponse delays (samples); (d) Polarity indicator (𝒛 ) as a raw value and with a hysteresis lasting 30 response delays (samples).
Figure 16. VIS CAM arc length ROI features for DC(+) varying arc length process: (a) Slidingwindow mean xV_DIAG and sliding windows standard deviation σV_DIAG calculated for win-dow length ∆n = 30 samples; (b) sliding window mean xV_DIAG2 and sliding windows standarddeviation σV_DIAG calculated for window length ∆n = 10 samples and difference among themxV_DIAG − σV_DIAG; (c) Welding arc length indicator (zALI) as a raw value and with a hysteresislasting 30 response delays (samples); (d) Polarity indicator (zPLI) as a raw value and with a hysteresislasting 30 response delays (samples).
Sensors 2021, 20, x FOR PEER REVIEW 14 of 21
Figure 16. VIS CAM arc length ROI features for DC(+) varying arc length process.: (a) Sliding win-dow mean 𝒙 _ and sliding windows standard deviation 𝝈 _ calculated for window length ∆𝑛 = 30 samples; (b) sliding window mean 𝒙 _ and sliding windows standard devia-tion 𝝈 _ calculated for window length ∆n=10 samples and difference among them 𝒙 _ −𝝈 _ ; (c) Welding arc length indicator (𝒛 ) as a raw value and with a hysteresis lasting 30 re-sponse delays (samples); (d) Polarity indicator (𝒛 ) as a raw value and with a hysteresis lasting 30 response delays (samples).
Figure 17. VIS CAM arc length ROI features for DC(−) short arc length process.: (a) Sliding win-dow mean 𝒙 _ and sliding windows standard deviation 𝝈 _ calculated for window length ∆𝑛 = 30 samples; (b) sliding window mean 𝒙 _ and sliding windows standard devia-tion 𝝈 _ calculated for window length ∆n=10 samples and difference among them 𝒙 _ −𝝈 _ ; (c) Welding arc length indicator (𝒛 ) as a raw value and with a hysteresis lasting 30 re-sponse delays (samples); (d) Polarity indicator (𝒛 ) as a raw value and with a hysteresis lasting 30 response delays (samples).
Figure 17. VIS CAM arc length ROI features for DC(−) short arc length process: (a) Slidingwindow mean xV_DIAG and sliding windows standard deviation σV_DIAG calculated for win-dow length ∆n = 30 samples; (b) sliding window mean xV_DIAG2 and sliding windows standarddeviation σV_DIAG calculated for window length ∆n = 10 samples and difference among themxV_DIAG − σV_DIAG; (c) Welding arc length indicator (zALI) as a raw value and with a hysteresislasting 30 response delays (samples); (d) Polarity indicator (zPLI) as a raw value and with a hysteresislasting 30 response delays (samples).

Sensors 2021, 21, 84 15 of 21
Sensors 2021, 20, x FOR PEER REVIEW 15 of 21
Figure 18. VIS CAM arc length ROI features for DC(−) long arc length process : (a) Sliding window mean 𝒙 _ and sliding windows standard deviation 𝝈 _ calculated for window length ∆𝑛 = 30 samples; (b) sliding window mean 𝒙 _ and sliding windows standard deviation 𝝈 _ calculated for window length ∆n=10 samples and difference among them 𝒙 _ −𝝈 _ ; (c) Welding arc length indicator (𝒛 ) as a raw value and with a hysteresis lasting 30 re-sponse delays (samples); (d) Polarity indicator (𝒛 ) as a raw value and with a hysteresis lasting 30 response delays (samples).
Figure 19. VIS CAM arc length ROI features for DC(−) varying arc length process: (a) Sliding win-dow mean 𝒙 _ and sliding windows standard deviation 𝝈 _ calculated for window length ∆𝑛 = 30 samples; (b) sliding window mean 𝒙 _ and sliding windows standard devia-tion 𝝈 _ calculated for window length ∆n=10 samples and difference among them 𝒙 _ −𝝈 _ ; (c) Welding arc length indicator (𝒛 ) as a raw value and with a hysteresis lasting 30 re-sponse delays (samples); (d) Polarity indicator (𝒛 ) as a raw value and with a hysteresis lasting 30 response delays (samples).
In the trails made on the arc length test stand, for the DC(+) process carried out with current set on 150 A, the maximal arc length was equal to about 250% of the electrode diameter (Figure 20). The same ratio can be observed in the feature presented in Figures 13–15a. The stable arc glows when the feature is below the 10 mm level, while for the long arc, the value tends to 40 mm. For the negative polarity, arc elongation can be even higher in terms of deviation from the optimal arc length (more than 300%). This makes it possible to calibrate the VIS CAM measurement to track arc length in the dimension units.
Figure 18. VIS CAM arc length ROI features for DC(−) long arc length process: (a) Slidingwindow mean xV_DIAG and sliding windows standard deviation σV_DIAG calculated for win-dow length ∆n = 30 samples; (b) sliding window mean xV_DIAG2 and sliding windows standarddeviation σV_DIAG calculated for window length ∆n = 10 samples and difference among themxV_DIAG − σV_DIAG; (c) Welding arc length indicator (zALI) as a raw value and with a hysteresislasting 30 response delays (samples); (d) Polarity indicator (zPLI) as a raw value and with a hysteresislasting 30 response delays (samples).
Sensors 2021, 20, x FOR PEER REVIEW 15 of 21
Figure 18. VIS CAM arc length ROI features for DC(−) long arc length process : (a) Sliding window mean 𝒙 _ and sliding windows standard deviation 𝝈 _ calculated for window length ∆𝑛 = 30 samples; (b) sliding window mean 𝒙 _ and sliding windows standard deviation 𝝈 _ calculated for window length ∆n=10 samples and difference among them 𝒙 _ −𝝈 _ ; (c) Welding arc length indicator (𝒛 ) as a raw value and with a hysteresis lasting 30 re-sponse delays (samples); (d) Polarity indicator (𝒛 ) as a raw value and with a hysteresis lasting 30 response delays (samples).
Figure 19. VIS CAM arc length ROI features for DC(−) varying arc length process: (a) Sliding win-dow mean 𝒙 _ and sliding windows standard deviation 𝝈 _ calculated for window length ∆𝑛 = 30 samples; (b) sliding window mean 𝒙 _ and sliding windows standard devia-tion 𝝈 _ calculated for window length ∆n=10 samples and difference among them 𝒙 _ −𝝈 _ ; (c) Welding arc length indicator (𝒛 ) as a raw value and with a hysteresis lasting 30 re-sponse delays (samples); (d) Polarity indicator (𝒛 ) as a raw value and with a hysteresis lasting 30 response delays (samples).
In the trails made on the arc length test stand, for the DC(+) process carried out with current set on 150 A, the maximal arc length was equal to about 250% of the electrode diameter (Figure 20). The same ratio can be observed in the feature presented in Figures 13–15a. The stable arc glows when the feature is below the 10 mm level, while for the long arc, the value tends to 40 mm. For the negative polarity, arc elongation can be even higher in terms of deviation from the optimal arc length (more than 300%). This makes it possible to calibrate the VIS CAM measurement to track arc length in the dimension units.
Figure 19. VIS CAM arc length ROI features for DC(−) varying arc length process: (a) Slidingwindow mean xV_DIAG and sliding windows standard deviation σV_DIAG calculated for win-dow length ∆n = 30 samples; (b) sliding window mean xV_DIAG2 and sliding windows standarddeviation σV_DIAG calculated for window length ∆n = 10 samples and difference among themxV_DIAG − σV_DIAG; (c) Welding arc length indicator (zALI) as a raw value and with a hysteresislasting 30 response delays (samples); (d) Polarity indicator (zPLI) as a raw value and with a hysteresislasting 30 response delays (samples).

Sensors 2021, 21, 84 16 of 21
Sensors 2021, 20, x FOR PEER REVIEW 16 of 21
Figure 20. Arc length luminance and geometry variation, DC(+), 150A, at the begin of the arc glowing (left) and before arc extinction (right).
Assessing the polarity, to avoid application of negative polarity, in which the heat is mostly transferred to the electrode tip, not in the joint direction, is an important task, es-pecially during MMA training. It was found that for the negative polarity, the span be-tween the minima of the diagnostic signal is expressed as min (𝒙 _ ) = 𝒙 _ −𝝈 _ , and the multiplicity of standard deviation is larger, as for the positive polarity. While the diagnostic signal is calculated as a product of ellipse eccentricity and ellipse minor axis length (the ellipse that has the same second order moments as the arc ROI), it is easy to explain this phenomenon. For positive polarity for the same distance between electrode tip and work, the arc cone is quite narrow, and thus it has low eccentricity, while the corresponding ellipse is more elongated than circular and at the same time the minor axis length of the ellipse is small. For the negative polarity, the arc moves round the elec-trode tip. In the VIS CAM image, due to a relatively long exposition time, the arc cone diameter is apparently wider. Thus, the eccentricity is higher, as in the case of DC(+) po-larity. At the same time, due to blurry arc representation, the standard deviation is lower, because in a wide range, the arc moves within the apparent bright arc cone. Having a large mean value and small standard deviation of 𝒙 _ _ signal is a key factor to assign po-larity indicator. This relationship is clearest for the short arc case, where 𝒙 _ and 𝝈 _ are close to each other for the DC(+), being for the similar case separated when DC(−) is used.
According to the obtained arc length indicators that have been used to assess process stability and to polarity indicators describing the direction in which DC current is sup-plied to the arc, two quantitative metrices were proposed to judge the correctness of arc length and polarity type. The arc length index describes the ratio between the sum of the arc over length indicators 𝑎𝑙 in a certain time window and the length of the time win-dows expressed in a total number of recorded images in this time range 𝑛∆ : 𝒂𝒍 = 1𝑛∆ 𝑎𝑙∆
(4)
In a similar way, the polarity index was defined, where 𝑝𝑙 is the number of polarity indicators, which point to the presence of negative polarity in a certain time moment: 𝒑𝒍 = 1𝑛∆ 𝑝𝑙∆
(5)
The results obtained for all considered arc length classes and polarities are gathered in Table 3. Indexes 𝒂𝒍 and 𝒑𝒍 were calculated for the whole realization of the process and parts of the process. When realizations of parts of the process were undertaken, the whole signal was divided into three even fragments. In the first, the influence of arc ignition is present, and the second one should be the most stable part of the process, while the last one contains the arc extinction. After investigation of the results, it was revealed that there is a clear border between the short and long arc and between positive and negative polar-ity.
Table 3. Arc length and polarity index values calculated for raw arc length indicator and polarity indicator vectors.
Figure 20. Arc length luminance and geometry variation, DC(+), 150A, at the begin of the arc glowing(left) and before arc extinction (right).
Assessing the polarity, to avoid application of negative polarity, in which the heat ismostly transferred to the electrode tip, not in the joint direction, is an important task, espe-cially during MMA training. It was found that for the negative polarity, the span betweenthe minima of the diagnostic signal is expressed as min(xV_DIAG2) = xV_DIAG2 − σV_DIAG2,and the multiplicity of standard deviation is larger, as for the positive polarity. While thediagnostic signal is calculated as a product of ellipse eccentricity and ellipse minor axislength (the ellipse that has the same second order moments as the arc ROI), it is easy toexplain this phenomenon. For positive polarity for the same distance between electrodetip and work, the arc cone is quite narrow, and thus it has low eccentricity, while thecorresponding ellipse is more elongated than circular and at the same time the minor axislength of the ellipse is small. For the negative polarity, the arc moves round the electrodetip. In the VIS CAM image, due to a relatively long exposition time, the arc cone diameteris apparently wider. Thus, the eccentricity is higher, as in the case of DC(+) polarity. At thesame time, due to blurry arc representation, the standard deviation is lower, because in awide range, the arc moves within the apparent bright arc cone. Having a large mean valueand small standard deviation of xV_DIAG_2 signal is a key factor to assign polarity indicator.This relationship is clearest for the short arc case, where xV_DIAG2 and σV_DIAG2 are closeto each other for the DC(+), being for the similar case separated when DC(−) is used.
According to the obtained arc length indicators that have been used to assess processstability and to polarity indicators describing the direction in which DC current is suppliedto the arc, two quantitative metrices were proposed to judge the correctness of arc lengthand polarity type. The arc length index describes the ratio between the sum of the arcover length indicators ali in a certain time window and the length of the time windowsexpressed in a total number of recorded images in this time range n∆ti:
al =1
n∆ti∑∆ti
i=1 ali (4)
In a similar way, the polarity index was defined, where pli is the number of polarityindicators, which point to the presence of negative polarity in a certain time moment:
pl =1
n∆ti∑∆ti
i=1 pli (5)
The results obtained for all considered arc length classes and polarities are gatheredin Table 3. Indexes al and pl were calculated for the whole realization of the process andparts of the process. When realizations of parts of the process were undertaken, the wholesignal was divided into three even fragments. In the first, the influence of arc ignition ispresent, and the second one should be the most stable part of the process, while the last onecontains the arc extinction. After investigation of the results, it was revealed that there is aclear border between the short and long arc and between positive and negative polarity.

Sensors 2021, 21, 84 17 of 21
Table 3. Arc length and polarity index values calculated for raw arc length indicator and polarity indicator vectors.
Welding Scenario Arc Length Index al Whole Arc Length Index alBegin/Middle
Process Polarity plIndex Whole
Process Polarity Indexpl Middle
DC(+) stable 0.01 0.00/0.01 0.10 0.14DC(+) unstable 0.84 0.80/0.84 0.29 0.14DC(+) mixed 0.51 0.00/0.56 0.14 0.15DC(−) stable 0.06 0.12/0.00 0.26 0.36
DC(−) unstable 0.97 0.99/0.94 0.28 0.31DC(−) mixed 0.45 0.13/0.22 0.23 0.35
The arc length index calculated for the whole signal length is below 0.1 for the shortarc (the stable process with DC(+) polarity), below 0.15 for DC(−) polarity with a short,stable arc, and above 0.80 for a long arc that is associated with an unstable process. Whenlooking at a shorter fragment of the process, the al increases, and the rise is more significantfor the neutral polarity. In addition, observing the change in the al index, it is possibleto point out when the arc has crossed the limit level, and the process is thus going to beunstable. According to that, it is possible both to inform a welding trainee that the distancebetween the electrode tip and the welded material is too long or to signal to an experiencedwelder or welding trainer that the process has become unstable.
A similar situation is seen with the polarity index pl. For the short arc, there is aconsiderable gap between pl values expressing positive and negative polarity. For the longarc, the values are high for both polarities, making the distinction among them impossible.This is caused because the index is vulnerable to large fluctuations in the arc shape in thestart and extinction phase of the MMA process conducted with a long arc. When only themiddle part of the process is quantified, the interval between polarities is much higher,because the value for the positive polarity average is plDC(+) = 0.14, while for negativepolarity it is plDC(−) = 0.34.
4. Prototype of End-User Device
To allow further testing of the proposed method and to ease the method applicationin welding training, a prototype of a stand-alone welding monitor device was integrated.There were two types of device proposed, differing in the control unit hardware and theavailability of a GUI (Graphic User Interface, Figure 21). In the first version, the systemcontrol unit was a PC, with Matlab 2020b application that offered a GUI for the user(Figure 22b). In the second proposition, the system was made more portable. The controlunit was a Raspberry Pi4 B (RP4), and in this case, there was no GUI for the user. The RP4computer was selected, because previous versions of Raspberry Pi were not equippedwith a full Gigabit Ethernet (this was emulated by USB2). Because of the relatively lowprocessing capability of the RP4, the image acquisition was made with a reduced framesize (half of the original image). This does not influence the method selectivity, but in thiscase, processing was made only at maximal 5 fps. The application on RP4 was configuredin offline mode, using an external monitor and configuration setup that was stored in .xmlfiles. For both system setups, the communication with the welder and trainer is madethrough a light indicator (Figure 22a). Communication between the central unit and theLED indicator is made through an I/O block offering Modbus TCP in the case of setup Awith PC, and via a relay module in the case of Setup B.

Sensors 2021, 21, 84 18 of 21
Sensors 2021, 20, x FOR PEER REVIEW 18 of 21
Figure 21. End-user weld monitoring systems setups, with the PC as a central unit (setup A) and a low-cost portable design with Raspberry Pi4 (setup B).
(a) (b)
Figure 22. (a) View of I/O module—Turck TBEN TBEN-S2-2COM-4DXP, Turck GmbH & Co. KG, Mulheim, Germany, and indicating light Banner K50LGRYPQ; (b) screenshot of System A GUI, made in Matlab App Designer.
Additionally, in the Matlab GUI, an option to introduce a custom user camera and to change the working distance setting in order to properly apply the stability and polarity detection principle. Moreover, this setting preserves the comparability of results using various CMOS cameras, equipped with lenses characterizing by custom focal length.
The hardware used to build the monitoring system in setup B, where the processing is performed by a Raspberry Pi4 computer, makes the system an economically optimized alternative to commercial systems in the area of process stability assessment. Addition-ally, the used camera, in terms of offered resolution and acquisition speed, is on a similar level to off-the-shelf systems, where 30 fps is the currently offered level [40–42] (max. 55 fps [43]) and the spatial resolution is mostly around full HD level [40–43].
5. Conclusions In this paper, an approach for assessing welding arc stability and polarity in MMA
welding is presented. To evaluate both properties, a visible light camera was used. The proposed method has been confronted with arc voltage and infrared thermograms to con-firm its stability. It has been found that joint application of geometry features applied for ROI containing binary representation of the welding arc can act as a diagnostic signal, which carries information about process stability. Appling a sliding window algorithm to calculate the average and standard deviation of the diagnostic signal allowed formulation of criteria that can be used to distinguish short (stable) and long unstable arcs, as well as the polarity type. Because for the proposed arc length and polarity index, the span be-tween arc length and polarity classes is large, the method is a robust one, giving a mar-ginal chance for misclassification (for the proven set of welded samples). It is a novel ap-proach, because in the literature there are no other propositions on how to assess the MMA polarity with the use of a visible light vision system. The proposed approach can be used to aid MMA welder training. In addition, it can be introduced to monitor linear
Figure 21. End-user weld monitoring systems setups, with the PC as a central unit (setup A) and a low-cost portable designwith Raspberry Pi4 (setup B).
Sensors 2021, 20, x FOR PEER REVIEW 18 of 21
Figure 21. End-user weld monitoring systems setups, with the PC as a central unit (setup A) and a low-cost portable design with Raspberry Pi4 (setup B).
(a) (b)
Figure 22. (a) View of I/O module—Turck TBEN TBEN-S2-2COM-4DXP, Turck GmbH & Co. KG, Mulheim, Germany, and indicating light Banner K50LGRYPQ; (b) screenshot of System A GUI, made in Matlab App Designer.
Additionally, in the Matlab GUI, an option to introduce a custom user camera and to change the working distance setting in order to properly apply the stability and polarity detection principle. Moreover, this setting preserves the comparability of results using various CMOS cameras, equipped with lenses characterizing by custom focal length.
The hardware used to build the monitoring system in setup B, where the processing is performed by a Raspberry Pi4 computer, makes the system an economically optimized alternative to commercial systems in the area of process stability assessment. Addition-ally, the used camera, in terms of offered resolution and acquisition speed, is on a similar level to off-the-shelf systems, where 30 fps is the currently offered level [40–42] (max. 55 fps [43]) and the spatial resolution is mostly around full HD level [40–43].
5. Conclusions In this paper, an approach for assessing welding arc stability and polarity in MMA
welding is presented. To evaluate both properties, a visible light camera was used. The proposed method has been confronted with arc voltage and infrared thermograms to con-firm its stability. It has been found that joint application of geometry features applied for ROI containing binary representation of the welding arc can act as a diagnostic signal, which carries information about process stability. Appling a sliding window algorithm to calculate the average and standard deviation of the diagnostic signal allowed formulation of criteria that can be used to distinguish short (stable) and long unstable arcs, as well as the polarity type. Because for the proposed arc length and polarity index, the span be-tween arc length and polarity classes is large, the method is a robust one, giving a mar-ginal chance for misclassification (for the proven set of welded samples). It is a novel ap-proach, because in the literature there are no other propositions on how to assess the MMA polarity with the use of a visible light vision system. The proposed approach can be used to aid MMA welder training. In addition, it can be introduced to monitor linear
Figure 22. (a) View of I/O module—Turck TBEN TBEN-S2-2COM-4DXP, Turck GmbH & Co. KG, Mulheim, Germany, andindicating light Banner K50LGRYPQ; (b) screenshot of System A GUI, made in Matlab App Designer.
Additionally, in the Matlab GUI, an option to introduce a custom user camera and tochange the working distance setting in order to properly apply the stability and polaritydetection principle. Moreover, this setting preserves the comparability of results usingvarious CMOS cameras, equipped with lenses characterizing by custom focal length.
The hardware used to build the monitoring system in setup B, where the processingis performed by a Raspberry Pi4 computer, makes the system an economically optimizedalternative to commercial systems in the area of process stability assessment. Additionally,the used camera, in terms of offered resolution and acquisition speed, is on a similar levelto off-the-shelf systems, where 30 fps is the currently offered level [40–42] (max. 55 fps [43])and the spatial resolution is mostly around full HD level [40–43].
5. Conclusions
In this paper, an approach for assessing welding arc stability and polarity in MMAwelding is presented. To evaluate both properties, a visible light camera was used. Theproposed method has been confronted with arc voltage and infrared thermograms toconfirm its stability. It has been found that joint application of geometry features appliedfor ROI containing binary representation of the welding arc can act as a diagnostic signal,which carries information about process stability. Appling a sliding window algorithm tocalculate the average and standard deviation of the diagnostic signal allowed formulationof criteria that can be used to distinguish short (stable) and long unstable arcs, as well as thepolarity type. Because for the proposed arc length and polarity index, the span between arclength and polarity classes is large, the method is a robust one, giving a marginal chancefor misclassification (for the proven set of welded samples). It is a novel approach, becausein the literature there are no other propositions on how to assess the MMA polarity withthe use of a visible light vision system. The proposed approach can be used to aid MMA

Sensors 2021, 21, 84 19 of 21
welder training. In addition, it can be introduced to monitor linear butt welding in harshenvironments, e.g., in underwater welding, where the welder is deprived of the possibilityof using their hearing for evaluation of process stability and their sight is also providinglimited information.
Monitoring of welding processes is a vital issue, and many research teams and indus-trial companies are working on proposing a robust and reliable tool for the quantificationof welding processes and the resulting joint quality. The majority of efforts relate to autom-atized or robotized methods, where process parameters are key factors of process stabilityand they determine the weld quality. In MMA, keeping the desired parameters is mainlyin hands of the welder, because he must maintain a constant arc length while moving theelectrode tip toward the welded material and moving the electrode across the weldinggroove. This demands a certain skill. The proposed approach is an innovative one, becauseit gives a feedback to the welder (during the training) when he keeps the arc at constantlength, and when the arc length has changed, and it is too long. This is a novel solution,different from those in which high frequency measurements of welding parameters aredemanded. It is also other type of educational aid, other than virtual welding devices. Asthe obtained results show, this method is a good start for future development, while in itscurrent form, it provides valuable information to the welder, with a time delay of 1/30 s.
The aim of the research was to evaluate the stability of the manual welding processwith coated electrodes based on the analysis of the arc length (which reflects arc voltage).The obtained results make it possible to control the process in terms of maintaining theappropriate arc length, which translates into the correctness of the welding process and theelimination of welding incompatibilities.
In summary, the most important conclusions are:
• The proposed approach is suitable for the detection of too long a welding arc anddistinction between a positive and negative polarity of welding current,
• Using visible light cameras, the user response can be made in an online mode, that isonly limited by camera speed (30 fps),
• A prototype was elaborated, that can be easily applied in real-life applications andtuned to user camera. Additionally, it is robust to changes in the stand’s geometricalsetup.
To generalize the proposed method, it is necessary to perform further studies on alarger set of joints that must be made with various parameters. Because in the currentstage the proposed approach was only assessed for down-hand welding (cladding), itsvalidity to other types of welding, e.g., overhead welding, will be investigated in the futureresearch. The next step should also be the application of system other than the RaspberryPi4 computer. Implementation of the proposed algorithm on a computer with a strong GPU,such as NVIDIA Jetson or NVIDA Xavier, could be an option to increase the performance.
Author Contributions: Conceptualization, W.J. and J.G.; methodology, W.J. and J.G.; software, W.J.;validation, W.J. and J.G.; formal analysis, J.G.; investigation, J.G. and W.J.; resources, J.G.; writing—original draft preparation, W.J.; writing—review and editing, J.G.; visualization, W.J. All authorshave read and agreed to the published version of the manuscript.
Funding: The publication of the study was co-funded using the statutory subsidy of the Faculty ofMechanical Engineering of the Silesian University of Technology in 2020.
Institutional Review Board Statement: Not applicable.
Informed Consent Statement: Not applicable.
Data Availability Statement: The data presented in this study are available on request from thecorresponding author.
Conflicts of Interest: The authors declare no conflict of interest. The founding sponsors had no rolein the design of the study; in the collection, analyses, or interpretation of data; in the writing of themanuscript, and in the decision to publish the results.

Sensors 2021, 21, 84 20 of 21
References1. Weman, K. Manual metal arc (MMA) welding with coated electrodes. In Woodhead Publishing Series in Welding and Other Joining
Technologies, 2nd ed.; Woodhead Publishing: Cambridge, UK, 2012; pp. 99–103. [CrossRef]2. Zuk, M.; Górka, J.; Dojka, R.; Czuprynski, A. Repair welding of cast iron coated electrodes. IOP Conf. Ser. Mater. Sci. Eng. 2017,
227, 012139. [CrossRef]3. Tomków, J.; Rogalski, G.; Fydrych, D.; Łabanowski, J. Advantages of the Application of the Temper Bead Welding Technique
During Wet Welding. Materials 2019, 12, 915. [CrossRef] [PubMed]4. Wegrzyn, T.; Wieszala, R. Significant alloy elements in welded steel structures of car body. Arch. Metall. Mater. 2012, 57, 45–52.
[CrossRef]5. Tomków, J.; Fydrych, D.; Rogalski, G. Dissimilar underwater wet welding of HSLA steels. Int. J. Adv. Manuf. Technol. 2020,
109, 717–725. [CrossRef]6. Górka, J.; Jamrozik, W. Application of time-frequency methods for assessment of gas metal arc welding condition. In Proceed-
ings of the Dynamical Systems in Applications DSTA 2017, Cham, Switzerland, 10 September 2018; Springer Proceedings inMathematics & Statistics: Cham, Switzerland, 2018; Volume 249, pp. 125–133. [CrossRef]
7. Zuk, M.; Górka, J.; Jamrozik, W. Simulated Heat-Affected Zone of Steel 4330V. Mater. Perform. Charact. 2019, 8, 606–613. [CrossRef]8. Chmielewski, T.; Golanski, D. The role of welding in the remanufacturing process. Weld. Int. 2015, 29, 861–864. [CrossRef]9. Mician, M.; Harmaniak, D.; Novy, F.; Winczek, J.; Moravec, J.; Trsko, L. Effect of the t(8/5) Cooling Time on the Properties of
S960MC Steel in the HAZ of Welded Joints Evaluated by Thermal Physical Simulation. Metals 2020, 10, 229. [CrossRef]10. Kik, T. Computational Techniques in Numerical Simulations of Arc and Laser Welding Processes. Materials 2020, 13, 608.
[CrossRef]11. Zhang, W.J.; Liu, Y.K.; Wang, X.W.; Zhang, Y.M. Characterization of three-dimensional weld pool surface in gas tungsten arc
welding. Weld. J. 2012, 91, 195–203.12. Zhang, W.J.; Zhang, Y.M. Modelling of human welder response to 3D weld pool surface: Part, I. Principles. Weld. J. 2012,
91, 310–318.13. Zhang, W.J.; Zhang, Y.M. Modelling of human welder response to 3D weld pool surface: Part II. Results and analysis. Weld. J.
2012, 91, 329–353.14. Kumar, V.; Albert, S.; Chandrasekhar, N.; Jayapandian, J. Evaluation of welding skill using probability density distributions and
neural network analysis. Measurement 2018, 116, 114–121. [CrossRef]15. Jamrozik, W.; Górka, J.; Kiel-Jamrozik, M. Detection of slag inclusions in MMA joints with passive thermography techniques.
Diagnostyka 2020, 21, 111–117. [CrossRef]16. Huang, Y.; Wang, K.; Zhou, Q.; Fang, J.; Zhou, Z. Feature extraction for gas metal arc welding based on EMD and time–frequency
entropy. Int. J. Adv. Manuf. Technol. 2017, 92, 1439–1448. [CrossRef]17. Fidali, M.; Jamrozik, W. Method of classification of global machine conditions based on spectral features of infrared images and
classifiers fusion. Quant. Infrared Thermogr. J. 2019, 16, 129–145. [CrossRef]18. Quinn, T.P.; Smith, C.; Mccowan, C.N. Arc sensing for defects in constant-voltage gas metal arc welding. Weld. J. 1999, 78, 322–328.19. Duley, W.; Mao, Y. The effect of surface condition on acoustic emission during welding of aluminium with CO2 laser radiation.
J. Phys. D Appl. Phys. 1994, 27, 1379. [CrossRef]20. Alfaro, S.C.A.; Vargas, J.A.R.; De Carvalho, G.C.; De Souza, G.G. Characterization of “humping” in the GTA welding process
using infrared images. J. Mater. Process. Technol. 2015, 223, 216–224. [CrossRef]21. Jamrozik, W. Modified random walker segmentation method of welding arc thermograms for welding process diagnostics. Int. J.
Mater. Prod. Technol. 2015, 51, 281–295. [CrossRef]22. Zhang, Y.; Zhang, N.; You, D.; Gao, X.; Katayama, S. High-power disk laser welding statuses monitoring based on analyses of
multiple-sensor signals. J. Manuf. Process. 2019, 41, 221–230. [CrossRef]23. Pal, K.; Bhattacharya, S.; Pal, S.K. Multisesor-based monitoring of weld deposition and plate distortion for various torch angles in
pulsed MIG welding. Int. J. Adv. Manuf. Technol. 2010, 50, 543–556. [CrossRef]24. Moon, H.S.; Yong, B.K.; Beattie, R.J. Multi sensor data fusion for improving performance and reliability of fully automatic welding
system. Int. J. Adv. Manuf. Technol. 2006, 28, 286–293. [CrossRef]25. Djebala, A.; Babouri, M.K.; Ouelaa, N. Rolling bearing fault detection using a hybrid method based on empirical mode
decomposition and optimized wavelet multi-resolution analysis. Int. J. Adv. Manuf. Technol. 2015, 79, 2093–2105. [CrossRef]26. Prezelj, J.; Udina, M.; Polajnar, I. Use of audible sound for on-line monitoring of gas metal arc welding process. Metalurgija 2008,
47, 81–85.27. Pal, K.; Pal, S.K. Monitoring of weld penetration using arc acoustics. Adv. Manuf. Process. 2011, 26, 684–693. [CrossRef]28. Chen, B.; Chen, S. Multi-sensor information fusion in pulsed GTAW based on fuzzy measure and fuzzy integral. Assem. Autom.
2010, 30, 276–285. [CrossRef]29. Bestard, G.; Sampaio, R.; Vargas, J.; Alfaro, S. Sensor fusion to estimate the depth and width of the weld bead in real time in
GMAW processes. Sensors 2018, 18, 962. [CrossRef]30. Dos Santos, E.B.F.; Kuroiwa, L.H.; Ferreira, A.F.C.; Pistor, R.; Gerlich, A.P. On the Visualization of Gas Metal Arc Welding Plasma
and the Relationship Between Arc Length and Voltage. Appl. Sci. 2017, 7, 503. [CrossRef]

Sensors 2021, 21, 84 21 of 21
31. Guo, B.; Shi, Y.; Yu, G.; Liang, B.; Wang, K. Weld deviation detection based on wide dynamic range vision sensor in MAG weldingprocess. Int. J. Adv. Manuf. Technol. 2016, 87, 3397–3410. [CrossRef]
32. Babouri, M.K.; Ouelaa, N.; Djebala, A. Experimental study of tool life transition and wear monitoring in turning operation usinga hybrid method based on wavelet multi-resolution analysis and empirical mode decomposition. Int. J. Adv. Manuf. Technol. 2016,82, 2017–2028. [CrossRef]
33. Yusof, M.F.M.; Kamaruzaman, M.A.; Ishak, M.; Ghazali, M.F. Porosity detection by analyzing arc sound signal acquired duringthe welding process of gas pipeline steel. Int. J. Adv. Manuf. Technol. 2017, 89, 3661–3670. [CrossRef]
34. Fidali, M.; Jamrozik, W. Diagnostic method of welding process based on fused infrared and vision images. Infrared Phys. Technol.2013, 61, 241–253. [CrossRef]
35. He, Y.; Li, D.; Pan, Z.; Ma, G.; Yu, L.; Yuan, H.; Le, J. Dynamic Modeling of Weld Bead Geometry Features in Thick Plate GMAWBased on Machine Vision and Learning. Sensors 2020, 20, 7104. [CrossRef] [PubMed]
36. Xiao, R.; Xu, Y.; Hou, Z.; Chen, C.; Chen, S. An adaptive feature extraction algorithm for multiple typical seam tracking based onvision sensor in robotic arc welding. Sens. Actuators A Phys. 2019, 297, 111533. [CrossRef]
37. Moradpour, M.A.; Hashemi, S.H.; Khalili, K. Machine vision implementation for off-line measurement of weld bead geometry iNAPI X65 pipeline steel. UPB Sci. Bull. D Mech. Eng. 2014, 76, 137–148.
38. Mikołajczyk, T.K.; Nowicki, K.; Bustillo, A.; Yu Pimenov, D. Predicting tool life in turning operations using neural networks andimage processing. Mech. Syst. Signal Process. 2018, 76, 503–513. [CrossRef]
39. Kramida, A.; Ralchenko, Y.; Reader, J.; Team, N.A. NIST Atomic Spectra Database (Ver. 5.3); National Institute of Standards andTechnology: Gaithersburg, MD, USA, 2015. Available online: http://physics.nist.gov/asd (accessed on 14 October 2020).
40. ESAB Camera Systems. Available online: https://www.esabna.com/us/en/products/welding-automation-robotics/orbital-welding/vision-systems/camera-systems.cfm (accessed on 5 December 2020).
41. iShot INTERTEST Camera. Available online: https://intertest.com/ishotr-weld-ir-hd-saw-sub-arc-welding-camera-system.html(accessed on 7 December 2020).
42. Cavitar Welding Camera. Available online: https://www.cavitar.com/product/cavitar-welding-camera/ (accessed on 11 December 2020).43. XIRIS Seam Monitor. Available online: https://www.xiris.com/xiris-seam-monitor/ (accessed on 7 December 2020).