Embed Size (px)
Citation preview

Walden UniversityScholarWorks
Walden Dissertations and Doctoral Studies Walden Dissertations and Doctoral StudiesCollection
2016
Assessing Information Technology and BusinessAlignment in Local City GovernmentLeslie Milbourne D'AnjouWalden University
Follow this and additional works at: https://scholarworks.waldenu.edu/dissertations
Part of the Business Administration, Management, and Operations Commons, Databases andInformation Systems Commons, and the Management Sciences and Quantitative MethodsCommons
This Dissertation is brought to you for free and open access by the Walden Dissertations and Doctoral Studies Collection at ScholarWorks. It has beenaccepted for inclusion in Walden Dissertations and Doctoral Studies by an authorized administrator of ScholarWorks. For more information, pleasecontact [email protected].

Walden University
College of Management and Technology
This is to certify that the doctoral dissertation by
Leslie Danjou
has been found to be complete and satisfactory in all respects,
and that any and all revisions required by
the review committee have been made.
Review Committee
Dr. David Gould, Committee Chairperson, Management Faculty
Dr. Stuart Gold, Committee Member, Management Faculty
Dr. Nikunja Swain, University Reviewer, Management Faculty
Chief Academic Officer
Eric Riedel, Ph.D.
Walden University
2016

Abstract
Assessing Information Technology and Business Alignment in Local City Government
Agencies
Leslie M. D’Anjou
MBA, DeVry University, 2008
BS, DeVry University, 2006
Dissertation Submitted in Partial Fulfillment
of the Requirements for the Degree of
Doctor of Philosophy
Management
Walden University
January 2016

Abstract
Top executives are interested in more transparent and formalized structures, applicable
measurements, and clear justification of alignment. Limited or improper information
technology governance (ITG) affects the business strategy that will ultimately influence
the overall business alignment in local city government agencies (LCGAs). The problem
addressed in this study was the lack of information regarding LCGAs IT/business
strategic alignment maturity model (SAMM) level and the LCGAs’ employment size.
The purpose of this survey study was to evaluate 48 LCGA participants in the
Southwestern part of the United States and compare their alignment perceptions with
their cities’ employment size. The theoretical framework for this study was based on ITG
and business strategy as measured by the SAMM instrument. An online survey was used
for data collection and data results were analyzed using descriptive statistics and an
Analysis of Variance. After using the SAMM instrument, the current snapshot maturity
level of LCGAs was 2.49 out of a maximum 5.0 level. Results illustrated no significant
relationship between LCGAs alignment maturity levels and a city’s size. This study
empowers positive social change by providing LCGAs 6 incremental steps to improve the
overall alignment maturity level in areas of transparent and formalized structures,
applicable measurements, and improved alignment measures.

Assessing Information Technology and Business Alignment in Local City Government
Agencies
by
Leslie M. D’Anjou
MBA, DeVry, 2008
BS, DeVry, 2006
Dissertation Submitted in Partial Fulfillment
of the Requirements for the Degree of
Doctor of Philosophy
Management
Walden University
January 2016

Dedication
I dedicate this dissertation as a believer in Jesus Christ who deserves all the glory,
honor, and praise for providing me this opportunity to reach this level of education. May
I use all of God’s blessings to fulfill my purpose here on earth!

Acknowledgments
My family has been my biggest supporter throughout this entire process. My wife,
Angellicia D’Anjou, daughter, Avyannah D’Anjou, and son, Levi D’Anjou have been
great supporters. Having my soul-mate, Angellicia, understand the time requirement
demanded from a Ph.D. makes me more in love with her. She has been my balance
throughout this entire process. She has given me just what I needed in love, support,
understanding, patience, and leeway to dig-in and complete this journey. Thanks, much
Honey! I love you with all my heart. Special thanks much also go out to my Dad and
Mom, John & Ruth D’Anjou, who have been my voice of reason, prayer warriors, and
support. I must also thank my two brothers and their families; John D’Anjou Jr., Santita
D’Anjou, John D’Anjou III, and Johanna D’Anjou; along with James D’Anjou, Kessa
D’Anjou, Ezra D’Anjou, and Eliana D’Anjou. Extended thanks must also go out to my
Father-In-Law, Richard Schultz, Mother-In-Law, Joylin Harding, Brothers-In-Law,
Philip Whyte, Sister-In-Law, Alisa Whyte, my little brother Aaron Schultz (expecting to
call you Dr. Schultz soon), and my Aunty Judy Griffith.
Without the help of my Dissertation Chair and Committee members who
contributed enormously, this would not have been plausible. My Team of two highly
accomplished advisors has been my shoulders to lean on with answering questions,
providing guidance, sharing insight and so much more. Many thanks go out to Dr. David
Gould for being my Committee Chair, Faculty Advisor, and my guide to success. Many
thanks also go out to Dr. Stuart Gold for verifying and validation my methodology.

Finally, thanks to my URR, Dr. Nikunja Swain and my Forms and Styles reviewer, Dr.
Travis Sands.
Many thanks must also go out to my team of supporters within LCGAs. Several
city managers have gone far and beyond the call of duty. They have given me guidance,
support, and mentorship that I’m much grateful and not worth to receive. Thank you both
much! Much thanks go out to several others and everyone who have taken this survey
and supported this study. Thank you all for your time and help.
Lastly, I would like to acknowledge Walden University for providing me with
the vessel to attain this high honor in completing my Ph.D. The bold idea to have all
Ph.D. Students focus on social change was and is tangible and attainable. All of the
resources, user-friendly online classes, residencies, and knowledge gained have given me
the ability to complete this great task. I would recommend Walden University to anyone
who is looking for a high quality higher education. Through Walden, I was able to be in
contact, work with, and gain invaluable insight from Dr. Luftman, the subject matter
expert of the IT/business strategic alignment-maturity assessment tool. Thank you Dr.
Luftman for taking your valuable time to spend it with me.
This entire process has been a great experience. Thank you all! Thank you, God!

i
Table of Contents
List of Tables .......................................................................................................................v
List of Figures .................................................................................................................... vi
Chapter 1: Introduction to the Study ....................................................................................1
Background of the Study ...............................................................................................1
Local City Government Agencies (LCGAs)........................................................... 2
IT/Business Alignment ........................................................................................... 6
Summary ................................................................................................................. 9
Problem Statement .......................................................................................................10
Purpose of the Study ....................................................................................................10
Research Question .......................................................................................................11
Theoretical Framework ................................................................................................13
Nature of the Study ......................................................................................................14
Definition of Terms......................................................................................................15
Assumptions .................................................................................................................17
Limitations ...................................................................................................................18
Scope and Delimitations ..............................................................................................18
Significance of the Study .............................................................................................19
Significance to Theory .......................................................................................... 19
Significance to Practice......................................................................................... 19
Significance to Social Change .............................................................................. 20
Summary ......................................................................................................................20

ii
Chapter 2: Literature Review .............................................................................................22
Search Strategy ............................................................................................................23
Theoretical Foundation ................................................................................................23
Computer Era ........................................................................................................ 25
Management of Information Systems Era ............................................................ 26
Governance Era ..................................................................................................... 28
Literature Review.........................................................................................................29
History of ITG....................................................................................................... 30
ITG Methodology ................................................................................................. 36
ITIL…. .................................................................................................................. 38
Business Strategy .................................................................................................. 41
IT in the Public Sector .......................................................................................... 44
Literature and Research Based Analysis ............................................................... 47
Present Study ........................................................................................................ 48
Rationale ............................................................................................................... 56
Summary and Conclusions ..........................................................................................56
Chapter 3: Research Method ..............................................................................................58
Research Design and Rationale ...................................................................................58
Methodology ................................................................................................................61
Population ............................................................................................................. 64
Sampling and Sampling Procedures ..................................................................... 64
Procedures for Recruitment, Participation, and Data Collection .......................... 68

iii
Instrumentation and Operationalization of Constructs ......................................... 69
Dependent Variables ............................................................................................. 70
Independent Variable ............................................................................................ 72
Data Analysis ...............................................................................................................72
Threats to Validity .......................................................................................................75
External Validity ................................................................................................... 75
Internal Validity .................................................................................................... 75
Construct Validity ................................................................................................. 76
Ethical Procedures ................................................................................................ 76
Summary ......................................................................................................................78
Chapter 4: Results ..............................................................................................................79
Data Collection ............................................................................................................80
Plan/Time Frame ................................................................................................... 80
Discrepancies ........................................................................................................ 81
Descriptive Statistics ............................................................................................. 85
Results ..........................................................................................................................89
Summary ....................................................................................................................103
Chapter 5: Discussion, Conclusions, and Recommendations ..........................................105
Interpretation of the Findings .....................................................................................106
Limitations of the Study.............................................................................................110
Recommendations ......................................................................................................111
Implication of Social Change.....................................................................................113
iv
Conclusion .................................................................................................................114
References ........................................................................................................................116
Appendix A: Consent Forms ...........................................................................................130
Appendix B: SAMM Survey Questions ..........................................................................132
Appendix C: Letter of Recruitment .................................................................................137
Appendix D: Participant Reminder E-mail ......................................................................139
Appendix E: SurveyMonkey Acknowledgement Informed Consent Form .....................140

v
List of Tables
Table 1. Public Sector ITG Strategy and Business Strategy ............................................. 52
Table 2. Strategic Alignment Maturity Categories ........................................................... 60
Table 3. LCGAs Frequencies ............................................................................................ 87
Table 4. Overall Descriptive Statistics.............................................................................. 88
Table 5. Descriptive Statistics – Mean Score, Standard Deviation, and FTEsize ............ 89
vi
List of Figures
Figure 1. LCGAs strategic alignment structure ...................................................................4
Figure 2. Chen (2010) maturity model fit test ...................................................................54
Figure 3. Worst case expected responses ...........................................................................66
Figure 4. Simple scatter dot plot ........................................................................................84
Figure 5. Histogram of SAMM ..........................................................................................85
Figure 6. Analysis of variance for SAMM ........................................................................90
Figure 7. SAMM mean plot ...............................................................................................91
Figure 8. Analysis of variance for Comm ..........................................................................92
Figure 9. Comm mean plot ................................................................................................93
Figure 10. Analysis of variance for Comp .........................................................................94
Figure 11. Comp mean plot .............................................................................................954
Figure 12. Analysis of variance for Gov ............................................................................96
Figure 13. Gov mean plot ..................................................................................................97
Figure 14. Analysis of variance for Part ............................................................................98
Figure 15. Part mean plot ...................................................................................................99
Figure 16. Analysis of variance for Scope .......................................................................100
Figure 17. Scope mean plot .............................................................................................101
Figure 18. Analysis of variance for Skills .......................................................................102
Figure 19. Skills mean plot ..............................................................................................103
Figure 20. SAMM maturity level adjustment ..................................................................112

1
Chapter 1: Introduction to the Study
Luftman (2000) described information technology (IT) and business alignment as
a harmonic relationship. Chen (2010) has likewise asserted that IT and business must be
in harmony for them to align correctly. An in-depth understanding of IT and business can
be achieved by understanding information technology governance (ITG) and business
strategy. It is noted that De Haes and Van Grembergen (2009) found that there is a
positive relationship between IT/business alignment and the usage of information
technology governance (ITG). Business strategy is measured by how well an organization
performs as it relates to structure, processes, and its environment (Croteau & Bergeron,
2001). These two topics inform the examination of IT/business alignment in local city
government agencies (LCGAs).
Chapter 1 includes the following sections: background of the study, problem
statement, purpose statement, research questions/hypotheses, nature of the study,
definition of terms, assumptions, scope/delimitations, limitations, significance of the
study, and a summary. Across this chapter, I assert that alignment must be imperative to
LCGAs because misalignment causes organizational failure (Chen, 2010). This chapter
also includes the initial implications for positive social change as it relates to IT and
business alignment.
Background of the Study
Building a good understand of how LCGAs can influence everyone’s way of life
can help demonstrate why proper alignment is necessary. In this background section, I
provide information needed to comprehend LCGAs structures, ITG structures, and

2
business strategies structures. Each of these subsections is necessary to build a sound
foundation.
Local City Government Agencies (LCGAs)
According to Abels (2014), LCGAs have been forced to realign their financial
dependency, practices, and structures to what is today called “the new normal” in
government. The new norm consist of citizens’ increased demands for local services
while budgetary dynamics are increasingly austere in the face of decreases in funding
from federal and state agencies (Abels, 2014). In the past, LCGAs could depend on
federal and state funding, but after the Great Recession things have changed. Less money
is available, but more demand is being experienced.
The citizens served by a LCGA expect a particular level of support. Abels (2014)
noted that citizens expect a better quality of life, air to breathe, and safe water to drink.
He noted further that citizens also expect to enjoy recreation facilities, have access to jobs
high-quality schooling, live in safe communities, and care for the less fortunate (Abels,
2014). In terms of organizational structure, citizens see themselves on top of the
organizational chart. Citizens insist that their expectations and needs must be the driving
force in the direction in which LCGAs progress.
Most LCGAs have organizational charts that are similar. They place their citizen
as head of their organizational chart followed by the mayor or council members, and then
the city employees. The intentions of LCGAs based on their organizational chart are note
worthy but Abels (2014) noted that even though citizens were aware and invited to the
planning stages, they had limited influence on the overall strategic plans.

3
Figure 1 displays a general structure of LCGAs’ overall strategic alignment as it
relates to its citizens. Citizens are the stakeholders of the city. Their taxes account for
more than half of the accounts receivable. Their feedback and the city council’s approval
help create the community plan. Abel (2014) has suggested that citizens have no impact
on the overall strategic plan, but many cities have taken the step to include citizens
through the development of a community plan. In the strategic alignment, the city council
functions as the board of directors for LCGAs. They are the liaisons and decision makers
between the citizens and the city management. The organizational strategy should be
static and constant eliminating biases from change leadership.
Then city management has the task to align and fulfill the community plan. They
do this by conducting organizational assessments of the city status, employee feedback,
strategic plan, departmental strategic and operational plans, and performance reviews.
There are constant checks and balances to verify and validate that work is being
performed at the highest standard possible. Alignment must occur to maximize
performance.

4
Figure 1. LCGAs strategic alignment structure.
Many factors have changed the perspectives of LCGAs. Martin, Levey, and
Cawley (2012) noted that the results from the great recession of 2008 have changed the
dichotomy of LCGAs in services and employment. Now, LCGAs has to use new business
strategies to deal with the new normal. Abels (2014) suggested that they refocus their
mission, reestablish processes and efficiencies, and learn to cope with less.

5
The new normal of LCGAs can be described as a fiscal environment characterized
by restrained revenues and limited expenditures (Martin et al., 2012). According to Abels
(2014), regional collaboration among other LCGAs organization can provide a real
solution to financial burdens. Another suggestion is to increase taxes, but most citizens
do not want to hear about or support tax increases. Martin et al. (2012) noted that the
Government Finance Officers Association (GFOA) recommended fees such as building,
parks and recreation, false alarms, title searches, tree planting, voter’s information,
permits, and the like to increase funding. As funding decreases in one or more ways,
funding will be acquired in another way. Privatization of many city functions and a new
set of hidden taxes that comes in the forms of fees and requirements will influence social
change in the new normal. Each LCGA must find ways to improve systems to eliminate
waste.
Another perspective of the new normal is in the employment arena. According to
Martin et al. (2012), new LCGAs hires will have limited compensation and benefits
packages. These authors also noted that job cuts, stagnant salaries, and fewer jobs will be
available within LCGAs (Martin et al., 2012). According to the Annual Questionnaire of
Public Employment (2014), 22 million jobs in 2013 were in the public sector, of which
63% of those jobs are in LCGAs. Before the great recession, a government job was
desirable. In the new normal environment, employment will be reduced marginally
(Abels, 2014). Therefore, top executives need to find better ways of meeting and
exceeding demand with fewer resources.

6
Moreover, another factor in the new normal environment are employee benefits.
According to Martin et al. (2012), LCGAs can expect to have a smaller workforce with
fewer benefits. The Annual Questionnaire of Public Employment (2014) noted that in the
year 2012, LCGAs lost 156,877 jobs. It is becoming more difficult for cities to attract top
talent. Many employees are looking to the private industry for higher wages and better
benefits. City employees are required to do more with fewer benefits. There is no longer
the attraction of having better benefits while working for local government. As
employment is being reduced and likely will continue in the future, top executives need a
plan to manage the additional workload. It is important to know how well LCGAs aligns
based on their current full-time employee (FTE) sizes in order to meet the demands of the
new normal.
Finding new ways to provide services in the new normal is a need that top
executives are looking to improve. Martin et al. (2012) described how LCGAs would
have to make hard decisions as to which service should stay or go, how to pay for it, and
who should deliver it. Even though the demand for services is increasing, the supplied
services are being decreased and the citizens will pay more and receive less. This
overview has offered a brief description of LCGAs. It is clear that these agencies have
taken on a new normal after the great recession. As the demand increases and the funding
decreases, the LCGAs have to find ways to make better use of the limited resources.
IT/Business Alignment
This study focused on IT and business alignment by first, looking at IT in terms of
ITG, and second by looking at business in terms of business strategy. Chen (2010) noted

7
that in order to achieve alignment, organizations must understand that it is an ongoing
effort in designing business strategies, implementing best business practices, realigning
goals, and continually improving strategic planning. The strategic alignment maturity
model (SAMM) instrument is the tool that measures the maturity level between
IT/business.
I used an executive perspective to examine ITG and business strategy externally
and internally. In the early 1990s, ITG started gaining increased use in commercial and
government agencies. According to Magnusson and Bygstad (2013), ITG is now gaining
rapid approval both academically and professionally. The literature has demonstrated
how a component of ITG is a critical component of strategic alignment and has presented
SAMM as a viable instrument for assessing business alignment. For instance, Luftman
(2000) assessed business/IT alignment using SAMM to understand the maturity levels of
businesses. Using Luftman’s SAMM instrument, Chen (2010) studied how companies in
China align in terms of business/IT by. Similarly, I sought to add to this body of
knowledge by examining the maturity levels in LCGAs in the southwest region of the
United States.
Aligning ITG with business strategy is important for any organization because it
provides performance improvements (Chen, 2010). Jairak and Praneetpolgrang (2013)
described ITG in term of three perspectives including decision rights and accountability,
business and IT strategies, and structure and processes. Building on these perspectives,
my study focused on examining IT/business strategic alignment as measured by the
SAMM instrument. Top executives of government agencies need to understand the
8
relationship between ITG and their business strategy alignment to understand where they
are at and what it will take to advance to the next level.
In addition, many government agencies face accounting irregularities such as
unbalanced budgets, debt, and request for bankruptcy. There is a need to examine the
relationship between ITG strategic alignment and business strategy alignment in terms of
the financial health of any organization (Kuhn, Ahuja, & Mueller, 2013). One example of
the most critical policies that affect both the private agencies directly and public agencies
indirectly is the Sarbanes-Oxley Act (SOX) of 2002. Producing corporate accountability
has been the driving force for the federal mandates.
According to Jacobson (2009), ITG is a subclass of corporate governance or
corporate business strategy. Kuhn, Ahuja, and Mueller (2013) indicated that insufficient
awareness or misunderstanding of operational controls could potentially lead to financial
loss. According to Abu-Musa (2009), ITG is quickly becoming the standard by which
most organizations use to comply with state/federal policies. If government agencies
ignore the failures of publicly traded agencies in providing effective ITG, then
accounting irregularities may be imminent. The accounting irregularities of Enron
resulted in the most widely reported violation of all time. Having proven alignment
standards in place can help to cultivate good behavior and identify wrongdoings.
Creating an environment that has proven alignment standards is essential to
LCGA. According to Wong, Ngan, Chan, and Chong (2012), IT/business alignment is the
perfect application for measuring the IT support of the organization’s needs, goals, and
strategies. El-Mekawy, Rusu, and Perjons (2015) noted that IT/business alignment
9
improves when business places the value on IT. Achieving alignment is a continuous
effort at shaping the strategies of the business, implementing best practices, realigning
goals, and planning strategically (Chen, 2010). Strategic IT/business alignment is
important today and will be in the future for any organization.
Several ITG methodologies exist to help govern an IT department. Methodologies
such as Information Technology Infrastructure Library (ITIL), Control Objectives for
Information and Related Technology (COBIT), and Information Security Framework
dominate the ITG framework. These ITG methodologies help to document the best
practices and formal approaches for organizations to follow strategically.
Figure 1 shows that IT/business strategy alignment falls directly under city
management in the organizational framework tool. City managers should be consistently
assessing each process, department, and their agency as a whole. If there are no
assessment or checks and balances of processes, then there will be no urgency to
improve. I used an assessment tool for LCGAs as it relates to IT/business strategy
alignment.
Summary
Therefore, one of the ways LCGAs can eliminating waste and maximize their
limited resources is through proper IT/business alignment. Financial, employment, and
services are areas affected in the new normal of LCGAs. Each of these areas will affect
everyone (LCGAs employees, city management, council members, and
residents/citizens) in some way or form. Even though IT and business alignment only
addresses a small subset of the bigger issue, IT/business alignment address the potential

10
for internal disaster. According to Chen (2010), misalignment leads to disastrous failures,
canceled/redundant projects, and systems failing to meet business needs, business user’s
dissatisfaction, and high costs.
Problem Statement
Aligning IT and business is a crucial issue for IT executives (Khaiata &
Zualkernan, 2009). Chen (2010) noted that the number one concern of IT management
and business executives is to understand how IT and business align. Luftman, Ben-Zvi,
Dwivedi, and Rigoni (2010) have collected a benchmark repository of over 2,000
organizations measuring IT/business alignment using the SAMM instrument. Only one
organization out of 2,000 agencies within Luftman’s benchmark repository was a
government agency. The problem my study sought to address was the lack of information
regarding LCGAs IT/business strategic alignment maturity level and its employment size.
The goal of this study was to understand how a city’s strategic alignment maturity level
might affect large, medium, and small city employment size and to understand its current
maturity level.
Purpose of the Study
The purpose of this quantitative survey study was to conduct an IT/business
strategic alignment maturity assessment of several cities in the southwestern part of the
United States. I compared these maturity assessments to the cities’ employment sizes.
According to Khaiata and Zualkernan (2009), the primary objective of SAMM is to
understand IT and business alignment in a simplistic format. According to the CobiT 4.1
excerpt (2014), the average enterprise strategic alignment maturity level is Level 2. My

11
intent was to understand the average maturity level of LCGAs and recommend steps to
improve alignment. I first used the SAMM instrument to question top executives within
LCGAs and second examined the relationship between a city’s IT/business strategic
alignment maturity level and its employment size.
The primary dependent variable for this study was the SAMM level of LCGAs.
This variable consists of six secondary IT/business alignment criteria. These secondary
variables were communications maturity (Comm), competency & value maturity (Comp),
governance maturity (Gov), partnership maturity (Part), scope & architecture maturity
(Scope), and the human resource skills maturity (Skills) levels. Full-time employment
size (FTEsize) was the dependent variable. I used the terms small, medium, and large
cities distinguish different LCGAs sizes. Both the independent and dependent variables
may have significant for LCGAs. They identify the LCGAs strategic alignment maturity
level and define how the size of the city’s FTE affects alignment.
Research Question
The research question organizing this study was: What was the relationship
between a city’s IT/business strategic alignment maturity level and its employment size?
The hypotheses associated with this question were:
H1o: There was no relationship between a city’s IT/business strategic alignment
maturity level and its employment size.
H1a: There was a relationship between a city’s IT/business strategic alignment
maturity level and its employment size.

12
H2o: There was no relationship between a city’s IT/business communication
maturity level and its employment size.
H2a: There was a relationship between a city’s IT/business communication
maturity level and its employment size.
H3o: There was no relationship between a city’s IT/business competency and
value maturity level and its employment size.
H3a: There was a relationship between a city’s IT/business competency and value
maturity level and its employment size.
H4o: There was no relationship between a city’s IT/business governance maturity
level and its employment size.
H4a: There was a relationship between a city’s IT/business governance maturity
level and its employment size.
H5o: There was no relationship between a city’s IT/business partnership maturity
level and its employment size.
H5a: There was a relationship between a city’s IT/business partnership maturity
level and its employment size.
H6o: There was no relationship between a city’s IT/business scope and
architecture maturity level and its employment size.
H6a: There was a relationship between a city’s IT/business scope and architecture
maturity level and its employment size.
H7o: There was no relationship between a city’s IT/business human resource
skills maturity level and its employment size.

13
H7a: There was a relationship between a city’s IT/business human resource skills
maturity level and its employment size.
Theoretical Framework
The theoretical framework for this study was based on ITG and business strategy
as measured by the SAMM instrument. Both of these theories help form the framework
of why this study was needed. Most of the literature refers to alignment as it relates to the
private sector. I will look at how the private sector have used these theories identify their
maturity level and apply it to LCGA.
According to Ali and Green (2012), effective ITG is vital for an organization to
fulfill corporate performance goals. Standardization and best-practice approaches along
with modernization of management all characterize sound ITG (de Souza Bermejo &
Tonelli, 2011). The theoretical framework of this study could contribute to the knowledge
base of top executives, and inform their efforts to make the connection between ITG
strategic alignment and strategic business alignment.
Top executives should want their overall business strategy to be inclusive of all
departments. Avison, Jones, Powell, and Wilson (2002) have defined business strategy
variables as including the business scope, business governance, and distinctive
competencies. Raghupathi (2007) suggested that drivers for business strategy could be
external through compliance with state/federal policies and internal through strategic
performance measures as it relates to ITG. Business strategy looks at the overall need of
an organization. It should focus on the customer need as well as the business requirement
need while eliminating waste.

14
One way of combining these two theories together and assessing results is to use a
SAMM instruments. Luftman developed the strategic alignment maturity model (SAMM)
using six factors of maturity: “communication, competency, governance, partnership,
technology scope, and skills” (Chen, 2010). According to Khaiata and Zualkernan
(2009), SAMM identified six factors of maturity along with five levels of maturity to
include initial/ad hoc (Level 1), committed (Level 2), established/focused (Level 3),
improved/managed (Level 4), and optimized (Level 5). Chen (2010) described the
SAMM instrument as an alignment assessment tool that evaluates IT and business
alignment maturity attributes. Luftman (2000) and Chen (2010) cross-validated and
analyzed this instrument.
There is limited knowledge that addresses alignment between ITG and business
strategy in LCGAs. Most of the literature focuses on the private industries. Only one out
of over 2,000 companies assessed by SAMM have been a government agency. I plan to
use these theoretical foundations and apply it to LCGAs.
Nature of the Study
I used a quantitative web survey to collect data and test the hypotheses. According
to Leedy and Ormrod (2005), survey research is designed to learn more about a large
population using a sample of that population. Singleton and Straits (2010) stated, "One
purpose of the survey is to describe the frequency of certain characteristics among groups
or populations" (p. 9). The frequency can show if there is a significant relationship
between variables. The target population for this study was specific to randomly selected
LCGAs within the southwestern region of the United States.

15
This study used results collected from a web survey. Similar to Luftman et al.
(2010) and Chen (2010), I examined the relationship between a city’s IT/business
strategic alignment maturity level and its employment size. I collected data using
Luftman’s (2010) SAMM instrument and distributed the survey to senior managers and
leaders within LCGAs. I used SurveyMonkey as the web-based survey tool to distribute
the SAMM instrument via an email link. Target participants were mayors, city council
members, city managers, deputy city managers, directors, managers, subject matter
experts, and senior IT personnel.
I analyzed the data using the Statistical Package for the Social Sciences (Version
21). I used both descriptive statistics and inferential analysis to identify the frequency,
mean, and standard deviation. I used a one-way ANOVA instead of Pearson correlation
to measure mean differences. This analysis shows the maturity level of local government
agencies compared with its employment size.
Definition of Terms
Throughout this study, I identify literature precise words, phrases, and studies that
need clarity. Below is a list of terms defined for clarity:
Business strategy: is the overall organizational strategy of LCGAs. This strategy
should always be constant in its subcategories or parts but unique to each organization. A
metaphor of this concept is the body. It is made up of many different parts such as the
head, nose, lips, and ears. No head, nose, lips, or ears are exactly the same. They are all
unique. Similarly, business strategy must be constant in subcategory or parts but unique
to each organization.
16
CobiT: A methodology used by organizations to comply with SOX. CobiT is a
model for IT management that consist of internal controls and holistic operations controls
(Hong, Chi, Chao, & Tang, 2003).
FTEsize: Full-time employment size is the independent variable grouped into
three categories; small, medium, and large.
Global Status Report on the Governance of Enterprise IT (GEIT): A 2011 study
uses to measure ITG maturity level.
Governance: According to Palczewska, Fu, Trundle, and Yang (2013),
governance is a collection of strategies and processes that formally manages problems. I
used governance in a similar manner in this study.
Information technology governance (ITG): An enterprise management approach
that links technology to business strategy. According to Robinson (2005), "IT governance
is to create a controlled environment for desirable actions to drive the effective, efficient,
and secure use of information technology” (p. 45).
Information technology infrastructure library (ITIL): A methodology that is used
by organizations to comply with SOX. "The ITIL is a framework of best practices
intended to facilitate the delivery of high quality IT services at a justifiable cost" (Galup,
Dattero, Quan, & Conger, 2009, p. 125).
ISO/IES 20000: A methodology used by organizations for IT service
management. According to Janssen and Schrenker (2011), ISO 20000 is the most known
and considered best practice in the IT service management standard.

17
ITG Maturity Levels: The ITG maturity levels consist of six levels: nonexistent,
initial, repeatable, defined, managed, and optimized (Alcott, 2008).
LCGAs: Local city government agencies consist of towns and cities ranging in
size greater than 400 and less than 1,000 full-time employees.
Sarbanes-Oxley Act of 2002 (SOX): This is a federal mandate that attempts to stop
accounting irregularities. Brochet (2010) stated that, "The Sarbanes-Oxley Act of 2002
(SOX) is a far-reaching federal law aimed at improving the reliability of both corporate
governance and the financial reporting process" (p. 419).
Strategic Alignment Model (SAM): According to Chan and Reich (2007), SAM
includes four core strategic choice variables, which are business strategy, organizational
infrastructure/processes, IT strategy, and IT infrastructure/processes.
Strategic Alignment Maturity Model (SAMM): Luftman developed SAMM that
included six maturity criteria such as communication, competency, governance,
partnership, technology scope, and skills (Luftman, 2000).
Assumptions
Several assumptions were made in this study that I describe in detail so that the
readers can understand and analyze the context of the data from my perspective. First, I
assumed that top executives within LCGAs want to understand how ITG and business
strategy align. Second, I assumed that the variables covered in this study were adequate
to examine the relationship between a city’s IT/business strategic alignment maturity
level and its employment size. Third, I assumed that the collected data sample, although
small, was a good representation of local city governmental workspaces in the

18
southwestern region of the United States. Fourth, I assumed that government agencies
had some level of ITG and business strategy to meet their organization’s strategic needs.
Fifth, I assumed that the SAMM instrument would adequately measure business strategy
alignment in LCGAs. Finally, I assumed that alignment between ITG and business
strategy would help to identify the maturity level of a local city government agency.
Limitations
There are limitations in every study. For this study, factors not considered in this
design could potentially change the conclusions drawn. This study’s limitations include:
1. Data were collected and analyzed from a web survey. Original data were
collected using proper research procedures.
2. Data retrieval for the dataset came from SurveyMonkey. Variables are static
and fixed.
3. While the sample size may be appropriate for this study, it may not be accurate
represent all LCGAs across the U.S.
4. There are also unknown variables not covered that may affect the outcome of
the survey.
5. Limited knowledge of IT/business alignment could alter the result of this study.
Scope and Delimitations
I conducted an analysis of LCGAs to understand the relationship between a city’s
IT/business strategic alignment maturity level and its employment size. The sample used
in this study was LCGAs within the Uunited States. According to Leedy and Ormrod
(2005), delimitations are the explicit limits and boundaries of the research effort. Then

19
the four delimitations of this study were (a) that it was limited to LCGAs senior
management participants, (b) that data was collected and analyzed using an online
survey, (c) that LCGAs were all located in the southwestern region of the United States,
and (d) that web-based participation in this survey was on a volunteer basis.
Significance of the Study
Significance to Theory
Chen (2010) noted that it is important to understand how IT and business
harmonize because this understanding leads to performance improvements. According to
Martin et al. (2012), LCGAs experience and expect marginal changes in finances,
employment, and services (Martin et al., 2012). The results of this study may provide
LCGAs with significant insights to their IT/business alignment maturity level. I drew
specific knowledge from top executives in LCGAs in areas such as communication,
competency/value, governance, partnership, technology scope, and skills to understand
their IT/business alignment maturity level. By producing such insights, this study shows
LCGAs the relation between maturity level and employment size. This study is relevant
to current discussions regarding both alignment in general, and to best practices in city
management in particular, because IT/business alignment can contribute to improving
government agency finances, employment, and services today and in the future.
Significance to Practice
Results from this study may provide executive leadership with data indicating the
significance using feasible measurements to link IT to business, and may facilitate their
understanding of the maturity level of their local city government agency. Currently, ITG

20
has several methodologies that can help formalize practice and policies. However, the
linkage between ITG strategic alignment and business strategy alignment is unclear
within LCGAs. Identifying the link(s) can provide government agencies with valuable
data to determine where to go and exactly what steps it could take to align ITG with
business strategy. My study could provide LCGAs with a proven instrument for
identifying what matters and what does not matter as it relates to alignment.
Significance to Social Change
This study empowers positive social change through better communication,
competency/value, governance, partnership, technology scope, and skills. Further studies
can use these results as benchmarks. This study presents the first known attempt to
capture data within LCGAs. These results can also help auditors (internal and external),
executives, stakeholders, and add to the body of knowledge. Each of these organizational
changes might produce effective city management changes that better server the
population in the new LCGAs normal environment.
Summary
Each LCGAs provides some type finance, employment, and service to the
residents of their city or town. I estimated that funding from federal and local state
agencies to LCGAs would continue to decrease while the demand for services is steadily
increasing. Better strategies within LCGAs may result in more success using fewer
resources. There is an opportunity to create positive social change within LCGAs by
understanding the strategic alignment maturity level based on its employment size.

21
There are several studies that correlate challenges, needs, and relevance of both
ITG strategic alignment and business strategy alignment. However, there are few
analyses available to top executives of LCGAs who struggle with understanding where
their organization stands in terms of ITG strategic alignment and business strategy
alignment LCGAs. Findings of this study may inspire executive leadership to understand
where their agency aligns and how to take the steps to improve.
Five chapters are framed this study. Chapter 1 includes the problem and provides
an overview of the design and organization of this study. Chapter 2 includes the literature
review describing the evolution of IT/business strategic alignment. Chapter 3 contains the
quantitative methodology used in this survey study. Chapter 4 describes the findings
while Chapter 5 interprets the findings.
22
Chapter 2: Literature Review
Current literature on IT/business alignment has several focal points that this study
addressed. In LCGAS, alignment hinges upon political approval from the customers and
stakeholders, internal and external. Effective ITG ensures that the overall IT and business
goals align within the organization (Ali & Green, 2012); however, little is known about
the relationship between a city’s IT/business strategic alignment maturity level and its
employment size. According to Singleton and Straits (2010), literature reviews clearly
define the problem using the theoretical context, and explain how other researchers have
studied similar studies. In this chapter, I seek to do this by presenting the evolving and
current literature, and emphasizing only the significant findings (Singleton & Straits,
2010).
This literature review consists of five sections. The first section describes the
research strategy. The second section offers a historical overview of the research topic
combined with the theoretical framework and reviews the history of ITG and business
strategies externally and internally. The third section includes the literature on ITG and
business strategy and includes supporting theories, which justify each of my research
variables. The fourth section includes a critically synthesis of the opportunities and the
barriers in alignment. This section includes the possibilities and obstacles to past research
and compares it to present research. Lastly, the fifth section includes the research design
that provided the foundation of this study.

23
Search Strategy
My research data collection strategy included multiple sources such as eBooks,
journal articles, online links, and libraries. Walden University’s online book collection
and research databases such as EBSCOhost, Emerald, ProQuest, Safari Tech Books, Sage
Journal Online, and Science Direct provided access to foundational theories and peer-
reviewed articles. Additionally I drew from websites included isaca.org, itgi.org,
itsmfusa.org, and sec.gov for resources to build the theoretical framework.
Each journal article, eBook, book, and website provided me information needed
to understand ITG strategic alignment and business strategy alignment. In what follows, I
present past theories along with current research on these topics. I primarily used journal
articles published within the past five years to build the theoretical framework of this
study. Keyword searches included ITG, ITIL, ITSM, MIS, Sarbanes-Oxley, systems
thinking, business strategy, business logic, SAMM, and system management.
Theoretical Foundation
The theoretical foundation that forms this study comprised of the theories of ITG
strategic alignment and business strategy alignment as is measured by the SAMM
instrument. Research literature on LCGAs is scarce and limited in terms of ITG strategic
alignment and business strategy alignment. Conversely, private sector agencies have a
broader research literature pool. This section includes the origins of each theory, major
theoretical propositions, prior research-based analysis, rationale, and a description of how
and why each theory relates to this study.

24
Top executives are expected to conduct governance in areas of executive
compensation, financial reporting, statutory/regulatory compliance, strategic planning,
and risk management (Bart & Turel, 2010). The federal mandate, SOX, requires top
executives to confirm the financial result with direct personal accountability of its
accuracy (Wong, Yip, Ray, & Paramesh, 2007). This theoretical review uses the literature
to demonstrate how top executives can understand and align ITG with the organization’s
overall business strategy.
When describing ITG, the Board Briefing on ITG (2003) stated that, “It is an
integral part of enterprise governance and consists of the leadership and organisational
structures and processes that ensure that the organisation’s IT sustains and extends the
organisation’s strategies and objectives” (p. 10). The responsibility of ITG belongs to top
executives such as executives and board members (Board Briefing, 2003). Norton and
Pine (2013) described business strategy from a top executive perspective as aligning their
organizational goals with the alignment that creates the best value for their customers.
This historical outlook of this study includes the development of both ITG strategic
alignment and business strategy alignment as is measured by the SAMM.
Each LCGA within the United States must maintain proper alignment between
their overall strategic plan and governance of IT to achieve expected performances and
achievable results. Chen (2010) noted that alignment between IT and business is
measured by how much both systems are in coherence with each other. The historical
perspective demonstrated in this study identified how ITG strategic alignment and
25
business strategy alignment started development from the beginning of the computer era
through today.
Computer Era
The developmental years of ITG came in conjunction with the creation and
evolution of the first programmable computer in 1936. Shapiro and Benenson (2006)
stated that Turing, a British mathematician who created the first programmable
computing machine, saw the computer as a person who was able to do everything that it
was programmed to do. According to Myers (1998), commercial products such as the use
of computer mouse, Windows, and text editing became available for commercial usage in
the 1980s. Meyers (1998) went on to describe technological advancements between 1960
and 1980s by identifying progress in such things as the word processor (the 1962
Sketchpad system), CAD systems (1963), Stanford’s TVEdit (1965), mouse manipulation
(1965), IBMs light pen (1967), William Newman’s Markup (1975), the video game Pong
(1976), and the Visi-Calc spreadsheet (1977). While the concepts of ITG did not exist
between the 1930s and the 1970s, the technological advancements developed during this
time built the foundational footprint of ITG today.
According to Diebold (1965), the potential management impact of computers, as
it related to American businesses in the future, would change performance on
conventional controls. He went on to say that new capabilities, organizational structures,
workforce makeup, physical facilities, and external environments would all change based
on the advancement of the computer (Diebold, 1965). Diebold’s projections of the future

26
were well founded, and, he was detailed the need for ITG even before it became
applicable.
As computers advanced and became more popular in the 1960s and in the 1970s,
the literature of the time was concerned with IS management, technical management, and
financial improvement. Although ITG was not the term of that time, the research at this
stage also advanced the foundation of ITG indirectly, especially with the concept of
management of information systems (MIS).
Management of Information Systems Era
In the 1960’s, the concept of MIS became widely disseminated. Daniel (1961)
noted that the building blocks of MIS start with top executives’ information
requirements. Additionally, Daniel (1961) laid out an exhibit of the anatomy of a
management information system that covered such topics as environmental data,
competitive data, internal data, planning, execution, controls, feedback, nonfinancial data,
financial data, management functions, and information systems characteristics.
According to Google Scholar, over 650 articles have cited Daniel’s article “Management
Information Crisis.” Rockart (1979) used Daniel’s article to define the data needed by top
executives to identify critical success factors. Similarly, De Vasconcellos, Sousa, and
Hambrick (1989) used the work of both Daniel and Rockart to identify critical success
factors which ensure the performance of an organization.
Researchers found that the performance of an organization was an important
aspect of development, and they sought to discover what the critical success factors were
needed to make improvements in terms of MIS. De Vasconcelos et al. (1989) noted the

27
importance of performance-based organizations by identifying critical success factors in
areas that measure success prerequisites. They noted that critical success factors
maximized both internal strengths and external industry strengths (De Vasconcellos et al.,
1989). This shows that organizations should not only look to improve based on what they
do well internally but should also look toward other similar agencies and follow best
business practices.
Between 1970 and 1979, MIS became a paramount and popular topic with
varying perspectives on how to improve the management of IS. Mason and Mitroff
(1973) defined variables such as psychological types, class of problems, evidence,
organizational context, and modes of presentation to explore and broaden different
characteristics of MIS. Swanson (1974) noted that the lack of supervision, appreciation,
and involvement attributed to failures in implementing MIS, and concluded that
participation in the process improved satisfaction. Similarly, Bostrom and Heinen (1977)
wrote about the failure of MIS at the organizational level, and related it to inadequate
designs. They explained that the use of a socio-technical systems (STS) design approach
would improve upon inadequacies. Correspondently, Ein-Dor and Segev (1978) analyzed
the success and failures from an organizational level focusing on the context variables
such as size, structure, situation, maturity, executive responsibility, and a steering
committee which when properly used can identify the success and failures of MIS.
Identification of MIS in terms of factors of success and failure were critical focal areas
during this time.

28
Furthermore, the time between 1980 and 1989 advanced the discussions on MIS
but there were also significant shifts towards organizational management. Many MIS
articles in the 1980s focused on such topics as framework research on MIS (Ives,
Hamilton, & Davis, 1980), MIS intellectual development (Culnan, 1986), and
contingency theory assessment on MIS (Weill & Olson, 1989). Even though these articles
focused specifically on MIS, they started to shift towards the organizational perspective.
Other articles during this period that mentioned MIS took a broader perspective in areas
in decision support systems (Sprague, 1980), organizational structure in computer
information systems (Robey, 1981), performance and behavior of organizational IS
(Huber, 1982), Nolan’s stage model (King & Kraemer, 1984), structural design in
organizations (Daft & Lengel, 1986), and paradigms of IS development.
There was a shift in focus in the 1960s to the 1990s from simple computing to the
organizational management of information systems. This shift occurred because more
and more organizations were using technology to maximize the value of services they
provide. Early adoption of technology cause missteps in strategies, design, transitions,
operation, and improvement. Researchers made note of these inefficiencies and started
formulating governance strategies.
Governance Era
As with MIS, the term governance was used to set precedence between the
accountability of management and financial investments. According to ITIL Service
Strategy (2011), governance defines the business and IT rules, direction, and policies.
Rhodes (1996) provided a well-defined explanation of governance by defining it as the

29
ability to give the enterprise direction, control, and oversight of executive actions,
accountability, and regulatory guidelines internally and externally. According to Shleifer
and Vishy (1997), the evolution of governance system started in the political realm as
opposed to the economic realm, which shaped corporate law at the federal level.
I draw on existing notions of governance and seek to navigate between overly
broad and narrow definitions, to define governance as the traditions and institutions by
which authority. This includes (a) the process by which governments selected, monitored
and re- placed; (b) the capacity of the government to effectively formulate and implement
sound policies; and (c) the respect of citizens and the state for the institutions that govern
economic and social interactions among them (Kaufmann, Kraay, & Mastruzzi, 2011, p.
222).
Governance processes are a legal necessity to form a structure acceptable by all
parties involved. They are fundamental to the success of every organization. When
governance processes are well designed, they coordinate every aspect of an organization:
its people, equipment, and money work in concert toward the strategic objectives of the
firm. However, when poorly designed, governance processes can be counterproductive
(Meyer, 2004).
Literature Review
Provided here is an exhaustive review of the current literature established by past
research. First, I reviewed studies related to the constructs of ITG and business strategy.
Second, I look at ways in which past research addresses the problem. Third, I described
the rationale for each variable. Fourthly, independent and dependent variables are also

30
discussed along with controversial findings. Last, the literature was review and
synthesized as it relates to the research questions. Each review established the need for
further studies of the research question and hypotheses.
The literature review focuses on theories of ITG and business strategy. According
to Mohamed (2012), ITG is based on five factors, which are organizational
demographics, information intensity, corporate culture, external environment, and IT
characteristics. Kim, Lee, and King (2010) defined business strategy as the position and
the direction in which an organization should progress. Furthermore, Mohamed (2012)
went on to say that ITG aligns itself with business strategies and IT in areas of authority
making decisions, capabilities, structures, processes, and realistic measurements that
connect the two entities. Clearly ITG and business strategies are married concepts that
can help to improve an organization.
History of ITG
The first topic of governance as it related to technology was on the subject of
information systems (IS) governance. Brown (1997) said that in the 1880s IS governance
used new forms to organize IS roles. As computer systems became more prominent in the
corporate world, top executives perspectives focused on systems management. Zmud
(1984) discussed how organized activities in system roles such as operation, systems
development, technical services, and administration functions. Adding to the IS
governance body of work, Dixon and John (1989) concluded that top executives must
focus on building partnerships, collaborate, improve upon change management
perspectives, have changed mindsets, utilize soft skills, manage from a strategic
31
perspective, and support the overall vision of the organization. King (1993) identified that
centralized and decentralized management options within systems were needed to
separate decision-making authority with IS. In the early 1990s, Allen and Boynton (1991)
continued the body of knowledge in IS governance by identifying strategic and structural
characteristics of organizations. Although IS governance remains relevant today, ITG
started becoming a broader topic of interest for top executives in the 1990s.
Then a significant shift in the way organizations addressed management of
technology started to occur during the early 1990s and continues today. According to
Board Briefing (2004), ITG became essential to top executives because they realize the
impact IT has on the enterprise to achieve technological objectives, adapt to changing
technology, manage risk factors, and appropriately becoming proactive with
opportunities. Moreover, Schwartz (2007) noted that organizations today are subject to
many types of regulations such as data retention, confidentiality, accountability
financially, and disaster recovery that forces them to become compliant. Furthermore,
Huang, Zmud, and Price (2010) suggested that ITG is significant in design by addressing
governance mechanisms, allocating decision rights, and allocating decision processes
appropriately. Additionally, Ali and Green (2012) declared that effective alignment
between ITG and business has become critical to modern organizations today. According
to Raghpathi (2007), drivers of ITG can be internal or external by focusing on several
operational/strategic variables. A general description of these variables used in this study
help to develop the research question and hypotheses.

32
Another reason for the significant shift in the way organizations addressed
management of technology was the mistrust between the citizens and corporations.
Corporate greed, failures, mismanagement, and lies exposed in the early 2000s drove
U.S. citizens to demand better regulation of corporate accounting irregularities. Federal
mandates enacted, such as SOX, Basel II, HIPAA, FDIC, FCPA, PCI, and federal
sentencing guidelines (Debreceny & Gray, 2013), answer the needs of citizens. Becoming
compliant with any of these federal mandates add to the importance of having ITG within
an organization.
The most popular mandate in terms of state/federal policies is SOX compliance.
Li et al. (2012) noted that firms reporting weaknesses in IT internal controls between
2004 and 2008 had significantly larger forecasting errors compared with firms with
effective internal controls. It is essential that organization understand the importance of
controlling and governing their entire organization to eliminate potential failures.
Even though SOX Section 404 and other state/federal policies are for the good in
most cases, there are always critics. Critics say that SOX is burdensome for business and
reduce competition (Li et al., 2012; Zhang, 2007). Another big criticism of this mandate
is that the benefits do not outweigh the costs of compliance with SOX (Millar & Bowen,
2009). Because of these reasons, many organizations are weighing the pros and cons of
staying in compliance with SOX and other state/federal policies.
Kryzanowski and Zhang (2013) described the creation of SOX as the answer that
force federal mandates on publicly traded organizations to be accountable for the
accounting irregularities found in many big organizations. Cohen, Krishnamoorthy, and

33
Wright (2010) explained that SOX was developed because of scandals in organizations
such as Enron and World-Com. These authors went on to say that auditors internally and
externally were given power by this mandate to create auditing committees, generate
independence from top executives, become the financial expert, and have the ability to
challenge management (Cohen et al., 2010). Li et al. (2012) described SOX Section 404
in the critical section of this federal mandate that addresses specifically with IT in terms
of financial reporting function or FRS. Although there are many more state/federal
policies and mandates that affect ITG, SOX is the biggest and most written about a
federal mandate that affects ITG.
According to Jairak and Praneetpolgrang (2013), the core principles of ITG are
business/IT alignment, IT resource management, IT service quality, IT security, and IT
risk management. Ali and Green (2012) described ITG effectiveness by identifying seven
independent variables: top management involvement, corporate communications systems,
IT steering committee, corporate performance measurement system, IT strategy
committee, ethics and the culture of compliance, and the overall effectiveness of ITG. As
organizations address these topics formally, they will minimize issues addressed by
state/federal policies. Bernroider and Ivanov (2011) noted that much attention has been
directed towards proper management controls since the U.S. imposed SOX. Therefore,
many organizations today implement ITG to be in compliance with state/federal
mandates and to know where they are at in terms of a maturity measurement.
De Haes and Van Grembergen (2010) provided a maturity models that is divided
into six sections to include nonexistent (Level 0), initial/ad hoc (Level 1), repeatable but

34
intuitive (Level 2), defined process (Level 3), managed and measurable (Level 4), and
optimized (Level 5). CobiT 4 (2014) agreed with having six maturity levels. Similarly,
Chen (2010) identified ITG in five levels leaving out the nonexistent level. I used
Luftman’s (2000) maturity levels to understand the maturity level in LCGAs. The ITG
maturity model helps determine where any organization is as it relates to its maturity
level.
An Executive View (2009) stated, “The levels of the generic maturity model
follow:
0 Non-existent: Complete lack of any recognisable processes. The enterprise
has not even recognised that there is an issue to be addressed.
1 Initial/ Ad Hoc: There is evidence that the enterprise has recognised that the
issues exist and need to be addressed. There are, however, no standardised
processes; instead, there are ad hoc approaches that apply to an individual or
case-by-case basis. The overall approach to management is disorganised.
2 Repeatable but Intuitive: Processes have developed to the stage where
similar procedures are followed by different people undertaking the same task.
There is no formal training or communication of standard procedures, and
responsibility is left to the individual. There is a high degree of reliance on the
knowledge of individuals and, therefore, errors are likely.
3 Defined Process: Procedures have been standardized and documented, and
communicated through training. It is mandated that these processes should be
followed; however, it is unlikely that deviations was detected. The procedures

35
themselves are not sophisticated but are the formalization of existing
practices.
4 Managed and Measurable: Management monitors and measures compliance
with procedures and takes action where processes appear not to be working
effectively. Processes are under constant improvement and provide good
practice. Automation tools are used in a limited or fragmented way.
5 Optimised: Processes have been refined to a level of good practice, based on
the results of continuous improvement and maturity modeling with other
enterprises. IT is used in an integrated way to automate the workflow,
providing tools to improve quality and effectiveness, making the enterprise
quick to adapt” (p. 22-23).
According to Tiwana, Konsynski, and Venkatraman (2013), the knowledge of
ITG can be best described by a cube that focuses on who is governed (ecosystem, firm,
projects), what is regulated (IT artifacts, content, stakeholders), and how is it
administered (decision rights, control, and architecture). Existing disciplinary articles
cover only nine of 27 areas. The other areas still need to be explored.
Even though there is much support of ITG, there are also critics that have strong
dislikes and concerns about its alignment effectiveness. According to Kooper, Maes, and
Lindgreen (2011), ITG is harmful (Ciborra, 1997), difficult to master (Chan, 2002), and
misleading (Maes, 2007). They went on to note that Hoebeke (2006) saw ITG as an
unmanageable mechanism (Kooper el al., 2011). Critics are concerned that ITG is not as

36
straightforward as it is presented. Products are changing so fast that ITG seem to be one
or more steps behind.
There are many topics that ITG covers. This study does not cover all topics nor
does it attempt to answer the critics of ITG. It does not go into full details about ITG
because the topics are too broad and too many for the scope of this paper. Core principles
are covered to provide a basis of understanding of how ITG came about, used and seen
today.
ITG Methodology
Development of ITG methodology must be viewed from a corporate governance
perspective as it relates to business strategy. Raghupathi (2007) said that corporate ITG
bring about accountability and transparency to build stakeholder’s confidence in a
positive way. Jacobson (2009) described ITG as a subset of corporate governance, which
stems from SOX legislation and accountability standards. Accountability, compliance,
and transparency are all focal points for top executives who want to make sure that their
IT departments are meeting expectations.
Several national and international organizations striving to document and
formalize the operational and strategic use of IT have done so in creating methodologies
such as Control Objectives for Information and Related Technology (CobiT), Information
Technology Infrastructure Library (ITIL), ISO 20000, and ISO 38500 (Bin-Abbas &
Bakry, 2014). Similarly, organization use ITG methodologies for different reasons such
as the use of CobiT for audit and control, ISO 17799 for meeting security management
37
obligations, Prince 2 for project management, balanced scorecard for developing vision
and strategy, and Val IT for managing IT investments (Iden & Eikebrokk, 2014).
Kerr and Murthy (2013) stated that CobiT was developed by the IT Governance
Institute (ITGI) to minimize the management risk of IT. Bernroider and Ivanov (2011)
noted that CobiT is as part of the framework uses as a best practice guideline. According
to the Global Status Report (2011), the trend in usage for CobiT decreased between 2008
and 2010 by 1.1%. Even though the usage trend declined, CobiT appeals to businesses
because it provides a best practice guideline to measure performance and project success
(Bernroider & Ivanov, 2011). As with all methodologies, CobiT is not perfect. It is a
good guideline to follow.
According to the Global Status Report (2011), ITIL is the most used external
framework at 28% of what?. This methodology has five books focusing on service
strategy, service design, service transition, service operation, and continual service
improvements. These publications are part of the best practice business procedures (ITIL
Service Operation, 2011). Service management governance can be managed by using
ITIL methodology as a best practice business process. It includes standards from
ISO/IEC 20,000 which is an official auditing standards and certification across the world
(ITIL Service Design, 2011). It is also important to note that the creation of this
methodology was birth in Great Britain by the Office of Government Commerce.
Both ITIL and CobiT have been competing against each other for the top spot.
Internationally, ITIL is world renown and respected. Each of these methodologies

38
provides a way for organizations to standardize complicated work. These methodologies
are there to create a culture of proper flow and not restrictive rules.
“ISO 20,000 is the external framework most frequently mentioned as a basis for
an enterprise’s GEIT approach” (Global Status Report, 2011). Both ITIL and ISO 20,000
were rated the same since ITIL include all the standards of ISO 20,000. The Global
Status Report (2011) also noted that both ITIL and ISO 20,000 are the fastest growing
external methodology. This framework is not a methodology but an auditing standards
and certification.
This study does not go into each specific detail on each methodology because the
primary focus of this study is to understand the relationship between ITG and the
alignment of business strategy in LCGAs. Even though this is the case, describing how
different methodology fills the gap between business strategy areas of concerns are
important. There are several IT goals or business strategy goals. These objectives are
identified and compared with ITIL, CobiT, and ISO 17799 to provide a broad
understanding of how these methodologies achieve business strategy goals. Top
executives can use one or several ITG methodologies to accomplish the different
objectives.
ITIL
Because ITIL is so prominent worldwide, it is important to look closely at this
methodology and understand why there is such an interest in it. Five books were put
together to articulate this methodology. Each of those five books explains IT in terms of
the service it provides building a business strategy model for all businesses to follow.
39
A business strategy, according to Casadesus-Masanell and Ricart (2010), is based
on specific agency goals and desires. This defitiona is true for LCGAs as well. They are
all different sizes of cities, and each city has its unique value. Casadesus-Masanell and
Ricart (2010) used the analogy of a business strategy by comparing it to a mechanical
task driven device. These authors showed that this mechanical task drove device changes
from agency to agency.
The ITIL approach was different. They provided a methodology or a mechanical
task driven device that was constant no matter the size or unique value of that
organization. Those books organized any service driven organization into five categories;
service strategy, service design, service transition, service operation, and continual
service improvements. Books were developed for each service type explaining in full
detail how to have a constant business strategy/methodology or mechanical task driven
device that never changes.
According to ITIL Service Strategy (2011), service strategy describes patterns,
plans, positions, and perspectives needed to fulfill the overall business strategy. This
book goes into detail about each critical success factor within service strategy. They
organize this service type into several subtypes such as strategy management, service
portfolio management, financial management, demand management, and business
relationship management (ITIL Service Strategy, 2011). Thinking of the overall business
strategy and placing each subtype into organized categories will allow for better planning
moving forward.
40
The next service type is service design. According to ITIL Service Design (2011),
service design describes the design of each service, methodology, processes, policies, and
facilitation of services. Service design helps define all aspects of the IT service. These
service subtypes are availability management, capacity management, continuity
management, design coordination, information security management, service catalog
management, service level management, and supplier management (ITIL Service Design,
2011). The design section help create formal processes.
Service transition is the third service type. It consists of the lifecycle of a service
in terms of new, modified, and retired services (ITIL Service Transition, 2011). This
service type allows for proper management and implementation of the change. According
to ITIL Service Transition (2011), service transition consist of change management,
change evaluation, knowledge management, release/deployment management, service
asset/configuration, service validation/testing, and transition planning/support. This
service type is for approving, quantifying, and implementation of new, modified, and
retired services.
Service operation is the fourth service type. “Service operation coordinates and
carries out the activities and processes required to deliver and manage services at agreed
levels to business users and customers. Service operation also manages the technology
that is used to deliver and support services” (ITIL Service Operation, 2011, p. 342). It is
important that SLAs are in place to identify improvements, consistency, or lack. Access
management, event management, incident management, problem management, and

41
request fulfillment (ITIL Service Operation 2011). The description of service operations
will work for any organization/agency. It focuses on the day-to-day operations.
Lastly, continual service improvement (CSI) is the final service type. According
to ITIL Continual Service Improvement (2011), CSI ensures alignment of services by
identifying and implementing continuous improvements. This service type is embedded
to certify continual optimal success through a seven-step improvement process; “identify,
define, gather, process, analyze, present, and implement improvements” (ITIL Continual
Service Improvement, 2011, p. 40). Organizations are constantly changing, and CSI
allow changes in dynamic environments.
Moreover, each of the five service types is unique but interrelated. They need
each other’s inputs and outputs for alignment. A service strategy means nothing if it does
not have a proper design/methodology, transition/oversight, operation/daily functions,
and CSI/optimization. The great benefit of an ITIL methodology is that it places stakes
(business strategies) within an organization that never changes but at the same time
allows for the dynamic business world to adapt and change effectively.
Business Strategy
In Greek, the word strategy is the ability to lead a troop from the general’s
office. According to Casadesus-Masanell and Ricart (2010), “Strategy is a firm’s
contingent plan as to the business model it will use” (p. 204). The word strategy is the
way in which an organization decides how they will achieve their goals using a
particular business model. In a local city government environment, this would mean
that a strategy is constructed from top management using a particular business model.

42
Consequently, there are three levels of strategy within an organization. Alsudiri,
Al-Karaghouli, and Eldabi (2013) noted that the three levels of strategy within an
organization, as it relates to alignment, are a corporate strategy, a business strategy, and
a functional strategy. The corporate strategy focuses on the type of business or agency
the organization wants to become. Business strategy focuses on how to be more
competitive or more politically aligned. The functional approach focuses on how
everyday operations will fulfill the competitive/political advantage. I focus on business
strategy, but the functional approach was also addressed to show how these two work in
tandem.
According to Miller (2006), department stores used business strategy to guide
decision-making approach in the past because there was a lack of human resource
management strategies in the early 20th century. Slater, Olson, and Finnegan (2011)
identified Miles and Snow in 1978 as the authors that initiated the use of business
strategy to organize structure and processes. Business strategy principles were then linked
to human resource (HR) systems back in the 1980s (Pena & Villasalero, 2010).
Organizations today look at the HR department to identify, monitor, and measure
business strategy in terms of functional business performance.
When describing the business strategy, Shavarini, Salimian, and Nazemi (2013)
described it as the way in which an organization attains competitive advantage. Many
organizations struggle with the idea of alignment. Business strategy is a simplified
narrative that transcends the desired behavior (Norton & Pine, 2013). How then can an
organization exceed its competitive advantage?

43
One way to exceed competitive advantage is through proper alignment. The
strategic alignment maturity model (SAMM) is an alignment tool that allows top
executives the ability to know if their organization aligns with the business strategy level
and the functional strategy level. According to Luftman (2010), SAMM allows top
executives to view an alignment roadmap that display levels of IT effectiveness through
business performance.
Luftman et al. (2010) noted that SAMM has six IT and business strategy
alignment components that are communication, value, governance, partnership,
scope/architecture, and skills. They went on to show that these core components relates to
ITG through nine items. These nine items are strategic business planning, IT strategic
planning, IT organizational structure, IT reporting, IT budgeting, IT investment
decisions, IT steering committee(s), IT project prioritization process, and IT reaction
capability (Luftman et al., 2010).
Even though SAMM provides good strategic alignment between ITG and
business strategy, there are many critics of strategic alignment. Röglinger, Pöppelbuß,
and Becker (2012) described over 10 different articles that criticized strategic alignment
from its existence because of its simplistic view of a dynamic world, its lack of empirical
foundation, results that didn’t consider evolution/change, documentation that was
dissatisfying, and also but not limited to economic infrastructure that was non-existent.
As with most concepts, considering all aspects of a problem is overwhelming for a
particular article. As more and more researcher focus on specific topics over time, the

44
body of knowledge will increase to fill the gap. This study helps fill the gap by using
SAMM to align IT and business strategy in LCGAs.
IT in the Public Sector
When describing the differences between public and private sector organizational
culture, Rosacker and Rosacker (2010) noted that public and private agencies are similar
in fiscal accountability, resource allocation, adherence to laws/regulations, and applying
best practice management principles but different in competitive pressures where the
public sector agencies face political pressures as opposed to competitor pressures. All
pressures are not the same. Political forces provide more scrutiny than that of competitive
pressures because public sector demands do not only come from the client, but it also
come from the citizens, media, special interest groups, elected officials and the like
(Rosacker & Rosacker, 2010). Political pressure from all of those stakeholders created an
organizational culture that requires accountability of time, resources, and money.
Organizational structure can also play a big role in understanding the alignment
between ITG and business strategy. According to Luftman et al. (2010), SAMM also
looks at the three organizational structures, which are centralized, decentralized, and
federated structures. In a centralized structure, the IT Director or CIO is the position
where all IT resources report. In a decentralized structure, each division has its reporting
head and leader. In a federated structure, a portion of IT is centralized while the other
portion is decentralized. The LCGAs tend to have a centralized IT structure based on
their yearly strategic plans.

45
According to Reddick (2011), the public sector has always faced the issue of
limited resources to deal with technology. Management failure has occurred because
naïve and blind trust has been given to commercial organizations in hopes that they are
looking out for the best interest of the public and/or the government (Hall, Kutsch, &
Partington, 2012). As technology is becoming one of the biggest budget items yearly
(Rosacker & Rosacker, 2010), stakeholders want to know that their money is being spent
productively. Aligning ITG with business strategy and providing stakeholders with a
clear measure as to how well IT has matured will provide transparency into the strengths
and weaknesses of IT in the public sector.
Ali and Green (2012) said, “The issue of establishing and implementing effective
information technology governance has become an important matter of modern business”
(p. 179). Rosacker and Rosacker (2010) noted that the private sector were first to use best
business practices and was later adopted by the public sector to improve IT project
management. It is evident that public sector agencies are taking effective measures to
meet the political pressures. According to the Global Status Report (2011) questionnaire,
the two highest percentage drivers of ITG are alignment between IT/business at 38% and
managing cost at 20%. Examining the relationship between ITG and business strategic
alignment in government agencies may provide stakeholders with the evidence they need
to identify how their government agency aligns.
Many government agencies are outsourcing IT. According to Duhamel, Gutierrez-
Martinez, Picazo-Vela, and Luna-Reyes (2014) outsourcing IT is attractive to LCGAs
because the administration is not able to keep up with the rapid change of technology.
46
These authors went on to say that there is a higher risk of failure (Duhamel et al., 2014).
Top executives are constantly looking for ways to meet the demands of technology.
Outsourcing technology is one way.
Reddick (2011) noted that barriers such as financial resources and support from
elected officials are recurrent problems within LCGAs. Since resources are scarce,
LCGAs must find better ways to align. Financial dependencies, structures, and practices
have been realigned in LCGAs and identified as the new normal (Abels, 2014). The new
normal is working with less financial and elected official support.
Abels (2014) noted that regional collaboration in LCGAs can provide a solution
to financial limitations. It is essential that technology alignment functionss the same way.
How does small, medium, and large LCGAs align? Does size matter? It is important that
some level of collaboration occurs. The new normal demands it. Martin et al. (2012)
noted that LCGAs should attain additional funding through raised permits, voter’s
information, false alarms, title searches, park/recreation, and building fees. Although
these are good options, alignment could improve financial burdens as well.
Employment issues in LCGAs are also a function of the new normal that must be
considered. New hires are expected to receive less compensation and benefits (Martin et
al., 2012). Over 13 million jobs were lost in 2013 in the public sector (Annual
Questionnaire of Public Employment, 2014). The new normal is working with less and
less. IT staff get paid competitive salaries in the private sectors, but stagnant salaries, job
cuts and fewer jobs are available with LCGAs (Martin et al., 2012).

47
No longer is top IT talent looking toward LCGAs for a stable, competitive salary,
and great benefits because it does not exist. There is a great need now in the new normal
more than ever before to maximize on limited resources. In 2012, LCGAs lost over
156,000 jobs (Annual Questionnaire of Public Employment, 2014). Knowing how well
LCGAs aligns could provide a benchmark point based on the size of the city.
This example shows how technology resources in LCGAs are scarce. The new
normal is being able to function with less and less in finances, resources, and greater
demand. Everyone wants better technology, but the resources are not there to properly
implement the growing need. All LCGAs have to find a better way to function with
limited resources. Alignment does provide some relief.
Literature and Research Based Analysis
Alignment’s importance has been well known and well documented since the late
1970's (e.g., Brancheau & Whetherbe 1987; Chan & Huff, 1993; Dixon & Little, 1989;
Henderson, & Venkatraman, 1996; IBM, 1981; Luftman & Brier, 1999; McLean &
Soden, 1977; Mills, 1986; Niederman et al., 1991; Parker & Benson, 1988). Over the
years, it persisted among the top-ranked concerns of business executives. Alignment
seems to grow in importance as companies strive to link technology and business in light
of dynamic business strategies and continuously evolving technologies (Papp, 1995;
Luftman, 1996). Importance aside, what is not clear is how to achieve and sustain this
harmony in relation to business and IT, how to assess the maturity of alignment, and what
the impact of misalignment might be on the firm (Papp & Luftman 1995). The ability to
achieve and sustain this synergistic relationship is anything but easy. Identifying an

48
organization’s alignment maturity provides an excellent vehicle for understanding and
improving the business-IT relationship (Luftman, 2000).
Luftman (2000) created an assessment tool to measure the alignment maturity
level of an organization. Currently, there is a repository database with over 2,000
agencies that have taken this assessment tool to measure overall alignment. Within
Luftman’s repository, only one public sector agency has taken this assessment.
According to Chen (2010), this assessment tool provides a snapshot of the current state of
an organization. He also went on to say that this assessment tool is the most
comprehensive assessment available (Chen, 2010). Since there was no empirical evidence
within LCGAs to understand their current state of alignment, Luftman’s SAMM
assessment tool is the perfect tool to provide LCGAs with empirical evidence.
There are several researchers who have studied ITG strategic alignment and
business strategy alignment within the private sector. Luftman brought the most attention
to the topic of IT and business alignment. Today the questions are still being asked, how
to align IT with the business. Empirical studies on this subject in public sectors are scarce
but needed to achieve proper alignment and functionality.
Present Study
Process alignment of information systems and business strategy alignment
according to Chen (2010) is an adaptive behavior instead of an event-planning situation.
Top executives must realize that it is their responsibility to measure the maturity of ITG
strategic alignment to their overall business strategy. Van Grembergen and De Haes
(2010) noted that an IT department can not adequately realize the investment into IT until

49
the business level thinks it is important. Chen (2010) agreed that alignment must be
addressed at different levels strategically through IT needs projected in the future,
tactically through adequate resources allocation, and operationally through effective and
efficient operations within the IT department. Luftman et al. (2010) linked ITG to
alignment by showing how ITG is the responsibility of strategic, tactical, and operational
owners that represent the stakeholders.
Researcher acknowledgment and documentation of the importance of ITG
strategic alignment and business strategy alignment has urged companies to become
align, but many organizations are still out of alignment (Chen, 2010). Top executives
must construct the alignment (Van Grembergen & De Haes, 2010). Without proper top
executive understanding and direction, the alignment will fail and cause poor
implementation internally. Collaboration between IT strategy and business strategy
should be a resultant of decisions made by top executives (Luftman et al., 2010).
Alignment must come from a collaboration of the senior management team.
There are many reasons for misalignment. The top reasons for misalignment
included lack of a close working relationship between IT and business, lack of effective
prioritization of IT needs, inability of IT to meet its commitments, ITs lack of
understanding of business, lack of senior executive support of IT, and lack of leadership
in IT management (Chen, 2010). Van Grembergen and De Haes (2010) noted that poorly
aligned organizations are organizations that fall below the Maturity Level 2.
Misalignment can cause poor business strategic planning, IT strategic planning, IT
budgeting, IT investment decisions, steering committee, IT prioritization process, and IT

50
reactions capacity (Luftman et al., 2010). Chen (2010) noted that alignment has a positive
association with success through a positive effect on IT and business.
Many practitioners and researchers have acknowledged SAM as a framework that
can be used to evaluate IT and business alignment (Luftman et al., 2010). Luftman (2000)
introduced the original SAMM instrument. Several studies have evolved from SAMM
such as Luftman’s (2004) study on assessing the maturity of business and IT. For
example, Huang and Hu (2007) study of achieving enterprise-wide IT and business
alignment, De Haes and Grembergen (2008) study on ITG and business maturity, De
Haes and Grembergen’s (2009) study on ITG implementation on business and IT
alignment, and Chen’s (2010) study on business and IT alignment in China. Chen use of
the SAMM instrument provided this study with guidelines on how to measures ITG
strategic alignment and business strategy alignment. This instrument contains 39 updated
questions using a 5-point Likert scale with minor wording differences from the original
Luftman (2000) model.
There are five levels, six levels when including nonexistent maturity levels, to
assess alignment. According to Chen (2010), SAMM involves five process levels which
the first level is the initial / ad hoc processes, the second level is the committed processes,
the third level is the established focused processes, the fourth level is the improved /
managed processes, and the fifth level is the optimized processes. In conjunction,
Luftman et al. (2010) described six components of IT and business strategy alignment
that are communications, value, governance, partnership, scope/architecture, and skills.
Chen (2010) also corroborated that these six values are components of IT and business

51
strategy alignment. Both Chen (2010) and Luftman et al. (2010) analyzed alignment
using Luftman (2000) original SAMM instrument. Chen went a step further to refine
Luftman’s SAMM and created a simplified instrument to evaluate alignment. Luftman’s
instrument was used to assess alignment within LCGAs.
The five predictors of ITG are strategic alignment, value delivery, resource
management, risk management, and performance management (ITGI, 2003; Tsai,
Hwang, Chang, & Lin, 2011). The strategic alignment predictor of ITG is the focal point
of this study because it is assessed using SAMM. Another description of an ITG
assessment tool is that it is a communication tools, process alignment assessment tool,
and structures used for decision-making (Kooper et al., 2011; Weill & Ross, 2004).
Furthermore, ITG predictors are leadership, organization structure, and process that
expand business strategy (Markovic & Maksimovic, 2012; Culver-Lozo, 1995). These
different predictors can be summed up as the ability of an organization to increasing
productivity through increased efficiency.
According to Chen (2010), IT strategy and business strategy relates to nine ways;
cost, quality, distinction, introduction of new products, diversity of products, efficiencies,
quality customer service, intensive marketing, and new market expansions. Since the
private sector organizations prospers on being competitive and public sector agencies
thrive on political power, Table 1 includes a public sector comparison between ITG
strategy and business strategy based on Chen’s comparison.

52
Table 1
Public Sector ITG Strategy and Business Strategy
ITG Strategy and Business Strategy Comparison
ITG strategy Business strategy
1. The cost is reduced. 1. Reduce the cost.
2. The quality of the product is improved. 2. Quality over quantity.
3. Attaining best business practices. 3. Follow best business practices.
4. Continuous improvement. 4. Introduce innovation.
5. The product is scalable and expandable. 5. System thinking short term and
long term.
6. Process improvements. 6. Improve efficiencies.
7. Quality customer service. 7. The customer comes first.
8. Marketing of systems following the right
channels.
8. Communicate effectively.
9. Change management system in place. 9. Follow approval processes.
Externally, predictors of business strategies are drivers focused externally and
strategically on meeting state/federal policies. For an organization to maintain
compliance with state/federal policies, they must understand what each law requires and
strive to attain and remain compliant. Times change and laws change; therefore, ITG and
business strategies must be built on a solid conceptual foundation that is dynamic enough
to meet all state/federal policies.
Internally, predictors of business strategies are described as strategic logic, which
focus on competitive advantage and obtaining the bottom line (Malaterre, McNamara,
Matz-Costa, Pitt-Catsouphes, & Valcour, 2013). Competitive advantage relates to the
private sector. Similarly though, competitive advantage is replaced by political pressures
in public sectors which also looks at the bottom line. Malaterre et al. (2013) went on to
say, “Organizations with a strong business strategy are likely to monitor indicators such
as sales, productivity, costs and profitability and base their decision on hard data” (p.
53
1377). This study uses these defined business strategy indicators to analyze internal
business strategies as it relates to ITG.
Luftman (2000) introduced SAMM that included 39 questions that divide into six
sections. Section 1 is the communication maturity that includes questions relating to
understanding of business by IT, understanding of IT by business, inter/intra-
organizational learning, protocol rigidity, knowledge sharing, and liaison(s)
breadth/effectiveness. Section 2 is the competency and value maturity that includes
questions relating to IT metrics, business metrics, balance metrics, service level
agreement, benchmarking, formal assessments/reviews, and continuous improvements.
Section 3 is the governance maturity that includes questions relation to strategic business
planning, IT strategic planning, reporting/organization structure, budgetary control, IT
investment management, steering committee(s), prioritization process, and business
perception of IT value. Section 4 is the partnership maturity which includes questions
relating to the role of IT in strategic business planning, shared goals, risk,
rewards/penalties, IT program management, relationship/trust style, and business
sponsor/champion. Section 5 is the technology scope maturity that includes questions
relating to traditional, enabler/driver, external, standards articulation, architectural
integration, enterprise, inter-enterprise, and architecture transparency-flexibility. Section
6 is the skills maturity that included questions relating to innovation, entrepreneurship,
locus of power, management style, change readiness, career crossover & education,
cross-training, social, political, and trusting environments.
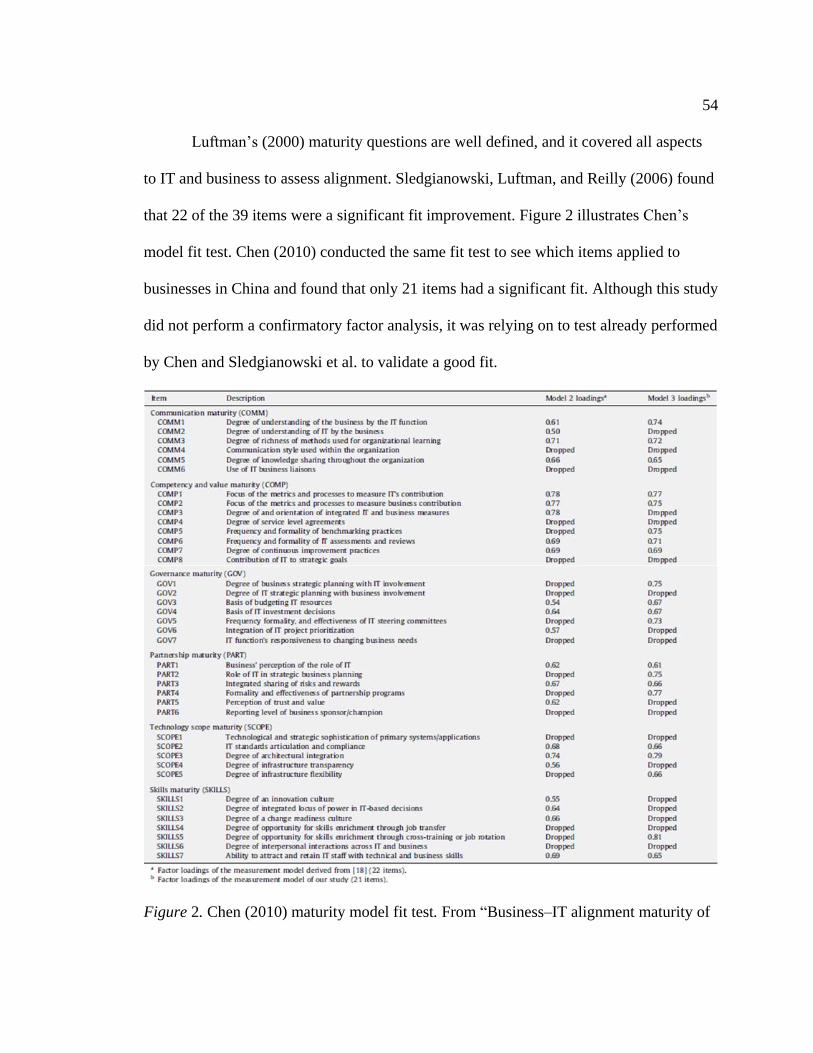
54
Luftman’s (2000) maturity questions are well defined, and it covered all aspects
to IT and business to assess alignment. Sledgianowski, Luftman, and Reilly (2006) found
that 22 of the 39 items were a significant fit improvement. Figure 2 illustrates Chen’s
model fit test. Chen (2010) conducted the same fit test to see which items applied to
businesses in China and found that only 21 items had a significant fit. Although this study
did not perform a confirmatory factor analysis, it was relying on to test already performed
by Chen and Sledgianowski et al. to validate a good fit.
Figure 2. Chen (2010) maturity model fit test. From “Business–IT alignment maturity of

55
companies in China,” by L. Chen, 2010, Information & Management, 47, p. 15-16.
Reprinted with permission.
Although there is a differentiation between public and private agencies, the
Luftman (2000) maturity list of questions applies to all organizations. Private companies
address the bottom line. Public agencies address their political interest. Luftman’s
maturity list of questions goes beyond the bottom line or the political interest. It focuses
on core principles of ITG and business strategy to understand the alignment between the
two strategies. Therefore, no changes were needed to be made to Luftman’s maturity list
of questions.
Luftman (2000) used his 39 variables to create a survey. Similarly, Chen (2010)
used a survey approach to creating the dependent variable of participants self-reporting
along with the six maturity criteria as the independent variable. The six maturity criteria
are communication maturity, competence and value maturity, governance maturity,
partnership maturity, technology scope maturity, and skills maturity. Luftman (2000)
found that 25 Fortune 500 companies averaged a maturity level of 2. An assessment on
the maturity level in LCGAs was conducted in the Southwest region of the United States.
The size of an organization is an important construct of SAMM. Luftman (2000)
noted that benchmarks for the SAMM instrument analyzes the type of industry and the
size of the organization. Chen (2010) analyzed the difference between Chinese domestic
companies and multinationals companies in China. I analyzed LCGAs as the industry and
full-time employment size as the size of the organization. Analyzing how size affects the

56
overall maturity of an organization aligns with the purpose of the SAMM assessment
instrument.
Rationale
The rationale behind this study was to understand different perspective from
departments such as IT, city management office, finance, HR, police, fire, water,
engineering, and the like cohesively along with perspectives from top management such
as city managers, council members, and mayors. Each perspective was evaluated based
on the FTEsize of LCGAs. Along with the perspectives and the FTEsize, this study
addressed the relationship between a city’s IT/business strategic alignment maturity level
and its employment size. It also looks at the current snapshot of LCGAs based on its size.
Luftman (2000) noted that alignment addressed the question of how IT is in
harmony with the organization. Chen (2010) added that maintenance of IT and business
alignment produces greater improved planning, higher perceived value, and more
excellent business performance. Aligning IT and business strategy within a local city
government agency is necessary to achieve greater harmony, planning, value, and
business performance.
Summary and Conclusions
In this chapter, the literature was carefully selected and constructed to provide
more insight into IT/business alignment. The theoretical foundation provided the theories,
historical foundations, major hypotheses, rationale, and the connection to the present
study. The literature review provided the constructs of interest, ways other researchers
have addressed this problem, and justification for each variable related to the research

57
questions. The literature justified the need to analyze external and internal variables of
IT/business alignment. The next chapter discusses the research methodology, design,
method, and sample for this study.

58
Chapter 3: Research Method
The purpose of this quantitative survey study was to examine the relationship
between a city’s IT/business strategic alignment maturity level and its employment size.
Previous studies have investigated issue related to ITG in such areas as consequences of
SOX’s internal controls (Li et al., 2012), SOX financial restatements (Kryzanowski &
Zhang, 2013), ITG top-performance management (Weill & Ross, 2004), and ITG
performance due to maturity levels (Simonsson, Johnson, & Ekstedt, 2010). Other studies
have focused on business maturity levels (Luftman et al., 2010), business/IT alignment in
China (Chen 2010), project management in public sectors (Rosacker & Rosacker, 2010),
emergency management of IT in the United States (Reddick, 2011), and the application
of ITG in universities (Jairak & Praneetpolgrang, 2013). I have examined the relationship
between a city’s IT/business strategic alignment maturity level and its employment size.
In this chapter, I discuss the research design and its appropriateness. I also present
a review and critique of the methodology used, and describe the data analysis plan. In the
final section of this chapter, I describe the threats to validity externally and internally
along with construct validity and ethical procedures.
Research Design and Rationale
I have looked at the overall strategic alignment maturity level of LCGAs and their
employment size. My sampling and measurement techniques were affected by the
method I chose. Leedy and Ormrod (2005) have described quantitative studies as a
relationship-based, qualitative studies as phenomena-based, and mixed-method studies as
covering both aspects. After a close examination of definitions and prior studies, I
59
decided that a quantitative design was the best approach for this study. Similarly, I
selected a nonexperimental study design over experimental and quasi-experimental
designs mostly because of the influence of prior studies, but also because this study did
not try to manipulate data in any way. I used a quantitative survey research approach to
understand the relationship between a city’s IT/business strategic alignment maturity
level and its employment size. Van de Ven (2007) noted that a quantitative survey study
could correlate and compare different variables. I sought to do so by distributing the
survey to participants online using SurveyMonkey, and making available for 3 weeks.
The condensed timeframe allowed participants sufficient time to take and complete the
survey.
I measured the average maturity level of LCGAs using the SAMM instrument.
Chen (2010) provided the six maturity components for strategic alignment as seen in
Table 2. These maturity components are communications, competency/value
measurements, governance, partnership, technology scope, and skills. There are also five
maturity levels on a 1 to 5 Likert scale.

60
Table 2
Strategic Alignment Maturity Categories
Maturity category Description
Communications
(COMM)
The effectiveness of leveraging information for mutual
understanding and knowledge sharing. This category evaluates
such issues as whether business and IT understand each other’s
operating environment, whether a liaison is used to facilitate
knowledge transfer between them, and whether there are rigid
protocols that impede discussion and sharing of ideas.
Competency/value
measurement
(COMP)
The management decisions and strategic choices that an
organization makes when determining the value and contribution
of IT to the firm. This category evaluates such issues as whether
an organization uses technical or business metrics for measuring
IT success, whether the organization has formal benchmarking
practices, and whether IT has contributed to the achievement of
the organization’s strategic goals.
Governance (GOV) The choices organizations make when allocating decision rights
for IT activities. This evaluates issues such as how IT projects are
prioritized and how IT budgets are controlled.
Partnership (PART) Pertains to how IT and the business perceive each other’s
contribution. This evaluates issues such as IT’s role in strategic
business planning and how risk and rewards are shared by IT and
business functions.
Technology scope
(SCOPE)
The management decisions and strategic choices an organization
makes when allocating resources toward its IT infrastructure.
This evaluates whether the primary systems of the organization
enable business strategy, whether business or IT changes are
transparent across the organization, and whether the IT
architecture is flexible in accommodating business and
technology changes.
Skills (SKILLS) The organization’s cultural climate toward change and
innovation. This evaluates issues such as the organization’s
ability to change, whether career crossover opportunities among
IT and business professionals exist, and whether the organization
has the ability to attract and retain the best business and technical
professionals.
Note. From “Business–IT alignment maturity of companies in China,” by L. Chen, 2010,
Information & Management, 47, p. 10. Reprinted with permission.

61
According to Kaiata and Zualkernan (2009), communication competency/value
measurement, governance, partnership, scope, and skills capture the maturity areas of IT
and business alignment. They went on to say that for each of the six maturity areas, there
are five classification levels (Kaiata & Zualkernan, 2009). Both the maturity areas and
the five classification levels made up variables for this study. Similarly, this study used
the SAMM instrument in a local city government environment to understand the average
maturity level and provide recommendations based on each maturity level.
The dependent variable for this study was the strategic alignment maturity level
(SAMM), and the independent variable measured the full-time employee size (FTEsize)
of LCGAs (large, medium, or small). I categorized LCGAs into three sizes. First, small-
sized cities are cities with less than 400 full-time employees. Second, medium-sized cities
are cities with 400 or more full-time employees but less than 1,000 employees. Third,
large cities are cities with more than 1,000 full-time employees. The overall maturity
level was averaged based on all responses to the survey.
Methodology
Researchers have three research methods to choose from when conducting
research: qualitative, quantitative, and mixed methods. When describing the differences
between qualitative and quantitative research approaches, Newman (1998) noted that
qualitative research reflected a phenomenon while quantitative research indicated
universal reality. Leedy and Ormrod (2005) supported Newman’s assertion by describing
how quantitative research answers relationship questions, qualitative research answers
natural phenomena questions, and a mixed research approach answers questions of both

62
the relationship and the phenomena. I evaluated each of these methodologies to
determine which method was suitable for this study. Because I was not looking at a
natural phenomenon or trying to validate a particular event but rather examining
relationships, a qualitative or mixed methods approach was not applicable for this study.
Researchers have used all three methods to study ITG and business strategies.
Quantitative studies are deductive while qualitative studies are inductive. Conversely,
inductive or qualitative reasoning makes a generalization based on events. To reach a
conclusion, I determined that deductive or quantitative reasoning was the practical choice
for this study.
Authors such as De Haes and Van Grembergen used a quantitative research
methodology to study the relationship between two or more variables in ITG and
business performance. Similarly, Luftman (2000 & 2004), Sledgianowski et al. (2006),
Luftman et al. (2010) and Chen (2010) used quantitative research methodology to study
IT and business alignment. Because this study was similar to Luftman and Chen’s
studies, I determined that a quantitative research methodology was most applicable.
I looked at the relationship between ITG and the alignment of business strategy in
LCGAs. According to De Haes and Van Grembergen (2009), there are quantitative
research hypotheses that should be potentially explored when conducting exploratory
research in such areas as ITG, ITG maturity levels, and business/IT alignment. The
purpose of a quantitative research method according to Leedy and Ormrod (2005) is to
examine relationships, confirm the relationships, and validate relationships within the
theory being studied. Therefore, a quantitative research methodology was applicable for

63
this study because I examine the relationship between ITG and the alignment of business
strategy as it relates to the size of LCGAs.
I used a quantitative survey design to examine the relationship between ITG
strategic alignment and business strategy alignment. According to Van de Ven (2007),
there are three designs to choose from; randomized experimental, quasiexperimental, and
nonexperimental designs. A quantitative experimental design analyzes cause and effect
(Leedy & Ormrod, 2005). The randomized experimental design requires two or more
groups of equivalence with one random group used as a treatment subject. Similarly, a
quasiexperimental design analyzes cause and effect with no randomization used on a
group (Leedy & Ormrod, 2005). Nonexperimental studies lack a control group but
observe and compare a natural event (Van de Ven, 2007). A nonexperimental study was
appropirate for this study because there was no control group.
A quantitative survey design was used to examine the relationship between both
the independent and dependent variables (Van de Ven, 2007). I used survey data to
examine the relationship a city’s IT/business strategic alignment maturity level and its
employment size. I also identified a snapshot of the current maturity level of small,
medium, and large size LCGAs organizations. There are two types of nonexperimental
collection of data that can be used, correlational and survey. A correlational study
statistically investigates surface relationships that do not identify the underlining
reasoning behind the relationship (Leedy & Ormrod, 2005). A survey study was used to
examine the underlining reasoning behind a relationship in terms of incidence,
64
distribution, and frequency (Leedy & Ormrod, 2005). Therefore, a survey design was
useful for this study.
Population
The target population for this study is from randomly selected cities within the
Southwest region of the United States. Budgetary information provided publically by
each city showed the number of approved overall employment positions. These figures
are used to assess the population data. Based on the accepted employment positions,
cities were considered as large cities (> 1000 employees), medium cities (400 < 1,000
employees), and small size cities (< 400 employees). The plan attempted to ask on
average five participants per city with three strata sizes. The total population needed for a
viable study was estimated to be 38 participants. This survey provides a general looking
into the local city government workplace environments to determine relationships in
IT/business strategic alignment maturity level and its employment size.
Sampling and Sampling Procedures
Luftman (2003) refined the SAMM instrument, as did Sledgianowski et al. (2006)
and Chen (2010) by identifying a goodness-of-fit index of the model. This study used the
same instrument to examine the relationship between ITG and the alignment of business
strategy in LCGAs. These results were further analyzed. The SAMM instrument was
available in an online survey format and administered online anonymously within a 3-
week period to give participants enough time to complete the survey.
The sample size was calculated using a G*Power 3 Tool. This study has included
a report on the mean of a scale called maturity level. The scale has five possible

65
responses, which range from a maturity level of one or initial at one end to optimized or a
maturity level of 5 at the other end. Because these responses follow a logical sequence, I
can assign a numerical score to each response (from 1 to 5), and compute a mean and
standard deviation. I have estimated the mean to within (plus/minus) 0.3 points of the true
value. The computation of sample size is the error margin of plus/minus 0.3 points on a
5-point Likert scale, patterned estimated responses, and missing data.
A worst case expected pattern of responses is seen in Figure 3. The estimated
initial response–Level 1 is (45%), committed response–Level 2 is (30%), established
response–Level 3 is (20%), improved response–Level 4 is (5%), and the optimized
response–Level 5 is (0%). These estimates correspond to a mean of 1.85 with a standard
deviation of 0.91. Only completed responses were analyzed, and missing data deleted
from the final computation.

66
Figure 3. Worst case expected responses.
Consequently, the decision to use a sample size of 38 participants is the basis of
the decisions and assumptions outlined above. Based on different sets of decisions and
assumptions, the sample size changed accordingly. There was an assumption that the
majority of LCGAs will have a worst-case maturity level of one, two, or three. According
to those assumptions, 38 participants were ideal with a target of 56 or more participants.
Computation of the required sample size was based primarily on three factors: the margin
of error, dispersion of responses, and missing data.
The first factor that determines the necessary sample size was the acceptable
margin of error. Accepting a relatively wide margin of error will need a small sample
size. Similarly, if a relatively narrow margin of error is desire, then a relatively large
sample size is needed. For an error margin of plus/minus 0.30 points, I needed 38
0%
5%
10%
15%
20%
25%
30%
35%
40%
45%
50%
InitialLevel 1
CommittedLevel 2
EstablishedLevel 3
ImprovedLevel 4
OptimizedLevel 5
45%
30%
20%
5%
0%
PER
CEN
T O
F R
ESP
ON
SES
MATURITY LEVEL
Expected Responses

67
participants at a minimum. If the error margin (to 0.60 points) doubles, the sample size
would be reduced to 12 subjects. By contrast, if the error margin (to 0.15 points) reduces
in half, the required sample size would increase to 144 participants.
The second factor that determines the necessary sample size was the dispersion of
responses. If clustered responses are in a narrow range, the error will tend to be small,
and the appropriate sample size is relatively small. Similarly, if the responses fall over a
wider range, the error will tend to be larger, and the appropriate sample size is relatively
high. Based on the G*Power 3 tool, the dispersion was quantified using the standard
deviation of the responses. The pattern used in this calculation leads to a required sample
size of 38. If the true standard deviation were 10% larger than assumed, then a sample
size of 46 would be needed. If the true standard deviation were 10% smaller than
assumed, a sample size of only 32 participants would be necessary.
The third factor that determines the required sample size was the percent of
missing data. In following the assumption that the sample size be 38 participants, there
can be no missing data associated with this sample. The expected rate of missing data is
2%. Therefore, a sample size of 39 would be needed. To cover the expected real rate of
missing data and other assumption, 56 participants was the objective. The adjustment of
missing data assumes that the data is missing entirely at random. No attempt was made to
calculate the validity of participants who complete the survey as opposed to participants
who did not complete the survey.
I targeted and try to contact at minimum 38 IT and business executives from
several local cities and towns using the three strata sizes. Chen (2010) required at least
68
three IT executives and three business executives from each company take the survey.
Similarly, this study randomly attempted to contact at least three IT executives along with
three business executives per city to obtain the sample size of 38. Five or more IT and
business executives had access to the survey. Using the G*Power 3 tools to calculate the
sample size, 38 participants were calculated to be ideal. This sample size creates a 95%
likelihood that the sample mean and the true mean will fall within 0.3 points of each
other. Observation of a mean of 1.85 will report that the true mean will probably fall in
the range of 1.85 plus/minus 0.3 points. I removed blank responses and omitted data from
the dataset. The original response rate for this study was 100% after excluding
nonresponses and missing data.
The research generalization findings of the survey may be affected by the total
error. Because only random LCGAs participants were studied, sampling errors can occur
along with nonsampling error, which equates to the total error (Smith & Albaum, 2005).
The goal of the survey was to obtain results from a target population of 50 participants
online using Surveymonkey. Smith and Albaum (2005) noted that there is a reduction in
the total error when using online surveys. The sampling technique used was a random
sampling of LCGAs.
Procedures for Recruitment, Participation, and Data Collection
The data source use in this study was a survey data source analysis. A Web-based
survey collected answers anonymously. SurveyMonkey was used to distribute the survey
and act as an instrument to collect data.
69
The local city government participants did use a web browser to access the online
survey for completion. Informed consent acknowledgement was provided at the
beginning of each survey. The survey did not identify the organization or individual
information. At the end of the survey, participants were given one final chance to decide
if they wanted to have their responses added to this study. After they submitted their
responses, they were thanked for their participation and will be provided aggregate
results after this study is complete. The dataset was available after the time to take the
survey was complete. During the data collection phase, the information was stored on a
secured server at SurveyMonkey. After finalizing data collection, SurveyMonkey
exported an SPSS data file using Illume software with case numbers (no other identifiers)
attached. I then analyze the data file. Once the dataset was uploaded and stored, the
dataset will remain on SurveyMonkey until a request is made to delete the original
dataset.
Instrumentation and Operationalization of Constructs
The originator of the SAMM instrument is Luftman (2000). Chen (2010) revised
this instrument and deployed it to organizations within China. I used Luftman’s SAMM
instrument and distributed it to LCGAs in the Southwest region of the United States. The
appropriateness of this instrument to the current study was that it identified the alignment
maturity level of LCGAs as it relates to the city size. City agencies can use this
information to determine how well they compare to other LCGAs of similar and different
sizes.

70
Chen (2010) noted that the reliability and validity of this instrument are much
higher than the benchmark requirements. Approval was granted to use Luftman (2010)
work (see Appendix A). Thus far, this instrument has been used in over 2,000
organizations within the United States; however, only one government agency was
evaluated. This instrument was also used in China to test 22 companies and 154
solicitations of IT and business executives (Chen, 2010).
The basis for the development of this instrument was to see a snapshot of IT and
business maturity alignment levels. I used the research question to examine if there was a
relationship between a city’s IT/business strategic alignment maturity level and its
employment size. Since this instrument has been in use for over 14 years within the U.S.,
it provides credibility to answer the research questions. The results from the data
collected were used to test each hypothesis by averaging the overall maturity level
responses of LCGAs.
Dependent Variables
The LCGAs strategic alignment maturity level is the dependent variable of this
study. There are primary and secondary factors. The strategic alignment maturity level is
the primary factor in this study and is represented by (SAMM). The average mean value
calculates the secondary factors. Each of the six criteria, secondary factors, are averaged
as an ordinal value. These averages make up the secondary factors.
Communications maturity was the first secondary factor (Comm). Luftman (2000)
noted that this secondary factor measures communication effectiveness. This factor
identifies whether or not ideas are being communicated within LCGAs. Using the

71
SAMM instrument, six questions relates to communication maturity. The average level of
those question measures the observed communication maturity level of one participant.
Competency and value maturity was the second secondary factor (Comp).
Luftman (2000) described this secondary factor as how well both the IT and business
demonstrates value. Eight questions relates to the competency and value maturity level.
Each of the eight questions represents the observed competency and value maturity level.
Governance maturity was the third secondary factor (Gov). Chen (2010) noted
that this secondary factor measures how well IT and business can allocate decision right
and prioritize budgets. Seven questions relates to the governance maturity level. Each of
the seven questions represents the governance observed maturity level.
Partnership maturity was the fourth secondary factor (Part). Chen (2010)
described this secondary factor measures how well IT and business perceive
contributions. Six questions relate to the partnership maturity level. Each of the six
questions represents the partnership observed maturity level.
Scope and architecture maturity was the fifth secondary factor (Scope). Luftman
(2000) noted that this secondary factor measures technology maturity. Five questions
relates to the scope and architecture maturity level. Each of the five questions represents
the scope and architecture observed maturity level.
Human resource skills maturity was the sixth secondary factor (Skills). Chen
(2010) noted that this secondary factor measures change and innovation within the
culture of the environment. Seven questions relates to the human resources skills maturity

72
level. Each of the seven questions represents the human resources skills observed
maturity level.
Independent Variable
The independent variable for this study was the size of each LCGAs. City sizes
are calculated by full-time employees (FTE) and defined in terms of small (< 400),
medium (400 < 1000), and large (> 1,000) agencies. This data was collect anonymously
using an online survey.
Data Analysis
Analyzing the survey dataset using SPSS helped organize, simplify, and analyze
data. The plan for analyzing the survey dataset was to use descriptive and inferential
statistical analysis. Statistical analysis was conducted using SPSS Version 21. Raw SPSS
dataset file from the survey was imported into SPSS Version 21 to perform the analysis.
The sample within this study was described using descriptive statistics. Summary
statistics represented the mean, median, normal/skewness, frequency of distribution,
variance, and standard deviation. Analyzing data was not conducted using correlation and
linear regression analysis but instead a one-way ANOVA was more applicable based on
the histogram.
The research question organizing this study was: What was the relationship
between a city’s IT/business strategic alignment maturity level and its employment size?
This research question provides the following hypotheses.
H1o: There was no relationship between a city’s IT/business strategic alignment
maturity level and its employment size.

73
H1a: There was a relationship between a city’s IT/business strategic alignment
maturity level and its employment size.
H2o: There was no relationship between a city’s IT/business communication
maturity level and its employment size.
H2a: There was a relationship between a city’s IT/business communication
maturity level and its employment size.
H3o: There was no relationship between a city’s IT/business competency and
value maturity level and its employment size.
H3a: There was a relationship between a city’s IT/business competency and value
maturity level and its employment size.
H4o: There was no relationship between a city’s IT/business governance maturity
level and its employment size.
H4a: There was a relationship between a city’s IT/business governance maturity
level and its employment size.
H5o: There was no relationship between a city’s IT/business partnership maturity
level and its employment size.
H5a: There was a relationship between a city’s IT/business partnership maturity
level and its employment size.
H6o: There was no relationship between a city’s IT/business scope and
architecture maturity level and its employment size.
H6a: There was a relationship between a city’s IT/business scope and architecture
maturity level and its employment size.

74
H7o: There was no relationship between a city’s IT/business human resource
skills maturity level and its employment size.
H7a: There was a relationship between a city’s IT/business human resource skills
maturity level and its employment size.
Pearson product-moment correlation coefficient linear regression equation was
not used to calculate and make correlations between different variables in IT/business
alignment and its employment size. Instead, a one-way ANOVA was used to measure
mean differences. According to Frankfort-Nachmias and Nachmias (2008), Pearson's r
reflects the direction and magnitude of the correlation between two variables. This test
was not used in the hypothesis to confirm an assumption of correlation. Pearson's
correlation coefficient (r) has a high positive correlation when the two variables are
closer to a positive one. Conversely, r has a high negative correlation when the two
variables are closer to a negative one. No correlation exists when r for each variable
approach zero. Another equation not used in this study was a bivariate linear regression
analysis. According to Green and Salkind (2011), bivariate linear regression evaluates
how well the independent variable predicts one or more dependent variables. This study
analyzes the overall maturity level of LCGAs.
A one-way ANOVA was used to measure mean differences between different
groups. According to Green and Salkind (2011), an ANOVA assesses whether the means
of a dependent variable is significantly different among the independent variable groups.
A one-way ANOVA predicted how well IT/business strategically aligns as it relates to
75
communication maturity, competency/value maturity, governance maturity, partnership
maturity, technology scope maturity, and skills maturity.
Threats to Validity
External Validity
External validity is the length at which findings of a study can be applied to a
larger population or in a different setting (Frankfort-Nachmias & Nachmias, 2008). This
study used a 95% assumption rate to compute the sample size. This assumption rate
allowed the observation value to fall within the margin of error in either direction. As
random sampling technique was used, there was external validity in this study.
Internal Validity
According to Leedy and Ormrod (2005), internal validity allows the researcher to
make accurate conclusions about cause-and-effect relationships in data. Factors that can
jeopardize internal validity are extrinsic factors, which happen before the study and
intrinsic factors, which occur during the study period (Frankfort-Nachmias & Nachmias,
2008). The validity of the instrument to collect data was assumed because it was created
by Luftman (2000) and validated by Sledgianowski et al. (2006) and Chen (2010).
Theories used around the world as best practices provide decisive factors of validity.
Researchers collecting data correctly along with the confidence that it is complete
minimizes threats to internal validity (Leedy & Ormrod, 2005). Because of the 14 plus
years of using this survey, I am confident that the data collected from this survey have a
limited threat to internal validity. Chen (2010) measured internal consistency by
assessing composite reliability. He found that the composite reliability coefficients were
76
higher than the benchmark coefficient of 0.60. The coefficient of 0.06 means that the
internal validity of this survey had a high internal reliability of the data (Chen 2010).
There was also high internal validity for this study due to IRB approval, Dissertation
Committee approval, and proven focus areas.
Construct Validity
According to Leedy and Ormrod (2005), construct validity is characteristics such
as motivation, creativity, racial bias, bedside manner, and the such that are taken into
consideration when using an instrument to conduct a survey. There are 39 questions
asked of participants. All of these questions in some way measure the constructs in
question. Threats to construct validity would be only to ask these questions of particular
participants. I used several cities, different FTEsizes, and randomized participation to
gather data. Participants could have had varying educational levels, ethnicity, ages, and
gender differences, which limit the threat of construct validity.
Ethical Procedures
The ethical research was consistent with APA standards and Walden University
ethical standards as it relates to the use of a survey, confidentiality, consent, and
organization involvement. My committee members approved my proposal. Then the
Institutional Review Board (IRB) reviewed this study, accepted, verified, and validated
that all ethical standards were in proper compliance.
Letters of recruitment (see Appendix C) was sent to LCGAs asking participants
within the city to voluntarily participate in this online survey. This emailed letter clearly
identified the full scope and approximate time it takes to complete this survey along with
77
how this study was voluntary and how it maintained confidentiality. The participant
reminder email (see Appendix D) was the official email letter used to remind participants
to take the survey before the deadline of three weeks has been met. This letter explained
to each participant a brief description of the nature of the study, benefits/risks, voluntary
consent information, the right to withdraw, and personal information usage. When
participants take the online survey, they were given the opportunity read and accept the
acknowledgment informed consent form (see Appendix E). Participants were given the
opportunity print a copy of this consent form for his or her records.
Protecting LCGAs and participant personal identifying information have
minimized risk. Participant did not enter personal information. A password protected
personal computer, and a memory stick are two electronic media devices to store data.
Access to data was restricted only to authorized personnel such as my dissertation
committee members, Walden University Ethics Board, and myself. I used SurveyMonkey
to distribute and collect data. Only completed results from this online survey were
collected.
In social science research, ethical considerations must be addressed. Frankfort-
Nachmias and Nachmias (2008) postulated that regulatory requirements such as legal
requirements, review committees within Universities and institutions, code of ethics used
professionally, and the code of ethics used personally are all important in ethical
considerations. Following such guidelines protects both the researched and the
researcher. Walden University Institutional Review Board (IRB) approves studies. This
study proposal was subject to a full review, evaluation, and approval process by

78
Walden’s IRB. A flash drive stores all data in a read-only format and will be locked in a
safe for 5 years. According to Walden University's security policy, data must be stored
for five years and then destroyed. This research will store data for 5 years.
Summary
The literature review for this study justifies the need for quantifiable data about
IT/business alignment. Chapter 3 presents a detailed explanation of the research method
and design. It also tested the hypothesis to examine if there was a relationship between a
city’s IT/business strategic alignment maturity level and its employment size. Analyzing
seven local cities should provide a snapshot into the state of IT and business alignment
and serve as a benchmark for future studies.
Overall, Chapter 3 includes a detailed explanation of the research method and
design. This chapter first included an analysis of the appropriateness of a quantitative
survey design to determine the research questions and hypotheses. Additionally included
is the data source, sample used, and detailed steps taken for data analysis management
and procedures. Finally, this chapter included ethical considerations to protect the
participants.

79
Chapter 4: Results
This chapter includes the findings and results of the data I collected and
statistically analyzed. The purpose of this quantitative survey study was to perform an
assessment using the SAMM instrument to determine if there was a relationship between
the LCGAs IT/business strategic alignment maturity level and the city’s full-time
employee size. I also sought to provide snapshots of the current maturity levels of
LCGAs studied. The primary dependent variable for this study was the strategic
alignment maturity level of LCGAs (SAMM). This variable consisted of six secondary
IT/business alignment criteria. These secondary variables were communications maturity
(Comm), competency & value maturity (Comp), governance maturity (Gov), partnership
maturity (Part), scope and architecture maturity (Scope), and the human resource skills
(Skills) maturity levels. The independent variable was measured using the city’s FTEsize.
I categorized the LCGAs by city size into small, medium, and large LCGAs. Both the
independent and dependent variables have significance for LCGAs. They identify the
LCGAs strategic alignment maturity level and define how the size of the city’s FTE
affects alignment. The research question guiding my study was: What is the relationship
between LCGAs IT/business strategic alignment maturity level and the city’s FTE size?
This research question had seven hypotheses associated with it, one primary, and six
secondary. I analyzed the data using SPSS version 21.0. I have divided the following
chapter into three sections: data collection, study results, and the summary of the results.
The data collection section is comprised of the timeframe of the study, discrepancies in

80
data collection, a description of the data, and results. The Results section includes a
description of statistical assumptions and my statistical analysis of findings.
Data Collection
This section includes the data collection summary. Here I describe the initial plan
and timeframe along with response rates. I also describe all the discrepancies along with
the descriptive statistics. The data collection process was random, confidential, and
anonymous.
Plan/Time Frame
In collaboration with dissertation committee members, LCGAs leadership, and
the Walden IRB, I had planned to make initial data collection strategic and precise.
Originally, I had planned to proceed as follows:
1. Obtain approval from Dr. Luftman to use SAMM instrument (1 week).
2. Obtain IRB approval (3 weeks).
3. Setup and use SurveyMonkey to distribute the survey via a web link (2
weeks).
4. Develop a good Letter of Recruitment (Appendix C), Cooperation Letter,
(Appendix D), Participant email (Appendix E), Acknowledge Informed
Consent Form Appendix F) (1 week).
5. Obtain approval via email from LCGAs city managers two weeks after IRB
approval (2 weeks).
6. Open the survey (3 weeks).
7. Email top executives to request anonymous participation (3 weeks).

81
8. Present aggregate results to top executives one month after the email went out
to the city managers for approval (1 month).
I asked top executives to participate anonymously, and gave them 3 weeks to complete
the survey. Each participant was sent a follow-up email reminder the first week, the
second week, at the beginning of the third week, on Wednesday of the third week, and on
the last day before the time of the survey had come to an end. Once the survey’s period
had ended, data was then summarized by SurveyMonkey and exported as an SPSS file.
No personal information was collected or distributed.
During the open survey period, 80 participants attempted the survey. Forty-eight
surveys were completed, N = 48. I sent seven hundred and ninety-six emails to 81
different LCGAs. There were 66 small cities, five medium cities, and ten large cities
selected in the southwestern region of the United States. Twenty participants from small
cities completed the survey. Medium size cities likewise had 20 participants complete the
survey. Large size cities had eight participants complete the survey. Out of all
participants, 18 were leaders, 15 were department directors, and 15 were top
management.
Discrepancies
Discrepancies in the data collection plan are listed below:
1. Obtain approval from Dr. Luftman to use SAMM instrument (1 week). This
was completed as planned.

82
2. Obtain IRB approval (3 weeks). It took three different revisions of my IRB
application to gain final approval. This process extended the planned approval
time from three weeks to two months.
3. Setup and use SurveyMonkey to distribute the survey via a web link (2
weeks). I completed this as planned.
4. Develop a good letter of recruitment (Appendix C), cooperation letter,
(Appendix D), participant email (Appendix E), and acknowledge informed
consent form (Appendix F) (1 week). The appendix order and contents
changed during the second and third IRB application revisions. The IRB
reviewer found no need for the cooperation letter. I replaced the coorperation
letter with changes made to the letter of recruitment, participant reminder
email, and the SurveyMonkey acknowledge informed consent form. In total,
IRB approval process took 2 months to complete.
5. Obtain approval via email from LCGAs city managers 2 weeks after IRB
approval (2 weeks). No need for this step. To replace this step, I distributed
around 800 public record emails to local cities and towns in the southwestern
region of the United States.
6. Open survey (3 weeks). I completed this as planned. I also included 2
additional weeks as a contingency plan for additional IRB clearance if I was
unable to obtain 38 participants or more.
7. Email top executives to participate anonymously (3 weeks). I completed this
as planned.

83
8. Present aggregate results to top executives 1 month after the email was
distributed to the city managers for approval (1 month). I sent aggregate
results to each person on the email list 1 month after this study is completed.
As this list indicates, there were several discrepancies between the initial plan and
final implementation. SurveyMonkey was used to anonymously collect the data from
participant responses. Each participant was asked two demographic questions about their
agency, job level, and the FTE size of their organization. Three weeks were given to all
participants along with several follow-up email reminders encouraging each participant to
complete their surveys before the deadline. After the deadline, I exported the results as an
SPSS (.sav) file.
Another discrepancy I found was my assumption that Pearson correlation would
be the ideal analytic measurement. Pearson correlation measures the relationship of
different variables based on a linear correlation. After attempting to use Pearson
correlation, it was clear that this was not the correct analysis to use. Figure 4 displays the
simple scatter dot plot that shows no linear relationship between each dataset.

84
Figure 4. Simple scatter plot.
After analyzing the scatter plot, it was clear that I was using an incorrect analysis.
I then used a histogram chart to see how the mean, standard deviation, and sample size
would appear. Figure 5 shows how the frequency curve has positively skewed
distribution, normal curve, and pointed in a positive direction. This chart indicated that
the dependent variable was normally distributed. Therefore, I determined that an
ANOVA was adequate for this study. ANOVA would look at the mean differences
between groups instead of looking at the relationships between variables as in the
Pearson correlation.
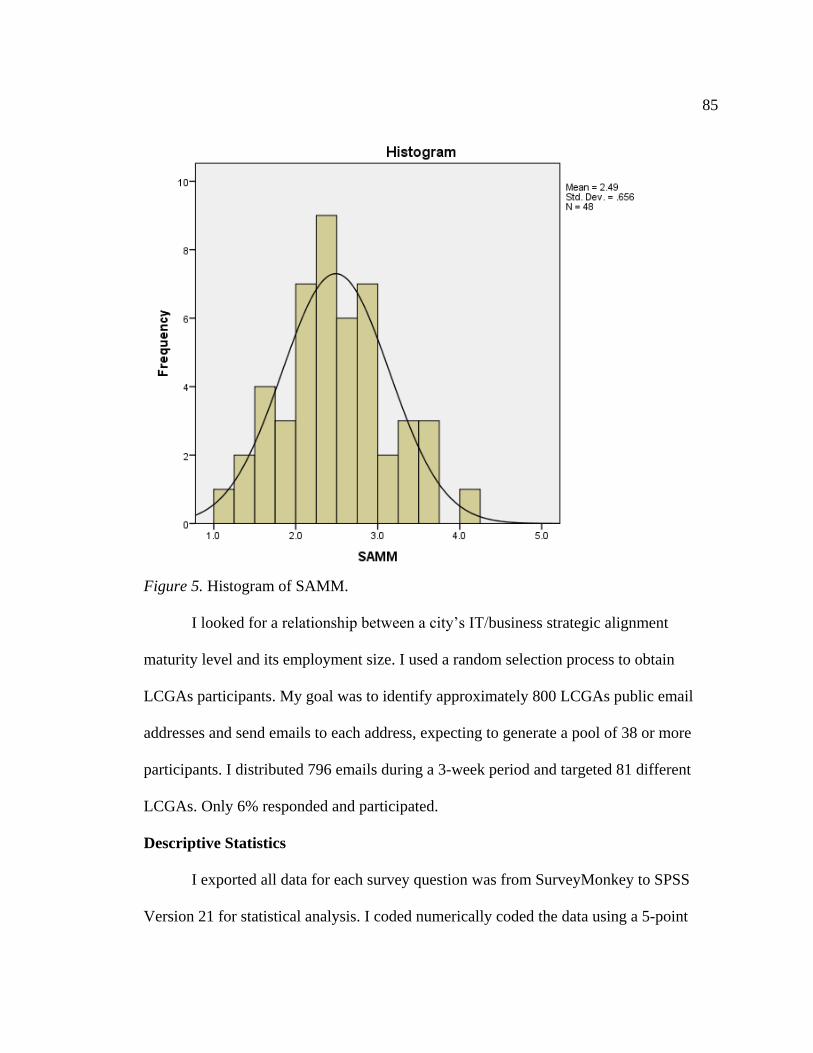
85
Figure 5. Histogram of SAMM.
I looked for a relationship between a city’s IT/business strategic alignment
maturity level and its employment size. I used a random selection process to obtain
LCGAs participants. My goal was to identify approximately 800 LCGAs public email
addresses and send emails to each address, expecting to generate a pool of 38 or more
participants. I distributed 796 emails during a 3-week period and targeted 81 different
LCGAs. Only 6% responded and participated.
Descriptive Statistics
I exported all data for each survey question was from SurveyMonkey to SPSS
Version 21 for statistical analysis. I coded numerically coded the data using a 5-point

86
Likert scale (1 = Level 1-initial to 5 = Level 5-optimized). I made no changes made to the
SAMM instrument.
I measured the distribution patterns of the survey data using frequency
distribution, and calculated responses using descriptive statistics in term of the means,
standard deviations, and ranges. I tested each hypothesis with a one-way ANOVA using
SPSS version 21. To reject the null hypotheses at a 95% confidence level, the standard of
p < .05.
Table 3 displays the frequency of the survey results in terms of the participant’s
job position, the size of their city/town, and their SAMM responses. Across all
participants’ job position, 18 (37.50%) were leaders, 15 (31.25%) were department
directors, and 15 (31.25%) were top management. Based on FTE city size, 20 (41.67%)
were small cities/towns, 20 (41.67%) were medium cities, and 8 (16.67%) were large
cities. Responses to each question are equal in the number of responses because only
completed responses were measured. The total number of participants who started the
survey were 80 participants. Only 60% completed the survey.

87
Table 3
LCGAs Frequency (N = 48)
Variables and category n %
Job Position
Leader
Department Director
Top Management
Total
18
15
15
48
37.50
31.25
31.25
100
City Size
Small
Medium
Large
Total
20
20
8
48
41.67
41.67
16.67
100
SAMM
Comm
Comp
Gov
Part
Scope
Skills
Total
48
48
48
48
48
48
48
100
100
100
100
100
100
100
Table 4 displays the overall descriptive statistics related to LCGAs FTEsize and
the SAMM. The maturity level ranges from 1 to 5 for each FTEsize. According to
Frankfort-Nachmias and Nachmias (2008), the mean (M) lends itself to mathematical
calculations and statistical measures. Small LCGAs FTEsize cities and towns recorded an
M = 2.59 with a standard deviation (SD) = 0.83. Medium LCGAs FTEsize cities had an
M = 2.34 with a SD = 0.58. Large LCGAs FTEsize cities had an M = 2.61 with a SD =
0.74. The overall mean value for LCGAs is M = 2.49 with a SD = 0.66. Standard
deviation identifies the dispersion points above and below the mean value (Frankfort-
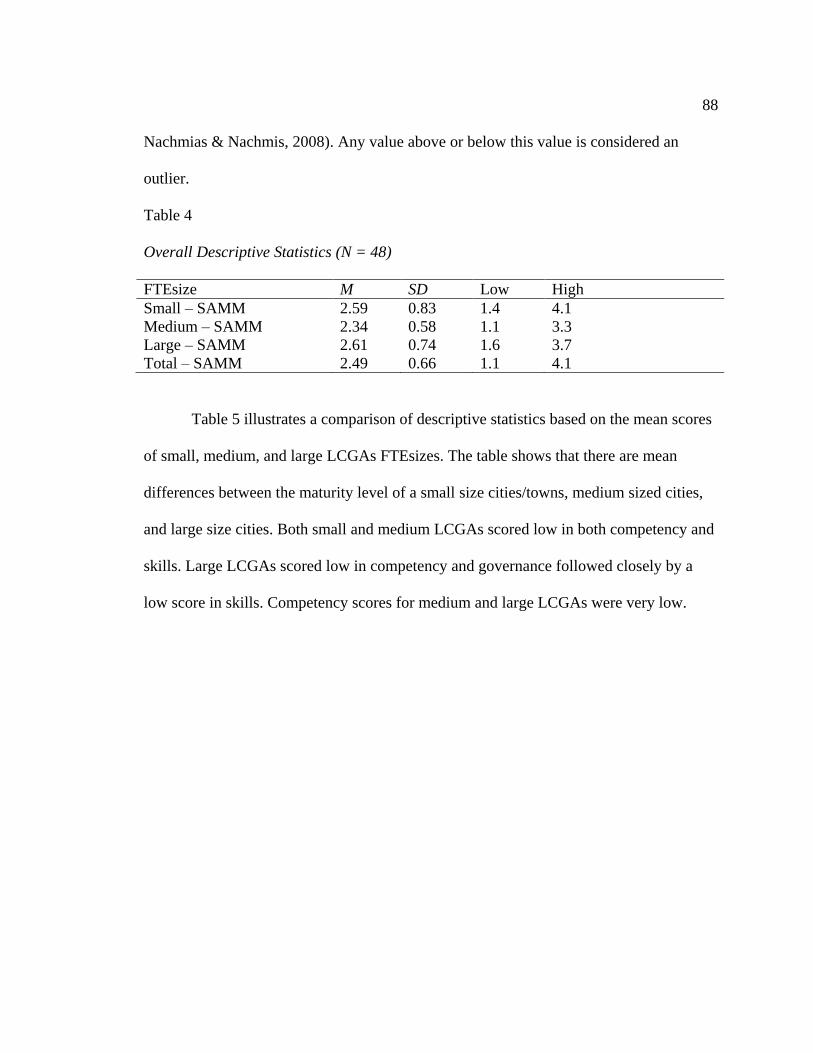
88
Nachmias & Nachmis, 2008). Any value above or below this value is considered an
outlier.
Table 4
Overall Descriptive Statistics (N = 48)
FTEsize M SD Low High
Small – SAMM
Medium – SAMM
Large – SAMM
Total – SAMM
2.59
2.34
2.61
2.49
0.83
0.58
0.74
0.66
1.4
1.1
1.6
1.1
4.1
3.3
3.7
4.1
Table 5 illustrates a comparison of descriptive statistics based on the mean scores
of small, medium, and large LCGAs FTEsizes. The table shows that there are mean
differences between the maturity level of a small size cities/towns, medium sized cities,
and large size cities. Both small and medium LCGAs scored low in both competency and
skills. Large LCGAs scored low in competency and governance followed closely by a
low score in skills. Competency scores for medium and large LCGAs were very low.
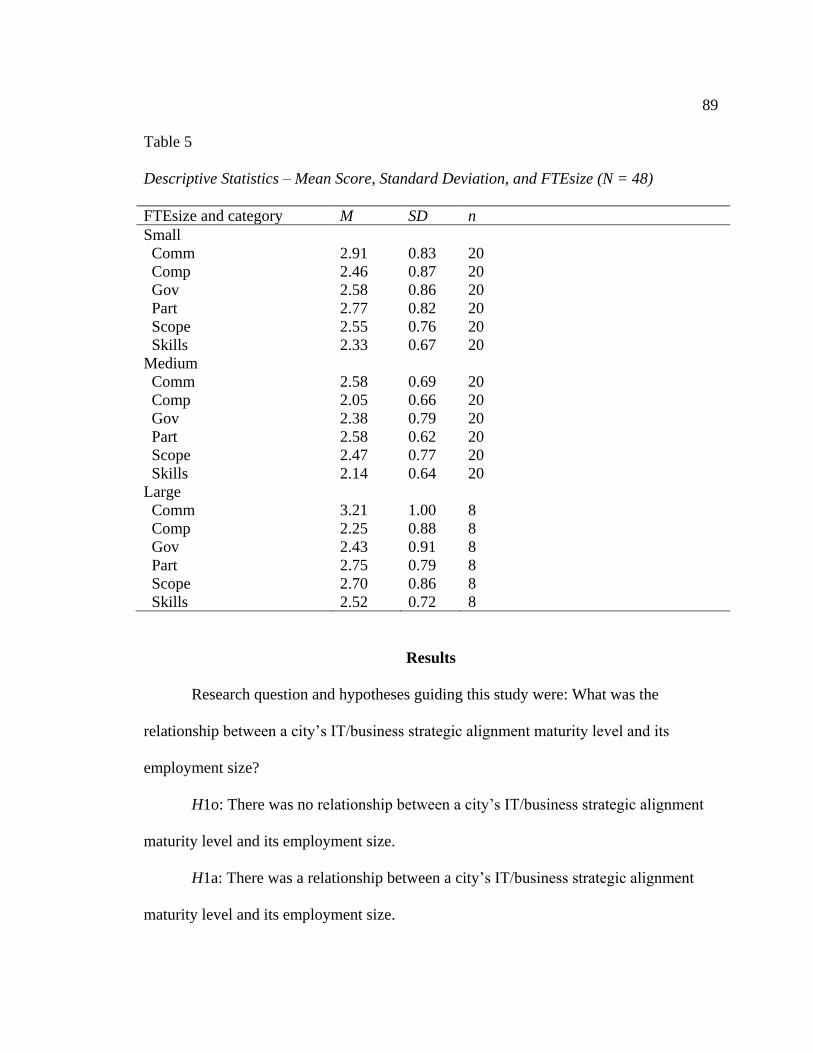
89
Table 5
Descriptive Statistics – Mean Score, Standard Deviation, and FTEsize (N = 48)
FTEsize and category M SD n
Small
Comm
Comp
Gov
Part
Scope
Skills
Medium
Comm
Comp
Gov
Part
Scope
Skills
Large
Comm
Comp
Gov
Part
Scope
Skills
2.91
2.46
2.58
2.77
2.55
2.33
2.58
2.05
2.38
2.58
2.47
2.14
3.21
2.25
2.43
2.75
2.70
2.52
0.83
0.87
0.86
0.82
0.76
0.67
0.69
0.66
0.79
0.62
0.77
0.64
1.00
0.88
0.91
0.79
0.86
0.72
20
20
20
20
20
20
20
20
20
20
20
20
8
8
8
8
8
8
Results
Research question and hypotheses guiding this study were: What was the
relationship between a city’s IT/business strategic alignment maturity level and its
employment size?
H1o: There was no relationship between a city’s IT/business strategic alignment
maturity level and its employment size.
H1a: There was a relationship between a city’s IT/business strategic alignment
maturity level and its employment size.

90
A one-way Analysis of Variance (ANOVA) was used to examine whether a city’s
IT/business strategic alignment maturity level (SAMM) is a function of its employment
size. The independent variable represented three different city sizes with unequal sample
sizes: (a) small (n = 20); (b) medium (n = 20); and (c) large (n = 8). The dependent
variable was the overall SAMM results obtained from 48 participants. All analysis used
an alpha level of .05. The test for homogeneity of variance was not significant [Levene F
(2, 45) = 0.57, p > .05] indicating that the underlying assumptions of applying ANOVA
were correct. Figure 6 reveals that there was not a statistically significant difference in
results [F(2, 45) = 0.86, p > .05] between SAMM and all three groups of city sizes which
resulted in a small effective size of .04.
Figure 6. Analysis of variance for SAMM.
Figure 7 graphically displays the means for the three city size groups as it relates
to SAMM. The X-axis (FTEsize) represents the three groups (small, medium, and large).
The Y-axis (SAMM) represents the mean number of the overall IT/business strategic
alignment. SAMM values are between 1 and 5. In this case, the medium sized LCGAs
had the lowest mean score (2.34) compared to small sized LCGAs (2.59) and large sized
LCGAs (2.61).

91
Figure 7. SAMM mean plot.
The second hypothesis was as follows:
H2o: There was no relationship between a city’s IT/business communication
maturity level and its employment size.
H2a: There was a relationship between a city’s IT/business communication
maturity level and its employment size.
A one-way Analysis of Variance (ANOVA) was used to examine whether a city’s
IT/business communication maturity level (Comm) is a function of its employment size.
The independent variable represented three different city sizes with unequal sample sizes:
(a) small (n = 20); (b) medium (n = 20); and (c) large (n = 8). The dependent variable was
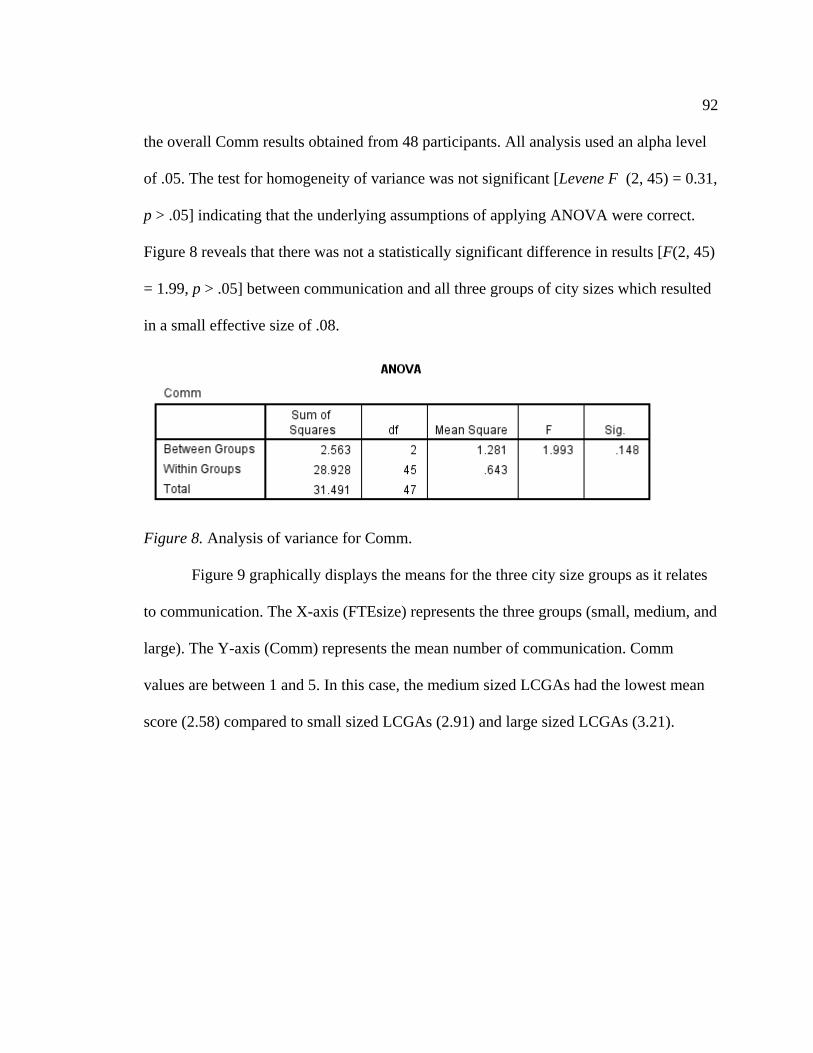
92
the overall Comm results obtained from 48 participants. All analysis used an alpha level
of .05. The test for homogeneity of variance was not significant [Levene F (2, 45) = 0.31,
p > .05] indicating that the underlying assumptions of applying ANOVA were correct.
Figure 8 reveals that there was not a statistically significant difference in results [F(2, 45)
= 1.99, p > .05] between communication and all three groups of city sizes which resulted
in a small effective size of .08.
Figure 8. Analysis of variance for Comm.
Figure 9 graphically displays the means for the three city size groups as it relates
to communication. The X-axis (FTEsize) represents the three groups (small, medium, and
large). The Y-axis (Comm) represents the mean number of communication. Comm
values are between 1 and 5. In this case, the medium sized LCGAs had the lowest mean
score (2.58) compared to small sized LCGAs (2.91) and large sized LCGAs (3.21).

93
Figure 9. Comm mean plot.
The third hypothesis was as follows:
H3o: There was no relationship between a city’s IT/business competency and
value maturity level and its employment size.
H3a: There was a relationship between a city’s IT/business competency and value
maturity level and its employment size.
A one-way Analysis of Variance (ANOVA) was used to examine whether a city’s
IT/business competency and value maturity level (Comp) is a function of its employment
size. The independent variable represented three different city sizes with unequal sample
sizes: (a) small (n = 20); (b) medium (n = 20); and (c) large (n = 8). The dependent

94
variable was the overall SAMM results obtained from 48 participants. All analysis used
an alpha level of .05. The test for homogeneity of variance was not significant [Levene F
(2, 45) = 0.31, p > .05] indicating that the underlying assumptions of applying ANOVA
were correct. Figure 10 reveals that there was not a statistically significant difference in
results [F(2, 45) = 1.37, p > .05] between competency/value and all three groups of city
sizes which resulted in a small effective size of .06.
Figure 10. Analysis of variance for Comp.
Figure 11 graphically displays the means for the three city size groups as it relates
to competency and value. The X-axis (FTEsize) represents the three groups (small,
medium, and large). The Y-axis (Comp) represents the mean number of competency and
value. Comp values are between 1 and 5. In this case, the medium sized LCGAs had the
lowest mean score (2.05) compared to small sized LCGAs (2.25) and large sized LCGAs
(2.46).

95
Figure 11. Comp mean plot.
The fourth hypothesis was as follows:
H4o: There was no relationship between a city’s IT/business governance maturity
level and its employment size.
H4a: There was a relationship between a city’s IT/business governance maturity
level and its employment size.
A one-way Analysis of Variance (ANOVA) was used to examine whether a city’s
IT/business governance maturity level (Gov) is a function of its employment size. The
independent variable represented three different city sizes with unequal sample sizes: (a)
small (n = 20); (b) medium (n = 20); and (c) large (n = 8). The dependent variable was

96
the overall Gov results obtained from 48 participants. All analysis used an alpha level of
.05. The test for homogeneity of variance was not significant [Levene F (2, 45) = 0.07, p
> .05] indicating that the underlying assumptions of applying ANOVA were correct.
Figure 12 reveals that there was not a statistically significant difference in results [F(2,
45) = 0.30, p > .05] between governance and all three groups of city sizes which resulted
in a small effective size .01.
Figure 12. Analysis of variance for Gov.
Figure 13 graphically displays the means for the three city size groups as it relates
to governance. The X-axis (FTEsize) represents the three groups (small, medium, and
large). The Y-axis (Gov) represents the mean number of governance. Governance values
are between 1 and 5. In this case, the medium sized LCGAs had the lowest mean score
(2.38) compared to small sized LCGAs (2.58) and large sized LCGAs (2.43).
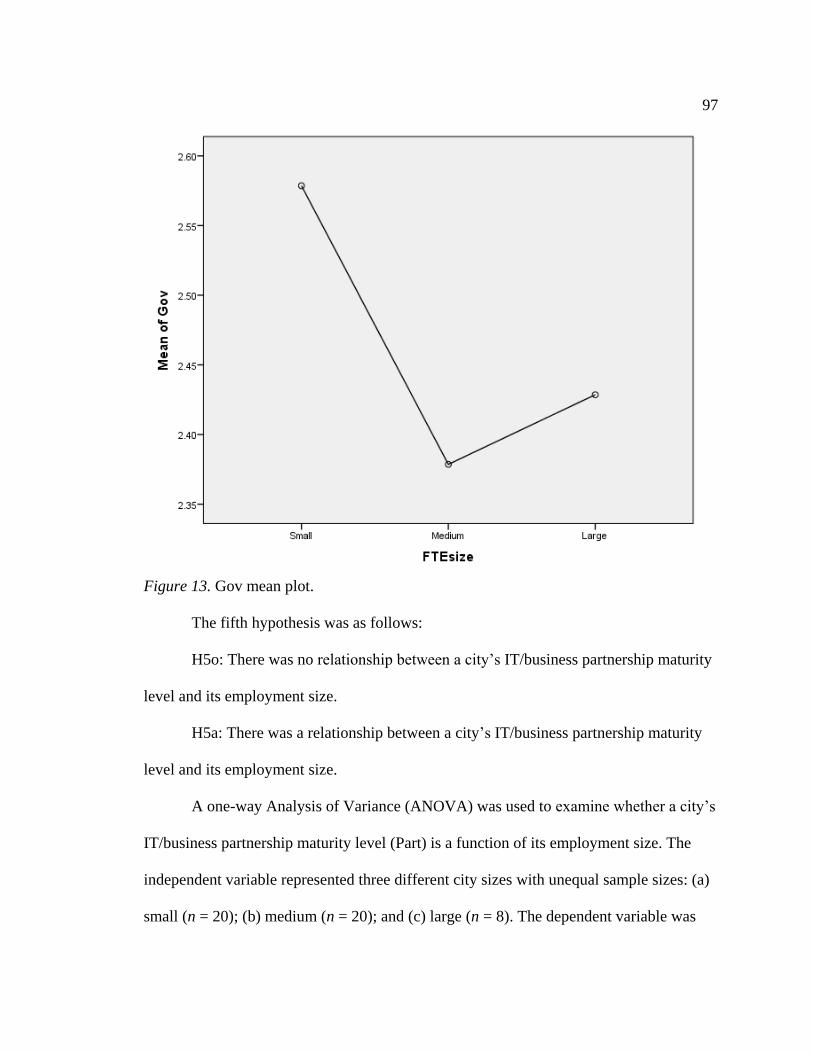
97
Figure 13. Gov mean plot.
The fifth hypothesis was as follows:
H5o: There was no relationship between a city’s IT/business partnership maturity
level and its employment size.
H5a: There was a relationship between a city’s IT/business partnership maturity
level and its employment size.
A one-way Analysis of Variance (ANOVA) was used to examine whether a city’s
IT/business partnership maturity level (Part) is a function of its employment size. The
independent variable represented three different city sizes with unequal sample sizes: (a)
small (n = 20); (b) medium (n = 20); and (c) large (n = 8). The dependent variable was

98
the overall partnership results obtained from 48 participants. All analysis used an alpha
level of .05. The test for homogeneity of variance was not significant [Levene F (2, 45) =
1.94, p > .05] indicating that the underlying assumptions of applying ANOVA were
correct. Figure 14 reveals that there was not a statistically significant difference in results
[F(2, 45) = 0.71, p > .05] between Part and all three groups of city sizes which resulted in
a small effective size of .02.
Figure 14. Analysis of variance for Part.
Figure 15 graphically displays the means for the three city size groups as it relates
to the partnership criteria. The X-axis (FTEsize) represents the three groups (small,
medium, and large). The Y-axis (Skills) represents the mean number of partnership. Part
values are between 1 and 5. In this case, the medium sized LCGAs had the lowest mean
score (2.58) compared to small sized LCGAs (2.77) and large sized LCGAs (2.75).
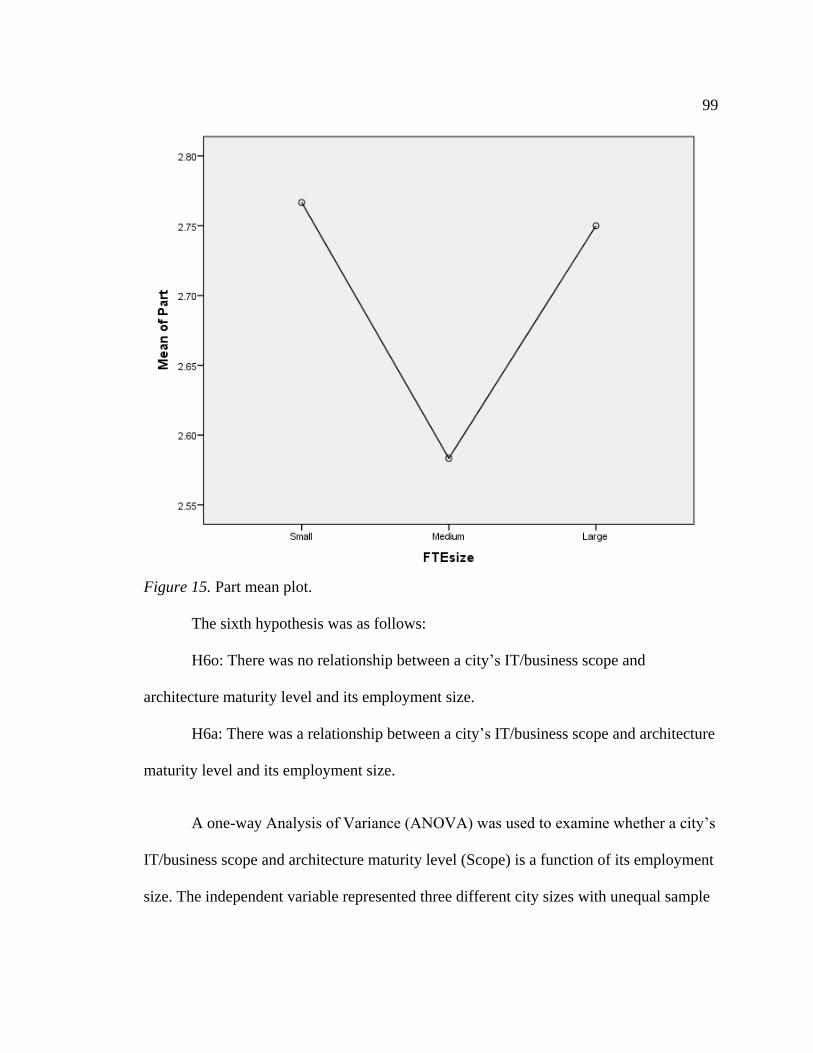
99
Figure 15. Part mean plot.
The sixth hypothesis was as follows:
H6o: There was no relationship between a city’s IT/business scope and
architecture maturity level and its employment size.
H6a: There was a relationship between a city’s IT/business scope and architecture
maturity level and its employment size.
A one-way Analysis of Variance (ANOVA) was used to examine whether a city’s
IT/business scope and architecture maturity level (Scope) is a function of its employment
size. The independent variable represented three different city sizes with unequal sample

100
sizes: (a) small (n = 20); (b) medium (n = 20); and (c) large (n = 8). The dependent
variable was the overall scope and architecture results obtained from 48 participants. All
analysis used an alpha level of .05. The test for homogeneity of variance was not
significant [Levene F (2, 45) = 0.01, p > .05] indicating that the underlying assumptions
of applying ANOVA were correct. Figure 16 reveals that there was not a statistically
significant difference in results [F(2, 45) = 0.86, p > .05] between scope/architecture and
all three groups of city sizes which resulted in a small effective size of .04.
Figure 16. Analysis of variance for Scope.
Figure 17 graphically displays the means for the three city size groups as it relates
to scope and architecture. The X-axis (FTEsize) represents the three groups (small,
medium, and large). The Y-axis (Skills) represents the mean number of scope and
architecture. Scope values are between 1 and 5. In this case, the medium sized LCGAs
had the lowest mean score (2.47) compared to small sized LCGAs (2.55) and large sized
LCGAs (2.70).

101
Figure 17. Scope mean plot.
The final hypothesis was as follows:
H7o: There was no relationship between a city’s IT/business human resource
skills maturity level and its employment size.
H7a: There was a relationship between a city’s IT/business human resource skills
maturity level and its employment size.
A one-way Analysis of Variance (ANOVA) was used to examine whether a city’s
IT/business human resource skills maturity level (Skills) is a function of its employment
size. The independent variable represented three different city sizes with unequal sample
sizes: (a) small (n = 20); (b) medium (n = 20); and (c) large (n = 8). The dependent

102
variable was the overall human resource skills results obtained from 48 participants. All
analysis used an alpha level of .05. The test for homogeneity of variance was not
significant [Levene F (2, 45) = 0.20, p > .05] indicating that the underlying assumptions
of applying ANOVA were correct. Figure 18 reveals that there was not a statistically
significant difference in results [F(2, 45) = 1.04, p > .05] between human resource skills
and all three groups of city sizes which resulted in a small effective size of .04.
Figure 18. Analysis of variance for Skills.
Figure 19 graphically displays the means for the three city size groups as it relates
to human resource skills. The X-axis (FTEsize) represents the three groups (small,
medium, and large). The Y-axis (Skills) represents the mean number of human resource
skills. Skills values are between 1 and 5. In this case, the medium sized LCGAs had the
lowest mean score (2.14) compared to small sized LCGAs (2.33) and large sized LCGAs
(2.52).
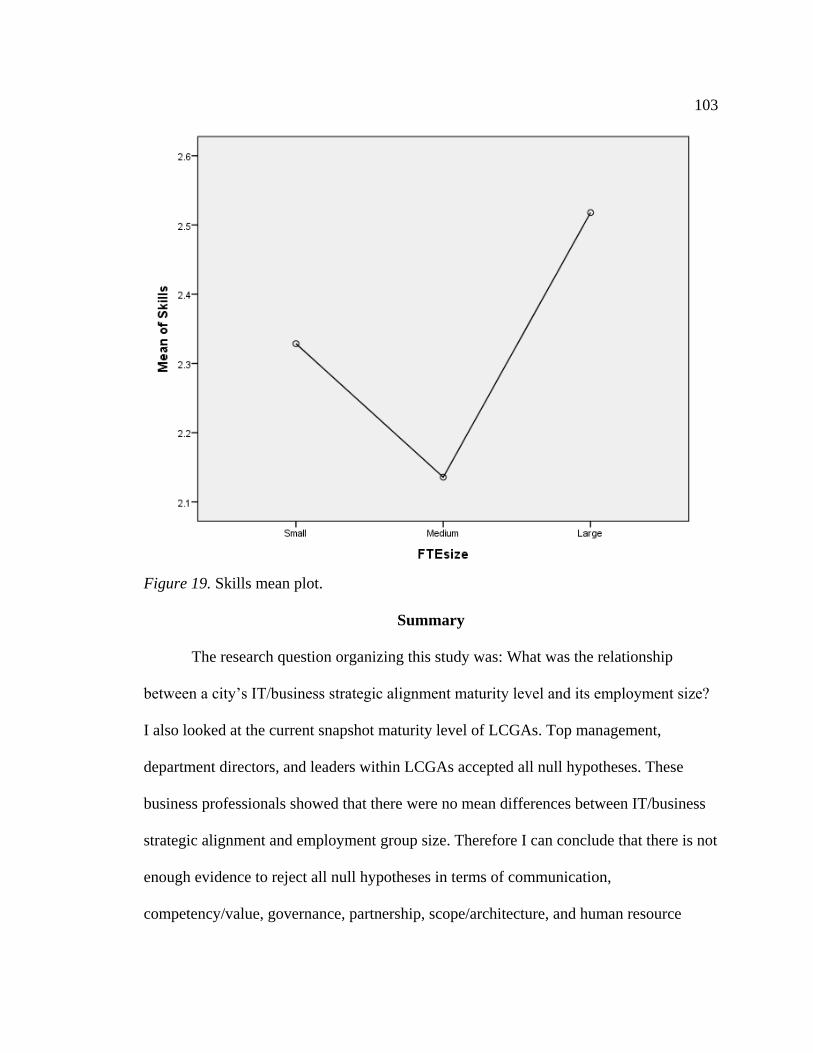
103
Figure 19. Skills mean plot.
Summary
The research question organizing this study was: What was the relationship
between a city’s IT/business strategic alignment maturity level and its employment size?
I also looked at the current snapshot maturity level of LCGAs. Top management,
department directors, and leaders within LCGAs accepted all null hypotheses. These
business professionals showed that there were no mean differences between IT/business
strategic alignment and employment group size. Therefore I can conclude that there is not
enough evidence to reject all null hypotheses in terms of communication,
competency/value, governance, partnership, scope/architecture, and human resource

104
scope as it relates to employment size. These findings, social change implications, and
future research recommendations are discussed further in Chapter 5.

105
Chapter 5: Discussion, Conclusions, and Recommendations
The purpose of this study was to examine the relationship between a city’s
IT/business strategic alignment maturity level and its employment size using top
executive perspectives. This quantitative survey design study relied on a one-way
ANOVA test to analyze the relationship between means differences from 48 completed
surveys. In addressing the question of what was the relationship between a city’s
IT/business strategic alignment maturity level and its employment size, I used a
quantitative approach to examine if there is any statistical relationship between the
independent (FTEsize) and dependent variables (SAMM). I distributed recruitment
emails to 796 randomly selected LCGAs top executive participants and invited them all
to participate in this web-based SurveyMonkey survey. A total of 80 participants
attempted to take this survey of which 60% completed the survey. Only completed
surveys were accepted and analyzed.
The purpose of Chapter 4 was to present and give comments on the statistical
significance of this study. Chapter 5 interprets the findings in Chapter 4 and (a)
summarizes findings, (b) explores interpretation of the findings, (c) discusses limitations,
(d) provides recommendations for LCGAs, (e) discusses significance of this study, (f)
identifies implications for social change, and (g) provides a conclusion. Each of these
sections provides an overall summary of this study.

106
Interpretation of the Findings
Based on the statistical results in Chapter 4, I found that all null hypotheses must
be retained because there was no statistical evidence to reject them. In the test for
homogeneity in each hypothesis, p > .05.
The survey had two main sections: demographic and SAMM assessment
questions. Because this survey was anonymous and confidential, only the job position
and the city size demographics were asked of each participant. Participants were asked to
self-identified as top management (deputy city manager, city manager, council member,
major and the like), department directors (IT director, HR director, and the like), or
Leaders (subject matter expert within the city). Similarly, participants were asked to
identify the size of their city: small (<400), medium (400<1,000), and large (>1,000). The
second section, SAMM, contained Luftman’s 39 questions from his IT/business strategic
alignment maturity model. I categorized these into six different criteria using a 5-point
Likert scale on all of them with 1 = Level 1 – Initial, 2 = Level 2 – Committed, 3 = Level
3 – Established, 4 = Level 4 – Improved/Managed, and 5 = Level 5 – Optimized.
In the literature review, I noted that both Luftman and Chen’s surveys used a
similar approach in gathering both demographic and SAMM information. Following his
strategic alignment measurement, GIMM (2015), Luftman’s survey asked for
demographic information such as the organizational demographics, country, and
company background. Similarly, Chen (2010) asked for functional areas of responsibility,
company type, and the type of industry. Chen’s survey included the demographic
107
information and SAMM questions. A 5-point Likert scale allowed both Luftman and
Chen to assess the significance of IT/business alignment.
To determine the relationship between variables, I designed the research question
to be comprised of one independent variable and seven dependent variables. The
independent variable was the LCGAs full-time employment size (FTEsize). All
dependent variables were based on SAMM (the overall maturity level of LCGAs), Comm
(communication maturity level), Comp (competency and value maturity level), Gov
(governance maturity level), Part (partnership maturity level), Scope (scope and
architecture maturity level), and Skills (human resource skills). I used SurveyMonkey to
collect research data, and SPSS software to compute the data. For each hypothesis, I used
a one-way ANOVA. I generated tables and figures of the results using SPSS.
Conversely, my literature review identified several differences in how researchers
studying IT/business alignment have designed their research questions. Luftman et al.
(2010) used a quantitative survey approach to measure relationship using a partial least
squares method. De Haes and Van Grembergen (2009) took a qualitative approach with
two research questions using exploratory research from secondary data. Khaiata and
Zualkernam (2009) used a quantitative survey approach that sought to improve the
SAMM instrument. Chen (2010) used a quantitative survey approach that included self-
reporting maturity as the dependent variable and SAMM, along with its six criteria, as his
independent variable. I was not able to establish consistency between authors based on
the type of research questions asked.

108
The research question for this study was: What is the relationship between a city’s
IT/business strategic alignment maturity level and its employment size? For each of the
seven hypotheses, I retained all null hypotheses because there was no statistical evidence
to reject them in SAMM, Comm, Comp, Gov, Part, Scope, and Skills. I calculated the
results for each hypothesis using a one-way ANOVA.
Compared to the findings of the studies outlined in the literature review, this
study’s findings were illuminating. Never before had a study of this nature been
conducted on LCGAs. The findings of my study are thus a benchmark and a current
snapshot of LCGAs. All participants of this study are innovators because they were
willing to be the first to take a survey that had never been done before in LCGAs.
Response levels indicate that there are many leaders in LCGAs looking for ways to
improve their organization.
I designed this study to explore the characteristics or roles of ITG and business
strategy and to determine significant mean differences between LCGAs IT/business
strategic maturity level and its employment size. Luftman (2000) designed the SAMM
assessment tool to quickly identify the maturity level of an organization. Based on the
findings of my study, the overall maturity level of LCGAs is 2.5. Small-sized LCGAs
had a maturity level of 2.59, medium-sized LCGAs had a maturity level of 2.34, and
large-sized LCGAS had a maturity level of 2.61. Even though these maturity levels may
appear low, it higher than those of the private sector organizations who have taken this
survey. According to Cobit 4.1 excerpt (2014), the average private sector enterprise
strategic alignment maturity level was Level 2.

109
The study from the Board Briefing (2003) noted that the responsibility of ITG
belongs to top executives. As part of the demographic questions asked in my study, each
participant was asked about their job position. A total of 18 participants were leaders, 15
were department directors, and 15 were top management. One of SAMM’s criteria
measured governance that is the responsibility of the top executives. Small-sized LCGAs
has an overall governance maturity level of 2.58, medium-sized LCGAs has a governance
maturity level of 2.38, and large-sized LCGAs has a governance maturity level of 2.43.
The combined overall governance maturity level for LCGAs was 2.46. These results
show that top executives feel that there is room for governance improvements.
Clearly, there was no statistical significant found between the SAMM and the
FTE size. Even though the results were not statistically significance, the Luftman’s
assessment tool provided a baseline and current snapshots of the maturity levels of
LCGAs. The maturity levels I found link back to the fundamental theories of this study.
My findings show that medium-sized cities ranked the lowest in all the maturity areas
measured. Both small and large cities had similar maturity levels. Human resource skills
was the lowest maturity level for small (2.33) agencies. Competency and value maturity
level was the lowest for medium and large-sized agencies (2.05 and 2.25 respectively).
Conversely, I found that small cities are best at communication (2.91), medium cities are
best at both communication (2.58) and partnership (2.58), and large cities are best at
communication (3.21).
These findings are important to LCGAs. A major goal of this study was to
provide LCGAs with information that may help their organization improve misalignment.
110
Misalignment can cause problems in IT/business strategic planning, budgeting,
investment decisions, prioritization, and support. Knowing potential weaknesses and
strengths will help LCGAs to target specific areas to improve. The assessment conducted
this study provides LCGAs with a current snapshot of their maturity alignment levels.
Limitations of the Study
There are several limitations that may have had an influence on the results of this
study. One possible reasons why the null hypotheses were rejected could have been
because of the power level. A larger sample size would have changed the statistical
significance. I calculated that if all remained the same, three times as many participants
would have produced a significance, p < .05. Future researchers should attempt to assess
a bigger sample size (N = 150+).
Another limitation of this study was the small area of ITG that this study covered.
Luftman et al. (2010) addressed governance in terms of the allocation of decision rights.
Reduction cost, quality improvements, best practices, continuous improvement,
scalability, process improvements, quality customer service, marketing, and change
management are all strategies of ITG not covered in this study. Due to the limitations of
this study, these areas were not addressed.
Additionally, meeting potential participants could have increased the sample size
and engender more enthusiasm to take the survey. Each participant only received emails,
and they responded to the survey without any face-to-face interaction. Allocating time to
take this survey was also a big concern knowing that potential participants in LCGAs are

111
operating with fewer resources, time, and money. Despite all these limitations, this study
provided results that could be used for future studies and in LCGAs.
Recommendations
The results of this study depicted areas in which one can expect better alignment
between ITG and business strategy alignment. Organizations today are looking for
tangible proof that they are receiving IT value on their investments. The review of the
literature shows that ITG is becoming valuable in organizations today in terms of
performance measures, management, reporting, investments, alignment, and executive
discussion points (Magnusson and Bygstad, 2013). Even though the results show that
there were no statistical significance between the three group sizes and SAMM, there was
value in assessing the current snapshot of LCGAs. The assessment results provide a
snapshot of the maturity level of small, medium, and large LCGAs.
It recommended that small, medium, and large LCGAs work at attaining maturity
Level 3. Except for large LCGAs communication maturity level, all other maturity levels
were below Level 3. According to Luftman (2000), there are six main transition points to
transition from maturity Level 2 to Maturity Level 3.
Therefore, Figure 19 displays the current maturity level of LCGAs along with
Luftman’s (2000) easy steps to improve by one level. Luftman (2000) noted that
improvement is incremental. To move from maturity Level 2.5 to 3.0, LCGAs must
improve in several ways:
1. Comm: Each LCGAs will need to move from a limited business IT
understanding to a good understanding, relaxed communication emerging

112
2. Comp: Each LCGAs will need to move from measuring functional cost
efficiency to measuring some cost effectiveness, dashboard established
3. Gov: Each LCGAs will need to move from tactical at the functional level,
occasionally responsive to relevant processes across the organization
4. Part: Each LCGAs will need to move from IT emerging as an asset, process
enabler, to IT is as an asset, process driver, and conflict seen as creative
5. Scope: Each LCGAs will need to move from being transactional to integrated
across the organization
6. Skills: Each LCGAs will need to move from differing across the functional
organization to an emerging value service provider balanced technical and
business hiring
Figure 20. SAMM maturity level adjustment.

113
This study only covered a few areas that related to ITG and business strategy.
Future study must focus externally and operationally on ITG as it relates to business
strategy in areas such as customer relationship, supplier management, data protection,
outsourcing, and privacy. Similarly, other studies should focus on specific alignment
areas in external strategic state/federal policies such as HIPPA compliance, SOX
compliance, ISO 9000 compliance, or the Patriot Act compliance. Internally, future
research should focus operationally on how ITG relates to business strategy in areas such
as ethics codes, Internet policies, information assurance, and quality assessment/testing.
Lastly, other studies should focus internally and strategically on areas such as audit
controls, benchmarking, and strategic alignment. There are many opportunities available
to build upon research on ITG and business strategies.
Implication of Social Change
Implications of positive social change may be assessed by evaluating the present
state of individual and collaborative LCGAs. Because of limited resources, time, and
money, proper governance of IT is being required by customers, stakeholders, investors,
and state/federal governing bodies. Similarly, considering the relationship internally
between the effectiveness of ITG and business strategy has significant implications of
positive social change because key positions within an organization such as the mayor,
council members, city managers, CIOs, CFOs, and the like are held responsible for the
investments made by an IT department.
I examined the relationship between a city’s IT/business strategic alignment
maturity level and its employment size. The results of the research question showed that

114
no statistically significant relationship exists between SAMM and the size of a city.
Additionally, the results showed a snapshot maturity level as it relates to SAMM and
ITG. These results offer evidence that inform LCGAs how well a similar FTEsize city
agency is currently performing. This study provides positive social change in LCGAs
because it provides data that never existed before.
The findings of this study show the need for more ITG discussions and strategic
business alignment. There is a need for further studies. The current state of ITG and
business strategic alignment in LCGAs is at a maturity Level of 2.5. There may be a need
to cover external requirements and more internal requirements. Decision makers within
LCGAs should use this study as a guide in addressing the need for better defined ITG and
business strategy measures. To achieve the effectiveness of ITG in such areas as
expanding market niche, managing workflow talent, reducing operational cost, and
providing flexible staffing proper measures must be in place to evaluate these results.
These findings of this study show decision makers areas in which they can make
improvements.
Conclusion
Many top executives have accepted ITG as a method to govern IT in terms of
setting rules, providing direction, and developing policies to be the right direction moving
forward. According to the Global Status Report (2011), 94% in 2010, 93% in 2008, 87%
in 2006, and 91% in 2004 of all respondents thought that ITG helps with the delivery of
the overall business strategy. I identified tangible variables that relates to the relationship
between a city’s IT/business strategic alignment maturity level and its employment size.

115
The results of this study revealed several tangible variables that did not reveal a
statistically significance between ITG and business strategy alignment. However, this
study was able to assess the current state of LCGAs and provide a snapshot of the current
environment. According to the Global Status Report (2011), only 8.5% of 834
respondents think that ITG activity is driven by complying with industry and
governmental regulations. Managing cost and alignment with current business needs
represent 58% that drives ITG activities (Global Status Report, 2011). Top executives
should ensure the use of ITG to align itself with business strategies in the way it sets
rules, provide direction and develop policies. It is the top executives’ duty to make sure
that ITG is not only implemented but aim to reach a maximum maturity, Level 5. Further
research must be done to understand how ITG aligns with business strategy. This study
provides a good initial basis to expand upon this research.
116
References
Abels, M. (2014). Strategic alignment for the new normal collaboration, sustainability,
and deliberation in local government across boundaries. State and Local
Government Review, 46(3), 11-218. doi:10.1177/0160323X14551179
Abu-Musa, A. (2009). Exploring the importance and implementation of COBIT
processes in Saudi organizations: An empirical study. Information Management &
Computer Security, 17(2), 73-95. doi:10.1108/09685220910963974
Alcott, L. (2008). IT governance maturity and context (ECAR Research Study 5).
Retrieved from the Educause Center for Applied Research website: http://net
.educause.edu/ir/library/pdf/ers0805/rs/ers08053.pdf
Ali, S., & Green, P. (2012). Effective information technology (IT) governance
mechanisms: An IT outsourcing perspective. Information Systems Frontiers,
14(2), 179-193. doi:10.1007/s10796-009-9183-y
Allen, B., & Boynton, A. (1991). Information architecture: In search of efficient
flexibility. MIS Quarterly, 15(4), 435-445. doi:10.2307/249447
Alsudiri, T., Al-Karaghouli, W., & Eldabi, T. (2013). Alignment of large project
management process to business strategy: A review and conceptual framework.
Journal of Enterprise Information Management, 26(5), 596-615. doi:10.1108
/JEIM-07-2013-0050
Avison, D., Jones, J., Powell, P., & Wilson, D. (2002). Using and validating the strategic
alignment model. Journal of Strategic Information Systems, 13(2004), 223-246.
doi:10.1016/j.jsis.2004.08.002
117
Bargeron, L. L., Lehn, K. M., & Zutter, C. J. (2010). Sarbanes-Oxley and corporate risk-
taking. Journal of Accounting and Economics, 49(1), 34-52. doi:10.1016/j
.jacceco.2009.05.001
Bart, C., & Turel, O. (2010). IT and the board of directors: An empirical investigation
into the "governance questions" Canadian board members ask about IT. Journal
of Information Systems, 24(2), 147-172. doi:10.2308/jis.2010.24.2.147
Bemroider, E., & Ivanov, M. (2011). IT project management control and the control
objectives for IT and related technology (COBIT) framework. International
Journal of Project Management, 29(2011), 325-336. doi:10.1016/j-ijproman
.2010.03.002
Bin-Abbas, H., & Bakry, S. H. (2014). Assessment of IT governance in organizations: A
simple integrated approach. Computers in Human Behavior, 32(2014), 261-267.
doi:10.1016/j.chb.2013.12.019
Brochet, F. (2010). Information content of insider trades before and after the Sarbanes-
Oxley Act. The Accounting Review, 85(2), 419-446. doi:10.2308/accr.2010
.85.2.419
Brown, C. (1997). Examining the emergence of hybrid IS governance solutions:
Evidence from a single case site. Information Systems Research, 8(1), 69-94.
doi:10.1287/isre.8.1.69
Casadesus-Masanell, R., & Ricart, J. E. (2010). From strategy to business models and
onto tactics. Long Range Planning, 43(2), 195-215. doi:10.1016/j.Irp.2010.01.004
Cenus Burea. (2014). Annual Questionnaire of Public Employment & Payroll Summary
118
Report: 2013. Retrieved from the census website:
http://www2.census.gov/govs/apes/2013_summary_report.pdf
Chan, Y., & Reich, B. (2007). IT alignment: What have we learned? Journal of
Information Technology, 2007(22), 297-315. doi:10.1057/palgrave.jit.200109
Chen, L. (2010). Business–IT alignment maturity of companies in China. Information &
management, 47(1), 9-16. doi:10.1016/j.im.2009.09.003
Cohen, J., Krishnamoorthy, G., & Wright, A. (2010). Corporate governance in the post‐
Sarbanes‐Oxley era: Auditors’ experiences. Contemporary Accounting Research,
27(3), 751-786. doi:10.1111/j.1911-3846.2010.01026.x
Collins, D., Masli, A., Reitenga, A. L., & Sanchez, J. M. (2009). Earnings restatements,
the Sarbanes-Oxley Act, and the disciplining of chief financial officers. Journal of
Accounting, Auditing & Finance, 24(1), 1-34. doi:10.1177/0148558X0902400103
Croteau, A. M., & Bergeron, F. (2001). An information technology trilogy: Business
strategy, technological deployment and organizational performance. The Journal
of Strategic Information Systems, 10(2), 77-99. doi:10.1016/S0963-
8687(01)00044-0
Daniel, D. R. (1961). Management information crisis. Harvard Business Review, 39(5),
111-121. Retrieved from http://hbr.org
De Haes, S., & Van Grembergen, W. (2009). An exploratory study into IT governance
implementations and its impact on business/IT alignment. Information Systems
Management, 26(2), 123-137. doi:10.1080/10580530902794786
De Haes, S., & Van Grembergen, W. (2010). Analysing the impact of enterprise
119
governance of IT practices on business performance. International Journal of
IT/Business Alignment and Governance (IJITBAG), 1(1), 14-38.
doi:10.4018/ijitbag.20100101
de Souza Bermejo, P. H., & Tonelli, A. O. (2011, January). Planning and Implementing
IT Governance in Brazilian Public Organizations. In System Sciences (HICSS),
2011 44th Hawaii International Conference on (pp. 1-10). IEEE.
doi:10.1109/HICSS.2011.343
De Vasconcellos, E. S., Sousa, J. A., & Hambrick, D. C. (1989). Key success factors:
Test of a general theory in the mature industrial‐product sector. Strategic
Management Journal, 10(4), 367-382. doi:10.1002/smj.4250100406
Debreceny, R., & Gray, G. (2013). IT governance and process maturity: A multinational
field study. Journal of Information Systems, 27(1), 157-188. doi:10.2308/isys-
50418
Diebold, J. (1965). What's ahead in information technology? Harvard Business Review,
43(5), 76-82. Retrieved from http://hbr.org
Dixon, P., & John, D. (1989). Technology issues facing corporate management in the
1990s’. MIS Quarterly, 13(3), 247-255. doi:10.2307/248998
Duhamel, F., Gutierrez-Martinez, I., Picazo-Vela, S., & Luna-Reyes, L. (2014). IT
outsourcing in the public sector: A conceptual model. Transforming Government:
People, Process and Policy, 8(1), 8-27. doi:10.1108/TG-05-2013-0012
El-Mekawy, M., Rusu, L., & Perjons, E. (2015). An evaluation framework for comparing
business-IT alignment models: a tool for supporting collaborative learning in
120
organizations. Computers in Human Behavior, 51(2015), 1-19.
doi:10.1016/j.chb.2014.12.016
Frankfort-Nachmias, C., & Nachmias, D. (2008). Research methods in the social sciences
(7th ed.). New York, NY: Worth Publishers.
Galup, S. D., Dattero, R., Quan, J. J., & Conger, S. (2009). An overview of IT service
management. Communications of the ACM, 52(5), 124-127.
doi:10.1145/1506409.1506439
GIIM strategic alignment measurement. (2015). GIIM. Retrieved from
https://www.surveymonkey.com/r/?sm=OESQnK%2BZVbSxDzcGfJMicA%3D
%3D
Global status report on the governance of enterprise IT (GEIT) - 2011. (2011). ISACA.
Retrieved from http://www.isaca.org/Knowledge-
Center/Research/ResearchDeliverables/Pages/ITGI-Global-Questionnaire-
Results.aspx
Green, S., & Salkind, N. (2011). Using SPSS for Windows and Macintosh: analyzing and
understanding data. (6th ed.) Upper Saddle River, NJ: Pearson Merrill Prentice
Hall.
Hall, M., Kutsch, E., & Partington, D. (2012). Removing the culture and managerial
barriers in project-to-project learning: a case from the UK public sector. Public
Administration, 90(3), 664-684. doi:10.1111/j.1467-9299.2011.01980.x
Hoekstra, A., & Conradie, N. (2002). PricewaterhouseCoopers. Retrieved from
https://www.cccure.org/Documents/COBIT/COBIT_ITIL_and_BS7799.pdf
121
Hoitash, R., Hoitash, U., & Johnstone, K. M. (2012). Internal Control Material
Weaknesses and CFO Compensation* Internal Control Material Weaknesses and
CFO Compensation. Contemporary Accounting Research, 29(3), 768-803.
doi:10.1111/j.1911-3846.2011.01122.x
Hong, K. S., Chi, Y. P., Chao, L. R., & Tang, J. H. (2003). An integrated system theory
of information security management. Information Management & Computer
Security, 11(5), 243-248. doi:10.1108/09685220310500153
Hong, K. S., Chi, Y. P., Chao, L. R., & Tang, J. H. (2003). An integrated system theory
of information security management. Information Management & Computer
Security, 11(5), 243-248. doi:10.1108/09685220310500153
Huang, R., Zmud, R. W., & Price, R. L. (2010). Influencing the effectiveness of IT
governance practices through steering committees and communication policies.
European Journal of Information Systems, 19(3), 288-302.
doi:10.1057/ejis.2010.16
Iden, J., & Eikebrokk, T. R. (2014). Using the ITIL process reference model for realizing
IT Governance: An empirical investigation. Information Systems Management,
31(1), 37-58. doi:10.1080/10580530.2014.854089
Information Systems Audit and Control Association. (2014). CobiT 4.1. Retrieved from
the ISACA website: http://www.isaca.org/Knowledge-
Center/cobit/Documents/COBIT4.pdf
IT Governance Institute. (2004). Board briefing on IT governance (2nd ed). Retrieved
from the ISACA website: http://www.isaca.org/restricted/Documents/26904

122
_Board_Briefing_final.pdf
IT Governance Institute. (2011). An executive view of IT governance. Retrieved from the
ISACA website: http://www.isaca.org /Knowledge-Center/Research/Documents
/An-Executive-View-of-IT-Governance-Research_res_Eng_0109.pdf
ITIL Continual Service Improvement. (2011). ITIL. Norwich, England: The Stationery
Office.
ITIL Service Strategy. (2011). ITIL. Norwich, England: The Stationery Office.
Jacobson, D. D. (2009, January). Revisiting IT governance in the light of institutional
theory. In System Sciences, 2009. HICSS'09. 42nd Hawaii International
Conference on (pp. 1-9). IEEE. doi:10.1109/HICSS.2009.374
Jairak, K., & Praneetpolgrang, P. (2013). Applying IT governance balanced scorecard
and importance-performance analysis for providing IT governance strategy in
university. Information Management & Computer Security, 21(4), 228-249.
doi:10.1108/IMCS-08-2012-0036
Janssen, M., & Schrenker, R. (2011). Guidelines from 80001: Maintaining a medical IT
network. Biomedical Instrumentation & Technology, 45(4), 295-299.
doi:10.2345/0899-8205-45.4.295
Kabachinski, J. (2011). Have you heard of ITIL? It's time you did. Biomedical
Instrumentation & Technology, 45(1), 59-62. doi:10.2345/0899-8205-45.1.59
Kaufmann, D., Kraay, A., & Mastruzzi, M. (2011). The worldwide governance
indicators: Methodology and analytical issues. Hague Journal of The Rule Of
Law, 3(2), 220-246. doi:10.1017/S1876404511200046

123
Kerr, D., & Murthy, U. (2013). The importance of the Cobit framework IT processes for
effective internal control over financial reporting in organizations: An
international questionnaire. Information & Management, 50(2013), 590-597.
doi:10.1016/j.im.2013.07.012
Khaiata, M., & Zualkernan, I. (2009). A simple instrument to measure IT-Business
alignment maturity. Information Systems Management, 26(2), 138-152.
doi:10.1080/10580530902797524
Khatri, V., & Brown, C. V. (2010). Designing data governance. Communications of the
ACM, 53(1), 148-152. doi:10.1145/1629175.1629210
King, J. (1983). Centralized versus decentralized computing: Organizational
considerations and management options. Computing Questionnaires, 15(4), 319-
349. doi:10.1145/289.290
Kooper, M. N., Maes, R., & Lindgreen, E. E. O. (2011). On the governance of
information: Introducing a new concept of governance to support the management
of information. International Journal of Information Management, 31(3), 195-
200. doi:10.1016/j.ijinfomgt.2010.05.009
Kryzanowski, L., & Zhang, Y. (2013). Financial restatements and Sarbanes-Oxley:
Impact on Canadian firm governance and management turnover. Journal of
Corporate Finance, 21(2013), 87-105. doi:10.1016/j.jcorpfin.2013.01.007
Kuhn Jr, J. R., Ahuja, M., & Mueller, J. (2013). An examination of the relationship of IT
control weakness to company financial performance and health. International
Journal of Accounting and Information Management, 21(3), 227-240.

124
doi:10.1108/IJAIM-12-2011-0042
Langbein, L. (2006). Public program evaluation: A statistical guide. Armonk, NY: M.E.
Sharpe.
Leedy, P., & Ormrod, J. (2005). Practical research: Planning and design (8th ed.).
Upper Saddle River, NJ: Pearson Merrill Prentice Hall.
Li, C., Peters, G. F., Richardson, V. J., & Watson, M. W. (2012). The consequences of
information technology control weaknesses on management information systems:
The case of Sarbanes-Oxley internal control reports. MIS Quarterly, 36(1), 179-
204. doi:10.1145/1216218.1216224
Luftman, J. (1996). Competing in the information age: Strategic alignment in practice.
New York, NY: Oxford University Press.
Luftman, J. (2000). Addressing business-IT alignment maturity. Communications of AIS,
4(14), 1-50. Retrieved from http://aisel.aisnet.org/cais/
Luftman, J. (2004). Managing the information technology resources. Upper Saddle
River, NJ: Pearson Prentice Hall.
Luftman, J. (2010). Business/IT-alignment: it’s all about people! Retrieved from
https://businessitalignment.wordpress.com/2010/12/22/strategic-alignment-
maturity-model-luftman/
Luftman, J., Ben-Zvi, T., Dwivedi, R., & Rigoni, E. (2010). IT governance: an alignment
maturity perspective. International Journal on IT/Business Alignment and
Governance, 1(2), 13-25. doi:10.4018/jitbag.2010040102
Magnusson, J., & Bygstad, B. (2013). Why I act differently: Studying patterns of

125
legitimation among CIOs through motive talk. Information Technology & People,
26(3), 265-282. doi:10.1108/ITP-10-2012-0117
Markovic, V., & Maksimovic, R. (2012). A contribution to continual software service
improvement based on the six-step service improvement method. International
Journal of Software Engineering and Knowledge Engineering, 22(04), 549-569.
doi:10.1142/S0218194012500143
Martin, L. L., Levey, R., & Cawley, J. (2012). The “new normal” for local government.
State and Local Government Review, 44(1 Suppl), 17S-28S.
doi:10.1177/0160323X12440103
Meyer, N. D. (2004). Systemic is governance: An introduction. Information Systems
Management, 21(4), 23-34. doi:10.1201/1078/44705.21.4.20040901/84184.3
Millar, J. A., & Bowen, B. W. (2011). Small and large firm regulatory costs: The case of
the Sarbanes-Oxley Act. Corporate Governance, 11(2), 161-170.
doi:10.1108/14720701111121038
Miller, D. (2006). Strategic human resource management in department stores: An
historical perspective. Journal of Retailing and Consumer Services, 13(2006), 99-
109. doi:10.1016/j.jretconser.2005.08.012
Mohamed, N. (2012). A conceptual framework for information technology governance
effectiveness in private organizations. Information Management & Computer
Security, 20(2), 88-106. doi:10.1108/09685221211235616
Moore, T. (2007). Competent to rule: Qualifications of church leadership. Retrieved from
http://www.breakpoint.org/features-columns/archive/1289-competent-to-rule
126
Myers, B. (1998). A brief history of human-computer interaction technology.
Interactions, 5(2), 44-54. doi:10.1145/274430.274436
Newman, I. (1998). Qualitative-quantitative research methodology: Exploring the
interactive continuum. Carbondale, IL: Southern Illinois University Press.
Norton, D. W., & Pine II, B. J. (2013). Using the customer journey to road test and refine
the business model. Strategy & Leadership, 41(2), 12-17.
doi:10.1108/10878571311318196
Palczewska, A., Fu, X., Trundle, P., Yang, L., Neagu, D., Ridley, M., & Travis, K.
(2013). Towards model governance in predictive toxicology. International
Journal of Information Management. 33(3), 567-582.
doi:10.1016/j.ijinfomgt.2013.02.005
Pena, I., & Villasalero, M. (2010). Business strategy, human resource systems, and
organizational performance in the Spanish banking industry. The International
Journal of Human Resource Management, 21(15), 2864-2888.
doi:10.1080/09585192.2010.528670
Raghupathi, W. (2007). Corporate governance of IT: A framework for development.
Communications of the ACM, 50(8), 94-99. doi:10.1145/1278201.1278212
Reddick, C. (2011). Information technology and emergency management: Preparedness
and planning in U.S. states. Disasters, 35(1), 45-61.
doi:10.1111/j.0361.2010.01192.x
Rhodes, R. A. W. (1996). The new governance: Governing without government. Political
Studies, 44(4), 652-667. doi:10.1111/j.1467-9248.1996.tb01747.x

127
Robinson, N. (2005). IT excellence starts with governance. Journal of Investment
Compliance, 6(3), 45-49. doi:10.1108/15285810510659310
Röglinger, M., Pöppelbuß, J., & Becker, J. (2012). Maturity models in business process
management. Business Process Management Journal, 18(2), 328-346.
doi:10.1108/14637151211225225
Rosacker, K., & Rosacker R. (2010). Information technology project management within
public sector organizations. Journal of Enterprise Information Management,
23(5), 587-594. doi:10.1108/1741039101083047
Schwartz, K. (2007). CIO. Retrieved from
http://www.cio.com/article/111700/IT_Governance_Definition_and_Solutions
Schwarz, A., & Hirschheim, R. (2003). An extended platform logic perspective of IT
governance: Managing perceptions and activities of IT. Journal of Strategic
Information Systems, 12(2003), 129-166. doi:10.1016/S0963-8687(03)00021-0
Shapiro, E., & Benenson, Y. (2006). Bringing DNA computers to life. Scientific
American, 294(5), 44-51. doi:10.1038/scientificamerican0506-44
Shavarini, S. K., Salimian, H., Nazemi, J., & Alborzi, M. (2013). Operations strategy and
business strategy alignment model (case of Iranian industries). International
Journal of Operations & Production Management, 33(9), 1108-1130.
doi:10.1108/IJOPM-12-2011-0467
Shleifer, A., & Vishny, R. W. (1997). A questionnaire of corporate governance. The
Journal of Finance, 52(2), 737-783. doi:10.1111/j.1540-6261.1997.tb04820.x
Simonsson, M., Johnson, P., & Ekstedt, M. (2010). The effect of IT governance maturity
128
of IT governance performance. Information Systems Management, 27(1), 10-24.
doi:10.1080/10580530903455106
Slater, S. F., Olson, E. M., & Finnegan, C. (2011). Business strategy, marketing
organization culture, and performance. Marketing Letters, 22(3), 227-242.
doi:10.1007/s11002-010-9122-1
Sledgianowski, D., Luftman, J. N., & Reilly, R. R. (2006). Development and validation
of an instrument to measure maturity of IT business strategic alignment
mechanisms. Innovative Technologies for Information Resources Management,
19(3), 18-33. doi:10.4018/irmj.2006070102
Tiwana, A., Konsynski, B., & Venkatraman, N. (2013). Special issue: information
technology and organizational governance: The IT governance cube. Journal of
Management Information Systems, 30(3), 7-12. doi:10.2753/MIS0742-
1222300301
Tsai, W. H., Hwang, E. T., Chang, J. C., & Lin, S. J. (2011). The Relationship between
team risk factors and IT Governance under ERP environment. International
Journal of Business and Management, 6(11), 21-26. doi:10.5539/ijbm.v6n11p21
Van de Ven, A. (2007). Engaged scholarship: A guide for organizational and social
research. Oxford, NY: Oxford University Press.
Van Grembergen, W., & De Haes, S. (2010). A research journey into enterprise
governance of IT, business/IT alignment and value creation. International Journal
on IT/Business Alignment on Government, 1(1), 1-13.
doi:10.4018/jitbag.2010120401
129
Weill, P., & Ross, J. (2004). IT governance: How top performers manage IT decision
rights for superior results. Watertown, MA: Harvard Business School Press.
Wong, T., Ngan, S., Chan, F., & Chong, A. (2012). A two-stage analysis of the
influences of employee alignment on effecting business-IT alignment. Decision
Support Systems, 53(2012), 490-498. doi:10.1016/j.dss.2012.03.008
Zmud, R. (1984). Design alternatives for organizing information systems activities. MIS
Quarterly, 8(2), 79-93. doi:10.2307/249345
130
Appendix A: Consent Forms

131
Letter of Permission
Dr. Jerry Luftman
Global Institute for IT Management
Professor & Managing Director
1530 Palisade Ave, Suite 15L Fort Lee, New Jersey 07024 Email: [email protected] Office: 201-787-9509 Skype: jerry.luftman
Web: http://www.globaliim.com/
January 31, 2015
To Walden University:
The purpose of this letter is to grant Leslie D’Anjou permission to use my Strategic Alignment Maturity Model (SAMM) Instrument for the sole purposes of his Dissertation research at Walden University. If you have any questions and/or concerns, please feel free to contact me. Good Luck, Leslie!
Jerry LuftmanPh.D.
Professor & Managing Director Global Institute for IT Management LLC

132
Appendix B: SAMM Survey Questions

133
Questions
Comm1 To what extent does IT understand the organization’s business
environment (e.g., its customers, competitors, processes,
partners/alliances)
Comm2 To what extent do the business organizations understand the IT
environment (e.g., its current and potential capabilities, systems,
services, processes)
Comm3 The following statements pertain to methods (e.g., intranets,
bulletin boards, education, meetings, e-mail) in place to promote
organizational education/learning (e.g., of experiences,
problems, objectives, critical success factors). Organizational
learning occurs primarily through
Comm4 The following question pertains to communications protocol.
The IT and business communication style (e.g., ease of access,

134
familiarity of stakeholders) tends to be
Comm5 The following statements pertain to the extent in which there is
knowledge sharing (intellectual understanding and appreciation
of the problems/opportunities, tasks, roles, objectives, priorities,
goals, direction, etc.) between IT and business
Comm6 The following statements pertain to the role and effectiveness of
IT and business liaisons
Comp1 The following statements pertain to the metrics and processes
used to measure IT’s contribution to the business
Comp2 The following statements pertain to the use of business metrics
to measure contribution to the business
Comp3 The following statements pertain to the use of integrated IT and
business metrics to measure IT’s contribution to the business
Comp4 The following statements pertain to the use of service level
agreements (SLAs)
Comp5 The following statements pertain to benchmarking practices.
Informal practices are such things as informal interviews,
literature searches, company visits, etc., while formal practices
are such things as environmental scanning, data gathering and
analysis, determining best practices, etc.
Comp6 The following statements pertain to the extent of assessment and
review of IT investments
Comp7 The following statements pertain to the extent to which IT-
business continuous improvement practices (e.g., quality circles,
quality reviews) and effectiveness measures are in place
Comp8 The demonstrated contribution that the IT function has made to
the accomplishment of the organization’s strategic goals is
Gov1 The following statements pertain to strategic business planning
with IT participation
Gov2 The following statements pertain to strategic IT planning with
business participation
Gov3 The following statements pertain to IT budgeting. Our IT
function is budgeted as a
Gov4 The following statements pertain to IT investment decisions. Our
IT investment decisions are primarily based on IT’s ability to
Gov5 The following statements pertain to IT steering committee(s)
with senior level IT and business management participation
Gov6 The following statements pertain to how IT projects are
prioritized. Our IT project prioritization process is usually
Gov7 The ability of the IT function to react/respond quickly to the
organization’s changing business needs is
Part1 IT is perceived by the business as
Part2 The following statements pertain to the role of IT in strategic
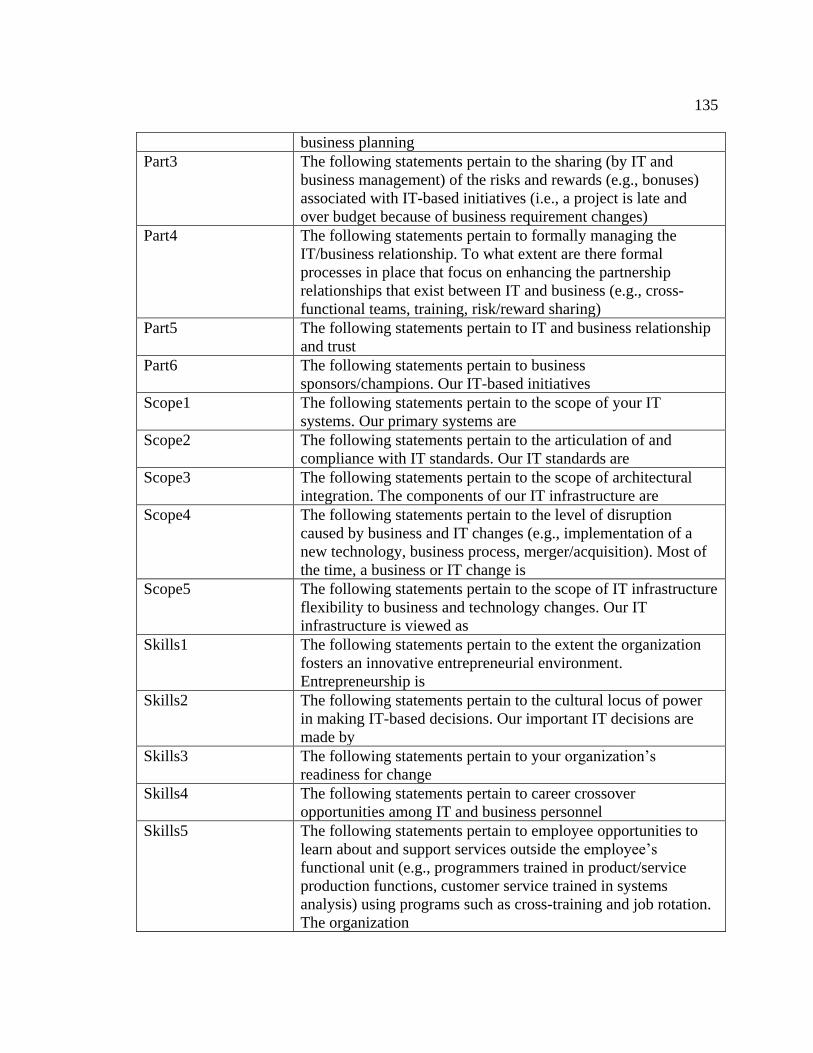
135
business planning
Part3 The following statements pertain to the sharing (by IT and
business management) of the risks and rewards (e.g., bonuses)
associated with IT-based initiatives (i.e., a project is late and
over budget because of business requirement changes)
Part4 The following statements pertain to formally managing the
IT/business relationship. To what extent are there formal
processes in place that focus on enhancing the partnership
relationships that exist between IT and business (e.g., cross-
functional teams, training, risk/reward sharing)
Part5 The following statements pertain to IT and business relationship
and trust
Part6 The following statements pertain to business
sponsors/champions. Our IT-based initiatives
Scope1 The following statements pertain to the scope of your IT
systems. Our primary systems are
Scope2 The following statements pertain to the articulation of and
compliance with IT standards. Our IT standards are
Scope3 The following statements pertain to the scope of architectural
integration. The components of our IT infrastructure are
Scope4 The following statements pertain to the level of disruption
caused by business and IT changes (e.g., implementation of a
new technology, business process, merger/acquisition). Most of
the time, a business or IT change is
Scope5 The following statements pertain to the scope of IT infrastructure
flexibility to business and technology changes. Our IT
infrastructure is viewed as
Skills1 The following statements pertain to the extent the organization
fosters an innovative entrepreneurial environment.
Entrepreneurship is
Skills2 The following statements pertain to the cultural locus of power
in making IT-based decisions. Our important IT decisions are
made by
Skills3 The following statements pertain to your organization’s
readiness for change
Skills4 The following statements pertain to career crossover
opportunities among IT and business personnel
Skills5 The following statements pertain to employee opportunities to
learn about and support services outside the employee’s
functional unit (e.g., programmers trained in product/service
production functions, customer service trained in systems
analysis) using programs such as cross-training and job rotation.
The organization

136
Skills6 The following statements pertain to the interpersonal interaction
(e.g., trust, confidence, cultural, social, and political
environment) that exists across IT and business units in our
organization
Skills7 The following statements pertain to the IT organization’s ability
to attract and retain the best business and technical professionals
There are five maturity levels for each question: Level 1 (no alignment with
business processes), Level 2 (beginning process), Level 3 (establishing process), Level 4
(improved process), and Level 5 (optimal process – complete alignment).

137
Appendix C: Letter of Recruitment
Leslie D’Anjou
Doctoral Candidate
School of Business
Walden University
Hello City Management Professionals,
My name is Leslie D’Anjou. I am an IT Business Analyst for the City of Goodyear and a
Walden University Doctoral student. As part of my Walden University School’s research
project, I am requesting participation from Arizona cities, towns, and individuals to
participate in a survey on IT/Business Alignment in local city government agencies.
This study will be relevant to you in several ways. Private sector organizations have been
using this exact survey worldwide for over 14 years. Similarly, this survey is also
applicable to local cities government agencies in terms of alignment between IT strategy
and the agency’s overall business strategy. As a participant, you will receive aggregate
results from this study. These results will show how well a similar city of your size aligns
and ways to improve alignment.
There are 41 online survey questions, which will take approximately 20 minutes to
complete. We are asking participants to answer all questions based on their best judgment
and perspective. Answering each survey question is valuable even if you may not know
the actual answer. All participation is strictly voluntary. All personal or specific city
information will remain confidential.
The target audience for this survey are City Management (CM Assistant, Deputy CM,
CM, etc…), Department Heads (ITS, Finance, HR, Engineering, Economic Development,
etc…), and Leaders (IT Subject Matter Experts, Supervisors, Managers, etc…).
Participants will provide top management insight into what they perceive as the current
alignment state of their city or town. This survey also targets a good cross section of
cities and towns (small<400, medium 400<1,000, and large>1,000).
This study will show how well IT and business strategies are aligned based on five levels:
Level 1:
Initial/Ad hoc
Level 2:
Committed
Level 3:
Established
Level 4:
Improved
Level 5:
Optimized

138
The goal of this survey is to provide you with information that may help in your
organization improve misalignment. Misalignment can cause problems in IT/business
strategic planning, budgeting, investment decisions, prioritization, and support.
This survey will be available at https://www.surveymonkey.com/r/ITBusAlignment. If
you have any questions or concerns, please contact me.
Thank you in advance for completing the survey and your assistance with this study.
Please feel free to share this survey with others as appropriate and encourage their
participation.
Sincerely,
Leslie M. D’Anjou
Doctoral Candidate
School of Management
Walden University

139
Appendix D: Participant Reminder E-mail
Hello______________________________,
My name is Leslie D’Anjou, and I am a Ph.D. student in the School of
Management at Walden University. I am contacting you again in hopes that you would
participate in this study. I am conducting a study that examines the relationship between a
city’s IT/business strategic alignment and its employment size. This study focusses on the
perception of business and IT professionals (BITPs), you.
There are 41 online survey questions, which will take approximately 20 minutes
to complete. We are asking participants to answer all questions based on your best
judgment and perspective. Answering each survey question is valuable even if you may
not know the actual answer. All participation is strictly voluntary. All personal or specific
city information will remain confidential.
If you are interested in participating in this study, this survey was available at
https://www.surveymonkey.com/r/ITBusAlignment. If you have any questions and
concerns, please contact me. Thank you much for your time and you participation. Have
a great day.
Yours sincerely,
Leslie M. D’Anjou
Doctoral Candidate
School of Management
Walden University

140
Appendix E: SurveyMonkey Acknowledgement Informed Consent Form
Welcome,
You are invited to take part in this research study based on the perception of top
management in local city government agencies (LCGAs). Because you represent City
Management (CM Assistant, Deputy CM, CM, etc…), Department Heads (ITS, Finance,
HR, Engineering, Economic Development, etc…), or Leaders (IT Subject Matter Experts,
Supervisors, Managers, etc…), your perspective is valuable in understanding business
and IT alignment. This consent form allows you the opportunity to become informed of
this study before taking this survey.
Leslie D’Anjou, a Business Analyst for the City of Goodyear led this Walden University
research study.
Justification:
The problem researched in this study is the lack of information regarding IT/business
strategic alignment level in LCGAs. The purpose of this study is to understand the
perspective of top management business and IT professionals (BITPs) in local city
government agencies (LCGAs). The goal is to identify the average alignment level of
LCGAs by size (small <400, medium 400<1,000, large >1,000) to determine their next
steps needed for improvement. This study has implications for positive social change in
LCGAs by identifying maturity levels between IT and the overall business strategy.
Procedures:
· Read and accept the acknowledgment informed consent form before taking this online
survey.
· Voluntarily participate in this online survey.
· Answer and complete all questions within this online survey and only complete one
online survey per participant. This online survey will take approximately 20 minutes of
your time.
Voluntary Nature of this Study:
All participation in this study is voluntary. Your decision to participate is entirely up to
your discretion. No negative feedback was given if you decide not to take this online
survey. Even if you have chosen to take this online survey and then decided that you did
not want to complete it, you can stop. After submission, all completed surveys was used
for this study.

141
Benefits and Risks:
There is no rewards or compensation for taking this survey, but there are benefits for
taking this online survey. It will:
1. Provide top management insight into how IT and the business aligns.
2. Offer knowledge about several maturity measures between IT and the business.
3. Increased knowledge of how to govern IT as it relates to the overall business strategy
in LCGAs.
4. Provide the alignment level based on the size of the LCGAs.
There is no obligation, physical, or emotional risk in taking this online survey. Aggregate
results were provided to all participating cities and towns. Participants can also obtain
aggregate results upon email request.
Payment:
No payment was given for taking this survey.
Privacy:
All information gathered in this online survey will remain confidential. This study will
not identify city names or personal information. It will only identify the size of your
city’s full-time employees and your job position. A memory stick that is password
protected will store and secure electronic data for five years.
Contacts and Questions:
If you have any questions and concerns, please feel free to contact the researcher. If there
is a need to speak privately about your rights as a participant, please contact Dr. Endicott,
Director of the Institutional Review Board. She is the Walden University representative
in which you can contact, [email protected]. Walden University’s approval number for
this study is 08-24-15-0133424, and it expires August 23, 2016.
Statement of Consent:
I have read the information above and feel that I understand this study well enough to
make a voluntary decision. Based on the complete above mentioned information, I
consent by clicking next below, of my accord, to participate in this research study. I am
now ready and willing to take this online survey.

142
You can now print or save this consent form. Please click Next below!