Embed Size (px)
Citation preview

ASQRDWebinarTelematicsDataAnalysis
DennisLCraggs,ConsultantQuality,ReliabilityandAnalyticsServices

Author’sBackground
• FiftyyearsworkexperienceatNASA,TeledyneCAE,FordMotorCompany,andFCAUSA(formerlyChrysler).
• BachelorofMechanicalEngineering,MastersofEngineeringMechanics,andMastersofOperationsResearch.
• PresentedandPublishedatAEC,ISSAT,SAE,andASQAutomotiveExcellenceJournal.
• Written~30articlesonDataAnalysisincludingTelematics,ManufacturingProcessCapability,andStatistics.TheycanbefoundonAccendoreliability.com,ASQAutomotiveExcellence,andLinkedIn.
• Currentlyconsulting,volunteeringasSAEorganizer,anddevelopingaclassfortheSAE.
11/8/18 ASQRDTelematicsWebinar 2

ProductDevelopment
• Requirementsareembeddedin– ProductSpecifications– RequestsforQuotes– VerificationTestPlans
• Commonrequirementscover– Businessfactorsliketiming,cost,…– Productfactors
• Function• Life• QualityandReliability• Otherfactors
11/8/18 ASQRDTelematicsWebinar 3

ProductEngineersNeedValidatedRequirements
• Functions
• Theproductlifeinyears,miles,cycles,…
• Theambientandin-vehicleoperatingenvironments
• QualityandReliabilityTargets
• Determinecustomerlight,typical,heavyusageaspercentiles.
• Provideinformationtosupportthedesignanddevelopmentprocess
11/8/18 ASQRDTelematicsWebinar 4

Howarerequirementsdeveloped?
• Considerthemissionprofile
• Takeasystemsview
• Manyinformationsourcesforrequirements
• Datadrivenapproachfrommonitoredvehicleusage(telematics).
11/8/18 ASQRDTelematicsWebinar 5

MissionProfileNASAExample
11/8/18 ASQRDTelematicsWebinar 6
• Thismissionprofiledefineslaunch,rendezvousanddocking,docked,decent,landingphasesofamission.
• Thedesignthecomponents,subsystems,andtotalsystemtowithstandthestressesandfunctiontosupportthemission.
• Amissionprofiledescribeshowthesystemisexpectedtobeused.
• Brokenintophases• Veryhighlevelview

MissionProfileAnAutomotiveDutyCycleExample
Vehi
cle
Spe
ed
Time
Drivetowork
Drivetolunch
Drivebacktowork
Drivehome
Off OffOffOff OffEngineState On On On On
Foranautomobile,vehicleoperationdefinesthemissionprofileparameters.VehicleUsageData• Countsofstops,trips,miles,days• Runandstoptimedurations• Vehiclespeeddata
AnalysisApproach• Developstandardizationmetrics,i.e.
miles/day,trips/day,miles/trip,…• Determineifdistributionsdescribethe
usagemetrics.• Determinevehicleaverageusageand
percentiles,e.g.,5th,50th,95th.• Projectpercentilestodesigntargets
(years,miles,cycles)11/8/18 ASQRDTelematicsWebinar 7

ASystemDesignProcessAnautomotiveexampleofaP-Diagram
DriverInputs• Pedal/brake• Steeringwheel• Keyon/off• Passenger/cargoloads
Outputs• OperatingTime/Distance• Trips• Vehiclespeeds• Acceleration• Turns• Driver/PassengerComfort• Enginestarts/stops• Hiddenparameters
Noise• Environment(temperature,
humidity,rain,vibration)• RoadandtrafficConditions
DesignControls• DesignTargetsandSpecifications• VerificationTestsandSystem
Modeling
11/8/18 ASQRDTelematicsWebinar 8
Theoutputsarecountableevents,states,andmeasurements.Engineersfocusontheiritemswhichmaybeasystem,subsystem,orcomponent.

MeetingRequirement• Requirementsareembeddedinstandardsandcontract
agreementstoverifyparts,systemsandvehicles.
• Requirementsaredevelopedusingsurveys,priorsimilarproductspecifications,and“Expert”opinion– Requirementsmaybeincompleteorilldefined,especiallyfornewproductortechnologies.
– Managementdirectiontocutcost/shortenproductdevelopmenttimemaycompromisetheprocess.
• Developrequirementsfromfielddata.– Fieldusagechangeswiththeenvironment,customerdemographics,andmarketsegments.
– Example:Canadahasmoreextremecold,theMiddleEastGulfcountrieshavemoreextremeheat.
– Becomecustomeroriented
11/8/18 ASQRDTelematicsWebinar 9

ANewDataSourceTheVehicleCommunicationsBus
11/8/18 ASQRDTelematicsWebinar 10
EngineController
TransmissionController
StabilityController
CustomerInformation
WirelessModule
BodyControlModule AirBagModule
EntertainmentSystem
• ModernAutomobileshavemanyelectronicmodules,basicallycomputers,controllingdifferentfunctions,transmittingandreceivingdata.
• ACAN(ControllerAreaNetwork)allowselectronicmodulestoshareinformationasmessages:o Switchpositions(doorswitchopen/closed)o MultipleStates(transmissiongear;ignitionswitchmodes,PRNDLselector)o Measurements(vehiclespeed,enginespeed,temperatures,pressures,GPS…)o Calculatedparameters(enginetorque)
• CANstandardsmakeiteasytoaddnewmoduleswithnewfunctionality.• Allshareddataareassigneduniquecodes.

Telematics
11/8/18 ASQRDTelematicsWebinar 11
DictionaryDefinition:thebranchofinformationtechnologythatdealswiththelong-distancetransmissionofcomputerizedinformation.
Wikipedia:Telematicsisaninterdisciplinaryfieldthatencompassestelecommunications,vehiculartechnologies,roadtransportation,roadsafety,electricalengineering(sensors,instrumentation,wirelesscommunications,etc.),andcomputerscience(multimedia,Internet,etc.).

VehicleTelematics
• About1000channelreadingsareavailablewhentheCANbusisactive–ignitionkeyoperation,remotestart,vehicleshutdown…
• Includestate,parametric,andlocationvariables.• Thedataarereadevery0.02second(50Hz).• Specialmodulesstorerawtimestampeddatarecords.
– Shortterm:~1minuterollingstackof50Hzrecordsforfaultdiagnostics.
– Longterm:1second(1Hz)datastoredasmemoryallows.• Somemodulescounteventsandmaintainparameterhistograms.• UsingWi-Fiorcellphones,dataistransmittedandstoredinadatabasefor
analysis.
DataStorageWi-Fior
CellPhone
11/8/18 ASQRDTelematicsWebinar 12

Usage
• Currently,aprimaryusageismonitoringvehiclesduringproductdevelopment– TesttrackvehiclesandRoadtestvehicles– Whenfaultsaredetectedonthebus,about±30secondsofthebus
recordsareuploadedtoservers.– Engineersareautomaticallynotifiedandtaskedtodiagnosethefault.
• Ausageistoanalyzeandprojectvehicleusageoverdesignlife.– 10years,15years…– 100,000;150,000;220,000miles…
• Canbeusedforcomparisons– Specialcommercialfleets(police,taxi,delivery,offroad,…)– RetailCustomers(cars,trucks,Minivans,SUVs)– Differentdemographics(US,Canada,China…)
11/8/18 ASQRDTelematicsWebinar 13

DataIssues
• CANdataproblems– Intermittentrecords(1record/secpatternisbroken)– Incompleterecords(missingdataelement)– Dataisunreasonable,outofrange.– Inconsistentchannelcodingacrossvehicletypes(model,engine,
transmission,modelyear)requireatranslationtable.• Files
– Millionsofrecords/vehicle– Gigabytesizevehiclesdatafiles.
• Analysis– Can’tperformtimeseriesanalysis.– Don’twanttointerpolatebetweendatatocreatedata.– Chosetofilteroutofrangedata.– Workwithonlycompleterecordsforthechannelsbeinganalyzed.– Treatedthedataasarandomsampletoapplystatisticalmethods.
11/8/18 ASQRDTelematicsWebinar 14
DataBias
• Oldervehicleswithlargeamountsofdatadominatetheanalysisvs.newvehiclewithsmallamountsofdata.– Asolutionistoweightvehiclesequallybystandardizethemetrics,i.e.,
miles/trip,trips/day,miles/day,percentoftotalusage,…
• Unequalnumbersofvehicles,likeretailsedansvs.policevehicles,canbiasresultbylosingsmallvehiclepopulationsinaverylargesetofvehicles.– Asolutionistofocustheanalysistoparticulartypesofvehicles,i.e.,
policevs.retailvs.taxiforthesamevehiclemodel,engine,etc.
11/8/18 ASQRDTelematicsWebinar 15

TypesofAnalysis
• Thedesiredanalyticsarespecifictotheengineerormanager.
• Theanalyticschangewithtypesofdata– Countingdata(liketripcounts,daysinservice,enginestarts,gear
shifts)– StateData(likethegearbeingused)– Continuousvariables(likevehiclespeed,enginespeed,enginetorque)
• Examples(slidestofollow)
– Distributionanalysisoftotaleventsonavehicle– Singleparametervs.miles,time,cycles…distributionanalysis– ContourPlotsofenginespeedxenginetorque– Pedalpositionstrokeanalysis– MarkovAnalysisofstatechanges
11/8/18 ASQRDTelematicsWebinar 16

Example:TripCounts
• Afleetofvehicleswasmonitoredusingtelematicsdata
• Thetotaltripsforeachvehiclewasdetermined
• Thetotaloperatingdaysforeachvehiclewasknown.
• Therawdatawasplotted.
11/8/18 ASQRDTelematicsWebinar 17

TripCountsvs.DaysInService
11/8/18 ASQRDTelematicsWebinar 18

TripsAnalysis
• Standardizedtotrips/dayforeachvehicle,i.e.,analyzetheslopeofthelinebetweentheoriginandthedata.
• Ratesliketrips/daycanbeprojectedto10years,15years,…
• UsingMinitab,thetrips/daywasanalyzedasNormal,Exponential,Weibull,andLognormaldistributions.TheLognormalprovidedthebestfit.
• Thedistributionwasusedtodeterminethepopulationpercentiles.
• The95thpercentileusagewasprojectedfromtrips/daytotrips/10years.
11/8/18 ASQRDTelematicsWebinar 19
Note:WherethereisaP-thpercentile,P%ofthesampledataisbelowtheP-value.Forexample,50%ofthedataisbelowthe50thpercentilevalue.
Trips/Day–DistributionIDPlot
11/8/18 ASQRDTelematicsWebinar 20
Thedataarethereddots.
Thebluelineisthebestfitforthedistributionusingthedata.
Correlationstatisticsareshownintheupperright.
Inthiscase,thebestfitswereprovidedbyWeibullandLognormal.Lognormalwasselectedbecauseit’scorrelationwashigher.

Trips/Day–LognormalDistribution
Thebestestimateofa95thpercentileis9.441trips/day.Thiswasroundedupto10trips/dayandcascadesfromthevehicletosystems,subsystems,andcomponents.
Thelognormalanalysisofwasrepeated.
Samplepercentileswereadded

TripsPerDayConclusions
• Thecorporatevalidationtargetwas95thpercentileusage.– 9.441trips/daywasroundedupto10.– At10trips/dayx365days/yearx10years=36,500tripsasa
verificationtestforignitionsystemcomponents.
• The10trips/dayisextendedtoothercomponents.– Driverdoorcycles(assume2open/closecyclespertrip)yielding
20x10x365=73,000doorcycles/10years.– Driverseatload/unloadfor36,500cycles.
• Additionaluses– Sometimesproblemsoccurredat5thpercentilecustomerusage.– Themedianvalue(50thpercentile)insteadofaverageforatypical
usage.
11/8/18 ASQRDTelematicsWebinar 22

AnalysisofContinuousVariables
• Continuousvariablesmayhaveallpossiblefractionalvaluesbetweenreasonableoperatinglimits.Forexample,thevehiclespeedvariesfrom0mphtoperhaps120mph.
• Astandardapproachistodisplaythedatawithafrequencyhistogram(countsonthey-axis)andbinsonthex-axis.
• Considerenginespeed.
11/8/18 ASQRDTelematicsWebinar 23

HistogramsforAnalytics
0
500
1,000
1,500
2,000
2,500
3,000
0250
550
850
1300
1900
2500
3100
3700
4300
4900
5500
6250
Freq
uency
EngineSpeed(rpm)
Histogram
0
500
1,000
1,500
2,000
2,500
3,000
0 30
0 60
0 90
0 14
00
2000
26
00
3200
38
00
4400
50
00
5600
65
00
Freq
uenc
y
Engine Speed (rpm)
Multi-Vehicle Histogram
VIN 1 VIN 2
Goodvisualizationforasingledataset,butitisdifficulttodeterminestatisticsorusagepercentiles.
Itisdifficulttomakecomparisonsbetweenmultipledatasets.
11/8/18 ASQRDTelematicsWebinar 24

CumulativeFrequencyPlot
0
500
1,000
1,500
2,000
2,500
3,000
0 30
0 60
0 90
0 14
00
2000
26
00
3200
38
00
4400
50
00
5600
65
00
Freq
uenc
y
Engine Speed (rpm)
Multi-Vehicle Histogram
VIN 1 VIN 2
0
5,000
10,000
15,000
20,000
25,000
0 1000 2000 3000 4000 5000 6000Cu
mulativeFreq
uency
EngineSpeed(rpm)
CumulativeFrequencyHistogram
VIN1 VIN2
11/8/18 ASQRDTelematicsWebinar 25
Thecumulativefrequencyhistogramshowsthesetwovehicleshaddifferentamountsofdata.Somestandardizationfortheamountofdataisneeded.

CumulativeHistograms
• Frequencyhistogramissues.– Analysisresultscanbebiasedtoafewhighusagevehicles.– Percentilesarehardtodetermine.
• Solution– Standardizethey-axisfromfrequencytopercentileusageforeach
plot.– Useapercentilehistogram.
11/8/18 ASQRDTelematicsWebinar 26

Standardization
0%
25%
50%
75%
100%
0 1000 2000 3000 4000 5000 6000
Cum
ulat
ive
Perc
ent
Engine Speeed (rpm)
Cumulative Percent Histogram
VIN 1 VIN 2
Afterstandardizingthedatatopercentoftotalusage,itisclearthatthetwovehicleshadverysimilarenginespeedusagepatterns.
0%
25%
50%
75%
100%
0 100020003000400050006000
CumulativePe
rcen
t
EngineSpeed(rpm)
VehicleEngineSpeeds
Thecumulativeusageplotallowscomparisonsofmanyfleetvehicles.
11/8/18 ASQRDTelematicsWebinar 27
Cumulative(Usage)PercentileHistogram
• Issues– Fleetswillshowover-lapofenginespeedtraces.– Manyfleetvehicleswillproduceunreadableoverlappingtraces.– Difficulttodefinevehiclepopulationpercentileswithheavyorlight
usagepatterns.
• Solution:Foreachvehiclespeed– Determinetheintersectionofthetraceswiththevehiclespeed.– Calculateintersectionpercentiles,i.e.,5th,50th,and95thby
• Ifthesamplesizeissmalllessthan20,useanormaldistributionapproximationtodeterminepercentiles.
• Ifthesamplesizeislarge,thencalculatethemedianranksforeachsampleandinterpolatetodeterminethepercentiles
11/8/18 ASQRDTelematicsWebinar 28

StatisticalComparison
0%
25%
50%
75%
100%
0 1000 2000 3000 4000 5000 6000
CumulativePe
rcen
t
EngineSpeed(rpm)
EngineSpeeds
11/8/18 ASQRDTelematicsWebinar 29
Determinethepercentileswherevehiclespeedtracesintersectthevehiclespeed.
Selectavehiclespeed
Generallythe5th,50th,and95thpopulationpercentilesareused.
Thecumulativeusagepercentilesformapopulation.

FleetPopulationPercentiles
0%
25%
50%
75%
100%
0 1000 2000 3000 4000 5000 6000
CumulativePe
cent
EngineSpeed(rpm)
EngineSpeedNormalDistributionAnalysis
P5 Average P95
11/8/18 ASQRDTelematicsWebinar 30
The5th,95th,andaveragewerejoinedtoformP5,P95,andaveragespeedtraces.
TheP95traceshowstheengineRPMisbelow1800RPMabout92%ofthetime.
TheP5traceshowstheengineRPMisbelow1800RPMabout73%ofthetime.
TheP5tracerepresentshigherenginerpmusage.

ComparisonExample
• Themedianvehiclespeedtracewasusedtocompareapolicewitharetailvehicles.
• Themedianpolicevehiclespeedtracewasextremelydifferentfromaretailcustomervehiclespeedtrace.– 66%idletimevs.16%idletime.
• Acoolingengineerwouldneedthisinformationtodevelopvalidationtests.
11/8/18 ASQRDTelematicsWebinar 31

FleetComparison
0%
25%
50%
75%
100%
0 10 20 30 40 50 60 70 80 90 100
CumulativePe
rcen
tile
VehicleSpeed(mph)
VehicleSpeedComparison-Policevs.SedanRank
Police Sedan
11/8/18 ASQRDTelematicsWebinar 32
Policevehicleusageisverydifferentthanretailsedanusage.
About16%idletimeforretailvehicles.
About66%idletimeforpolicevehicles.

MultipleParameterAnalysis
• Dataformultipleparametersareavailableinthetimestampeddatarecords.
• Example:– EngineSpeedandEngineTorque
• Powertrainengineersliketoviewacontourplot• Process:
– Determinethenumberofrecordsineachspeedxtorqueinterval.– Calculatethepercentoftotalrecordsineachinterval.– Averageacrossthefleet.– Displayasacontourplot.
11/8/18 ASQRDTelematicsWebinar 33

Multi-ParameterAnalysis–ContourPlots
11/8/18 ASQRDTelematicsWebinar 34
• Enginefieldusageismostlylowtorqueandlowspeed.• Dynamometertestingishighlyacceleratedasitis
conductedathighspeedandhightorque.• Datacountsineachtorque–rpmintervalcanbeused
tocalculatecumulativedamageonparts.• Damageforfieldanddynamometertestingcanbe
compared.

DamageAnalysis
• Thisisanopportunitytoperformmanycomponentcumulativedamageanalyses.
• Thecountsoftimetorquexrpmproducesisproducedforeachgear.Thetorqueandrpmarescaledbythegearratiotodeterminewhateachgearexperiences.Whenthegeardesigninformationisadded,thecumulativedamagecanbecalculatedforeachgear.
• Thiscancascadedownthedrivelinethroughthetransmissionandaxle.
• Thisanalysiscanberepeatedforeachvehicle.Theanalysiswouldthenfocusonthedistributionofcumulativedamage.
• Thefieldusagedamagecanbecomparedtodynamometerdamageduringvehicledevelopment.
11/8/18 ASQRDTelematicsWebinar 35

Othertypesofparameteranalysis
• Acceleratorpedalpositionanalysis– MonitorthepedalpositionusingthepedalvoltageontheCANbus.– Thepedalpositiontracecanbebrokenintostrokesections.
• Pressingtheacceleratorpedalprovidesacontinuouslyincreasingvoltagesignal.Thishasalowstartingvoltageandahighendvoltage.Conceptuallythevoltageisrisingfromalocalvalleytoalocalpeak.
• Releasingtheacceleratorpedalprovidesacontinuouslydecreasingvoltagesignal.Now,thereisahighstartingvoltageandalowendvoltage.Conceptually,thevoltageisdescendingfromalocalpeaktoavalley.
– Eachpedalupordownstrokeisusedtoincrementacounterinacelldeterminedbythestartandendvoltage.
• Theresultswereexactlytwicethecyclecountsprovidedbyrain-flowstresscycleanalysis.
11/8/18 ASQRDTelematicsWebinar 36
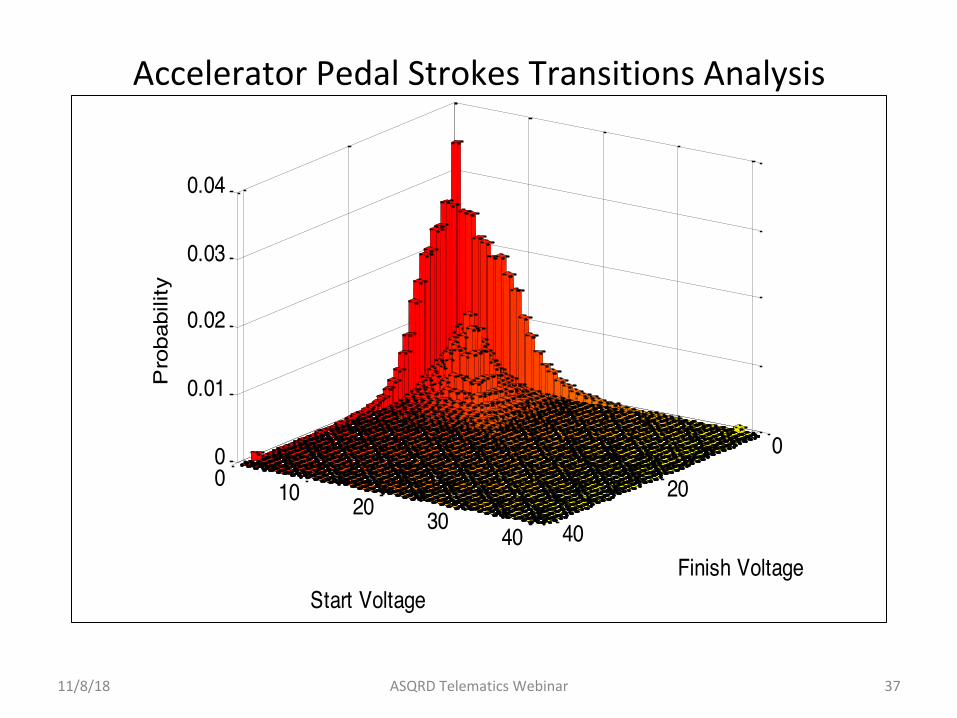
AcceleratorPedalStrokesTransitionsAnalysis
0 10 20 30 40
0
20
40
0
0.01
0.02
0.03
0.04
Finish Voltage
WL Accelerator Pedal Strokes
Start Voltage
Pro
babi
lity
11/8/18 ASQRDTelematicsWebinar 37

TemperatureCycles
• Asimilarapproachwasusedtoanalyzethermalcyclecounts.
• Thisisimportantforelectroniccomponentsthatexperiencefatigueduringthermalcycles.– Electronicsolderjoints,boards,chips
• Importantinformationtodevelopelectronicvalidationtests– Fatiguemodelsfordifferenttypesofdevices.
11/8/18 ASQRDTelematicsWebinar 38

ThermalCycleAnalysis
JamesMcLeish,“AcceleratedLifeTest–SimulationIntegration”,SAEAutomotiveExcellence,Spring,2017.
11/8/18 ASQRDTelematicsWebinar 39

StateChanges
• Somecomponentsarestressedwhenstatechangesoccur.
• Anexampleisatransmissionwhenagearisbeingengaged.
• Thetotalcountsmaybeused,butamorerefinedmethodwouldbetocountgeartransitions.– Adownshiftfromthecruisinggear,saythe8thgeardownto7thisless
stressfulthanthe8thdownto6thor5th,…– TracktheshiftswithaMarkovTable
11/8/18 ASQRDTelematicsWebinar 40

StateTransitionsAnalysis-MarkovStartwithcountsofstatemeasurementsfromstateXtostateY.XandYcanbethesamestate.
ApplicationExample:Transmissiongearusage
11/8/18 ASQRDTelematicsWebinar 41
Dividebythenumberofmeasurementsinarowtodetermineprobabilitiesofchangingorremaininginastate.

Issues
• Gigabytesizevehiclefilescan’tbeheldinmemoryforanalysis.• Datafromtoomanyvehiclestoprocess.• Timeconsumingtoreadandanalyzeafile.
– About1Gigabyte/minuteonalaptop.
11/8/18 ASQRDTelematicsWebinar 42

TheToolMix
• Matlab– Readfilesandextractdata– Performstatisticalanalysis,creategraphicsandsummarytables..
• Minitab– Forsomestatisticalanalysisandgraphics.– OthertoolslikeSAS,JMP,andStatgraphicscanbeused.
• Excel,Word,andPowerPointforsummaryreports.– Providelongtermstorageofanalysisresults
11/8/18 ASQRDTelematicsWebinar 43

Software
• Matlabscriptswerewrittenforalaptoptoperformtheanalysisascommercialsoftwarewasnotavailabletoperformtheanalysis.– Currentanalysiscanbeextendedfurther.– Currentlydevelopingagraphicalinterface.
• Otherprogramminglanguagesandplatformscanduplicatetheanalysis.Thecurrentresultsareaproofofconcept.
11/8/18 ASQRDTelematicsWebinar 44
UserFriendlyTools
• Needtodevelopagraphicalinterface.– Makeiteasierfortheanalysttouse
• Scriptssupportautomaticreportgeneration
• Needdistributedprocessingandcloudstorage.– Fasterprocessingofindividualvehiclefileswithmanyparallel
processors.– Redundancyincloudstorageprotectsthedata
11/8/18 ASQRDTelematicsWebinar 45

Conclusions
• Telematicsdataanalysiscanprovidedatadrivendesigntargetsconsistentwiththeorganizationmissionprofile.– Examples:10years/100,000miles;10years/150,000miles…
• Targetingaggressivecustomerusagesispossiblebyselectingthehighstressusers,i.e.,1stor99thpercentiles,or5thand95thpercentiles.
• Worktodateisaproofofconcept.Furtherdevelopmentisrequiredtodevelopsoftware,databases,hardware,…
• Monitoringfocusesonthepopulation,nottheindividual.Privacymustbemaintained.
11/8/18 ASQRDTelematicsWebinar 46

ContactInfo
DennisCraggsQuality,Reliability,andAnalyticsServices
12028TownlineRd.,GrandBlanc,MI48439
11/8/18 ASQRDTelematicsWebinar 47


![9. Telematics and IVI [호환 모드] - Yonsei Universityweb.yonsei.ac.kr/hgjung/Lectures/DME427/9. Telematics and IVI.pdf · Telematics Telematics typically is any integrated use](https://img.dokumen.tips/doc/110x75/5bddac8609d3f27f5d8b6335/9-telematics-and-ivi-yonsei-telematics-and-ivipdf-telematics.jpg)