Embed Size (px)
Citation preview

Making Better Decisions May 8, 2017 ASQ Orange Empire Section
Presented by Dave Nagy Cell & Text: 714.883.9305 [email protected]
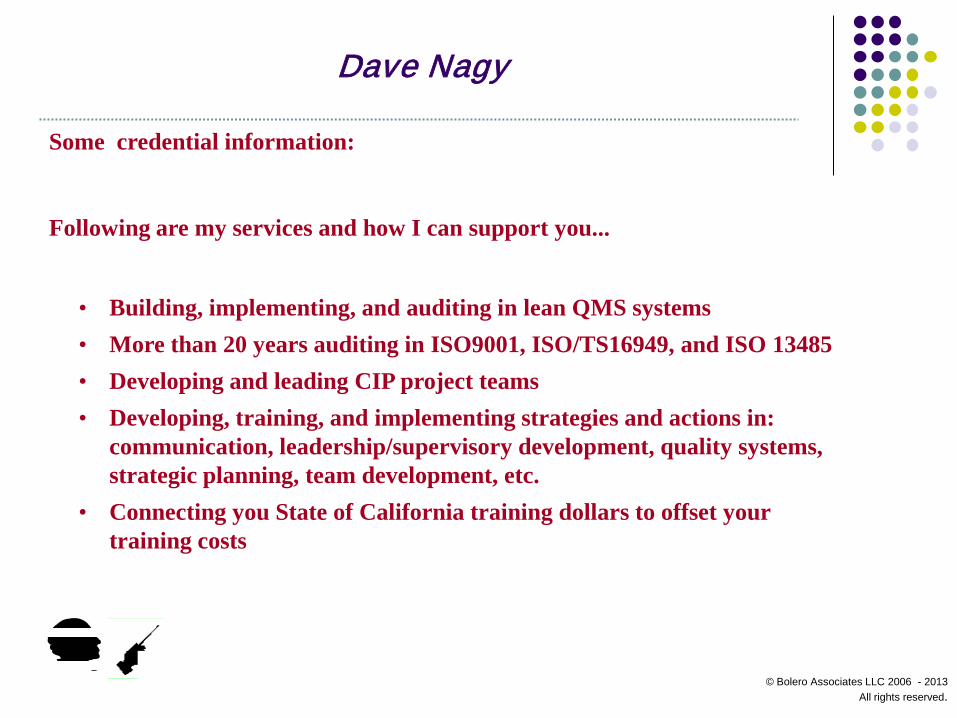
Dave Nagy
Some credential information:
Following are my services and how I can support you...
• Building, implementing, and auditing in lean QMS systems • More than 20 years auditing in ISO9001, ISO/TS16949, and ISO 13485 • Developing and leading CIP project teams • Developing, training, and implementing strategies and actions in:
communication, leadership/supervisory development, quality systems, strategic planning, team development, etc.
• Connecting you State of California training dollars to offset your training costs
© Bolero Associates LLC 2006 - 2013 All rights reserved.

Our Session Focus: Decision Making
Session objectives are to: Understand the factors that influence decision making
and the connection to ISO9001-2015
Be introduced to a decision-making process Look at tools and techniques for improving decision-
making success

Session Focus: Decision Making
Every decision involves choices – • yes/no, go/no go, my way/your way, status quo, etc.
Every decision has consequences - positive / negative / its not broke yet / let’s wait and see
• On customers, suppliers, employees • On Culture
• Ethics (what is right given existing norms) • Moral compass (values, beliefs, philosophies) • Respect – (sound decisions are expected)
• On opportunity • On unintended consequences (holistic or island)

Bad, Really Bad Decision Making – 10 Worst
• NASA knew the Challenger had O-ring problems, but decided to launch the space shuttle anyway.
• All 12 of the largest publishing firms that rejected J.K. Rowling's "Harry Potter and the Sorcerer's Stone.”
• #10 - M&M’s Mars passed on the chance to use their candy in "E.T., the Extra-Terrestrial" when Spielberg asked. Instead, Hershey smartly stepped in with Reese's Pieces when opportunity knocked.
• #9 - Dick Rowe (Decca Records) was mistaken. Guitar bands weren't cold, they were hot. But, Dick Rowe said Deca was interested in the Beatles who went on to sign with EMI.
• #1 - Prohibition was supposed to lower crime levels and reduce the amount of money spent on prisons... What resulted instead was an explosion of alcohol-related crime...Unexpected negative financial effects also fell on a country expecting an economic windfall.
http://history.howstuffworks.com/historical-events/10-worst-decisions10.htm 5/3/17

Bad Decisions from Bad Data Costs the U.S. $3 Trillion Per Year 50% — the amount of time that knowledge workers waste hunting for data, finding and correcting errors, and searching for confirmatory sources for data they don’t trust. 60% — the estimated fraction of time that data scientists spend cleaning and organizing data, according to CrowdFlower. 75% — an estimate of the fraction of total cost associated with hidden data factories in simple operations, based on two simple tools, the so-called Friday Afternoon Measurement and the “rule-of ten.” https://hbr.org/2016/09/bad-data-costs-the-u-s-3-trillion-per-
© Bolero Associates LLC 2014 All rights reserved.

The most common reasons for making bad decisions: 1. Lack of time 2. Not having sufficient alternatives from which to choose from 3. Not considering all the alternatives 4. Lack of information 5. Not being methodical 6. Inaccurate forecasting of the effects of specific actions 7. Inaccurate forecasting of external influences 8. Hazy objectives 9. Acceptance of others' judgments 10. Poor work at an earlier stage of problem solving 11. Acceptance of subjective needs and feelings 12. An impulsive response
Our Session Focus: Decision Making

Approaches to Decision Making:
Response to recurring problems Programmed
Nonprogrammed
Response to problems and opportunities that have unique circumstances, unpredictable results, and important consequences.

Programmed Decisions
• Involve problems or situations that occur often
• Circumstances and solutions are predictable
Examples:
- how to pay employees
- how to file an expense report
- how to process new-hire paperwork

Approaches to Decision Making:
Response to recurring problems Programmed
Nonprogrammed
Response to problems and opportunities that have unique circumstances, unpredictable results, and important consequences.

Non-Programmed Decisions
• Made in response to problems and opportunities that have unique circumstances
• Example: change jobs, move to new house, buy car
• May provide unpredictable results • Example: buy a car from gov’t auction sight unseen
• Are often situations with multiple variables or have never occurred before
• Example: move plant to new city

Decision-Making Factors: Individual
• Personality Style (Temperament Style)
• Decision-making Style:
Autocratic - Participative
• Relationship with Manager
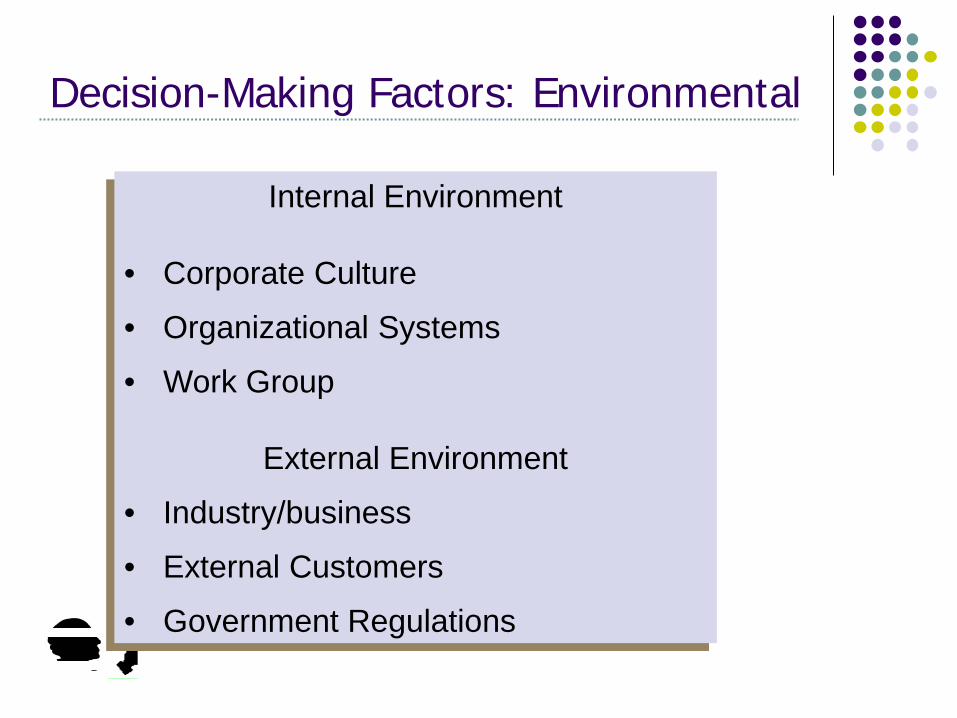
Decision-Making Factors: Environmental
Internal Environment • Corporate Culture
• Organizational Systems
• Work Group
External Environment
• Industry/business
• External Customers
• Government Regulations

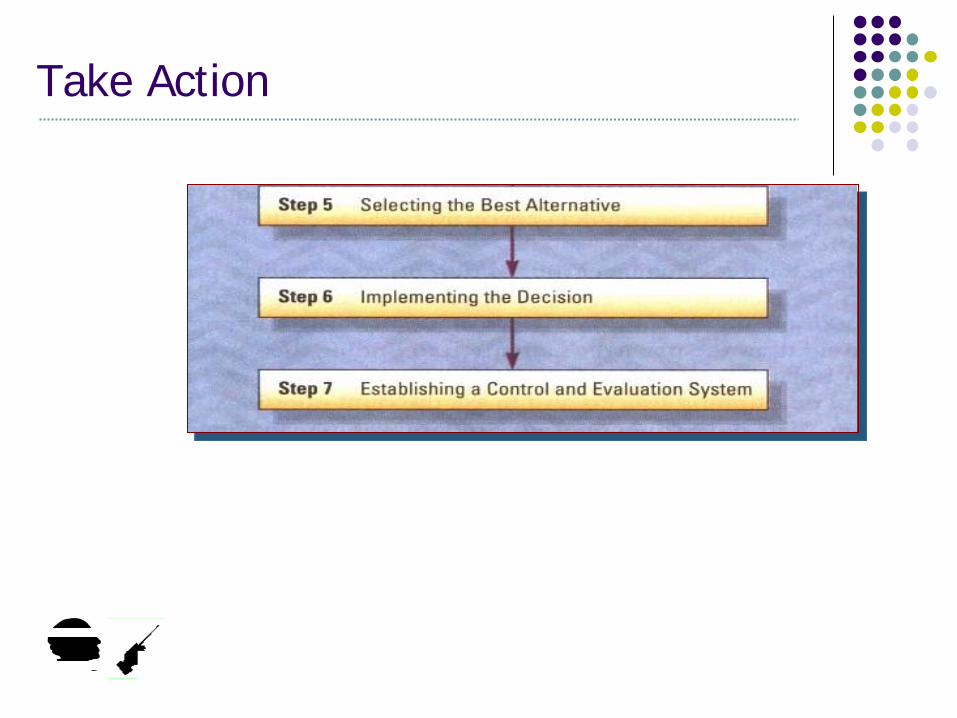
The Decision Making Process Define the Problem or Opportunity
Identify Limiting Factors
Develop Potential Alternatives
Analyze the Alternatives
Select the Best Alternative
Implement the Decision
Establish a Control System
Step 1
Step 2
Step 3
Step 4
Step 5
Step 6
Step 7

Get it Right from the Start
Most Critical Step in the Process
Problems involve:
Symptom: signal something is wrong Root Cause: produces the symptoms

A great place to use a Force-Field Analysis: Balance between forces that favor change and resist change
Driving Forces Restraining Forces Status Quo

Generate Ideas
Alternatives should address the root cause and address limiting factors by strengthening driving forces and/or removing or weakening restraining forces
1. Brainstorming (group or individual): Go for quantity versus quality
2. Mind Mapping (concept maps) http://www.mindgenius.com
3. Pareto Analysis (choosing What to Change)
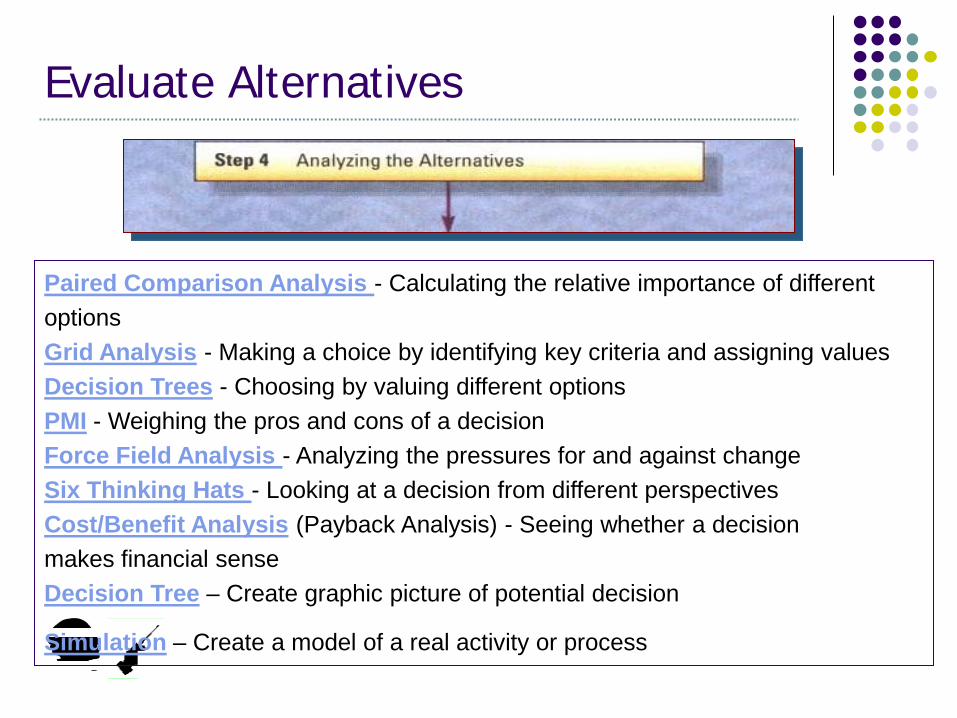
Evaluate Alternatives
Paired Comparison Analysis - Calculating the relative importance of different options Grid Analysis - Making a choice by identifying key criteria and assigning values Decision Trees - Choosing by valuing different options PMI - Weighing the pros and cons of a decision Force Field Analysis - Analyzing the pressures for and against change Six Thinking Hats - Looking at a decision from different perspectives Cost/Benefit Analysis (Payback Analysis) - Seeing whether a decision makes financial sense Decision Tree – Create graphic picture of potential decision
Simulation – Create a model of a real activity or process
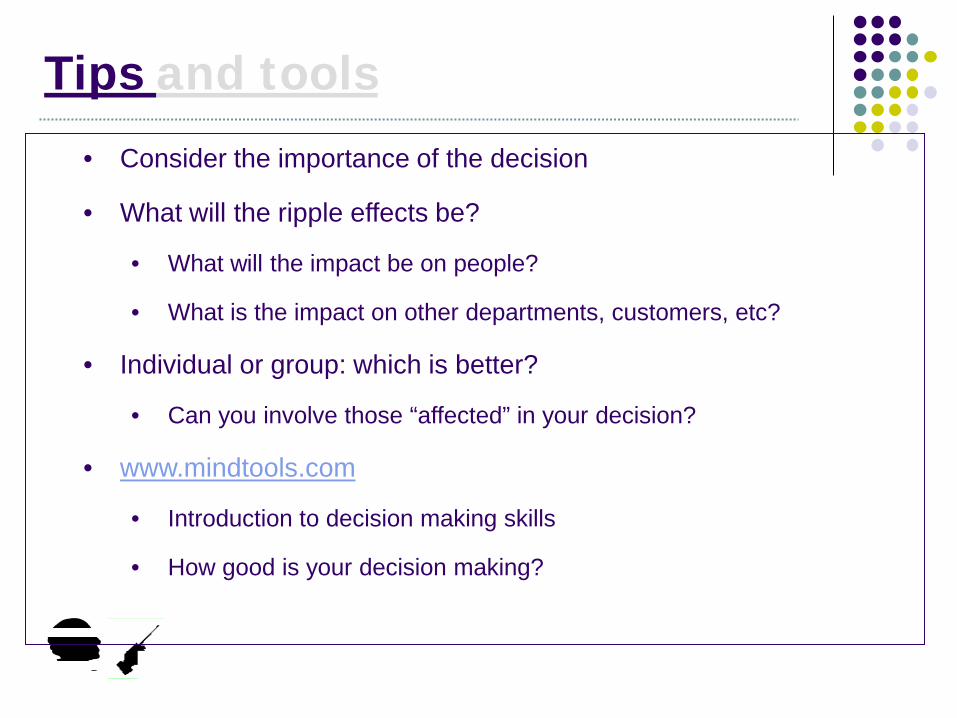
Tips and tools • Consider the importance of the decision
• What will the ripple effects be?
• What will the impact be on people?
• What is the impact on other departments, customers, etc?
• Individual or group: which is better?
• Can you involve those “affected” in your decision?
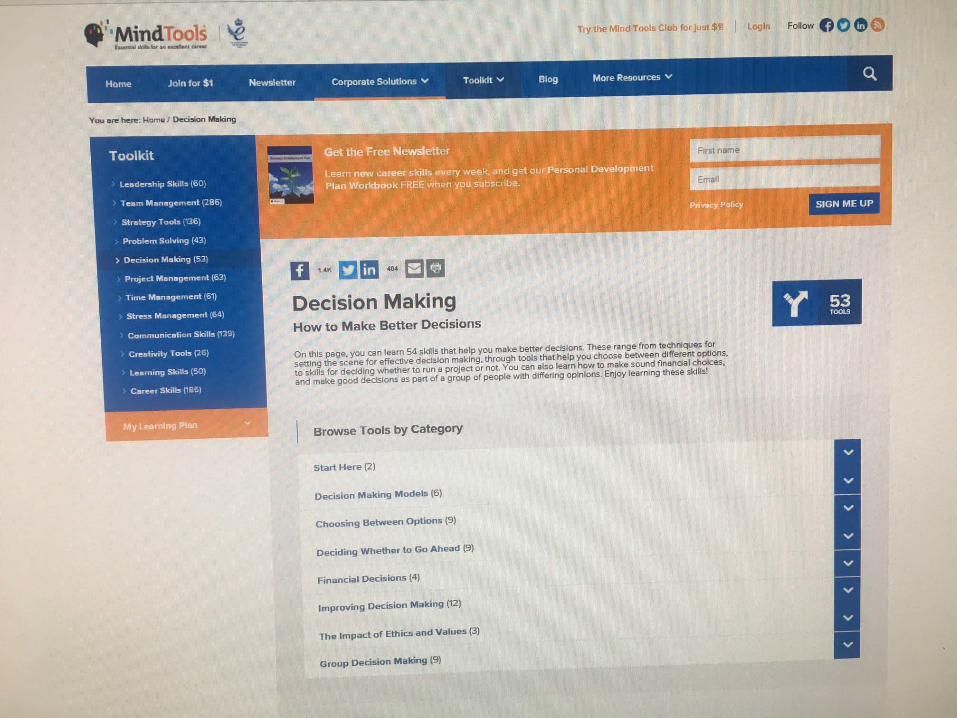
• www.mindtools.com
• Introduction to decision making skills
• How good is your decision making?

© Bolero Associates LLC 2014 All rights reserved.

© Bolero Associates LLC 2014 All rights reserved.

Tips and tools www.mindtools.com
• Choosing Between Options
• Grid Analysis, Paired Comparison, Decision Tree, etc
• Deciding Whether to Go Ahead
• PMI, Force Field Analysis, Risk Analysis, etc
• Financial Decision Making
• Cost Benefit Analysis, Cash Flow Forecasting, etc
• Improving Decision Making
• Group Decision Making

Tips and tools Grid Analysis Making a Decision By Weighing Up Different Factors (Also known as Decision Matrix Analysis, Pugh Matrix Analysis, and Multi-Attribute Utility Theory)
Example A caterer needs to find a new supplier for his basic ingredients. He has four suppliers options. Factors that he wants to consider are:
• Cost. • Quality. • Location. • Reliability. • Payment options.
Firstly he draws up the table shown in Figure 1, and scores each option by how well it satisfies each factor:

Tips and tools Grid Analysis Firstly he draws up the table shown in Figure 1, and scores each option by how well it satisfies each factor: Figure 1: Example Grid Analysis Showing Unweighted Assessment of How Each Supplier Satisfies Each Factor
Factors: Cost Quality Location Reliability Payment Options Total
Weights:
Supplier 1 1 0 0 1 3
Supplier 2 0 3 2 2 1
Supplier 3 2 2 1 3 0
Supplier 4 2 3 3 3 0
Figure 1: Example Grid Analysis Showing Unweighted Assessment of How Each Supplier Satisfies Each Factor

Tips and tools Grid Analysis Next he decides the relative weights for each of the factors. He multiplies these by the scores already entered, and totals them. This is shown in Figure 2: Figure 2: Example Grid Analysis Showing Weighted Assessment of How Each Supplier Satisfies Each Factor
Figure 1: Example Grid Analysis Showing Unweighted Assessment of How Each Supplier Satisfies Each Factor
Factors: Cost Quality Location Reliability
Payment Options Total
Weights: 4 5 1 2 3
Supplier 1 4 0 0 2 9 15
Supplier 2 0 15 (3) 2 4 3 24
Supplier 3 8 10 (2) 1 6 0 25
Supplier 4 8 15 3 6 0 32
This makes it clear to the caterer that Supplier 4 is the best option, despite the lack of flexibility of its payment options.

Tips and tools
Paired Comparison Analysis
• When you're choosing between many different options, how do you decide on the best way forward?
• This is especially challenging if your choices are quite different from one another, if decision criteria are subjective, or if you don't have objective data to use for your decision.
• Paired Comparison Analysis helps you to work out the relative importance of a number of different options – the classical case of "comparing apples with oranges."
Figure 1: Example Grid Analysis Showing Unweighted Assessment of How Each Supplier Satisfies Each Factor
This makes it clear to the caterer that Supplier 4 is the best option, despite the lack of flexibility of its payment options.

Tips and tools
Paired Comparison Analysis For example, a philanthropist is choosing between several different nonprofit organizations that are asking for funding. To maximize impact, she only wants to contribute to a few of these, and she has the following options:
• An overseas development project. • A local educational project. • A bequest for her university. • Disaster relief.
Figure 1: Example Grid Analysis Showing Unweighted Assessment of How Each Supplier Satisfies Each Factor
This makes it clear to the caterer that Supplier 4 is the best option, despite the lack of flexibility of its payment options.

Tips and tools
Paired Comparison Analysis
Figure 1: Example Grid Analysis Showing Unweighted Assessment of How Each Supplier Satisfies Each Factor
This makes it clear to the caterer that Supplier 4 is the best option, despite the lack of flexibility of its payment options.
A: Overseas Development
B: Local Educational
C: University
D: Disaster Relief
A: Overseas Development
B: Local Educational
C: University D: Disaster Relief
Figure 1 – Example Paired Comparison Analysis Table (not filled in): Then she compares options, writes down the letter of the most important option, and scores their difference in importance to her. Figure 2 illustrates this step of the process.

Tips and tools Paired Comparison Analysis
Figure 1: Example Grid Analysis Showing Unweighted Assessment of How Each Supplier Satisfies Each Factor
This makes it clear to the caterer that Supplier 4 is the best option, despite the lack of flexibility of its payment options.
A: Overseas Development
B: Local Educational C: University D: Disaster
Relief A: Overseas Development A, 2 C, 3 A, 1
B: Local Educational C, 1 B, 1
C: University
C, 2
D: Disaster Relief
Figure 2 – Example Paired Comparison Analysis Table (filled in): Finally, she adds up the A, B, C, and D values and converts each into a percentage of the total. These calculations yield the following totals:
• A = 3 (30 percent). • B = 1 (10 percent). • C = 6 (60 percent). • D = 0.
Here, she decides to make a bequest to her university (C) and to allocate some funding to overseas development (A).

Tips and tools Force Field Analysis Analyzing the Pressures For and Against Change
Figure 1: Example Grid Analysis Showing Unweighted Assessment of How Each Supplier Satisfies Each Factor
To carry out a Force Field Analysis, use a blank sheet of paper or whiteboard, or download our worksheet. Then describe your plan or proposal for change in a box in the middle of the paper. List the forces for change in a column on the left-hand side, and the forces against change in a column on the right-hand side.

Tips and tools
Force Field Analysis Analyzing the Pressures For and Against Change
Figure 1: Example Grid Analysis Showing Unweighted Assessment of How Each Supplier Satisfies Each Factor
As you do this, consider the following questions:
• What business benefit will the change deliver? • Who supports the change? Who is against it? Why? • How easy will it be to make the change? Do you have enough
time and resources to make it work? • What costs are involved? • What other business processes will be affected by the
change? • What are the risks?

Tips and tools Figure 1: Example Grid Analysis Showing Unweighted Assessment of How Each Supplier Satisfies Each Factor
(Click image to view full size.)

Tips and tools Figure 1: Example Grid Analysis Showing Unweighted Assessment of How Each Supplier Satisfies Each Factor
Force Field Analysis • Decide whether or not to move forward with the decision or change. • Think about how you can strengthen the forces that support the change and
weaken the forces opposing it, so that the change is more successful. The Analysis If you had to implement the project in the example above, the analysis might suggest a number of changes that you could make to the initial plan. You could:
• Train staff ("Cost" +1) to minimize the fear of technology ("Staff uncomfortable with new technology" -2).
• Show staff that change is necessary for business survival (new force that supports the change, +2).
• Show staff that new machines would introduce variety and interest to their jobs (new force that supports the change, +1).
• Raise wages to reflect new productivity ("Cost" +1, "Loss of overtime" -2). • Install slightly different machines with filters that eliminate pollution ("Impact on
environment" -1). These changes would swing the balance from 11:10 (against the plan), to 13:8 (in favor of the plan).
Take Action

Boosting Decision-Making Success
1. Understand how different styles make decisions (self and others)
2. Allow ample time for the process
3. Know when to involve others
4. Encourage others to make decisions & provide coaching support
5. Learn from past decisions
6. Prioritize decisions and don’t spend equal time on each
7. Treat the root cause versus symptom
8. Seek quality information
9. Know when to hold off (Just-in-time approach) and when to act (understand the risks)
10. Ask for help

Group Decision Making
Advantages
Broader perspective Diversity broadens the
view More satisfactory
decision Opportunity for
discussion Less uncertainty Encourages buy-in
Disadvantages
Compromise Groupthink Difficulty in performing
certain tasks Difficulty in taking the
initiative No one person has the
responsibility for final decision

It’s a Wrap
Focus: Making Better Decisions In this session, we… Looked at the factors that influence decision making Discussed the steps in the decision-making process Applied tools and techniques for improving
decision-making success
© Bolero Associates LLC 2014 – 2017. All rights reserved.

Techniques for Making Better Decisions May 8, 2017 ASQ Orange Empire Section
Presented by Dave Nagy Cell & Text Msg: 714.883.9305 [email protected]