Embed Size (px)
DESCRIPTION
Design of Long Accelerating Moving walkways
Citation preview
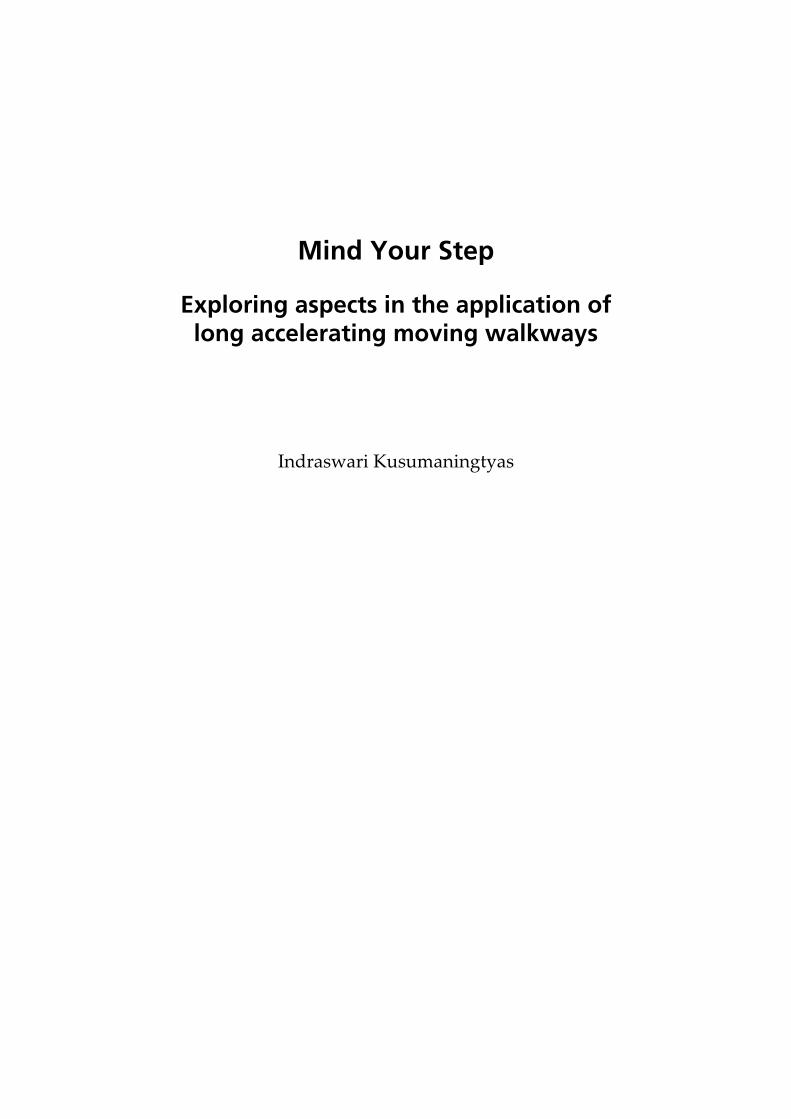
Mind Your Step
Exploring aspects in the application of long accelerating moving walkways
Indraswari Kusumaningtyas

Cover: Photo by Peter Baker

Mind Your Step
Exploring aspects in the application of long accelerating moving walkways
Proefschrift
ter verkrijging van de graad van doctor aan de Technische Universiteit Delft,
op gezag van de Rector Magnificus prof. dr. ir. J.T. Fokkema, voorzitter van het College voor Promoties,
in het openbaar te verdedigen op dinsdag 27 oktober 2009 om 12:30 uur
door
Indraswari KUSUMANINGTYAS
werktuigkundig ingenieur geboren te Tanjungpandan, Indonesië
Dit proefschrift is goedgekeurd door de promotor: Prof. dr. ir. G. Lodewijks Samenstelling promotiecommissie: Rector Magnificus, voorzitter Prof. dr. ir. G. Lodewijks, Technische Universiteit Delft, promotor Prof. dr. ‐ing. L. Overmeyer, Leibniz Universität Hannover, Germany Prof. dr. F. Robusté, Universitat Politècnica de Catalunya, Spain Prof. dr. ir. S.C. Santema, Technische Universiteit Delft Prof. dr. ir. S.P. Hoogendoorn, Technische Universiteit Delft Prof. dr. eng. J.A. Ferreira, Technische Universiteit Delft Prof. dr. ir. J. Hellendoorn, Technische Universiteit Delft This dissertation is the result of research carried out from 2005 to 2009 at Delft University of Technology, Faculty of Mechanical, Maritime and Materials Engineering, Department of Maritime and Transport Technology, Section of Transport Engineering and Logistics. TRAIL Thesis Series no. T2009/10, The Netherlands TRAIL Research School TRAIL Research School P.O. Box 5017 2600 GA Delft The Netherlands Phone: +31 (0)15 2786046 Fax: +31 (0)15 2784333 Email: [email protected] ISBN: 978‐90‐5584‐122‐6 Copyright © 2009 by Indraswari Kusumaningtyas All rights reserved. No part of this publication may be reproduced or transmitted in any form or by any means, electronic or mechanical, including photocopying and recording, or in any information storage or retrieval system without the prior written permission of the author. Printed in the Netherlands by Ipskamp Drukkers

To my daughter Naureen, who began her journey together with this work


vii
Contents
1 Introduction 1
1.1 Background 1 1.2 Research objective 5 1.3 Research approach 5 1.4 Thesis outline 6 2 The story of accelerating moving walkways 9
2.1 Historical development 9 2.2 Birth of conventional moving walkways 11 2.3 Revival of high‐speed moving walkways 11 2.3.1 In‐line belts 12 2.3.2 Sliding parallelograms 12 2.3.3 Sliding pallets 12 2.3.4 Accelerating/decelerating rollers with high‐speed belt 13 2.4 Conclusions 15 3 Characteristics and comparative evaluation of accelerating moving walkways 17
3.1 Introduction 17 3.2 Research approach 18 3.2.1 Scope of analysis 18 3.2.2 Selection of data 19 3.3 Characteristics of the selected transport systems 20 3.3.1 Bus 20 3.3.2 Light rail 26 3.3.3 Automated people mover 27 3.3.4 Personal rapid transit 28 3.3.5 Conventional moving walkway 30

viii Exploring aspects in the application of long accelerating moving walkways
3.3.6 Accelerating moving walkway 32 3.4 Comparative evaluation 34 3.5 Conclusions 40 4 Characteristics and behaviour of pedestrians as passengers of
accelerating moving walkways 43
4.1 Introduction 43 4.2 Human characteristics, abilities and limitations related to AMW design 44 4.2.1 Physical characteristics of human body 44 4.2.2 Ability to maintain balance and stability 46 4.2.3 Cognitive and sensory abilities 47 4.3 Human behaviours related to AMW use 48 4.3.1 Approaching the AMW 49 4.3.2 Boarding the AMW 53 4.3.3 Travelling on the high‐speed section 57 4.3.4 Exiting the AMW 59 4.4 Influence towards aspects in AMW applications 60 4.4.1 Effective capacity 60 4.4.2 AMW length 61 4.4.3 Safety 62 4.4.4 Alternative route 62 4.4.5 Power consumption 62 4.5 Conclusions 63 5 A study on the application of accelerating moving walkways in
Amsterdam Airport Schiphol 65
5.1 Introduction 65 5.2 Amsterdam Airport Schiphol 66 5.2.1 The passenger terminal 66 5.2.2 Passenger processes 68 5.2.3 Expansion plans 69 5.3 Evaluation of AMWs for intra‐terminal transport 69 5.3.1 Current situation in Schiphol Centrum 70 5.3.2 AMWs in Schiphol Centrum 76 5.4 Evaluation of AMWs for inter‐terminal transport 80 5.4.1 A projection on Schiphol Noordwest 80 5.4.2 AMWs between Schiphol Noordwest and Schiphol Centrum 81 5.5 Conclusions 83

Contents ix
6 Analysing drive-related application aspects in long accelerating moving walkways 85
6.1 Introduction 85 6.2 Drive‐related aspects 86 6.2.1 Components and support structure requirements 86 6.2.2 System and passenger safety 87 6.3 Research approach 88 6.3.1 Multiple drives 88 6.3.2 Drive control 89 6.3.3 Dynamic simulations 90 6.4 AMW system considered 91 6.4.1 Main components 91 6.4.2 Assumptions for investigating multiple drives 97 6.5 Modelling the AMW high‐speed belt conveyor 98 6.5.1 Belt dynamics 99 6.5.2 Motion resistances 102 6.5.3 Passenger flow 105 6.5.4 Drive station 107 6.5.5 Simulation framework 110 6.6 Conclusions 111 7 Performance of long accelerating moving walkway belts with
single and multiple drives 113
7.1 Introduction 113 7.2 Model parameters 113 7.3 Behaviour of single‐drive AMW belts 115 7.3.1 System layout 116 7.3.2 Starting 116 7.3.3 Influence of passenger distribution 122 7.3.4 Stopping 125 7.4 Behaviour of long multiple‐drive AMW belts 131 7.4.1 System layout 131 7.4.2 Starting 132 7.4.3 Influence of passenger distribution 136 7.4.4 Stopping 139 7.5 Implications towards drive‐related application aspects 144 7.5.1 System components and support structure 144 7.5.2 System and passenger safety 145 7.5.3 Power consumption 145 7.6 Conclusions 146

x Exploring aspects in the application of long accelerating moving walkways
8 Performance of long multiple-drive accelerating moving walkway belts with voltage control 147
8.1 Introduction 147 8.2 Drive control 148 8.2.1 Method of drive control 148 8.2.2 Implementation in the simulation framework 149 8.3 Behaviour of long multiple‐drive AMW belts with voltage control 149 8.3.1 System layout 149 8.3.2 Starting 150 8.3.3 Influence of passenger distribution 152 8.3.4 Stopping 154 8.4 Implications towards drive‐related application aspects 158 8.4.1 System components and support structure 158 8.4.2 System and passenger safety 159 8.4.3 Power consumption 159 8.5 Conclusions 159 9 Conclusions and recommendations 161
9.1 Conclusions 161 9.1.1 On aspects influencing the application of long AMWs 162 9.1.2 On the effects of using multiple drives in long AMWs 164 9.2 Recommendations 166 Nomenclature 169 References 173 Summary 185 Samenvatting 189 Acknowledgement 193 Curriculum vitae 195 TRAIL Thesis Series 197

1
Chapter 1
Introduction
1.1 Background
The most basic mode of human transport is, undoubtedly, walking (Allan, 2001; Brög and Mense, 2003). Even with the availability of modern and sophisticated transport modes, walking is still normally carried out, at least, at the beginning and the end of a journey. If the journey involves intermediate change of vehicle, within or across transport modes, more walking may have to be performed. Efforts are continuously made to ease walking, such as by providing safe and comfortable paths or by placing facilities at as close distances as possible. Despite these efforts, in some situations it may occur that walking distances are still relatively long for pedestrians to cover within their comfort level. In such cases, moving walkways can be applied.
In the EN 115‐1:2008 standard, the European Committee for Standardization (Comité Européen de Normalisation, CEN) defines a moving walkway as a ‘power‐driven installation for the conveyance of persons in which the user carrying surface remains parallel to its direction of motion and is uninterrupted (e.g. pallets, belt)’ (CEN, 2008). Various terms are also commonly used to name such a system, such as moving walk, moving sidewalk, moving pavement, passenger conveyor, pedestrian conveyor, or travelator. These terms are used interchangeably in this thesis.
The first ever concept of a continuous moving pavement was proposed in 1874 for New York, with the intention to alleviate congestion (Richards, 1966). Several other concepts of moving walkways were also put forward as new forms of transport to reduce city congestions due to horse‐drawn vehicles. Only very few of these were actually constructed, mainly as attractions during large exhibitions. The enthusiasm for these new systems faded with the development of electric tramway, railway, motor car and motor bus, which more or less “solved” the transport problems in that early period. Interests in the use of moving walkways emerged for the second time
2 Exploring aspects in the application of long accelerating moving walkways
some fifty years later, when the traffic conditions and town congestions once again became worse (Tough and O’Flaherty, 1971). Although the idea to use moving walkways to relieve congestions was not realized, the first modern moving walkway found its way into installation as a permanent form of transport in an underground rail station in Jersey City, New Jersey, in 1954. It was due to the development of this first modern system that conventional moving walkways found their present form, as shown in Figure 1.1.
(a) (b)
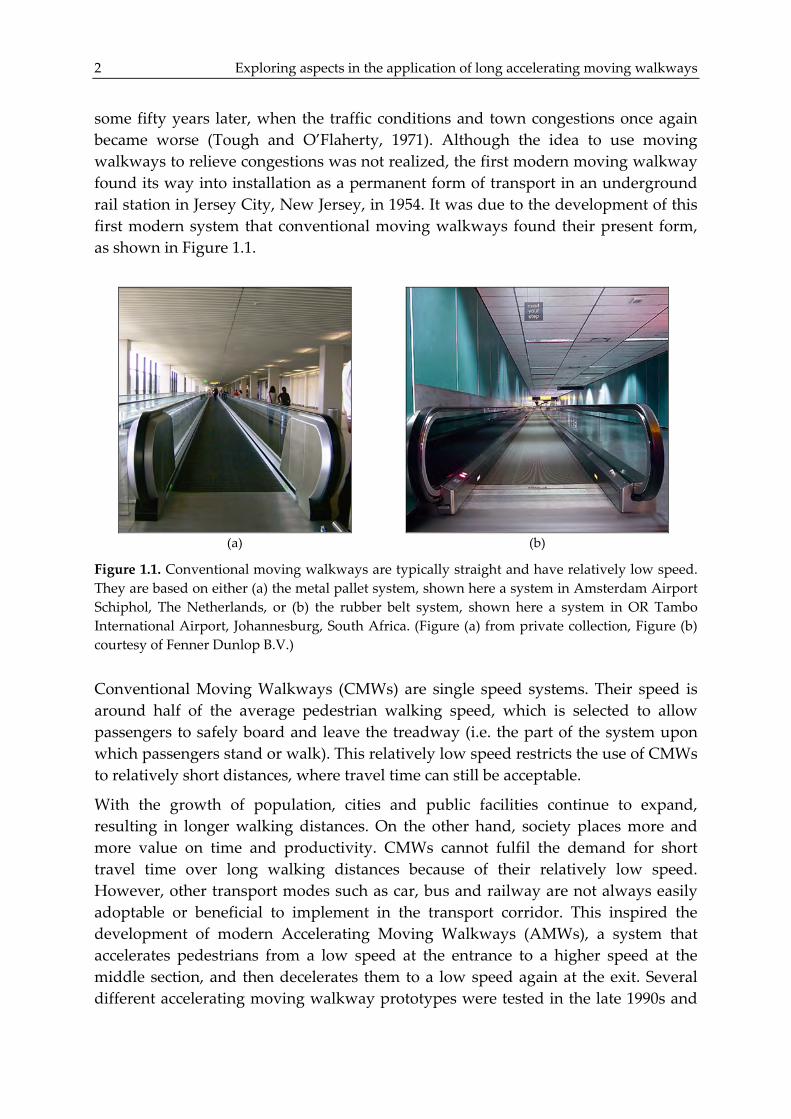
Figure 1.1. Conventional moving walkways are typically straight and have relatively low speed. They are based on either (a) the metal pallet system, shown here a system in Amsterdam Airport Schiphol, The Netherlands, or (b) the rubber belt system, shown here a system in OR Tambo International Airport, Johannesburg, South Africa. (Figure (a) from private collection, Figure (b) courtesy of Fenner Dunlop B.V.)
Conventional Moving Walkways (CMWs) are single speed systems. Their speed is around half of the average pedestrian walking speed, which is selected to allow passengers to safely board and leave the treadway (i.e. the part of the system upon which passengers stand or walk). This relatively low speed restricts the use of CMWs to relatively short distances, where travel time can still be acceptable.
With the growth of population, cities and public facilities continue to expand, resulting in longer walking distances. On the other hand, society places more and more value on time and productivity. CMWs cannot fulfil the demand for short travel time over long walking distances because of their relatively low speed. However, other transport modes such as car, bus and railway are not always easily adoptable or beneficial to implement in the transport corridor. This inspired the development of modern Accelerating Moving Walkways (AMWs), a system that accelerates pedestrians from a low speed at the entrance to a higher speed at the middle section, and then decelerates them to a low speed again at the exit. Several different accelerating moving walkway prototypes were tested in the late 1990s and

Chapter 1. Introduction 3
early 2000s, either in the manufacturing sites or in public areas (Abe et al., 2001; Cote and Gempp, 1997; Gonzalez‐Alemany and Cuello, 2003; Ikizawa et al., 2001; Loder, 1998; Shirakihara, 1997). Since 2002, an AMW system has been operating in Montparnasse Metro Station in Paris, France (Dembart, 2003). Another AMW system from a different design has been installed in Toronto Pearson International Airport, Canada, since 2007 (Gonzalez‐Alemany et al., 2007).
A unique characteristic of moving walkways is its ability to continuously provide large transport capacity during operation. Combined with a higher maximum speed, it is envisaged that AMWs can be a potential transport mode to fill the gap between short and moderate distance transport (Abe et al., 2001; Gonzalez‐Alemany and Cuello, 2003; Gonzalez‐Alemany et al., 2007; Saeki, 1996; Shirakihara, 1997). However, as a fairly new technology, only very few systems have been developed and, so far, these are all relatively short systems. Information, to some extent, can be gathered from the prototype tests of these systems and the currently operating AMWs. This can provide some insights on the application of AMWs for short distances. However, a long version of present day AMWs has never been made, so there is no knowledge on the application and performance of these systems for longer distances. Although long AMWs are claimed possible (Dembart, 2003; Klein, 2003; ThyssenKrupp, 2007), so far there is no elaboration on whether extending the length of AMWs will involve considerations for the same application aspects as for relatively short AMWs.
In comparison to people transport, the exploitation of conveyor systems for long distance transport of goods and materials has been carried out for many years. In the field of bulk material transport by belt conveyors, particularly, there is an ever increasing demand to carry higher tonnage over longer distances and more diverse routes. These requirements constantly push belt conveyor technology to its limit. Continuous studies on aspects such as system resistances (e.g. Hager et al., 2005; Lodewijks, 1995; Wheeler, 2003), power and drives (e.g. Gallina, 1991; Schultz, 1995; Sheehy, 2003), conveyor design (e.g. Lodewijks, 2000; Nordell, 1991; Roberts et al., 1985), and dynamic analysis and simulations (e.g. Lodewijks, 1996; Nordell and Ciozda, 1984; Nuttall, 2007; Zür, 1986) lead to technological advancements that enable belt conveyor industry to keep up with the demand. Hence, long overland belt conveyors with multiple vertical as well as horizontal curves, such as the one shown in Figure 1.2(a), can be developed. Furthermore, the maximum achieved flight length continues to increase, see Figure 1.2(b). One of the technologies that contributed to the possibility to develop longer belt conveyors is the distribution of drive power along the path of a belt conveyor.
The idea of distributing power at multiple locations along the length of a belt conveyor began between mid 1970s and mid 1980s, particularly in the underground coal mining industry. There was a tremendous growth in mining output, which resulted from the improvement of mining equipment efficiencies and capabilities, as

4 Exploring aspects in the application of long accelerating moving walkways
well as the increase of mining block size to reduce the lost production time for moving mining equipments from block to block. However, transporting higher capacity over longer distances required more drive power and belt strength, much larger than what had ever been used before. This gave rise to a number of concerns, including the large size of high power drives and the impracticality to move them around. Although belt technology could have handled the increased belt strength requirements, moving to a higher belt rating would also mean having to handle a much heavier belt. With the introduction of intermediate drives, the required belt strength and drive unit size were reduced. The required system performance was achieved through proper control of the drives. Today, intermediate drive technology is very well accepted and widely used in underground belt conveyors, and is gaining more applications in overland belt conveyors (Alspaugh, 2003). Studies are continuously performed to better understand the characteristics and performance of belt conveyors with intermediate drives, improve their system design, and develop better drive control.
(a) (b)
Figure 1.2. (a) Technological advancements, such as the distribution of drive power, have enabled the development of long overland belt conveyors. (b) The maximum length of conveyor flights continues to increase over the years. (Figure (a) courtesy of Gabriel Lodewijks, Figure (b) from Moerman (2006))
Because moving walkways and belt conveyors share some similarities in their mechanism principles, the experience of developing long bulk material belt conveyors can be taken as analogy for developing long AMWs. It may be expected that increasing the length of AMWs will influence the drive power requirements and system strength, giving rise to some conveyance concerns. This may lead to the necessity to also apply distributed drives at multiple locations along the length of the AMWs. Nevertheless, the two systems have different characteristics related to their

Chapter 1. Introduction 5
different application and load, one for people and the other for goods/materials. Hence, it is not straightforward to say whether using multiple drives in long AMWs will bring the same effects and benefits to their application aspects and performance, as in long multiple‐drive bulk material belt conveyors.
1.2 Research objective
The main objective of this thesis is to investigate the possibility of applying AMWs for moderate distance continuous people transport.
In dealing with this main research objective, the following questions are posed:
(1) What aspects influence the possibility to apply AMWs for moderate distance transport? Do application aspects of CMWs and present day short AMWs also hold for long AMWs?
(2) Is the single‐drive design of present day short AMWs still suitable for long AMWs? What are the effects of applying multiple drives along the AMW towards the system performance?
1.3 Research approach
The first set of questions is approached by distinguishing three main elements in the application of AMWs, i.e. the system itself, the passengers, and the location. The characteristics of each element are reviewed and analysed with respect to how they impose requirements and boundaries for the application of AMWs in general and in particular for moderate distance transport. The characteristics of AMWs are evaluated based on the designs and specifications of present day systems, from the point‐of‐view of technical as well as non‐technical aspects typically considered in the evaluation of transport alternatives. An important aspect is the position of AMWs against other types of transport systems. The inherent characteristics of passengers and the behaviour that rise due to their interaction with the AMW are studied. Then the AMWs are analysed in the context of a location, which characteristics are formed by its function, layout and the people in it. Through these steps, the application aspects that are of concern to a long AMW are identified and evaluated as to whether they differ to those for a short AMW.
The second set of questions is dealt with by, first, looking at the application aspects of long AMWs from the point‐of‐view of the drive system. This correlates the application aspects to operating performances, e.g. system tension (relates to structural costs, system safety and space utilization), system acceleration and deceleration (relates to passenger safety), and power consumption (relates to operational cost). An approach involving the application of multiple drives and drive control is proposed. The effect of this approach towards the system application

6 Exploring aspects in the application of long accelerating moving walkways
aspects and performance are analysed by means of simulations. For this, a moving walkway model is built, which takes into account the influence of passenger loading and drive control. The parameters for the simulations are based on the characteristics of the AMW and the passengers.
1.4 Thesis outline
After this introduction, a short description about AMWs is given in Chapter 2. Then, the two set of research questions are investigated.
Part I, dealing with the first set of questions, comprises of Chapters 3, 4 and 5.
Chapter 3 presents an extensive study on the characteristics of modern AMWs. These characteristics are evaluated against the characteristics of CMWs and some selected discontinuous transport systems. Based on the comparative evaluation, the competitiveness of AMWs and their potential area of application with regards to moderate distance transport are discussed.
The characteristics and behaviour of human in their capacity as passengers of AMWs are discussed in Chapter 4. Human characteristics are reviewed in relation to the system design. Behaviours that arise due to the interaction of pedestrians and passengers with the system are studied. With this information, how the passengers may influence the application aspects of long AMWs is discussed.
In Chapter 5, a case study on the application of AMWs in Amsterdam Airport Schiphol is presented. Two areas of application are considered, i.e intra‐terminal transport and inter‐terminal transport. The study provides an example on how the function and layout of a facility as well as the characteristics of the people in a location impose requirements and boundaries for the application of AMWs.
Part II, dealing with the second set of questions, consists of Chapters 6, 7 and 8.
A number of application aspects of long AMWs are selected in Chapter 6. These aspects are first discussed from the point‐of‐view of the drive system and how they relate to the AMW operating performance. An approach to apply a multiple‐drive configuration, as opposed to the current single‐drive configuration, is proposed. To evaluate the effect of the drive configuration, a moving walkway model is developed.
The first set of simulation cases is presented in Chapter 7. The performance of a long AMW is compared to that of a short AMW when both systems apply a single drive unit. The drives are controlled for equal load‐sharing. This represents the typical operation of nowadays systems. Then, the performance of a long AMW with multiple drives is investigated to obtain some comparisons. The simulation results are discussed in terms of the selected drive‐related application aspects.
In Chapter 8, the long multiple‐drive AMW is again simulated for the same cases as in Chapter 7. This time, the drives are controlled by regulating the voltage according

Chapter 1. Introduction 7
to the amount of load in each driven section. The results of the simulations are compared to those from the previous chapter. The proposed approach, i.e. the use of multiple drives and voltage control, is evaluated with regards to whether it brings benefit to the application aspects and performance of the long AMW.
Finally, Chapter 9 gives some concluding remarks on the result of the research, in line with the main research objective. Some recommendations and outlooks for further research are suggested.
The relationship between chapters in this thesis can be viewed in Figure 1.3.
Figure 1.3. Outline of this thesis, showing the relationship between chapters.
Part I
Part II
Chapter 3. Characteristics and comparative evaluation of
accelerating moving walkways
Chapter 4. Characteristics and behaviour of pedestrians as
passengers of accelerating moving walkways
Chapter 2. The story of accelerating moving walkways
Chapter 5. A study on the application of accelerating moving walkways in Amsterdam Airport
Schiphol
Chapter 6. Analysing drive‐related application aspects in long
accelerating moving walkways
Chapter 7. Performance of long accelerating moving walkway belts with single and multiple drives
Chapter 8. Performance of long multiple‐drive accelerating moving walkway belts with voltage control
Chapter 9. Conclusions and recommendations

8 Exploring aspects in the application of long accelerating moving walkways

9
Chapter 2
The story of accelerating moving walkways
2.1 Historical development
The first concept of a moving walkway was put forward in 1874 for an elevated moving platform in New York City (Richards, 1966). This proposal was followed by several others, adopting various designs and mechanisms. However, it was only in 1893 during the World’s Columbian Exposition in Chicago that the first moving platform operated to carry passengers. This system is presented in Figure 2.1.
(a) (b)
Figure 2.1. (a) The moving walkway at the 1893 World’s Columbian Exposition in Chicago consisted of a slow platform with hand‐posts and a faster platform with benches. (b) It was constructed to lessen the fatigue of visitors walking from the end of a pier into the fairground. (Figure (a) from Anon (1892), Figure (b) from Shepp and Shepp (1893))
The system consisted of two parallel wooden platforms operating at around 4.8 and 9.6 km/h (equals to 1.33 and 2.67 m/s). The slow platform was fitted with hand‐posts and was used solely for access to the faster one. Journeys on the fast platform were

10 Exploring aspects in the application of long accelerating moving walkways
carried out while sitting on benches. This elevated roof‐covered system was about 1,310 m long and was laid out on a great ellipse at the exposition site. It was driven by a number of 11 kW electric motors, placed at intervals along the underneath of the platform. The capacity of the system was 31,680 seated passengers per hour (P/h) (Tough and O’Flaherty, 1971).
The most ambitious and extensive installation in history was the moving platform at the Paris Exposition in 1900. As illustrated in Figure 2.2, the system ran in a one‐way elevated loop, covering a distance of 3,360 m. The system had two platforms moving at 3.6 and 7.2 km/h (1 and 2 m/s). The slow platform was 0.9 m wide, whereas the fast one was 2 m wide. Both were equipped with hand‐posts and the fast platform was additionally fitted with fencing and handrails. The fast platform had a maximum capacity of 57,600 P/h, although during operation it only carried a daily average of 31,000 P/h. A number of stations provided ticket offices and entry stairs to the system.
(a) (b)
Figure 2.2. (a) The extensive moving platform at the Paris Exposition in 1900 covered a distance of 3,360 m. (b) It was powered by 172 driving units distributed around the circuit, each of which transferring the drive force through reduction gears. (Figure (a) from Suplée (1900), Figure (b) from Anon (1900))
The above moving platform had 172 driving units distributed around the circuit, each of which was powered by a 3.7 kW DC electric motor. The driving units drove both platforms by transferring the drive force through reduction gears to a shaft with two different size traction wheels (Tough and O’Flaherty, 1971). The system ran for eight months and was used by 6.5 million people with a total of 40 minor accidents (Richards, 1966). A movie of the system in operation shows how easily people were

Chapter 2. The story of accelerating moving walkways 11
able to pass between the two platforms, regardless of their different speeds (Dailymotion, 2007).
2.2 Birth of conventional moving walkways
In 1948, New York City Transit Authority encouraged the idea to use passenger conveyors to alleviate congestions in both the surface and underground of the central of New York. What followed was the conception of the “Carveyor” by a joint venture of Goodyear Tyre and Rubber Company and Stephens‐Adamson Manufacturing Company. This was to be a system of cabins carried on roller conveyors, which would move slowly through stations and quickly between stations. The boarding of passengers into the cabins at a station was to be assisted by a rubber belt moving walkway running at the same speed as the cabins, parallel to the track. In the end, the Carveyor was only made into a model and a test unit, whereas the moving walkway found its way into installation at the Erie Station in Jersey City, New Jersey in 1954. This is, in fact, the first Conventional Moving Walkway (CMW) to be used as a practical permanent form of transport (Tough and O’Flaherty, 1971).
Following the above breakthrough up to this day, numerous CMWs have been designed and installed in many countries throughout the world. A considerable proportion of moving walkway installations are found in conjunction with transport facilities such as airports, rail/metro stations, bus terminals, parking areas and docks. There are also installations in shopping centres, exhibition grounds, amusement parks, sporting arenas and other pedestrian areas. The construction and mechanism of each design may vary quite considerably from one another, but they can generally be categorized into metal pallet systems and rubber belt systems.
The metal pallet systems developed based on standard escalator components and techniques, seeing that they closely resemble a flat escalator. The rubber belt systems evolved from industrial belt conveyors, putting more importance to the ride quality, particularly comfort, safety and stability. Owing to their typically short lengths, a single drive unit is normally used to power each system. The development and application of moving walkways are guided by standards, such as ASME A17.1 from the American Society of Mechanical Engineers (ASME) and EN 115 from the European Committee for Standardization (Comité Européen de Normalisation, CEN). These standards particularly emphasize on aspects of passenger safety.
2.3 Revival of high-speed moving walkways
Although CMWs appear to have found its niche in the transport market, the interest to have a transport system continuously moving at a speed higher than walking pace did not fade. Even since the 1960s, several ideas on how to achieve a higher transport speed have been proposed. In the 1970s and early 1980s, a few of these ideas were

12 Exploring aspects in the application of long accelerating moving walkways
made into prototypes and were tested. Although none of them were commercialized, their working principles were later adapted for subsequent Accelerating Moving Walkway (AMW) designs. Prototypes of these later designs were built and tested in the late 1990s and early 2000s. Based on the method used to achieve acceleration and deceleration, these systems can generally be categorized into the following groups: in‐line belts, sliding parallelograms, sliding pallets and accelerating/decelerating rollers with high‐speed belt.
2.3.1 In-line belts
A number of belt conveyors with slightly different speeds are placed one after another, end to end. The in‐line belts at the entrance have increasing speeds, such that they accelerate the passengers to a high‐speed belt conveyor in the middle section. Approaching the exit, another series of belts with decreasing speeds decelerate the passengers, see Figure 2.3. This mechanism was used in the Loderway system (Loder, 1998), which was tested for public use in Brisbane Airport, Melbourne Airport and Degraves Street Subway in Melbourne. A very similar system, named Speedmove, was also built by Fujitec (Kazuo et al., 2003).
2.3.2 Sliding parallelograms
A series of parallelogram pallets form a continuous treadway. At the entrance, the pallets move at a low speed for a short distance. Then, while continuing to move forward, each pallet begins to slide progressively sideways with regard to the pallet behind it. The resultant of the forward moving and the sideway sliding creates an accelerating speed, see Figure 2.4. The pallets will stop sliding sideways once they reach the target high speed. The method is reversed for deceleration at the exit. This mechanism was used in the Dunlop Speedaway (Todd, 1974), which was installed for public trial at the Expo ’70 in Osaka, Japan, and at the Battelle Institute in Geneva, Switzerland. The Mitsubishi Speedwalk (Shirakihara, 1997), which was demonstrated at the Seaside Park in Fukuoka, Japan, also adopted this mechanism.
2.3.3 Sliding pallets
There are a number of different variations in the way the pallets slide. One system accelerated and decelerated individual main pallets by sliding them over continuous auxiliary pallets (Ikizawa et al., 2001). Another design used an array of pallets that slightly overlap one on top of the previous at the entrance, each of which then progressively slides forward to accelerate passengers (Abe et al., 2001). These two systems were only tested in the factory. The more successful variation is the TurboTrack system (Gonzalez‐Alemany and Cuello, 2003), which employs auxiliary pallets and main pallets, see Figure 2.5. The auxiliary pallets ‘hide’ underneath the main pallets at the entrance and exit, and progressively extend or retract to accelerate

Chapter 2. The story of accelerating moving walkways 13
or decelerate the passengers. The auxiliary pallets are fully extended at the high‐speed section, forming a continuous treadway with the main pallets. This system is now installed at the Toronto Pearson International Airport in Canada.
(a) (b)
Figure 2.3. (a) The Loderway AMW system uses in‐line belts. (b) A number of belt conveyors with slightly different speeds are placed end to end to achieve acceleration or deceleration. (Figures courtesy of Elevator World)
Figure 2.4. The Mitsubishi Speedwalk uses parallelogram pallets forming an S‐shape treadway. At the curves, the sideway sliding and the forward moving of each pallet results in an accelerating or decelerating speed. (Figures courtesy of Elevator World)
2.3.4 Accelerating/decelerating rollers with high-speed belt
In this mechanism, a ‘carpet’ of metal rollers at the entrance accelerates passengers onto a high‐speed belt conveyor. Approaching the exit, another series of metal rollers decelerates the passengers, see Figure 2.6. The mechanism is adopted by the Gateway system (Cote and Gempp, 1997), which was installed in 2002 for public demonstration in the Paris Montparnasse metro station. This system continues to operate today after passing the test period.

14 Exploring aspects in the application of long accelerating moving walkways
(a) (b)
Figure 2.5. (a) At the entrance and exit, the TurboTrack looks like present‐day metal‐pallet CMWs. (b) However, its sliding pallet mechanism enables it to extend and retract each pallets for accelerating or decelerating the passengers. (Figure (a) courtesy of Gabriel Lodewijks, Figure (b) courtesy of ThyssenKrupp Elevator AG)
(a) (b)
Figure 2.6. (a) The Gateway system applies a carpet of metal rollers to accelerate passenger onto a high‐sped belt conveyor; the reverse happens at the exit. (b) Transition from and to the metal rollers is assisted by a metal plate. (Figure (a) courtesy of Gabriel Lodewijks, Figure (b) courtesy of BBC)
As with CMWs, the designs of high‐speed moving walkways also have to adhere to the safety guidelines. However, the available standards generally refer to the conventional systems. In EN 115‐1:2008 (CEN, 2008), for example, only a few additional remarks on very few clauses are given for the case of accelerating systems. The latest ASME A17.1‐2007 (Donoghue, 2007) hardly gives any note on AMWs.

Chapter 2. The story of accelerating moving walkways 15
However, an appendix about these systems was included in the 1981 edition of this standard (Donoghue, 1981). Eventually, AMWs must be developed with strict adherence of the rules but, as has been mentioned in the standards, some clauses may be relaxed under certain circumstances at the discretion of the enforcing authority.
2.4 Conclusions
This chapter has presented a brief overview of (high‐speed) moving walkways since the first ever development until now. Compared to high‐speed moving walkways in the old days, the change of speed in modern AMWs is carried out in the same direction to the travel. This is advantageous from the point‐of‐view of space utilization, since the system does not need a large surface area for its installation. The modern AMW systems described in this chapter have all been built into prototypes and have been tested in the factory as well as in public sites for transporting passengers. A number of prototypes were only demonstrated for a certain period of time, typically up to around six month. Currently two AMW systems are operating, one in Paris and one in Toronto. The AMW system in Toronto, which is based on the sliding pallets mechanism, looks more like a CMW at its entrance. This may give more confidence for passengers to step in. The system in Paris starts with the accelerating roller mechanism, so it may be unfamiliar for passengers who use it for the first time. However, with regards to the idea of long AMWs, the belt‐based AMW system in Paris is considered to have a better possibility for extension due to the fact that very long belt conveyors are already a common practice, particularly in the mining industries. This can provide analogy for the case of long AMW belts. Therefore, in the second part of this thesis, the belt‐based AMW system is taken as the focus of analysis.

16 Exploring aspects in the application of long accelerating moving walkways

17
Chapter 3
Characteristics and comparative evaluation of accelerating moving walkways*
3.1 Introduction
Accelerating Moving Walkways (AMWs) are transport systems that continuously move passengers by accelerating them from a relatively low speed at the entrance to a higher speed at the middle section, and then decelerating them to a relatively low speed again at the exit. These systems were developed with the aim to fulfil the demand for a people mover that can bridge the so‐called gap between short and moderate distance transport (Abe et al., 2001; Gonzalez‐Alemany and Cuello, 2003; Gonzalez‐Alemany et al., 2007; Saeki, 1996; Shirakihara, 1997).
When planning for a transportation project, a modal alternative analysis is normally conducted to determine the most suitable transport mode for the particular application. A number of different transport modes are considered in the analysis. This implies that different transport modes generally have somewhat overlapping areas of application, and the choice for a specific transport mode is only taken after detail evaluation of the system characteristics against the type of application. In order to identify the potential area of application of AMWs, in which they can be considered in modal alternative analyses, an understanding of the characteristics of the system is necessary.
In this chapter, the characteristics of present day AMWs are reviewed. These characteristics are comparatively evaluated against the characteristics of other transport systems that may serve short and moderate distance transport. At the
* Part of this chapter is based on: Kusumaningtyas, I. and Lodewijks, G. (2008), “Accelerating Moving Walkway: A review of the characteristics and potential application”, Transportation Research Part A: Policy and Practice 42(4), 591–609.

18 Exploring aspects in the application of long accelerating moving walkways
lower boundary, there is the Conventional Moving Walkways (CMWs). At the upper boundary, there can be a number of discontinuous transport systems such as buses, light rails, Automated People Movers (APMs), and Personal Rapid Transits (PRTs). Through this comparative evaluation, I discuss the competitiveness of present day AMWs and, thereby, identify the circumstances in which these systems can be potentially applied.
The remainder of this chapter is structured as follows. In Section 3.2, the approach used for the collection of transport system characteristic data is explained. These data are then presented in Section 3.3. The comparative evaluation of the transport system characteristics, carried out from the perspective of AMWs, is discussed in Section 3.4. The conclusions in Section 3.5 sum up the discussion.
3.2 Research approach
3.2.1 Scope of analysis
This chapter confines the discussion of people transport systems to buses, light rails, APMs, PRTs, CMWs and AMWs. The first four modes can be categorized as discontinuous people movers, whereas the last two modes are continuous. These transport systems were selected based on the consideration that they have the potential to provide high‐capacity mass transit. The array of transport systems represents a rather wide area of application, which may be uncommon for the present image of moving walkways. However, it is the intention of this chapter to evaluate further possibilities for AMW applications.
A number of characteristics are selected as the criteria for evaluation. The performance of a transport system is usually measured by its passenger capacity and speed (Fouracre et al., 2003). These technical characteristics are important criteria in this study. Transport planners and operators always look at passenger capacity to determine whether the transport system can fulfil the demand. Speed is considered since it is one of the factors that determine the total travel time. The financial characteristics, comprising of capital cost and operational cost, also become criteria for evaluation. Clearly, costs are always a major concern in any transport system development and operation.
Additional characteristics to be considered include the required corridor width for a two‐way system, headway, stop spacing, safety and environmental impacts, including energy use. The required corridor width is determined by the width of the vehicle and the track gauge. It is related to land‐use, which eventually relates also to the capital cost. Furthermore, it is especially of interest if the transport system needs to be installed in a limited space or in an already built‐up environment. Headway represents the frequency‐of‐service of the systems, which has influence on the passenger waiting time. Stop spacing determines the accessibility of the transport

Chapter 3. Characteristics and comparative evaluation of AMWs 19
system and the passenger walking time. It also influences the average speed of the transport system. Safety is considered by both operators and users when choosing which transport mode to develop, operate or use. Finally, the environmental impact and energy consumption of transport systems are becoming a greater concern. People are now more aware of these issues due to the increase of pollution and congestion, and the scarcity of non‐renewable energy resources.
3.2.2 Selection of data
Travel time is determined by the travel distance and the transport speed. The transport speed used for the analysis in this chapter is the average speed of the transport system. It is mainly influenced by the number of stops and the distance between stops, and not so much by the maximum speed. Because of the intermediate stops, discontinuous transport systems seldom operate at their maximum speed. Therefore, comparing the maximum speed would not give a proper representation of their actual operation. However, a CMW only operates at a single speed, so I record this speed for the analysis. As for AMWs, the speed at the high‐speed section is used considering that this section forms the longest part of the system, implying that passengers will be transported at this speed for most of the travel time.
The capacity mainly discussed in this paper is the maximum system capacity, unless stated otherwise. The maximum system capacity is calculated based on the assumption that the system is fully loaded and running at the minimum headway. This is actually difficult to achieve in practice since a transport system is seldom able to operate in this manner. Many factors contribute to the lower practical capacity such as uneven passenger demand during the peak hour, day‐to‐day fluctuation in demand (e.g. workdays and weekends, or due to seasons, weather, and special events), varying standing densities of the passengers, dwell time at stops, junction capacities, junction priorities, grades and curves in the route, maintenance, unplanned events (e.g. propulsion failure, track failure, equipment failure, accidents), and, as in the case of light rails and APMs, uneven loading of cars within a train and signalling restrictions (Commission for Integrated Transportation (CfIT), 2005; Parkinson and Fisher, 1996). The data of practical capacity is, however, not always available in literatures. CfIT (2005) suggests that 75% of the theoretical capacity should be assumed for the practical capacity. For a moving walkway, Turner (1998) proposes that 50% of the theoretical capacity would be a reasonable estimate.
The capital cost analysis focuses on capital cost per kilometre, which is derived by dividing the total cost for completing the system by the number of kilometres. The cost per kilometres was used as the measure because it presents comparable information on a common basis. The capital cost in this paper covers the cost of land and utilities, infrastructures, and vehicles. For the operational cost, I included the cost per passenger‐km and the cost per vehicle‐km. The cost per passenger‐km is a

20 Exploring aspects in the application of long accelerating moving walkways
suitable measure to represent the operational cost of an AMW system because the passenger‐km of an AMW, which is the sum of the trip distances travelled by all passengers, can be easily calculated. The cost per vehicle‐km of a moving walkway system is more difficult to determine since, firstly, moving walkways do not consist of vehicles (although it is possible to assume a moving walkway as one). Secondly, it is more complicated to determine the total distance that has been ‘travelled’ by the treadway of the moving walkway when it is in service. However, it has the advantage that it avoids uncertainty inherent in average load factors. Due to this reason, I decided to also look into the cost per vehicle‐km. The operational cost generally covers staff‐related costs, vehicle operational costs, and vehicle and infrastructure maintenance costs (Brand and Preston, 2003a).
The data on capital cost and operational cost were taken from different years. To have consistency in the comparative analysis, the capital and operational costs were then projected into 2005 US dollars using the appropriate Consumer Price Index (CPI). It must be noted, though, that there is a difficulty regarding cost comparison between existing systems and new systems. Existing systems such as buses, light rails, APMs and CMWs could benefit from some economies of scale and a learning effect. They have experienced a longer period of development and operation, which may lead to falling unit costs. PRTs and AMWs, being almost totally new systems, are more prototype‐like. Hence, they will normally yield higher unit costs. On the other hand, there is a risk that some forms of operational costs might be underestimated due to the lack of a long period of operating experiences. Thus, there is a certain degree of uncertainty with regards to the true long term costs for PRT and AMW systems (Tegner, 2003). Unfortunately, this cannot be avoided at the moment.
The characteristics of each type of transport system can vary widely due to the diverse conditions and features of every installation. Hence, data obtained from the reviewed literatures are used to determine the range of values of the system characteristics. The data from the literatures were noted and compiled, and then the range of values for each characteristic was approximated.
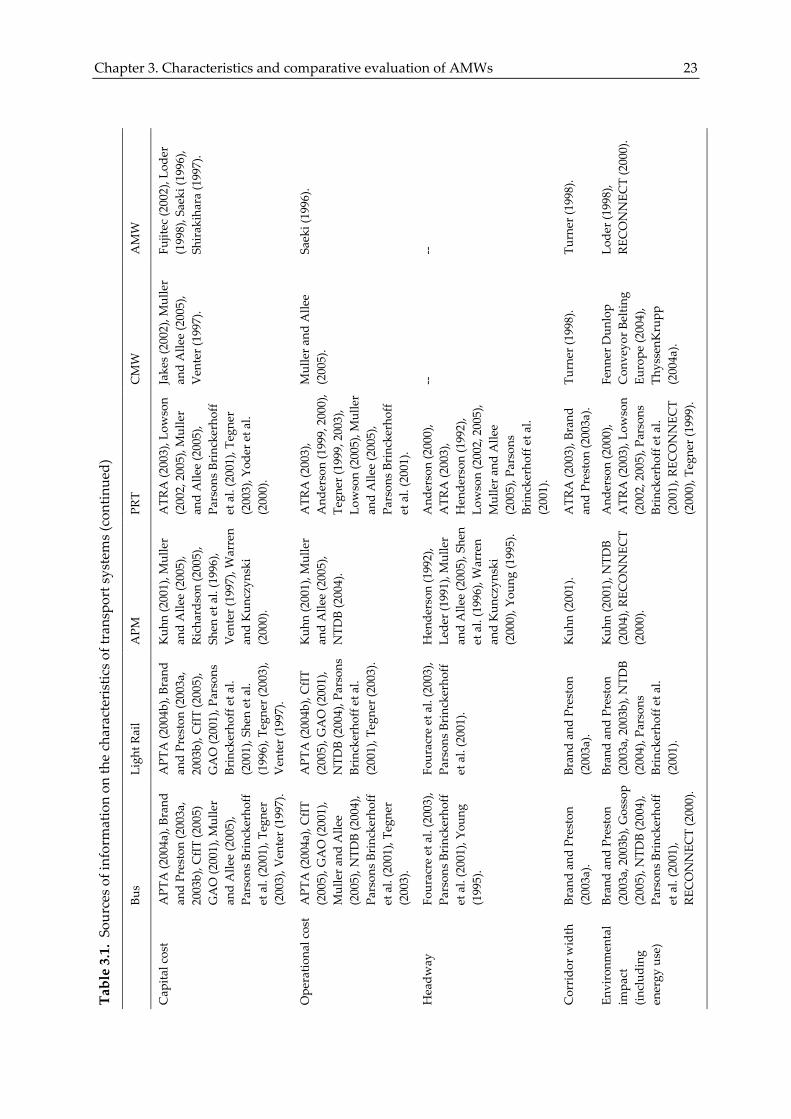
The characteristics of the observed transport systems are described in the next section. The sources of the characteristic data are clustered according to the type of transport systems and the criteria of evaluation, as presented in Table 3.1.
3.3 Characteristics of the selected transport systems
3.3.1 Bus
Buses are rubber‐tired vehicles with drivers, which operate mostly on roads, either in mixed traffic, bus lanes, or busways, see Figure 3.1. Buses in mixed traffic contribute to congestion, which in turn may cause delays for the buses themselves. Bus lanes and busways give the buses right‐of‐way. However, bus lanes are usually built as
Chapter 3. Characteristics and comparative evaluation of AMWs 21
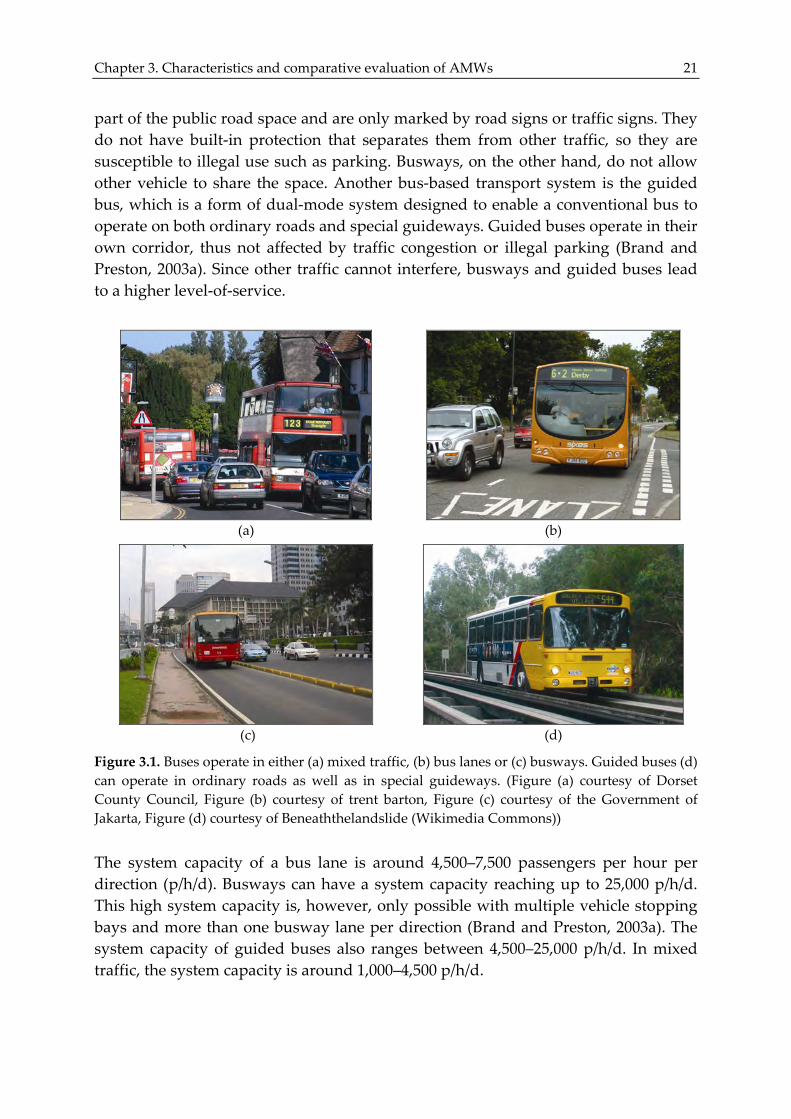
part of the public road space and are only marked by road signs or traffic signs. They do not have built‐in protection that separates them from other traffic, so they are susceptible to illegal use such as parking. Busways, on the other hand, do not allow other vehicle to share the space. Another bus‐based transport system is the guided bus, which is a form of dual‐mode system designed to enable a conventional bus to operate on both ordinary roads and special guideways. Guided buses operate in their own corridor, thus not affected by traffic congestion or illegal parking (Brand and Preston, 2003a). Since other traffic cannot interfere, busways and guided buses lead to a higher level‐of‐service.
(a) (b)
(c) (d)
Figure 3.1. Buses operate in either (a) mixed traffic, (b) bus lanes or (c) busways. Guided buses (d) can operate in ordinary roads as well as in special guideways. (Figure (a) courtesy of Dorset County Council, Figure (b) courtesy of trent barton, Figure (c) courtesy of the Government of Jakarta, Figure (d) courtesy of Beneaththelandslide (Wikimedia Commons))
The system capacity of a bus lane is around 4,500–7,500 passengers per hour per direction (p/h/d). Busways can have a system capacity reaching up to 25,000 p/h/d. This high system capacity is, however, only possible with multiple vehicle stopping bays and more than one busway lane per direction (Brand and Preston, 2003a). The system capacity of guided buses also ranges between 4,500–25,000 p/h/d. In mixed traffic, the system capacity is around 1,000–4,500 p/h/d.

22 Exploring aspects in the application of long accelerating moving walkways
AMW
Abe et al. (2001),
Brow
ning (1
974), C
ote
and Gem
pp (1
997),
Don
oghu
e (1981),
Fujitec (2
002),
Gon
zalez‐Aleman
y an
d Cue
llo (2
003),
Hende
rson (1
992),
Ikizaw
a et al. (2001),
Lode
r (1998),
RECONNEC
T (2000),
Saeki (1996),
Shirakihara (1997),
Turner (1
998).
Abe et al. (2001),
Brow
ning (1
974),
Ikizaw
a et al. (2001),
Lode
r (1998), Saeki
(1996), Shirakiha
ra
(1997), T
urner (1998).
‐‐ Don
oghu
e (1981),
Ikizaw
a et al. (2001),
Lode
r (1998), Saeki
(1996), Shirakiha
ra
(1997).
CMW
CEN (1
998),
Don
oghu
e (1981),
Fruin (1992), K
ittelson
& Associates et al.
(2003), L
eder (1
991),
Toug
h an
d O’Flaherty
(1971), T
urner (1998),
Youn
g (1995).
CEN (1
998), Fruin
(1992), K
ittelson &
Associates et al.
(2003), L
eder (1
991),
Turner (1
998), Y
oung
(1995).
‐‐ CEN (1
998),
Don
oghu
e (1981).
PRT
ATR
A (2
003), B
rand
and Preston (2003a,
2003b), H
ende
rson
(1992), L
owson (2003,
2005), Muller a
nd
Allee (2005), P
arsons
Brinckerho
ff et al.
(2001), R
ECONNEC
T (2000), T
egner (1999),
Warren an
d Kun
czyn
ski (2000).
And
erson (2000),
ATR
A (2
003), B
rand
and Preston (2003a,
2003b), H
ende
rson
(1992), L
owson (2002,
2005), Muller a
nd
Allee (2005), P
arsons
Brinckerho
ff et al.
(2001).
Lowson (2002, 2005).
And
erson (1999, 2000),
ATR
A (2
003), P
arsons
Brinckerho
ff et al.
(2001).
APM
Hende
rson (1
992),
Kuh
n (2001), L
eder
(1991), L
owson (2003),
Muller a
nd Allee
(2005), R
ECONNEC
T (2000), R
icha
rdson
(2005), Shen et al.
(1996), W
arren an
d Kun
czyn
ski (2000),
Youn
g (1995).
Hende
rson (1
992),
Kuh
n (2001), L
eder
(1991), M
uller a
nd
Allee (2005),
Richardson (2
005),
Shen et a
l.(1996),
Warren an
d Kun
czyn
ski (2000),
Youn
g (1995).
Kuh
n (2001), L
owson
(2003), W
arren an
d Kun
czyn
ski (2000).
Kuh
n (2001), Shen et
al. (1996).
Ligh
t Rail
Bran
d an
d Preston
(2003a, 2003b),
Fouracre et a
l. (2003),
GAO (2
001), K
ittelson
& Associates et al.
(2003), K
uhn (2001),
Lowson (2003),
Parson
s Brinckerho
ff et al. (2001).
Bran
d an
d Preston
(2003a, 2003b), CfIT
(2005), Fou
racre et al.
(2003), K
uhn (2001),
Parson
s Brinckerho
ff et al. (2001).
Fouracre et a
l. (2003),
Lowson (2003).
Bran
d an
d Preston
(2003a, 2003b),
Parson
s Brinckerho
ff et al. (2001).
Bus
Bran
d an
d Preston
(2003a, 2003b),
Fouracre et a
l. (2003),
GAO (2
001), G
ossop
(2005), K
ittelson &
Associates et al.
(2003), L
owson (2003),
Parson
s Brinckerho
ff et al. (2001),
RECONNEC
T (2000),
Youn
g (1995).
Bran
d an
d Preston
(2003a, 2003b), CfIT
(2005), Fou
racre et al.
(2003), L
eder (1
991),
Parson
s Brinckerho
ff et al. (2001), Y
oung
(1995).
Fouracre et a
l. (2003),
Lowson (2003).
Bran
d an
d Preston
(2003a, 2003b), Gossop
(2005), P
arsons
Brinckerho
ff et al.
(2001).
Table 3.1. Sou
rces of information on th
e characteristics of tran
sport systems
Speed
Cap
acity
Stop spa
cing
Safety
Chapter 3. Characteristics and comparative evaluation of AMWs 23
AMW
Fujitec (2
002), L
oder
(1998), Saeki (1
996),
Shirakihara (1997).
Saeki (1996).
‐‐ Turner (1
998).
Lode
r (1998),
RECONNEC
T (2000).
CMW
Jakes (2002), M
uller
and Allee (2005),
Venter (1997).
Muller a
nd Allee
(2005).
‐‐ Turner (1
998).
Fenn
er Dun
lop
Con
veyo
r Beltin
g Eu
rope (2
004),
ThyssenK
rupp
(2004a).
PRT
ATR
A (2
003), L
owson
(2002, 2005), M
uller
and Allee (2005),
Parson
s Brinckerho
ff et al. (2001), T
egner
(2003), Y
oder et a
l. (2000).
ATR
A (2
003),
And
erson (1999, 2000),
Tegn
er (1
999, 2003),
Lowson (2005), M
uller
and Allee (2005),
Parson
s Brinckerho
ff et al. (2001).
And
erson (2000),
ATR
A (2
003),
Hende
rson (1
992),
Lowson (2002, 2005),
Muller a
nd Allee
(2005), P
arsons
Brinckerho
ff et al.
(2001).
ATR
A (2
003), B
rand
and Preston (2003a).
And
erson (2000),
ATR
A (2
003), L
owson
(2002, 2005), P
arsons
Brinckerho
ff et al.
(2001), R
ECONNEC
T (2000), T
egner (1999).
APM
Kuh
n (2001), M
uller
and Allee (2005),
Richardson (2
005),
Shen et a
l. (1996),
Venter (1997), Warren
and Kun
czyn
ski
(2000).
Kuh
n (2001), M
uller
and Allee (2005),
NTD
B (2004).
Hende
rson (1
992),
Lede
r (1991), Muller
and Allee (2005), Shen
et al. (1996), W
arren
and Kun
czyn
ski
(2000), Y
oung (1
995).
Kuh
n (2001).
Kuh
n (2001), N
TDB
(2004), R
ECONNEC
T (2000).
Ligh
t Rail
APT
A (2
004b), Bran
d an
d Preston (2003a,
2003b), C
fIT (2005),
GAO (2
001), P
arsons
Brinckerho
ff et al.
(2001), Shen et al.
(1996), T
egner (2003),
Venter (1997).
APT
A (2
004b), CfIT
(2005), G
AO (2
001),
NTD
B (2004), P
arsons
Brinckerho
ff et al.
(2001), T
egner (2003).
Fouracre et a
l. (2003),
Parson
s Brinckerho
ff et al. (2001).
Bran
d an
d Preston
(2003a).
Bran
d an
d Preston
(2003a, 2003b), NTD
B (2004), P
arsons
Brinckerho
ff et al.
(2001).
Bus
APT
A (2
004a), Bran
d an
d Preston (2003a,
2003b), C
fIT (2005)
GAO (2
001), M
uller
and Allee (2005),
Parson
s Brinckerho
ff et al. (2001), T
egner
(2003), V
enter (1997).
APT
A (2
004a), CfIT
(2005), G
AO (2
001),
Muller a
nd Allee
(2005), N
TDB (2004),
Parson
s Brinckerho
ff et al. (2001), T
egner
(2003).
Fouracre et a
l. (2003),
Parson
s Brinckerho
ff et al. (2001), Y
oung
(1995).
Bran
d an
d Preston
(2003a).
Bran
d an
d Preston
(2003a, 2003b), Gossop
(2005), N
TDB (2004),
Parson
s Brinckerho
ff et al. (2001),
RECONNEC
T (2000).
Table 3.1. Sou
rces of information on th
e characteristics of tran
sport systems (con
tinue
d)
Cap
ital cost
Ope
ratio
nal cost
Headw
ay
Corrido
r width
Environm
ental
impa
ct
(includ
ing
energy use)

24 Exploring aspects in the application of long accelerating moving walkways
At airports, buses usually operate on terminal frontage and circulation roadways on a non‐exclusive basis. In some cases, buses may also be used for transporting passengers to and from the airport apron, see Figure 3.2. Depending on the headway, the system capacity of airport buses can reach 1,500 p/h/d (Leder, 1991). The lower system capacity is partly influenced by the more spacious interior, which is required to accommodate baggage.
(a) (b)
Figure 3.2. In airports, buses may operate (a) at the landside, such as for car park shuttle, or (b) at the airside for apron transfer. (Figure (a) courtesy of Sidney Keyles (www.photobucket.com), Figure (b) courtesy of Sergei Polomskihh (www.bus‐photo.net))
Bus stops in mixed traffic and bus lanes are usually built with spacing between 200–600 m. Lowson (2003) used a model to calculate the optimum stop spacing for buses, which yield to a value of 500 m. This resembles the average stop spacing used by buses in city operations, although a typically closer stop separation will occur in the city centre. The short separations between stops are useful to minimize walking times of passengers, but they lead to a significant reduction in the average speed (Lowson, 2003; Warren and Kunczynski, 2000).
The average bus speed in mixed traffic is around 15–20 km/h, while in bus lanes and busways it is around 15–25 km/h and 22–50 km/h, respectively (Brand and Preston, 2003a, 2003b). For guided buses, the average speed is between 30–50 km/h. The higher speed for busways and guided buses is achieved because of the lower stop densities. For busways and guided buses, the stop spacing is usually around 500–1,000 m. However, the average speed of all bus‐based systems is far below the maximum speed, which, depending on the local regulation, can reach up to 100 km/h. Buses can have a minimum headway of 60 s, but 10–30 minutes is more practical.
The capital cost for a bus‐based system intended for mixed traffic is low, mainly because it makes use of existing roads. The capital cost for such a system can be between $0.14–6.75 million/km (Government Accountability Office (GAO), 2001). On

Chapter 3. Characteristics and comparative evaluation of AMWs 25
the other hand, the construction of dedicated bus lanes or exclusive right‐of‐ways involves high capital costs and displaces valuable roadway space. Interpolation of data from existing sites gives an estimate that the capital cost of a bus lane and busway system is around $1.14–26.41 million/km and $4.38–38.65 million/km, respectively (CfIT, 2005; GAO, 2001). For the guided bus, the capital cost ranges between $2–7 million/km, which is somewhat lower than for bus lanes and busways. This is due to the limited number of guided bus systems in the world, constituting only 25 km of guided bus tracks. Hence, the data of capital cost for guided buses are only based on these existing systems.
The operational cost for buses can range between $0.09–0.95/passenger‐km and $1.22–14.75/vehicle‐km (American Public Transportation Association (APTA), 2004a; GAO, 2001). Distinctive data of the operational costs for each type of bus‐based system was not available. One of the factors that contribute to the operational cost for buses is the high requirements for personnel, consisting of drivers, administrative staffs, and maintenance workers. Each vehicle may require five or more drivers and other support staff to provide the necessary full day service every day of the year (Lowson, 2005; Warren and Kunczynski, 2000).
The energy use of buses varies between 0.3–1.56 MJ/passenger‐km (Brand and Preston, 2003a; Lowson, 2002). Until today, most buses are still operated by diesel engines, which cause relatively high pollution. With ultra low sulphur diesel (ULSD) and exhaust treatment technology, the emissions from diesel engines can be reduced. Bus‐based systems produce a noise level around 70–84 dB(A) (Brand and Preston, 2003b; Parsons Brinckerhoff et al., 2001). For guided buses, noise levels are perceptibly lower on the guideway than on normal roads, at around 56–59 dB(A) (Gossop, 2005).
Buses are considered quite flexible because they can fit in any demanding space constraints, can respond to differences in service needs, and can be easily reconfigured. The required corridor width for a two‐way bus system in mixed traffic is around 6–8.5 m, which refers to a minimum road width. For buses in bus lanes, busways, and guided buses, the corridor width is 6–8 m, 8–13 m, and 5.8–6.2 m, respectively (Brand and Preston, 2003a). Buses are considered relatively safe. However, the passenger safety of conventional bus systems is said to be lower when compared to bus lanes and segregated bus systems on their own right‐of‐way. Unfortunately, buses generally have poor public image. They are often considered uncomfortable, especially when they operate near or at their nominal capacity. Sometimes passengers have to stand in a crowded space during the trip. In airport applications, it is tedious to enter and exit a bus while carrying luggage. Buses are also not very suitable for accommodating indeterminate passenger arrivals. In such situations, the frequency of the bus must be high in order to provide an adequate level‐of‐service, resulting in buses running with very small loads. Another drawback

26 Exploring aspects in the application of long accelerating moving walkways
is the long waiting time, which sometimes causes the total trip time to be not much quicker than walking.
3.3.2 Light rail
A light rail is a rail‐based system that can operate in mixed traffic on tracks on ordinary roads, or on segregated tracks with either a longitudinal right‐of‐way or a full right‐of‐way, see Figure 3.3. The application of light rails in mixed traffic may face interference from other road users, which can deteriorate the rapidity and reliability of the service. Thus, light rail operates best when fully segregated from other traffic, but this will significantly increase the cost.
The distance between stops in a light rail network can be between 250–1,000 m, with an average of about 500 m. A stop spacing of 250 m is considered exceptional. Based on his model, Lowson (2003) suggested that the optimum spacing should be around 750 m. A light rail has a maximum speed of 80–90 km/h, which is seldom achieved due to the short stop spacing. The average speed is around 15–25 km/h for light rails operating in mixed traffic and around 21–45 km/h in segregated tracks (Brand and Preston, 2003a). The design capacity can vary widely according to the system’s arrangements (i.e. the number of trains, the number of cars per train, and the headway), ranging from 1,000–30,000 p/h/d (Brand and Preston, 2003b; Fouracre et al., 2003). Light rails can have a minimum headway of 60 s, although a 10–30‐minute headway is more typical in practice.
The cost of a light rail system can differ a lot due to the great variety of features that the system may offer. The capital costs can vary between $8.5–83.5 million/km (GAO, 2001). High capital costs arise in systems that include tunnel sections. The required corridor width for a two‐way light rail system is 5–6.5 m. The construction of a light rail system is difficult to modify once it has been fixed in place. Therefore, careful planning, including for future expansion, is important. The operational cost of light rails is around $0.15–5.42/passenger‐km and $2.95–22.44/vehicle‐km (APTA, 2004b; GAO, 2001).
The energy use of light rails is estimated to be between 0.7–2.5 MJ/passenger‐km (Brand and Preston, 2003a; Lowson, 2002). Light rails are powered by electric propulsion and, therefore, are environmentally friendly. Noise levels for light rail are relatively low at about 60–74 dB(A) (Brand and Preston, 2003a; Parsons Brinckerhoff et al., 2001). However, ground vibration due to the operation of light rails may affect the surroundings.
Light rails are considered a reliable and safe mode of transport that can handle high capacity of people. Its capacity can be increased with a lower increase in operational cost because each light rail train, no matter what number of cars, can be operated by just one person. Light rails give maximum advantage for high volumes of passengers. For smaller number of passengers, their advantage relative to buses is minimal. The

Chapter 3. Characteristics and comparative evaluation of AMWs 27
odds of travelling in a crowded vehicle while standing and the difficulties of entering and exiting with luggage, just as in buses, may also happen when using light rails. Nevertheless, they are considered more comfortable than buses.
(a) (b)
Figure 3.3. Light rails operate in (a) mixed traffic or (b) on segregated tracks with right‐of‐way. (Figure (a) courtesy of Light Rail Now, Figure (b) compliments of Bombardier Transportation)
3.3.3 Automated people mover
An Automated People Mover (APM) is a mode of public transport, which consists of discrete vehicles that have automatic (driverless) control, use specialized guideways, and operate on exclusive right‐of‐way. APMs are usually found in the form of trains consisting of one or more cars. Each train operates on a single route that can have intermediate stations. These systems generally serve relatively small areas such as airports and downtown districts, see Figure 3.4. In few cases, however, APMs are also used for transport over a much wider area.
(a) (b)
Figure 3.4. Automated People Movers generally serve relatively small areas such as (a) airports and (b) downtown districts. (Figures compliments of Bombardier Transportation)

28 Exploring aspects in the application of long accelerating moving walkways
The system capacity ranges from 1,000–30,000 p/h/d. The maximum speed of APMs can reach up to 90 km/h. However, if an APM has to stop at a number of intermediate stations that are separated only in short distances, or if the track incorporates many curves, the maximum speed is hardly achieved. The distance between stops can be between 500–1,500 m, with an optimum spacing of 750 meter (Lowson, 2003; Warren and Kunczynski, 2000). This leads to an average speed of around 15–50 km/h. APMs typically have headways between 60–180 s.
When constructing an APM system, attention should be given to their integration with other elements, especially if they are to be installed in a built‐up environment. The required corridor width for a two‐way APM system is around 4.4–6.5 m (Kuhn, 2001). Most APMs are located on elevated structures or underground, so vertical transport facilities such as elevator, escalator, or moving ramps are required. Furthermore, they need stations, equipment rooms, a central control area, and maintenance facilities. Hence, the capital costs for APMs are high. They also require high level of maintenance. The capital cost of existing APM systems vary widely between $12.5–147.9 million/km (Jakes, 2002; Richardson, 2005; Shen et al., 1996). However, over the years, the cost for a new APM system steadily increased, both in terms of capital cost and continuing operational and maintenance costs (Jakes, 2002; Venter, 1997; Warren and Kunczynski, 2000). As a result, many new projects cannot afford to include APMs in their transportation plans. The operational cost of an APM can vary around $0.15–11.77/passenger‐km (National Transit Database (NTDB), 2004; Tegner, 2003). In terms of cost per vehicle‐km, it is around $10.1–45.6/vehicle‐km (NTDB, 2004).
Due to its electric propulsion, APM operations can be regarded as local pollution‐free. Noise emission of APMs is perceived to be around 54–72 dB(A) (Kuhn, 2001; RECONNECT, 2000). However, ground vibrations can occur due to APM operations. Data on APM energy use is very limited. Based on data of three systems, it is found that the energy consumption of APMs ranges between 1.62–12.78 MJ/passenger‐km (NTDB, 2004). The higher value of energy use is exceptional, which happened due to relatively low passenger‐km in the corresponding corridor. The average energy use was found to be around 2.66 MJ/passenger‐km.
APMs in general have high passenger acceptance due to their high safety and service record. APM systems are also quite flexible to modify. Many APM projects are designed for future expansion. If no guideway is added in the expansion, the system capacity can be changed by modifying the number of trains, the number of cars per train, or the headway.
3.3.4 Personal rapid transit
A Personal Rapid Transit (PRT) is another type of automatic control (driverless) vehicle, aimed for public transport. It takes the form of a small vehicle, available for
Chapter 3. Characteristics and comparative evaluation of AMWs 29
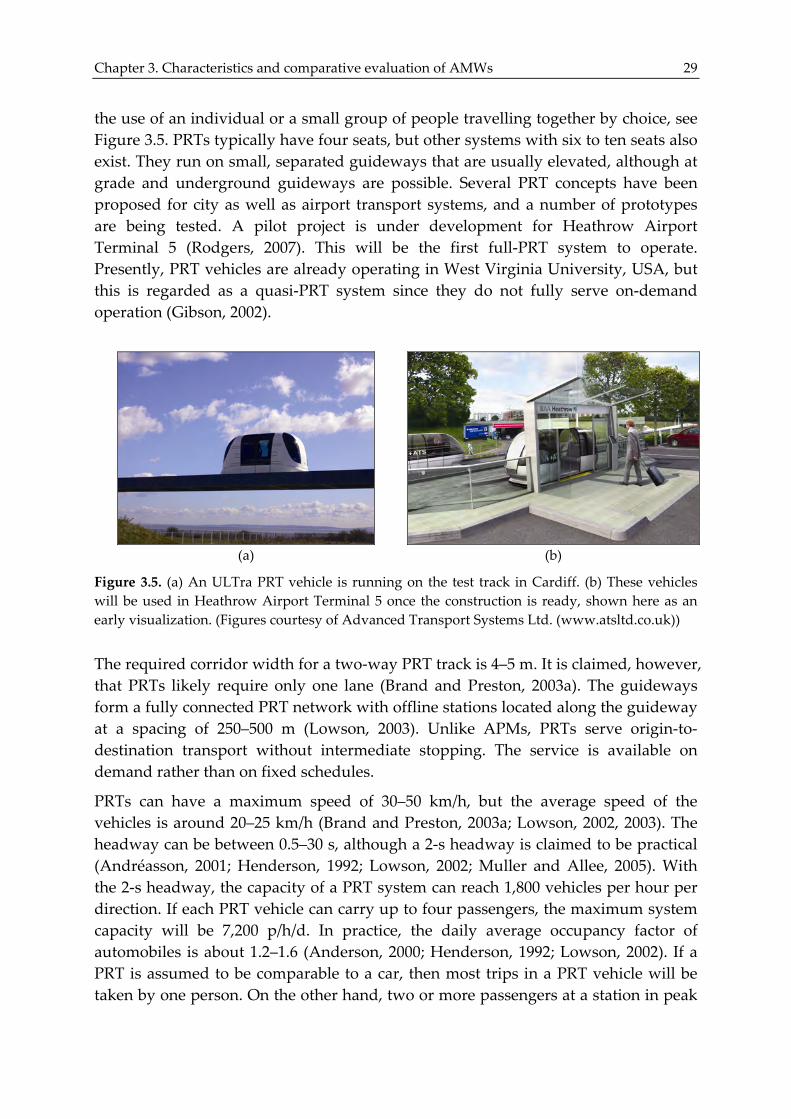
the use of an individual or a small group of people travelling together by choice, see Figure 3.5. PRTs typically have four seats, but other systems with six to ten seats also exist. They run on small, separated guideways that are usually elevated, although at grade and underground guideways are possible. Several PRT concepts have been proposed for city as well as airport transport systems, and a number of prototypes are being tested. A pilot project is under development for Heathrow Airport Terminal 5 (Rodgers, 2007). This will be the first full‐PRT system to operate. Presently, PRT vehicles are already operating in West Virginia University, USA, but this is regarded as a quasi‐PRT system since they do not fully serve on‐demand operation (Gibson, 2002).
(a) (b)
Figure 3.5. (a) An ULTra PRT vehicle is running on the test track in Cardiff. (b) These vehicles will be used in Heathrow Airport Terminal 5 once the construction is ready, shown here as an early visualization. (Figures courtesy of Advanced Transport Systems Ltd. (www.atsltd.co.uk))
The required corridor width for a two‐way PRT track is 4–5 m. It is claimed, however, that PRTs likely require only one lane (Brand and Preston, 2003a). The guideways form a fully connected PRT network with offline stations located along the guideway at a spacing of 250–500 m (Lowson, 2003). Unlike APMs, PRTs serve origin‐to‐destination transport without intermediate stopping. The service is available on demand rather than on fixed schedules.
PRTs can have a maximum speed of 30–50 km/h, but the average speed of the vehicles is around 20–25 km/h (Brand and Preston, 2003a; Lowson, 2002, 2003). The headway can be between 0.5–30 s, although a 2‐s headway is claimed to be practical (Andréasson, 2001; Henderson, 1992; Lowson, 2002; Muller and Allee, 2005). With the 2‐s headway, the capacity of a PRT system can reach 1,800 vehicles per hour per direction. If each PRT vehicle can carry up to four passengers, the maximum system capacity will be 7,200 p/h/d. In practice, the daily average occupancy factor of automobiles is about 1.2–1.6 (Anderson, 2000; Henderson, 1992; Lowson, 2002). If a PRT is assumed to be comparable to a car, then most trips in a PRT vehicle will be taken by one person. On the other hand, two or more passengers at a station in peak
30 Exploring aspects in the application of long accelerating moving walkways
periods are likely to discuss their destinations and share rides rather than wait for the next vehicle, making it reasonable to apply an occupancy factor of 2.0 (Muller and Allee, 2005). Hence, a practical system capacity of 1,800–3,600 p/h/d may be achieved.
The capital cost for a PRT system is estimated to be around $4.21–15.99 million/km (Advanced Transit Association (ATRA), 2003; Tegner, 2003). In fact, a higher capital cost of $25.99 million/km was estimated for one system, but this figure is considered exceptional (Yoder et al., 2000). The operational cost of a PRT ranges from $0.07–0.28/passenger‐km (Tegner, 1999, 2003). In terms of cost per vehicle‐km, Anderson (1999) estimated that the operational cost is around $0.11/vehicle‐km. Due to lack of data, a range of value for the operational cost per vehicle‐km cannot be given.
PRTs are electrically powered, so there is no local pollution during operation. The average energy use is 0.55 MJ/passenger‐km (Lowson, 2002). Again, lack of data prevents from estimating the range of value for the energy use. Studies show that the noise emission level of PRTs is around 35–65 dB(A) (ATRA, 2003; Lowson, 2002). The safety of PRTs is expected to be high due to the segregated tracks. Furthermore, it benefits from personal security since it is likely that all trips are only undertaken with companions chosen by the traveller.
3.3.5 Conventional moving walkway
Conventional Moving Walkways (CMWs) are single speed conveyors that continuously move passengers at a constant low speed during operation. There is no waiting time to use the system, unless the capacity of the system is exceeded; then passengers may need to briefly queue before stepping onto the treadway. All installed moving walkways are now providing point‐to‐point transport along straight lines. However, there have been developments and installations of spiral escalators (Jie, 2003) and curved moving walkways (Abe et al., 2001; Ishikawajima‐Harima Heavy Industries, 2004), which suggests that there is a possibility of using moving walkway over curved routes.
Present day CMWs typically operate at speeds of 0.6–0.75 m/s (Turner, 1998). Some systems may be found operating at around 0.5 m/s or around 0.83 m/s, but these cases are few. The ASME A17.1‐1981 (Donoghue, 1981) stated that a maximum speed of 0.91 m/s is allowed but, to the best of my knowledge, no system has ever adopted this speed. In case of inclined moving walkways, a different guideline is given with regards to the allowable maximum speed, depending on the gradient of the slope (Comité Européen de Normalisation (CEN), 1998; Donoghue, 1981).
Nowadays, CMWs are available with a treadway width starting from 0.6 m, increasing with an increment of 0.2 m up to a width of 1.6 m (Turner, 1998). CMWs with a 0.6 or 0.8 m width are not commonly used anymore because they are considered too narrow and can only accommodate one passenger lane. Systems with 1 and 1.2 m widths are more commonly installed. These widths can better
Chapter 3. Characteristics and comparative evaluation of AMWs 31
accommodate two passenger lanes, although they may not always be comfortable for mixed standing and walking traffic, particularly in airports. Luggage‐carrying passengers often find difficulties to walk pass other luggage‐carrying passengers standing still on the conveyor. Therefore, recently there is a trend towards wider moving walkways with widths of 1.4 and 1.6 m. These treadway widths will allow passengers to pass each other freely, even with a trolley.
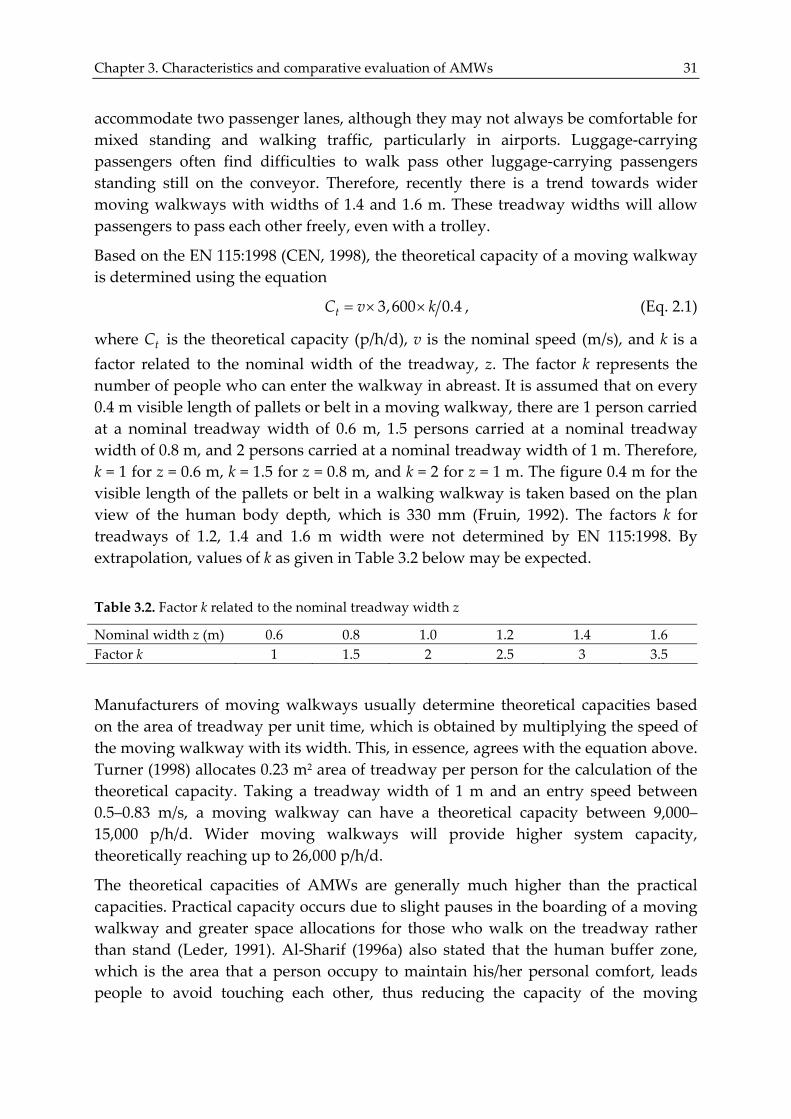
Based on the EN 115:1998 (CEN, 1998), the theoretical capacity of a moving walkway is determined using the equation
= × ×3,600 0.4tC v k , (Eq. 2.1)
where tC is the theoretical capacity (p/h/d), v is the nominal speed (m/s), and k is a factor related to the nominal width of the treadway, z. The factor k represents the number of people who can enter the walkway in abreast. It is assumed that on every 0.4 m visible length of pallets or belt in a moving walkway, there are 1 person carried at a nominal treadway width of 0.6 m, 1.5 persons carried at a nominal treadway width of 0.8 m, and 2 persons carried at a nominal treadway width of 1 m. Therefore, k = 1 for z = 0.6 m, k = 1.5 for z = 0.8 m, and k = 2 for z = 1 m. The figure 0.4 m for the visible length of the pallets or belt in a walking walkway is taken based on the plan view of the human body depth, which is 330 mm (Fruin, 1992). The factors k for treadways of 1.2, 1.4 and 1.6 m width were not determined by EN 115:1998. By extrapolation, values of k as given in Table 3.2 below may be expected.
Table 3.2. Factor k related to the nominal treadway width z
Nominal width z (m) 0.6 0.8 1.0 1.2 1.4 1.6 Factor k 1 1.5 2 2.5 3 3.5
Manufacturers of moving walkways usually determine theoretical capacities based on the area of treadway per unit time, which is obtained by multiplying the speed of the moving walkway with its width. This, in essence, agrees with the equation above. Turner (1998) allocates 0.23 m2 area of treadway per person for the calculation of the theoretical capacity. Taking a treadway width of 1 m and an entry speed between 0.5–0.83 m/s, a moving walkway can have a theoretical capacity between 9,000–15,000 p/h/d. Wider moving walkways will provide higher system capacity, theoretically reaching up to 26,000 p/h/d.
The theoretical capacities of AMWs are generally much higher than the practical capacities. Practical capacity occurs due to slight pauses in the boarding of a moving walkway and greater space allocations for those who walk on the treadway rather than stand (Leder, 1991). Al‐Sharif (1996a) also stated that the human buffer zone, which is the area that a person occupy to maintain his/her personal comfort, leads people to avoid touching each other, thus reducing the capacity of the moving

32 Exploring aspects in the application of long accelerating moving walkways
walkway. Furthermore, in practice, the entry rate of passengers onto the moving walkway is not always uniform and continuous. The practical capacity of a moving walkway is thus primarily dependent on its width at its entrance, as this determines the number of people who can enter the walkway in abreast. The entry speed of the moving walkway only affects the capacity to the extent that it determines the spacing of the passengers as they step onto the walkway (Kittelson & Associates et al., 2003). Walking on a moving walkway will increase the passengers’ travel speed and thus reduces travel time, but this does not affect capacity because it does not affect the entry rate into the moving walkway. These aspects are further discussed in Chapter 4.
For estimation of the practical capacity, Turner (1998) allocates 0.46 m2 area of treadway per person. This implies that the practical capacity is estimated to be about 50% of the theoretical capacity. The practical capacity of CMWs with 1 m treadway width is thus expected to be around 4,500–7,500 p/h/d. For wider treadways, a practical capacity up to 13,000 p/h/d may be expected.
The capital cost for building a CMW including the surrounding structure is approximated to be around $29–36.3 million/km (Venter, 1997). No figure was found on the operational cost of a CMW. However, it is said to be very similar to a PRT (Muller and Allee, 2005), which would be around $0.07–0.28/passenger‐km and $0.11/vehicle‐km.
The noise level of CMWs is claimed to be low. However, quantitative data was hardly found. The only available sources stated that metal‐pallet moving walkways generate noise levels of approximately 54 dB(A) (ThyssenKrupp, 2004a), whereas rubber‐belt systems has noise levels below 55 dB(A) (Fenner Dunlop Conveyor Belting Europe, 2004).
CMWs are considered not very suitable for wheelchair users (with the exception of wheelchair users with attendants) or other mobility‐impaired passengers. Furthermore, they are not flexible to modify and they can become a barrier for cross‐concourse movements. Nevertheless, the system is believed to be safe and simple and may be easily integrated into any environment. It needs only a small installation space. A two‐way AMW system with a treadway width of 0.6–1 m will consume around 2.5–3.3 m of the corridor width (Turner, 1998). For a treadway width of 1.6 m, the required width is 4.7 m. Maintenance of CMWs is also simple, although careful planning is required to avoid disturbance of passenger transport.
3.3.6 Accelerating moving walkway
Being a modification of CMWs, present day Accelerating Moving Walkways (AMWs) exhibit some of the characteristics of CMWs such as continuous operation, no waiting time and point‐to‐point transport over a straight line. The differences mainly stem from the different maximum speed at which the AMWs operate. Figure 3.6 depicts two types of AMW, which are both installed alongside conventional systems.
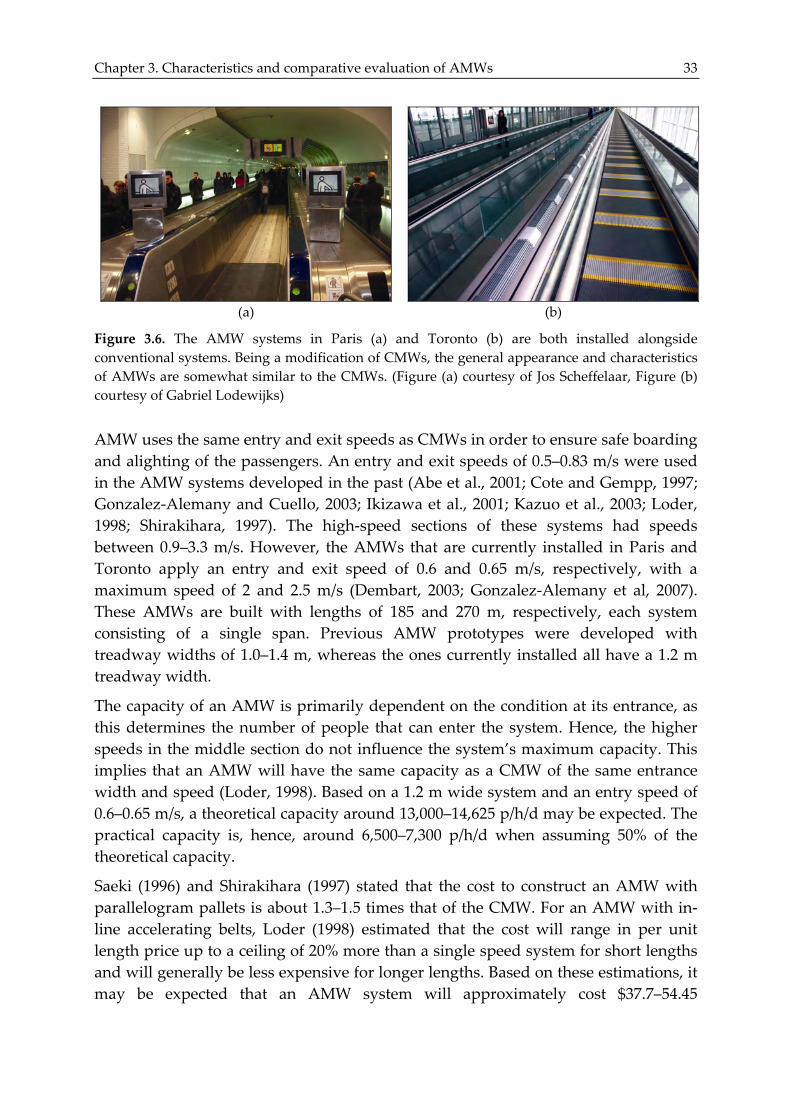
Chapter 3. Characteristics and comparative evaluation of AMWs 33
(a) (b)
Figure 3.6. The AMW systems in Paris (a) and Toronto (b) are both installed alongside conventional systems. Being a modification of CMWs, the general appearance and characteristics of AMWs are somewhat similar to the CMWs. (Figure (a) courtesy of Jos Scheffelaar, Figure (b) courtesy of Gabriel Lodewijks)
AMW uses the same entry and exit speeds as CMWs in order to ensure safe boarding and alighting of the passengers. An entry and exit speeds of 0.5–0.83 m/s were used in the AMW systems developed in the past (Abe et al., 2001; Cote and Gempp, 1997; Gonzalez‐Alemany and Cuello, 2003; Ikizawa et al., 2001; Kazuo et al., 2003; Loder, 1998; Shirakihara, 1997). The high‐speed sections of these systems had speeds between 0.9–3.3 m/s. However, the AMWs that are currently installed in Paris and Toronto apply an entry and exit speed of 0.6 and 0.65 m/s, respectively, with a maximum speed of 2 and 2.5 m/s (Dembart, 2003; Gonzalez‐Alemany et al, 2007). These AMWs are built with lengths of 185 and 270 m, respectively, each system consisting of a single span. Previous AMW prototypes were developed with treadway widths of 1.0–1.4 m, whereas the ones currently installed all have a 1.2 m treadway width.
The capacity of an AMW is primarily dependent on the condition at its entrance, as this determines the number of people that can enter the system. Hence, the higher speeds in the middle section do not influence the system’s maximum capacity. This implies that an AMW will have the same capacity as a CMW of the same entrance width and speed (Loder, 1998). Based on a 1.2 m wide system and an entry speed of 0.6–0.65 m/s, a theoretical capacity around 13,000–14,625 p/h/d may be expected. The practical capacity is, hence, around 6,500–7,300 p/h/d when assuming 50% of the theoretical capacity.
Saeki (1996) and Shirakihara (1997) stated that the cost to construct an AMW with parallelogram pallets is about 1.3–1.5 times that of the CMW. For an AMW with in‐line accelerating belts, Loder (1998) estimated that the cost will range in per unit length price up to a ceiling of 20% more than a single speed system for short lengths and will generally be less expensive for longer lengths. Based on these estimations, it may be expected that an AMW system will approximately cost $37.7–54.45

34 Exploring aspects in the application of long accelerating moving walkways
million/km for the parallelogram type and $34.8–43.56 million/km for the in‐line type. Dembart (2003) reported that the AMW system in Paris, which is based on the accelerating/decelerating rollers, cost around $29 million/km. This lower figure may be excluding the cost for the surrounding structure. No figure was found on the operational cost of an AMW. If a factor of 1.2–1.5 is also applied to the operational cost of CMWs, then the operational cost for AMWs may be around $0.08–0.42/passenger‐km and $0.13–0.17/vehicle‐km.
Owing to their higher speed, the power consumption of AMWs can be estimated to be around two to four times the power consumption of CMWs of the same length. This basically depends on the speed ratio between the entrance and the high‐speed section. Loder (1998) estimated that an AMW will use about 3 kWh of power to transport 1000 passengers as far as 100 m. This equals to about 0.11 MJ/passenger‐km. The noise level of AMWs is also higher than CMWs. The system in Toronto, which is a metal pallet system, has a noise level of around 76 dB(A) (Axel Köhler, personal communication, 19 February 2008). The AMW system in Paris is reported to have a noise level of 82 dB(A) (Rémi Besson, personal communication, 22 March 2007).
As with CMWs, AMWs are also not very suitable for mobility‐impaired passengers, except for wheelchair users with attendants (Ikizawa et al, 2001; Shirakihara, 1997). However, results of public tests suggest that AMWs are generally safe, although a learning period may be required for first‐time users. The systems are relatively easy to integrate into any environment. The space requirement for a two‐way AMW system of 1.2 m treadway width is around 4.8 m (ThyssenKrupp, 2007), which is slightly more than what is required for a two‐way CMW of the same treadway width. A deeper pit depth is also typically required for the accelerating and decelerating sections. Just like CMWs, they are also not flexible to modify and can become a barrier for cross‐concourse movements. Maintenance of AMWs is similar to CMWs, although it may be required more frequently due to their higher operating speed.
3.4 Comparative evaluation
The characteristics of the AMWs are evaluated and compared to those of buses, light rails, APMs, PRTs and CMWs. A summary of the system characteristics are given in Table 3.3.
The lower boundary for AMWs, i.e. for short distance transport, is determined by the comparison of AMWs with respect to CMWs. For the same entry speed and treadway width, the two systems offer the same transport capacity. Both systems also provide continuous transport with no waiting and no intermediate stopping. Hence, the single advantage of AMWs over CMWs is their higher speed. In this respect, AMWs can be an alternative transport system to serve the area of application that is normally at the upper boundary for CMWs. However, the higher costs for AMWs may become a main aspect to consider.

Chapter 3. Characteristics and comparative evaluation of AMWs 35
Table 3.3. Characteristics of the transport systems
Systems Average speed (km/h)
Theoretical system capacity
(p/h/d)
Capital cost
($ M/km)
Operational cost ($/passenger‐km)
Operational cost
($/vehicle‐km) Bus: ‐ mixed traffic 15–20 1,000–4,500 0.14–6.75 0.09–0.95 1.22–14.75 ‐ bus lane 15–25 4,500–7,500 1.14–26.41 0.09–0.95 1.22–14.75 ‐ busways 22–50 4,500–25,000 4.38–38.65 0.09–0.95 1.22–14.75 ‐ guided bus 30–50 4,500–25,000 2–7 0.09–0.95 1.22–14.75 ‐ airport 15–20 1,000–1,500 0.14–6.75 0.09–0.95 1.22–14.75 Light rail 15–45 1,000–30,000 8.5–83.5 0.15–5.42 2.95–22.44 APM 15–50 1,000–30,000 12.5–147.9 0.15–11.77 10.1–45.6 PRT 20–25 1,800–7,200 4.21–15.99 0.07–0.28 0.11 CMW 1.8–3 11,250–18,675a 29–36.3 0.07–0.28 0.11 AMW 7.2–9 13,000–14,625b 34.8–54.45 0.08–0.42 0.13–0.17 Notes: Costs are given as 2005 US dollars a for a treadway width of 1.2 m and a speed of 0.5–0.83 m/s b for a treadway width of 1.2 m and an entry speed of 0.6–0.65 m/s
Table 3.3. Characteristics of the transport systems (continued)
Systems Corridor width (two‐way) (m)
Headway (s)
Stop spacing (m)
Noise level (dB(A))
Energy use (MJ/ passenger‐km)
Bus: ‐ mixed traffic 6–8.5c 600–1,800 200–600 70–84 0.3–1.56 ‐ bus lane 6–8 600–1,800 200–600 70–84 0.3–1.56 ‐ busways 8–13 600–1,800 500–1,000 70–84 0.3–1.56 ‐ guided bus 5.8–6.2 600–1,800 500–1,000 56–59d 0.3–1.56 ‐ airport 6–8.5 600–900 200–600 70–84 0.3–1.56 Light rail 5–6.5 600–1,800 250–1,000 60–74 0.7–2.5 APM 4.4–6.5 60–180 500–1,500 54–72 1.62–12.78 PRT 4–5 0.5–30 250–500 35–65 0.55 CMW 2.5–4.7e 0 0 <55 0.02–0.05 AMW 4.8f 0 0 76–82 0.11 Notes: c refers to a minimum road width d on the guideway e for treadway widths of 0.6–1.6 m f for a treadway width of 1.2 m
The upper boundary for AMWs is firstly influenced by the issue of travel time. This results in a maximum distance that can be served by the AMWs, such that an acceptable travel time can be provided. Because passengers of AMWs are originally pedestrians, I look into acceptable walking limits to determine the maximum transport distance for AMWs. The acceptable walking distance and walking time vary according to the nature of the pedestrian, the purpose and destination of the

36 Exploring aspects in the application of long accelerating moving walkways
walk, and the nature of the walking environment (Pikora et al., 2001). For most purposes, acceptable walking is thought to be about 20 minutes walk, which equates to around 1.5 km for an average pedestrian (Gleave and Halden, 2001). This agrees with Hyden et al. (1998), who stated that people are still willing to walk between 1 and 2 km. As a comparison, the heavily used Central‐Mid‐Level Escalator in Hong Kong, which is an 800 m route consisting of several low‐speed escalators and CMWs, also takes around 20 minutes to travel if the pedestrians only stand while being conveyed. If 20 minutes is taken as the maximum travel time and 2.5 m/s as the AMW speed, then a maximum travel distance of 3 km can be covered with AMWs. Within this 3 km distance, there is clearly overlapping with discontinuous transport systems such as buses, light rails, APMs and PRTs. Then, the suitability of AMWs over the other systems depends on the nature of the application and whether or not the characteristics of the AMWs are competitive compared to those of the others.
As discontinuous transport systems, buses, light rails and APMs need to make intermediate stops. The stop spacing influences the speed of these systems and the walking time of their passengers. Large stop spacing increases the walking time, while small stop spacing reduces the average travel speed due to the time lost in accelerating and decelerating. An optimal distance between stops offsets between walking time and average speed. Even so, the average speed of buses, light rails, and APMs will still be much lower compared to their maximum speeds. Furthermore, intermediate stops may lead to an increase in waiting time and headway (Warren and Kunczynski, 2000). The transport system thus becomes prone to delays.
The average speed of AMWs is lower than that of the other transport systems. However, AMWs do not have intermediate stops so they can always operate at their nominal speed. The absence of delay may to some extent offset the lower running speed, particularly when observing that the nominal AMW speed is quite close to the lower limit of average speed for some discontinuous systems. When the walking time to reach the transport mode, the waiting time for the vehicle, the dwell time at each station, and the walking time to reach the final destination are also taken into account, the total travel time of AMWs may be not much different to that of buses, light rails, and APMs. However, the total journey time of AMWs may still be below that of PRTs. Because PRTs do not have to make intermediate stops and their average speed is fairly higher than that of AMWs, passengers can safe time.
For AMWs, the additional walking time depends on the distance from the origin to the entrance of the first AMW span, the length of the landings between the AMW spans, and the distance from the exit of the last AMW span to the final destination. However, the landing is usually only a few meters long and AMWs can be installed very close to the arrival and departure points of passengers. Hence, a short walking time can be expected. As a continuous transport system, AMWs also provide better service in terms of minimum waiting time. AMWs are always readily available for

Chapter 3. Characteristics and comparative evaluation of AMWs 37
use, making them suitable for any passenger arrival pattern. This is certainly a feature that cannot be provided by the discontinuous transport systems. Buses, light rails, and APMs can be unsuitable for situations that have irregular passenger arrival pattern. In such cases, it may happen that a vehicle has arrived at a station while not many passengers are present, or it has not arrived while many passengers have already waited. Whereas for PRTs, the question that still remains to be answered is whether they can effectively handle large number of passengers requesting service at approximately the same time, for example when a plane or a train has just arrived (Lowson, 2005).
In a cost‐benefit analysis, the walking time from the origin to a stop or station, the waiting time for the service, and the walking time from a stop or station to the destination are usually weighted to the in‐vehicle time by a factor of about two (Brand and Preston, 2003a). This indicates that passengers are, to a certain extent, generally more tolerant to a long in‐vehicle time than to a long walking and waiting time. In this respect, AMWs may accommodate better.
AMWs have higher maximum capacity than PRTs and buses in mixed traffic, buslanes, and airports. On the other hand, its maximum capacity may be lower than that of buses in busways, guided buses, light rails, and APMs. The comparison above also holds true for the practical capacity of the systems. For AMWs with a 1.2‐m treadway width, the practical capacity was estimated to be around 6,500–7,300 p/h/d. The practical capacity of PRTs was estimated to be between 1,800–3,600 p/h/d. If 75% of the maximum capacity is assumed for the practical capacity of bus‐based systems, light rail, and APMs, then their practical capacity will be around 750–3,375 p/h/d for buses in mixed traffic, 3,375–5,625 p/h/d for buses in bus lanes, 3,375–18,750 p/h/d for buses in busways and guided buses, and 750–22,500 p/h/d for light rails and APMs. However, as previously stated, the upper limit of capacity for bus‐based systems can only be achieved with multiple stopping bays and lanes. With a similar approach, if desired, a higher capacity for AMW systems can also be achieved by installing more than one lane per direction.
The system capacity of discontinuous transport systems can be limited by the capacities of the stations (Vuchic, 1981). For AMWs, the space available before the entrance and after the exit, i.e. the landing, may become the limiting factor. However, people normally only need to pause briefly to enter the moving walkway. So, unless there is a sudden peak of passenger arrival, the entrance landing is never fully occupied. At the exit landing, people also usually directly continue to walk away. Hence, the capacity of the exit landing is also never fully occupied, unless if someone pauses in front of the exit, which is quite unlikely. On the downside, if an AMW system cannot operate due to breakdown or maintenance, it is likely that there will be no transport capacity at all because there is no immediate replacement for the system. Breakdown of a vehicle from the other transport modes can be easily

38 Exploring aspects in the application of long accelerating moving walkways
replaced by another vehicle, so operation in the network can be continued although perhaps not as optimal.
The capital cost of AMWs is somewhat in the same range as that of light rails and APMs, but it is still quite higher than that of buses and PRTs. At this point, a methodological remark is necessary for further analysis of the capital cost. The cost per kilometre is subject to many variables, such as the number of stations and the number of trains/vehicles in the system, as is in the case of buses, light rails, APMs, and PRTs. For that reason, the capacity of the system should be taken into account in the comparison. This allows different systems to be compared on the basis of their design. Venter (1997) introduced the typical cost per passenger/hour to represent the cost of a system associated with the service provided. The typical cost per passenger/hour is calculated by dividing the total capital cost of the system with the maximum capacity provided by the equipment supplied. In this paper, the systems are represented by the typical cost per passenger‐km/hour, which gives a more consistent comparison: it does not only consider the capacity of the system, but also the length. Hence, the typical cost per passenger‐km/hour is determined using the capital cost per kilometre instead of the total capital cost. The typical costs of the different transport systems are presented in Table 3.4. They were calculated based on the data in Table 3.3 assuming that the high capital cost corresponds to the high system capacity and the lower capital cost corresponds to the lower system capacity.
Table 3.4. Typical costs of the different transport systems
Systems Typical cost
($ per passenger‐km/hour) Bus: ‐ mixed traffic 140–1,500 ‐ bus lane 255–3,520 ‐ busway 975–1,545 ‐ guided bus 280–445 ‐ airport 140–4,500 Light rail 2,785–8,500 APM 4,390–12,500 PRT 2,210–2,340 CMW 2,420–3,220 AMW 3,630–3,865 Note: Costs are given as 2005 US dollars
From Table 3.4 we can see that buses still give the lowest range of cost, followed by PRTs and AMWs. However, by taking the system capacity and the length of the system into account, the typical cost of AMWs is now not so much higher than that of buses and PRTs. Light rails and APMs remain more expensive, most likely due to the higher costs for guideways and larger vehicles.

Chapter 3. Characteristics and comparative evaluation of AMWs 39
The operational cost of AMWs is lower than that of buses, light rails, and APMs, both in terms of cost per passenger‐km and cost per vehicle‐km. The operational cost of PRTs is just slightly lower than that of AMWs. The operational cost of AMWs can be low since, in terms of operation and maintenance, they are simpler than the other transport systems. Their simpler technology does not need expensive and complicated maintenance. Also, not many personnel are required to operate the system. The low operational cost is partly influenced by the system’s low energy use. Although data on energy use per passenger‐km was scarce, based on the obtained data it is seen that AMWs use the least energy. The energy consumption of buses and PRTs are somewhat in the same range, while light rails use slightly more. APMs consume the most energy.
For a two‐way system, AMWs need relatively less space than the other systems. Busways consume most space, while the other transport systems are in between. PRTs require somewhat the same track width as AMWs, but the whole network may use more land. In airports and transit stations, the small installation space for AMWs makes it is possible to apply the concept of ‘everything under one roof’. AMWs can be installed as close as possible to the arrival and departure points of passengers, so passengers do not need to step to other parts of the building to access the transport system.
Segregated transport systems are considered safer than transport systems in mixed traffic. Furthermore, automated systems are also considered safer than systems with drivers. This is mainly due to the risk of human error in mixed traffic situations and manual operations (Brand and Preston, 2003a). In this sense, the safety of passengers in conventional bus‐based systems is lower than that in the other transport systems. APMs and PRTs are claimed to have very high safety, both being segregated and driverless. AMWs are also segregated from other traffic around it, except for the entrance and exit. These access and egress points should not be at crossings with other traffic flow.
AMWs as well as light rails, APMs, and PRTs are electrically powered so they produce no local emissions during operation. However, emissions are produced at the power stations when generating the electricity. The overall emissions produced, therefore, depend on the method used to generate the electricity. This can be almost zero if using renewable energy or significantly high if using coal. However, emissions of local pollutants at the power stations will generally have smaller impacts than at the location where the transport system operates, and are also easier to control because they come from a single source (Brand and Preston, 2003a). Buses, on the other hand, produce more pollutants since they are generally still powered by diesel engines.
Data on the noise levels of the transport systems were limited. Based on the obtained data, AMWs generate noise levels around the same range as the other systems. This

40 Exploring aspects in the application of long accelerating moving walkways
can be a nuisance, since AMWs are still more likely to be installed indoors. The noise emission of PRTs is generally low, although certain types of vehicle may produce higher noise level. Other transport systems emit higher noise levels.
AMWs, along with light rails, APMs, and PRTs, provide smooth transport for passengers because the internal vibration caused by these systems is low. However, the ground vibration caused by light rails and APMs are relatively stronger, which is likely due to the heavier vehicles. The ground vibration can disturb non‐users and the surroundings. Buses do not cause as much ground vibration as light rails and APMs, but the internal vibration that affects the passengers can be higher. AMWs and PRTs, on the other hand, do not emit significant ground vibration that can disturb the environment.
3.5 Conclusions
This chapter presented the findings of a literature review on Accelerating Moving Walkways (AMWs) and evaluated the characteristics of AMWs compared to those of Conventional Moving Walkways (CMWs), buses, light rails, Automated People Movers (APMs), and Personal Rapid Transits (PRTs). For relatively short distances, the advantage of AMWs over CMWs mainly stem from their higher speed. A factor that may prevent the use of AMWs as an alternative transport system for applications at the upper boundary of CMWs is the higher costs.
It is concluded that AMWs can be an interesting alternative transport system for moderate distance people transport. Based on speed and travel time alone, AMWs may be suitable for distances up to 3 km. However, the suitability of AMWs still depends on the nature of the application. The comparative evaluation has shown that AMWs can be competitive to the other transport modes. AMWs are capable of providing a high capacity transport at relatively low costs. A two‐way AMW system does not take‐up an installation space any larger than the other systems and they are generally easy to integrate into any environment. Furthermore, the energy use and environmental impacts are typically low.
The total travel time on AMWs can be competitive to that of the discontinuous transport systems when the walking time, waiting time, and dwell time in stations are taken into account. This competitiveness is influenced by the possibility of using one long single‐span AMW to cover the whole travel distance. Such a long AMW will provide a faster travel than using a number of shorter AMWs with intermediate landings. In this regard, the limiting characteristics of present day AMWs are still their ability to only serve point‐to‐point transport over straight lines. If AMWs have entrances and exits along the route, then passengers with farther destinations would not need to experience an increase of travel time due to frequent accelerations, decelerations and landings. A number of concepts have been proposed in the past to enable access and egress along the AMW (Tough and O’Flaherty, 1971), but so far the

Chapter 3. Characteristics and comparative evaluation of AMWs 41
complexity of coordination between passengers entering and exiting the system has been a challenge. The current inability to bend around obstacles also limits the possibility to apply a single‐span AMW over longer routes in built‐up environments such as city centres.
Bearing in mind their competitiveness as well as limitations, some possible applications for AMWs are exampled. AMWs may be used to connect between passenger terminals in large airports. They may also connect the main terminal to the parking area or to a nearby train/metro/bus station. In the city, AMWs may serve as feeders for other modes of public transport. In underground rail/metro stations, for example, they may be applied to connect between two stations and their surroundings, such that the accessibility of the stations increases. In large fair ground, exhibition sites and amusement parks, AMWs may provide transport from the parking area, bus/rail station, or hotel to the site’s entrance.

42 Exploring aspects in the application of long accelerating moving walkways

43
Chapter 4
Characteristics and behaviour of pedestrians as passengers of accelerating moving walkways
4.1 Introduction
As presented in Chapter 3, the possibility to apply Accelerating Moving Walkways (AMWs) for moderate distance transport is influenced by the system characteristics, which partly relates to the design of the system. In setting up the design criteria, human factors information are considered, which include human characteristics, abilities and limitations as well as behaviours that arise from their interactions with the system and the environment. Like any other transport systems, the installation of AMWs in a public facility should also be carried out with considerations of the users. Understanding about the characteristics and behaviour of pedestrians as passengers of AMWs is necessary to support decisions on aspects related to the application. This may influence the effectiveness of the AMWs in providing efficient, comfortable and safe pedestrian mobility.
This chapter reviews characteristics, abilities and limitations, as well as behaviour of human in their capacity as passengers of AMWs. In performing the study, not only information directly related to AMWs is included, but also those related to Conventional Moving Walkways (CMWs). Both systems exhibit a number of similarities in terms of their physical dimensions, operational conditions and tasks that passengers need to perform when using the system, particularly at the entrance and exit. Hence, CMWs can provide comparable situations as projections for AMWs, bearing in mind the influence of the AMW acceleration, higher speed and deceleration. The study focuses on horizontal systems and, thus, passenger movements in the horizontal dimension. This is due to the fact that present day AMWs are still only available as horizontal systems.

44 Exploring aspects in the application of long accelerating moving walkways
Considering that moving walkway passengers are essentially pedestrians, human factors information of pedestrians are also reviewed. A number of pedestrian characteristics, for example body dimension, space occupation, and locomotion can be considered relevant for moving walkways. Pedestrian behaviours in bottlenecks and unidirectional flow may also provide insights for situations in moving walkways. Comparison and interpretation are carried out in using the pedestrian data due to possible influence from the moving walkway speed.
The rest of the chapter is structured as follows. The characteristics, abilities and limitations of AMW passengers are described in Section 4.2, particularly with regards to their influence towards the design of the system. The behaviours of pedestrians as passengers of moving walkways are described in Section 4.3, with projections for the case of AMWs. In Section 4.4, I discuss how the characteristics and behaviour of passengers may affect aspects in the application of AMWs. Some concluding remarks are given in Section 4.5.
4.2 Human characteristics, abilities and limitations related to AMW design
For identifying human characteristics, abilities and limitations related to AMW design, the study is directed toward standards on moving walkways, which have been briefly mentioned in Chapter 2. In the ASME A17.1‐1981 (Donoghue, 1981), one of the clauses is explained to have been ‘… specified based upon experience gathered in human factors research’. Furthermore, in the EN‐115:1998 (Comité Européen de Normalisation (CEN), 1998) and EN‐115‐1:2008 (CEN, 2008), the clauses correspond to a number of hazards significant to moving walkways, including those due to ‘neglecting ergonomic principles in machinery design’ or ‘mismatch of machinery design with human characteristics and abilities’. These indicate that the standards have been drawn with reference to human factors information. Reviewing the clauses from a human factor point‐of‐view can provide sufficient insights into the main factors considered important by the authorities.
The clauses in the standards cover issues related to not only moving walkway passengers, but also operational and maintenance personnel as well as inspectors. Here, the focus is on clauses related to the passengers. Each clause is analysed to figure out what human characteristics, abilities or limitations were used as reference. This brings out three main aspects, which are briefly discussed below.
4.2.1 Physical characteristics of human body
The physical size of an average human body is used as reference in setting the standards for moving walkway dimensions. For instance, the body width determines the minimum width of the moving walkway. For pallet‐type systems, the body depth
Chapter 4. Characteristics and behaviour of pedestrians as passengers of AMWs 45
determines the depth of a pallet. The height of the balustrade is taken to accommodate the comfortable height and posture of the arm with respect to the body for holding the handrail, whereas the width of the handrail is chosen to provide a comfortable and secure grip. Furthermore, the average weight of a passenger is used as reference to determine the load for structural design.
Considerations of the shape and size of body parts, particularly those in contact with the moving walkway (i.e. fingers, hands and feet), and the soft body tissue also influence decisions of the system’s shape, dimension and material, especially with regard to safety requirements. For example, to avoid shearing or cutting of the skin, balustrade and skirting should be made of smooth materials and edges should be made bevelled or rounded‐off. Also, to avoid trapping and pinching of body parts, gaps should be made sufficiently small and necessary devices (e.g. combs, deflectors, and guards) should be installed.
The above are few examples of how human physical characteristics influence the design criteria of moving walkways, which applies to both CMWs as well as AMWs. It is not the intention of this study to list each and every value of the human physical characteristics and their corresponding moving walkway specifications. Considering that the most obvious variation in moving walkway specifications is its width, here I elaborate on the dimensions of human body width and depth within the concept of human body ellipse.
The plan view of the human body can be approximated as an ellipse defined by the body depth and shoulder breadth. Human factors studies have shown that the fully clothed dimensions of the 95th percentile of the population are 0.33 m body depth and 0.525 m shoulder breadth. To incorporate spatial allowance for the presence of personal articles, social conventions to avoid body contact with others, and body sway when walking, a human body ellipse of about 0.457 by 0.609 m (equals to 18 by 24 inch) is defined, representing the plan view of an average adult male body (Fruin, 1971). This implies a standing area of around 0.28 m2/person. As can be seen in Figure 4.1, the spatial allowances of the shoulders are less than those in front of and behind the body. This indicates that people are more tolerant to lateral contact with other people (e.g. brushing shoulders) than longitudinal contact (e.g. bumping head‐on).
From a psychological point‐of‐view, the human body ellipse represents the so‐called human buffer zone, which is the area around a human body that if intruded will cause anxiety or discomfort. This concept determines the inter‐personal spacing of pedestrians, including passengers in moving walkways. When freedom of choice exists, pedestrian will adopt personal spacing that avoids physical contact with others. Personal and cultural differences among people may affect the size of the human buffer zones and, consequently, the perception of space (Hall, 1966; Tanaboriboon et al., 1986).

46 Exploring aspects in the application of long accelerating moving walkways
Figure 4.1. The human body ellipse model described by Fruin (1971) provides a simple way to visualize situations involving confined pedestrians.
Considering the human body ellipse, a minimum treadway width of 0.6 m is clearly required. A treadway width of 1 m may enable two passengers to stand side by side, since the body width below the shoulder is smaller. However, they may have to stand closer to the balustrade and have their shoulders brushing. A treadway width of at least 1.2 m is required to allow two people to stand comfortably in abreast.
4.2.2 Ability to maintain balance and stability
When using moving walkways, passengers are subjected to the complex tasks of stepping onto, standing or walking on, and stepping off a moving surface. An important aspect for successfully performing these tasks is the ability to maintain balance and stability. Hence, this factor is used as reference in setting the standards for a number of system specifications, particularly speed, acceleration, deceleration, jerk (i.e. the rate of change of acceleration or deceleration), inclination angle, and treadway material.
To prevent passengers from falling when boarding and alighting, the standards limit the maximum entrance and exit speeds to 0.90 m/s (Donoghue, 2007; CEN, 2008). These speeds are constant along CMWs. The standards prescribe a maximum speed of 4.57 m/s at the high‐speed section of AMWs, which is about the same as a bicycle rider or a jogger (Donoghue, 1981). At this level, wind is felt on the face and may cause minor disturbance of clothing and hair, but no effect is perceived towards walking and standing balance (Murakami and Deguchi, 1981). It is considered that higher speeds would cause an uncomfortable sensation due to stronger head wind, with effects starting from disarranged hair, flying dusts, force of wind felt on the body, leading to lost of balance (Blocken and Carmeliet, 2004). The above maximum AMW speed is presumably prescribed for indoor applications. For outdoor applications, a lower maximum speed may be preferred since occurring open‐air wind may additionally influence passenger perception.
Passenger balance is also affected by the level of acceleration, deceleration and jerk. For horizontal AMWs, ASME A17.1‐1981 limits the acceleration and deceleration in the variable speed zones to 0.1g (0.98 m/s2), with a maximum jerk of 0.91 m/s3 (Donoghue, 1981). Neither the EN‐115:1998 nor the latest EN‐115:2008 explain on
0.609 m
0.457 m

Chapter 4. Characteristics and behaviour of pedestrians as passengers of AMWs 47
these specifications. The EN‐115:2008 only gives a deceleration limit of 1 m/s2, but this is stated for the stopping procedure of CMWs rather than for the deceleration zone of AMWs (CEN, 2008). It should be noted that starting and stopping of moving walkways in normal operational conditions have to be carried out with nobody onboard. For emergency stopping, where passengers may still be present on the system, the total deceleration to which a passenger is subjected shall not exceed 0.25g (2.45 m/s2) (Donoghue, 1981). This limit is particularly important for AMWs, in which the deceleration of the emergency stop plus the deceleration in the normal deceleration zone can be additive.
To reduce the risk of slipping, the slope of a moving walkway is limited to 12° at any point, except for the entrance and exit where a limit of 3° is set. Furthermore, the treadway, comb‐plates and cover‐plates have to be made of anti‐slip materials, having a friction coefficient of at least 0.45 (CEN, 2008). This thesis focuses on horizontal systems, thus the influence of slopes is not further discussed.
Besides referring to the standards, designers of moving walkways typically perform their own studies to select the optimum system specifications. Extensive tests are particularly performed when designing AMWs, since there is little information for such systems in the standards. The physical abilities of the population vary over a wide range. Hence, experiments and observations with human subjects both in the factory and in public facilities allow designers to evaluate how various groups of users respond to the system. Necessary improvements are then carried out based on the results of the studies. The investigations generally resulted in designers setting lower values for speed, acceleration, deceleration and jerk compared to the maximum limits given by the standards.
4.2.3 Cognitive and sensory abilities
For passengers, cognitive and sensory abilities play an important role to perceive situations when using moving walkways, either CMWs or AMWs. Due to the wide range of cognitive and sensory abilities, each passenger may respond differently when interacting with the system. A number of guidelines in the standards are based on considerations for the cognitive and sensory abilities of passengers, with a particular focus toward safety.
Moving walkway passengers apply their cognitive abilities to process sensory information to, for instance, comprehend how the system works and perceive the level of risks. Inaccurate judgments of the situations may occur, particularly if the passenger is not yet familiar with the system. This is typically the case when encountering an AMW, which is not yet common. Standards require that signs are provided to caution people on how to use the system properly (Donoghue, 2007; CEN, 2008). Visual and, optionally, auditory devices, such as shown in Figure 4.2(a), should provide information to help passengers better understand the system.

48 Exploring aspects in the application of long accelerating moving walkways
Related to the discussion above, vision is thus particularly important for passengers. Besides to receive visual information from safety signs, vision is also required to perceive changes in the walking surface and to avoid conflicts with other passengers. This supports the tasks of stepping onto, standing or walking on, and stepping off a moving surface. Visual information serves as input for the brain to guide locomotion and maintain postural stability (Marigold and Patla, 2008; Winter, 1995). This explains why people with poor vision, either due to decrease of their sensory system ability or due to surrounding conditions (e.g. darkness), experience more challenge in walking (Ray et al., 2008). The standards require sufficient lightings in the area of the moving walkway, particularly at the landings. The use of colours is also recommended for components that need extra attention, as exampled in Figure 4.2(b).
(a) (b)
Figure 4.2. (a) Visual and auditory devices (see arrows) are installed in an AMW to advice passengers on how to properly use the system. (b) In another AMW, besides providing visual cues, yellow lines are used to mark the border of the landings and the extendable pallets. (Figure (a) courtesy of Jos Scheffelaar, Figure (b) courtesy of Gabriel Lodewijks)
4.3 Human behaviours related to AMW use
This section discusses human behaviours related to the use of AMWs. To the best of my knowledge, no pedestrian or passenger behaviour study has ever been carried out directly on present day AMWs. Unfortunately, it was not possible to conduct observations or experiments directly on one of the present day AMW since no such systems were available at a convenient location, causing logistics difficulties. Furthermore, a plan to observe pedestrian behaviours on CMWs at a major airport in the Netherlands could not be carried out due to permission problems. Hence, I had to rely on literatures for information. The review in this section is, thus, mainly carried out based on data from pedestrian or passenger behaviour studies on CMWs, bottlenecks and escalators. Taking into account the similarities and differences

Chapter 4. Characteristics and behaviour of pedestrians as passengers of AMWs 49
between AMWs and the above systems, a projection is then made for the case of present day AMWs.
For identifying pedestrian and passenger behaviours related to AMW use, a number of tasks are distinguished based on the layout of an AMW, namely approaching the system, boarding, travelling on the high‐speed section, and exiting the system. The areas where these tasks are carried out are depicted in Figure 4.3. The behaviours that typically occur when carrying out each task are reviewed.
Figure 4.3. A number of tasks are distinguished based on the layout of an AMW, namely (A) approaching the system, (B) boarding, (C) travelling on the high‐speed section, and (D) exiting the system. Here, the AMW and the adjacent corridor are depicted only for one travel direction.
4.3.1 Approaching the AMW
Upstream of the corridor
At a relatively far distance before the entrance to a moving walkway, the pedestrian walking behaviour is found to be quite similar to that in corridors without moving walkways.
Daamen (2004) comprehensively reviewed several articles on pedestrian behaviour studies carried out in locations without moving walkways. She indicated that the walking speeds of individuals in uncongested corridors (the so‐called free‐flow walking speed) typically follow a normal distribution with an estimated overall average of 1.34 m/s and a standard deviation of 0.37 m/s. This values closely match the results of Young (1999), who conducted a pedestrian behaviour study specifically in airport corridors with CMWs. His study found an average free‐flow walking speed of 1.34 m/s with a standard deviation of 0.26 m/s. Density within the corridor affects the ability of pedestrians to achieve the free‐flow walking speed. Young did not evaluate speed‐density relationship in his study, but he pointed out that it can be estimated from results in previous studies. An overview of several proposed relations between speed, density and flow for one‐directional pedestrian traffic flows have been summarized by Daamen (2004).
It may be projected that similar walking behaviour as above will be present upstream of a corridor with AMWs. It is argued that at a relatively far distance before the entrance to the moving walkway, pedestrians have not yet committed him‐/herself to
A B
Direction of travel
C D

50 Exploring aspects in the application of long accelerating moving walkways
a certain mode of transport (Young, 1995). Hence, he/she will likely try to keep his/her natural walking speed, regardless of whether a CMW or an AMW is installed.
Route choice
Approaching the moving walkway, pedestrians will start to make a decision as to which route they will adopt, i.e. through the moving walkway or through the adjacent corridor. I consider travel time, physical effort, safety and personal characteristics as factors influencing the route choice.
Travel time Pedestrians typically prefer a route with the least travel time. The trip purpose determines the extent to which travel time is perceived by each pedestrian. Generally, travel time is more valued by work‐related travellers than those on recreational trips. Pedestrians evaluate the expected travel time on each route alternative based on the travel distance, the attainable travel speed, as well as the congestion level and queue length. The travel distance through the moving walkway is more or less the same as that through the adjacent corridor. The attainable travel speed is influenced by the walking speed and the speed of the moving walkway. Pedestrians consider these aspects in relation to the crowdedness of the route. In a crowded corridor, pedestrians may have to reduce their walking speed. In a crowded moving walkway, they may even have to stand still, thus eliminating the possibility to increase their travel speed by walking on the treadway. The waiting time to queue before boarding a crowded moving walkway is also considered in trade‐off to the attainable travel speed on the moving walkway. For AMWs, this may possibly be compensated by its speed.
The travel times through a corridor by walking (twalk), standing and walking on a CMW (tCMW,stand and tCMW,walk), and standing and walking on an AMW (tAMW,stand and tAMW,walk) can be calculated using the equations
=walkwalk
Ltv
, (Eq. 4.1)
=,CMW standCMW
Ltv
, (Eq. 4.2)
( )=+,
,CMW walk
CMW walk MW
Ltv v
, (Eq. 4.3)
( )( )
( )⋅ + − −= +
+,
,, ,
2 acc dec acc decAMW stand
AMW highAMW entry AMW high
L L L L Lt
vv v , and (Eq. 4.4)
( )( )
( )( )
⋅ + − −= +
+ +,
, , , ,
2 acc dec acc decAMW walk
AMW entry AMW high AMW high walk MW
L L L L Lt
v v v v , (Eq. 4.5)
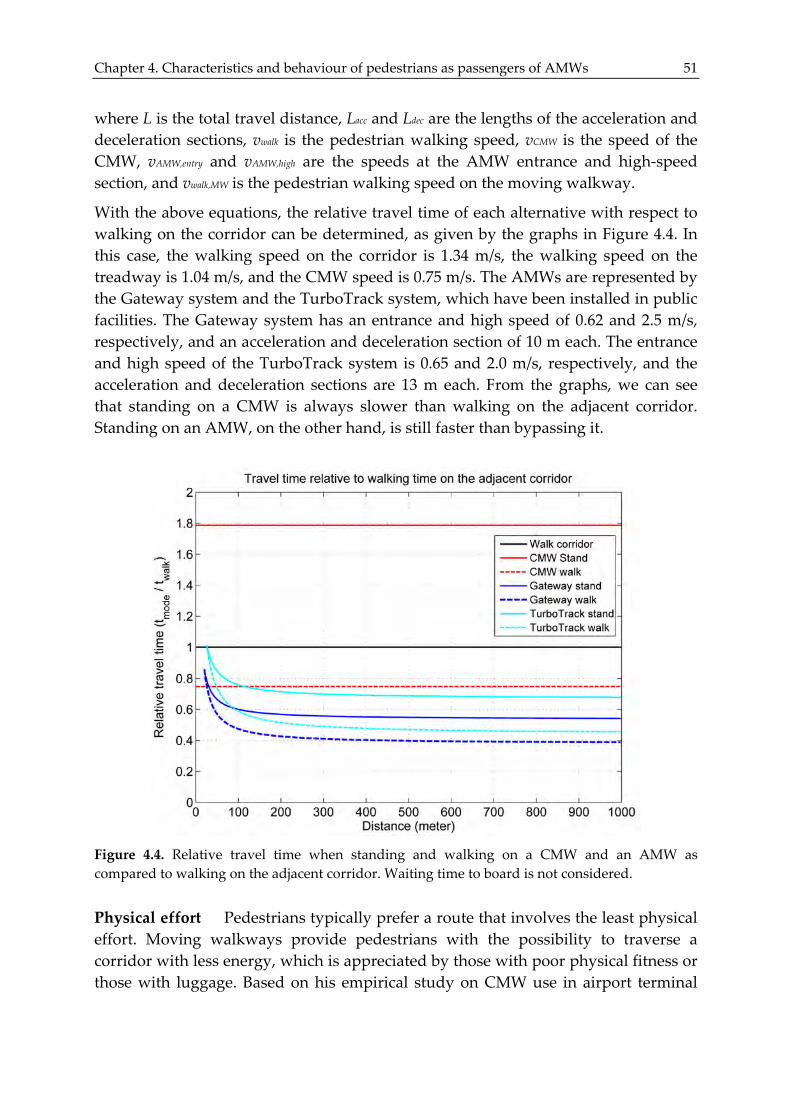
Chapter 4. Characteristics and behaviour of pedestrians as passengers of AMWs 51
where L is the total travel distance, Lacc and Ldec are the lengths of the acceleration and deceleration sections, vwalk is the pedestrian walking speed, vCMW is the speed of the CMW, vAMW,entry and vAMW,high are the speeds at the AMW entrance and high‐speed section, and vwalk,MW is the pedestrian walking speed on the moving walkway.
With the above equations, the relative travel time of each alternative with respect to walking on the corridor can be determined, as given by the graphs in Figure 4.4. In this case, the walking speed on the corridor is 1.34 m/s, the walking speed on the treadway is 1.04 m/s, and the CMW speed is 0.75 m/s. The AMWs are represented by the Gateway system and the TurboTrack system, which have been installed in public facilities. The Gateway system has an entrance and high speed of 0.62 and 2.5 m/s, respectively, and an acceleration and deceleration section of 10 m each. The entrance and high speed of the TurboTrack system is 0.65 and 2.0 m/s, respectively, and the acceleration and deceleration sections are 13 m each. From the graphs, we can see that standing on a CMW is always slower than walking on the adjacent corridor. Standing on an AMW, on the other hand, is still faster than bypassing it.
Figure 4.4. Relative travel time when standing and walking on a CMW and an AMW as compared to walking on the adjacent corridor. Waiting time to board is not considered.
Physical effort Pedestrians typically prefer a route that involves the least physical effort. Moving walkways provide pedestrians with the possibility to traverse a corridor with less energy, which is appreciated by those with poor physical fitness or those with luggage. Based on his empirical study on CMW use in airport terminal

52 Exploring aspects in the application of long accelerating moving walkways
corridors, Young (1995) implied that, for those people whose walking speeds are quite close to the speed of the CMW (up to 0.4 unit speed difference), standing on the CMW may carry the same or even a higher utility than walking on the adjacent corridor. Some pedestrians may evaluate physical efforts in trade‐off to travel time. For short distances, they may consider walking on the adjacent corridor not so tiring. Hence, if they see potential delays from using moving walkways, as in the case of a crowded CMW, they may choose to walk. However, Young’s analysis (1995) suggested the tendency of pedestrians to opt for standing on CMWs than bypassing when the travel distance gets longer, possibly as it spends less energy. As have been stated, standing on an AMW still transports passengers faster than bypassing it. Hence, a passenger can ‘take a rest’ on AMWs without risking his/her travel time.
Safety Personal characteristics, abilities and limitations shape each person’s perception on the safety of a route. For moving walkways, perception on safety is very much influenced by the system speed. The speed of CMWs is relatively low. At only around half of the average pedestrian walking speed, it is generally considered safe by most groups of pedestrians (Ikizawa et al., 2001). Elderly people, small children, and those with physical disabilities have often been observed using CMWs. The entrance speed of AMWs is the same as CMWs. However, knowing that this will accelerate to a higher speed, some groups of pedestrians may feel discouraged from using the AMWs. For old people, those physically impaired and those with small children, for example, the higher travel speed may, in fact, become a reason for not using AMWs.
Personal characteristics As have been stated above, personal characteristics such as age, physical fitness, type of traveller and number of bags carried may affect route choice by influencing the pedestrian’s walking speed as well as perception toward physical effort and safety.
To the best of my knowledge, only Young (1995) ever evaluated the route choice behaviour between CMW and the adjacent corridor. From his study, he found that a vast majority of the pedestrians (around 75%) used the CMWs. Of these, around 28% stood still, whereas 72% walked along the treadway. His mode choice analysis showed that pedestrians do tend to choose the CMWs, especially if walking on the treadway is possible.
It may be expected that pedestrians will also show the tendency to choose AMWs over bypassing it, particularly due to the possibility to reduce physical efforts as well as travel time, even if they stand. However, it is also expected that the composition of pedestrians (based on personal characteristics) who choose AMWs will differ from those who choose CMWs. Fit pedestrians, who would possibly bypass slow CMWs especially when crowded, may prefer to use AMWs rather than bypassing them. On the other hand, pedestrians with poor physical fitness, who would use CMWs to reduce their physical efforts, may possibly avoid AMWs due to fear of falling.

Chapter 4. Characteristics and behaviour of pedestrians as passengers of AMWs 53
4.3.2 Boarding the AMW
Those who choose to use the AMW will continue to walk toward the entrance. In approaching the entrance comb intersection line, pedestrians encounter a decrease in walking area from the upstream corridor to the narrow AMW, which can become a bottleneck. Then, when boarding the system, they face a change of walking surface from the fixed landing to the moving treadway. This may create responses due to the requirement to perform complex tasks that do not naturally fit with his/her behaviour patterns.
Approaching the entrance
In CMWs, the entrance comb intersection line is approximately 1 m after the beginning of the balustrades (namely the newel). In present day AMWs, i.e. the Gateway and the TurboTrack, it is approximately 3 m after the newel. This implies that pedestrians have to first walk in between the balustrades, which is 1 m high, before boarding the moving walkway.
Hawkins and Atha (1976) observed pedestrian behaviour when approaching the entrance of a 1 m wide airport CMW operating at 0.65 m/s. The speed when approaching the comb intersection line was determined by calculating the time required for a passenger to walk through the ‘approach area’, which starts 5 m in front of the comb intersection line, thus 4 m before the newel. The observation period represented the daily peak arrival time of international passengers. During this period, a density of 0.18–1.43 person/m2 was observed, ranging from free flow up to minor congestion/queue. The approach speed ranged between 0.59 m/s and 1.55 m/s, with an average of 1 m/s. The average approach speed is lower than the average free‐flow walking speed found upstream of the corridor. It is likely that passengers who have approached closer to the entrance begin to adjust their walking speed in anticipation of boarding the moving walkway. The lower walking speed may also be due to a higher density at the entrance, possibly when a queue takes place. This condition reduces the space available for pedestrians to make a free step forward and hinders their vision.
The above results are compared to those from the narrow bottleneck experiment carried out by Hoogendoorn and Daamen (Daamen, 2003, 2004; Hoogendoorn and Daamen, 2005). In this experiment, pedestrians walked from a 4 m wide corridor into a 1 m wide bottleneck with a layout as depicted in Figure 4.5(a). Following the walking direction, the area from x = 9 m to x = 4 m is quite similar to the approach area in Hawkins and Atha’s study, the comb intersection line being at x = 4 m, as shown in Figure 4.5(b).
Hoogendoorn and Daamen (2005) showed that between x = 5 m and x = 4 m, which may represent the area in between the balustrade from the newel to the entrance comb intersection line, the pedestrian density varied around 0.2–2 person/m2. The

54 Exploring aspects in the application of long accelerating moving walkways
walking speed in this area varied around 0.5–1.5 m/s, with an average of 1 m/s (Daamen, 2003). These values are quite close to the results from Hawkins and Atha.
Figure 4.5. The layout of the bottleneck in Hoogendoorn and Daamen’s experiment (a) is quite similar to the entrance area of the CMW in Hawkins and Atha’s observation (b). (Figure (a) reprinted with adaptation by permission from Hoogendoorn and Daamen (2005), Copyright 2005, the Institute for Operations Research and the Management Sciences, 7240 Parkway Drive, Suite 300, Hanover, Maryland 21076 USA., Figure (b) reprinted with adaptation by permission of from Hawkins and Atha (1976), Taylor and Francis)
Between x = 9 m to x = 5 m, Hoogendoorn and Daamen recorded pedestrian densities up to 4 person/m2, which is more than twice the maximum density recorded by Hawkins and Atha. Possibly, the flow of pedestrians into the bottleneck experiment area was more continuous than the flow of passengers approaching the moving walkway after leaving a plane, so congestion was more severe upstream of the narrow bottleneck. The walking speed upstream of the bottleneck ranged between 0.3–2 m/s (Hoogendoorn and Daamen, 2005). The lower limit was found during the major congestion. The higher limit was noted at x = 9 m and y = 4 meter, which is relatively far from the centreline of the bottleneck. In Hawkins and Atha’s study, passengers tend to walk closer to the centreline of the CMW. Corresponding to this, around the centreline upstream of the narrow bottleneck, the walking speed was below 1.5 m/s (Hoogendoorn and Daamen, 2005).

Chapter 4. Characteristics and behaviour of pedestrians as passengers of AMWs 55
From the discussion above, we can see that close similarities exist between the behaviour of passengers approaching a 1 m wide CMW entrance and the behaviour of pedestrians at a 1 m wide bottleneck. Because the entrance of AMWs is very much like the entrance of CMWs, it is expected that information from the above studies can be used to project the behaviour of passengers approaching the entrance of AMWs. The relationships between speed, density and flow found from the narrow bottleneck experiment, such as given by Daamen (2004), may be relevant for the behaviour of passengers approaching the newel and the comb intersection line of the AMW.
The entrance comb intersection line of an AMW is deeper behind the newel, i.e. at approximately x = 2 in Figure 4.5. This means that passengers would have to walk further into the bottleneck in order to board. Based on the findings of Hoogendoorn and Daamen (2005), it is expected that, once passing the newel, the passengers will regulate themselves with respect to other passengers in front or next to them, creating longitudinal headways and layers. It may thus be expected that, even in the event of queuing in front of the newel, the spacing of passengers will not be too close to each other when boarding. A mean headway of 1.28 s was found by Hoogendoorn and Daamen (2005), giving a longitudinal spacing of 1.28 m when taking the 1 m/s mean walking speed inside a bottleneck. Such spacing may be expected between passengers when walking towards the comb intersection line. This will support a safer boarding process.
As an additional note, Young (1999) observed that the average free‐flow walking speed of those pedestrians who chose to bypass the moving walkway did not differ from the average free‐flow walking speed upstream of the corridor.
Boarding onto the acceleration zone
Passengers who have reached the comb intersection line will board the moving walkway. Based on their characteristics, abilities and limitations, passengers’ response toward the transition from the fixed landing to the moving treadway vary.
It is considered that the change of walking surface generally caused some apprehension. Kuner (1972) observed that a large number of moving walkway and escalator users tend to check their walking speed and adjust their walking pattern at the threshold, or even stop, before boarding the system. This is confirmed by the study of Hawkins and Atha (1976), which found that approximately half of CMW passengers checked their walking speed before boarding. About half of the passengers were able to walk straight onto the system without hesitation. The other half had to use a small half‐step to adjust to the speed difference at the threshold.
The manner in which passengers board the system affected their boarding time, which is defined as the time during the one full step that placed a passenger’s leading foot on the treadway. Those who checked their speed at the threshold undoubtedly had a higher mean boarding time (at 1.03 s), as compared to those who

56 Exploring aspects in the application of long accelerating moving walkways
did not hesitate to board (at an average of 0.87 s). The overall mean boarding time was 0.95 s with a range of 0.61 to 1.74 s (Hawkins and Atha, 1976). This can be compared to the mean boarding time of 1.09 s obtained by Fruin (1973) for escalators. In this latter case, a slower boarding time can be expected due to the palletized surface of the escalator, which causes passengers to tend to wait for the next pallet to be completely present before boarding. In both studies, density significantly affected boarding time. The view to the threshold is more easily impeded during heavy traffic, possibly causing more hesitation to board. Hence, longer boarding times are found at higher densities. Another significant factor affecting boarding time was age, with older passengers having higher boarding times. Note that boarding time does not necessarily indicate the time headway between two successive passengers.
The change of surface speed generally affected passengers’ balance. In their observation, Hawkins and Atha (1976) found that 31% of CMW passengers experienced some balance problems as a result of boarding, varying from just slight sway (19%), convulsive jerk (9%) to complete loss of balance (3%). Almost all of those who experienced balance problems were able to regain their balance within 3 s after boarding. It was noticed that older passengers tend to experience difficulties with boarding situations, resulting in longer boarding times and more balance problems.
The difference between a CMW and an AMW is apparent after the entrance area. For a CMW, the same speed will carry the passenger from the entrance to the exit. For an AMW, the speed after the entrance will gradually increase up to the speed of the high‐speed section. Nevertheless, Ikizawa et al. (2001) observed that the problem for most people is not the boarding onto the AMW, but the acceleration to and the deceleration from the high‐speed zone.
Based on this, it may be expected that passengers will board AMWs with more or less the same behaviour as in boarding CMWs. With respect to present day AMWs, the time to board the accelerating roller type AMW may be comparable to the boarding time of the CMWs in Hawkins and Atha’s study, since the AMW entrance speed is close to the CMW speed. The time to board the pallet type AMW may be more comparable to the boarding time of escalators in Fruin’s study.
The accelerating roller AMW system maintains the entrance speed constant over a length of 1 m before gradually increasing the speed (Cote and Gempp, 1997). This makes the first meter of the AMW similar to the CMW, so the transition task when boarding is the same, i.e. from a fixed landing to a moving surface of around 0.65 m/s. Hence, it may be projected that the percentage of people experiencing balance problems at the AMW entrance will be somewhat similar to those at the CMW entrance. The time required to regain balance may be slightly longer, depending on the level of acceleration and jerk. However, it is expected that the balance problem will not occur for the entire acceleration zone because there is far less speed change

Chapter 4. Characteristics and behaviour of pedestrians as passengers of AMWs 57
during accelerating compared to when first stepping from the fixed landing to the moving treadway.
Based on calculations, present day AMWs adopt accelerations below 0.5 m/s2, which according to Browning (1974) is suitable for the general public. Although De Graaf and Van Weperen (1997) found that people are generally able to accept this level of acceleration without having to hold onto a support, passengers are still recommended to maintain firm hold of the handrail and not walk when on the acceleration zone. Nevertheless, it has been observed that many fit and experienced passengers walk while being accelerated.
4.3.3 Travelling on the high-speed section
After the acceleration zone, passengers reach the high‐speed section. This is a continuous treadway moving at a constant speed. Here, passengers have the option to either stand or walk. From the discussion on route choice behaviour in Section 4.3.1, it appears that the possibility to walk on the moving walkway is also considered when pedestrians evaluate whether or not they will use the system. This implies that pedestrians have started to make an early decision of their travel behaviour between standing and walking, even before they use the moving walkway. Factors influencing the early decision to walk or stand somewhat continue from those influencing route choice behaviour, i.e. travel time, physical efforts, safety and passenger characteristics. However, once on the moving walkway, the ability to follow this early decision depends on the prevailing situation.
In their study, Hawkins and Atha (1976) observed that approximately half of the CMW passengers (55%) had some moment of walking on the CMW after boarding. This percentage consisted of 27% who completely walked on the treadway the whole way and 28% who changed between walking and standing during the travel. Passengers who stood for the whole journey comprised of 45% of the sample. This is quite to the contrary of what Young (1995) found in his study, where 72% of the observed CMW users walked on the moving treadway, whereas the other 28% stood whilst being transported. It is unclear whether all of the 72% walking CMW users above walked the whole way, or whether any of them changed between walking and standing for part of the way. Possibly, the different percentage of those walking and standing in the two studies above is influenced by the observation period and the directions of the observed CMWs. Hawkins and Atha only observed one CMW serving the arrival direction during an early morning peak arrival period on a weekday, whereas Young observed five CMWs serving departure as well as arrival directions during an afternoon period (would typically be non‐peak) on a Sunday. It is likely that, being observed in the peak arrival period, the CMW in Hawkins and Atha’s study had a higher congestion level, resulting in a higher percentage of passengers standing on the treadway. From these two studies, we can see that the

58 Exploring aspects in the application of long accelerating moving walkways
ratio between walkers and riders on CMWs can vary considerably for different situations. The only similarity is that the percentage of walkers is higher than riders.
In the absence of downstream obstruction on the moving walkway, Young (1999) found that the average free‐flow walking speed of pedestrians who walked on the CMW was 1.04 m/s with a standard deviation of 0.47 m/s. This is significantly lower than the average free‐flow walking speed upstream of the corridor. The lower onboard walking speed may be influenced by the physical characteristics of the CMW, i.e. the surface of the treadway, the narrow width and the treadway speed, which caused a higher level of awareness compared to walking on the normal corridor. In addition, the fact that moving walkways provide forward propulsion may give passengers a reason to reduce their walking speed, considering that they will still be able to complete their travel through the corridor in a timely manner (Young, 1999). The level of incentive to reduce walking speed may depend on personal characteristics such as age, physical fitness, type of traveller and number of bags carried, which affect perception toward physical effort and time pressure.
Those walking on the moving walkway can be obstructed by downstream pedestrians who are walking at a lower pace or standing. In the case of no side convention for walking and standing, at low traffic density, overtaking of the obstruction is usually possible, even if it means having to zigzag. However, this may not be possible at higher density. On the other hand, if the side convention does exist, at both low as well as high traffic density, those who wish to walk (termed as walkers) will always be able to bypass standing passengers (termed as riders), but their walking speed may still be influenced by the passenger directly in front of them. It is envisaged that the situation of all riders or all walkers can be approached using information of pedestrian behaviours in bottlenecks (Hoogendoorn and Daamen, 2005). However, if the two types of passengers exist, the situation is more complex to predict, even more so if there is no side convention.
Based on the above discussion, the following projection of passenger behaviours in AMWs is made. The high‐speed section is a constant speed treadway. At this stage, it is expected that passengers have fully regained their balance, which may give them the confidence to walk on the system should they choose to. It is projected that the average walking speed onboard the high‐speed section, i.e. relative to the speed of the treadway, will at most be the same as that observed in the CMWs. A lower average walking speed up to stand still may even occur due to possible influence from the higher AMW speed. Firstly, due to the higher speed, travel time reduction will already be achieved even when standing, such that the travel time reduction from walking on the treadway serves more as a bonus. In the absence of time constraint, standing still may also be preferred as a way to minimize energy use. Secondly, the higher AMW speed may actually cause a higher level of awareness due to conflicting sensory information from the eye relative to the surrounding and the

Chapter 4. Characteristics and behaviour of pedestrians as passengers of AMWs 59
leg relative to the treadway (Srinivasan, 2009). Hence, passengers take more careful steps resulting in a lower walking pace. Considering these two factors, it may occur that the percentage of walkers on AMWs is lower than that on CMWs.
4.3.4 Exiting the AMW
After the end of the high‐speed section, passengers transfer onto the deceleration zone as preparation toward exiting the AMW. In terms of pedestrian behaviours, no study has ever discussed the process of exiting a bottleneck or a moving walkway. Possibly it is simply regarded as an opposite of the previous process, e.g. exiting a bottleneck is a reversal of entering it whereas exiting a moving walkway is a reversal of boarding it. Here, the discussion of exiting the AMW is directed more to safety.
On the deceleration zone
Bunching is considered a risk in the deceleration zone. Due to the deceleration, the spacing between the passengers is reduced. If the passengers are already standing quite closely to each other at the end of the high‐speed section, once they are decelerated, they may push into the passengers in front of them. In fact, if all passengers are riders from the beginning to the end of the travel, bunching will not occur. However, the presence of walkers among AMW passengers cannot be avoided.
A number of studies concluded that safety issues due to the crowding of passengers in the deceleration zone will not occur if the speed ratio is 3:1 or lower (Loder, 1998). Furthermore, passengers tend to alter their position in relation to other passengers, thus eliminating danger (Ikizawa et al., 2001). A lower deceleration rate, which may result in a slightly higher exit speed compared to the entrance if the deceleration zone length is the same as the acceleration zone length, may be used to avoid bunching (Loder, 1998).
As can be seen in Figure 4.6, present day AMWs apply individual handgrips that move synchronously with the change of speed, starting from the entrance to the exit. The spacing of these handgrips is arranged such that if passengers take hold of them, they will be spaced safely to avoid bunching at the exit (Gonzalez‐Alemanyi et al., 2007; Ikizawa et al, 2001). The handrail in between are intentionally made from material that are not comfortable to hold, further encouraging the passengers to take hold of the individual grips.
Leaving the exit
The process of stepping off from a moving walkway will generally be similar for CMWs as well as AMWs, considering that they have the same exit speed. Upon placing the leading foot onto the fixed landing, the trailing foot quickly follows to help maintain balance. Passengers should directly walk away from the exit in order to clear the landing for the next alighting passenger. For AMWs, the exit newels are

60 Exploring aspects in the application of long accelerating moving walkways
around 3 m after the exit comb intersection line. This naturally encourages passengers to continue walking toward the normal corridor at the end of the AMW, such that the landing can be quickly cleared.
Figure 4.6. Individual handgrips move synchronously with the change of speed. By holding the marked handgrip, passengers will be spaced safely to avoid bunching at the exit. (Figure courtesy of Gabriel Lodewijks)
4.4 Influence towards aspects in AMW applications
4.4.1 Effective capacity
As mentioned in Chapter 3, the theoretical system capacity is usually grossly overstated. With regard to Equation 3.1, the assumption that every 0.4 m available belt of pallet area is used by passengers implies no longitudinal inter‐personal spacing between passengers, such that a passenger’s face would be very close to the back of another passenger’s head. Furthermore, the equation assumes half‐a‐person standing in abreast, e.g. 1.5 person for a treadway width of 0.8 m, which is not practical. The discussions in Section 4.3 have pointed out a number of pedestrian/passenger behaviours that oppose the above assumptions. Even if passengers continuously arrive to the system, possibly causing a queue and oversaturated flow, passengers’ approach and boarding behaviours will still generate empty spaces on the treadway.
A number of methods have been used to estimate the effective capacity of a moving walkway. Turner (1998), for example, assumes that a passenger will occupy 0.46 m2 area on the treadway. It is likely that the longitudinal spacing is considered more valuable for a person that the lateral spacing. Therefore, for a body ellipse width of 0.609 m, the passenger’s space headway can be assumed to be around 0.75 m. This is the quite close to the empty‐step phenomena in escalators, where passengers only board on every other step (Fruin, 1971), implying a longitudinal spacing of 0.8 m.

Chapter 4. Characteristics and behaviour of pedestrians as passengers of AMWs 61
The rate of provision of this preferred empty space for boarding depends on the speed at the entrance. Hence, for a 1 m wide moving walkway, in which two passenger lanes can be formed (possibly forming a zipping effect, according to Daamen (2004)), the maximum effective capacities for a number of entrance speeds can be approximated, as given in Table 4.1.
Table 4.1. Effective capacity of a 1 m wide (accelerating) moving walkway
Entrance speed (m/s) 0.60 0.65 0.75 0.80 Effective capacity (passengers/hour/direction) 5400 5850 6750 7200
For a 1.2 m AMW, which is the width of present day systems, it is expected that the maximum effective capacity will not deviate from the above values. This is due to the fact that still only two passenger lanes can be formed, except that the zipping effect may not be so apparent. However, the effective capacity of a system with an entrance speed of 0.80 m/s above is arguable. Studies have shown that people are more hesitant to board a treadway moving at a higher speed, thus reducing the system capacity (Turner, 1998). Mayo (1966, as cited in Davis and Dutta, 2002) found that escalators with a speed of 0.75 m/s gave the highest handling capacity. A similar trend is present for moving walkways (ThyssenKrupp, 2004b).
In theory, wider moving walkways would have higher system capacity since the width would then be sufficient to accommodate more passenger lanes. I argue that this is not a safe assumption, particularly in the case of AMWs. Quite likely, passengers will want to be within access of the handrail in order to help maintain balance, especially when boarding. This will encourage the formation of only two lanes. Hence, for planning purpose, the use of wider AMWs should be directed toward easier bypassing (e.g. with baggage or trolleys) rather than to accommodate a higher transport demand.
4.4.2 AMW length
Based on the graphs in Figure 4.4, a travel distance of 120 m should be considered as the minimum AMW length, at which the transport time when using the AMW will still be advantageous compared to bypassing it or using the CMW. From the discussion in Section 4.3.3, it may be expected that the fraction of riders on AMW is higher than that on CMWs. Some passengers who would normally walk on a CMW might not be brave enough to walk on an AMW. Applying the AMW for a length of at least 120 m will ensure that even this group of AMW riders can travel with at least the same travel time as when walking on the CMW.
It is also observed from Figure 4.4 that the relative travel time of the AMW comes to almost a constant value after a distance of about 350 m. Of course there is still travel time reduction for higher distances, but the advantage is not significant. Based on

62 Exploring aspects in the application of long accelerating moving walkways
this, a single‐span AMW should be applied for longer point‐to‐point transport line, so the transport time reduction can be maximized. However, if applying one long AMW is not possible, e.g. due to blocking cross‐concourse traffic at the location, it is recommended to try as far as possible to use AMW spans of 350 m.
4.4.3 Safety
In general, safety aspects for AMWs are similar to those for CMWs, so the same measures can be applied. The crucial tasks are boarding and exiting. Passenger boarding problems are typically encountered when there is high density at the threshold, which prohibits accurate judgment of the boarding situation. Certain applications, such as in mass transit facilities or stadiums and arenas, impose extreme loading or queuing conditions over a relatively short time. Therefore, ample space for people, especially if coming in a large crowd, must be provided at the entry and exit landings of the AMW. The entrance and exit landings should not be at a location of crossing flows. Pedestrians who are unfamiliar with the location usually need to check their directions at corridor intersections, so crowding may occur.
Possible congestion in a shared landing area of two moving walkways heading opposite directions also has to be taken into account, especially when a large group of passengers is exiting one system while another large group is queuing to enter the other. To reduce the funnelling effect of the two queues, a barrier can be placed to separate the landing. It may be preferred to separate the two moving walkways at each side of the corridor, leaving the middle of the corridor free for normal walking.
4.4.4 Alternative route
There is invariably a minority of pedestrians that experience some degree of difficulty in utilizing AMWs. Firstly, there are those persons who have difficulty using the system either due to unfamiliarity or some deficiency in the learning process. Secondly, there are various disadvantaged groups in the community, such as the mentally or physically handicapped, who lack the opportunity to utilize the system due to some planning or design barrier inherent in the system. Hence, there may be certain environments where it is not be desirable to install AMWs as the only available transport system. In such a situation, an alternative route or transport system should be made available for those who do not want or simply cannot use AMWs.
4.4.5 Power consumption
Different types of demand pattern may be present in different locations. In airports and transit stations, for example, passengers typically arrive at certain schedules, causing peaks at certain hours. On the other hand, the demand pattern of visitors in shopping centres or amusement parks may be relatively uniform throughout the day.

Chapter 4. Characteristics and behaviour of pedestrians as passengers of AMWs 63
Variation in the demand pattern reduces the capacity that moving walkways actually carries. Even in the event of oversaturated flow, moving walkways will never operate at the design capacity due to passenger approach and boarding behaviours.
The motor of moving walkways are always sized for maximum capacity, which, according to the standards, is calculated based on a certain design load other than the effective capacity. The above practical situations result in underutilization of the motor. If the motor consistently operates at less than 50% of its full load, it will operate with a low efficiency and this will lead to inefficient power consumption (Bonnet, 1994). Hence, energy‐saving measures should be taken into account in the application of moving walkways.
CMWs typically apply a form of stand‐by mode in order to save energy when there is no passenger using the system (Electrical & Mechanical Services Department (EMSD), 2007). One method, namely the stop‐and‐go method, stops the system when there is an extensive period of no load and starts it again before a passenger steps foot on the treadway, when the sensor is triggered. Alternatively, the moving walkway operates at idling speed at no load and changes to nominal speed on higher loads, which is termed the idle‐to‐nominal method. The recently developed method is to use an energy optimiser device, which can regulate the operating voltage of the motor according to the load.
So far, present day AMWs do not apply these power saving schemes. With regards to the application of AMWs for moderate distance transport, the suitability of the above power saving schemes in long AMWs is not yet tested. The stop‐and‐go method and the idle‐to‐nominal method might not work optimally if the inter‐arrival time of the passengers in the location is on average less than the travel time through the system. The likeliness of this is higher for significantly longer AMWs. It seems that the energy optimiser device may be a more suitable option.
4.5 Conclusions
In this chapter, the characteristics and behaviour of pedestrians as passengers of (accelerating) moving walkways have been reviewed. The inherent characteristics of pedestrian, such as body dimension as well as motor and sensory skills, define requirements and limits for the design of the system, which holds for either short or long AMW systems. In terms of applying AMWs for moderate distance transport, increasing the speed at the high‐speed section would have been interesting. The currently applied speed has not yet reached the limit given by standards. However, manufacturers’ tests have shown that a higher speed would exclude some groups of pedestrians from the possibility to use the system.
Besides the limit of maximum speed, there also exist limits of maximum acceleration, deceleration and jerk. This does not only apply for the accelerating and decelerating

64 Exploring aspects in the application of long accelerating moving walkways
zones, but also for the starting and stopping of the system. Normal starting and stopping are not allowed to be carried out with passengers on board, but emergency stopping may have to be performed with passengers. The emergency stopping performance of a much longer AMW can be expected to differ from that of a shorter AMW. In the EN 115‐1:2008 standard, a range of stopping distances are recommended as a function of the moving walkway speed. This applies only for CMWs. It is unclear whether following this range of stopping distances, or an extrapolation of it, will be suitable for AMWs, particularly long ones. This is evaluated in Chapter 7.
The behaviours of passengers on AMWs were projected based on data from passenger studies on CMWs and pedestrian studies at narrow bottlenecks. It is expected that passenger behaviours on CMWs are generally applicable for AMWs. However, due to the influence of the higher AMW speed, some differences may occur between the composition of pedestrians that use the AMWs and the CMWs, as well as the composition of the walkers and riders in the two systems. For long AMW systems, it is projected that more riders will be present. With regards to the application of AMWs, these two aspects should be taken into account when evaluating the effectiveness of the system to support pedestrian mobility, related to the inclusion of all pedestrian type in the location and travel time predictions.
Similarities have been found between the approach behaviour of CMW passengers before stepping onto the treadway and the behaviour of pedestrians upstream and inside the bottleneck. It is expected that pedestrian flow relationships obtained from the bottleneck study can be applicable for the AMWs as well. Experiments or observations directly on AMWs should be carried out to confirm these projections.
The above passenger behaviours when using AMW can be of interest if a long AMW requires multiple drives, as is evaluated in the second part of this thesis. The arrival interval and boarding behaviour, as well as the walk or stand choice, influence the distribution of the load along the length of the system. This affects the amount of load that each drive has to handle. Unfortunately, empirical data could not be gathered during the course of this research to give insights on the walk or stand choice behaviour of the passengers on AMW. Because it is envisaged that the fraction of riders on long AMWs would be higher than on CMWs, for the evaluation in Chapters 7 and 8, it is assumed that passengers only stand.

65
Chapter 5
A study on the application of accelerating moving walkways in Amsterdam Airport Schiphol‡
5.1 Introduction
In the previous two chapters, the characteristics of present day Accelerating Moving Walkways (AMWs) as well as the characteristics and behaviours of pedestrians as users of (accelerating) moving walkways have been presented. Their effects toward aspects in the application of AMWs have also been discussed in general. In addition, a location may also impose certain requirements and boundaries for the application of AMWs, depending on the function of the facility, the characteristics and composition of pedestrians in the location, as well as the configuration and geometry of existing infrastructures. To provide an example, a study on the application of AMWs in Amsterdam Airport Schiphol (AAS) is presented in this chapter.
Two areas of application are considered, i.e. intra‐terminal transport and inter‐terminal transport. For the case of intra‐terminal transport, the possibility to apply AMWs in Schiphol Centrum and the extent to which they can benefit the passengers, airport and airlines are analysed. For the case of inter‐terminal transport, how AMWs may be applied to bridge the distance between Schiphol Centrum and the planned Schiphol Noordwest is evaluated. It is not the intention of this study to come up with a complete appraisal and design of AMW installation in AAS. The main aim is to obtain insights on the possibility of applying present day AMWs in an actual location, along with the various considerations involved in the planning process.
‡ Part of this chapter is based on: Kusumaningtyas, I., Paro, J.C., and Lodewijks, G. (2007), “Accelerating moving walkways for quality people transport in airports: An assessment of their applicability in Amsterdam Airport Schiphol”, Proceedings of the European Transport Conference 2007, Association for European Transport, London, 1–13.
66 Exploring aspects in the application of long accelerating moving walkways
The case study is carried out in collaboration with the Koninklijke Luchtvaart Maatschappij (KLM, in English is known as the KLM Royal Dutch Airlines) and the Samenwerking Innovatieve Mainport (SIM, in English is known as the Innovative Main Port Alliance). The former is the home carrier of AAS. The latter is an organization based in AAS, consisting of a number of parties from the aviation sector and knowledge institutions, which aims at positioning AAS as an innovative European main port. Data about the airport, its operations and the passenger processes were obtained through KLM and SIM. Observations were also carried out to study the situations in the passenger terminal in AAS.
The structure of this chapter is as follows. Section 5.2 provides information about AAS, describing the passenger terminal, the passenger processes and the expansion plans. With this information, evaluations on the application of AMWs for intra‐terminal and inter‐terminal transport in AAS are performed, as discussed in Section 5.3 and Section 5.4 respectively. Conclusions based on the analyses are given in Section 5.5.
5.2 Amsterdam Airport Schiphol
5.2.1 The passenger terminal
AAS is one of Europe’s largest and busiest airports. Besides serving the home market in the Netherlands, it also functions as a hub for the transfer market. As shown in Figure 5.1, AAS adopts a two‐level centralized finger pier configuration. With its single terminal concept, all processes are carried out under one roof, thus enabling fast and easy passenger processes.
The terminal, namely Schiphol Centrum, consists of public and non‐public areas. This study focuses on the non‐public part of the terminal. The layout of Schiphol Centrum is depicted in Figure 5.2. The non‐public part of the passenger terminal is divided into Schengen and Non‐Schengen areas, following the European Schengen Agreement. The Schengen areas in AAS are Lounges 1 and 4, as well as Piers B, C, D second floor (DII) and M. The other areas in AAS are thus Non‐Schengen, i.e. Lounges 2 and 3, as well as Piers D first floor (DI), E, F, G and H. Note that Piers H and M is, in fact, one pier with two names.
The terminal is currently equipped with a network of Conventional Moving Walkways (CMWs). These systems are mainly installed in the piers and corridors, with locations as indicated in Figure 5.2. Their lengths are between 40 to 100 m, with an average length of 70 m. They generally have a treadway width of 1.4 m, although a number of systems with a 1 m treadway width are also installed, such as in the narrow corridor of Pier‐E. The operating speed of the systems is typically 0.75 m/s. Each moving walkway is installed with a single drive system providing power between 10 and 20 kW.

Chapter 5. A study on the application of AMWs in Amsterdam Airport Schiphol 67
Figure 5.1. An aerial view of Amsterdam Airport Schiphol. The ground level, with entrance under the grass roof, is for arrivals. The upper level is for departures. (Figure courtesy of Erwin Voogt (www.erwinvoogt.com))
Figure 5.2. Layout of Schiphol Centrum showing the passenger facilities. The blue lines mark the division between the public and the non‐public areas. The red lines represent the CMWs. The corridor between Piers B and C still show the layout before May 2007; the new corridor has three pairs of shorter CMWs. (Figure from Schiphol Group (2006), courtesy of Schiphol Group)

68 Exploring aspects in the application of long accelerating moving walkways
5.2.2 Passenger processes
AAS serves Origin/Destination (O/D) as well as transfer passengers. The total number of passengers flying through AAS in 2006 is 46.1 million, with around 41.6% of them being transfer passengers (Schiphol Group, 2007a). Based on the origin or destination of the flight, air traffic movements in AAS are distinguished into European (EURO) and Intercontinental (ICA). In terms of transfer processes, this gives four possibilities, i.e. EURO/EURO, EURO/ICA, ICA/EURO, and ICA/ICA. Each type of transfer is assigned a certain Minimum Connecting Time (MCT), which is determined by the minimum time required to allow passengers and baggage to transfer from one flight to another as well as to turn around the aircraft. The MCTs for transfers in AAS are given in Table 5.1 below.
Table 5.1. Minimum Connecting Time (MCT) for transfer in AAS
From To Abbreviation MCT European European EURO/EURO 40 minutes European Intercontinental EURO/ICA 50 minutes Intercontinental European ICA/EURO 50 minutes Intercontinental Intercontinental ICA/ICA 50 minutes Sources: Schiphol Group (2009a).
The processes that have to be followed by departing, arriving and transfer passengers are schematically presented in Figure 5.3.
S = Schengen, NS = Non‐Schengen, US = United States, HRF = High Risk Flight screening
Figure 5.3. Flow diagram of passenger processes in AAS. (Figure taken from Paro (2007))

Chapter 5. A study on the application of AMWs in Amsterdam Airport Schiphol 69
Passengers departing to Schengen countries go through a centralized ticket and security check at the lounges; due to the Schengen agreement, passports are no longer checked. Those going to Non‐Schengen countries go through passport and ticket control at the lounges, whereas the security check is carried out at the gates. Transfer passengers go through passport control at the lounge only if they cross between the Schengen and the Non‐Schengen areas. Security check for those transferring to the Schengen zone is carried out together with the passport control. Those transferring to Non‐Schengen countries go through security check at the gates. Arriving passengers are checked for their passports only if they arrive from NS countries.
5.2.3 Expansion plans
AAS expected a 4 to 5% growth in passenger number per year, which will result in 65 million passengers in 2015 (Schiphol Group, 2007b). To accommodate this growth, AAS plans to increase the capacity of Schiphol Centrum by improving the efficient use of the existing infrastructure and, possibly, by building an extra pier in the south part of the terminal. The new pier, namely Pier‐A, will connect directly to the terminal via the beginning of Pier‐B. The current aircraft buffer stands at the J‐area, located west of Pier‐G across the A4 highway, will be used for passenger handling after 2010. This will provide additional capacity for Schiphol Centrum (Schiphol Group, 2007b). A transport system will thus be required to connect the J‐area to Schiphol Centrum.
Furthermore, AAS estimates up to 85 million passengers in 2025 (Schiphol Group, 2007c). Since Schiphol Centrum will have reached its maximum capacity in 2015, a separate terminal is planned to be built at the northwest side of Schiphol Centrum across the A4 highway. This new terminal, namely Schiphol Noordwest, will have a capacity up to 30 million passengers. It is mainly intended for flights not involved in transfer processes. Hence, the hub and its transfer traffic can still apply the one‐terminal concept in Schiphol Centrum. Nevertheless, a good transport connection between Schiphol Noordwest and Schiphol Centrum is necessary. This is to provide the passengers with easy access to the vast (inter)national and high‐speed rail network situated underneath Schiphol Centrum (Schiphol Group, 2007c).
An illustration of AAS expansion plans is given in Figure 5.4.
5.3 Evaluation of AMWs for intra-terminal transport
The one‐terminal concept simplifies the execution of passenger processes in AAS. However, the finger pier configuration has the disadvantage of long walking distances (International Air Transport Association (IATA), 2004). With plans to expand the airport, walking distances in AAS are likely to increase. This will affect

70 Exploring aspects in the application of long accelerating moving walkways
O/D as well as transfer passengers. It is a particularly critical matter for the latter since they generally face more time pressure to switch flights.
Figure 5.4. AAS expansion plans: (1) the planned Schiphol Noordwest, (2) the planned Pier‐A, (3) the J‐area, and (4) Schiphol Centrum. (Figure from Schiphol Group, KLM and Luchtverkeers‐leiding Nederland (2005), courtesy of Schiphol Group)
Time schedules and MCTs in AAS are established with the purpose to minimize delays and misconnections, thus providing passengers with good service levels while maximizing the productivity of the airport and airlines. The long walking distances may cause a risk in maintaining these times. Increasing the MCT, in particular, is not desirable because it will increase the transfer times of indirect connections in the network, making them less attractive (Veldhuis, 1997). This can be counter‐productive to AAS competitiveness in the transfer market.
CMWs are installed to assist passenger mobility in the terminal. However, as pointed out in Chapter 4, they do not always provide travel time reduction. In this section, the possibility to apply AMWs in Schiphol Centrum is evaluated. The extent to which they can benefit the passengers as well as the airport and airlines is examined. Factors involved in the consideration of their application are also discussed.
5.3.1 Current situation in Schiphol Centrum
Walking distances
IATA recommends a maximum walking distance of 250–300 m without mechanical assistance (IATA, 2004). If the route is equipped with moving walkways, walking distances up to 650 m is allowed, of which not more than 200 m is unaided. This standard is not universally adopted and some airport authorities, including AAS, have their own guidelines.
I analyse the distribution of walking distances in Schiphol Centrum and evaluate it against the guidelines. A database was generated, consisting of all lounge‐to‐gate
1
2
3 4

Chapter 5. A study on the application of AMWs in Amsterdam Airport Schiphol 71
and gate‐to‐gate distances in Schiphol Centrum. The main distances are shown in Figure 5.5.
Figure 5.5. Main distances in the non‐public part of Schiphol Centrum, showing Piers B to H/M and Lounges L1 to L4. The corridor between Piers B and C still show the layout before May 2007; the new BC‐corridor has approximately the same length. (Figure from Paro (2007))
The lounge‐to‐gate distance applies to departing passenger. It is defined as the distance from the entrance of a lounge, which is marked by the passport/ticket control, to a departure gate. Referring to Figure 5.5, departing passengers flying from Piers B, C and DII enter Lounge 1, whereas those flying from Piers DI and E enter Lounge 2. Furthermore, departing passengers with gates in Piers F, G and H enter Lounge 3, whereas those with gates in Pier‐M enter Lounge 4. Similar distances can be assumed for arriving passengers. On the other hand, the gate‐to‐gate distance applies for transfer passengers. It refers to the distance between the arrival and the connecting gates. Transfer traffic occurs within (intra‐) and between (inter‐) all piers, except for Pier‐H/M that only handles O/D flights.

72 Exploring aspects in the application of long accelerating moving walkways
The distributions of the lounge‐to‐gate, intra‐pier gate‐to‐gate and inter‐pier gate‐to‐gate distances are presented in Figures 5.6 to 5.8, respectively, for total as well as unaided distances. Total distance refers to the entire length of a journey from one point to another. Unaided distance is the total distance subtracted by the length of CMWs available along the way.
Lounge-to-gate distances
0%10%20%30%40%50%60%70%80%90%
100%
0-50
50-1
00
100-
150
150-
200
200-
250
250-
300
300-
350
350-
400
400-
450
450-
500
500-
550
550-
600
600-
650
650-
700
700-
750
750-
800
Distance (m)
Cum
ulat
ive
% o
f gat
es
Total
Unaided
Figure 5.6. The cumulative distribution of lounge‐to‐gate distances for gates in Piers B, C, D, E, F, G, H and M for total and unaided distances.
Intra-pier gate-to-gate distances
0%10%20%30%40%50%60%70%80%90%
100%
0-50
50-1
00
100-
150
150-
200
200-
250
250-
300
300-
350
350-
400
400-
450
450-
500
500-
550
550-
600
600-
650
650-
700
700-
750
750-
800
Distance (m)
Cum
ulat
ive
% o
f gat
e pa
irs
Total
Unaided
Figure 5.7. The cumulative distribution of intra‐pier gate‐to‐gate distances in Piers B, C, D, E, F and G for total and unaided distances.
Figure 5.6 shows that approximately 16% of the total lounge‐to‐gate distances exceed the 650 m limit given by IATA. These are dominated by gates at the middle and the

Chapter 5. A study on the application of AMWs in Amsterdam Airport Schiphol 73
end of Piers B, DI and H. From Figure 5.7, only 2% of the total intra‐pier gate‐to‐gate distances are over 650 m, found for travels between gates at the ends of the U‐shape part of Pier‐DI. On the other hand, as seen in Figure 5.8, around 85% of the inter‐pier gate pairs have distances more than 650 m. When also considering the availability of CMWs, only 16% of the lounge‐to‐gate distances are assisted following the guideline of IATA. Slightly more than 60% of the intra‐pier gate pairs have unaided distances up to 200 m, but less than 1% of the inter‐pier gate pairs fulfil this limit. In general, the lounge‐to‐gate distances as well as the intra‐pier and inter‐pier gate pairs may be unaided for 55 to 90% of the journey.
Inter-pier gate-to-gate distances
0%10%20%30%40%50%60%70%80%90%
100%
0-10
0
100-
200
200-
300
300-
400
400-
500
500-
600
600-
650
650-
700
700-
800
800-
900
900-
1000
1000
-110
0
1100
-120
0
1200
-130
0
1300
-140
0
1400
-150
0
1500
-160
0
1600
-170
0
1700
-180
0
1800
-190
0Distance (m)
Cum
ulat
ive
% o
f gat
e pa
irs
Total
Unaided
Figure 5.8. The cumulative distribution of inter‐pier gate‐to‐gate distances between Piers B, C, D, E, F and G for total and unaided distances.
In the current practice, not all intra‐pier and inter‐pier gate pairs in AAS are assigned to handle transfer traffics. Unfortunately, there is no clear information on this matter.
Cross analysis of processing time and walking distance for O/D passengers
The cut‐off times for check‐in and baggage drop‐off are 30 and 60 minutes before the Scheduled Time of Departure (STD) for EURO and ICA flights, respectively (KLM Royal Dutch Airlines (KLM), 2009a). These times are set in order to ensure that passengers and their baggage can reach the aircraft in time, thus avoiding delays. Nevertheless, study shows that a number of passengers still arrive at the airport front in the last 30 minutes before STD (Van Dijk and Van der Sluis, 2006). The gates close 10 minutes before STD (KLM, 2009b). Hence, passengers who completed check‐in and baggage drop‐off exactly at the cut‐off time will have 20 minutes (for EURO flights) or 50 minutes (for ICA flights) to reach their gates while following the next departure processes. Table 5.2 estimates the time required to undergo departure

74 Exploring aspects in the application of long accelerating moving walkways
processes after check‐in and baggage drop‐off, as illustrated in Figure 5.3. The estimation takes service time as well as queuing time into account.
Table 5.2. Estimation of the time required for departure processes of a passenger
Time (minutes) Process
EURO‐S EURO‐NS ICA Ticket (and passport) control 2 3 3 Security check 4 5 5 High risk flight (HRF) screening ‐ ‐ 8 Boarding 4 4 5 Total with/without HRF screening 10 12 21/13 Sources: Ashford (1988), Competition Commission (2002a, 2002b), Horstmeier and De Haan
(2001), IATA (2004). AAS assumes an average walking speed of 1.17 m/s for its terminal design, which takes into account the slowing down of passengers due to bringing hand luggage, pushing shoppers (i.e. small airport trolleys) and way finding. At this speed, the farthest Schengen gate can be reached in slightly over 11 minutes. Additionally walking on the CMWs, which cover 40% of the way, gives a 2 minute advantage. Walking to the farthest away Non‐Schengen gate takes slightly under 11 minutes, with a 1 minute advantage if walking on the CMWs that cover just 20% of the way.
Since the boarding procedure is carried out at the gate, EURO‐S passengers will be able to reach the farthest Schengen gate around 4 minutes before it closes, giving just enough time to complete their process. For EURO‐NS and ICA passengers, the security check is also carried out at the gate so the farthest Non‐Schengen gate can be reached before it closes. However, the remaining time for EURO‐NS passengers is only around 7 minutes, so completing their processes can delay the gate closing time. In this case, the maximum lounge‐to‐gate distance that enables the completion of passenger processes before the scheduled gate closing time is 600 m. For ICA passengers, the remaining time is sufficient to not interrupt the gate closing time.
Cross analysis of processing time and walking distance for transfer passengers
The established MCTs have to provide passengers with sufficient time to reach their connecting gate while following the required transfer processes. Table 5.3 estimates the time required to undergo transfer processes as illustrated in Figure 5.3, starting from the moment the blocks are placed on the aircraft landing gear at the arrival gate, which marks the start of the MCT. The estimation takes service time as well as queuing time into account.
The MCT ends at the moment the blocks are removed from the connecting aircraft, such that it can move from the gate. This implies that the closing time of the gates at 10 minutes before STD is within the MCT. Hence, with MCTs as given in Table 5.1
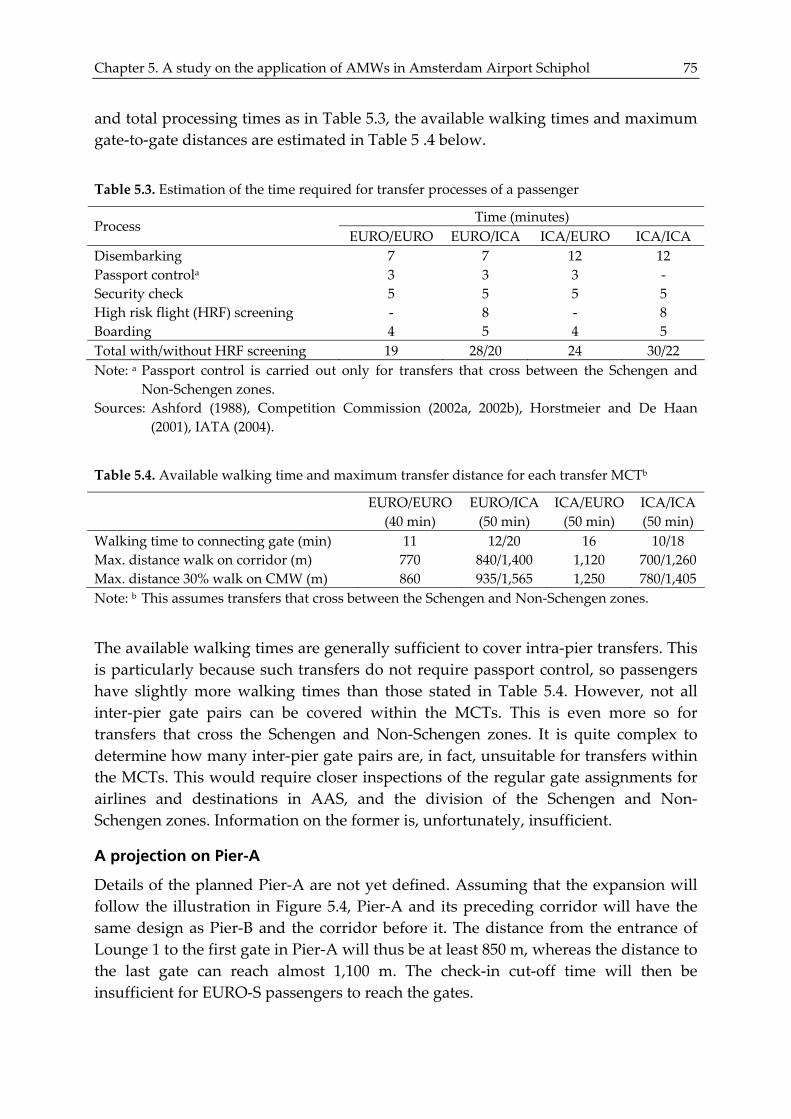
Chapter 5. A study on the application of AMWs in Amsterdam Airport Schiphol 75
and total processing times as in Table 5.3, the available walking times and maximum gate‐to‐gate distances are estimated in Table 5 .4 below.
Table 5.3. Estimation of the time required for transfer processes of a passenger
Time (minutes) Process
EURO/EURO EURO/ICA ICA/EURO ICA/ICA Disembarking 7 7 12 12 Passport controla 3 3 3 ‐ Security check 5 5 5 5 High risk flight (HRF) screening ‐ 8 ‐ 8 Boarding 4 5 4 5 Total with/without HRF screening 19 28/20 24 30/22 Note: a Passport control is carried out only for transfers that cross between the Schengen and
Non‐Schengen zones. Sources: Ashford (1988), Competition Commission (2002a, 2002b), Horstmeier and De Haan
(2001), IATA (2004).
Table 5.4. Available walking time and maximum transfer distance for each transfer MCTb
EURO/EURO
(40 min) EURO/ICA(50 min)
ICA/EURO (50 min)
ICA/ICA (50 min)
Walking time to connecting gate (min) 11 12/20 16 10/18 Max. distance walk on corridor (m) 770 840/1,400 1,120 700/1,260 Max. distance 30% walk on CMW (m) 860 935/1,565 1,250 780/1,405 Note: b This assumes transfers that cross between the Schengen and Non‐Schengen zones.
The available walking times are generally sufficient to cover intra‐pier transfers. This is particularly because such transfers do not require passport control, so passengers have slightly more walking times than those stated in Table 5.4. However, not all inter‐pier gate pairs can be covered within the MCTs. This is even more so for transfers that cross the Schengen and Non‐Schengen zones. It is quite complex to determine how many inter‐pier gate pairs are, in fact, unsuitable for transfers within the MCTs. This would require closer inspections of the regular gate assignments for airlines and destinations in AAS, and the division of the Schengen and Non‐Schengen zones. Information on the former is, unfortunately, insufficient.
A projection on Pier-A
Details of the planned Pier‐A are not yet defined. Assuming that the expansion will follow the illustration in Figure 5.4, Pier‐A and its preceding corridor will have the same design as Pier‐B and the corridor before it. The distance from the entrance of Lounge 1 to the first gate in Pier‐A will thus be at least 850 m, whereas the distance to the last gate can reach almost 1,100 m. The check‐in cut‐off time will then be insufficient for EURO‐S passengers to reach the gates.

76 Exploring aspects in the application of long accelerating moving walkways
Whether or not Pier‐A will handle transfer traffic is not yet known. Intra‐pier transfers might not be a problem. However, the walking distances for inter‐pier transfers to/from Pier‐A are likely to be long. It may be particularly difficult to assign transfers from/to Non‐Schengen gates within the MCTs.
5.3.2 AMWs in Schiphol Centrum
Possible locations
As discussed in Chapter 4, the recommended minimum length at which AMWs should be built is 120 m. At this length, the AMWs offer significant travel time reduction compared to CMWs that may justify their installation. However, as seen in Figure 5.2, Schiphol Centrum is already a built‐up area. Each part of the terminal has certain structure, layout and function, which should be taken into account when planning for AMWs of at least 120 m long.
Lounges 1 and 2, for example, are around 160 and 180 m long, respectively. Having AMWs in these locations would be particularly useful for passengers who need to transfer from, for instance, Pier‐C to Pier‐E. However, the lounges house various commercial retails and service facilities. Installing AMWs here can limit crossing pedestrian flows, thus reducing the accessibility of passengers to the amenities. Considering the growing importance of retailing as part of the revenue generating strategy of airports (Freathy and O’Connell, 1998), this effect will not be desired.
Similarly, installing AMWs at floor level at the piers could help reduce the amount of walking and travel time, especially for passengers with gates at the pier end. However, the AMWs may limit access to other gates located along the way. Passengers with gates far from the entrance and exit of the AMWs cannot benefit from the investment. Crossing pedestrian flows, which may occur during intra‐pier transfers, will also be disturbed.
Hence, parts of Schiphol Centrum viewed most suitable for AMW installations are the corridors. Because corridors function to connect lounges and piers, travel time and walking distance reductions in the corridors will contribute to those of lounge‐to‐gate and inter‐pier gate‐to‐gate journeys. There are four corridors in AAS, namely the BC‐corridor between Piers B and C, the Holland Boulevard between Piers E and F, the G‐corridor between Lounge 3 and Pier‐G, and the M‐corridor between Lounge 4 and Pier‐H/M. These corridors have lengths between 150 to 300 m and are all currently served by CMWs.
The BC‐corridor, G‐corridor and M‐corridor, in particular, do not house any commercial retails or service facilities. Furthermore, there are no access points at the sides of these corridors. Hence, no crossing pedestrian flow occurs. Since a bidirectional pedestrian traffic is mainly present, there are possibilities to install long AMWs in these locations. For these empty corridors, it is expected that the AMWs

Chapter 5. A study on the application of AMWs in Amsterdam Airport Schiphol 77
will not only reduce walking distance and travel time but also improve passengers’ perception on the corridors, which may otherwise seem longer than they actually are. However, a different situation applies to Holland Boulevard. One side of this corridor is used as a lounge, housing commercial retails and service facilities. At the other side, CMWs are currently installed. This leaves the area in the middle for pedestrian circulation. With such a layout, an initial evaluation suggests that it may be possible to replace the CMWs with a long AMW without disturbing the pedestrian circulation. There may be concerns that the commercial retails will be affected because passengers using the long AMW will directly bypass them. However, a significant fraction of AAS transfer passengers traverse through Holland Boulevard every day, so travel time reduction in this location can help maintain the MCTs. This presents two opposite needs. Airlines would like passengers to be able to move quickly through the terminal. In contrast, owners of commercial retails would like them to stay as long as possible in the lounge. For AAS, both interests are important for the airport’s revenue and competition.
Related to the airport expansion plan, a corridor will connect Pier‐A to Pier‐B as illustrated in Figure 5.3. If this new AB‐corridor has a similar concept as the current BC‐corridor, then AMWs can be installed without interrupting any crossing flows.
Transport demand
In their design guideline, AAS requires moving walkways in the airport to have a minimum width of 1.4 m. Furthermore, the moving walkways must be able to handle 117 passengers per minute or 7,020 p/h/d. The width and effective capacity of present day AMWs do not fulfil these requirements. However, the currently installed CMWs in Schiphol Centrum do not exactly fulfil the requirements either. Some of them are not 1.4 m wide. Those that have widths of 1.4 m typically operate at 0.75 m/s, giving an effective capacity of only 6,750 p/h/d based on the assumption that, due to practicality and comfort, only two passenger lanes will form. This somewhat suggests that deviation from the guideline is possible provided that the moving walkway can still accommodate the peak hour demand in the location.
Based on data in 2006, the peak hour demands in the above mentioned corridors are all under 2,000 p/h/d. This is less than half of the effective capacity of a 1.2 m wide AMW, which is 5,580 or 5,850 p/h/d for an entry speed of 0.62 or 0.65 m/s, respectively. Even when estimated to follow the 4 to 5% growth in passenger number, the AMW will still be able to meet the peak hour demands in the year 2015, i.e. when the maximum capacity of Schiphol Centrum will have been reached.
Expected benefits
I evaluate the expected benefit from applying AMWs in the aforementioned corridors, specifically in terms of reducing travel time and walking distance. The current situations and the proposed modifications are described in Table 5.5. The

78 Exploring aspects in the application of long accelerating moving walkways
travel times of the alternative modes in each corridor are presented in Table 5.6. Here I assume an average walking speed of 1.17 m/s, a CMW speed of 0.75 m/s, and an AMW entry and maximum speed of 0.62 and 2.5 m/s respectively. Walkers on the moving walkways have an average speed of 1.04 m/s as stated in Chapter 4.
Table 5.5. Current situations and proposed modifications in the corridors
Corridor Total length
Current CMWs per direction Proposed AMW per directionc
BC 290 m 2 x 60 m + 1 x 48 m, landing 10 m 245 m G 210 m 2 x 63 m, landing 13 m 180 m M 160 m 2 x 58 m, landing 16 m 135 m Holland Boulevard 210 m Direction‐1: 98 m + 62 m, landing 10 m
Direction‐2: 98 md
175 m 105 m
ABe 290 m 2 x 60 m + 1 x 48 m, landing 10 m 245 m Note: c The proposed AMW should leave sufficient free space at both ends of the corridor for safe
pedestrian circulations due to intersection of walking areas. d The other 62 m CMW is not installed because there is a baggage pre‐sorter system below
the location (Schiphol Group, 2009b). Thus, the floor is not deep enough for the CMW pit. e It is assumed that the AB‐corridor has the same concept as the current BC‐corridor.
Table 5.6. Travel times of alternative modes in the corridors, expressed in minutesf
Use CMW Use AMW Corridor
Walk the whole length Stand Walk Stand Walk
BC 4.13 (1.0) 5.47 (1.32) 3.30 (0.8) 2.35 (057) 1.91 (0.46) G 2.99 (1.0) 4.00 (1.34) 2.37 (0.79) 1.71 (0.57) 1.39 (0.47) M 2.28 (1.0) 3.20 (1.41) 1.71 (0.75) 1.34 (0.59) 1.11 (0.49) Holland Boulevard‐1g 2.99 (1.0) 4.27 (1.43) 2.20 (0.74) 1.75 (0.58) 1.44 (0.48) Holland Boulevard‐2h 2.99 (1.0) 3.77 (1.26) 2.51 (0.84) 2.28 (0.76) 2.11 (0.71) AB 4.13 (1.0) 5.47 (1.32) 3.30 (0.8) 2.35 (0.57) 1.91 (0.46) Note: f Numbers in the brackets are the relative travel time of a mode when referred to the
walking time on the whole length of the corridor. g The direction with two CMWs, from Pier‐E to Pier‐F h The direction with one CMW, from Pier‐F to Pier‐E
Table 5.6 shows that, if a passenger uses the CMWs in a corridor as riders (i.e. standing on the treadway), he will travel approximately 34% slower than if he simply walks the whole way. If he uses the CMWs as walkers, he reduces his travel time by around 22 and 43% compared to walking on the corridor and standing on the CMWs, respectively. The CMWs can, thus, function to reduce travel time only if passengers can walk on the treadway. Otherwise, it only serves to reduce physical efforts. Walking on the CMW still require physical effort but at a lower level because passengers generally lower their pace (Young, 1999).

Chapter 5. A study on the application of AMWs in Amsterdam Airport Schiphol 79
In contrast, a long AMW in the corridor provides the possibility to not only reduce the physical effort but also travel time regardless of whether the passenger stands or walks on the treadway. Travel time savings of around 42 and 53% are reached when a passenger traverses the corridor making use of the AMW by standing and walking, respectively, compared to when walking on the corridor the whole way. Furthermore, by standing and walking on the AMW, the corridor can be travelled approximately 58 and 39% faster than by standing and walking on the CMWs, respectively. Even when a passenger chooses to just stand on the AMW, he can still travel around 26% faster than when walking on the CMW.
As discussed in Section 5.3.1, O/D ICA passengers have sufficient time to reach their gates if they enter the lounge directly after the cut‐off times, whereas O/D EURO‐S passengers have just enough time to reach the farthest Schengen gate. For these passengers, the presence of AMWs in Schiphol Centrum increases the possibility to reach their gates and complete their processes within the allotted time. On the other hand, although CMWs are provided, O/D EURO‐NS passengers with last minute check‐in cannot complete their processes in time if their gates are beyond 600 m from the lounge. Such gates are found in Pier‐DI (13 gates) and Pier‐H (3 gates). Unfortunately, none of the proposed AMWs in Table 5.6 can contribute to reduce the lounge‐to‐gate walking times to Pier‐DI. The AMW proposed for the G‐corridor reduces the lounge‐to‐gate walking times to Pier‐H by a maximum of 12% compared to the CMWs. This only gives an additional travel distance of around 74 m. The last two gates are, thus, still unreachable within the cut‐off time.
The extent to which the proposed AMWs contribute towards reducing inter‐pier gate‐to‐gate travel times depends on how many percent of the route they cover. In average, for long inter‐pier gate‐to‐gate distances, the AMWs provide assistance for around 21% of the journey, leaving 19% to be covered by CMWs and the rest unaided. Hence, the travel time can be reduced by 8 or 11% when standing or walking on the AMWs, respectively. This increases the possibility of transfer passengers to reach their connecting gates in time, thus reducing the risk of departure delays or passenger misconnections. Subsequently, it may avoid airlines from having to pay direct costs associated with delays and misconnections, as well as indirect costs due to the loss of goodwill (Hafizogullari et al., 2002). Alternatively, farther inter‐pier distances can be reached within the available walking times as shown in Table 4.7 below. This opens the possibility to assign short connection times to an additional 45 inter‐pier gate pairs for each transfer type, which increases gate utilization and airport productivity. Exceptions from the above apply for gate pairs between Piers C, D, and E because no AMWs can be installed between them.
To evaluate the contribution of the proposed AMWs towards the future Pier‐A, it is assumed that the number and positions of gates in Pier‐A are identical to those in Pier‐B, and similar CMWs as in Pier‐B are installed in Pier‐A. With the availability of

80 Exploring aspects in the application of long accelerating moving walkways
AMWs in the AB‐corridor, O/D EURO‐S passengers with last minute check‐in can complete their processes in time if their gates are located up to 990 m from the lounge, assuming they stand on the AMWs. This leaves five gates inaccessible within the cut‐off time. If they walk on the AMWs, passengers with gates up to 1,075 m from the lounge can complete their processes, leaving one gate inaccessible within the cut‐off time. With respect to long inter‐pier gate‐to‐gate distances with Pier‐A, the proposed AMWs provide assistance for an average of 33.5% of the journey, leaving 23.5% to be covered by CMWs and the rest unaided. If passengers only stand on the AMWs, the maximum distances for transfer within the MCTs are 1,030 m for EURO/EURO and 1,500 m for ICA/EURO. For EURO/ICA, the maximum distance is 1,885 or 1,125 m, the latter if HRF screening is required. Finally, due to its position in the Schengen part of the terminal, Pier‐A is not expected to handle ICA/ICA transfers.
Table 5.7. Maximum inter‐pier transfer distance for each transfer MCT when using AMWsi
EURO/EURO
(40 min) EURO/ICA(50 min)
ICA/EURO (50 min)
ICA/ICA (50 min)
Walking time to connecting gate (min) 11 12/20 16 10/18 Max. distance if standing on AMW (m) 930 1,015/1,695 1,355 845/1,525 Max. distance if walking on AMW (m) 960 1,050/1,755 1,400 875/1,580 Note: i This assumes transfers that cross between the Schengen and Non‐Schengen zones.
5.4 Evaluation of AMWs for inter-terminal transport
AAS plans to build Schiphol Noordwest to accommodate long term capacity demand. In this section, how AMWs may connect this future terminal with Schiphol Centrum is evaluated. Since details on Schiphol Noordwest are not yet available, this evaluation can only be done based on preliminary descriptions from limited sources.
5.4.1 A projection on Schiphol Noordwest
Schiphol Noordwest came into plan due to the need to have extra capacity for aircraft buffer positions and passenger handlings after the year 2015. Its location at the northwest part of the airport across the A4 highway was selected based on considerations of land availability, position with regards to Schiphol Centrum and the runways, as well as planning suitability. For the initial phase, Schiphol Noordwest should be able to provide its first aircraft buffer position in the year 2010. Around the year 2015, it should be ready to receive the first overflow of passenger handling that cannot be carried out anymore in Schiphol Centrum. By 2020, the entire infrastructure of Schiphol Noordwest should be ready for passenger handlings. It is then important that the terminal has access to the nearby A4, A5 and A9 highways. Furthermore, a good connection with Schiphol Centrum is required,

Chapter 5. A study on the application of AMWs in Amsterdam Airport Schiphol 81
particularly to access the (inter)national and high‐speed rail network located underneath it (Schiphol Centrum, 2007c).
5.4.2 AMWs between Schiphol Noordwest and Schiphol Centrum
Considering that the hub activities of KLM and its partners will remain in Schiphol Centrum, the travel between Schiphol Noordwest and Schiphol Centrum is not necessarily subjected to constraint from the MCTs. Nevertheless, an acceptable travel time should be provided in order to maintain a good service level. As a comparison, I refer to the shuttle buses currently used to transport passengers between the long‐term parking area P3 and the entrance of the departure hall in Schiphol Centrum. The bus departs every 10 minutes and the journey takes 8 minutes (Amsterdam Airport Schiphol, 2009). Taking half of the headway as the mean waiting time, the total travel time of the average bus passengers is thus 13 minutes.
The straight distance between Schiphol Centrum and Schiphol Noordwest at the points shown Figure 5.9 is estimated to be around 2,000 m. This is within the potential coverage of AMWs, as previously discussed in Chapter 3. If a single‐span of approximately 2,000 m long AMW per direction is applied in this case, the travel time will be around 13.4 minutes if passengers stand or around 9.5 minutes if they walk on the treadway. This is competitive to the average travel plus waiting time of passengers with the shuttle buses. With AMWs there is no waiting time involved, which as stated in Chapter 3, is generally valued more negatively than in‐vehicle time by a factor of two (Brand and Preston, 2003).
Another alternative is to have a series of two AMWs per direction with a landing at the long‐term parking P3, as shown in Figure 5.10, based on the following consideration. Anticipating the need for more parking spots for the growing number of passengers and employees of companies in the airport, AAS has a mid‐term plan to expand P3. To add value to this area, facilities will be built with specific targets for those who park their cars at P3 and, of course, their cars. There are ideas for a hotel, restaurants, shops, entertainment, car service and rental, and even check‐in and baggage drop‐off services (Schiphol Group, 2007b). Passengers and employees using P3 may need to go to either Schiphol Noordwest or Schiphol Centrum. Then, it may be an option to have a pair of AMWs connecting Schiphol Centrum to P3 and another pair connecting P3 to Schiphol Noordwest. Each AMW may have a length of around 1,000 m. The travel time for each leg will be around 6.7 minutes when passengers stand on the treadway. There will be a small additional walk between the two AMW sections for those who need to travel directly between Schiphol Noordwest and Schiphol Centrum. Those with more time can visit the facilities in P3.
Because Schiphol Noordwest is not intended for flights involved in transfers, passengers do not have to remain in the non‐public part of the terminal. The AMWs can be placed at the public part of the airport. A possibility will be to have them

82 Exploring aspects in the application of long accelerating moving walkways
underground so that they do not interfere with the apron and runway. In this way, they can be at the same level as the underground train station in Schiphol Centrum. The concept will be somewhat similar to the AMW system in the Paris metro station.
Figure 5.9. The position of Schiphol Noordwest (NW) with respect to Schiphol Centrum (SC) and the long‐term parking area (P3). (Figure taken from Schiphol Group, KLM and Luchtverkeers‐leiding Nederland (2005), courtesy of Schiphol Group)
Figure 5.10. An alternative connection between Schiphol Noordwest (NW) and Schiphol Centrum (SC) via the long‐term parking area (P3). (Figure taken from Schiphol Group, KLM and Luchtverkeersleiding Nederland (2005), courtesy of Schiphol Group)
The transport demand between Schiphol Noordwest and Schiphol Centrum via P3 is not yet known. A rough estimation on the contribution of the parking area P3 toward the transport demand may be based on the capacity of the current shuttle buses. The transport capacity between P3 and Schiphol Centrum is estimated to be 600 p/h/d,
±1000 mNW
SC
P3
±1000 m
±2000 m
NW
SC
P3

Chapter 5. A study on the application of AMWs in Amsterdam Airport Schiphol 83
assuming six buses per hour per direction carrying 100 passengers per bus. It is presumed that such a shuttle bus schedule was taken to provide an optimal balance between good passenger service levels and efficient bus operations. Following a passenger growth rate of 4%, the transport demand between P3 and Schiphol Centrum will be 1,120 p/h/d in the year 2025. The transport demand for the leg between P3 and Schiphol Noordwest may be estimated to be 40% of this figure, based on the capacity ratio between Schiphol Noordwest and Schiphol Centrum.
Some passengers may also access the airport via the train station below Schiphol Centrum. In 2006, the share of access by train was around 35.4% (Schiphol Group, 2007b). With the prediction of the number of O/D passengers in 2025, a rough estimation would lead to around 2,000 passengers per hour by train. Considering the capacity ratio between Schiphol Noordwest and Schiphol Centrum, it may be estimated that only 40% of this figure would go to Schiphol Noordwest, giving a transport demand of around 800 p/h/d between Schiphol Centrum and Schiphol Noordwest.
The transport demand in the year 2025 is thus estimated to be around 2,000 p/h/d between Schiphol Centrum and P3, and around 1,250 p/h/d between Schiphol Noordwest and P3. These figures are within the effective capacity of an AMW system.
5.5 Conclusions
This study has presented the application of Accelerating Moving Walkways (AMWs) in Amsterdam Airport Schiphol (AAS) for intra‐terminal transport in Schiphol Centrum and for inter‐terminal transport between Schiphol Centrum and Schiphol Noordwest. As part of this thesis, the study served as an example to show how the characteristics of a location impose requirements and boundaries towards the application of AMWs.
In the case of AMWs for intra‐terminal transport in Schiphol Centrum, the fact that the terminal is already a built‐up area contributes to the complexity of the planning process. Although, from the point‐of‐view of walking distances alone, a number of locations may benefit from having AMWs, the current functions, layouts and passenger activities in those locations do not allow for AMW installations at floor level. In the end, only corridors are deemed suitable for installing AMWs without resulting in too many disturbances or modifications to the current situation. The proposed AMWs can bring 40 to 50% travel time reduction in each corridor where they are installed. In terms of overall travel times in the terminal, the AMWs only contribute to around 8 to 12% reduction. Even so, this opens the possibility to assign additional gates for handling passenger processes within the established time schedules and MCTs.

84 Exploring aspects in the application of long accelerating moving walkways
The evaluation of AMWs for inter‐terminal transport between Schiphol Centrum and Schiphol Noordwest could only be presented briefly due to lack of information regarding the new terminal. As in the previous case, the planning process for this purpose has to take into account the functions, layouts and passenger activities in Schiphol Centrum as well as Schiphol Noordwest. Existing infrastructures located between the two terminals, such as the long‐term parking P3 and the runways, also need to be considered. However, because these areas will still undergo developments in the mid‐ and long‐terms, the concepts for installing long AMWs can be incorporated into the overall development and construction plans.
The discussions in this chapter have mainly evaluated the application of AMWs in AAS from the point‐of‐view of passenger travel time and transport demand. A complete study should also evaluate these aspects against the required capital and operational costs for the systems. To identify the elements of the costs, a more detailed design concept for the AMW installations would be required, but this is not within the scope of this chapter.

85
Chapter 6
Analysing drive-related application aspects in long accelerating moving walkways
6.1 Introduction
Previous chapters have discussed aspects in the application of long Accelerating Moving Walkways (AMWs) for moderate distance people transport by evaluating the influence of the elements involved, i.e. the AMW itself, its passengers and the location. From the discussions in the first part of this thesis, it has been concluded that the competitiveness of AMWs for moderate distance transport can only be achieved if a long single span system is used to cover the whole travel distance. Related to this, it has been identified that some application aspects are still similar to those of relatively short AMWs, whereas other application aspects are affected when the systems become longer. These include technical as well as non‐technical issues (Kusumaningtyas and Lodewijks, 2006). Reflecting on the experience of long (overland) bulk material belt conveyor operations, one of the expected technical issues stems from the use of the single drive unit. For long AMW systems, it is envisaged that a multiple‐drive configuration will have to be applied.
This chapter focuses the discussion to the second research objective, i.e. to study the effects of applying multiple drives in long AMWs. To provide background for this research direction, Section 6.2 presents a number of application aspects from the previous chapters, selecting those that are related to the drive system and describing them from this point‐of‐view. The influence of the system dynamics towards these aspects is also explained. The approach of applying multiple drives and, eventually, drive control in long AMWs is discussed in Section 6.3. The effects of this approach is analysed by means of simulations. For this, the components of the considered AMW system is described in Section 6.4, followed by the description of the models in Section 6.5. Section 6.6 gives the conclusions.

86 Exploring aspects in the application of long accelerating moving walkways
6.2 Drive-related aspects
Drive‐related issues in the application of long AMWs arise from the fact that longer systems require more drive power. It is expected that continuing to use the single drive configuration of present day AMW may lead to some technical problems.
6.2.1 Components and support structure requirements
If a long AMW is driven by a single drive unit, either at the head or at the tail, a very large motor will have to be used to provide the required amount of power. The large drive force from the motor will be applied at a single point and transferred along the pallet‐chain, in the case of a pallet‐type AMW, or along the belt, in the case of a belt‐type AMW. This will result in a high peak in the chain or belt tension at the location of the drive. Hence, the chain/belt has to be strong enough to withstand the maximum transient tension. For the belt‐type AMW, an additional requirement holds that the belt has to be stiff enough to support the passengers without exceeding the prescribed sag limits.
If the chain/belt strength is too high, there is a possibility that the chain/belt becomes too stiff to bend over a normal sprocket or pulley. In this case, larger sprockets/pulleys may have to be used. The high chain/belt tension also applies a higher pull, thus leading to the requirement of stronger sprockets/pulleys as well as shafts. Larger and stronger components are typically heavier so they exert a higher load on the support structure or frame, which consequently needs to be made stronger as well. Finally, although its width may be kept the same, such a large construction will require a deeper pit space for installation. As exampled in Chapter 5, the availability of space under the floor can be limited, particularly if the location is already built‐up. The necessity to have non‐standard components and structure can also add to the capital costs. All this implies that there is a practical limit to the strength of chain or belt used in long moving walkways (Lodewijks et al., 2006).
Although it is possible to use a series of shorter (and, hence, smaller) AMWs with intermediate landings to span the desired transport distance, as discussed in the Chapters 3 and 4, in terms of travel time reduction a long single‐span AMW is more beneficial. Such a layout is also considered advantageous from the point‐of‐view of capital costs because the accelerating and decelerating sections are typically more expensive than the high‐speed part. Furthermore, as stated in Chapter 4, passengers may also find a single‐span AMW more convenient since they do not need to repeatedly step on and off a number of shorter systems, which may expose them to more body jerks (Kusumaningtyas and Lodewijks, 2007).

Chapter 6. Analysing drive‐related application aspects in long AMWs 87
6.2.2 System and passenger safety
From the drive system point‐of‐view, the safety of the AMW and its passengers is influenced by how the pallet‐chain or belt responds towards the applied drive force. This is particularly important to consider for transient conditions such as starting, stopping, loading and unloading. When a drive force is applied to the chain or belt, a stress wave is induced. During starting, for example, the chain/belt section at the location of the motor starts moving gradually and, as the wave propagates, its successive sections are put into motion (Zür, 1986). Due to the combination of the chain/belt’s elastic properties and distributed mass, the propagation of these longitudinal waves is damped by internal friction and motion resistances in the system. This results in variations of the chain or belt dynamics. Experience from bulk material belt conveyors shows that failure to include transient elastic response in the system design can lead to operational problems and even damage, particularly in long and high‐capacity systems and those with varying load distributions (Nordell and Ciozda, 1984).
For normal starting and stopping of the AMW, a long start‐up and stopping time can be chosen to minimize the transient dynamics, thus avoiding high tensions in the system. Furthermore, in normal operations, the AMWs are not allowed to be started or stopped with passengers onboard. Hence, the effect of transient dynamics towards passengers during normal starting and stopping can be waived.
A different situation may occur, however, in the case of starting and stopping related to the application of a power saving scheme, such as those stated in Chapter 4. When using the stop‐and‐go or idle‐to‐nominal method, the system has to accelerate to its nominal speed within the limited time between the moment a passenger is detected and the moment he/she steps foot on the treadway. Based on the experience of bulk material conveyor operations, it is expected that a longer AMW will need a longer starting time to achieve a smooth start‐up and reach a steady nominal speed for the entire length of the system. Such a longer required starting time might not be available within the present power saving scheme. On the other hand, reducing the starting time will influence the system tension and acceleration dynamics, which may affect the safety of the system and the passengers.
Another important situation is emergency stopping, in which there are still passengers onboard. When a sensor detects a problem or when an emergency stop button is pressed, the AMW breaking system must be able to stop the AMW as soon as possible to prevent injury, e.g. passenger entrapment. On the other hand, the stop should not be achieved too harshly such that the passengers fall (Al‐Sharif, 2004). For the stopping of Conventional Moving Walkways (CMWs), EN 115‐1:2008 (Comité Européen de Normalisation (CEN), 2008) and ASME A17.1 (Donoghue, 1981) have set standards for the stopping distance, deceleration or jerk. No guidelines are available

88 Exploring aspects in the application of long accelerating moving walkways
for AMWs, but it may be expected that the same standards will apply in order to enable the same prevention of danger. For a long AMW, aiming for the same stopping targets as for a shorter or slower system may involve the use of a high breaking load, which can bring unexpected stopping dynamics and higher jerks.
6.3 Research approach
As discussed in the previous section, it can be expected that a long AMW will require different system specifications compared to a shorter AMW if the single drive configuration is kept. Furthermore, the dynamic behaviour of a long single‐drive AMW is also expectedly different from a short single‐drive AMW when the starting and stopping settings are the same. However, it is not yet clear to what extent these aspects will differ and whether that will lead to the inapplicability of present day (accelerating) moving walkway standards, designs, and custom practices for longer AMWs.
On the other hand, research in the field of long bulk material belt conveyors have also found that the dynamic belt behaviour of a single‐driven system is comparable to the dominant behaviour found in a system with multiple drives, when the drive station spacing is set equal to the belt length of the single‐driven system (Nuttall, 2007). Then, the components of the multiple‐driven system can be designed according to those of the single‐driven system. Taking analogy, it may be expected that applying multiple drives may enable a long AMW to use the same components and operational settings of present day AMWs. Nevertheless, whether the multiple drives can bring the advantages that justify their application is not yet clear.
The above questions mainly rise from the fact that AMWs carry passengers, who have free minds to choose when to ‘load’ and how to ‘distribute’ themselves on the system. Hence, multiple‐drive settings that would succeed in bulk material belt conveyors, which load rate and distribution can be determined by the operator, might not work as expected in passenger conveyors. In this chapter, the above questions are investigated by means of comparing the operating behaviour of short single‐driven AMWs with that of long single‐driven and long multiple‐driven AMWs. First, the theories underlying the multiple‐drive approach are explained.
6.3.1 Multiple drives
In a multiple‐drive belt conveyor system, the multiple drives are installed at a number of positions along the length of the conveyor. Due to this, such a drive configuration is also known as a distributed‐drive system. Each drive station directly supplies the required power to overcome the resistances generated in the previous section. The main idea behind the use of multiple drives is to find the right balance between the locally applied drive power and the occurring resistance, so the belt tension stays within the safety margins in a controlled manner. With proper

Chapter 6. Analysing drive‐related application aspects in long AMWs 89
positioning of the drive stations, the maximum system tension can be limited to the desired specifications (Alspaugh, 2003; Nuttall and Lodewijks, 2004). The effect of implementing distributed drives to limit tension is shown in Figure 6.1. The amount of tension drop after passing a drive unit is equal to the amount of drive force required to run the conveyor section before that drive.
Figure 6.1. Effect of distributed drives to limit the belt tension. (Figure from Nuttall and Lodewijks (2004))
If applied to a long AMW, the lower maximum tension may give way to the use of pallet‐chain or belt with a lower strength, which is also lighter. It further leads to the possibility to use lighter as well as standardized components and support structure, regardless of the system length. In a long belt conveyor, the cost of the belt typically represents 25 to 30% of the total capital investment (Romani, 2000). Hence, the possibility to use a lighter belt may help to keep the costs of long conveyors reasonably low.
To implement a multiple‐drive configuration, the system designer need to determine the required number of drive stations and their positions, and determine how to control and coordinate the motors during start‐up, stopping, and steady‐state running. The aspects that affect the choice of number of drive stations and their positions have been explained by Nuttall and Lodewijks (2004).
6.3.2 Drive control
To successfully apply multiple drives in a long conveyor system, including a long AMW, attention have to be paid on how to match the power at each drive location to all the possible load variations that might exist (Alspaugh, 2003). For this, proper control for the drives is required. The drive control must be able to accurately and reliably compensate for varying load and friction conditions, as well as dynamic behaviours in the system, to produce a smooth and safe operation during transient as well as normal running. Good coordination among the multiple drives during all phases of the operation will be required to minimize the stresses on the system components. How this coordination should be carried out is the question.

90 Exploring aspects in the application of long accelerating moving walkways
Perhaps the simplest way of controlling multiple drives is by load sharing. If all drive stations in a multiple‐drive AMW are equipped with the same motors and given the same input frequency and voltage signals, then the drive stations will have more or less the same speed‐torque characteristics. Provided that the system is started or stopped smoothly, the pallet‐chain or belt dynamics will be small and the velocity of every point along the chain/belt will be virtually the same. When the system reaches its operational speed, the chain/belt speed will have equalized throughout the system. Then, being linked by a common drive rail, i.e. the chain or belt, each drive station will apply the same amount of drive force and, thus, equally share the total load. One central controller can be used for all motors, which keeps the conveyor system at the desired speed (Cowie, 2001; Nuttall, 2007).
When controlling the multiple drives by way of load sharing, attention should be given to the possibility of unexpected rise or fall of tension when there is an imbalance between the sized motors and the actual occurring loads (Nuttall, 2007). This can be a problem for the case of AMWs, since the occurring passenger load may continuously vary in time and space from the designed situation. It may then make sense to have drive stations utilising the same motor to supply different amounts of power based on the load demand on the specific section that they support. For this, the drive stations should be controlled individually.
From the above description, it can be stated that the control of the multiple drives in an AMW requires knowledge of the resistances met by the pallet chain or belt. This resistance is affected by the geometry of the system and the load on it. The effect of the geometry can be determined beforehand at the design stage. The influence of the load depends on the number of passengers on the moving walkway and their positions. Therefore, the drive control will depend on the accuracy of the knowledge of the distribution of the passengers. Due to the different nature of the loads in passenger conveyors and bulk conveyors, as has been described in the beginning of this section, the control procedures normally used for the multiple drives in bulk conveyors might not be suitable for the multiple drives in AMWs.
6.3.3 Dynamic simulations
To investigate the performance of short and long AMWs with single and multiple drives, a simulation approach is adopted. This is considered the best way to conduct the analysis without jeopardizing the safety of either the AMW system or the passengers, particularly when observing transient conditions. Furthermore, performing the research experimentally entails high costs and a large space for building the AMW setups, which need to be tested for the short, long, single‐drive and multiple‐drive cases with and without passengers. The variation of transient conditions that can be tested experimentally can be limited and investigations of worst case scenarios might not be possible. Experimental verifications of the
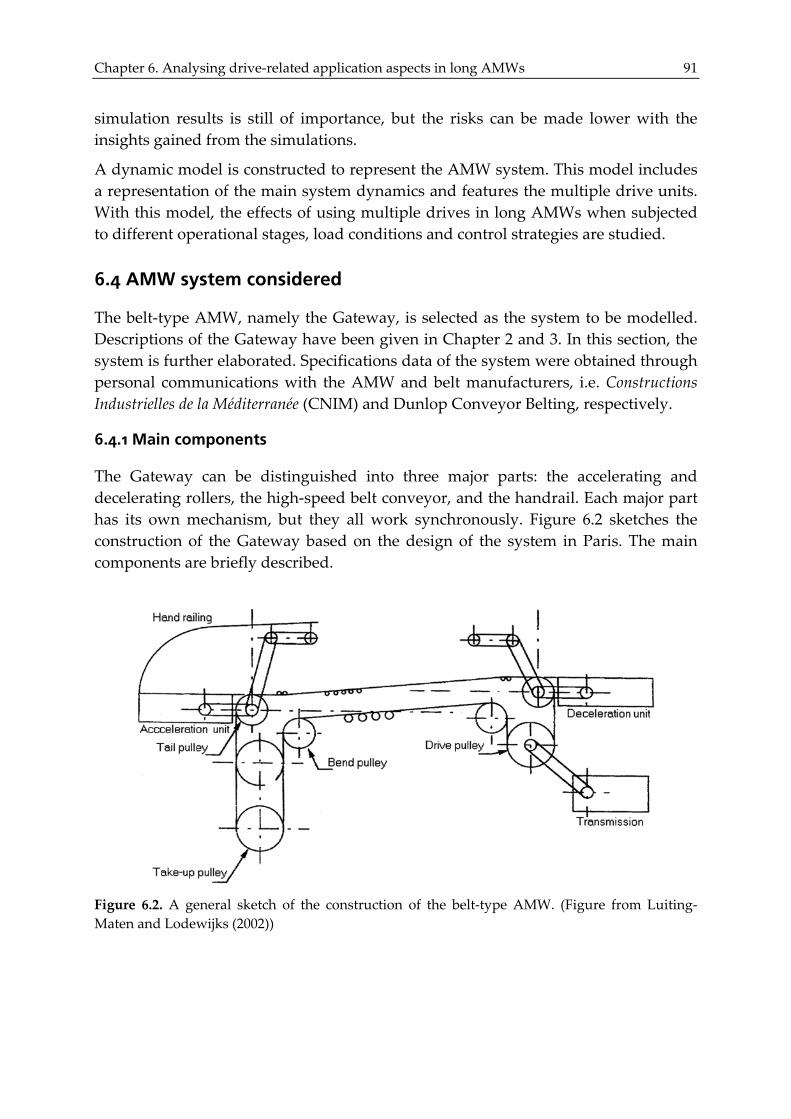
Chapter 6. Analysing drive‐related application aspects in long AMWs 91
simulation results is still of importance, but the risks can be made lower with the insights gained from the simulations.
A dynamic model is constructed to represent the AMW system. This model includes a representation of the main system dynamics and features the multiple drive units. With this model, the effects of using multiple drives in long AMWs when subjected to different operational stages, load conditions and control strategies are studied.
6.4 AMW system considered
The belt‐type AMW, namely the Gateway, is selected as the system to be modelled. Descriptions of the Gateway have been given in Chapter 2 and 3. In this section, the system is further elaborated. Specifications data of the system were obtained through personal communications with the AMW and belt manufacturers, i.e. Constructions Industrielles de la Méditerranée (CNIM) and Dunlop Conveyor Belting, respectively.
6.4.1 Main components
The Gateway can be distinguished into three major parts: the accelerating and decelerating rollers, the high‐speed belt conveyor, and the handrail. Each major part has its own mechanism, but they all work synchronously. Figure 6.2 sketches the construction of the Gateway based on the design of the system in Paris. The main components are briefly described.
Figure 6.2. A general sketch of the construction of the belt‐type AMW. (Figure from Luiting‐Maten and Lodewijks (2002))

92 Exploring aspects in the application of long accelerating moving walkways Accelerating and decelerating rollers
A roller in the accelerating or decelerating section comprises of a shaft forming an axle, with carrying disks for carrying the passengers and drive disks for driving the roller assembly. The drive disks have diameters that vary progressively between successive rollers, so that the rotational speeds of several successive rollers and the tangential speeds of their carrying disks produce the acceleration or deceleration effect desired. The carrying disks are of the same diameter, i.e. 25 mm (Cote and Gempp, 1997). As shown in Figure 6.3, they are specially designed to intermesh. A description of the mechanism is given in US Patent 5234095 (Patin, 1993).
Figure 6.3. Intermeshing of accelerating/decelerating rollers. (Figure courtesy of Jan Carel Paro)
The transitions between the accelerating/decelerating rollers and the high‐speed belt conveyor are accommodated by means of transfer plates, as depicted in Figure 6.4. Small rollers are assembled on transfer plate forming a surface on which passengers can glide from the accelerating/decelerating rollers to/from the belt. Details about the transfer plate are described in the US Patent 6978875 B2 (Diaz, 2005).
Figure 6.4. A transfer plate is fitted between the accelerating/decelerating rollers and the belt. (Figure courtesy of Jan Carel Paro)
Belt
The high‐speed belt conveyor is designed following existing rules and practices developed for CMWs. The conveyor uses the Starglide passenger belt (Dunlop Conveyor Belting, 2009a), which is a steel‐reinforced rubber belt specially designed for passenger transport. The top rubber cover has grooves that fit with the combs of
Transfer plate

Chapter 6. Analysing drive‐related application aspects in long AMWs 93
the transition plate, which avoids objects from getting trapped into the system. The steel cords provide the required rigidity. A cross‐section of the belt is shown in Figure 6.5.
The top and bottom steel cords are oriented in the lateral (weft) direction. This provides high transverse rigidity to support the passengers. The steel cords in the middle, which are oriented in the longitudinal (warp) direction, provide a lower flexural rigidity. The belt needs to be strong enough to transmit tension forces, but it also need to be able to wrap around the pulleys.
Figure 6.5. The steel‐reinforced belt is grooved in the longitudinal direction. (Figure courtesy of Gabriel Lodewijks)
The breaking strength of the belt per unit belt width is 500 N/mm. Combined with the belt width and the safety factors, the allowable belt tension during operation can be determined. The DIN 22101 standard (Deutsches Institut für Normung (DIN), 2000) defines safety factors for transient and stationary conditions by SA and SB respectively. For steel‐cord belts in normal operating condition, the actual safety factor S along a belt has to fulfil SA ≥ 5.4 during starting and stopping and SB ≥ 8.0 during steady state operation. This is in accordance with the ASME A17.1‐1981 (Donoghue, 1981) and the EN 115‐1:2008 (CEN, 2008) standards, which prescribe a safety factor of at least 5.0 for the belt.
The actual safety factor is defined as
⋅= Nk BST
, (Eq. 6.1)
where kN is the breaking strength of the belt, B is the belt width and T is the belt tension, which may vary along the belt. The width of the Starglide belt in the AMW, including the part under the skirts, is 1,270 mm. This leads to a maximum allowable belt tension of 79.4 kN during steady state operation and 117.6 kN during starting and stopping.
Under normal operating conditions, the belt material exhibits a linear strain‐stress characteristic. The belt stiffness can, thus, be represented by a constant modulus of
Grooves
Longitudinal steel cords
Lateral steel cords

94 Exploring aspects in the application of long accelerating moving walkways
elasticity Eb. This is 667 N/mm2 for the Starglide belt (Dunlop Conveyor Belting, personal communications, 1 December 2006). This value is calculated over the entire cross sectional area of the belt, which has a thickness of 30 mm.
The belt is spanned between the head and tail pulleys that are 800 mm in diameter. The wrap angle of the belt around these pulleys is increased by using bend pulleys or snubs, which are 500 mm in diameter. Besides giving more contact surface for traction, this also reduces the required pit depth for the return belt strand.
A tensioning device or take‐up is applied to compensate for belt stretch and to allow for the transfer of drive force. This sets a pre‐tension level to the belt and ensures sufficient slack‐side belt tension, which prevents belt slip and provides the required contact pressure on the drive pulley to transmit the effective drive force. In the present AMW, a screw take‐up is applied at the tail pulley, giving a pre‐tensioning force per unit belt width of 20 N/mm. This is a manual or fixed take‐up, typically used for relatively short belt conveyors. Such a take‐up is usually not applied in relatively long systems due to its inability to compensate for changes in the belt tension during starting, stopping and varying loading conditions (Jackson et al, 1993; James, 1994). Based on EN 115‐1:2008 (CEN, 2008), the belt of a moving walkway should be tensioned continuously and automatically. This can be done, for example, with an electrical winch.
Support rolls
The upper (carrying) strand of the belt is supported at its edges by a series of support rolls or idlers, as shown in Figure 6.6.
(a) (b)
Figure 6.6. (a) The upper belt strand is supported by idlers at its edges. (b) The idler features a plastic shell fitted with a ball bearing. (Figure (a) courtesy of Schindler, Figure (b) from Luiting‐Maten and Lodewijks (2002))
These idlers have a diameter of 85 mm and a width of 35 mm. They are made of Acetal Poly‐Oxy‐Methylene Copolymer (POM), a type of material that is rigid and tough, has good abrasion and creep resistance, as well as low coefficient of friction
Skirt
Side rolls
Support rolls (idlers)

Chapter 6. Analysing drive‐related application aspects in long AMWs 95
(AZoM, 2001). It is also a slow burning material with little of no smoke generation, which is an important characteristic for a system intensively used by people. The density of the material is 1,410 kg/m3. The idlers are fitted with single row deep groove ball bearings of type 6305‐2RS1 (SKF Group, 2009a). The inner diameter of the bearing is 25 mm, whereas the outer diameter is 62 mm. By means of a threaded shaft, the idler is bolted onto the support structure. The idler spacing is 150 mm.
The lower (return) strand is supported by full‐width support rollers, which have a diameter of 89 mm and are spaced 2 m apart. No information was available about the bearings in these rollers, so similar bearing type as above is assumed.
Drive unit
The present belt‐type AMW is powered by a single drive unit consisting of an AC motor and a gear box. The drive force is transferred to the belt through the head pulley, which also makes it a drive pulley. This single drive unit is also used to drive the accelerating and decelerating rollers as well as the handrail. The drive forces for these units are derived from the belt. Consequently, a high pre‐tension in the belt is required (Luiting‐Maten and Lodewijks, 2002).
The above drive configuration is quite similar to that of typical Conventional Moving Walkways (CMWs) nowadays. A possible difference is the location of the drive unit, which, for the Gateway system, is underneath the decelerating section. For CMWs, the drive unit may be placed after and at the same level as the drive pulley, as shown in Figure 6.7(a), which enables the use of a smaller pit‐depth. Such a position may not be possible for the AMW because the motor may interfere with the mechanism of the accelerating or decelerating section.
The motor of the Gateway system in Paris, depicted in Figure 6.7(b), has a power rating of 200 kW. This motor rating is actually an overkill because, even when fully loaded, the system would not require all this power (Rémi Besson, personal communication, 22 March 2007). Furthermore, the motor is placed in the basement of the metro station underneath the AMW belt, which is quite large. Such a space may not be available in other locations, putting restrictions to the choice of the drive unit.
Handrail
As seen in Figure 6.8 below, the handrail system consists of a continuous handrail guide, on which individual handgrips are mounted. The spacing between these handgrips varies from the entrance to the exit of the AMW depending on the speed of the treadway. This is enabled by a mechanism that comprises of a guiderail and a series of moving carts. Each block has two caterpillar belts of a fix length. Each caterpillar belt links two adjacent carts to two adjacent handgrips. The distance of the guiderail to the handrail guide is specially made such that, when the carts move along the guiderail, the caterpillar belts retain their fix length resulting in the sliding

96 Exploring aspects in the application of long accelerating moving walkways
of the handgrips that is synchronized with the speed of the treadway. More on this mechanism can be found in the US Patent 6367608 B1 (Franceschi, 2002).
(a) (b)
Figure 6.7. The drive unit of the belt‐type AMW is quite similar to that of a CMW. However, the drive unit of the CMW (a) can be placed at the same level as the drive pulley, whereas that of the AMW (b) need to be placed underneath the conveyor. (Figure (a) from private collection, Figure (b) courtesy of Gabriel Lodewijks)
Figure 6.8. A special handrail mechanism enables the individual handgrips to move synchronously with speed of the treadway. (Figures courtesy of CNIM (left) and Gabriel Lodewijks (right))
It should be noted that this study focuses only on the high‐speed belt conveyor, which comprises of the belt, the support rolls and the drive unit. Other parts, namely the accelerating/decelerating rollers and the handrail, are not taken into further consideration. Although they contribute to the total required drive power for the system, they do not influence the dynamics of the belt because their mechanisms are separate. Furthermore, if the system will be powered by multiple drives, the accelerating/decelerating rollers and handrails can be driven separately from, but coordinated with, the high‐speed belt.
Handrail guide
Caterpillar belt
Individual handgrip
Guiderail Cart

Chapter 6. Analysing drive‐related application aspects in long AMWs 97
6.4.2 Assumptions for investigating multiple drives
To investigate the application of multiple drives in the belt‐type AMW, a number of assumptions have to be taken. This is due to the fact that the present belt‐type AMW is a single‐drive system and no multiple‐drive AMW has ever been developed. Hence, there is no practical example of how the multiple drives are positioned and how the drive forces are applied.
The closest case may be the multiple‐drive escalators from Westinghouse (Westinghouse Electric Corporation, 1973) and Mitsubishi (Kitamura et al., 1993), which are constant speed systems. To move the steps, these escalators employed a toothed rack, which they called step link, instead of a step chain. The rack teeth would engage to the polyurethane rollers of a drive chain, which is driven by the drive sprocket in each drive unit, hence pulling the steps up or down. Such drive units can also be used for a multiple‐drive pallet‐type CMW. However, it can be complex to install it for a multiple‐drive pallet‐type AMW because the accelerating/decelerating sections of the present day pallet‐type AMW are continuous with the high‐speed section. Due to the way the pallets extend and retract, having multiple drives in such a system may require drive units with different tooth‐pitches for different locations along the AMW.
In this study, it is assumed that the drives of the belt‐type AMW are applied with the same principle as those of the Enerka Becker System (EBS). This is a special type of closed bulk material belt conveyor that has multiple drives along the belt (Dunlop Conveyor Belting, 2009b; Enclosed Bulk Systems, 2009). As seen in Figure 6.9, each drive station in this system has two identical symmetrical AC motors, each connected to a drive wheel. The drive wheels press onto the surface of slightly curved triangular rubber profiles that are vulcanized to the edges of the main belt. This transfers the drive forces to the belt. In an EBS conveyor, the distance between the drive units can be 40 to 100 m. The drives may be connected directly on‐line to the supply, through a soft starter or through an inverter.
Figure 6.9. The drive unit of the Enerka Becker System. (Figures courtesy of Fenner Dunlop B.V.)
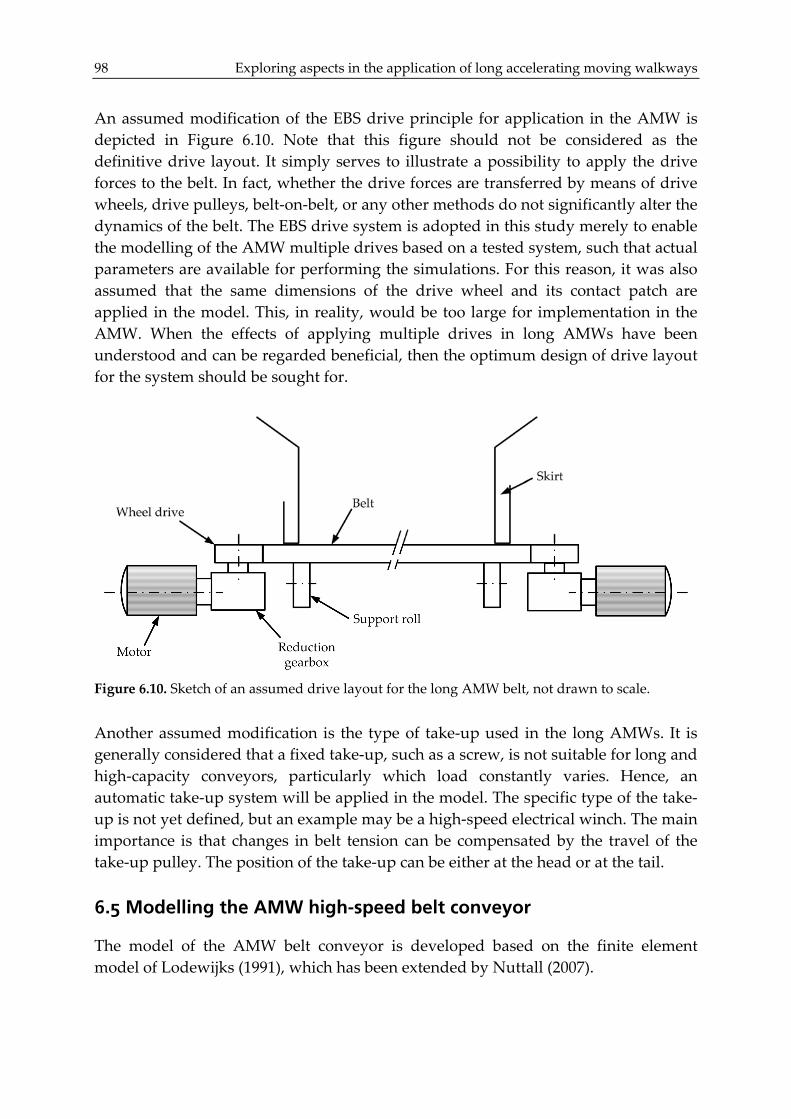
98 Exploring aspects in the application of long accelerating moving walkways
An assumed modification of the EBS drive principle for application in the AMW is depicted in Figure 6.10. Note that this figure should not be considered as the definitive drive layout. It simply serves to illustrate a possibility to apply the drive forces to the belt. In fact, whether the drive forces are transferred by means of drive wheels, drive pulleys, belt‐on‐belt, or any other methods do not significantly alter the dynamics of the belt. The EBS drive system is adopted in this study merely to enable the modelling of the AMW multiple drives based on a tested system, such that actual parameters are available for performing the simulations. For this reason, it was also assumed that the same dimensions of the drive wheel and its contact patch are applied in the model. This, in reality, would be too large for implementation in the AMW. When the effects of applying multiple drives in long AMWs have been understood and can be regarded beneficial, then the optimum design of drive layout for the system should be sought for.
Figure 6.10. Sketch of an assumed drive layout for the long AMW belt, not drawn to scale.
Another assumed modification is the type of take‐up used in the long AMWs. It is generally considered that a fixed take‐up, such as a screw, is not suitable for long and high‐capacity conveyors, particularly which load constantly varies. Hence, an automatic take‐up system will be applied in the model. The specific type of the take‐up is not yet defined, but an example may be a high‐speed electrical winch. The main importance is that changes in belt tension can be compensated by the travel of the take‐up pulley. The position of the take‐up can be either at the head or at the tail.
6.5 Modelling the AMW high-speed belt conveyor
The model of the AMW belt conveyor is developed based on the finite element model of Lodewijks (1991), which has been extended by Nuttall (2007).

Chapter 6. Analysing drive‐related application aspects in long AMWs 99
6.5.1 Belt dynamics
Since this study is mainly focused on how the belt tensions and accelerations react in a multiple‐drive configuration, only the longitudinal elastic response of the belt is investigated. Furthermore, in an AMW, transverse oscillation of the belt is expected to be low because the system uses a stiff belt and a small idler spacing.
To study the longitudinal elastic response using the finite element approach, the belt is divided into a finite number of elements that are modelled as strings. The distributed mass of the belt and the mass of the passengers in each element is divided equally over the element nodes. The mass of the idlers in each element is also accounted by dividing their reduced mass (i.e. the rotational inertia of the idlers expressed as a mass moving in the direction of the belt) to the element nodes. These lumped mass elements are connected by linear spring elements, which represent the stiffness of the belt.
The belt is then split at the location of the tensioning device, such that the system can be laid out in the x‐direction. The elements and the nodes are numbered in sequence starting from the tensioning devise and increasing in the direction of the belt’s movement. This is depicted in Figure 6.11 for a simplified version of the sketch in Figure 6.2.
Figure 6.11. Finite element model of a simplified AMW belt conveyor with n belt elements.
The first and last nodes in the above figure represent the locations where the belt leaves and enters the take‐up pulley, respectively. The tensioning force Ft is equally divided over these two nodes, whereas the dynamic mass of the tensioning device is divided based on the relationship that describes the displacement of the take‐up pulley yt as follows
( )= −112t ny u u , (Eq. 6.2)
100 Exploring aspects in the application of long accelerating moving walkways
where u1 and un are the displacements of the first and the last nodes.
In the finite element model above, the entrance is placed at the same node as the tensioning device, whereas the exit is at the same node as the drive station. This is acceptable because the distance between the entrance and the tensioning device, as well as the distance between the exit and the drive station, are relatively short compared to the total length of the belt. Accordingly, if a drive station is located directly next to the tensioning device then both components can be considered as one mass element. Due to the short belt section between the two components, they will most likely be within one belt element.
The influence of the belt speed on the longitudinal elastic response of the belt is negligible (Lodewijks, 1996). This is due to the fact that the maximum operating speed of the AMW belt, which is 2.5 m/s, is far lower than the propagation speed of longitudinal stress waves in the belt. The wave propagation speed c1 can be calculated with the equation
=+1 ʹ ʹb
b l
E Acm m
, (Eq. 6.3)
where m’b and m’l are the mass of the belt and the load per unit length, respectively, and A is the area of the belt cross section. The 1,270 mm wide Starglide belt has a thickness of 30 mm and it weighs 52.27 kg/m. Hence, the wave propagation speed is 697 m/s for an empty belt. An example of the influence of load on the wave propagation speed is given for the case of a belt with passengers standing at the comfortable interpersonal spacing as discussed in Chapter 4. Here, a strip of belt 1 m long and 1.2 m wide will effectively be occupied by 2.5 passengers. Assuming a weight of 100 kg per person, derived from the design load in EN 115‐1:2008 (CEN, 2008), the load per unit belt length is 250 kg/m. This results in a minimum wave propagation speed of 290 m/s for the above loading condition.
If modelled as a string, the natural frequencies ωn of a moving belt element spanning the distance L between two idler sets can be calculated by (Lodewijks, 1996)
πω⎛ ⎞
= − =⎜ ⎟⎝ ⎠
2
1 21
1 , 1,2,3,...bn
vn c nL c
(Eq. 6.4)
Using the above equation, if the belt speed vb is neglected by setting it to zero, the maximum error in the frequency of the first harmonic is smaller than 0.01% for a loaded belt operating at 2.5 m/s. Hence, the belt elements can be considered stationary with respect to the support structure without resulting in a noticeable error. By expressing the displacement of each node relative to the displacement of the first node, the first node is effectively fixed to a stationary position whereas the other nodes can move relative to this point as a result of the strain in the elastic belt.

Chapter 6. Analysing drive‐related application aspects in long AMWs 101
External forces acting on the belt, such as motion resistances and drive forces, are incorporated into the dynamic belt model by allocating them to the corresponding nodes. In this way, the above finite element model can be easily adapted from a single‐drive to a multiple‐drive system. The additional drive stations can be added by directly applying the drive forces to the nodes where the drive stations are located. This consequently affects the choice of the belt element size, as the nodes need to coincide with the location of the drive stations.
The dynamic behaviour of the belt is represented by a set of equations derived based on the principle of virtual work of the belt elements (Lodewijks, 1991). The system’s internal work is solely contributed to the stiffness of the belt elements. The components of the external work relate to:
(i) the acceleration mass of the belt, idlers and passengers,
(ii) the impulse of the flowing belt and passenger mass (due to the stationary representation of the elements),
(iii) the displacement of the tensioning force,
(iv) the inertia of the take‐up pulley,
(v) the system motion resistances, and
(vi) the drive forces.
Note that the virtual work equations from components (ii), (iii) and (iv) function as the connecting equations that turn the horizontal belt model into an endless system.
The system is in equilibrium when the sum of the internal virtual work of the belt elements is equal to the sum of the components of the external virtual work. Rearranging the terms results in the equation of motion
⋅ + ⋅ + ⋅ =( ) ( ) ( ) ( ) ( ) ( ) ( , ( ))t t t t t t t tM u C u K u F u , (Eq. 6.5)
where M, C, and K are the mass, damping and stiffness matrices, respectively, F is the force vector, and , and u u u are the vectors of nodal displacements, velocities and accelerations, respectively, all being a function of time t. The mass matrix contains the mass of the belt elements, the reduced mass of the idlers, as well as the mass of the passengers. The stiffness matrix contains the elasticity modulus of the belt elements. Finally, the force vector represents the impulse effect of the flowing mass, the tensioning force, the motion resistances, as well as the drive forces. Note that in the dynamic belt conveyor model, the viscous aspect from the damping matrix is directly incorporated in the force vector through the definition of the motion resistances.

102 Exploring aspects in the application of long accelerating moving walkways 6.5.2 Motion resistances
The DIN 22101 (DIN, 2000) and ISO 5048:1989 (International Organization for Standardization (ISO), 1989) standards classify motion resistances in conventional bulk material belt conveyors into four groups, namely main resistances, secondary resistances, slope resistances and special resistances. These groups are further categorized into more specific resistances based on the components or interactions of components that cause the resistances. Such a classification has never been done for the motion resistances in moving walkways. Because the belt‐part of the Gateway is basically a belt conveyor, I follow the classification of DIN 22101 and ISO 5048 to identify the motion resistances in the Gateway belt, taking into account possible differences in components and operational conditions of the system.
Main resistances
Main resistances in a belt‐type AMW may comprise of:
rolling resistance due to the indentation of the belt by the idlers, and
rotational resistance due to friction of the idler bearings and seals.
These resistances occur along the whole length of the belt, so they have a large influence towards the system power consumption. According to Hager and Hintz (1993), the indentation rolling resistance contributes to around 60% of the total resistance in a horizontal belt conveyor, thus responsible for more or less the same percentage of the total power consumption.
In DIN 22101 and ISO 5048:1989, the main resistances are simplified into an artificial friction factor f. With this factor, the total main resistance force FM in each belt section i that has a length l can be calculated as
( )( )δ= ⋅ ⋅ ⋅ + + ⋅, , , ,ʹ ʹ ʹ cosM i i i r i b i l i iF f l g m m m , (Eq. 6.6)
where g is the gravitational acceleration, m’r is the reduced mass of the idlers per unit length and δ is the inclination angle of the belt.
The standards for bulk material belt conveyors prescribe a basic value of 0.02 for f, based on a broad range of tests (ISO, 1989). This value applies to a certain belt conveyor design and operating conditions. For different operating conditions, the value of f can vary from 0.01 to 0.04 (DIN, 2000). As an example, the EBS was measured to have an f value of 0.015 (Nuttall, 2007).
The calculation of the main resistance force based on DIN 22101 and ISO 5048:1989 only use the Coulomb friction law. The single value of f suggests that the calculation is carried out for steady state conditions. Transient conditions involving speed variation (e.g. during starting or stopping) and load variation (e.g. during loading or unloading) are not considered to change the friction value of the system.

Chapter 6. Analysing drive‐related application aspects in long AMWs 103
In his dynamic belt model, Lodewijks (1991) calculated the main resistance force by incorporating the Coulomb and viscous friction laws using the equation
( ) ( )( )δ= ⋅ + ⋅ ⋅ ⋅ ⋅ + + ⋅, , , ,ʹ ʹ ʹ ʹ cosM i i vo v i i r i b i l i iF f c c u l g m m m , (Eq. 6.7)
where cvo and c’v represent the Coulomb and viscous friction components, respectively. The main resistances are allocated to the corresponding element nodes, so iu is the velocity of the node i. The drawback of this model appears when simulating stopping procedures and stationary conditions. If the Coulomb friction component cvo is present and the belt is stopped with the motors switched off, the resistance force does not disappear, causing the modelled belt to move backwards (Nuttall, 2007).
Nutall (2007) returned to use Equation 6.6 for modelling the main resistance force. However, to improve the description of the friction effects, he calculated the friction factor fi based on the LuGre dynamic friction model (Canudas de Wit et al., 1995), which has been adjusted to represent the phenomena in a belt conveyor. The model can be visualized by two rigid bodies making contact through bristles. When a tangential force is applied, the bristles deflect like a spring. If the force is large enough, the bristles will slip. The average deflection of the bristles zi is modelled by Olsson et al. (1998) as
σ= − 0 ( )i
i i ii
vz v z
g v . (Eq. 6.8)
In the above equation, vi is the relative velocity between the surfaces, σ0 is the stiffness of the bristle, whereas g(vi) is a positive function that models the Stribeck effect. The index i in the notations indicates the individual bristle state of each node in the dynamic belt model. Additionally, in the belt model, the relative velocity vi is equal to the node velocity iu .
The Stribeck effect represents the behaviour of a typical idler bearing friction, which decreases continuously when the velocity increases from zero. A reasonable choice of g(vi) that gives a good approximation of this effect is
( )α α −= + ⋅2
00 1( ) iv v
ig v e , (Eq. 6.9)
where α0 represents the dynamic (or Coulomb) friction coefficient and α1 the additional bearing friction that disappears once reaching the speed v0. Correspondingly, the sum of α0 + α1 is the static friction (or stiction) coefficient.
With the bristle deflection modelled, the actual resistance factor is calculated by
σ σ α= + +0 1 2i i i if z z v , (Eq. 6.10)
where σ1 is a damping coefficient. The last term α2vi accounts for linear viscous friction from the indentation rolling resistance.

104 Exploring aspects in the application of long accelerating moving walkways
To determine the parameters of the dynamic friction model, the relationship between the steady state belt velocity and the friction is considered. At a constant velocity, the rate of change of bristle deflection is constant, thus 0z = . By combining Equations 6.8, 6.9 and 6.10, the steady state friction factor fss,i is
α= ⋅ +, 2( ) sgn( )ss i i i if g v v v . (Eq. 6.11)
The value of fss,i can be determined from the system’s artificial friction factor f. The typical dynamic friction coefficient α0 of a deep groove single row ball bearing as used in the AMW belt is 0.0015, whereas the stiction friction value α0 + α1 can be up to twice of the dynamic friction value (SKF Group, 2009b). Here it is assumed to be 0.0025.
Secondary resistances
In the belt‐type AMW, secondary resistances may consist of:
resistance due to friction in the pulley bearings, and
resistance due to the wrapping of the belt on the pulleys.
As can be seen, these resistances only occur locally. In DIN 22101 and ISO 5048:1989, the influence of the secondary resistances for bulk material belt conveyors is approximated by a factor C, which decreases exponentially with increasing belt length. With this factor, the total secondary resistance FS is calculated by
( )= − ⋅1S MF C F . (Eq. 6.12)
The values of C are indicated in Table 6.1 for a range of belt length within the potential travel distance of an AMW.
Table 6.1. Some values of C as given by DIN 22101
Head to tail pulley distance (m) 100 200 500 1000 1500 ≥2000 C 1.78 1.45 1.20 1.09 1.06 1.05
Source: DIN (2000).
Slope resistances
Slope resistance is not necessarily related to friction. Instead, it represents forces that are related to the lifting or lowering of the belt and the passengers on inclined or declined conveyor sections. The resistance is positive for an inclined section and negative for a declined one. In DIN 22101, the slope resistance FSl for every inclined or declined belt section i is calculated by
( )= ⋅ ⋅ +, , ,ʹ ʹSl i i b i l iF h g m m , (Eq. 6.13)
where hi is the change of elevation of the corresponding belt section.

Chapter 6. Analysing drive‐related application aspects in long AMWs 105
This study focuses on horizontal AMW systems. Hence, the slope resistance is not further dealt with.
Special resistances
Special resistances are only present in some belt conveyor systems, depending on the additional components installed. If compared to a bulk material belt conveyor, the additional component in the belt‐type AMW is the handrail. The handrail may add to the total system resistances in the form of:
resistances due to friction of the handrail inner ply sliding on the handrail guide,
resistances due to friction of the handrail on the rollers of the tension bow, and
resistances due to the lifting or lowering of the handrail in an inclined or declined belt section.
Resistances from the handrail are not further considered in this study because, as stated in Section 6.4.1, it is assumed that the handrail will be driven separately from the belt conveyor.
The total motion resistance in a horizontal AMW belt is thus equal the sum of the main and the secondary resistances. These motion resistances can vary along the belt. With the models above, the motion resistances in each belt element can be calculated for every simulation step.
A power consumption test was carried out on the previously installed horizontal Starglide passenger belt in Amsterdam Airport Schiphol (AAS), which ran at a speed of 0.65 m/s and has a travel distance of around 96 m (in mid 2007, this system was retrofitted into a new CMW). The test was performed using an empty belt, resulting in a power reading of approximately 3 kW. Taking into account the motor efficiency and the characteristics of the belt and idlers, a friction factor of around 0.019 was found for this Starglide belt. Note that this friction factor is in fact a combination of the factors f∙C. No data was available for the Starglide belt used in the AMW system in Paris. It is thus assumed that the same friction value as above applies.
6.5.3 Passenger flow
As discussed in the previous section, the number of passengers on each part of the AMW belt influences the amount of motion resistances in the belt elements. In the model, the passengers are represented by passenger blocks, which are uniformly distributed loads with certain masses and lengths. This representation is acceptable since the dynamic belt model only requires knowledge of the total mass in each belt element, which is then converted into lumped mass at the element nodes.
In the simulation, the flow of passengers entering the AMW belt is described by loading patterns, which define the variation of mass entry rate for the duration of the simulation. An example of a loading pattern is given in Figure 6.12. In this example,

106 Exploring aspects in the application of long accelerating moving walkways
the entry rate between time t = 0 and t = t1 is 500 kg/s, which may represent five passengers entering the belt per second. From t = t1 to t = t2 there is no passenger entering the belt. Then, between t = t2 and t = t3, passengers arrive again at a rate of two passengers per second.
Figure 6.12. Example of a loading pattern of passengers entering the belt‐part of the AMW.
It should be noted that there exists a maximum mass entry rate, which is defined by the maximum capacity of the system. In reality, this depends on the width of the system and the minimum interpersonal spacing that passengers are willing to adopt when entering the AMW. This has been extensively discussed in Chapter 4. However, standards may dictate a different rule about the rated capacity, which mainly relates to structural design and power requirement. This is explained in Chapter 7.
During the simulation, the mass balance of the passengers in each belt element is determined for every time step. The passenger blocks enter the system through the belt element grid that denotes the entrance and then move through the following elements towards the exit (Kusumaningtyas and Lodewijks, 2007). However, with such an algorithm, the passengers can only be simulated as riders (i.e. standing on the belt) because the movement of the mass is governed by the belt speed.
If a mix of standing and walking passengers is present, it is considered best to first generate the belt’s passenger mass distribution for the whole duration of the simulation outside of the simulation framework of the AMW belt conveyor. It is perceived that this may be performed with a pedestrian behaviour model that has been calibrated to include unidirectional pedestrian flow in bottlenecks, such as NOMAD (Hoogendoorn and Bovy, 2004). The spatial and temporal distributions of pedestrian density obtained from NOMAD may be converted into the variation of passenger mass distribution for each belt element (Kusumaningtyas and Lodewijks, 2007). The passenger mass data of the belt elements can then be inputted directly into the dynamic belt model at every simulation time step, thus overriding the mass balance algorithm above. By doing so, additional computation load from calculating the more complex passenger mass movement can be avoided.

Chapter 6. Analysing drive‐related application aspects in long AMWs 107
6.5.4 Drive station
As discussed in Section 6.4.2, a drive station in the AMW belt conveyor consists of two squirrel‐cage induction motors, each of which powers a drive wheel through a reduction gear. To control the speed of the belt, an inverter is applied between the supply and the motor. The function of the inverter is to draw power from the fixed‐frequency constant‐voltage mains and convert it to variable frequency and variable voltage for driving the induction motor.
When ac motors operate on variable voltage/frequency supplies, system instability may occur due to pulsation of the motor torque caused by the voltage harmonics applied to the machine. Lodewijks (1996) pointed out that the frequency of this torque pulsation is higher than the maximum significant frequency of longitudinal vibrations in belt conveyor systems longer than 1 km. Because the frequency of the torque pulsation is at least 60 Hz, whereas the maximum significant frequency of the axial vibration is 40 Hz, no important interactions between the dynamics of the electrical drive and the dynamics of the belt conveyor are expected. Hence, no separate mathematical model of the inverter is included in the belt conveyor model. The electrical transients in the stator and rotor are not taken into account because the electrical time constants of the motor are much smaller than the mechanical time constants in the belt conveyor. The inverter is accounted for by directly changing the motor supply frequency and voltage, and the steady‐state equation of the torque is used in the equation of motion of the belt conveyor.
The induction motor is modelled based on the equivalent circuit approach (Chapman, 2005). Figure 6.13 shows the per‐phase equivalent circuit that is used to determine the output or induced torque Tind as a function of the input frequency fs and input phase voltage Vs. In the figure, R1 and X1 represent the resistance and reactance of the stator coils, X2 and R2/s represent the reactance and the resistance of the rotor coils, whereas XM represents the mutual reactance between the stator and rotor coils. As can be seen, the rotor resistance is a function of the motor slip s.
Figure 6.13. The per‐phase equivalent circuit of an induction motor.

108 Exploring aspects in the application of long accelerating moving walkways
The reactances X1, X2 and XM are established for a certain supply frequency (Chapman, 2005). If the motor is operated at variable frequencies, these reactances depend on the synchronous speed ωsync as follows
1 2 , , sync s sync r M sync MX L X L X Lω ω ω= ⋅ = ⋅ = ⋅ , (Eq. 6.14)
where Ls and Lr are the inductances of the stator and rotor, whereas LM is the mutual inductance between the stator and rotor. The synchronous speed is a function of the supply frequency fs and the number of pole pairs p as defined by
2 ssync
fp
ω π= ⋅ . (Eq. 6.15)
A simplified way to solve the circuit above is to determine the Thevenin equivalent of the portion of the circuit to the left of X2. Thevenin’s theorem states that any linear circuit that can be separated by two terminals from the rest of the system can be replaced by a single voltage source in series with an equivalent impedance (Chapman, 2005). If this were done to the induction motor equivalent circuit, the resulting circuit would be a simple series combination of elements as shown in Figure 6.14.
Figure 6.14. The simplified per‐phase equivalent circuit of an induction motor.
The magnitude of the Thevenin voltage VTH in Figure 6.14 is
( )
=+ + 22
1 1
MTH s
M
XV VR X X
. (Eq. 6.16)
The Thevenin resistance RTH and reactance XTH are given by
( )⋅
=+ +
21
221 1
MTH
M
R XRR X X
(Eq. 6.17)
and ( )
⋅ + ⋅ + ⋅=
+ +
2 2 21 1 1
221 1
M M MTH
M
R X X X X XXR X X
. (Eq. 6.18)
Chapter 6. Analysing drive‐related application aspects in long AMWs 109
From this approach, the magnitude of the current I2 is
( ) ( )
=+ + +
2 2 22 2
TH
TH TH
VIR R s X X
. (Eq. 6.19)
The rotor induced torque is given by
( ) ( )( )ω
⋅ ⋅=
⋅ + + +
22
2 22 2
3 THind
sync TH TH
V R sT
R R s X X , (Eq. 6.20)
with the factor ‘3’ representing the three phase induction motor.
With the motor shaft speed ωm known, the motor slip s can be calculated by
ω ωω−
= sync m
sync
s . (Eq. 6.21)
The parameters of the equivalent circuit can be derived based on data from induction motor catalogues using the approximation procedure described by Lodewijks (1996) or the curve fitting method carried out by Nuttall (2007).
In order to move the system, the motor has to generate enough torque to overcome motion resistances in the belt conveyor, compensate for losses in the gearbox, and accelerate the rotating components of the drive. The fraction of power for overcoming motion resistances is applied to the belt through the drive wheel in the form of the drive force Fd. Gearbox losses depends on the gearbox efficiency ηg. The amount of power to accelerate the rotating drive components is influenced by the inertia of the rotor Jr, gear Jg and drive wheel Jd. When seen from the motor side of the gearbox, the relationship between the angular motor shaft speed, the motor torque and the drive force is defined as
ωη
⎛ ⎞+ + ⋅ = − ⋅⎜ ⎟ ⋅⎝ ⎠2d d
r g m ind dg
J rJ J T Fi i
, (Eq. 6.22)
where i is the gearbox ratio and rd is the radius of the drive wheel.
To solve the above equation of motion, a traction model (Nuttall, 2007) is used to link the motor model with the dynamic belt conveyor model. This model describes the relationship between the applied drive force and the resulting slip or creep ratio between the drive wheel and the belt. With this traction model, it is possible to represent situations where the applied drive force approaches friction limit, resulting in excessive slip between the belt and the drive wheel.
When the drive wheel applies a drive force Fd to the viscoelastic surface of the belt, a speed difference occurs between the drive wheel outer diameter and the belt. This speed difference arises due to elastic deformation and sliding in the contact region. The speed difference is expressed as the slip or creep ratio δ as defined by

110 Exploring aspects in the application of long accelerating moving walkways
ωδ − ⋅= b d d
b
v rv
, (Eq. 6.23)
where vb is the belt velocity and ωd is the angular velocity of the drive wheel.
Through experiments, Nuttall (2007) obtained the actual traction‐slip relationship of the drive unit in the EBS. The resulting traction‐slip curve is approximated by the function
δ δ δ δδ
δ δδ
⎧− ⋅ − ⋅ ≤⎪⎪= ⎨⎪ ⋅ >⎪⎩
2
2
2 ( ) , 2
2 , 4 2
d
ba ba
Fb ba a
, (Eq. 6.24)
where a and b are constants that have been determined by curve fitting the data measured from the experiments (Nuttall, 2007). The factor ‘2’ is added because there are two drive wheels in each drive station.
With the above equation, a drive wheel generates drive or break forces when it is running respectively faster or slower than the belt. When the motor produces a torque that is larger than the friction allows, the excess force will accelerate the drive wheel and cause an increasing slip without an increase in drive force. Based on the traction‐slip curve obtained through the experiments, a drive wheel can apply a maximum drive force of approximately 850 N to the belt when the normal force of the wheels pressing on the belt is 1000 N (Nuttall, 2007).
6.5.5 Simulation framework
The AMW belt conveyor model was built in Simulink, with the components of the model built as Matlab functions and scripts. The relationship between the components of the AMW belt conveyor model is presented in Figure 6.15 (Kusumaningtyas and Lodewijks, 2007).
Figure 6.15. Structure of the AMW belt conveyor model.

Chapter 6. Analysing drive‐related application aspects in long AMWs 111
A numerical integration routine was used to simulate the dynamics of the system as a function of time. For every time step, the simulation generates output data of the system performance. This includes the belt’s nodal acceleration and velocities, belt element tensions, drive force per station, motor slip, and creep.
6.6 Conclusions
This chapter has presented a number of drive‐related aspects that potentially emerge in AMWs when their lengths are extended. These issues mainly rise due to the higher power requirements in longer systems. When a long AMW continue to implement a single‐drive system to deliver the high drive force, there are concerns with regards to the strength requirements of the system’s components and structure, as well as the operational safety of the system and its passengers.
To analyse the extent of the above concerns, a model of an AMW high‐speed belt conveyor was developed. With this model, in Chapter 7, I will simulate and compare the behaviour of a long single‐drive AMW belt against that of a short single‐drive system. Furthermore, reflecting on the experience of long (overland) bulk material belt conveyors, the application of multiple drives in long AMW belts will be simulated in order to evaluate the effects of these drives towards the system’s performance. At this stage, the study in Chapter 7 will apply a scalar open‐loop drive control for starting and stopping, as well as a drive load‐sharing approach.

112 Exploring aspects in the application of long accelerating moving walkways
113
Chapter 7
Performance of long accelerating moving walkway belts with single and multiple drives
7.1 Introduction
In this chapter, the performance of long Accelerating Moving Walkway (AMW) belt conveyors is investigated by way of simulations using the dynamic belt conveyor and drive station models described in Chapter 6. The objective is, firstly, to evaluate the extent to which the dynamics of long AMW belts differ from those of short AMW belts when a single‐drive configuration is used. Secondly, the investigation aims to analyse the effects of applying multiple drives toward the dynamic behaviour of long AMW belts. How the applied drive configurations affect the required specifications for long AMW belts and whether current moving walkway operational strategies can still be applied are evaluated. Although initial indications may be derived from the findings of studies on long bulk material belt conveyors, the influence of the varying load distributions in AMWs has to be taken into account.
To perform the simulations, the model parameters are first defined in Section 7.2. Then, Section 7.3 presents a number of case studies for comparing the operating behaviour of short and long single‐drive AMW belts. The performance of long AMW belts with multiple drives is discussed in Section 7.4 for similar cases as the long single‐drive belts. The implications of the system dynamics towards drive‐related application aspects in long AMWs are discussed in Section 7.5. Some conclusions are given in Section 7.6.
7.2 Model parameters
The parameters for the belt conveyor model are based on the specifications of the high‐speed belt conveyor in the AMW system in Paris, which have been described in Chapter 6. The parameters are listed in Table 7.1 below.

114 Exploring aspects in the application of long accelerating moving walkways Table 7.1. Belt conveyor parameters
Parameter Notation Value Belt width w 1,270 mm Belt thickness h 30 mm Belt stiffness Eb 667 N/mm2 Belt mass m’b 52.27 kg/m Reduced idler mass m’r 1.34 kg/m Tensioning force Ft 20 N/mm Dynamic friction factor α0 0.0015 Additional friction when static α1 0.0010 Viscous friction factor α2 0.0074 Maximum passenger mass m’l,max 500 kg/m
Moving walkway standards prescribe load ratings for the calculation of structural design and power transmission. For an exposed treadway width of 1.2 m, the guidelines translate to a load rating of no less than 440 kg/m according to ASME A17.1‐1981 (Donoghue, 1981) and around 610 kg/m according to EN 115‐1:2008 (Comité Européen de Normalisation (CEN), 2008). Referring to Chapter 4, if simply the human body dimension is considered, a 1.2 m wide treadway of one meter length can hold five people. This results in a maximum theoretical passenger mass of 500 kg/m, which is between the prescribed load ratings above. Nevertheless, when the comfortable interpersonal spacing of pedestrians is also considered, the above treadway area may in practice only hold 2.5 people. Furthermore, the load distribution entering the high‐speed belt is actually affected by the load distribution in the section before it. If passengers are assumed to board the accelerating rollers with a headway of 0.8 m and for safety reasons they only stand while being accelerated, once entering the high‐speed belt they will be spaced 2.75 m apart. This gives a passenger mass of just 73 kg/m, which will be maintained if passengers continue to stand on the belt. ASME A17.1‐1981 recognized this ‘thinning of the load’ from the acceleration zone to the high‐speed zone. However, it further explained that because the treadway may have to deal with the crowding of passengers due to walking, then each driven section should still be designed to carry the full rated load. With these considerations, the rated load for the model parameter is set to 500 kg/m.
For the drive station model of the multiple‐drive AMW belt, the parameters are taken from the properties of the drive station in the Enerka Becker System (EBS) pilot installation that was constructed in Almere, the Netherlands (Nuttall, 2007). These parameters are listed in Table 7.2. Since the multiple AMW drives are assumed to be based on the drive system of the EBS, the motor in each drive is also sized according to the EBS motors, i.e. with a rated output power of 3 kW per motor. The properties of the drive wheel and contact surface in the EBS drive system only allow a maximum applied drive force of 850 N per drive wheel, above which then slip occurs. This means that the maximum useable power from each drive line is around 2.1 kW

Chapter 7. Performance of long AMW belts with single and multiple drives 115
when operating the AMW belt at 2.5 m/s. Hence, installing a 3 kW motor in each drive line is sufficient. The additional available power may serve as a margin to compensate for the efficiency of the reduction gear. Having a larger motor per drive line will not be necessary because the drive wheel will not be able to transfer all the available power anyway.
Table 7.2. Drive station parameters
Parameter Notation Value Nominal motor power Pn 3 kW Nominal phase voltage Vs,n 230 V Nominal phase current Is,n 6.3 A Nominal frequency fs,n 50 Hz Number of pole pairs p 2 Nominal speed nn 1,400 rpm Drive wheel diameter dd 250 mm Gear reduction i 7.33 Traction constant 1 a 3.96∙104 Traction constant 2 b 1.16∙104
The equivalent circuit parameters of the 3 kW motor were determined using data from the manufacturer’s motor catalogue and following the curve‐fitting procedure from Nuttall (2007). The parameters are listed in Table 7.3.
Table 7.3. Equivalent circuit parameters for the 3 kW motor
Parameter Notation Value Stator resistance R1 0.375 Ω Rotor resistance R2 1.34 Ω Stator inductance Ls 4.82 mH Rotor inductance Lr 24.5 mH Mutual inductance LM 11.8 mH
For the investigation in this chapter, the motors are controlled based on the typical control method of the EBS drive, i.e. with an open loop scalar speed control where the ratio between the supply voltage and the supply frequency is kept constant up to the nominal frequency. Furthermore, all motors are supplied with the same input signal so they have more or less the same speed‐torque characteristics. Hence, they will equally share the total load when operating at steady state condition.
7.3 Behaviour of single-drive AMW belts
In this section, the operating behaviours of short and long single‐drive AMW belts are studied. The objective is to obtain insights on the extent to which the dynamics of

116 Exploring aspects in the application of long accelerating moving walkways
the two belt lengths differ and how that affects the drive‐related application aspects of the long AMW belts. Based on these insights, it is evaluated whether extending the belt length will affect the possibility to still use present AMW specifications and common moving walkway settings.
7.3.1 System layout
Figure 7.1 presents a layout of a single‐drive AMW belt with the drive station located at the head of the conveyor. In the figure, the automatic tensioning device is placed at the tail. The influence of placing the tensioning device at the head is also studied.
Figure 7.1. Layout of a single‐drive AMW belt.
The short AMW belt conveyor is assumed to have a total length of 200 m. This represents a conveyor with a travel distance Lconv of 100 m. If combined with the accelerating and decelerating sections of 10 m each, a 120 m long AMW is obtained. This is the recommended minimum length of an AMW system that was derived in Chapter 3. Using the formula from DIN 22101 (Deutches Institut für Normung (DIN), 2000) as stated in Equation 6.6, the resistances in the belt can be estimated. For a belt mass, reduced idler mass and passenger mass as given in Table 7.1 and a friction factor as discussed in Section 6.5, the 200 m belt is calculated to have a total resistance of around 11.9 kN when fully loaded. It is expected that a 45 kW motor is sufficient to drive such a belt conveyor at its nominal speed, including compensating for efficiencies.
A total belt length of 2,000 m is taken for the long system, resulting in a belt conveyor with a travel distance of 1,000 m. This approximates the length of the inter‐terminal AMW proposed in Chapter 5. The resistance in this configuration is 119 kN, i.e. ten times that of the 200 m long belt. A 450 kW motor is required to power this belt conveyor.
7.3.2 Starting
Starting procedure
Standards require the starting of moving walkways to be carried out with no passengers on the system. There is no specific guideline on the selection of starting

Chapter 7. Performance of long AMW belts with single and multiple drives 117
times for moving walkways. For bulk material belt conveyors, a number of rules have been established for determining starting times in order to minimize the system dynamics. One rule states that the starting time should be at least five times the time it takes for a longitudinal acceleration wave to travel from head to tail (Lodewijks, 1996). This is expressed as
≥ ⋅1
5 conva
LTc . (Eq. 7.1)
For an empty 100 m belt conveyor, this gives a very low limit of 0.72 s. Another rule sets a starting time of 60 s for every 1 km belt length, giving a starting time of 12 s for a 200 m belt. The last rule is derived from the DIN 22101, where the starting time is a function of the target belt speed, artificial friction factor and safety factors (Lodewijks, 1996) as defined by
⎛ ⎞
= ⋅⎜ ⎟⋅ ⋅ −⎝ ⎠b A
aB A
v STC f g S S
. (Eq. 7.2)
The variation of starting time is thus governed by the secondary resistance factor C, which varies according to the length of the system. For the 100 m conveyor, this gives a starting time of 14.87 s.
For the long belt conveyor, with a total belt length of 2,000 m, the recommended starting time is 120 s when based on the 60 s per 1 km belt length rule. This differs quite far from the starting times based on the other rules, which are only 7.17 and 24.28 s.
For the AMW belt conveyor in this study, a gradual speed ramp‐up is selected to prevent excessive belt oscillations and limit the transient belt dynamics. Harrison (1983) has derived an S‐curve speed profile for the starting of bulk material belt conveyors based on simulations and experimental verifications. This speed profile is used for the starting of the AMW belt. The ramp‐up of the belt speed vb during the starting time Ta is carried out following the formula
π⎛ ⎞⎛ ⎞⋅= ⋅ − ≤ ≤⎜ ⎟⎜ ⎟⎜ ⎟⎝ ⎠⎝ ⎠
,( ) 1 cos , 02b t
b aa
v tv t t TT
, (Eq. 7.3)
where vb,t is the target belt speed.
As stated in Section 7.2, the AMW drives are controlled in an open loop manner. In the simulation, the above speed profile is converted into a ramp‐up profile of the AC motor supply frequency. The gradual increase of supply frequency up to the nominal frequency of 50 Hz is accompanied with the increase of supply voltage, such that the voltage to frequency ratio remains constant. With the stiff torque‐slip characteristic and the gradual speed increase, the motor will closely follow the synchronous speed.

118 Exploring aspects in the application of long accelerating moving walkways Analysis of normal starting
For the starting of the 200 m belt, a starting time of 5 s is initially selected. This starting time is between the two lower starting times derived from the aforementioned rules. The system is started using the S‐curve speed profile and it is simulated each for a tensioning device at the tail and at the head. The former is the common take‐up location in moving walkways. Figure 7.2 presents the starting behaviour of the 200 m belt when the take‐up is placed at the tail.
0 2 4 60
0.5
1
1.5
2
2.5
3
Time [s]
Bel
t spe
ed [m
/s]
0 1 2 3 4 5 60
2
4
6
8
10
12
Time [s]
Driv
e fo
rce
[kN
]
Figure 7.2. Starting of a 200 m belt with a single drive station and a tail take‐up in 5 s.
As shown in the upper left graph, the short ramp‐up time results in a maximum acceleration almost reaching 1 m/s2. In this graph, the green line is the belt acceleration directly after the drive (Adrive) and the red line is that at the location of the take‐up (Apre). Since there is no passenger onboard, this is considered acceptable. The drive force from the motor, depicted in the lower right graph, is relatively high but not resulting in any slip. The change of belt tension, depicted in the lower left graph, does not exhibit significant oscillations. The blue line represents the belt tension just before the belt passes the drive station, i.e. the tight‐side tension (T1). The green line is the belt tension right after the belt passes the drive station, i.e. the slack‐side tension (T2). The red line is the pretension level (Tpre). The maximum transient and steady state belt tension is well within the allowable limit specified by the safety
Apre
Adrive
T1
T2 Tpre

Chapter 7. Performance of long AMW belts with single and multiple drives 119
factor, as calculated in Section 6.4.1. For a tail take‐up belt, care has to be taken that the belt tension after the motor does not drop too low to compression.
When comparing the influence of the take‐up position, it was observed that the belt conveyor with a head take‐up has slightly more dynamics that the one with a tail take‐up when the same starting time is applied. Nevertheless, the overall starting performances of both systems are quite similar. The only main difference is the belt tension profile, as seen in Figure 7.3.
(a) (b)
Figure 7.3. Difference in belt tension profile along the length of a single‐drive 200 m belt with (a) a tail take‐up and (b) a head take‐up for a starting time of 5 s.
The maximum belt tension is higher for the system with a head take‐up. This is because the resistances in such a system are accumulated for the whole length of the belt before reaching the location of the drive. The belt tension after the drive is thus the same as the pretension level; hence the green line overlaps the red line. Furthermore, it is noticed from Figure 7.3(b) that, after the 5 s starting period has elapsed, the belt tension of the head take‐up belt has not completely reached steady state. This indicates that the belt is still slightly accelerating. The jerk at the end of the starting period is only around 0.4 m/s3, which is within the 0.5–0.6 m/s3 limit recommended for human balance (Vuchic, 1981). Setting the starting time to 10 s improves the dynamics of the head take‐up belt, resulting in smoother profiles that
T1
Tpre T2
T1
T2 = Tpre

120 Exploring aspects in the application of long accelerating moving walkways
directly damp out after the starting period. A 10 s starting time is close to the 12 s starting time calculated with the 60 s per 1 km belt length rule.
For the 2,000 m belt, a starting time of 10 s was initially tested. This is close to the lowest starting time derived from the abovementioned rules. The applied drive force did not reach friction limit, so the system could reach the target speed within the starting time. However, as shown in Figure 7.4, severe oscillations occur. The oscillations remain in the system long after the starting period has elapsed, causing high jerks that prevent the system from directly being used by passengers. Note that in the acceleration graph of the head take‐up belt, the green line overlaps the red line.
For the tail take‐up system, the large drive force caused the belt tension after the drive to drop significantly into compression, as depicted in the lower graph of Figure 7.4(a). In the head take‐up belt, the belt only entered compression slightly. For a 10 s starting time, both cases result in undesirable starting performances.
(a) (b)
Figure 7.4. Starting of a 2,000 m belt with a single drive station for (a) a tail take‐up and (b) a head take‐up in 10 s.
Based on the simulations, it was found that 60 s is the minimum starting time that enables a 2,000 m belt with a tail take‐up to avoid compression during starting. This is depicted in Figure 7.5, along with a comparison for the case of a head take‐up belt.
Apre
Adrive Apre = Adrive
T1 Tpre
T2
T1
T2 = Tpre

Chapter 7. Performance of long AMW belts with single and multiple drives 121
0 20 40 60 800
10
20
30
Time [s]
Driv
e fo
rce
[kN
]
0 20 40 60 80
0
10
20
30
Time [s]
Driv
e fo
rce
[kN
]
(a) (b)
Figure 7.5. Starting of a 2,000 m belt with a single drive station for (a) a tail take‐up and (b) a head take‐up in 60 s.
Although compression is avoided, as can be seen in Figure 7.5(a) the slack‐side tension of the tail take‐up belt is still quite low, even at steady state. This is no longer influenced by the starting time, but is due to large drive force that is applied to overcome the resistances in the long belt. Even if the starting time is extended further, the slack‐side tension will remain as low. This indicates that the amount of take‐up force designed for present day AMW belts are not suitable when used in long single‐drive systems, particularly when applied at the tail, which is normally the take‐up
T1
T1
Tpre
T2 T2 = Tpre
Apre
Adrive
Apre = Adrive

122 Exploring aspects in the application of long accelerating moving walkways
location in moving walkways. To solve this, the pretension of the tail take‐up belt would have to be increased significantly, implying a larger take‐up device.
Compared to the tail take‐up belt, the starting behaviour of the 2,000 m head take‐up belt shows more oscillations, as seen in Figure 7.5(b). However, they are not severe. Furthermore, at the end of the starting time the remaining acceleration only results in jerks that are practically zero, so passengers can already use the system. If the 60 s per 1 km belt length rule is adopted, the 120 s starting time will result in an improved dynamics through the reduction of the oscillations. Nevertheless, the 60 s starting time can be considered sufficient to obtain an acceptable starting performance for the 2,000 m head take‐up belt.
7.3.3 Influence of passenger distribution
Loading pattern
When passengers enter an empty AMW running at its nominal speed, the steady state of the system is perturbed. The drive system applies more drive force in response to the increase of load. The change of drive force initiates the propagation of acceleration waves from the drive location, resulting in belt dynamics. The extent of this depends on the number and distribution of passengers on the system.
In order to, step by step, understand the effect of loading, the passengers are initially assumed to just stand while being transported. Hence, their movement is governed only by the belt speed, i.e. 2.5 m/s. The short AMW belt conveyor has a 100 m travel distance so it requires 40 s to pass through it. For the long system, 400 s (equals to 6.67 minutes) is required to pass the 1,000 m travel distance by standing.
As explained in Section 6.5.3, the standing passengers are modelled as uniformly distributed loads with certain masses and lengths. The loading patterns in Figure 7.6 are assumed as the mass entry rate of the passengers. These relatively simple patterns were selected as to be able to identify the influence of the passenger distributions in the change of drive force and belt tension profiles.
The first loading pattern in the figure represents a continuous and uniform stream of passenger that would give the belt its rated load, i.e. 500 kg/m. At a speed of 2.5 m/s, the passenger mass entry rate is 1,250 kg/s. The second loading pattern models an intermittent stream that varies from the rated load to half of the rated load at an interval of 30 s, with a zero entry rate in between. A 30 s interval can be considered as a typical inter‐arrival time between vehicles in a transit station, especially one with multiple platforms. The variation of load rate results in a system that is partially loaded if referred to the design condition.

Chapter 7. Performance of long AMW belts with single and multiple drives 123
(a) (b)
0 20 40 60 80 100 120 140 1600
500
1000
1500Continuous entry of passengers at rated load
0 20 40 60 80 100 120 140 1600
500
1000
1500
Time [s]
Pas
seng
er m
ass
entry
rate
[kg/
s]
Intermittent entry of passengers at varying load
Figure 7.6. Loading patterns for the simulation of standing passengers for (a) continuous full load, and (b) intermittent varying load.
Analysis of loading for standing passengers
The results of the loading simulations for the 200 m AMW belt are presented in Figure 7.7 for the case of a take‐up at the head.
The figure shows that the drive system in the short AMW belt can respond smoothly to the increase of load, including when the mass entry rate is varying. For the case of continuous loading at a uniform rate, as depicted in the graphs at the left side, once the whole length of the belt is loaded, the drive force and thus belt tension reach a new steady state. The maximum belt tension for a fully loaded belt as shown in the middle left graph is within the maximum allowable limit. For partial loading resulting from the varying entry rate, the belt tension varies between this maximum tension and the pretension, as shown in the middle right graph. Another aspect to assess is the drop of belt speed due to the transition from empty to fully loaded. As shown in the bottom graphs, the change in load condition causes a small deceleration, which would be unfelt by passengers. This results in a 3% speed drop when the belt is fully loaded, which is within the 5% limit from EN 115‐1:2008 (CEN, 2008). For the same loading pattern, a 200 m tail take‐up belt gives similar results in terms of drive force, deceleration and speed profiles as the head take‐up belt. The tight‐side belt tension profile follows a similar pattern as the tight‐side tension in the head take‐up belt but at a lower value, whereas the slack‐side tension continues the same slack‐side tension after starting.

124 Exploring aspects in the application of long accelerating moving walkways
Figure 7.7. Loading of a 200 m belt with a single drive station and a head take‐up for (a) continuous full load and (b) intermittent varying load.
The loading behaviour of a 2,000 m belt with a head take‐up is depicted in Figure 7.8. For the continuous uniform loading, the drive is able to gradually increase the applied drive force. However, it was noticed that the maximum belt tension at the rated load is far above the 62.5 N/mm steady state tension limit. Assuming the belt does not fail, the drop of belt speed at full load is 3%. For the case of intermittent loading with varying entry rate, disregarding the fact that the system would fail, it was found that the drive force changed in a staggering manner. This staggering follows the varying gradient of load increase in the belt due to the varying entry rate. The drive force increases for a longer period of time due to the longer length of the belt. Here the simulation was only carried out for 450 s, which is only slightly longer
0 20 40 600
5
10
15
Time [s]
Driv
e fo
rce
[kN
]
0 50 100 150
0
5
10
15
Time [s]
Driv
e fo
rce
[kN
]
(a) (b)
T1 T1
T2 T2

Chapter 7. Performance of long AMW belts with single and multiple drives 125
than the time it takes for the first passenger to exit the system. Hence, the above graph has not yet shown the effect of exiting passengers. For the long system, the increasing and decreasing pattern of drive force and belt tension as in the right graphs in Figure 7.7 may occur if the interval between the entry rates is much longer. The loading of a 2,000 m tail take‐up belt results in similar profiles of drive force, deceleration and speed. When fully loaded, the maximum belt tension is lower than in the head take‐up belt, but still above the allowable limit. Another concern is the constantly low slack‐side tension, which is almost zero. Based on these simulations, it is clear that the present AMW belt rating is not strong enough to handle the rated load of long single‐drive AMW belts, either with a head or a tail take‐up.
Figure 7.8. Loading of a 2,000 m belt with a single drive station and a head take‐up for (a) continuous full load and (b) intermittent varying load.
7.3.4 Stopping
Stopping procedure
As with normal starting, the normal stopping of moving walkways has to be carried out when the system is empty. The only situation where stopping may be carried out with passengers onboard is for emergency stopping. In both cases, the stopping procedure should result in a largely uniform deceleration (CEN, 2008). Once the system has stopped, it has to be maintained stationary.
0 100 200 300 4000
50
100
150
Time [s]
Driv
e fo
rce
[kN
]
0 100 200 300 400
0
50
100
150
Time [s]
Driv
e fo
rce
[kN
]
(a) (b)
T1
T2
T1
T2

126 Exploring aspects in the application of long accelerating moving walkways
Normal stopping is most likely carried out at the end of the daily operational hours. In this case, the stopping procedure can be selected without many constraints. It may be initiated by simply cutting off the supply frequency and voltage, then letting the system coast to a stop due to its internal resistance. It may also be carried out by gradually reducing the supply frequency and, correspondingly, supply voltage such that a controlled speed ramp down is obtained. In this study, the stopping procedure is carried out following a reversed S‐curve speed profile.
Emergency stopping has to achieve two somewhat conflicting requirements, i.e. to stop the moving walkway as fast as possible to prevent injury (e.g. passenger entrapment) and to not stop too harshly that may cause passenger falls (Al‐Sharif, 1996b). In EN 115‐1:2008 (CEN, 2008), the stopping distances for moving walkways are prescribed as margins, with a lower limit for an unloaded system and an upper limit for a loaded system. However, the guideline is only available for moving walkways running at nominal speeds of 0.5 to 0.9 m/s. The standard further states that the deceleration in the direction of travel should not exceed 1 m/s2. With this maximum deceleration, a 2.5 m/s belt will need at least 2.5 s to stop. The minimum stopping distance for such a belt is thus 3.125 m.
Analysis of normal stopping
The stopping time for normal stopping is initially tested for the same amount of time that produced an acceptable performance for the normal starting of the same belt configuration. For the 200 m belt, this is 5 s. The stopping behaviour of the 200 m belt with a head take‐up is depicted in Figure 7.9.
The upper left graph in the figure shows the drive station reducing the applied drive force in the process to stop. In order to follow the imposed speed profile given to the drive, the drive starts braking. In practice, the drive may accomplish this by entering the regenerative braking quadrant or by dissipating the electric power using braking resistors (Trzynadlowski, 2001). The change of belt tension is generally smooth. The tight‐side tension drops below the pretension level, but this does not pose a problem due to compression. No oscillations occurred during the stopping time because the system was able to directly respond to the change in drive force. However, as shown in the lower left graph, after the stopping period elapsed and the input frequency signal is zero, the belt has not completely stopped. It may be that, due to the system inertia and the relatively short stopping time, a small amount of energy is still present in the system even though the drive does not deliver anymore power. The remaining energy is shown by the occurrence of oscillating deceleration as depicted in the lower right graph. This energy is gradually consumed by the system internal resistance and the belt finally comes to a complete stop.

Chapter 7. Performance of long AMW belts with single and multiple drives 127
0 2 4 6 8 10-10
-5
0
5
Time [s]
Driv
e fo
rce
[kN
]
Figure 7.9. Stopping of a 200 m belt with a single drive station and a head take‐up in 5 s.
For the same stopping time, the stopping performance of the tail take‐up belt is quite similar to that of the head take‐up belt with respect to the drive force and speed profile. The belt tension profile is naturally different as a result of the different take‐up position. In this case, the tension drop in the tight side is not as low as that of the head take‐up system, but the slack‐side tension increases, see Figure 7.10.
(a) (b)
Figure 7.10. Difference in belt tension profile along the length of a single‐drive 200 m belt with (a) a tail take‐up and (b) a head take‐up for a stopping time of 10s.
T2
T1
T1 T1
T2 T2 = Tpre
Tpre
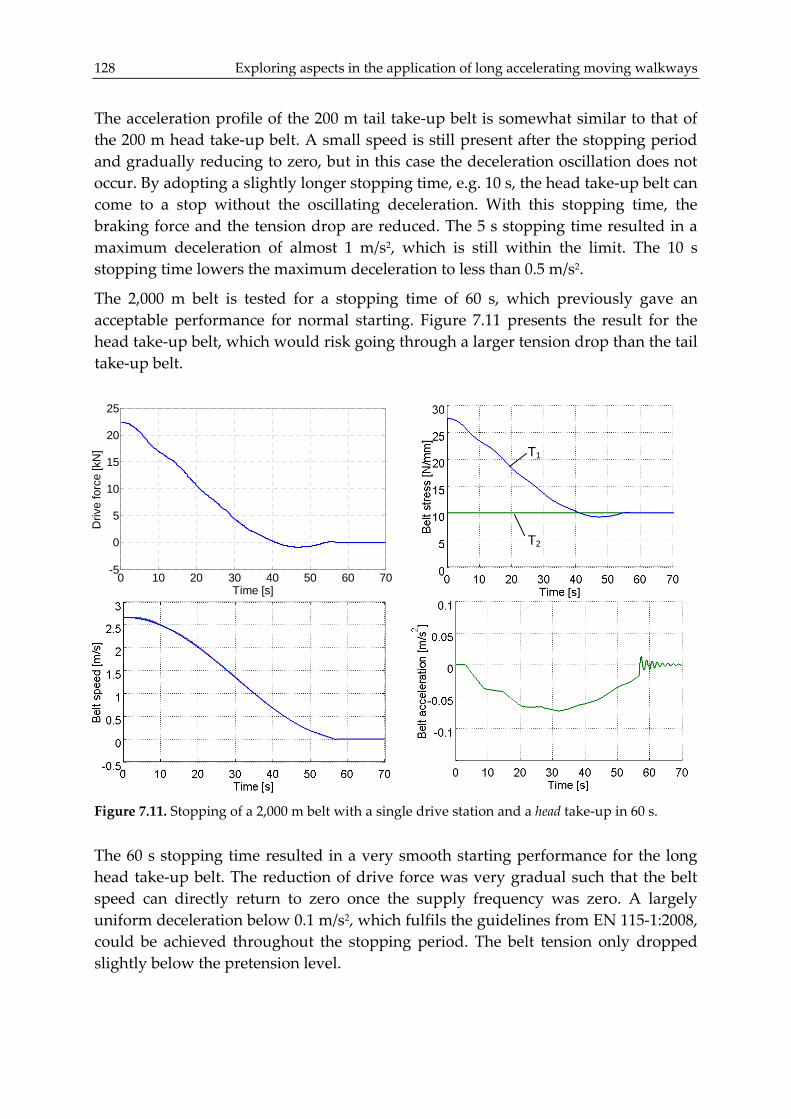
128 Exploring aspects in the application of long accelerating moving walkways
The acceleration profile of the 200 m tail take‐up belt is somewhat similar to that of the 200 m head take‐up belt. A small speed is still present after the stopping period and gradually reducing to zero, but in this case the deceleration oscillation does not occur. By adopting a slightly longer stopping time, e.g. 10 s, the head take‐up belt can come to a stop without the oscillating deceleration. With this stopping time, the braking force and the tension drop are reduced. The 5 s stopping time resulted in a maximum deceleration of almost 1 m/s2, which is still within the limit. The 10 s stopping time lowers the maximum deceleration to less than 0.5 m/s2.
The 2,000 m belt is tested for a stopping time of 60 s, which previously gave an acceptable performance for normal starting. Figure 7.11 presents the result for the head take‐up belt, which would risk going through a larger tension drop than the tail take‐up belt.
0 10 20 30 40 50 60 70-5
0
5
10
15
20
25
Time [s]
Driv
e fo
rce
[kN
]
Figure 7.11. Stopping of a 2,000 m belt with a single drive station and a head take‐up in 60 s.
The 60 s stopping time resulted in a very smooth starting performance for the long head take‐up belt. The reduction of drive force was very gradual such that the belt speed can directly return to zero once the supply frequency was zero. A largely uniform deceleration below 0.1 m/s2, which fulfils the guidelines from EN 115‐1:2008, could be achieved throughout the stopping period. The belt tension only dropped slightly below the pretension level.
T2
T1
Chapter 7. Performance of long AMW belts with single and multiple drives 129
The 2,000 m tail take‐up belt also presented a smooth stopping performance within 60 s, with the drive force, deceleration and speed profiles similar as above. The tight‐side tension and the slack‐side tension only slightly dropped and increased, respectively, around the pretension level. It should be added that a 120 s stopping time, based on the 60 s per 1 km belt length rule, obviously gave a smoother stop for both types of take‐up belt. In such a case, the belt tension did not even go across the pretension level and the drive force did not even need to brake. However, the 60 s stopping time can already be considered sufficient.
Analysis of emergency stopping
The emergency stopping of the 200 m belt is initially tested for a 3 s stopping time, which is slightly above the 2.5 s time derived earlier in this section. The stopping procedure simply follows the reversed S‐curve speed profile and no additional braking force is applied to the belt. It was found that, for both empty and fully loaded, the 200 m belt cannot be stopped within 3 s because slip occurs. This causes uncontrolled decelerations exceeding the 1 m/s2 limit and unacceptable jerks. The shortest stopping time that can be imposed to an empty 200 m belt without causing slip is 5 s, which is similar to the time previously tested for normal stopping. However, the belt still drifted for around 10 s after the power supply was stopped. A similar occurrence is found for the emergency stopping of a fully loaded 200 m belt, where the belt can avoid slip with a 15 s stopping time, but cannot stop completely within that time. For the same stopping time, similar performances in terms of drive force, belt speed and acceleration were found for the 200 m tail take‐up belt.
Based on the above, it can be directly inferred that a 2,000 m single‐drive belt in any loading condition will not be able to stop within 3 s. From the simulations, it was found that the shortest time in which a 2,000 m system with a head take‐up can stop acceptably from empty condition, i.e. without drive slippage, high decelerations or belt compression, is 25 s. For an empty tail take‐up belt, an acceptable stopping performance can be achieved in 15 s. The shorter acceptable stopping time for the empty tail take‐up belt may be explained by the possibility of the deceleration waves to propagate away from the drive station at the head into two directions before being reflected by the tail take‐up. The shorter propagation distance in both travel directions results in a more uniform and faster belt speed reduction along the length of the upper and lower strands compared to that in the head take‐up belt. In the latter system, the deceleration wave has to travel the whole length of the belt before being reflected by the head take‐up. The delayed reaction causes higher speed differences along the belt length, which results in a larger tension drop for a 15 s stopping of the head take‐up system.
If the 2,000 m system is fully loaded, the acceptable stopping time extends to 50 s, which is required to avoid belt compression. In this case, the acceptable stopping time is similar for both types of take‐up since the deceleration wave propagation in
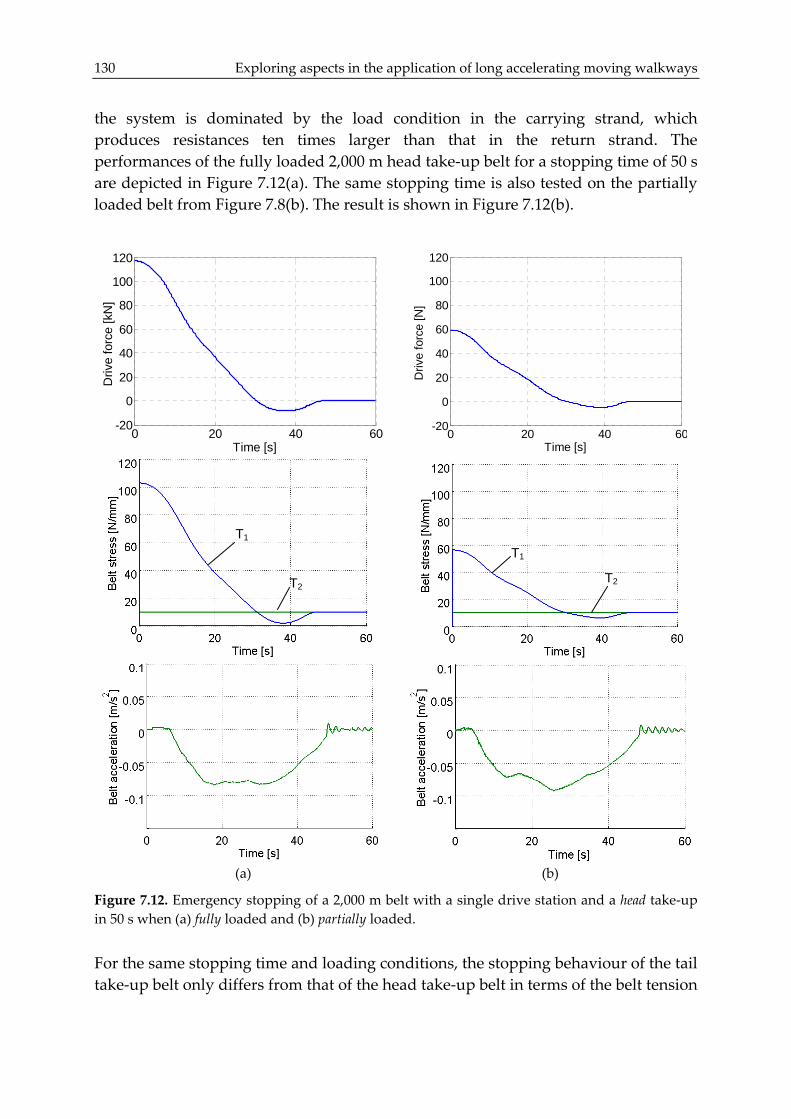
130 Exploring aspects in the application of long accelerating moving walkways
the system is dominated by the load condition in the carrying strand, which produces resistances ten times larger than that in the return strand. The performances of the fully loaded 2,000 m head take‐up belt for a stopping time of 50 s are depicted in Figure 7.12(a). The same stopping time is also tested on the partially loaded belt from Figure 7.8(b). The result is shown in Figure 7.12(b).
0 20 40 60-20
0
20
40
60
80
100
120
Time [s]
Driv
e fo
rce
[kN
]
0 20 40 60
-20
0
20
40
60
80
100
120
Time [s]
Driv
e fo
rce
[N]
(a) (b)
Figure 7.12. Emergency stopping of a 2,000 m belt with a single drive station and a head take‐up in 50 s when (a) fully loaded and (b) partially loaded.
For the same stopping time and loading conditions, the stopping behaviour of the tail take‐up belt only differs from that of the head take‐up belt in terms of the belt tension
T1 T1
T2 T2

Chapter 7. Performance of long AMW belts with single and multiple drives 131
profile, which is also acceptable for a 50 s stopping time. It should be noted that, for both the head and the tail take‐up belts, the tight‐side tension drop during the 50 s stopping procedure is quite close to zero. This tension drop, in fact, becomes the main reason for the need to use a longer stopping time. With the 50 s stopping time, the drive station only slightly enters regenerative braking and the resulting decelerations and jerks are well within the allowable limits.
The 50 s stopping time for the fully loaded 2,000 m belt is actually quite long for an emergency stop. With such a time, the belt would travel for another 70 m before stopping. In order to obtain a shorter stopping time and distance for emergency stopping, additional brake load would have to be applied to the belt, besides the drive’s regenerative brake due to the imposed speed reduction signal. The amount of brake load that should be applied to stop a moving walkway of a given belt length and width is prescribed in EN 115‐1:2008 (CEN, 2008). However, the additional brake load will most likely increase the deceleration level and the risk of belt compression. Attention should be given to ensure that the deceleration level is still safe for passengers and the belt compression will not cause system failure that may, again, endanger the passengers.
7.4 Behaviour of long multiple-drive AMW belts
The discussions in the previous section have pointed out a number of difficulties for the application of long AMW belts if a single‐drive configuration is used. In this section, the influence of implementing multiple drives in long AMW belts is investigated.
7.4.1 System layout
To enable comparisons between the long single‐drive and the long multiple‐drive AMW belts, the total length of the multiple‐drive belt is also set at 2,000 m. A separate consideration is made with regard to the required power for the carrying (upper) and the return (lower) belt strands due to the different amount of resistances in the strands. The drives in the carrying strand have to be sized to handle passengers at maximum capacity, whereas those in the return strand only have to handle an empty belt. In this case, the per‐meter resistance in the carrying strand is ten times higher than that in the return strand. If the belt tension in each driven section of the carrying strand is to be kept approximately equal to that in each driven section of the return strand when handling the rated load, then the drive spacing in the return strand should be made ten times larger than that in the carrying strand. All drive stations are hence installed with the same amount of power.
A layout of a 2,000 m belt with multiple drives is presented in Figure 7.13. In this example, the drive spacing in the carrying stand is 100 m, so it has ten drive stations. The return strand has only one drive station located 1,000 m from the last drive in the

132 Exploring aspects in the application of long accelerating moving walkways
carrying strand. As stated in Chapter 6, the numbering of the drive stations begins from the position of the tensioning device following the direction of the belt’s movement. For a system with a tail take‐up as in the figure below, the first drive station is in the carrying strand. A system with a head take‐up, which is also simulated in this study, has its first drive station in the return strand.
Figure 7.13. Layout of a multiple‐drive AMW belt.
As described in Section 6.4.2, the multiple drives of the AMW belt are assumed to be based on the drive system of the EBS. Hence, to provide the required transferable drive power, each drive station in the above figure is modelled as eight very closely spaced EBS type drive stations. This gives a total installed power of 528 kW, which is larger than the total power installed in the previously discussed 2,000 m single‐drive belt. In the model, the higher total power resulted from the rounding up of the number of required EBS type drive stations when the amount of resistances in a driven section is divided by the maximum transferable drive force from an EBS drive. In practice, this larger total power can be attributed to the fact that the multiple‐drive belt consists of a number of short driven sections, which results in a higher fraction of secondary resistances when compared to the long single‐drive belt.
For ease of discussion, the multiple‐drive belt conveyor with 10 drive stations in the carrying strand and 1 drive station in the return strand is further referred to as the 10C/1R system.
7.4.2 Starting
Starting procedure
Nuttall (2007) studied the dynamics of multiple‐drive EBS conveyors with a head take‐up. He stated that the multiple‐drive configurations can be seen as a number of linked single‐drive systems with a single tensioning device. When the resistances in all driven sections are more or less equal, the dominant dynamic behaviour occurs in the belt section between the head take‐up and the first drive station, which has to accelerate the longest length of belt. As a result, the dynamic in this section determines the starting time that is acceptable. It was further observed that the tight‐side tension in this dominant belt section approximately follows the same profile as

Chapter 7. Performance of long AMW belts with single and multiple drives 133
that of a single‐drive system, when single‐drive belt length is equal to the length of the dominant belt section. The acceptable starting time for the multiple‐drive belt can, thus, be approximated from the starting time of this single‐drive belt.
In Section 7.3.2, the 2,000 m single‐drive belt with a head take‐up could perform an acceptable starting procedure with a 60 s starting time. Based on this, an initial starting time of 30 s is deduced for a 10C/1R system with a head take‐up, corresponding to the 1,000 m belt section between the tensioning device and the first drive station. The S‐curve speed profile is again used as the starting procedure for the motors in the multiple‐drive configuration.
Nuttall did not carry out studies on multiple‐drive systems with a tail take‐up. However, it can be expected that the starting time for such a belt will also be governed by the dynamics of the longest belt section. The 2,000 m single‐drive belt with a tail take‐up in Section 7.3.2 required a 60 s starting time to give an acceptable starting behaviour. The 10C/1R system with a tail take‐up is, thus, initially tested for a 30 s starting time.
Analysis of normal starting
The starting behaviours of the 10C/1R belt with a head and a tail take‐up in 30 s are presented in Figure 7.14. As shown in the upper graphs in the figure, the 30 s starting time results in a relatively high starting curve for the drive force from the drive station in the return strand. This refers to the first drive station for the head take‐up belt and the last drive station for the tail take‐up belt. These drive stations delivers the most drive power because they have to accelerate the longest length of belt. The least amount of power is applied by the last drive station in the head take‐up belt and, reversely, the first drive station in the tail take‐up belt. Once the 30 s starting time has elapsed and the belt is running at a constant and uniform speed, the drive stations share the total belt load equally and, hence, the applied drive forces become the same for all drive stations. The oscillations of drive forces are more apparent for the head take‐up belt.
The middle graphs show the transition of belt tensions during the starting of the empty belt. The solid lines denote the tight‐side tension of each drive station, whereas the dashed lines represent the slack‐side tension. As seen in the left graph, the belt tension profile for the starting of the head take‐up belt is reasonably good. Although some oscillations occur, they are not severe. Notice that the steady state tensions of the belt sections in the carrying strand are at different levels, even though they have the same amount of resistances. This is caused by the load sharing behaviour of the drive stations, where the total load in the system is equally supported by the drive stations when the belt have reached its operational speed.
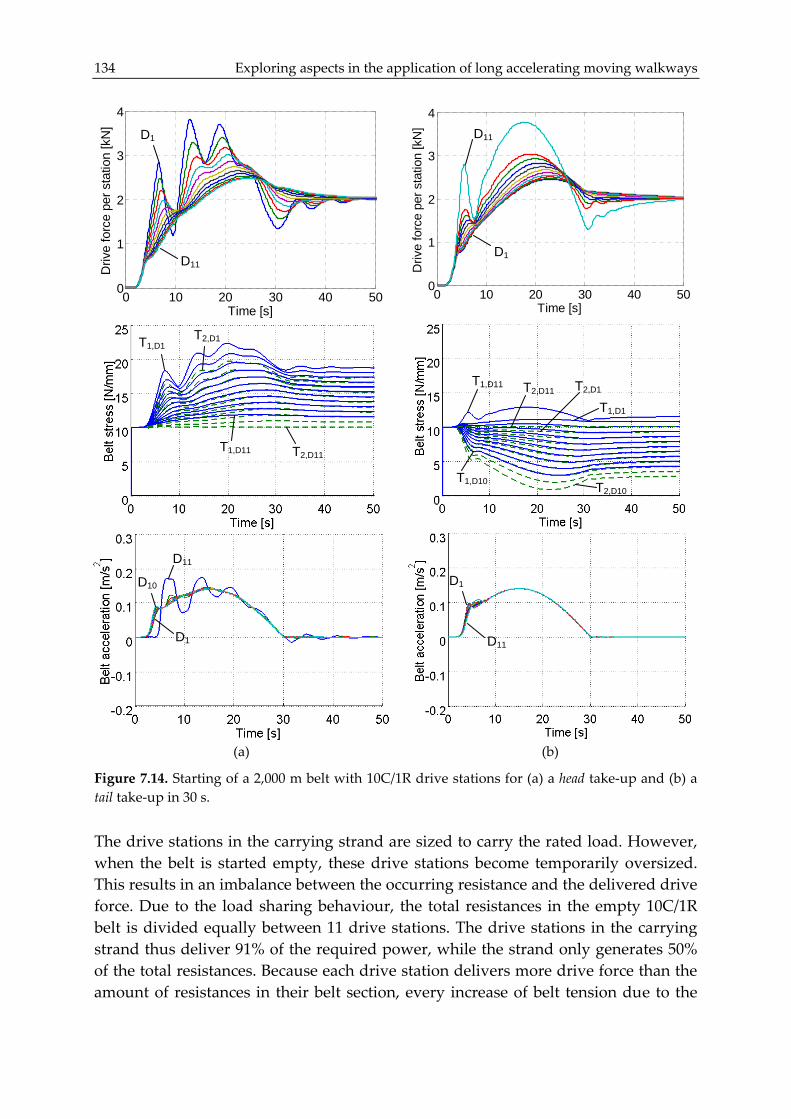
134 Exploring aspects in the application of long accelerating moving walkways
0 10 20 30 40 500
1
2
3
4
Time [s]
Driv
e fo
rce
per s
tatio
n [k
N]
0 10 20 30 40 50
0
1
2
3
4
Time [s]
Driv
e fo
rce
per s
tatio
n [k
N]
(a) (b)
Figure 7.14. Starting of a 2,000 m belt with 10C/1R drive stations for (a) a head take‐up and (b) a tail take‐up in 30 s.
The drive stations in the carrying strand are sized to carry the rated load. However, when the belt is started empty, these drive stations become temporarily oversized. This results in an imbalance between the occurring resistance and the delivered drive force. Due to the load sharing behaviour, the total resistances in the empty 10C/1R belt is divided equally between 11 drive stations. The drive stations in the carrying strand thus deliver 91% of the required power, while the strand only generates 50% of the total resistances. Because each drive station delivers more drive force than the amount of resistances in their belt section, every increase of belt tension due to the
D1
D10
D11
T1,D11 T2,D11
T1,D1 T2,D1
D1
D11
D11
D1
T1,D11
T1,D10
T2,D11
T2,D10
T1,D1 T2,D1
D1
D11

Chapter 7. Performance of long AMW belts with single and multiple drives 135
motion resistance is followed by a larger drop of belt tension due to the applied drive force. This is a particular concern for the case of the tail take‐up belt, since the belt tension drops lower and lower with each passed carrying drive station.
It is additionally noted that with a starting time of 60 s, the drive force oscillations in the head take‐up belt can be significantly reduced to a maximum of around 2.5 kN for the first drive station. This also lowers the maximum transient belt tension to around 20 N/mm. For the tail take‐up belt, this longer starting time enables a slight lift of the minimum transient belt tension to a little above 2 N/mm.
The maximum acceleration during starting is generally low, as depicted in the lower graphs. The acceleration level at the end of the starting period is very small, only resulting in a 0.01 m/s3 jerk in the head take‐up belt. The acceleration after starting even directly goes to zero for the tail take‐up system. Hence, the belt conveyor can be used by passengers as soon as the starting period has elapsed.
I additionally observe the application of more drive stations in the 2,000 m belt by using 50 m spacing for the drive stations in the carrying strand and a 500‐m spacing in the return strand. This configuration is referred as the 20C/2R system. Due to halving the drive station spacing, each drive station in the 20C/2R system now has half the power of a drive station in the 10C/1R system. The starting time for the 20C/2R system is initially tested at 15 s, deduced from the expected starting time of the 500 m belt section in the return strand. The results are presented in Figure 7.15 for a head take‐up and a tail take‐up belt.
The 15 s starting time does not give satisfactory starting behaviour for either the head take‐up or the tail take‐up belt. As can be seen in the upper graphs, after the high overshoot of applied drive force, the first drive station in the return strand of the head take‐up drive has to brake in order to catch up with the imposed starting speed profile. The same occurs for the last drive station in the tail take‐up belt, although it does not enter braking as long as the drive station in the head take‐up belt. Additionally, the belt tension in the tail take‐up belt drops too low into compression. The starting performances for both types of take‐up belt were improved when the starting time is changed to 30 s.
In terms of belt tension, for head take‐up it is always above the compression limit, although very near to pretension level. The 30 s starting time does not result in braking, still positive drive force but there is a drop almost reaching zero. The acceleration after the starting period directly damps out to zero. Hence, passengers should be able to enter the system. Compared to the 10C/1R configuration with the same starting time, the maximum belt tension is slightly lower but the minimum tension is very similar. The additional drive stations only cause additional belt tension profiles in between the maximum and the minimum belt tensions.

136 Exploring aspects in the application of long accelerating moving walkways
0 5 10 15 20 25 30-2
0
2
4
6
Time [s]
Driv
e fo
rce
per s
tatio
n [k
N]
0 5 10 15 20 25 30
-2
0
2
4
6
Time [s]
Driv
e fo
rce
per s
tatio
n [k
N]
(a) (b)
Figure 7.15. Starting of a 2,000 m belt with 20C/2R drive stations for (a) a head take‐up and (b) a tail take‐up in 15 s.
The results for the case of 20C/2R drive configuration revealed that the additional eleven drive stations do not provide significant benefit compared to the 10C/1R configuration. Firstly, the reduction in the maximum transient belt tension is small, which corresponds with the fact that the attainable reduction diminishes with the increasing number of drives (Alspaugh, 2003). Secondly, the shorter drive spacing does not allow for the reduction of the system starting time. Hence, the 10C/1R drive configuration can be considered sufficient.
7.4.3 Influence of passenger distribution
Loading pattern
For this section onwards, the focus is only on the 2,000 m belt with 10C/1R drive stations. The same loading patterns, in Section 7.3.3, which have been tested for the long single‐drive belt, are now tested for this multiple‐drive system.
Analysis of loading for standing passengers
The loading behaviour of the 10C/1R system from empty to fully loaded is depicted in Figure 7.16.
D1
D22
D22
D1
T1,D22 T2,D22
T1,D1 T1,D2 T2,D2
T1,D1 T1,D22
T1,D20 T2,D20
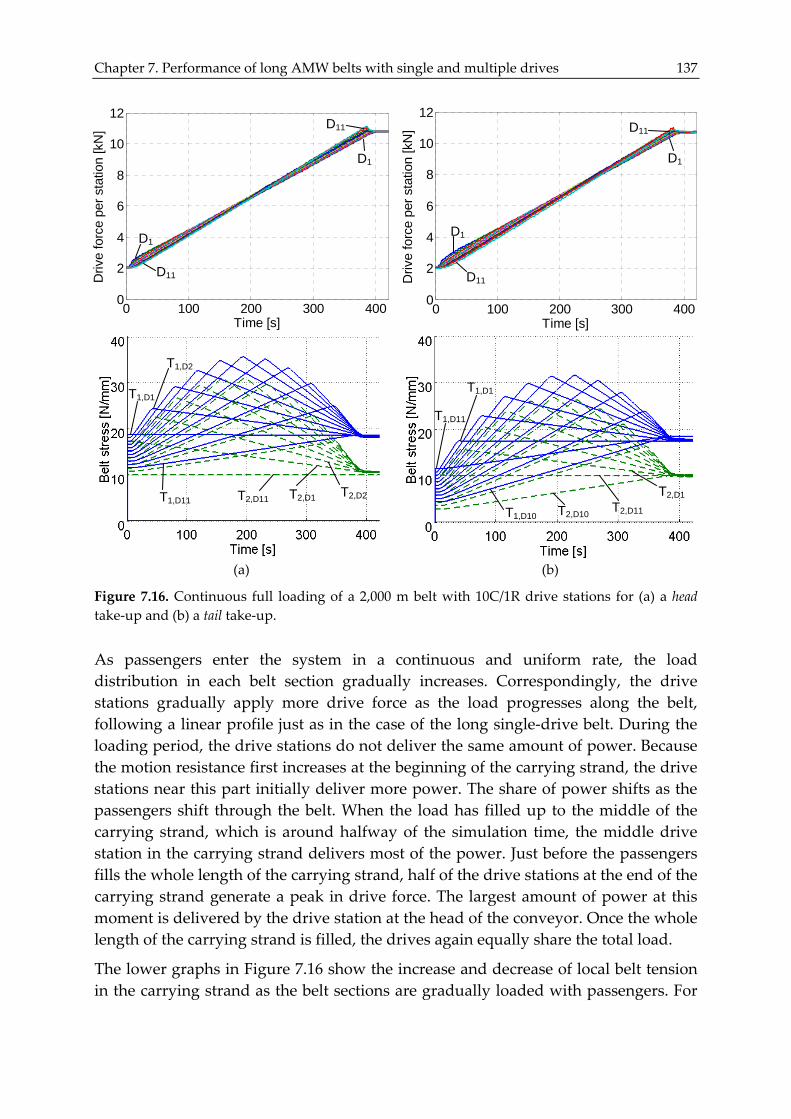
Chapter 7. Performance of long AMW belts with single and multiple drives 137
0 100 200 300 4000
2
4
6
8
10
12
Time [s]
Driv
e fo
rce
per s
tatio
n [k
N]
0 100 200 300 4000
2
4
6
8
10
12
Time [s]
Driv
e fo
rce
per s
tatio
n [k
N]
(a) (b)
Figure 7.16. Continuous full loading of a 2,000 m belt with 10C/1R drive stations for (a) a head take‐up and (b) a tail take‐up.
As passengers enter the system in a continuous and uniform rate, the load distribution in each belt section gradually increases. Correspondingly, the drive stations gradually apply more drive force as the load progresses along the belt, following a linear profile just as in the case of the long single‐drive belt. During the loading period, the drive stations do not deliver the same amount of power. Because the motion resistance first increases at the beginning of the carrying strand, the drive stations near this part initially deliver more power. The share of power shifts as the passengers shift through the belt. When the load has filled up to the middle of the carrying strand, which is around halfway of the simulation time, the middle drive station in the carrying strand delivers most of the power. Just before the passengers fills the whole length of the carrying strand, half of the drive stations at the end of the carrying strand generate a peak in drive force. The largest amount of power at this moment is delivered by the drive station at the head of the conveyor. Once the whole length of the carrying strand is filled, the drives again equally share the total load.
The lower graphs in Figure 7.16 show the increase and decrease of local belt tension in the carrying strand as the belt sections are gradually loaded with passengers. For
D1
D1
D11
D11
T2,D11 T2,D1 T2,D2 T1,D11
T1,D1
T1,D2
D11
D1
D1
D11
T1,D1
T1,D11
T1,D10 T2,D10 T2,D11 T2,D1

138 Exploring aspects in the application of long accelerating moving walkways
each driven section, the belt tension increases until the moment the first passenger passes the location of the drive. The highest peak of tight‐side tension occurs when the passengers first pass the drive station at the middle of the carrying strand. After the whole carrying strand is filled, the resistance in each driven section matches the sized drive. Hence, the steady state tight and slack‐side tensions of all drive stations settle at the same level. The peak tension during this loading period should be taken into account when evaluating the required strength of the system components.
A different situation occurs when the rate of passengers entering the conveyor is not continuous and uniform, as can be seen in Figure 7.17 below.
0 100 200 300 4000
2
4
6
Time [s]
Driv
e fo
rce
per s
tatio
n [k
N]
0 100 200 300 400
0
2
4
6
Time [s]
Driv
e fo
rce
per s
tatio
n [k
N]
(a) (b)
Figure 7.17. Intermittent varying loading of a 2,000 m belt with 10C/1R drive stations for (a) a head take‐up and (b) a tail take‐up.
The upper graphs of Figure 7.17 show that the increase of drive forces follows staggering lines, with the gradients corresponding to the varying load rate entering the system with an interval of 30 s. The imbalance in the applied drive forces occur throughout the loading period because the occurring resistance in the belt sections never matches the sized drives. At the beginning of the loading from an empty belt, the drive at the entrance delivers the highest amount of power. At the end of the first
D1
D1
D11
D11
T2,D11 T2,D1
T2,D2 T1,D2
T1,D11
T1,D1
D1
D11
D1
D11
T1,D10 T2,D11
T1,D11 T1,D1
T2,D1
T2,D10

Chapter 7. Performance of long AMW belts with single and multiple drives 139
loading interval, when there is no passenger entering the system, the drive stations try to equalize the load sharing. When the next wave of passengers enters the system at a lower loading rate, the drive force imbalance occurs again. Notice that, as more passengers enter the system, it becomes more difficult to achieve a balanced load sharing of the drive stations during the intervals where no passengers are entering the system. This is due to the fact that, although no more passengers enter, the passengers that are already on board continue to shift through the belt sections and change the distribution of the motion resistances that have to be handled by each drive stations.
For a varying loading condition, the transition of local belt tensions is not as obvious compared to the changes in applied drive forces. The increase and decrease of the local belt tension for drive stations the entrance until the centre of the carrying strand can be followed corresponding to the change of loading rate, up to the moment where the first passenger passes the middle drive station. The imbalance between the occurring resistance and the applied drive power at the moment just before the first passenger enters the last driven section in the carrying strand results in a tension drop in the slack‐side belt tension. Since the belt sections are partially loaded, the resistances do not match the sized drive so the belt tension of the driven sections cannot settle at the same level.
Just like in the loading of the single‐drive belt, the increase of load in the system causes belt speed drop. For the multiple‐drive belt, the speed drop is not the same for every drive station during the loading period because each drive station handles different amount of loads. It is important that the varying speed drop between the drive stations do not cause major speed differences between the belt sections. From both simulated loading conditions, it was found that the changes of belt speed during loading was largely uniform and did not result in any significant decelerations that may affect the balance of passengers.
It is additionally noted that the 20C/2R system results in a significantly lower steady state belt tension compared to the 10C/1R system once it is fully loaded. However, the peak of tight‐side tension during the loading period is only around 2 N/mm lower than that in the 10C/1R system. Hence, the utilized belt specification will most likely be similar. This once again confirms that the 10C/1R configuration is sufficient.
7.4.4 Stopping
Stopping procedure
The normal stopping of the 10C/1R belt is initially tested for a 30 s stopping time, which is half of what was found acceptable for the 2,000 m single‐drive belt in Section 7.3.4. The stopping procedure still applies the reversed S‐curve speed profile by gradually reducing the supply frequency and, correspondingly, the supply voltage. Additional brake load is not yet applied to the system during stopping.

140 Exploring aspects in the application of long accelerating moving walkways Analysis of normal stopping
The stopping behaviour of the 2,000 m belt with 10C/1R drive configuration is depicted in Figure 7.18.
0 10 20 30 40-2
-1
0
1
2
3
Time [s]
Driv
e fo
rce
per s
tatio
n [k
N]
0 10 20 30 40
-2
-1
0
1
2
3
Time [s]D
rive
forc
e pe
r sta
tion
[kN
]
(a) (b)
Figure 7.18. Stopping of a 2,000 m belt with 10C/1R drive stations for (a) a head take‐up and (b) a tail take‐up in 30 s.
For both a head take‐up and a tail take‐up belt, the 30 s stopping time enabled the system to stop with acceptable dynamics. In the upper graphs, it is shown that the
D1
D11
D11
T1,D1 T2,D1
T2,D11 T1,D11
D1
D11
T1,D11 T2,D11
T1,D1
T2,D10 T1,D10

Chapter 7. Performance of long AMW belts with single and multiple drives 141
applied drive forces are gradually reduced following the decrease in the input frequency and voltage. In order to achieve the imposed speed profile, the drive stations have to enter regenerative braking. In the head take‐up belt, the first drive station applies the most braking force because it has to decelerate the longest length of belt. For the tail take‐up belt, the largest braking is carried out by the last drive station. Approaching the end of the stopping time, the drive stations reduce their braking force in order to set the belt to zero speed. The relatively fast release of brake resulted in some oscillating decelerations after the stopping period was over, as shown in the middle graphs. For the head take‐up belt, the oscillating decelerations at the end of the stopping time are not uniform for the whole length of the belt. Nevertheless, the resulting jerk is less than 0.1 m/s3. Furthermore, the belt was able to directly reach zero speed after the stopping time was over; hence additional brake load is not necessary.
The change in belt tension in the systems is smooth, as shown in the lower graphs. No oscillations occur since the belt was able to directly react towards the change of applied drive forces. During stopping, the belt tension in the head take‐up belt drops below the pretension level due to the applied braking force. The tension drop does not cause the belt to enter compression, so it does not pose any problem. For the tail take‐up belt, belt tension rises over the pretension level during stopping, except for the tight slide tension of the driven section in the return strand.
Analysis of emergency stopping
Looking at the results from the stopping procedure of the 2,000 m single‐drive belt, it is logical that the 2,000 m 10C/1R belt cannot stop within 3 s. However, unlike normal starting and normal stopping, using half the time that was acceptable for the emergency stopping of the 2,000 m single‐drive belt did not give an acceptable emergency stopping for the 2,000 m 10C/1R belt. From the simulations, it was found that an empty 2,000 m 10C/1R belt can stop without drive slip and belt compression when the stopping time is 15 s. The maximum deceleration during the stopping time is almost 0.3 m/s2 and oscillating decelerations are present after the stopping time is over. The level of jerk is generally below 0.1 m/s3.
For a fully loaded belt, a 20 s stopping time was required to enable the 10C/1R system to achieve acceptable emergency stopping dynamics. The stopping performance of this belt is presented in Figure 7.19 for a head and a tail take‐up belt.
The motion resistance in the belt sections are the same when the system is fully loaded. Hence, as seen in the middle graphs, the tight‐side and the slack‐side tensions of all drive stations are at more or less the same level before the stopping procedure starts. The levels of tight‐side and slack‐side tensions are the same for both the head and the tail take‐up belts, so the gradual reduction of drive force follows

142 Exploring aspects in the application of long accelerating moving walkways
more or less the same profile for both types of take‐up belts, as depicted in the upper graphs. The drives carry out regenerative braking at more or less the same level.
0 10 20 30-8
-4
0
4
8
12
Time [s]
Driv
e fo
rce
per s
tatio
n [k
N]
0 10 20 30
-8
-4
0
4
8
12
Time [s]
Driv
e fo
rce
per s
tatio
n [k
N]
(a) (b)
Figure 7.19. Emergency stopping of a fully loaded 2,000 m belt with 10C/1R drive stations for (a) a head take‐up and (b) a tail take‐up in 20 s.
The transition of belt tension is also approximately similar, although the belt tension oscillation at the end of the stopping time is slightly more for the head take‐up belt. The lower graphs show the deceleration profile during the emergency stopping period. The maximum deceleration is around 0.2 m/s2, which is well within the 1 m/s2 limit. The level of jerk is also generally low, with a maximum jerk of around 0.02 m/s3.
D1
D11
D11
T2,D1
T1,D1 T1,D11
T2,D11
D1
D11
T2,D6
T2,D11
T1,D1
T2,D6
T1,D11
T2,D1

Chapter 7. Performance of long AMW belts with single and multiple drives 143
The 20 s stopping time is also applied to test the emergency stopping of the 10C/1R belt that is partially loaded due to the loading pattern in Section 7.3.3. As presented in Figure 7.20, the stopping dynamics are generally acceptable. Different drive force and belt tension dynamics occur for the emergency stopping of a head and a tail take‐up belt when the system is partially loaded. The deceleration profiles of both types of belt are more or less similar to those of the fully loaded belt.
0 10 20 30-6
-4
-2
0
2
4
6
Time [s]
Driv
e fo
rce
per s
tatio
n [k
N]
0 10 20 30
-6
-4
-2
0
2
4
6
Time [s]
Driv
e fo
rce
per s
tatio
n [k
N]
(a) (b)
Figure 7.20. Emergency stopping of a partially loaded 2,000 m belt with 10C/1R drive stations for (a) a head take‐up and (b) a tail take‐up in 20 s.
With a 20 second stopping time, the stopping distance is around 30 m. This may still be considered to far for an emergency stopping. A slight reduction of the stopping time to 15 s still enables a stopping of the fully loaded as well as partially loaded belt without drive slip and belt compression, at the expense of more tension oscillations at the end of the stopping time. The drive force and deceleration profiles from a 15 s stopping time are still acceptable.
T1,D1
T1,D11
T2,D11
D1
D11
D11
T1,D11
T2,D11
144 Exploring aspects in the application of long accelerating moving walkways
7.5 Implications towards drive-related application aspects
Based on the discussions in the previous sections, how the operating behaviour and dynamics of long single‐drive and multiple‐drive AMW belts affect the following drive‐related application aspects is evaluated.
7.5.1 System components and support structure
When the length of a single‐drive AMW belt conveyor is significantly extended, in this case to 2,000 m, the long system cannot continue to use the same belt rating as that used in present day (short) AMWs. When handling the design load, the maximum belt tension in the system exceeds the allowable limit derived from the belt’s breaking strength and safety factors. A belt with a higher rating will have to be used, but such a passenger belt is not readily available. Stronger belts available for bulk material conveyors cannot be used because they do not have sufficient transverse rigidity that is required to support the passengers. Hence, a new passenger belt would have to be produced.
Even if a stronger belt can be made available, another issue is still present. The higher tight‐side tension at the drive pulley of the long AMW belt causes higher resultant tension acting on the drum. To withstand this new level of tension, the diameters of the end pulleys have to be increased. In the case of the 2,000 m single‐drive belt, it has been calculated that the pulley diameters will need to be around 1,100 mm in order to accommodate the maximum belt tension when carrying the rated load. This is around two standard pulley diameters larger than what is used now.
A lower maximum belt tension when fully loaded can be provided by the application of multiple drives. The proposed 10C/1R drive configuration can reduce the maximum operating tension to less than half of that in a single drive system. The current belt rating can thus be applied to longer AMW belts as well. By limiting the maximum tension in the 2,000 m multiple‐drive AMW to the same limit as that found in a 200 m single‐drive system, the components and specifications of the 200 m system can be applicable for the 2,000 m system as well.
For a long single‐drive belt with a take‐up positioned at the tail, an additional concern is the low drop of slack‐side tension when starting. However, this problem was not solved by the use of multiple drives. As explained in front, the multiple drives in this study equally share the total load in the belt, so an imbalance occurs between the applied drive forces and the locally occurring belt resistances during empty starting. This causes a progressive tension drop each time the belt passes a drive station. To solve this, the amount of take‐up tension will have to be increased, which may also contribute to the necessity for a larger take‐up device and pit‐depth.
For multiple‐drive belts, the two take‐up positions have their own limitations. A belt with a take‐up at the head generally results in operating performances that have

Chapter 7. Performance of long AMW belts with single and multiple drives 145
higher dynamics compared to a belt with a take‐up at the tail. However, the tail take‐up belt risks from belt tension drop due to the load sharing of the drives.
7.5.2 System and passenger safety
For empty starting and stopping, provided that a sufficient ramp time is selected, the belt can have generally uniform accelerations and jerks that are within the limits given for passenger safety. Variations of loading conditions when passengers use the system do not cause any discernable accelerations or jerks related to belt velocity changes.
For a long belt, the ramp time is dictated by the transition of belt tension and the occurrence of slip at the drive stations. A too short starting and stopping times may cause belt compression. For long multiple‐drive belts, the risk of belt slip is somewhat higher than that in single‐drive belts. This is due to the assumed design that the multiple drive forces are applied with friction wheels, which have a lower limit of slip when compared to a drive pulley.
The emergency stopping of the long single‐drive belt is cannot be carried out in a short time due to the risk of belt compression during stopping. When the system is fully loaded, a 50 s stopping time is required. Such a stopping time will still carry the passengers for another 70 m before actually stopping. With the multiple‐drive configuration, the stopping of the 2,000 m belt can be carried out in a relatively shorter time. In this case, a fully loaded belt can carry out an emergency stop in 15 s while still maintaining acceptable belt tension and jerks. This stopping time still results in a relatively long stopping distance that does not yet comply with the current moving walkway standards. However, if a shorter stopping time is taken in order to fulfil the stopping distance in the standards, higher jerk and belt compression may occur. Bunching hazard at the exit may be the risk when the longer stopping time is used. On the other hand, the shorter stopping time may impose risk to all passengers since the high jerk occurs along the system.
7.5.3 Power consumption
As mentioned above, the 2,000 m single‐drive AMW belt needs 60 s to carry out normal starting and normal stopping procedures with smooth operating dynamics. Due to this longer ramp time, power consumption saving modes of CMWs based on the stop‐and‐go or idle‐to‐nominal schemes (as explained in Chapter 4), cannot be implemented in long AMWs. To provide the acceptable starting time for the long single‐drive AMW belt, the passenger detection sensor for the stand‐by modes would have to be placed very far before the comb intersection line. Because it is necessary to prevent non‐users from triggering the detection sensor and users from approaching the AMW without triggering it, some form of barrier are usually placed

146 Exploring aspects in the application of long accelerating moving walkways
to distinguish the path towards the comb. This may be an issue because the long barrier can also disturb other pedestrian flow.
Unfortunately, the multiple‐drive configuration cannot enable the implementation of such stand‐by mode either. The minimum start‐up time of a multiple‐drive belt is still governed by the longest section in the system, i.e. the section in the return strand. Hence, the acceptable ramp time is still not sufficiently low. From the alternatives previously mentioned in Chapter 4, this leaves only the power optimiser method that regulates voltage according to the amount of load in the system.
7.6 Conclusions
This chapter has extensively discussed the operating performance of long AMW belt conveyors with single and multiple drives during starting, loading and stopping processes. Based on the simulation results, a number of aspects have been pointed out with regards to the implication of the system dynamics towards drive‐related application aspects of long AMW belts.
As was envisaged in the beginning of this chapter, a single drive unit is not a practical drive configuration for long AMWs, mainly because the occurring system tension cannot be accommodated by the currently available passenger belt rating. Applying multiple drives will enable the long AMW to continue using the same belt rating as well as system components and structure as in present day AMW systems. The optimum arrangement of the multiple drives for drive force transfer still needs to be sought for.
From simulations, it appears that applying a load‐sharing approach to control the multiple drives still brings some issues to the overall performance of the AMW belt. The load‐sharing behaviour causes imbalance between the applied drive force and the occurring resistances in a driven section when the load in that section does not reach its design capacity. This results in undesirable tension increase in head take‐up belts and tension drop in tail take‐up belts. In order to match the generated power with the amount of load in the belt section, the drives should be controlled individually. The influence of such a method towards the performance of the multiple‐drive AMW belt is evaluated in the next chapter.

147
Chapter 8
Performance of long multiple-drive accelerating moving walkway belts with voltage control
8.1 Introduction
In Chapter 7 it was shown that imbalance between the occurring motion resistances and the applied drive force in the driven sections of a multiple‐drive Accelerating Moving Walkway (AMW) belt can lead to undesirable rise and fall of belt tension. The tail take‐up belt, in particular, can have a very low slack‐side tension at the drive station furthest away from the take‐up position due to the load‐sharing behaviour of the drives. For the head take‐up belt, the imbalance can cause a belt tension rise during loading, which may peak up to twice of the belt tension when empty. In order to provide a drive force that correspond to the amount of motion resistances in each driven belt‐section, each drive station need to be controlled individually.
This chapter analyses the influence of applying individual drive control based on the amount of motion resistances in the corresponding belt section towards the performance of the long AMW belt. The analysis uses the belt conveyor model described in Chapter 6, which has also been used in Chapter 7. First, the method of drive control and how it is implemented in the simulation framework are described in Section 8.2. Applying this control method, the operating behaviours of long AMW belts with multiple drives are once again simulated and analysed in Section 8.3. The implications of the new dynamic behaviours towards the system’s drive‐related applications aspects are discussed in Section 8.4, focusing on whether the applied drive control can bring added benefits to the operation of the system. Section 8.5 concludes the chapter.
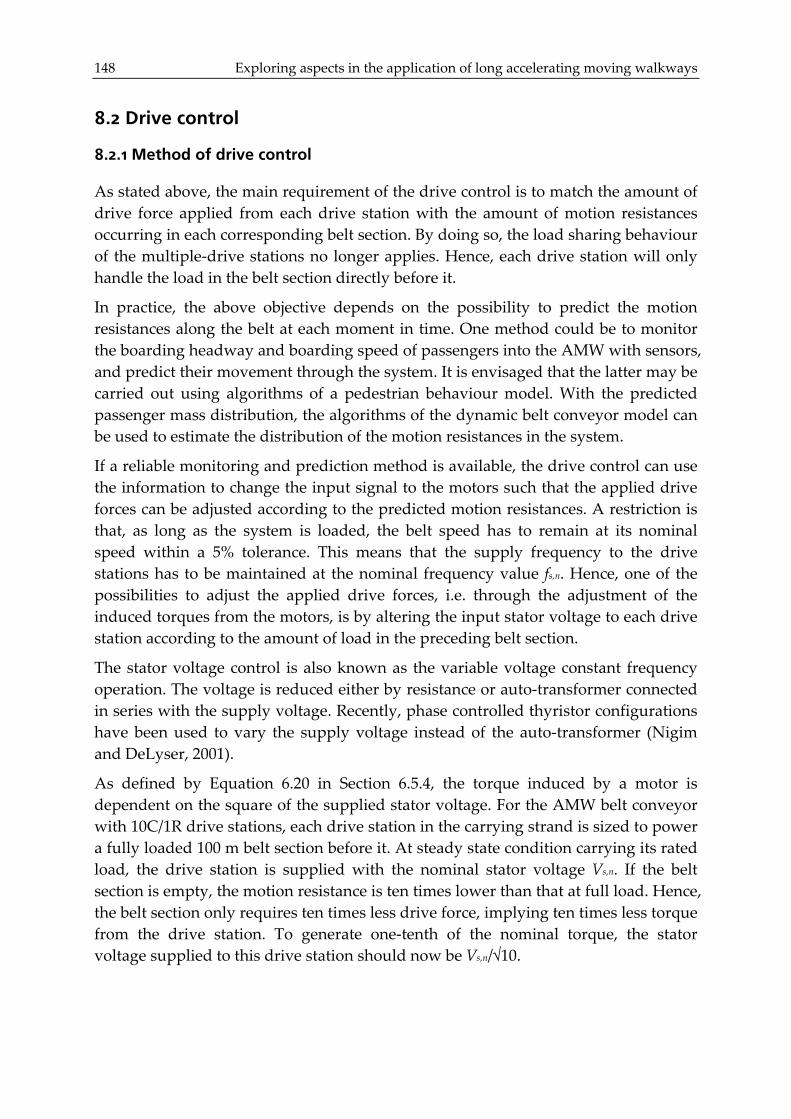
148 Exploring aspects in the application of long accelerating moving walkways
8.2 Drive control
8.2.1 Method of drive control
As stated above, the main requirement of the drive control is to match the amount of drive force applied from each drive station with the amount of motion resistances occurring in each corresponding belt section. By doing so, the load sharing behaviour of the multiple‐drive stations no longer applies. Hence, each drive station will only handle the load in the belt section directly before it.
In practice, the above objective depends on the possibility to predict the motion resistances along the belt at each moment in time. One method could be to monitor the boarding headway and boarding speed of passengers into the AMW with sensors, and predict their movement through the system. It is envisaged that the latter may be carried out using algorithms of a pedestrian behaviour model. With the predicted passenger mass distribution, the algorithms of the dynamic belt conveyor model can be used to estimate the distribution of the motion resistances in the system.
If a reliable monitoring and prediction method is available, the drive control can use the information to change the input signal to the motors such that the applied drive forces can be adjusted according to the predicted motion resistances. A restriction is that, as long as the system is loaded, the belt speed has to remain at its nominal speed within a 5% tolerance. This means that the supply frequency to the drive stations has to be maintained at the nominal frequency value fs,n. Hence, one of the possibilities to adjust the applied drive forces, i.e. through the adjustment of the induced torques from the motors, is by altering the input stator voltage to each drive station according to the amount of load in the preceding belt section.
The stator voltage control is also known as the variable voltage constant frequency operation. The voltage is reduced either by resistance or auto‐transformer connected in series with the supply voltage. Recently, phase controlled thyristor configurations have been used to vary the supply voltage instead of the auto‐transformer (Nigim and DeLyser, 2001).
As defined by Equation 6.20 in Section 6.5.4, the torque induced by a motor is dependent on the square of the supplied stator voltage. For the AMW belt conveyor with 10C/1R drive stations, each drive station in the carrying strand is sized to power a fully loaded 100 m belt section before it. At steady state condition carrying its rated load, the drive station is supplied with the nominal stator voltage Vs,n. If the belt section is empty, the motion resistance is ten times lower than that at full load. Hence, the belt section only requires ten times less drive force, implying ten times less torque from the drive station. To generate one‐tenth of the nominal torque, the stator voltage supplied to this drive station should now be Vs,n/√10.

Chapter 8. Performance of long multiple‐drive AMW belts with voltage control 149
For any level of load from empty to fully loaded, the stator voltage supplied to a drive station in the carrying strand Vs,carry can be determined with the relation
= ⋅ ,, ,
,
M carrys carry s n
M full
FV V
F , (Eq. 8.1)
where Vs,n is the nominal supply voltage, FM,carry is the local motion resistance due to the carried load and FM,full is the motion resistance at the designed full load.
For the drive station in the return strand, because it is sized to power an empty belt and the return strand is always empty, then the stator voltage supplied to the return strand at steady state is always at the nominal voltage.
8.2.2 Implementation in the simulation framework
In this study, the main objective of the analysis is to evaluate whether adjusting the stator voltage of individual drive can improve the operating performance of the long multiple‐drive AMW belt. The simulation building block of the control system itself, which would include the load monitoring and mass distribution prediction model, is not yet the focus. Hence, in this chapter, the stator voltage adjustment is implemented in the belt conveyor simulation framework using a relatively straight‐forward approach.
From the simulations in Chapter 7, data of the distribution of load in the belt sections during the whole length of the simulations can be made available. With this data, the locally occurring motion resistance in each driven section and the corresponding stator voltage that would generate the matching drive force are calculated. The resulting adjusted stator voltage profiles are then inserted into the belt conveyor simulation framework as input to the induction motor model.
Descriptions of the stator voltage profiles for starting, loading and stopping processes are further explained in the next sections.
8.3 Behaviour of long multiple-drive AMW belts with voltage control
8.3.1 System layout
This study focuses only on the long AMW belt with ten drive stations in the carrying strand and one drive stations in the return strand, which is referred to as the 10C/1R belt. The layout of the system has been presented in Figure 7.13 in Chapter 7. The belt is simulated for a take‐up at the tail as well as at the head.

150 Exploring aspects in the application of long accelerating moving walkways 8.3.2 Starting
Starting procedure
To maintain a consistent study, the S‐curve speed profile is again used for the starting procedure. For the drive station in the return strand, the supply frequency is gradually ramped up from zero to the nominal frequency of 50 Hz within the selected starting time, following the S‐curve profile. Because this drive station will be handling its rated load upon steady state operation, the supplied stator voltage is also ramped up following the S‐curve profile by keeping a constant voltage to frequency ratio at a value of Vs,n/fs,n.
For the drive stations in the carrying strand, the supply frequency profiles are the same as that for the drive station in the return strand. However, the carrying strand is still empty. Hence, as explained in Section 8.2.1, the stator voltages to the carrying drive stations are only ramped up from zero to Vs,n/√10 within the starting time, following the S‐curve profile. The voltage to frequency ratios for the drives in the carrying strand are also kept constant, but at a value of 1/√10 times Vs,n/fs,n.
Analysis of normal starting
The 10C/1R belt with a head take‐up is initially tested for a starting time of 30 s, which is similar to that used in Section 7.4.2.
As can be seen in the upper graph of Figure 8.1(a), this starting time resulted in a drive force that exceeds the friction limit for the drive station in the return strand. This differs from the result of the 30 s starting for the 10C/1R belt without supply voltage reduction in Section 7.4.2, where all the drive stations are equally sharing the load. Because the drive stations are now assigned to handle only the loads in their own preceding belt sections, the drive station in the return strand no longer receives support from the drive stations in the carrying strand so it has to deliver a much higher drive force. Applying this higher drive force within a 30 s starting time now causes some slip. This could be avoided by adopting a 45 s starting time, as shown in Figure 8.1(b). For both starting time, the drive forces are much less oscillating compared to the case where stator voltage regulation was not applied.
Although slip occurred at the return drive station for a 30 s starting time, it did not significantly effect the belt accelerations or the belt tensions. Comparing to the belt accelerations in Figure 7.14(a), the belt accelerations in Figure 8.1(a) are not so different. The maximum tight‐side belt tension resulting from the 30 s starting time is more or less the same for either applying or not applying the drive control strategy because this tension is dictated by the drive in the return strand, which is not affected by the adjustment of the stator voltage. However, the belt tension profiles for the drives in the carrying strand are now converging to the same tight‐side and slack‐side tensions. This is a logical result of reducing the stator voltage supplied to the drives, which now matches the locally applied drive force to the locally occurring

Chapter 8. Performance of long multiple‐drive AMW belts with voltage control 151
motion resistance in each driven section. Using a 45 s starting time, the belt accelerations and tensions damp out faster, giving a smoother starting performance.
0 10 20 30 40 500
2
4
6
8
10
12
14
Time [s]
Driv
e fo
rce
per s
tatio
n [k
N]
0 20 40 60
0
2
4
6
8
10
12
14
Time [s]
Driv
e fo
rce
per s
tatio
n [k
N]
(a) (b)
Figure 8.1. Starting of a 2,000 m belt with 10C/1R drive stations and a head take‐up in (a) 30 s and (b) 45 s with stator voltage control.
As seen in Figure 8.2, the starting behaviour of the 10C/1R belt with a tail take‐up is relatively similar to that of the head take‐up belt when the stator voltage control is applied. This is particularly true for the belt tension profile, which in Section 7.4.2 was significantly different between the tail and head take‐up systems. By balancing the locally applied drive force to the local resistances, the progressive drop of belt
D1
D10
D11
D1
T1,D1
T1,D2
T2,D1 T2,D11
D1
D10 D11
D1
T1,D1
T1,D2
T2,D1

152 Exploring aspects in the application of long accelerating moving walkways
tension at each passing of a drive station can be avoided. Hence, there is no risk of belt compression, even if the total length of the belt is increased further.
8.3.3 Influence of passenger distribution
Loading pattern
The same passenger loading patterns as described in Section 7.3.3 are now tested for the loading of a 10C/1R belt with drive control, which adjusts the supplied stator voltage according to the amount of load in each driven belt section. During the loading process, the return strand remains at its empty condition so the supply frequency and voltage are kept at their nominal values. The drive stations in the carrying strand are also kept at the nominal frequency to maintain the rated belt speed. However, their stator voltages are gradually adjusted to follow the increase or decrease of motion resistances due to the change of passenger mass in the belt sections.
Analysis of loading for standing passengers
The loading behaviour of the 10C/1R belt with a head take‐up from empty to full load is depicted in Figure 8.3. As seen in the left graph, each drive station in the carrying strand gradually increases its applied drive force according to the increase of load in its preceding belt section. Once a belt section is fully loaded, the corresponding drive station applies the nominal voltage and the generated drive force is now at more or less the same level as the drive force from the return drive station. Then the next drive station starts to increase its drive force. The duration of each drive‐force increase is around 40 s, which relates to the length of the driven section and the belt speed. Notice that the drive forces slightly peaked at the moment when the whole length of the carrying strand is fully loaded and passengers begin to exit the belt. This is similar to what occurred in the 10C/1R belt without drive control in Section 7.4.3. Due to the influence of the load, there is a 3% drop in belt speed when fully loaded. Nevertheless, the belt accelerations and jerks remain practically zero during the whole loading process.
Because the drive forces are gradually and individually increased to match the local resistances, the increase of belt tensions also occurred locally for one carrying belt section at a time, as seen in the right graph of Figure 8.3 above. This gives the advantage of preventing undesirable increase of tensions in the subsequent belt sections, which occurs when all drive stations share the load and increase their drive forces at the same time. Hence, the peaking of belt tensions as previously observed in Figure 7.16 does not appear.
The same principle holds for the case where passengers enter the belt according to an intermittent varying loading pattern. As seen in the left graph in Figure 8.4, each

Chapter 8. Performance of long multiple‐drive AMW belts with voltage control 153
drive station in the carrying strand increases and decreases its applied drive force according to the number of passengers in the preceding belt section.
0 20 40 600
2
4
6
8
10
12
14
Time [s]
Driv
e fo
rce
per s
tatio
n [k
N]
Figure 8.2. Starting of a 2,000 m belt with 10C/1R drive stations and a tail take‐up in 45 s with stator voltage control.
0 100 200 300 4000
2
4
6
8
10
12
Time [s]
Driv
e fo
rce
per s
tatio
n [k
N]
Figure 8.3. Loading of a 2,000 m belt with 10C/1R drive stations and a head take‐up for continuous full load with stator voltage control.
0 100 200 300 4000
2
4
6
8
10
12
Time [s]
Driv
e fo
rce
per s
tatio
n [k
N]
Figure 8.4. Loading of a 2,000 m belt with 10C/1R drive stations and a head take‐up for intermittent varying load with stator voltage control.
D11
D1 D2 T1,D1
T1,D11
T2,D1 T2,D11
D11
D1
D2
D2
T1,D1
T1,D11 T2,D1 T2,D11
D11
T1,D11
T1,D1
T2,D10

154 Exploring aspects in the application of long accelerating moving walkways
The change of gradients in the drive force profiles can be easily linked to the tested passenger loading pattern, with its loading time intervals and varying loading rates, as well as the travel time through each driven section. In contrary to the case in Section 7.4.3, the variation of loading condition in each driven section is clearly reflected in the rise and fall of belt tensions as depicted in the right graph of Figure 8.4. Notice that during the moment when the first passengers begin exiting the belt, i.e. around the simulation time of 400 s, a number of the drive forces slightly peaked. This is comparable to the case of full rate loading shown in Figure 8.3. Due to this slight peak, a number of the belt tensions dropped below pretension level.
The loading behaviours of the tail take‐up belt for the same continuous full load and intermittent varying load patterns are very similar to the graphs in Figures 8.3 and 8.4. This is due to the fact that, with the supply voltage reduction control, the steady state conditions of both types of belt after starting are alike.
8.3.4 Stopping
Stopping procedure
The stopping procedure applies the reverse S‐curve speed profile. For normal stopping, at which there are no passengers on board, the input frequency to the drive station in the return strand is ramped down from the nominal frequency to zero, with the stator voltage decreased accordingly to maintain a constant ratio of Vs,n/fs,n. For the drive stations in the carrying strand, the supply frequencies are also decreased gradually from the nominal frequency to zero. On the other hand, the stator voltages are gradually ramped down from Vs,n/√10 to zero following the reversed S‐curve profile. The starting value of Vs,n/√10 is the voltage adjustment that corresponds to the empty condition of the belt at the beginning of the normal stopping procedure.
For emergency stopping, the ramp down of the input frequency and voltage signal to the return drive station is the same as in the case of normal stopping above. The ramp down of the supply frequencies to the carrying drive stations is also similar to that for normal stopping. The difference is that the ramp down of supply voltages for the carrying drive stations will begin from the stator voltage values that are currently being supplied to each drive stations just before the emergency stopping procedure is initiated, which corresponds to the locally carried load at that moment. The initial value of the stator voltage profiles for emergency stopping procedure may, thus, be different between one carrying drive station and the other.
Analysis of normal stopping
Figure 8.5 presents the dynamics of the 10C/1R belt with a head take‐up for a normal stopping procedure carried out in 30 s.

Chapter 8. Performance of long multiple‐drive AMW belts with voltage control 155
In contrast to the normal starting procedure, the 30 s stopping time did not result in any slip at the return drive station. As seen in the left graph in Figure 8.5, the drive force of the return drive station can smoothly ramp down to zero in 30 s, during which the motors slightly entered the regenerative braking quadrant. The smooth change of drive force resulted in a smooth belt tension profile, as shown in the right graph. The tight‐side belt tension of the return drive station drops slightly below the pretension level due to the applied braking force, but it is still far from compression. The belt acceleration profile resulting from this normal stopping procedure is more or less similar to that depicted in Figure 7.18(a), which a 30 s stopping of the same belt configuration without stator voltage control.
0 10 20 30 40 50-4
-2
0
2
4
6
8
10
12
Time [s]
Driv
e fo
rce
per s
tatio
n [k
N]
Figure 8.5. Stopping of a 2,000 m belt with 10C/1R drive stations and a head take‐up in 30 s with stator voltage control.
Due to similar belt tension and drive force states prior to stopping, the same performances as in Figure 8.5 above are obtained for the normal stopping of an empty tail take‐up belt.
Analysis of emergency stopping
The emergency stopping behaviour of the 10C/1R belt from fully loaded is depicted in Figure 8.6 for a stopping time of 20 s, which is similar to the stopping time used in the emergency stopping case in Section 7.4.4. Comparing to the graphs in Figure 7.19, for the same belt configuration, we can see that the stopping dynamics are similar between applying and not applying the stator voltage control. When the system is fully loaded, all drive stations are running at their nominal frequency and voltage. Hence, regardless of whether or not the stator voltage control is applied, the belt will be stopped from the same initial states.
D1 T1,D1
156 Exploring aspects in the application of long accelerating moving walkways
0 5 10 15 20 25 30-8
-4
0
4
8
12
Time [s]
Driv
e fo
rce
per s
tatio
n [k
N]
0 5 10 15 20 25 30
-8
-4
0
4
8
12
Time [s]
Driv
e fo
rce
per s
tatio
n [k
N]
(a) (b)
Figure 8.6. Emergency stopping of a fully loaded 2,000 m belt with 10C/1R drive stations for (a) a head take‐up and (b) a tail take‐up in 20 s with supply voltage reduction.
Different dynamics occur for the emergency stopping of a partially loaded belt when the stator voltage control is applied, as seen in Figure 8.7 for a head take‐up and the a take‐up belt. Compared to the case without stator voltage control as depicted in Figure 7.20, the partially loaded belt initiates the emergency stopping from various drive force levels because now there is no load sharing of the drives. The different levels of applied drive forces correspond to the different amount of load present in each driven section at the time the emergency stop is initiated.
For a stopping time of 20 s, the partially loaded belt can stop smoothly in time. By applying the stator voltage control to each drive station, the braking force from the drive station in the return strand now stays the same for any level of belt load, as observed when comparing the drive force graph in Figure 8.6 and Figure 8.7. Because the load sharing behaviour of the drives no longer applies, the return drive station will always be handling the same amount of motion resistances as dictated by the empty state of the return strand. Variation of load in the carrying strand now only affects the level of braking forces for the carrying drive stations.
The belt tension profile during the 20 s emergency stopping is generally acceptable. Although oscillations occur at the end of the stopping period, they quickly damp out. Compared to the case without stator voltage control as depicted in Figure 7.20, the
D1
D11 D11
D1
T2,D6 T1,D6
T1,D11
T2,D11
T2,D1
T1,D1
T2,D11
T2,D1
T2,D6
T1,D6
T1,D11 T1,D1

Chapter 8. Performance of long multiple‐drive AMW belts with voltage control 157
belt tension dynamics of the partially loaded belts are now quite different, particularly for the tail take‐up belt. With the stator voltage control, the slack‐side tensions of the tail take‐up belt remain approximately at the pretension level.
0 5 10 15 20 25 30-8
-4
0
4
8
12
Time [s]
Driv
e fo
rce
per s
tatio
n [k
N]
0 5 10 15 20 25 30
-8
-4
0
4
8
12
Time [s]
Driv
e fo
rce
per s
tatio
n [k
N]
(a) (b)
Figure 8.7. Emergency stopping of a partially loaded 2,000 m belt with 10C/1R drive stations for (a) a head take‐up and (b) a tail take‐up in 20 s with supply voltage reduction.
Observing Figure 8.6 and 8.7, the belt tension profile for the drive station in the return strand is more or less the same between a fully loaded and a partially loaded belt when the stopping time is the same. Furthermore, for the head take‐up belt, the maximum belt tension drop during stopping occurs at the return drive station, which is the first drive after the take‐up in the direction of the belt’s movement. In this case, for the same stopping time, the maximum belt tension drop is the same regardless of the passenger loading condition. For the tail take‐up belt, the maximum belt tension drop varies according to the passenger loading condition. For a fully loaded belt, the maximum drop occurs for the first drive after the take‐up in the direction of the belt’s movement, which is the carrying drive station closest to the entrance. For a partially loaded belt, the maximum belt tension drop will occur at the drive station that is handling the highest amount of motion resistances.
D1
T2,D11
T1,D1
D11
T2,D11
T1,D11
158 Exploring aspects in the application of long accelerating moving walkways
8.4 Implications towards drive-related application aspects
The influence of applying the stator voltage drive control in the long multiple‐drive AMW belts is discussed with regards to their implication towards a number of drive‐related application aspects. Whether the drive control strategy brings added benefits towards the operation of the system is evaluated, as compared to the cases in Chapter 7 where the stator voltage control was not applied.
8.4.1 System components and support structure
For the same starting time, the maximum transient belt tension during starting is the same for a system applying or not applying the stator voltage control. A positive impact of the stator voltage control is mainly seen for the empty starting of the tail take‐up belt. Now the belt tensions can be maintained well above the compression limit, with the slack‐side tension staying around the pretension level. Hence, even if the length of the tail take‐up belt is further extended, there will be no risk of belt compression.
During passenger loading, the application of the supply voltage control could improve the system dynamics in terms of avoiding undesirable peaking of belt tensions. In the case where stator voltage control was not applied, the occurring peaks were almost twice of the full load belt tension level. With the drive control strategy, the slack‐side tension stayed fairly close to the pretension level and the tight‐side tension remained within the full load belt tension level.
There is no significant improvement in the stopping behaviours of the belt when applying the stator voltage reduction, as compared to not using it. For the same stopping time, the margins of the belt tension dynamics are more or less the same.
Based on the above, it may be said that the applied stator voltage reduction strategy contributes to a better control of the limits of belt tension during all phases of the system operation. This is particularly beneficial when the long multiple‐drive belt system has a tensioning device at the tail, which is the typical take‐up position in nowadays passenger conveyors. Because the very low belt tension drop during the empty starting of such a system can be avoided, the belt pretension level does not have to be increased. This avoids the need for a larger tensioning device. The AMW belt conveyor will still have to use the same belt rating as before, due to the fact that there is no passenger belt with a lower rating than what is currently being used. However, the ability to control the maximum transient belt tension to a lower level, compared to that in a system with no stator voltage control, may open the possibility to reduce the size of the end pulleys and shafts.

Chapter 8. Performance of long multiple‐drive AMW belts with voltage control 159
8.4.2 Passenger safety
The simulations applying stator voltage control demonstrated that the drive control strategy did not cause detrimental accelerations or decelerations during starting, loading as well as stopping. The level of accelerations, decelerations and jerks were more or less similar to those in the systems that did not apply voltage control, which were well within the recommended limit for human balance. In this respect, the voltage control strategy did not contribute to any significant improvement.
8.4.3 Power consumption
The stator voltage control did not enable the long multiple‐drive AMW belts to use a shorter starting time. Because the drive stations no longer equally share the total load, the return drive station has to apply a higher force to drive its own belt section. Hence, slip can occur at the return drive station when the starting time is too short. Due to this, the long multiple‐drive AMW belt still cannot achieve power consumption saving based on the stop‐and‐go or idle‐to‐nominal schemes.
Nevertheless, the reduction of the stator voltages, which initially aims to balance the applied drive forces to the occurring loads, may still provide a possibility to reduce the power consumption of the induction motors. It is known that the applied stator voltage affects the copper losses and the core loss in an induction motor (Mohan, 2003). With a reduction in the stator voltage, the amount of core loss comes down. Initially, the amount of copper losses also decreases. However, this occurs only up to a certain sufficiently low stator voltage value, after which the copper losses would increase again. Hence, for a given loading condition, there is a certain stator voltage value at which the total motor losses are minimal, in other words the power consumption efficiency is optimal (Kumar, 2004).
As explained in Section 8.2.2, the stator voltage adjustments in this study were determined based on a straight‐forward approach that only considered the distribution of the load on the system. The selected stator voltages were not yet a result of a power efficiency optimization algorithm. There may be a possibility that the stator voltage that would generate a matching drive force to the load is not exactly the stator voltage that would lead to minimal motor losses. In this case, the drive control algorithm would have to be able to determine a stator voltage value that can give a trade‐off between achieving optimal power consumption efficiency and balancing the applied drive force to the belt resistance.
8.5 Conclusions
This chapter has discussed the performance of long multiple‐drive AMW belts that applied stator voltage adjustment to the drive stations in the carrying strand. This control strategy matched the locally applied drive force to the locally occurring

160 Exploring aspects in the application of long accelerating moving walkways
motion resistances in the belt sections. The main objective was to evaluate whether adjusting the stator voltage of individual drive can improve the operating performance of the long multiple‐drive AMW belt. A straight‐forward calculation was applied to determine the profile of the adjusted stator voltages as a function of the part‐load motion resistance, full‐load motion resistance and nominal voltage. Although a complete simulation building block of the drive control was not yet implemented into the belt conveyor simulation framework, the above straight‐forward approach could provide initial insights into the influence of the stator voltage adjustment.
Applying the above drive control strategy resulted in good operating performances from the point‐of‐view of the system dynamics. The belt tension can be maintained within desirable limits during all phases of the operation. The acceleration/deceleration and jerks are also still within acceptable levels for passenger safety. In general, improvements were noticed when compared to the results in Chapter 7. However, the study has not taken into account the effect of the selected stator voltage values towards the amount of losses in the induction motors. This can only be carried out by incorporating a core resistance element in the induction motor equivalent circuit model from Chapter 6, and building a power efficiency model into the complete belt conveyor simulation framework. This is suggested for further extension of this research.
161
Chapter 9
Conclusions and recommendations
The main objective of this thesis was to investigate the possibility of applying Accelerating Moving Walkways (AMWs) for moderate distance continuous people transport.
In dealing with this main research objective, the following questions were posed:
(1) What aspects influence the possibility to apply AMWs for moderate distance transport? Do application aspects of CMWs and present day AMWs also hold for long AMWs?
(2) Is the single‐drive design of present day AMWs still suitable for long AMWs? What are the effects of applying multiple drives along the AMW toward the system performance?
9.1 Conclusions
Based on the discussions in this thesis, it is concluded that AMWs can be an interesting alternative transport system for moderate distance people transport. Many of the application aspects for long AMWs can still follow from those commonly used for CMWs and the presently applied short AMWs. Naturally, there are a number of other application aspects that differ from those of CMWs and present day short AMWs, and these have to be taken into account when planning for the implementation of such long AMWs. Furthermore, to improve their suitability for the purpose of moderate distance transport, a few adjustments on the design are necessary, particularly with regards to the applied drive configuration. These are summarized in the following sections.

162 Exploring aspects in the application of long accelerating moving walkways 9.1.1 On aspects influencing the application of long AMWs
Three elements are involved in the application of AMWs, i.e. the system itself, the passengers, and the location. The characteristics of each element and their interactions impose requirements and boundaries towards the application of AMWs for moderate distance transport. In this section, only application aspects for long AMWs that differ from those for CMWs and short AMWs are discussed.
An important consideration related to the potential to use AMWs for moderate distance transport is their position with regard to other transport systems, which may also operate in the same range of distance. The comparative study in Chapter 3 has pointed out that, in terms of transport capacity, capital and operational costs, space utilization as well as environmental impacts, AMWs are competitive compared to buses, light rail, Automated People Movers (APMs) and Personal Rapid Transits (PRTs). The total travel time on AMWs can be also competitive to that of the above discontinuous transport systems when the walking time, waiting time, and dwell time in stations are taken into account. This, however, depends on the possibility to use one long continuous span of AMW to cover the whole transport distance. Based on speed and travel time alone, AMWs can be applied to cover a total travel distance of up to 3 km for general purposes, e.g. recreational. For accessing other transport systems, e.g. as a feeder to transit stations, a total travel distance of 1.5 km is considered in order to limit the travel time to a maximum of 10 minutes. The challenge will be to have a long terrain for installing such long single span AMWs without crossing other traffics. This sets boundaries to the type of locations where long AMWs can be applied.
Related to the above, the main limiting factor in the application of AMWs for moderate distance transport still stems from their ability to only provide point‐to‐point transport over straight routes. Having intermediate entrances and exits along the length of the AMW will increase the likeliness of having long single span AMWs to carry passengers over longer transport distances. Technology‐wise, although this is not a trivial attempt, it is achievable. The challenge would be more to the ability of passengers to coordinate themselves for boarding to and alighting from a number of access points along the route.
Having faster AMW systems would increase the competitiveness of AMWs against discontinuous transport systems, enabling them to be more applicable for longer transport distances. This may come with a trade‐off. As discussed in Chapter 4, humans inherently have a wide range of limitations in their motor ability to withstand speed, acceleration and jerk. Increasing the maximum speed, even though still within the maximum limit given by the standards, may exclude the possibility of certain pedestrian groups to access the system.

Chapter 9. Conclusions and recommendations 163
Compared to passengers of CMWs, passengers of AMWs are expected to have a different composition with regards to their personal characteristics due to the influence of the higher speed. Furthermore, the fraction of riders and walkers on the AMW is expected to also differ from that on CMWs. It is envisaged that more riders will be present on AMWs, or walkers with walking speeds lower than those found on CMWs. When the AMW span gets longer, it is expected that the faction of riders will increase. These aspects should be taken into account when planning for applying long AMWs, e.g. to evaluate the inclusion of all pedestrian groups and to predict the travel times through the transport corridor.
Another aspect that also relates to the passengers is power consumption. In situations where passenger flow is not continuous, moving walkways typically apply some form of power saving measures. The most commonly used is the stand‐by mode, which stops or reduces the system speed when there is no passenger on board. The stand‐by mode can only perform when the inter‐arrival time between passengers is longer than the time to pass the whole length of the system. With regards to the application of long AMWs, the chance that another passenger enters the system before the previous passenger has left the system becomes smaller as the system gets longer. The stand‐by modes might not be a suitable power saving measure for long AMWs.
A study on the application of Accelerating Moving Walkways (AMWs) in Amsterdam Airport Schiphol (AAS) was carried out in Chapter 5 to evaluate the application of AMWs in a location. The system was evaluated for intra‐terminal transport in Schiphol Centrum and for inter‐terminal transport between Schiphol Centrum and the planned Schiphol Noordwest. The general conclusion is that planning for AMW application in a built‐up area imposes more complexity than if the AMW will be applied in a still‐to‐be‐developed facility.
In a built‐up area, the current function, layout and pedestrian activities in the location would impose boundaries towards the installation of the system, for example in terms of the achievable system length, the availability of floor space and pit depth, and the possibility to include all groups of pedestrians to access the system. In Schiphol Centrum, for example, a number of locations actually had long walking distances, but the presence of crossing traffic flow did not allow for the installation of AMWs at the minimum recommended length of 120 m. Under this length, the AMW will not be able to provide the transport time benefit that can justify their installation. In Schiphol Centrum, only corridors with bidirectional traffic flows were deemed suitable to install AMWs without resulting in too complicated disturbance or modification to the current situation. This affects the extent to which AMWs can contribute toward reducing the overall travel time and walking distance in the terminal.

164 Exploring aspects in the application of long accelerating moving walkways
If the area of interest will still undergo developments, the planning of AMW installations can be incorporated into the overall construction plan of the area. This is considered to be the case in the example of AMWs for inter‐terminal transport between Schiphol Centrum and Schiphol Noordwest. Although presented briefly due to lack of background data, two alternatives of applying long AMWs were proposed: one directly between the two terminals and another with an intermediate landing at the long‐term parking area between the terminals. Because of the possibility to apply long AMW spans, these alternatives were evaluated to provide competitive transport times compared to the currently operating bus shuttle service. The planning process for this purpose still has to consider the functions, layouts and airport processes in existing infrastructures between the two terminals, but due to the planned development then the possibility for modifications are still open.
9.1.2 On the effects of using multiple drives in long AMWs
It is clear from this thesis that a long AMW will face obstacles for its application if the system continues to apply the present‐day single‐drive configuration. The simulations conducted in this study have shown that a long single‐drive AMW has different operating behaviours compared to a short single‐drive AMW, which hinder the suitability of the current moving walkway design and common practices for long AMWs. The concern does not necessarily stem from the high transient dynamics when starting empty, but more to the high belt tension that occurs when the system is carrying its rated load. The currently applied belt rating could not accommodate this high maximum tension, so the system may fail.
The above problem implicates to a number of application aspects pointed out in the previous section. To resist the higher maximum system tension, the minimum required specifications for the system components and support structure would have to be increased. This can increase the capital costs and affect the required floor specifications for the installation, e.g. floor depth and foundation strength. The typical starting and stopping time of nowadays moving walkways, particularly for emergency stopping, can no longer be applied for long AMWs. Using the same setting has shown to cause severe system dynamics, which would risk the safety of the system and the passengers, the latter being limited by the inherent motor skill of human. Also related to this, because a short starting time cannot provide acceptable belt tension behaviour in a long single‐drive AMW, the stand‐by mode cannot be used as a power saving measure.
The solution to the above problems is not as easy as replacing the current belt with a stronger one, since a higher rating is currently not available for passenger conveyor belts. However, as demonstrated by the simulations in this thesis, the application of multiple drives in long AMW belts provided a way to reduce the maximum transient dynamics as well as steady state belt tension, such that the currently available belt

Chapter 9. Conclusions and recommendations 165
rating can continue to be used. By limiting the maximum tension in a long AMW to more or less the same level as the maximum tension in present day short AMWs, the components and specifications of present day AMWs can be applied for long AMWs as well. This is advantageous from the point‐of‐view of the possibility to use standardized components already available in the market, thus avoiding high costs due to having to produce new ones.
During normal operation, the application of the multiple drives enabled relatively low accelerations and jerks in the long AMW, which fulfils the guidelines given by current standards. A limitation, however, was found with regards to emergency stopping with passengers on board. In order to limit the maximum deceleration and jerk for the safety of all passengers on board, as well as to maintain limits of tension and drive force to avoid system failure, the acceptable stopping time and hence stopping distance during the emergency stopping of a long AMW still cannot fulfil the guidelines prescribed by the standards. Applying the multiple drives enabled the use of a much lower stopping time as compared to when using a single drive unit, but this stopping time still resulted in a too long emergency stopping distance.
The typical setting for the drive system in moving walkways applies an open loop scalar control. When using this control approach in the multiple‐drive configuration, all drive stations were given the same input signals (i.e. supply frequency and voltage) during all phases of the operation. This results in an equal load‐sharing behaviour between the drives. However, this load‐sharing approach caused imbalance between the applied drive force and the occurring resistances in each driven section. This resulted in undesirable rise and fall of the belt tension when the system is not loaded to its rated capacity, which is what typically occurs for a significant time during the AMW operational hours.
A stator voltage adjustment strategy was, therefore, tested for the control of individual drive stations in the carrying strand of a long multiple‐drive AMW belt. The objective of this drive control was to match the locally applied drive force to the locally occurring motion resistances in the belt sections. This approach resulted in good operating performances from the point‐of‐view of the system’s dynamic behaviour. The belt tension can be maintained within desirable limits during all phases of the operation, even when the system is not fully loaded. The accelerations, decelerations and jerks are also kept within acceptable levels for passenger safety.
From the simulations, it was found that the long multiple‐drive AMWs still required relatively long starting times. Related to power saving measures, this implies that applying multiple drives in long AMW belts still could not provide short enough starting times that would enable the application of a stand‐by mode. The application of the stator voltage control did not provide any reduction in the starting time either. However, the regulation of the stator voltages according to the amount of motion resistances in the belt sections may provide a possibility to reduce power

166 Exploring aspects in the application of long accelerating moving walkways
consumption in the system. This comes back to the characteristics of the induction motors used in the AMW drive system, where changes in the applied stator voltage will change the amount of motor losses. However, the stator voltage adjustment in this research has not taken into account the effect of voltage variation towards motor losses.
9.2 Recommendations
This study is regarded as a step towards better understanding of AMWs, particularly related to the idea of using such systems for moderate distance people transport in the modern time. Naturally, not all aspects could be covered by this single study. Furthermore, during the course of this research, the limited availability of information regarding AMWs in general as well as on various aspects related to AMW applications was recognized. Therefore, further investigations to the more detailed aspects have to be performed should a long AMW be developed.
The application of long AMWs in a public area can be based on a well‐informed decision if the behaviours of pedestrians/passengers related to AMW use are better understood. The choice behaviour to use or not use the AMW and the choice behaviour to stand or walk on the AMW influence the effectiveness of the system to accommodate the transport demand, the accuracy of the travel‐time planning, etc. In this thesis, an attempt has been made to project such behaviours based on the limited information about CMW passengers and pedestrians on bottlenecks. It is recommended that observations and experiments are carried out to confirm these projections. Observations in a public site will provide empirical data on the natural behaviours of pedestrians/passengers. Experiments with, perhaps, an AMW prototype in a manufacturer site will enable investigation on certain behaviours that are of interest by controlling certain parameters. Because AMWs are currently only available outside of the Netherlands, collaborations with foreign parties may help reduce logistics issues, which were faced in this work.
Results from the recommended studies above can support the development of a proper model to simulate pedestrian/passenger behaviours related to AMW use. During the planning phase of a transportation project, insights provided by such a model can be used to evaluate the effectiveness of a proposed AMW in a certain location. Furthermore, outputs from the pedestrian/passenger behaviour model can be used to provide a more realistic representation for the passenger loading distribution, i.e. with a mix of standing and walking passengers, when evaluating the performance of long AMWs with multiple drives. In this thesis, although variations in passenger loading rates and loading intervals have been taken into account, the simulations only assumed standing passengers. With this assumption, the change of load in each belt section is more or less gradual. It is expected that the presence of walking passengers will introduce a certain degree of variance in the way that the

Chapter 9. Conclusions and recommendations 167
load in the belt sections increase or decrease. This may influence the behaviour of the belt and the motors.
It has been demonstrated through this thesis that a multiple‐drive configuration will be required for long AMWs. The main issue is how to coordinate these multiple drives. The simulations have provided initial insights that a decentralized voltage control strategy, which adjusts the voltage of individual drive according to the load, can improve the system operating performance compared to the centralized open loop scalar control, which lets the drives follow their inherent load‐sharing behaviour. Nevertheless, a detailed investigation that implements a full model of the control system is recommended. The straight‐forward approach for implementing the voltage adjustment strategy in this thesis has a limitation that it does not capture possible transients in the control system. These transients may relate to the response speed of the control system towards changes in the states of the belt. With a full control model, the appropriate setting for the control parameters can be determined. This voltage control strategy is also considered to open the possibility to save power consumption. If this is to be pursued, the model of the control system needs to also include a power optimization algorithm. Then, a core resistance element should also be incorporated in the induction motor model.
A noticed limitation of the 10C/1R multiple‐drive configuration, which was investigated in this thesis, was that it could not provide a sufficiently low stopping time during emergency stopping. Further research should also be directed to find solutions that will allow emergency stopping to be carried out as soon as possible, without imposing risks to either the passengers (due to excessive deceleration and jerks) or the system (due to drive slip and too low belt tension drop).

168 Exploring aspects in the application of long accelerating moving walkways

169
Nomenclature
Table 1. List of abbreviations
Abbreviation Description AAS Amsterdam Airport Schiphol AC Alternating Current AMW Accelerating Moving Walkway APM Automated People Mover APTA American Public Transport Association ASME American Society of Mechanical Engineers ATRA Advanced Transit Association CEN Comité Européen de Normalisation (European Committee for Standardization) CfIT Commission for Integrated Transportation CMW Conventional Moving Walkway CNIM Constructions Industrielles de la Méditerranée CPI Consumer Price Index DIN Deutches Institut für Normung EBS Enerka Becker System EURO European (flights) EURO‐NS European Non‐Schengen EURO‐S European Schengen GAO Government Accountability Office HRF High Risk Flight IATA International Air Transport Association ICA Intercontinental (flights) ISO International Organization for Standardization KLM Koninklijke Luchtvaart Maatschappij (KLM Royal Dutch Airlines) MCT Minimum Connecting Time NS Non‐Schengen NTDB National Transit Database O/D Origin/Destination POM Poly‐Oxy‐Methylene PRT Personal Rapid Transit S Schengen SIM Samenwerking Innovatieve Mainport (Innovative Main Port Alliance)

170 Exploring aspects in the application of long accelerating moving walkways
Table 1. List of abbreviations (continued)
Abbreviation Description STD Schedule Time of Departure ULSD Ultra Low Sulphur Diesel UK United Kingdom US United States Table 2. List of capital variables
Capital Unit Description A m2 Belt cross‐sectional area B mm Belt width C ‐ Secondary resistance factor Ct p/h/d Theoretical transport capacity in passenger per hour per direction C N∙s/m Damping matrix Eb N/m2 Modulus of elasticity of the belt F N Force vector Fd N Drive force FM N Main resistance force FS N Secondary resistance force FSl N Slope resistance force Ft N/mm Pre‐tensioning force per unit belt width I1 A Stator current I2 A Rotor current Jd kg∙m2 Drive wheel inertia Jg kg∙m2 Gearbox inertia Jr kg∙m2 Rotor inertia K N/m Stiffness matrix L m Distance between two idler sets Lacc m Length of the acceleration section Lconv m Length of conveyor Ldec m Length of the deceleration section LM H Mutual inductance Lr H Rotor inductance Ls H Stator inductance M kg Mass matrix Pn kW Nominal motor power R1 Ω Stator resistance R2 Ω Rotor resistance RTH Ω Thevenin equivalent resistance S ‐ Actual safety factor SA ‐ Safety factor during starting and stopping SB ‐ Safety factor during steady state operation T N Belt tension T1 N/mm Tight‐side belt tension per unit belt width T2 N/mm Slack‐side belt tension per unit belt width

Nomenclature 171
Table 2. List of capital variables (continued)
Capital Unit Description Ta s Conveyor starting time Te N/mm Belt pre‐tension per unit belt width Tind Nm Induced motor torque Vs V Stator phase voltage VTH V Thevenin equivalent voltage X1 Ω Stator reactance X2 Ω Rotor reactance XM Ω Magnetizing reactance XTH Ω Thevenin equivalent reactance Table 3. List of non‐capital variables
Non‐capital Unit Description a ‐ Traction constant 1 b ‐ Traction constant 2 c1 m/s Longitudinal wave propagation speed cvo ‐ Coulomb friction component c’v ‐ Viscous friction component dd m Drive wheel diameter f ‐ DIN artificial friction factor fs Hz Stator supply frequency fss ‐ Steady state friction factor g m/s2 Gravitational acceleration h m Change of elevation hb m Belt thickness j ‐ Gearbox ratio k ‐ Factor related to the nominal treadway width kN N/mm Standardized belt strength per unit belt width l m Length of belt section m’b kg/m Mass of belt per unit length m’l kg/m Mass of load (passenger) per unit length m’r kg/m Reduced mass of idlers per unit length nn rpm Nominal motor speed p ‐ Pole pair rd m Radius of drive wheel s ‐ Motor slip t s Time tAMW,stand s Time to travel through an AMW by standing tAMW,walk s Time to travel through an AMW by walking tCMW,stand s Time to travel through an CMW by standing tCMW,walk s Time to travel through an CMW by walking tmode s Travel time on a transport mode twalk s Time to walk through a corridor u m Nodal displacement

172 Exploring aspects in the application of long accelerating moving walkways
Table 3. List of non‐capital variables (continued)
Non‐capital Unit Description u m Vector of nodal displacements u m/s Nodal velocity u m/s Vector of nodal velocities u m/s2 Vector of nodal accelerations v m/s Velocity, speed v0 m/s Stribeck velocity vAMW,entry m/s Speed of AMW at the entrance vAMW,high m/s Speed of AMW at the high‐speed section vb m/s Belt velocity vb,t m/s Target belt velocity vCMW m/s Speed of CMW vr m/s Relative speed between contacting surfaces vwalk m/s Walking speed vwalk,MW m/s Walking speed relative to the treadway w m Nominal treadway width yt m Displacement of take‐up pulley z m Bristle deflection Table 4. List of Greek symbols
Greek symbol Unit Description α0 ‐ Coulomb friction coefficient α1 ‐ Additional friction when static α2 ‐ Viscous friction coefficient δ ‐ Creep ratio ηg ‐ Gearbox efficiency θ o Belt inclination angle σ0 N/m Bristle stiffness σ1 N/m Bristle damping ωd rad/s Drive wheel angular velocity ωm rad/s Motor shaft speed ωn rad/s Natural frequency of axial string vibration ωsync rad/s Synchronous motor speed

173
References
Abe, Y., Beniya, Y. and Masuda, H. (2001), “Accelerating moving walkway ‘ACCEL‐LINER’”, Proceedings of the Eighth International Conference on Automated People Movers, American Society of Civil Engineers, Reston, Virginia, 665–674.
Advanced Transit Association (2003), Personal automated transportation: Status and potential of Personal Rapid Transit – Technology evaluation, Advanced Transit Association. Available at: http://advancedtransit.org/%5Cpub%5C2002%5Cprt%5Ctech6.pdf (Accessed 5 October 2005).
Allan, A. (2001), “Walking as a local transport modal choice in Adelaide”, World Transport Policy & Practice 7(2), 44–51. Available at: http://www.eco‐logica.co.uk/pdf/wtpp07.2.pdf (Accessed 7 October 2008).
Al‐Sharif, L. (1996a), “Escalator handling capacity”, Elevator World, December, 134–137.
Al‐Sharif, L. (1996b), “Escalator stopping, braking and passenger falls”, Lift Report 22(6), November/December, 42–46.
Al‐Sharif, L. (2004), “Intelligent braking systems for public service escalators”, Proceedings of the First IEE International Conference on Building Electrical Technology, The Institution of Engineering and Technology, Herts, UK, 158–166.
Alspaugh, M.A. (2003), “The evolution of intermediate driven belt conveyor technology”, Bulk Solids Handling 23(3), 168–173.
American Public Transportation Association (2004a), Bus and trolleybus statistics, American Public Transportation Association, Washington, DC. Available at: http://www.apta.com/research/stats/bus/index.cfm (Accessed 15 November 2005).
American Public Transportation Association (2004b). Rail statistics, American Public Transportation Association, Washington, DC. Available at: http://www.apta.com/research/stats/rail/index.cfm (Accessed 15 November 2005).
Amsterdam Airport Schiphol (2009), Parking at Schiphol, Amsterdam Airport Schiphol, Schiphol, The Netherlands. Available at: http://www.schiphol.nl/Transport/ParkingAtSchiphol.htm (Accessed 27 March 2009).
Anderson, J.E. (1999), “A response to arguments in opposition to Personal Rapid Transit”, Innovative Transportation Technologies. Available at: http://faculty.washington.edu/jbs/itrans/oppseprt.htm (Accessed 27 June 2006).

174 Exploring aspects in the application of long accelerating moving walkways
Anderson, J.E. (2000), “A review of the state of the art of Personal Rapid Transit”, Journal of Advanced Transportation 34(1), 3–29.
Andréasson, I. (2001), Innovative transit systems: Survey of current developments, VINNOVA Report VR 2001:3, The Swedish Agency of Innovation Systems, Stockholm. Available at: http://advancedtransit.org/pub/2002/prt/andreasson.pdf (Accessed 27 June 2006).
Anon (1892), “The travelling sidewalk at the World’s Columbian Exposition”, Scientific American 66(3), 31.
Anon (1900), “Moving platform at the Paris Exposition”, Electrician 46(1), 4.
Ashford, N. (1988), “Level of service design concept for airport passenger terminals – A European view”, Transportation Planning and Technology 12(1), 5–21.
AZoM (2001), Acetal Polyoxymethylenen Copolymer – POM, The A to Z of Materials, Warriewood, Australia. Available at: http://www.azom.com/Details.asp?ArticleID=381 (Accessed 11 December 2006).
Blocken, B. and Carmeliet, J. (2004), “Pedestrian wind environment around buildings: Literature review and practical examples”, Journal of Thermal Envelope and Building Science 28(2), 107–159.
Bonnet, A.H. (1994), “An update on AC induction motor efficiency”, IEEE Transactions on Industry Applications 30(5), 1362–1372.
Brand, C. and Preston, J. (2003a), The supply of public transport – A manual of advice, Working paper Ref 949, Transport Studies Unit, University of Oxford, Oxford. Available at: http://www.tsu.ox.ac.uk/research/test/MoA_d2(v2)_print.pdf (Accessed 29 May 2006).
Brand, C. and Preston, J. (2003b), “Which technology for urban public transport? A review of system performance, cost and impacts”, Proceedings of the Institution of Civil Engineers: Transport 156(4), 1–10.
Brög, W. and Mense, N. (2003), “Eight cities walking: Comparative data on walking as a transport mode from cities in Europe, Australia and the US, Portland”, Proceedings of the Fourth International Conference on Walking in the 21st Century (Walk21‐IV: Health, Equity and Environment), Walk 21, Portland, Oregon. Available at: http://www.walk21.com/papers/Brog.pdf (Accessed 7 October 2008).
Browning, A.C. (1974), “City transport of the future – The high speed pedestrian conveyor. Part 1: Ergonomic considerations of accelerators, decelerators and transfer sections”, Applied Ergonomics 5(4), 225–231.
Canudas de Wit, C., Olsson, H., Åström, K.J. and Lischinksy, P. (1995), “A new model for control of systems with friction”, IEEE Transactions on Automatic Control 40(3), 419–425.
Chapman, S.J. (2005), Electric Machinery Fundamentals, 4th ed., McGraw‐Hill, New York.
Comité Européen de Normalisation (1998), EN 115:1998 Safety rules for the construction and installation of escalators and passenger conveyors (includes amendment A1: 1998), Comité Européen de Normalisation, Brussels.
Comité Européen de Normalisation (2008), EN 115‐1:2008 Safety of escalators and moving walks – Part 1: Construction and installation, Comité Européen de Normalisation, Brussels.

References 175
Commission for Integrated Transportation (2005), Affordable mass transit – Guidance, Commission for Integrated Transportation, London. Available at: http://www.cfit.gov.uk/docs/2005/amt/pdf/amt.pdf (Accessed 22 May 2006).
Competition Commission (2002a), BAA plc: A report on the economic regulation of the London airports companies (Heathrow Airport Ltd, Gatwick Airport Ltd and Stansted Airport Ltd), Competition Commission, London. Available at: http://www.competition‐commission.org.uk/rep_pub/reports/2002/473baa.htm#full (Accessed 18 February 2009).
Competition Commission (2002b), Manchester Airport PLC: A report on the economic regulation of Manchester Airport PLC, Competition Commission, London. Available at: http://www.competition‐commission.org.uk/rep_pub/reports/2002/474manchester.htm#full (Accessed 18 February 2009).
Cote, A. and Gempp, A. (1997), “The high‐speed passenger conveyor – Reflections on comfort”, Proceedings of the Sixth International Conference on Automated People Movers, American Society of Civil Engineers, Reston, Virginia, 634–643.
Cowie, C.J. (2001), “Load sharing applications with adjustable frequency drives”, Drivesmag, 16 January. Available at: http://www.drivesmag.com/index.php?option=com_content&task=view&id=19&Itemid=77 (Accessed 12 May 2009).
Daamen, W. (2003), “Controlled experiment to derive walking behaviour”, European Journal of Transport and Infrastructure Research 3(1), 39–59.
Daamen, W. (2004), Modelling passenger flows in public transport facilities, PhD thesis, Delft University of Technology, The Netherlands.
Dailymotion (2007), Edison moving sidewalk 1900 Paris, Online video. Available at: http://www.dailymotion.com/video/x23xo1_edison‐moving‐sidewalk‐1900‐paris (Accessed 28 August 2008).
Davis, P. and Dutta, G. (2002), “Estimation of capacity of escalators in London Underground”, IIMA Working Papers No. 2002‐1‐01, Indian Institute of Management Ahmedabad, Gujarat, India. Available at: http://www.iimahd.ernet.in/publications/data/2002‐11‐01GoutamDutta.pdf (Accessed 19 September 2006).
De Graaf, B. and Van Weperen, W. (1997), “The retention of balance: An exploratory study into the limits of acceleration the human body can withstand without losing equilibrium”, Human Factors 39(1), 111–118.
Dembart, L. (2003), “International Traveler / Update: In Paris, the Concorde of all sidewalks”, International Herald Tribune, 30 April. Available at: http://www.iht.com/articles/2003/04/30/trav_ed3_.php (Accessed 15 September 2005).
Deutsches Institut für Normung (2000), DIN 22101 Gurtförderer für schüttgüter ‐ Grundlagen für die berechnung und auslegung, Deutsches Institut für Normung, Berlin.
Diaz, B. (2005), Conveyor for carrying devices such as pedestrian conveyors, US Patent 6978875 B2.
Donoghue, E.A. (1981), Handbook on A17.1 Safety code for elevators and escalators, 1981 ed., American Society for Mechanical Engineers, New York.

176 Exploring aspects in the application of long accelerating moving walkways
Donoghue, E.A. (2007), ASME A17.1 / CSA B44 Handbook: ASME A17.1‐2007, Safety code for elevators and escalators, CSA B44‐07, Safety code for elevators, 2007 ed., American Society for Mechanical Engineers, New York.
Dunlop Conveyor Belting (2009a), Starglide (Passenger Conveyor Belt), Dunlop Conveyor Belting, Drachten, The Netherlands. Available at: http://eu.dunlopconveyorbelting.com/starglide_spec (Accessed 27 April 2009).
Dunlop Conveyor Belting (2009b), EBS closed conveyor, Dunlop Conveyor Belting, Drachten, The Netherlands. Available at: http://www.dunlop‐enerka.com/en/belting_products/EBS.aspx (Accessed 5 May 2009).
Electrical & Mechanical Services Department (2007), Guidelines on energy efficiency of lift & escalator installations, 2007 ed., Electrical & Mechanical Services Department, Hong Kong. Available at: http://www.emsd.gov.hk/emsd/eng/pee/eersb.shtml (Accessed 3 July 2008).
Enclosed Bulk Systems (2009), EBS conveyor, Enclosed Bulk Systems BV, Beverwijk, The Netherlands. Available at: http://www.enclosedbulk.com/EN/index_en.htm (Accessed 5 May 2009).
Fenner Dunlop Conveyor Belting Europe (2004), Starglide passenger conveyor belt, Product catalogue, Fenner Dunlop Conveyor Belting Europe.
Fouracre, P., Dunkerley, C. and Gardner, G. (2003), “Mass rapid transit systems for cities in the developing world”, Transport Reviews 23(3), 299–310.
Franceschi, J‐C. (2002), Device forming a moving handrail for an accelerated moving walkway, US Patent 6367608 B1.
Freathy, P. and O’Connell, F. (1998), European Airport Retailing, Macmillan, London.
Fruin, J.J. (1971), Pedestrian Planning and Design, Metropolitan Association of Urban Designers and Environmental Planners, New York, New York.
Fruin, J.J. (1973), “Service and capacity of people mover systems”, Journal of the Transportation Engineering Division 99(3), 489–497.
Fruin, J.J. (1992), “Designing for pedestrians”, in G.E. Gray and L.A. Hoel (eds.), Public Transportation, 2nd ed., Prentice Hall, Englewood Cliffs, New Jersey, 212–242.
Fujitec (2002), Accelerating autowalk Speedmove, General product catalogue, Fujitec Corporation. Available at: http://fujitec.com.ar/english/information/catgen/SpeedMove.pdf (Accessed 11 September 2005).
Gallina, R. (1991), “Decreasing tensions in a belt conveyor by using multiple‐pulley drives”, Bulk Solids Handling 11(4), 829–832.
Gibson, T (2002), “Still in a class of its own”, Progressive Engineer, March. Available at: http://www.progressiveengineer.com/PEWebBackissues2002/PEWeb%2024%20Mar%2002‐2/PRT.htm (Accessed 11 November 2008).
Gleave, S.D. and Halden, D. (2001), The application of accessibility methodologies to land use planning, Final report, Steer Davies Gleave and Derek Halden Consultancy, London. Available from: http://wales.gov.uk/desh/research/planning/accessmethodologies/finalreporte.pdf?lang=en (Accessed 22 May 2006).

References 177
Gonzalez‐Alemany, M.A. and Cuello, M.A. (2003), “Accelerating walkway”, ThyssenKrupp techforum, English ed., July, 52–55. Available at: http://www.thyssenkrupp.com/documents/Publikationen/Techforum/techforum_E_7_2003.pdf (Accessed 1 December 2005).
Gonzalez‐Alemany, M.A., Soffritti, M., Behrend, M. and Eisele, T. (2007), “TurboTrack – Making long distances shorter”, ThyssenKrupp techforum 1, 68–75. Available at: http://www.thyssenkrupp.com/documents/Publikationen/Techforum/techforum_1_2007_en.pdf (Accessed 14 September 2007).
Gossop, C. (2005), Cambridgeshire guided busway order: Inspector’s report, Report to the Secretary of State for Transport TWA/04/APP/02, The Planning Inspectorate, Bristol, UK. Available at: http://www.dft.gov.uk/stellent/groups/dft_about/documents/pdf/dft_about_pdf_610693.pdf (Accessed 20 June 2006).
Government Accountability Office (2001), Mass Transit: Bus Rapid Transit shows promise, Report to Congressional Requesters GAO‐01‐984, US General Accounting Office, Washington, DC.
Hafizogullari, S., Chinnusamy, P. and Tunasar, C. (2002), “Simulation reduces airline misconnections: A case study”, Proceedings of the 2002 Winter Simulation Conference, IEEE, Piscataway, New Jersey, 1192–1198.
Hager, M. and Hintz, A. (1993), “The energy saving design of belts for long conveyor systems”, Bulk Solids Handling 13(4), 749–758.
Hager, M., Overmeyer, L. and Scholl, F. (2005), “Investigations on causes and value of the indentation rolling resistance of belt conveyors”, Bulk Solids Handling 25(2), 84–91.
Hall, E.T. (1966), The Hidden Dimension, Doubleday, Garden City, New York.
Harrison, A. (1983), “Criteria for minimizing transient stress in conveyor belts”, Mechanical Engineering Transactions Institute of Engineers Australia 8(3), 129–134.
Hawkins, N.M. and Atha, J. (1976), “A study of passenger behaviour on a slow speed travellator system”, Ergonomics 19(4), 499–517.
Henderson, C. (1992), “New public transportation technology”, in G.E. Gray and L.A. Hoel (eds.), Public Transportation, 2nd ed., Prentice Hall, Englewood Cliffs, New Jersey, 654–692.
Hoogendoorn, S.P. and Bovy, P.H.L. (2004), “Pedestrian route‐choice and activity scheduling theory and models”, Transportation Research Part B: Methodology 38(2), 169–190.
Hoogendoorn, S.P. and Daamen, W. (2005), “Pedestrian behaviour at bottlenecks”, Transportation Science 39(2), 147–159.
Horstmeier, T. and De Haan, F. (2001), “Influence of ground handling on turn round time of new large aircraft”, Aircraft Engineering and Aerospace Technology 73(3), 266–270.
Hydén, C., Nilsson, A. and Risser, R. (1998), WALCYNG – How to enhance WALking and CYcliNG instead of shorter car trips and to make these modes safer, Deliverable D6, Department of Traffic Planning and Engineering, University of Lund, Sweden & FACTUM Chaloupka, Praschl & Risser OHG,Vienna, Austria. Available at: http://www.ocs.polito.it/biblioteca/mobilita/WALCYNG.pdf (Accessed 24 May 2006).

178 Exploring aspects in the application of long accelerating moving walkways
Ikizawa, K., Nagai, H., Aoe, S., Sato, T., Okuno, R. and Yanagisawa, T. (2001), “Development of an accelerating walkway”, NKK Technical Review 84, 66–70. Available at: http://www.jfe‐steel.co.jp/archives/en/nkk_giho/84/pdf/84_10.pdf (Accessed 14 August 2005).
International Air Transport Association (2004), Airport Development Reference Manual, 9th ed., International Air Transport Association, Montreal, Quebec.
International Organization for Standardization (1989), ISO 5048:1989 Continuous mechanical handling equipment – Belt conveyors with carrying idlers – Calculation of operating power and tensile forces, International Organization for Standardization, Geneva.
Ishikawajima‐Harima Heavy Industries (2004), Topics of the year for April 2003 to March 2004 – Land machinery and plants: Curved moving walkway using rubber belt completed in Japan, Ishikawajima‐Harima Heavy Industries. Available at: http://www.ihi.co.jp/ihi/ihitopics/enterprise/0304‐0403‐land‐e.html#(5) (Accessed 17 May 2006).
Jackson, K.D., McCulloch, M.D. and Landy, C.F. (1993), “A study of the suitability of electric drives to the task of driving conveyors”, Conference Record of the 1993 IEEE Industry Applications Society Annual Meeting, IEEE, Piscataway, New Jersey, 488–495.
Jakes, A.S. (2002), “Reasons why people movers are overly expensive for airport applications”, Proceedings of the 27th International Air Transport Conference, American Society of Civil Engineers, Reston, Virginia, 1–10.
James, G.L. (1994), “A review of conveyor take‐up design”, Proceedings of the International Mechanical Engineering Congress and Exhibition ‐ Mech 94, Institution of Engineers, Australia, 103–111.
Jie, P. (2003), “Spiral escalators in Shanghai”, Elevator World, July, 100–103.
Kazuo, A., Kenro, M., Masakuni, H., Katsumi Y. and Tomoyoshi, K. (2003), “Feature and prospect of accelerating moving walks”, Nippon Kikai Gakkai Gijutsu Koenkai Koen Ronbunshu, January, 41–44. Available at: http://sciencelinks.jp/j‐east/article/200308/000020030803A0210219.php (English abstract, accessed 18 March 2006).
Kitamura, S., Kamaike, H. and Haruta, Y. (1993), “The multi‐drive system for long‐travel moving stairways”, Elevator World, December, 98–103.
Kittelson & Associates, KFH Group, Parsons Brinckerhoff Quade & Douglass and Hunter‐Zaworski, K. (2003), TCRP report 100 – Transit capacity and quality of service manual, 2nd ed., Transportation Research Board, National Research Council, Washington, DC.
Klein, H. (2003), “A helping hand for long walks: Moving walkways made in northern Spain’s Asturia region accelerate smoothly and safely”, ThyssenKrupp Magazine 2, 108–111. Available at: http://www.thyssenkrupp.com/documents/Publikationen/Magazin/Magazin‐Bewegung‐eng.pdf (Accessed 5 March 2007).
KLM Royal Dutch Airlines (2009a), Check‐in: options and times, KLM Royal Dutch Airlines, Schiphol, The Netherlands. Available at: http://www.klm.com/travel/nl_en/travel_information/checkin_options/index.htm (Accessed 12 February 2009).
KLM Royal Dutch Airlines (2009b), Security checks and boarding time, KLM Royal Dutch Airlines, Schiphol, The Netherlands. Available at: http://extra.klmtransfer.schiphol.nl/web/show/id=156607/langid=42 (Accessed 18 February 2009).

References 179
Kuhn, F. (2001), “The VAL: Lille urban community metro’s experience”, Presentation to the Korean Railway Research Institute, Seoul, July. Available at: http://www.tsd.org/papers/VAL‐2001%20CUDL.pdf (Accessed 20 June 2006).
Kumar, S. (2004), “Stator voltage control of induction motors”, Technical articles in electrical engineering, National Institute of Technology Calicut. Available at: http://sureshks.netfirms.com/article/stator/stator.htm (Accessed 1 July 2009).
Kuner, R. (1972), “Human/machine interface in moving walk design”, Proceedings of the Man/Transportation Interface Specialty Conference, American Society of Civil Engineering, New York, New York, 139–155.
Kusumaningtyas, I. and Lodewijks, G. (2006), “Issues for the application of accelerating moving walkways for moderate distance people transport,” Proceedings of the 9th TRAIL Congress 2006 – TRAIL in Motion, TRAIL Research School, Delft, The Netherlands, CD‐ROM, 1–15.
Kusumaningtyas, I. and Lodewijks, G. (2007), “Toward intelligent power consumption optimization in long high‐speed passenger conveyors”, Proceedings of the Tenth IEEE Intelligent Transportation Systems Conference 2007, IEEE, Piscataway, New Jersey, 597–602.
Kusumaningtyas, I., Paro, J.C., and Lodewijks, G. (2007), “Accelerating moving walkways for quality people transport in airports: An assessment of their applicability in Amsterdam Airport Schiphol”, Proceedings of the European Transport Conference 2007, Association for European Transport, London, 1–13.
Kusumaningtyas, I. and Lodewijks, G. (2008), “Accelerating Moving Walkway: A review of the characteristics and potential application”, Transportation Research Part A: Policy and Practice 42(4), 591–609.
Leder, W.H. (1991), “Review of four alternative airport terminal passenger mobility systems”, Transportation Research Record 1308, 134–141.
Loder, J. (1998), “The in‐line accelerating moving walkway”, Elevator World, September, 94–97.
Lodewijks, G. (1991), Het modelleren van een bandtransporteur, Report No. 91.3.TT.2830 (in Dutch), Section of Transport Engineering and Logistics, Delft University of Technology, The Netherlands.
Lodewijks, G. (1995), “Rolling resistance of conveyor belts”, Bulk Solids Handling 15(1), 15–22.
Lodewijks, G. (1996), Dynamics of belt systems, PhD thesis, Delft University of Technology, The Netherlands.
Lodewijks, G. (2000), “Research and development in closed belt conveyor systems”, Bulk Solids Handling 21(6), 592–599.
Lodewijks, G., Nuttall, A.J.G. and Kusumaningtyas, I. (2006), “Long distance passenger conveyors”, Proceedings of the Ninth IEEE Intelligent Transportation Systems Conference 2006, IEEE, Piscataway, New Jersey, 707–712.
Lowson, M. (2002), “Sustainable personal transport”, Proceedings of the Institution of Civil Engineers: Municipal Engineers 151(1), 73–81.
Lowson, M. (2003), “Service effectiveness of PRT vs. collective‐corridor transport”, Journal of Advanced Transportation 37(3), 231–241.
Lowson, M. (2005), “Personal Rapid Transit for airport applications”, Transportation Research Record 1930, 99–106.

180 Exploring aspects in the application of long accelerating moving walkways
Luiting‐Maten, J.H.D. and Lodewijks, G. (2002), Wear of Starglide belts in AWS‐applications, Report No. 2002.TT.5665, Section of Transport Engineering and Logistics, Delft University of Technology, The Netherlands.
Marigold, D.S. and Patla, A.E. (2008), “Visual information from the lower visual field is important for walking across multi‐surface terrain”, Experimental Brain Research 188(1), 23–31.
Mayo, A.J. (1966), A study of escalators and associated flow systems, MSc thesis, Imperial College of Science and Technology, University of London, London.
Moerman, S. (2006), Overview and characteristics of long distance overland belt conveyor systems. Report No. 2005.TL.7027, Section of Transport Engineering and Logistics, Delft University of Technology, The Netherlands.
Mohan, N. (2003), Electric Drives: An Integrative Approach, MNPERE, Minneapolis, MN.
Muller, P.J. and Allee, W. (2005), “Personal Rapid Transit, an airport panacea?”, Paper presented at the 84th Annual Meeting of the Transportation Research Board, Washington, DC. Available at: http://www.prtcons.com/docs/PRT%20Airport%20Panacea.pdf (Accessed 22 May 2006).
Murakami, S. and Deguchi, K. (1981), “New criteria for wind effects on pedestrians”, Journal of Wind Engineering and Industrial Aerodynamics 7(3), 289–309.
National Transit Database (2004), 2004 data tables, National Transit Database, Washington, DC. Available at: http://www.ntdprogram.com/NTD/NTDData.nsf/DataTableInformation?OpenForm&2004 (Accessed 15 November 2005).
Nigim and DeLyser (2001), “Using MathCad in understanding the induction motor characteristics”, IEEE Transactions on Education 44(2), 165–169.
Nordell, L.K. and Ciozda, Z.P. (1984), “Transient belt stresses during starting and stopping: elastic response simulated by finite element methods”, Bulk Solids Handling 4(1), 93–98.
Nordell, L.K. (1991), “Channar 20 km overland – A flagship of modern belt conveyor technology”, Bulk Solids Handling 11(4), 781–784.
Nuttall, A.J.G. and Lodewijks, G. (2004), “An overview of multi‐actuator belt conveyors”, Proceedings of the Eighth International Conference on Bulk Materials Storage, Handling, and Transportation, Wollongong, Australia, July 5–8, 278–282.
Nuttall, A.J.G. (2007), Design aspects of multiple driven belt conveyors, PhD thesis, Delft University of Technology, The Netherlands.
Olsson, H., Åström, K.J., Canudas de Wit, C., Gäfvert, M. and Lischinsky, P. (1998), “Friction models and friction compensation”, European Journal of Control 4(3), 176–195.
Parkinson, T. and Fisher, I. (1996), TCRP report 13: Rail transit capacity, Transportation Research Board, National Research Council, Washington, DC. Available at: http://onlinepubs.trb.org/Onlinepubs/tcrp/tcrp_rpt_13‐a.pdf (Accessed 22 May 2006).
Paro, J.C. (2007), Application of accelerated moving walkways at Amsterdam Airport Schiphol, Report No. 2007.TEL.7152, Section of Transport Engineering and Logistics, Delft University of Technology, The Netherlands.
Parsons Brinckerhoff, Lea + Elliot, JKH Mobility Services and Infrastructure Services (2001), Central area loop study: Final report, Ohio‐Kentucky‐Indiana Regional Council of Governments,

References 181
Cincinnati, Ohio. Available at: http://www.oki.org/pdf/loopfinalreport.pdf (Accessed 22 May 2006).
Patin, P. (1993), Conveying device, especially with high speed conveying element, US Patent 5234095.
Pikora, T.J., Giles‐Corti, B. and Donovan, R. (2001), “How far will people walk to facilities in their local neighbourhoods”, Proceedings of the Second International Conference on Walking in the 21st Century (Australia: Walking the 21st Century), Walk 21, Perth, Australia. Available at: http://www.dpi.wa.gov.au/mediafiles/walking_21centconf01bpaper_pikora.pdf (Accessed 22 May 2006).
Ray, C.T., Horvat, M., Croce, R., Mason, R.C. and Wolf, S.L. (2008), “The impact of vision loss on postural stability and balance strategies in individuals with profound vision loss”, Gait & Posture 28(1), 58–61.
RECONNECT (2000), Reducing congestion by introducing new concepts of transport: Final report, European Research Project RECONNECT. Available at: http://www.transport‐research.info/Upload/Documents/200310/reconnect.pdf (Accessed 19 November 2005).
Richards, B. (1966), New Movement in Cities, Studio Vista, London.
Richardson, R. (2005), “Toronto airport people mover gets ready to roll”, Design Engineering, June, 16–17.
Roberts, A.W., Harrison, A. and Hayes, J.W. (1985), “Economic factors relating to the design of belt conveyors for long distance transportation of bulk solids”, Bulk Solids Handling 5(6), 1143–1149.
Rodgers, L. (2007), “Are driverless pods the future?”, BBC News Online, 18 December. Available at: http://news.bbc.co.uk/2/hi/uk_news/7148731.stm (Accessed 10 November 2008).
Romani, N.K. (2000), “Going the distance: Alternative controlled‐start techniques can benefit long overland conveyors”, Pit & Quarry, October.
Saeki, H. (1996), “Mitsubishi Speedwalk: Development of accelerating moving walk”, Proceedings of the Fifth International Conference on Automated People Movers, American Society of Civil Engineers, Reston, Virginia, 571–581.
Schiphol Group, KLM and Luchtverkeersleiding Nederland (2005), Werken aan de toekomst van Schiphol en de regio, Schiphol Group, Schiphol, the Netherlands. Available at: http://www.schiphol.nl/pdf/schiphol_samenleving/pp_deel_v1_m56577569830798229.pdf (Accessed 29 January 2007)
Schiphol Group (2006), Analyst presentation: Schiphol Group 2006 interim financial results, Schiphol Group, Schiphol, The Netherlands. Available at: http://www.schipholgroup.nl/web/file?uuid=023f98c7‐d1e2‐4014‐9052‐4fc73fcda454&owner=9e0fea1f‐13d2‐46e5‐bb71‐d5131fd8ef27&langid=43 (Accessed 29 January 2007).
Schiphol Group (2007a), Statistical Annual Review 2006, Schiphol Group, Schiphol, The Netherlands. Available at: http://www.schipholgroup.com/Onderneming/Informatie/FeitenCijfers/StatisticalAnnualReview/StatisticalAnnualReview.htm (Accessed 27 March 2007).
Schiphol Group (2007b), Ruimtelijk Ontwikkelingsplan Schiphol 2015, Schiphol Group, Schiphol, The Netherlands. Available at: http://www.schipholgroup.com/web/file?uuid=08f2ca68‐70ce‐

182 Exploring aspects in the application of long accelerating moving walkways
4698‐b62b‐6a1c810d58c7&owner=ce03cf16‐bea6‐4c18‐9a9e‐ed754692d123&langid=42 (In Dutch, accessed 28 June 2007).
Schiphol Group (2007c), Lange termijn visie op de ontwikkeling van de mainport Schiphol: Een wereldwijd netwerk voor een concurrerende randstad, Schiphol Group, Schiphol, The Netherlands. Available at: http://www.schipholgroup.com/web/file?uuid=e53aa001‐8c81‐4a8c‐9020‐db770d6a44d2&owner=21c6d4d0‐8b40‐46f9‐bfe2‐fef180802874&langid=42 (In Dutch, accessed 28 June 2007).
Schiphol Group (2009a), Schiphol timetable: April – October 2009, Schiphol Group, Schiphol, The Netherlands. Available at: http://www.schipholgroup.com/web/file?uuid=13cc847f‐f98d‐413a‐b16c‐938f7c067784&owner=ca813fc0‐6642‐4892‐a5a5‐0d528f2776f9&langid=42 (Accessed 27 March 2009).
Schiphol Group (2009b), Your suitcaseʹs passage through an international airport, Schiphol Group, Schiphol, The Netherlands. Available at: http://www.schipholgroup.com/AboutUs/NewsMedia/SchipholFactSheets./SchipholFactSheets..htm (Accessed 24 February 2009).
Schultz, G. (1995), “Comparison of drives for long belt conveyors”, Bulk Solids Handling 15(2), 247–251.
Sheehy, D.J. (2003), “Balancing of multi‐drive conveyor motors with wound rotor motors”, Bulk Solids Handling 23(3), 182–185.
Shen, L.D., Huang, J. and Zhao, F. (1996), “Automated People Mover applications: A worldwide review”, Paper presented at the 75th Annual Meeting of the Transportation Research Board, Washington, DC. Available at: http://web.tongji.edu.cn/~yangdy/apm/apmrev.html (Accessed 19 September 2005).
Shepp, J.W. and Shepp, D.B. (1893), Shepp’s World’s Fair Photographed, Globe Bible Publishing Co., Chicago, IL.
Shirakihara, T. (1997), “Speedwalk – An accelerating moving walkway”, Proceedings of the Sixth International Conference on Automated People Movers, American Society of Civil Engineers, Reston, Virginia, 624–633.
SKF Group (2009a), Deep groove ball bearings, single row, seal on both sides, SKF Group, Göteborg, Sweden. Available at: http://www.skf.com/skf/productcatalogue/Forwarder?action=PPP&lang=en&imperial=false&windowName=null&perfid=105027&prodid=1050270305 (Accessed 11 December 2006)
SKF Group (2009b), Constant coefficient of friction μ for unsealed bearings, SKF Group, Göteborg, Sweden. Available at: http://www.skf.com/skf/productcatalogue/jsp/viewers/tableViewer.jsp?tableName=1_0_t6.tab&maincatalogue=1&lang=en (Accessed 24 April 2009).
Srinivasan, M. (2009), “Optimal speeds for walking and running, and walking on a moving walkway”, Chaos 19(2), 026112.
Suplée, H.H. (1900), “Local transportation at the Paris Exposition”, Engineering Magazine 19, 697–704.
Tanaboriboon, Y., Hwa, S.S. and Chor, C.H. (1986), “Pedestrian characteristics study in Singapore”, Journal of Transportation Engineering 112(3), 229–235.

References 183
Tegner, G. (1999), “Market demand and economic viability of a Personal Rapid Transit system in Stockholm – The use of EMME/2”, Paper presented at the 14th Annual emme/2 International Users’ Group Conference, Chicago, Illinois. Available at: http://www.inro.ca/en/pres_pap/international/ieug99/paper5.pdf (Accessed 7 November 2005).
Tegner, G. (2003), EDICT ‐ Comparison of costs between bus, PRT, LRT and metro/rail, Transek AB, Gotenburg, Sweden. Available at: http://faculty.washington.edu/jbs/itrans/gorancomp.htm (Accessed 7 November 2005).
ThyssenKrupp (2004a), Questions and answers: How loud are escalators or walkways?, ThyssenKrupp Fahrtreppen GmbH. Available at: http://www.thyssenkrupp‐fahrtreppen.com/en/products/questions_and_answers/index.php?navi=_0_5#9 (Accessed 15 November 2005).
ThyssenKrupp (2004b), ThyssenKrupp AG Planning General, ThyssenKrupp Fahrtreppen. Available at: http://www.thyssenkrupp‐fahrtreppen.de/en/planning/general/index.php?navi=_1_1 (Accessed 11 August 2008).
ThyssenKrupp (2007), TurboTrack – Accept no limits, Product catalogue, ThyssenKrupp Elevator (ES/PBB). Available at: http://www.thyssenkruppelevadores.com/pdf/es/catalogos/turbotrack.pdf (Accessed 30 July 2008).
Todd, J.K. (1974), “Dunlop S‐type Speedway: A high‐speed passenger conveyor”, Transportation Research Record 522, 65–75.
Tough, J.M. and O’Flaherty, C.A. (1971), Passenger Conveyors: An Innovatory Form of Communal Transport, Ian Allan, London.
Trzynadlowski, A.M. (2001), Control of Induction Motors, Academic Press, San Diego, CA.
Turner, D.L. (1998), “Escalators and moving walks”, in G.R. Strakosch (ed.), The Vertical Transportation Handbook, 3rd ed., John Wiley and Sons, New York, 219–244.
Van Dijk, N.M. and Van der Sluis, E. (2006), “Check‐in computation and optimization by simulation and IP in combination”, European Journal of Operational Research 171(3), 1152–1168.
Veldhuis, J. (1997), “The competitive position of airline networks”, Journal of Air Transport Management 3(4), 181–188.
Venter, M.S. (1997), “Lowering the cost of APM solutions”, Proceedings of the Sixth International Conference on Automated People Movers, American Society of Civil Engineers, Reston, Virginia, 79–87.
Vuchic, V.R. (1981), Urban Public Transportation – Systems and Technology, Prentice Hall, Englewood Cliffs, New Jersey.
Warren, R. and Kunczynski, Y. (2000), “Planning criteria for Automated People Movers: Defining the issues”, Journal of Urban Planning and Development 126(4), 166–188.
Westinghouse Electric Corporation (1973), “Modular electric stairways”, Elevator World, January, 11–13.
Wheeler, C.A. (2003), Analysis of the main resistances of belt conveyors, PhD thesis, The University of Newcastle, Australia.
Winter, D.A. (1995), “Human balance and posture control during standing and walking”, Gait & Posture 3(4), 193–214.

184 Exploring aspects in the application of long accelerating moving walkways
Yoder, S.L., Weseman, S.E. and DeLaurentiis, J. (2000), “Capital costs and ridership estimates of Personal Rapid Transit”, Transportation Research Record 1704, 58–67.
Young, S.B. (1995), “Analysis of moving walkway use in airport terminal corridors”, Transportation Research Record 1506, 44–51.
Young, S.B. (1999), “Evaluation of pedestrian walking speeds in airport terminals”, Transportation Research Record 1674, 20–26.
Zür, T.W. (1986), “Viscoelastic properties of conveyor belts – Modelling of vibration phenomena in belt conveyors during starting and stopping”, Bulk Solids Handling 6(3), 553–560.

185
Summary
Mind Your Step Exploring aspects in the application of long accelerating moving walkways
With the growth of population, cities and public facilities continue to expand, resulting in longer walking distances. This inspired the development of modern Accelerating Moving Walkways (AMWs), systems that accelerate pedestrians from a low speed at the entrance to a higher speed at the middle section, and then decelerate them to a low speed again at the exit. A unique characteristic of such systems is their ability to continuously provide large transport capacity during operation. Combined with their higher speed, as compared to Conventional Moving Walkways (CMWs), it is envisaged that AMWs can be a potential transport mode to fill the gap between short and moderate distance transport. However, present day AMWs are still relatively short, so there is no knowledge on the application and performance of these systems for longer distances. Although long AMWs are claimed to be possible, so far there is no elaboration whether they will involve considerations for the same application aspects as for CMWs and relatively short AMWs.
In comparison to people transport, the exploitation of conveyor belts for long distance transport of bulk materials has been carried out for many years. One of the technologies that made the development of such long belt conveyors possible is the distribution of power along the belt conveyor. Because moving walkways and belt conveyors have some similarities in their mechanism, the experience in developing long bulk material belt conveyors can be taken as analogy for developing long AMWs. Nevertheless, the two systems have different characteristics related to their different application and load, one for people and the other for bulk materials. Hence, it is still unclear whether using multiple drives in long AMWs will bring the same effects and benefits to their application aspects and performance, as in long multiple‐drive bulk material belt conveyors.

186 Exploring aspects in the application of long accelerating moving walkways
This thesis aims to investigate the possibility of applying AMWs for moderate distance continuous people transport. In approaching this main research objective, the following research questions are posed: What aspects influence the possibility to apply AMWs for moderate distance transport? Do application aspects of CMWs and present day short AMWs also hold for long AMWs? Is the single‐drive configuration of present day short AMWs still suitable for long AMWs? What are the effects of applying multiple drives along the AMW toward the system performance?
For the first two questions, we distinguish three main elements in the application of AMWs, i.e. the system itself, the passengers, and the location. The characteristics of each element and their interactions are analysed with respect to how they impose requirements and boundaries towards the application of AMWs, in general and in particular for moderate distance transport. Based on the analysis, it is concluded that AMWs can be an interesting alternative of transport system for moderate distance people transport. Many of the application aspects for long AMWs can still follow from those commonly used for CMWs and present day short AMWs. Naturally, there are a number of other application aspects that differ, which have to be taken into account when planning for the implementation of such long AMWs.
The comparative study in this thesis points out that, in terms of transport capacity, capital and operational costs, space utilization as well as environmental impacts, AMWs are competitive compared to buses, light rail, automated people movers and personal rapid transits. The total travel time on AMWs can be also competitive to that of the discontinuous transport systems when the walking time, waiting time, and dwell time in stations are taken into account. This depends on the possibility to use one long continuous span of AMW to cover the whole transport distance.
Increasing the speed of AMWs would increase their competitiveness against discontinuous transport systems, but it may come with a trade off. Humans inherently have limitations in their motor ability to withstand speed, acceleration and jerk. Increasing the AMW speed, even though still within the maximum limit in the standards, may exclude certain pedestrian groups from accessing the system. Compared to passengers of CMWs, passengers of AMWs are expected to have a different composition with regards to their personal characteristics, due to the influence of the higher speed. The fraction of standing and walking passengers are also projected to differ.
In terms of location, planning for AMW application in a built‐up area imposes more complexity than if the AMWs will be applied in a still‐to‐be‐developed facility. In a built‐up area, the current function, layout and pedestrian activities in the location would impose boundaries towards the installation of the system. If the area will still undergo developments, the planning of AMW installations can be incorporated into the overall construction plan of the area.

Summary 187
The third and fourth research questions are dealt with by means of simulations. A dynamic AMW belt conveyor model is constructed. This model includes a representation of the main system dynamics and the drive system, which can be set as a single drive unit or multiple drive stations. With this model, the dynamic behaviour and operating performance of long AMWs are studied for cases of different drive configurations, operational stages, load conditions and control strategies.
The simulations show that a long single‐drive AMW has different operating behaviours compared to a short single‐drive AMW. It is concluded that a long AMW will face obstacles for its application if the system continues to use such a drive configuration. The problem does not necessarily stem from the high transient system dynamics, but more from the high belt tension that occurs when the system is carrying its rated load. The currently applied belt specification cannot resist this high maximum tension, so the system will break. This brings implication to a number of application aspects pointed out by the analysis of the first two research questions.
The solution to this issue is not as easy as replacing the current belt with a stronger one, since a higher rating is currently not available for passenger conveyor belts. As demonstrated by the simulations, the application of multiple drives in long AMW belts provides a way to reduce the maximum transient dynamics as well as steady state belt tension. This allows the currently available belt specification to be used. By limiting the maximum tension in a long AMW to more or less the same level as the maximum tension in present day short AMWs, the components and specifications of present day AMWs can be applied for long AMWs as well.
During normal operations, the application of the multiple drives gives relatively low accelerations and jerks in the long AMW. A limitation, however, is found for emergency stopping with passengers on board. The acceptable stopping time during the emergency stopping of a long AMW still results in a too long stopping distance. The typical open loop scalar control of the multiple drives, which gives an equal load‐sharing behaviour, also causes imbalance between the applied drive force and the occurring motion resistances in each driven belt section. This results in undesirable rise and fall of the belt tension when the system is not loaded to its rated capacity. A control strategy is tested to adjust the stator voltage of each drive station in the carrying strand of the AMW belt according to the amount of load. This improves the system performance, whereby the belt tension can be maintained within desirable limits during all phases of the operation, even when the system is not fully loaded. The accelerations, decelerations and jerks are also acceptable for passenger safety.
Indraswari Kusumaningtyas
Delft, October 2009

188 Exploring aspects in the application of long accelerating moving walkways

189
Samenvatting
Mind Your Step Exploring aspects in the application of long accelerating moving walkways
Met de groei van de bevolking groeien ook steden en openbare voorzieningen, wat resulteert in langere loopafstanden. Dit inspireerde de ontwikkeling van de moderne versnellende rolpaden (Accelerating Moving Walkways, AMWs). Deze systemen versnellen voetgangers van een lage snelheid bij de ingang naar een hogere snelheid op het middelste gedeelte, en vertragen ze weer naar een lage snelheid bij de uitgang. Een uniek kenmerk van de AMWs is hun grote transportcapaciteit. In combinatie met hun hogere snelheid, in vergelijking met conventionele rolpaden (Conventional Moving Walkways, CMWs), wordt er verwacht dat AMWs een vervoerssysteem kunnen worden dat de kloof tussen de korte en middellange vervoersafstanden overbrugt. Toch zijn huidige AMWs nog relatief kort, dus is er nog geen kennis over de toepassing en de prestaties van deze systemen voor langere afstanden. Hoewel er wordt beweerd dat het mogelijk is om lange AMWs te maken, is er tot nu toe geen concreet ontwerp waaruit blijkt of er voor het gebruik van lange AMWs rekening wordt gehouden met dezelfde toepassingsaspecten als voor CMWs en korte AMWs.
In vergelijking met personenvervoer, worden voor het vervoer van bulkmateriaal over lange afstanden al langer transportbanden gebruikt. Een van de technologieën die de ontwikkeling van dergelijke lange transportbanden mogelijk maakt is de verdeling van het aandrijfvermogen langs de transportband. Omdat rolpaden en transportbanden een aantal overeenkomsten in hun mechanisme hebben, kan de ervaring in de ontwikkeling van lange transportbanden voor stortgoed worden genomen als analogie voor de ontwikkeling van lange AMWs. Niettemin, de twee systemen hebben verschillende kenmerken in verband met hun verschillende toepassing en lading, een voor mensen en de andere voor stortgoed. Daarom is het nog niet duidelijk of het gebruik van meerdere aandrijvingen bij lange AMWs dezelfde gunstige invloed zal hebben op hun toepassingsaspecten en prestaties, zoals bij lange transportbanden voor bulkmateriaal.

190 Exploring aspects in the application of long accelerating moving walkways
Dit proefschrift heeft tot doel de mogelijkheid van de toepassing van AMWs voor continu personenvervoer over middellange afstanden te onderzoeken. Bij het benaderen van deze doelstelling zijn de volgende onderzoeksvragen gesteld: Welke aspecten beïnvloeden de mogelijkheid van AMW toepassing voor het vervoer over middellange afstanden? Gelden toepassingsaspecten van CMWs en huidige korte AMWs ook voor lange AMWs? Is de enkele aandrijfconfiguratie van de huidige korte AMWs nog geschikt voor lange AMWs? Wat zijn de effecten op de systeemprestaties van de toepassing van meerdere aandrijvingen bij lange AMWs?
Voor de eerste twee vragen, onderscheiden wij drie belangrijke elementen in de toepassing van AMWs: het systeem, de passagiers en de locatie. De kenmerken van elk element en hun interacties worden geanalyseerd met betrekking tot eisen en grenzen aan de toepassing van AMWs, in het algemeen en in het bijzonder voor het vervoer over middellange afstanden. Op basis van de analyse wordt geconcludeerd dat AMWs een interessant vervoersalternatief kunnen worden voor personenvervoer over middellange transportafstanden. Veel toepassingsaspecten van lange AMWs komen overeen met die van CMWs en huidige korte AMWs. Natuurlijk zijn er een aantal andere toepassingsaspecten die verschillen, waarbij met het plannen van de uitvoering van lange AMWs rekening moet worden gehouden.
De vergelijkende studie in dit proefschrift wijst erop dat, in termen van transportcapaciteit, kapitaal‐ en operationele kosten, ruimtegebruik en milieu‐effecten, AMWs ten opzichte van bus, light rail, geautomatiseerde people movers en personal rapid transits concurrerend zijn. De totale reistijd op AMWs kan ook met die van de bovenstaande discontinue vervoerssystemen concurrerend zijn, als de looptijd, wachttijd, en stoptijd in de stations in aanmerking worden genomen. Dit hangt af van de mogelijkheid om met een lang, ononderbroken stuk AMW de hele vervoersafstand te overbruggen.
Het verhogen van de snelheid van AMWs zou hun concurrentievermogen ten opzichte van discontinue vervoerssystemen verhogen, maar er zit ook een nadeel aan. Mensen hebben van nature beperkingen in hun motorisch vermogen om snelheid, versnelling en schokken te doorstaan. Het verhogen van de snelheid van AMWs, hoewel nog binnen de maximum grens in de normen, kan bepaalde voetgangersgroepen van toegang tot het systeem uitsluiten. Vergeleken met de passagiers van CMWs, wordt er verwacht dat de passagiers die gebruikt willen maken van AMWs een andere samenstelling van persoonlijke kenmerken zullen hebben, als gevolg van de invloed van de hogere snelheid. De fracties van staande en lopende passagiers zullen waarschijnlijk ook anders zijn.
Het toepassen van AMWs bij een al bestaande bebouwing is complexer dan in een nog‐te‐bouwen faciliteit. Bij een al bestaande bebouwing, zouden de huidige functie, layout en voetgangersactiviteiten grenzen aan de installatie van het systeem

Samenvatting 191
opleggen. Als het gebied nog in ontwikkeling is, kan de planning van de AMW installaties worden opgenomen in het totale bouwplan.
De derde en vierde onderzoeksvraag worden behandeld door middel van simulaties. Er is een dynamisch transportbandmodel van de AMW gebouwd. Dit model bevat een weergave van de belangrijkste systeemdynamica en het aandrijfsysteem, dat kan worden ingesteld als een enkele aandrijving of als meerdere aandrijvingen. Met dit model zijn het dynamische gedrag en de operationele prestaties van lange AMWs bestudeerd voor verschillende aandrijfconfiguraties, operationele fasen, beladings‐toestanden en regelstrategieën.
De simulaties laten zien dat een lange AMW met enkele aandrijving een verschillend operationele gedrag heeft in vergelijking met een korte AMW met enkele aandrijving. Er wordt geconcludeerd dat er voor het gebruik van een lange AMW problemen zullen ontstaan, als er voor het systeem een enkele aandrijving wordt gebruikt. Het probleem volgt niet noodzakelijkerwijs uit de hoge transient systeemdynamica, maar is een gevolg van de hoge bandspanning die ontstaat bij nominale belasting. Banden volgens de huidige specificaties zijn niet bestand tegen deze spanningen en zullen breken. Dit heeft gevolgen voor een aantal toepasingsaspecten die door de analyse van de eerste twee onderzoeksvragen zijn aangetoond.
De oplossing voor dit probleem is niet zo eenvoudig als de vervanging van de huidige band door een sterkere, omdat een hogere bandspecificatie momenteel niet beschikbaar is voor passagierstransportbanden. Zoals uit de simulaties blijkt, biedt de toepassing van meerdere aandrijfstations in de lange AMW‐band een manier om de maximale transient dynamica te verminderen, evenals de steady state bandpanning. Daardoor kan de momenteel beschikbare bandspecificatie worden gebruikt. Door de beperking van de maximale spanning in een lange AMW naar min of meer hetzelfde niveau als de maximale spanning in het huidige korte AMWs, kunnen de onderdelen en specificaties van de huidige korte AMWs ook voor lange AMWs worden toegepast.
Tijdens de normale operaties, heeft de toepassing van meerdere aandrijfstations relatief lage versnellingen en schokken in de lange AMW tot gevolg. Een beperking is echter gevonden voor noodstoppen met passagiers aan boord. De aanvaardbare stoptijd tijdens de noodstop van een lange AMW resulteert nog steeds in een te lange remweg. De typische open‐loop scalaire regeling van de meerdere aandrijfstations, die een gelijk load‐sharing gedrag geeft, veroorzaakt ook onbalans tussen de toegepaste aandrijfkracht en de voorkomende bewegingsweerstanden in elke aangedreven bandsectie. Dit resulteert in ongewenst toenemen en afnemen van de bandspanning wanneer het systeem niet tot de nominale capaciteit wordt belast. Een regelstrategie is getest om de statorspanning van elke aandrijfstation in het bovenste gedeelte van de AMW‐band aan te passen op basis van de hoeveelheid belading. Dit verbetert de systeemprestaties, waardoor de bandspanning tijdens alle fasen van de operatie

192 Exploring aspects in the application of long accelerating moving walkways
binnen acceptabele grenzen kan worden gehouden, zelfs als het systeem niet volledig beladen is. De versnellingen, vertragingen en schokken zijn ook aanvaardbaar voor de veiligheid van de passagiers.
Indraswari Kusumaningtyas
Delft, oktober 2009

193
Acknowledgement
The email about my PhD position came exactly one day after a blue line appeared on my test kit. Since then, it has been a challenge to take care of both “babies”. I would like to thank special people, whom without their help and support it would have been more challenging to raise a child and finish my PhD.
First and foremost, I express my gratitude to Gabriel Lodewijks, my supervisor, for always having confidence in me throughout the course of this project. It must have been a big surprise when I informed about my pregnancy just three months after I started. I remembered his first response: “Oh, wow”. And then he congratulated me and happily spoke of his children, and I knew that I had his support. Gabriel trusted me with the right amount of freedom to follow my ideas, and gave me the necessary push and feedback to keep me going. His encouragement towards my professional and personal goals enabled me to finish this project quite on time.
I thank members of the Section of Transport Engineering and Logistics for making the group a nice place to work. I enjoy the friendship of Adriana Lopez de la Cruz, my roommate, with whom I started and finished my PhD at exactly the same dates. The friendship of Kimberly Wu from next door is also a pleasure. Sharing stories and encouragements with them ensured me that I still have my PhD sanity. I am grateful to Ad, Jozephina, Patty and Margriet for their assistance in managing the administrative part of my project. Special thanks to Jozephina and Patty for putting up with my daily request for ‘the key’. I value the support of Jaap Ottjes, who gave kind attention and advice for my concerns. Thanks to Dick Mensch for his kindness since I first came to the group for my MSc study and for helping me with Dutch translations. Out‐of‐topic chats over coffee and cookie with Dingena, Svetlana, Sumin, Jan‐Henk, Hans, Joan, Karel, Mark, Wouter, Albert, Frans, Mahbub, and also Ben‐Jaap, Yusong, Ton, Paul, Puspita and Rafael have been nice complements to my work. I particularly thank Ashley Nuttall for his help at the start of this project. The assistance of (former) students (Jan Carel, Niels, Joris, Jasper and Aziz), who took parts of my research as their assignments, are greatly appreciated.

194 Exploring aspects in the application of long accelerating moving walkways
I cannot go without saying thank you to Conchita van der Stelt from TRAIL, for bearing with all my questions and nagging for every little thing concerning the production of this thesis.
I have had the opportunity to get acquainted with many people outside of work, and it is those people who allowed me to have a balance in life. I appreciate the kindness of Esther, Jolanda, everyone at Grote Johannes, who gave me the peace of mind to work knowing that my daughter is in good care. The warm neighbourly friendship of Hans and Thea Renting as well as Leon, Astrid and Nena are greatly valued; they have made me and my family feel at home. I thank the support of Annemiek Hilberink, my first Dutch friend. I also thank all Indonesian friends whom I met in Delft, among others Archie‐Siska, Saputra‐Pita, Zaki‐Selly, Hatami‐Euis, and Akil‐Chandra, for being my extended family abroad.
I dedicate this work to my beloved family, for their constant love and prayers. To my dad, Subagio, who drew my fascination to science and engineering when I was still a small child. To my mum, Astuti, for showing that it is possible to be a loving wife and mother, and have a fulfilling career. To my brother, Satya, who has always been the truly caring person I can trust. To my father‐in‐law Parikesit, my late mother‐in‐law Mieke, my sister‐in‐laws Aura and Dhita, my grandmother Eyang Uti, Oma Sumantri and Opa Hubert, for their tremendous support and encouragement. To my daughter Naureen Hanifa, mijn lieve Naureentje, it is from her that I learn about what matters in my life. To my husband, Gea, my partner and my best friend, for his love and patience, for always being by my side, for sharing my dreams, joy and sorrow.
I thank Allah for His blessings and guidance, for all that He has given me. Praises be to Him, al hamdu lillaahi rabbil ʹaalamiin.
Indraswari Kusumaningtyas
Delft, October 2009

195
Curriculum vitae
Indraswari Kusumaningtyas was born on September 16, 1978 in Tanjungpandan, Indonesia. At the age of five, she followed her parents to live in Manchester, UK, where she began her primary education. The family returned to Indonesia in the end of 1986 to live in Yogyakarta. In this city, she completed her education up to undergraduate level.
Indraswari attended the Bachelor Programme in Mechanical Engineering at Gadjah Mada University in Yogyakarta from September 1997 to April 2002. During this study, she carried out a two‐month industrial research internship at Leces Paper Factory in Probolinggo, in which she analysed the vibration and lubrication problems of a wood pulper agitator. After performing a final research project to analyse the structural and stability characteristics of becak (Indonesian rickshaw) as a vehicle, she obtained her BEng degree cum laude.
Directly after graduation, Indraswari joined the Department of Mechanical and Industrial Engineering at Gadjah Mada University as a junior lecturer. During this appointment, she co‐taught a number of undergraduate courses and co‐supervised an undergraduate practicum offered by the Section of Vibration and Acoustics. She also assisted in the section’s research projects. Indraswari took leave from this position in September 2003 after securing a StuNed Scholarship from the Dutch Government to follow a Master Programme in Mechanical Engineering at Delft University of Technology, the Netherlands. In July 2005, she received her MSc degree cum laude. Her final research project was carried out at the Section of Transport Engineering and Logistics. She analysed the dynamics of multiple‐drive bulk material belt conveyors during starting.
Indraswari began working on her PhD research in August 2005, extending her stay at the Section of Transport Engineering and Logistics. Her research shifted to the study of passenger belt conveyors. She investigated the possibility of using accelerating moving walkways for moderate distance transport and analysed the effect of applying multiple drives in such long systems. Within this period, she also
196 Exploring aspects in the application of long accelerating moving walkways
supervised student assignments and final projects on a variety of topics related to her research. The result of this research is presented in this thesis.
Indraswari is married to Gea Parikesit and is a mother of currently one daughter, Naureen Hanifa. Upon completing her PhD, Indraswari and her family will return to Yogyakarta, Indonesia.

197
TRAIL Thesis Series
The following list contains the most recent dissertations in the TRAIL Thesis Series. For a complete overview, see the TRAIL website: www.rsTRAIL.nl. The TRAIL Thesis Series is a series of the Netherlands TRAIL Research School theses on transport, infrastructure and logistics. Kusumaningtyas, I., Mind Your Step: Exploring aspects in the application of long accelerating moving walkways, T2009/10, October 2009, TRAIL Thesis Series, the Netherlands
Gong, Y., Stochastic Modelling and Analysis of Warehouse Operations, T2009/9, September 2009, TRAIL Thesis Series, the Netherlands
Eddia, S., Transport Policy Implementation and Outcomes: the Case of Yaounde in the 1990s, T2009/8, September 2009, TRAIL Thesis Series, the Netherlands
Platz, T.E., The Efficient Integration of Inland Shipping into Continental Intermodal Transport Chains. Measures and decisive factors, T2009/7, August 2009, TRAIL Thesis Series, the Netherlands
Tahmasseby, S., Reliability in Urban Public Transport Network Assessment and Design, T2009/6, June 2009, TRAIL Thesis Series, the Netherlands
Bogers, E.A.I., Traffic Information and Learning in Day‐to‐day Route Choice, T2009/5, June 2009, TRAIL Thesis Series, the Netherlands
Amelsfort, D.H. van, Behavioural Responses and Network Effects of Time‐varying Road Pricing, T2009/4, May 2009, TRAIL Thesis Series, the Netherlands
Li, H., Reliability‐based Dynamic Network Design with Stochastic Networks, T2009/3, May 2009, TRAIL Thesis Series, the Netherlands
Stankova, K., On Stackelberg and Inverse Stackelberg Games & their Applications in the Optimal Toll Design Problem, the Energy Markets Liberalization Problem, and in the Theory of Incentives, T2009/2, February 2009, TRAIL Thesis Series, the Netherlands
Li, T., Informedness and Customer‐Centric Revenue, T2009/1, January 2009, TRAIL Thesis Series, the Netherlands
Agusdinata, D.B., Exploratory Modeling and Analysis. A promising method to deal with deep uncertainty, T2008/17, December 2008, TRAIL Thesis Series, the Netherlands

198 Exploring aspects in the application of long accelerating moving walkways
Kreutzberger, E., The Innovation of Intermodal Rail Freight Bundling Networks in Europe. Concepts, Developments, Performances, T2008/16, December 2008, TRAIL Thesis Series, the Netherlands
Taale, H., Integrated Anticipatory Control of Road Networks. A game theoretical approach, T2008/15, December 2008, TRAIL Thesis Series, the Netherlands
Li, M., Robustness Analysis for Road Networks. A framework with combined DTA models, T2008/14, December 2008, TRAIL Thesis Series, the Netherlands
Yu, M., Enhancing Warehouse Performance by Efficient Order Picking, T2008/13, October 2008, TRAIL Thesis Series, the Netherlands
Liu, H., Travel Time Prediction for Urban Networks, T2008/12, October 2008, TRAIL Thesis Series, the Netherlands
Kaa, E.J. van de, Extended Prospect Theory. Findings on Choice Behaviour from Economics and the Behavioural Sciences and their Relevance for Travel Behaviour, T2008/11, October 2008, TRAIL Thesis Series, the Netherlands
Nijland, H., Theory and Practice of the Assessment and Valuation of Noise from Roads and Railroads in Europe, T2008/10, September 2008, TRAIL Thesis Series, the Netherlands
Annema, J.A., The Practice of Forward‐Looking Transport Policy Assessment Studies, T2008/9, September 2008, TRAIL Thesis Series, the Netherlands
Ossen, S.J.L., Theory and Empirics of Longitudinal Driving Behavior, T2008/8, September 2008, TRAIL Thesis Series, the Netherlands
Tu, H., Monitoring Travel Time Reliability on Freeways, T2008/7, April 2008, TRAIL Thesis Series, the Netherlands
D’Ariano, A., Improving Real‐Time Train Dispatching: Models, Algorithms and Applications, T2008/6, April 2008, TRAIL Thesis Series, the Netherlands
Quak, H.J., Sustainability of Urban Freight Transport. Retail Distribution and Local Regulations in Cities, T2008/5, March 2008, TRAIL Thesis Series, the Netherlands
Hegeman, G., Assisted Overtaking. An assessment of overtaking on two‐lane rural roads, T2008/4, February 2008, TRAIL Thesis Series, the Netherlands
Katwijk, R.T. van, Multi‐Agent Look‐ahead Traffic Adaptive Control, T2008/3, January 2008, TRAIL Thesis Series, the Netherlands
Argiolu. R., Office Location Choice Behaviour and Intelligent Transport Systems, T2008/2, January 2008, TRAIL Thesis Series, the Netherlands
Houtenbos, M., Expecting the Unexpected. A study of interactive driving behaviour at intersections, T2008/1, January 2008, TRAIL Thesis Series, the Netherlands
Negenborn, R.R., Multi‐Agent Model Predictive Control with Applications to Power Networks, T2007/14, December 2007, TRAIL Thesis Series, the Netherlands

Propositions accompanying the PhD thesis
“Mind Your Step: Exploring aspects in the application of long accelerating moving walkways” to be defended on Tuesday, 27 October 2009 at 12:30 in Delft
by Indraswari Kusumaningtyas 1. In contrary to bulk material belt conveyors, the possibility of applying high‐speed passenger
belt conveyors for long distance transport is more limited by the load than by the conveyor technology.
2. Conducting emergency stopping of long accelerating moving walkways with the aim to achieve short stopping distances, as can be extrapolated from the EN 115‐1:2008 standard, entails high risk for everyone on board. (Comité Européen de Normalisation (2008), EN 115‐1:2008 Safety of escalators and moving walks – Part 1: Construction and installation, Comité Européen de Normalisation, Brussels)
3. The growing number of independent elderly traveler (Alsnih and Hensher, 2003) poses a threat towards the acceptance of accelerating moving walkways as a public transport system. (Alsnih, R. and Hensher, D. (2003), “The mobility and accessibility expectations of seniors in an aging population”, Transportation Research Part A: Policy and Practice 37(10), 903–916)
4. The findings of Williams and Bargh (2008) are not yet sufficient to conclude that experiencing physical warmth promotes interpersonal warmth, because the influence of the ambient temperature is not yet addressed. (Williams, L.E. and Bargh, J.A. (2008), “Experiencing physical warmth promotes interpersonal warmth”, Science 322(5901), 606–607)
5. Scientific publications should present both the positive and negative results of research. Otherwise, they will be like promotional advertisements: they do not lie, they just do not give all facts.
6. While science is defined as the belief in the ignorance of experts (Feynman, 1999), monotheistic religions can be defined as the belief in the ignorance of all men. (Feynman, R.P. (1999), The pleasure of finding things out: The best short works of Richard Feynman, Perseus Books Group, New York)
7. When practiced at its two extremes, freedom of speech can lead to ignorance.
8. The key to work and life balance is the acceptance of the consequences of our choices.
9. If an adult sleeps like a baby, he/she has sleeping problems.
10. As much as eating is not done in order to defecate, PhD research should not be done in order to make a dissertation. Of course a final output will have to be produced, but what is absorbed in between is the essential.
These propositions are regarded as opposable and defendable and as such have been approved
by the supervisor, Prof. Dr. Ir. G. Lodewijks.
Stellingen behorende bij het proefschrift
“Mind Your Step: Exploring aspects in the application of long accelerating moving walkways” te verdedigen op dinsdag, 27 oktober 2009 om 12:30 te Delft
door Indraswari Kusumaningtyas 1. In tegenstelling tot transportbanden voor het transport van bulkmateriaal, is de mogelijkheid
van de toepassing van snel passagierstransportbanden voor het vervoer over lange afstanden meer beperkt door de lading dan door de transportbanden technologie.
2. Het uitvoeren van een noodstop van lange versnellende rolpaden met het doel om een korte remweg te realiseren, zoals kan worden afgeleid uit de EN 115‐1:2008 norm, brengt een hoog risico voor iedereen aan boord. (Comité Européen de Normalisation (2008), EN 115‐1:2008 Safety of escalators and moving walks – Part 1: Construction and installation, Comité Européen de Normalisation, Brussels)
3. Het groeiende aantal oudere onafhankelijke reizigers (Alsnih and Hensher, 2003) vormt een bedreiging voor de aanvaarding van versnellende rolpaden als een openbaar vervoersysteem. (Alsnih, R. and Hensher, D. (2003), “The mobility and accessibility expectations of seniors in an aging population”, Transportation Research Part A: Policy and Practice 37(10), 903–916)
4. De bevindingen van Williams en Bargh (2008) zijn nog niet voldoende om te concluderen dat het ervaren van fysieke warmte de interpersoonlijke warmte bevordert, omdat de invloed van de omgevingstemperatuur nog niet onderzocht is. (Williams, L.E. and Bargh, J.A. (2008), “Experiencing physical warmth promotes interpersonal warmth”, Science 322(5901), 606–607)
5. Wetenschappelijke publicaties moeten zowel de positieve als de negatieve resultaten van het onderzoek presenteren. Anders lijken zij op promotiereclame: ze liegen niet, ze geven gewoon niet alle feiten.
6. Terwijl de wetenschap als het geloof in de onwetendheid van deskundigen is gedefinieerd (Feynman, 1999), kan monotheïstisch religies als het geloof in de onwetendheid van alle mensen worden gedefinieerd. (Feynman, R.P. (1999), The pleasure of finding things out: The best short works of Richard Feynman, Perseus Books Group, New York)
7. Indien uitgevoerd op zijn twee extremen, kan vrijheid van meningsuiting in ‘ontkennen’ resulteren.
8. De sleutel tot werk en leven balans is de aanvaarding van de consequenties van onze keuzes.
9. Als een volwassen slaapt als een baby, dan heeft hij/zij slaapproblemen.
10. Zo veel als het eten niet worden gedaan om te defeaceren, moet promotieonderzoek niet worden gedaan om een proefschrift te maken. Natuurlijk zal een eindresultaat moeten worden geproduceerd, maar wat is geabsorbeerd in de tussentijd is de essentie.
Deze stellingen worden opponeerbaar en verdedigbaar geacht en zijn als zodanig goedgekeurd
door de promotor, prof. dr. ir. G. Lodewijks.