Embed Size (px)
Citation preview

ASIA-PACIFIC PRIVATE EQUITY REPORT 2018

About Bain & Company’s Private Equity business
Bain & Company is the leading consulting partner to the private equity (PE) industry and its stakeholders.
PE consulting at Bain has grown sevenfold over the past 15 years and now represents about one-quarter of
the fi rm’s global business. We maintain a global network of more than 1,000 experienced professionals serv-
ing PE clients. Our practice is more than triple the size of the next-largest consulting company serving PE fi rms.
Bain’s work with PE fi rms spans fund types, including buyout, infrastructure, real estate and debt. We also work
with hedge funds, as well as many of the most prominent institutional investors, including sovereign wealth
funds, pension funds, endowments and family investment offi ces. We support our clients across a broad range
of objectives:
Deal generation. We help develop differentiated investment theses and enhance deal fl ow by profi ling industries,
screening companies and devising a plan to approach targets.
Due diligence. We help support better deal decisions by performing due diligence, assessing performance
improvement opportunities and providing a post-acquisition agenda.
Immediate post-acquisition. We support the pursuit of rapid returns by developing a strategic blueprint for
the acquired company, leading workshops that align management with strategic priorities and directing
focused initiatives.
Ongoing value addition. We help increase company value by supporting revenue enhancement and cost reduction
and by refreshing strategy.
Exit. We help ensure funds maximize returns by identifying the optimal exit strategy, preparing the selling
documents and prequalifying buyers.
Firm strategy and operations. We help PE fi rms develop distinctive ways to achieve continued excellence by devising
differentiated strategies, maximizing investment capabilities, developing sector specialization and intelligence,
enhancing fund-raising, improving organizational design and decision making, and enlisting top talent.
Institutional investor strategy. We help institutional investors develop best-in-class investment programs across
asset classes, including private equity, infrastructure and real estate. Topics we address cover asset class allocation,
portfolio construction and manager selection, governance and risk management, and organizational design and
decision making. We also help institutional investors expand their participation in private equity, including
through coinvestment and direct investing opportunities.

Asia-Pacific Private Equity Report 2018 | Bain & Company, Inc.
Page i
Contents
1. Asia-Pacifi c private equity: Powerful momentum; a changing market . . . . . . pg. 1
2. What happened in 2017? . . . . . . . . . . . . . . . . . . . . . . . . . . . . . . . . . . . . pg. 4
Investments: A new record . . . . . . . . . . . . . . . . . . . . . . . . . . . . . . . . . . . pg. 4
Exits: Rebounding higher . . . . . . . . . . . . . . . . . . . . . . . . . . . . . . . . . . . . pg. 8
Fund-raising: Regional funds bounce back . . . . . . . . . . . . . . . . . . . . . . . pg. 10
Returns: Another strong performance . . . . . . . . . . . . . . . . . . . . . . . . . . . pg. 11
Changing sources of value . . . . . . . . . . . . . . . . . . . . . . . . . . . . . . . . . . pg. 13
Diverse markets, different outlooks . . . . . . . . . . . . . . . . . . . . . . . . . . . . . pg. 16
3. Creating value in an evolving market . . . . . . . . . . . . . . . . . . . . . . . . . . . pg. 17
Building commercial excellence . . . . . . . . . . . . . . . . . . . . . . . . . . . . . . . pg. 17
Making the most of digital technologies . . . . . . . . . . . . . . . . . . . . . . . . . pg. 21
Managing talent . . . . . . . . . . . . . . . . . . . . . . . . . . . . . . . . . . . . . . . . . pg. 29
4. Conclusion . . . . . . . . . . . . . . . . . . . . . . . . . . . . . . . . . . . . . . . . . . . . . pg. 34

Asia-Pacific Private Equity Report 2018 | Bain & Company, Inc.
Page 1
1. Asia-Pacifi c private equity: Powerful momentum; a changing market
Building on three strong years, the Asia-Pacifi c private equity (PE) industry achieved its best all-around perfor-
mance to date in 2017, signaling the start of a new era. Deals were larger, investment was broader and large
global investors were more active than ever. All markets in the region rose to new highs, and total deal value
reached a record level.
A combination of forces propelled the market to new heights, including an improved macro climate and mount-
ing pressure to invest huge reserves of committed, unspent capital. As the volatility and political shocks of the
past two years subsided, stock markets rallied, economic growth took off and PE funds were more comfortable
putting capital to work. But, beyond the heady deal making, the market showed signs of maturing and entering
a new phase of growth.
Asia-Pacifi c PE deal value soared to $159 billion in 2017, up 41% over 2016 and 19% higher than the previous
all-time high of $133 billion in 2015. Exit value at $115 billion marked the second best year on record, barely below
the 2014 peak, and exit activity hit a record high. Fund-raising rose 6% to $66 billion, above the fi ve-year his-
torical average (see Figure 1.1).
Two key forces powered growth in 2017: investors’ growing confi dence in the region as macro climate improved,
and company owners’ greater overall acceptance of private equity funding. Major players, including global and
regional PE fi rms and institutional investors, were more active in Asia-Pacifi c last year, accelerating the fl ow of
Figure 1.1: The Asia-Pacifi c private equity industry had a spectacular year on many fronts
200
400
600
800
1,000
1,100
0
56 5273
65 62 66
159
56
95
133
112
63
20
40
60
80
100
120
140
$160B
20
40
60
80
100
120
140
$160B
20
40
60
80
100
120
140
$160B
115
57
122
10598
80
Deal value reached its highest level ever Exit value rebounded to a near-record high Fund-raising continued to be robust
Note: Excludes real estate and infrastructure fundsSources: AVCJ; Preqin
Asia-Pacific PE investment market
1713 14 15 1620120 0 0
200
400
600
800
1,000
1,100
0
Asia-Pacific-focused closed funds(by close year)
1713 14 15 162012
Asia-Pacific PE exit market
Deal/exit/fund-raising value Deal/exit count
1713 14 15 162012
2012–2016 average

Asia-Pacifi c Private Equity Report 2018 | Bain & Company, Inc.
Page 2
large deals. Frequently pooling their investments, investors led a surge of megadeals ($1 billion or more) includ-
ing the region’s largest deal ever—a $14.7 billion buyout of Toshiba Memory Corp. by a group of investors led by
Bain Capital and others.1
Company owners are turning in greater numbers to private equity, and they are more willing to cede control—an
important transformation that enhances the conditions for the future growth of the industry in the region. The
value of buyouts jumped 94% to $72 billion in 2017, making up 45% of total Asia-Pacifi c deal value, compared
with an average of 38% from 2012 to 2016.2 Moreover, Asia-Pacifi c’s share of global PE assets under management
reached a new milestone of 23%, up from 9% a decade ago (see Figure 1.2). Underscoring broadening accep-
tance of PE, the value of the region’s private equity deals soared to an unprecedented 17% of Asia-Pacifi c M&A
transactions, while public-to-private deals more than doubled to a record $27 billion.
Private equity investments were also more balanced geographically. Though Greater China still accounted for
almost half (45%) of the region’s PE activity in 2017, India, Japan and Southeast Asia each represented more
than 10% of total deal value. Japan and Southeast Asia saw the biggest gains last year. Investment deal value in
Japan rose to $25 billion—up 269% over the average from 2012 to 2016, and Southeast Asia deal value jumped
to $20 billion, an increase of 182% over the same fi ve-year average.
Despite large capital calls to support the record level of deal making, limited partners (LPs) remained cash-
positive in the fi rst nine months of 2017. For every dollar invested in 2014 to September 2017, the industry already
has paid back $1.20. It also continues to generate high returns: The median net internal rate of return (IRR) of
Asia-Pacifi c-focused funds was 11.5%, based on the latest data as of January 2018, up 0.7 percentage points from
their performance at the end of 2016. And top-quartile funds are on track to achieve an 18.4% net IRR.
Figure 1.2: Asia-Pacifi c’s share of both the global PE market’s assets under management and regional M&A hit new milestones
Percentage of Asia-Pacific PE vs. Asia-Pacific M&A
Percentage of Asia-Pacific vs. global PE assets under management
Sources: Preqin; AVCJ; Dealogic
1718%
16
14
12
10
6
4
2
82003
04
05
0607
0810
1112
13
14 15 16
09
0% 252015105

Asia-Pacific Private Equity Report 2018 | Bain & Company, Inc.
Page 3
Overall, the Asia-Pacifi c PE industry has never been healthier. But for fund managers and investors, the region
clearly has reached a turning point, with implications for both future investment decisions and portfolio com-
pany management. Despite intense competition, steady economic growth may no longer propel multiples. In the
Bain 2018 Asia-Pacifi c private equity survey, GPs said that the top two challenges keeping them awake at night
are the lack of attractive deals and the valuations of potential targets being too high. Many believe the market has
reached the top of the cycle and prices could decline in 2018. To maintain high returns in a changing environ-
ment, GPs will need to help their portfolio companies accelerate organic growth and improve operations. That,
in turn, requires new skills and capabilities.
Successful funds are starting to build those capabilities. We see three broad areas of opportunity to develop
differentiated growth strategies and improve portfolio companies’ performance:
• Strengthen commercial excellence. Accelerating top-line growth lifts profi tability and has a powerful impact
on exit multiples, but it’s hard to get right. Only 24% of GPs say they have met top-line expectations in most
of their portfolio companies over the last few years, according to our 2018 survey. PE fi rms that build strength
in commercial excellence can help portfolio companies spot organic growth opportunities and introduce
initiatives to take advantage of them. Leading GPs are using that approach to improve results and generate
big payoffs.
• Rethink strategies for a digital era. Data, analytics and connectivity are rapidly reshaping every sector of the
global economy. Top global PE investors are helping management teams understand how new technologies
are shifting their profi t pools. Digital tools can help them take practical steps to improve their strategic posi-
tion, commercial performance and cash fl ow. Portfolio companies that embrace digital strategies are better
positioned to manage disruption and keep pace with rapidly changing markets. However, most Asia-Pacifi c
PE funds have work to do. Many say they feel unprepared to help companies navigate a digital shift.
• Make talent a top priority. Our research shows portfolio leadership is the main source of success or failure
in value creation for Asia-Pacifi c private equity investments. However, many PE fi rms take an overly positive
view of management teams early in the investment process. That often leads to surprises during the holding
period and a loss of value when companies need to correct course. The most successful PE companies get
the right leadership in place to deliver on the value-creation plan. That’s critical to helping portfolio compa-
nies outperform.
In Section 2 of this report, we will examine in greater detail how the Asia-Pacifi c PE industry performed in 2017
and highlight key trends that will shape the PE landscape in the coming years. In Section 3, we will discuss how
companies can outperform even as market growth slows, by strengthening commercial excellence, rethinking
digital strategies and fi nding the right talent to fi ll key roles. We have also included a snapshot review of each
market in the region.
Looking back, Asia-Pacifi c’s private equity industry developed powerful momentum in 2017. Growing investor
confi dence and increased acceptance of private equity are paving the way for future growth. More important, the
winners are already at work raising the performance bar for 2018 and beyond.

Asia-Pacifi c Private Equity Report 2018 | Bain & Company, Inc.
Page 4
2. What happened in 2017?
It was a year of resurgence for Asia-Pacifi c private equity. After a 16% dip in deal value in 2016, private equity
investment came roaring back, setting a new record in 2017. The industry was primed for growth. GPs were sit-
ting on huge stockpiles of capital committed to the region, increasing the pressure to do deals—and the market
was fl ush with large opportunities. Company owners across the region showed a growing appetite for private
equity. At the same time, exit activity hit a record high and investors raised the largest Asia-Pacifi c-focused buyout
fund ever. On many fronts, the industry showed signs it is entering a new era—one defi ned by a broader market,
intense competition and shifting sources of value.
Here’s how the year unfolded.
Investments: A new record
Asia-Pacifi c deal value climbed to an all-time high of $159 billion in 2017, up 41% over 2016 and 19% higher than
the historic deal-value peak in 2015 (see Figure 2.1). The number of individual transactions, at 1,015, was down
slightly from 2016, but the average deal size rose 47% to $156 million—more than 50% higher than the annual
average in 2012 to 2016—and the number of deals valued at $1 billion or more nearly doubled to 27 (see Figure 2.2).
A major force behind that unprecedented growth was the trend toward consortium transactions. Almost two-
thirds of deal volume involved multiple investors, about 15 percentage points higher than the previous fi ve-year
average. The rise in pooled transactions propelled a surge in megadeals over $1 billion, as GPs, institutional
Figure 2.1: Investment momentum accelerated, and Asia-Pacifi c deal value set a new record
Globalfinancial crisis
0
50 3459
7850 39
5769 63 56
95
133112
159150
100
$200B
2005 1706 07 08 09 10 11 12 13 14 15 16
Asia-PacificPE investmentdeal value
Note: Excludes real estate and infrastructure fundsSource: AVCJ
Asia gold rush DowntrendBroad-basedgrowth
Internet/China lift
2005 1706 07 08 09 10 11 12 13 14 15 160
250
500
750
1,000
1,250
Asia-PacificPE investmentdeal count

Asia-Pacific Private Equity Report 2018 | Bain & Company, Inc.
Page 5
investors and government affi liates vied for attractive targets. Global GPs were particularly active, especially at
the top end, participating in 60% of the deal value. They led, or co-led, 71% of the megadeals worth $1 billion or
more, including the region’s largest buyout ever—the $14.7 billion acquisition of Toshiba’s semiconductor busi-
ness by Bain Capital and others (see Figure 2.2).
PE funds’ strong performance over the past four years has riveted LPs’ interest in the region. That, in turn, has
generated record levels of dry powder—committed, but unspent capital. At the end of 2017, dry powder in the
Asia-Pacifi c region had risen to $225 billion, or 2.2 years of future supply at the current pace of investment, from
$170 billion in 2016 (see Figure 2.3). Venture and growth subasset classes were important components of the
increase, and venture dry powder was 90% higher than the annual average during the previous fi ve years. That
change is not surprising, given the explosion of venture capital investment and funding over the past decade in
China, which now ranks as the world’s second-largest venture capital market, behind only Silicon Valley. India
also represents a rapidly growing market for venture and growth deals.
A sharp rise in public-to-private deals also fueled PE investment across the region in 2017. Public-to-private deals
made up 17% of total Asia-Pacifi c deal value, setting a new high. While it’s too early to tell whether this trend will
continue, it’s an important signal for the industry, since a rise in public-to-private transactions increases the
overall deal pool signifi cantly.
Valuations remain high. Overall, prices in the Asia-Pacifi c region remained high in 2017. Median PE valuations
were just 3% lower than their 2016 record. But, Asia-Pacifi c’s 2017 average multiple of EBITDA-to-enterprise
value for PE transactions fell to 14.1, the fi rst decline since it began a steady march upward in 2013 and spiked
sharply in 2016. Still, Asia-Pacifi c multiples remain much higher than the US average of 10.3.
Figure 2.2: A surge in megadeals led to record growth; all categories of investors backed the trend
PE investment value (by deal size) 2017 PE investment value (by type of investors and deal size)
Note: Excludes real estate and infrastructure fundsSource: AVCJ
12 7 12 22 2715
97 76 102 117 156106Avgeragedeal value ($M)
Number of>$1B deals
<$100M $100M–$1B >$1B
2012 13 14 15 17160
6356
95
133
159
112
50
100
150
$200B 100%
0
20
40
60
80
Global GPs RegionalGPs
DomesticGPs
Governmentaffiliates
Other
Institutionalinvestors

Asia-Pacifi c Private Equity Report 2018 | Bain & Company, Inc.
Page 6
A broader market. Greater China (China, Hong Kong and Taiwan) continues to attract the most capital—deal
value rose 15% to $73 billion in 2017. But strong PE activity spanned all markets, with Japan and Southeast Asia
gaining signifi cant market share. Japan’s deal value in 2017 jumped to about $25 billion, up 137% over 2016.
Southeast Asia’s market more than doubled to $20 billion, a record high (see Figure 2.4).
Internet and tech still on top. For the third year running, Internet and technology sectors attracted nearly half of
deal volume in 2017. Funds’ focus on innovation provided a strong foundation for investment activity, with more
than 450 deals in the Internet or technology sectors, and a median size of about $23 million. It also included
highly visible deals like SoftBank Capital’s $2.6 billion investment in Flipkart Online Services in India, or the
Singapore-based $2.5 billion Grab deal, led by a consortium of investors including Toyota’s Next Technology
Fund and SoftBank Capital. Investors also continued to favor consumption-related sectors, including consumer
products, retail and healthcare (see Figure 2.5).
Buyouts and control situations—full steam ahead. GPs have long sought to gain more control over their invest-
ments in the Asia-Pacifi c region, and they made big strides in 2017. Buyouts represented 45% of Asia-Pacifi c deal
value in 2017—a record high and about 7 percentage points higher than the average over the previous fi ve years.
The region now generates 22% of global buyout value, up from 13% in 2016 (see Figure 2.6). Those numbers
also point to company owners’ growing acceptance of PE. Minority deals with a path to control—including board
seats or decision rights for most important investments, such as hiring key people or committing to large expense—
rose too. Fifty percent of Asia-Pacifi c companies that were bought with a minority stake in the past two to three
years had path-to-control provisions, up from 34% in our 2017 survey.
Figure 2.3: Despite increasing investments, Asia-Pacifi c funds are still sitting on signifi cant amounts of dry powder
Asia-Pacific-focused unspent capital
Number ofyears of future
investment
As of year-end2005 06 07 08 09 10 11 12 13 14 15 16 17
0.8 1.0 1.4 1.8 1.5 1.3 1.5 1.3 1.6 1.3 1.4 1.7 2.2
3549
6584 83 91
114 120
149
125138
170
225
0
$250B
200
150
100
50
Note: Other includes distressed and mezzanine funds, and excludes real estate and infrastructure fundsSource: Preqin
Buyout Growth Venture Other
40%
CAGR2017 vs. 5-year
average
78%
90%
17%60%

Asia-Pacific Private Equity Report 2018 | Bain & Company, Inc.
Page 7
Figure 2.4: Investment rose broadly across the region; Southeast Asia and Japan posted remarkable gains
Asia-Pacific PEinvestment value(by country)
Note: Excludes real estate and infrastructure fundsSource: AVCJ
Average dealvalue ($M)
Deal count
2012–16 average 2016 2017
105 119 128 141 158 504 115 130 284 58 60 106 126 79 140 184 160 175
Greater China Japan Southeast Asia India South KoreaAustralia/
New Zealand
444 534 569 48 66 49 62 65 70 221 256 184 77 87 91 47 47 51
47
63
56%15%
73
710
25
269%137%
7 8
20
182%136%
13 1520
51%28%
10 713
32%86%
9 8 9
2%19%
0
80
60
40
20
Figure 2.5: Investors’ continued appetite for Internet and technology assets accounted for 46% of total deal volume in 2017
Note: Excludes real estate and infrastructure fundsSource: AVCJ
2012–16 average deal count
Oil&GasTelco Other
Internet
Technology
Media MiningConst.Agri-
culture
Utilities
Logistics
IndustrialRetail
Food
and
beve
rage
Hou
se-
hold
App
ar-
elLe
isur
e
Services
Financialservices
Health
2017 deal count
Telco Other
Internet
Technology
Media
Const.
Util
ities
Logi
stics
Indu
stria
l
Retail
Food
and
be
vera
ge
House-hold
Apparel
Leisure
Services
Financialservices
Health
MiningOil&GasAgriculture
Internet and technology sectors’share of deal volume, 2012–17
01713 14 15 162012
20
40
60%
Inter-net
Tech-nology
22
32
39
50
45 46

Asia-Pacifi c Private Equity Report 2018 | Bain & Company, Inc.
Page 8
Many company owners in the region, once skeptical of private equity, are embracing it now as they seek the
skills and capabilities to help their businesses grow globally, especially given the accelerating pace of techno-
logical changes and slowing growth in some of their home markets. A series of high-profi le PE exits in 2017
threw a spotlight on the ability of top-performing GPs to accelerate growth and improve profi tability, particu-
larly in countries like India, where the industry has historically struggled to generate a steady stream of good
returns. Company owners increasingly understand the industry’s core strengths—robust networks and the
ability to analyze trends across industries and markets to develop fresh insights that can guide investment strat-
egies and improve performance. Given the challenge of adapting their business models to rapidly changing
digital technologies, it’s not surprising that more company owners are turning to private equity.
Exits: Rebounding higher
Exits rose in all countries across the region, with particularly strong rebounds in Southeast Asia and South Korea.
Exit values jumped 25% in 2017, compared with the previous fi ve-year average, to a near record of $115 billion,
after declining in 2015 and 2016 (see Figure 2.7). The rebound helped fuel a virtuous industry cycle by return-
ing cash to LPs. Exit activity set a new record with 710 exits, up from the previous peak of 582 in 2015. Singapore’s
sovereign wealth fund, GIC, rung up the largest exit with the $10.4 billion sale of Global Logistic Properties,
setting another record.
Secondary sales (exit to another PE owner) were about 45% higher than the historical average, helping push total
exit value to a new high. Trade exits remained solid and were the largest exit channel. IPOs were in line with the
historical average.
Figure 2.6: Buyout value hit a new high and gained global importance; “path to control” progressed in minority deals
Asia-Pacific PE buyout value and share vs. global buyoutsMinority-stake deals
increasingly offer a path to control
… of Asia-Pacific GPs with minority stakes would like
to get more control
… of Asia-Pacific companies that were bought with a minority stake
in the past 2 to 3 years had
a path-to-control provision
Note: Chart excludes real estate and infrastructure deals. Total buyout value excludes add-on transactions used to acquire assets that are added on to existing platform companies. The total buyout value in 2018 including add-ons was $83 billion.Sources: Chart based on data from AVCJ and Dealogic; Bain Asia-Pacific private equity survey, January 2018 (n=136)
2000 1309 10 11 12 14 15 17160401 02 03 05 06 08070
5
10
15
20
25%
0
10
20
30
40
50
60
70
$80B
Asia-Pacific buyout value Share vs. global
88%
50%

Asia-Pacific Private Equity Report 2018 | Bain & Company, Inc.
Page 9
Figure 2.7: Large-scale exits and a record number of company sales helped push exit value to a near record
Value of Asia-Pacific PE exits (by type) Sample of 2017 exits
Note: Left-side chart excludes real estate and infrastructure dealsSource: AVCJ
Count 424 447 578 582 710507 40%
2017 vs.2012–16average
AssetCountryExit type and
PE value
GlobalLogistic
Properties
Trade/secondary
$10.4BSingapore
Australia
South Korea
CarverKorea
Japan
AlintaEnergy
Trade$3.0B
Trade$2.7B
UniversalStudiosJapan
Trade$2.3B
Divestor
GIC
Anchorage, Oaktree,
TPG,York Capital
Bain Capital,Goldman Sachs,
Lee Sang-rok
Goldman Sachs,MBK, PAG,Owl Creek
2012 13 14 15 1716
7%
36%
46%
25%
0
25
50
75
100
$125B
IPO
Trade
Secon-dary
80
57
122
10598
115
Figure 2.8: Unrealized value of PE investments grew signifi cantly, propelled by newer investments
30%CAGR
Unrealized value rose 30% from mid-2016 to mid-2017 GPs trimmed older vintages
Asia-Pacific PE unrealized asset value ($B)
Notes: 2008 to 2015 show values in December; both graphs exclude real estate and infrastructure fundsSources: Preqin; AVCJ
Estimated fair unrealized value of Asia-Pacific PE portfolio (by vintage)
243273
324 236
386
424
87
132153
25%CAGR
196
67
Pre-2006
2007
2008
2009
2010
2011
2012
20132014
Pre-2006
2007
20082009
2010
2011
2012
2013
20142015
Pre-2007200820092010
2011
2012
2013
2014
20152016
2015 2016 2017
13 14 15 June2016
Dec.2016
June2017
December 2015 December 2016 December 201709 10 11 1220080
20
40
60
80
100%
Share withvintage greater
than 7 years36% 29% 26%

Asia-Pacifi c Private Equity Report 2018 | Bain & Company, Inc.
Page 10
The value of companies still being held in PE portfolios in June 2017 grew 30% from a year earlier to $424 billion
(see Figure 2.8). If multiples begin to contract, PE funds may risk building up an exit overhang. But for now,
GPs continued to trim older-vintage companies from their portfolios, reducing the share with a vintage of more
than seven years to 26% at the end of 2017, from 29% a year earlier. More than 90% of GPs responding to Bain’s
2018 survey expect strong exit momentum across all channels this year.
Fund-raising: Regional funds bounce back
Fund-raising activity focused exclusively on the Asia-Pacifi c region was slightly higher than the historical average,
with $66 billion raised in 2017. Pan-Asia regional funds expanded their fund-raising activity at the expense of
country-focused funds, jumping to 32% of the total from 21% a year earlier, with KKR closing a record $9.3 billion
regional buyout fund (see Figure 2.9).
Although Asia-Pacifi c GPs see competition intensifying and a tougher investment environment, 65% plan to
raise funds in the next 24 months.
As we mentioned earlier, Asia-Pacifi c-focused funds held a record 23% of global private equity assets under man-
agement, up sharply from 9% a decade ago.
LPs continued to refocus their relationships with GPs, gravitating to large, experienced funds with strong track
records. Refl ecting that trend, the total number of funds closing in 2017 was down by about a third, and average
fund size grew by almost 65%. The pattern for funds raised in 2017 also underscored LPs’ preference for large
funds with proven track records. Only 21% of PE funds on the road last year reached their target in less than 12
Figure 2.9: Regional fund-raising bounced back, including the largest-ever buyout fund raised in Asia
Capital raised by Asia-Pacific-focused funds (by closed year) Sample of Asia-Pacific funds closed in 2017
Note: Chart excludes real estate and infrastructure fundsSource: Preqin
Number ofAsia-Pacific
funds closed
Average size($M)
Fund typeand value raisedFund manager Focus
Buyout$9.3B
RegionalKKR
CITIC Private Equity
Asia AlternativesManagement
Fund of funds$1.8B
Baidu
Multistrategy$2.0B
China
Regional
Quadrant Private Equity
Buyout$0.9B
Australia/New Zealand
Expansion/late stage
$1.1BChina
Asia-Pacific regional Asia-Pacifc country focused
325 302 194
190 206 340
30% 21%32%
70%79%
68%
2012–16average
2016 2017
$62B $62B $66B

Asia-Pacific Private Equity Report 2018 | Bain & Company, Inc.
Page 11
months. Large, experienced funds took 14 months on average to close new funds. Smaller, experienced funds
were on the road for 16 months, and fi rst-time funds took two years to close (see Figure 2.10).
Returns: Another strong performance
Despite the large capital calls of 2017, LPs remained cash-positive in the fi rst nine months of the year (see Figure 2.11 ). From 2014 to September 2017, LPs received $1.20 for every $1 invested, and the industry continues to
generate high returns. Buyout and growth funds had a fi ve-year, end-to-end pooled IRR of 12.5% as of June 2017,
nearly 4 percentage points higher than returns from comparable public equities.
Funds focused on the Asia-Pacifi c region posted a median internal rate of return of 11.5%. Since 2014, the region’s
funds have been producing a median IRR of 11% to 12%, and top-quartile funds’ returns were well above most LPs’
expectation of 16% for Asian emerging markets (see Figure 2.12).
The profi tability of 2010 and 2011 vintages was solid, and early indications for the 2012 vintage are promising.
By contrast, aggregate net returns of recent vintages like 2013 or 2014 were trending lower. However, it’s too
early to predict the profi tability of younger funds, given that most of these returns are based on theoretical valu-
ation of the owned assets, as opposed to actual selling price.
What’s clear, though, is that strong PE fund performance has increased competition, pushing prices up for now.
Finding attractive deals will be more challenging, and GPs will need to work harder to match their returns of the
past few years. Results from Bain’s 2018 Asia-Pacifi c private equity survey show a top concern for many GPs is
lower returns, resulting from a lack of attractive deal fl ow and high valuations.
Figure 2.10: A fl ight to quality among investors is benefi ting large funds with proven track records
On/more than target in less than 1 yearOn/more than target in 1–2 yearsLess than target and/or greater than 2 years
Notes: Excludes real estate and infrastructure funds; large, experienced funds exclude first-time funds and include funds with more than $1 billion in assetsSource: Preqin
Fund type
Time to closein 2017
(in months)
Percentage offunds that met
their target in 2017
Large,experienced
funds
Smaller,experienced
funds
First-timefunds
Only 21% of funds on the road reachedtheir goal quickly (by year of final close)
Large, experienced funds were most successful
02014 15 16 17
Percentage of Asia-Pacific-focused PE funds closed
20
40
60
80
100%
14
16
24
75%
48%
33%

Asia-Pacifi c Private Equity Report 2018 | Bain & Company, Inc.
Page 12
Figure 2.11 : Despite large capital calls, LPs remained cash-positive in Q3 2017 and the PE industry kept outperforming
Cash flow for Asia-Pacific buyout and growth funds Asia-Pacific private equity vs. public market
Note: Cambridge Associates’ mPME is a proprietary private-to-public comparison methodology that evaluates what performance would have been had the dollars invested in PEbeen invested in public markets instead; the public index’s shares are purchased and sold according to the PE fund cash-flow scheduleSource: Cambridge Associates
DistributionsContributionsNet cash flowsMSCI All Country APAC mPMEAsia-Pacific buyout and growth funds
13 14 15 16 Q317
09 10 11 12082007−20
–15
–10
–5
0
5
10
15
20
$25B$1.20 backfor every $1invested in2014–17
End-to-end pooled IRR (as of June 2017)
3 years 10 years 20 years5 years0
5
10
15%
10.6
12.5
8.6
10.5
4.5
10.7
5.05.1
Figure 2.12: Profi tability remained solid, although younger vintages’ projected returns are trending lower
2004
Top-quartile fundsThird-quartile funds Median funds Top-quartile fundsThird-quartile funds Median funds
Net IRR of Asia-Pacific-focused funds(all vintages)
Net IRR of Asia-Pacific-focused funds(by vintage)
Notes: Includes Asia-Pacific-focused funds that have IRR data; vintage year refers to year of initial investment; excludes real estate and infrastructure funds and funds withno/null value; smaller sample size for 2009 vintageSource: Preqin (most up-to-date performance data is mostly from June or September 2017)
As of year-end Vintage year
132012 14 15 16 Most upto date
0
5
10 9.9 9.911.0
12.010.8 11.5
1516%: Expectations for Asian emerging markets from most LPs
20
25%
14
16%+ Asianemerging-market
expectations
05 06 07 08 09 10 11 12 130
5
10
15
20
25
30
35% Stabilized IRR Projected IRR

Asia-Pacific Private Equity Report 2018 | Bain & Company, Inc.
Page 13
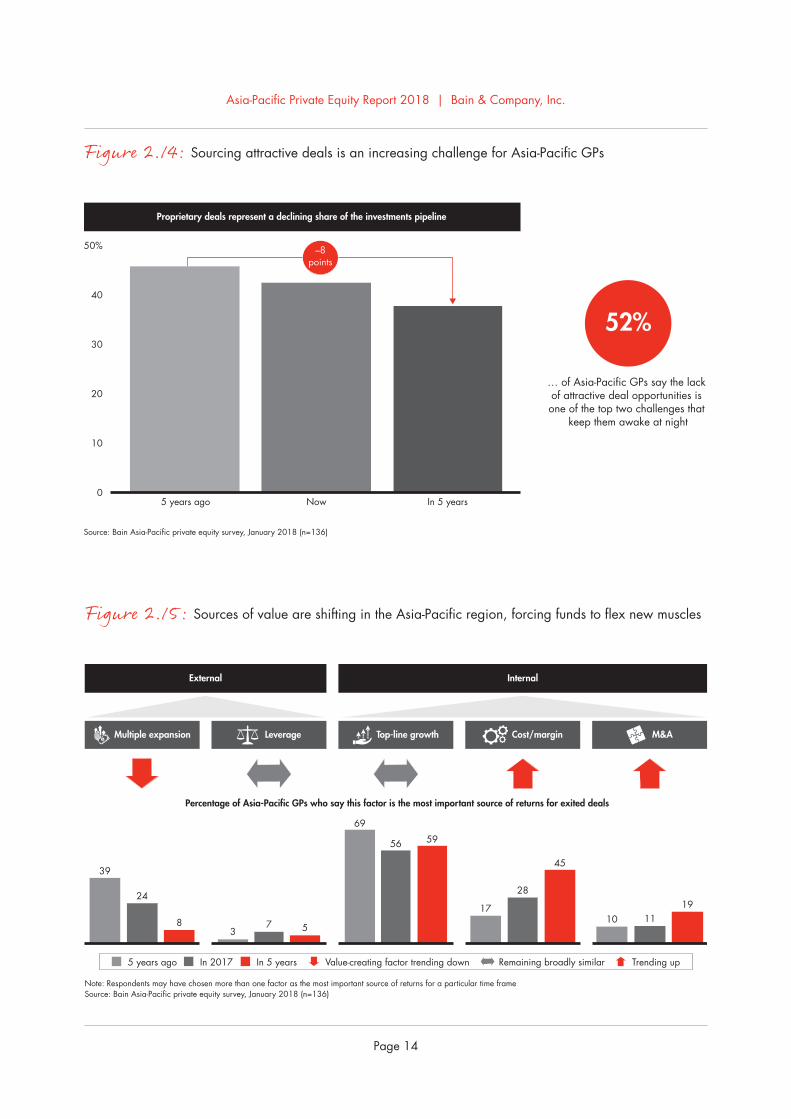
Changing sources of value
The Asia-Pacifi c region holds plenty of opportunity for investors to earn strong profi ts in the coming years. But,
the fundamental sources of value creation that investors counted on in the past are changing. To maintain high
returns, PE fi rms will need to develop new capabilities.
With median purchase-price multiples at near-record levels and market growth expected to further slow in the
coming years, GPs can no longer expect top-line growth to increase the value of their assets, so they can exit at a
premium. More than 70% of Asia-Pacifi c GPs say competition increased in 2017, especially from regional and
local PE fi rms, making it more diffi cult to fi nd attractive deals. A majority say the lack of attractive deal opportu-
nities for 2018 is one of the top two challenges that keep them awake at night. They also see a clear decline in
proprietary deals (see Figures 2.13 and 2.14).
Until now, most PE funds investing in the region have been content to ride the wave of strong macro growth
and expanding multiples—buying high and selling higher. Already, these external factors have become far less
important as sources of returns than they were fi ve years ago. Going forward, the most important factors will
be internal—top-line growth, increasing margins and strategic M&A (see Figure 2.15). Anticipating that
change, successful GPs already have begun to play a more active role helping their portfolio companies create
value by accelerating organic growth, improving capital effi ciency, reducing cost and pursuing strategic mergers
and acquisitions.
Figure 2.13: GPs say competition has increased sharply, with regional/local PE fi rms and corporate investors the biggest threats
Asia-Pacific GPs’ perspectives on the levelof competition vs. the past 12 months
Biggest competitive threats for Asia-Pacific GPs
Source: Bain Asia-Pacific private equity survey, January 2018 (n=136)
January 2018 survey
Increase significantly
Increase moderately
Stay broadly the same
0
40
20
60
80
100%Decrease
Regional/local PE firms
Strategic/corporate players
Global PE firms
Inbound corporateinvestment from overseas
LPs/SWFs direct investing
Cross-border PE investments
63%
47
34
25
13
6
Asia-Pacifi c Private Equity Report 2018 | Bain & Company, Inc.
Page 14
Figure 2.14: Sourcing attractive deals is an increasing challenge for Asia-Pacifi c GPs
Source: Bain Asia-Pacific private equity survey, January 2018 (n=136)
Proprietary deals represent a declining share of the investments pipeline
… of Asia-Pacific GPs say the lack of attractive deal opportunities is one of the top two challenges that
keep them awake at night
10
20
30
40
50%
05 years ago Now In 5 years
–8points
52%
Figure 2.15: Sources of value are shifting in the Asia-Pacifi c region, forcing funds to fl ex new muscles
Percentage of Asia-Pacific GPs who say this factor is the most important source of returns for exited deals
39
24
83
7 5
69
56 59
17
28
45
10 1119
Note: Respondents may have chosen more than one factor as the most important source of returns for a particular time frame Source: Bain Asia-Pacific private equity survey, January 2018 (n=136)
5 years ago In 2017 In 5 years Value-creating factor trending down Remaining broadly similar Trending up
External Internal
M&ACost/marginTop-line growthLeverageMultiple expansion

Asia-Pacific Private Equity Report 2018 | Bain & Company, Inc.
Page 15
For many, however, this fundamental shift in approach will require adding new capabilities. As we detail in the
coming pages, a few key strategies can prepare Asia-Pacifi c PE fi rms to ride the new wave of value creation and
produce top-tier returns: help portfolio companies build commercial excellence, make the most of digital tech-
nologies and excel at talent management.
The Asia-Pacifi c PE industry has reached a critical turning point, and investors in the region face new challenges
and opportunities. Some GPs believe the market has reached the top of the cycle, and many are concerned that
multiples could decline. Whether the cycle turns down in 2018 or later, the days of heady emerging-market
growth are probably over. PE funds that start building the skills and expertise to create internal sources of value
will have the tools to help them deliver strong returns and attract fresh capital for a new era.

Asia-Pacifi c Private Equity Report 2018 | Bain & Company, Inc.
Page 16
Mature PE market and high expertisePlenty of PE capital availableHigh pricingMore concerns over LPs investing directly
Growing focus on making new dealsBrighter macro contextPositive exit environmentHigh valuation and competitionNarrow target pool in each country
2017 DEALS(VS. 2012–16
AVERAGE)
2017 EXITS(VS. 2012–16
AVERAGE)
KEY 2017 HIGHLIGHTS
MARKET OUTLOOK
AUSTRALIA
JAPAN
SOUTH KOREA
ASEAN
INDIA
GREATER CHINA
$73B(+56%)
569 deals(+28%)
$20B(+51%)
184 deals(−17%)
$20B(+182%)
70 deals(+14%)
$13B(+32%)
91 deals(+18%)
$25B(+269%)
49 deals(+3%)
$9B(+2%)
51 deals(+8%)
$48B(+9%)
393 exits(+86%)
$18B(+105%)
122 exits(32%)
$16B(+86%)
31 exits(−3%)
$11B(+76%)
73 exits(+31%)
$13B(+2%)
65 exits(−7%)
$9B(−21%)
26 exits(−44%)
• Equaled record year for deal value, boosted by megadeals and buyouts• Vivid interest in logistics, services and consumer over Internet• Vivid exit activity momentum
• Softer deal activity, but a few megadeals pushed deal value up• Weaker Internet and tech deal flow• Strong exit momentum
• Vivid deal activity• Strength in consumer/retail and energy and resources sectors• Great exit momentum
• Highest deal value ever• Singapore story strong• Internet, tech and healthcare driving sectoral interest• Momentum in secondary exits
• Biggest market since 2007, including largest-ever Asia- Pacific PE deal• Increased interest from global LPs• Strong momentum in tech• Strength in trade exits
• Deal value on par with historical average• Strong momentum in healthcare• Challenged IPO channel
DIVERSE MARKETS, DIFFERENT OUTLOOKS
Strengthening macro contextPriority given to making new dealsShift to buyout/“path to control”Steep competitionBuildup of exit overhang
++
−
+
+
−−
+
−
−
+
+
−−
−−
++
More balanced sector focusPositive exit environment, including IPOHigh valuation and intense competition, especially from LPs investing directly
Solid deal flowImproving macro contextSteep valuationsIntensified competition
Noncore carve-outs fueling deal flowCompany owners opening up to PELimited pool of large transactionsIncreasing competition
+
−
−++
+
+

Asia-Pacific Private Equity Report 2018 | Bain & Company, Inc.
Page 17
3. Creating value in an evolving marketIt’s becoming tougher to deliver big gains from private equity investments in the Asia-Pacifi c region. Competi-
tion is more intense, valuations are soaring and the sources of value are shifting. That means GPs need to
rethink how they evaluate and seize new opportunities. Those who deliver profi table organic growth, and do it
quickly, can prosper even in a challenging market.
Three key capabilities can help PE fi rms take a more active role accelerating top-line growth: building commer-
cial excellence, harnessing digital technologies and improving talent management. Leading PE fi rms already
have begun embracing a more active management approach. We describe some of their experiences in the three
sections that follow, highlighting their impressive results.
• • •
Building commercial excellence
Increasing top-line growth has the biggest impact on exit multiples. GPs who spot growth opportunities early
can bid for companies more confi dently, generate more value post-acquisition and exit more profi tably. In our
experience, building commercial excellence is a deep, mostly untapped source of growth. We defi ne commercial
excellence as a set of capabilities that can generate growth including customer segmentation, salesforce effec-
tiveness, category management and pricing. PE fi rms that help their portfolio companies improve their go-to-
market approach generate triple benefi ts: top-line acceleration, margin expansion and higher exit multiples.
Improving commercial operations often produces a quick win. Advanced analytics can rapidly help sales teams
shift to winning behaviors, for example. When companies in a B2B setting launch multiple commercial excel-
lence initiatives, we typically see 10% to 20% top-line acceleration, and a 10% to 15% EBITDA uptick—and even
more when they harness digital technologies. Our research also shows that median return on investment is 20%
to 30% higher when using a commercial acceleration program (see Figure 3.1).
Take the example of a global IT infrastructure company acquired by a US-based PE fi rm. The GP leadership team
quickly realized that the IT company’s biggest growth opportunity was in China, but it was not in a position of
strength: A key competitor dominated the most important distributor-led sales channel.
The PE team helped management review its China operations using a systematic assessment of its market posi-
tion based on customer, supplier and distributor input. This outside-in view allowed the management team to
identify major distribution concerns, including poor incentives and insuffi cient market coverage. It also quickly
revealed a weak presence in smaller Chinese cities compared with the competition.
To address those problems, the company signifi cantly upgraded its channel engagement, using more distribu-
tors to accelerate sales. At the same time, the leadership team launched several initiatives aimed at quick wins.
To increase sales, for example, it redesigned the conditional rebate to incentivize both wholesalers and its own
frontline staff. It also deployed a methodical approach to screen and select new distributors for areas where
coverage was low.
The results were impressive: The company’s sales took off, and in six months the leadership team had hit its
12-month target with a growth rate 2.25 times higher than that of the market. In the meantime, the distributor
coverage increased by 60% (see Figure 3.2).

Asia-Pacifi c Private Equity Report 2018 | Bain & Company, Inc.
Page 18
Figure 3.1: Commercial front-end acceleration can ring the cash register quickly
Commercial excellence initiatives Benefits
Source: Bain & Company
Operatingmodel and salesforce
management
Customer segmentation and value proposition
Category management and adjacencies
Pricing
Sales andchannel coverage
Sales behaviors
10%–20% top-line improvement
10%–15% EBITDA uptick
20%–30% deal ROI improvement
Top-lineacceleration
Marginexpansion
Exit multiple growth
Figure 3.2: Portfolio companies tend to reap big gains from commercial acceleration programs
IT company’s results after four-monthpilot program in China, indexed
Carver Korea enterprise value Swisse Wellness EBITDA
Sources: Literary search; expert interviews; AVCJ; Bain & Company
Acquired by Unileverfor $2.7B in September 2017
83% stake acquired by Biostimefor A$1.7B in September 2015
Distributor coverage Sales growth
Before
After
Market
ITcom-pany
60%
2.25x
September 2017exit
July 2016acquisition
$0.6B
$2.7B
4.5x
September 2015exit
2013 capitalinjection from
Goldman Sachs
A$2M
A$150M
75x
Yearly target was hitin just six months

Asia-Pacific Private Equity Report 2018 | Bain & Company, Inc.
Page 19
Building new muscles
Top-line growth has a multiplier effect on creating value because it lifts profi t along with revenue. That generates
impressive momentum, making it easier to exit at a high multiple. Yet few PE fi rms do it well—including those
focused on the Asia-Pacifi c region. Our 2018 survey indicates only 24% achieved their top-line goals in most of
their portfolio companies.
One explanation is that historically, Asia-Pacifi c PE fi rms could surf on market growth and take advantage of
expanding multiples to underwrite future value projections. Now, with macro conditions slowing and the loom-
ing risk of contracting multiples, many recognize they need new muscles to help portfolio companies accelerate
organic growth. Bain research shows that portfolio companies that grew by gaining market share or investing
in businesses adjacent to their core produced returns 30% to 50% higher than those that relied on market
growth alone. However, 56% of the region’s funds do not feel fully confi dent to underwrite the top-line and
bottom-line opportunities after due diligence, and 68% are not prepared to make the most of commercial excel-
lence initiatives involving the salesforce, pricing or product offering after the acquisition (see Figure 3.3).
Implementing commercial excellence initiatives is hard work. Customer segmentation, pricing, salesforce
models and product offerings are interlinked, making it complex to set change in motion. Upgrading a company’s
go-to-market model requires a change in mindset. Many companies lack vital market data, such as their share of
customers’ wallet, which is the starting point for overhauling strategy. And for many GPs, commercial accelera-
tion seems a risky and time-consuming endeavor.
Figure 3.3: The era of surfi ng on market growth is over, but Asia-Pacifi c GPs are not fully prepared for the shift
Note: Adjacency refers to businesses with activities close to the core of the acquirerSources: Bain FoF proprietary database; Bain Asia-Pacific private equity survey, January 2018 (n=136)
Median ROI from investments in share gain or adjacent businesses are 30% to 50% higher than from pure market growth
Market growth
1.4
1.8
2.0
Share gain Adjacency
48%
30%
… of Asia-Pacific PE funds don’t feelfully confident to underwrite the top-line
and bottom-line opportunities afterdue diligence
56%
… of Asia-Pacific GPs say they arenot fully prepared to deliver commercialexcellence initiatives after the acquisition
68%

Asia-Pacifi c Private Equity Report 2018 | Bain & Company, Inc.
Page 20
But digital innovation has made inaction a bigger risk. Digital technologies are revolutionizing the way com-
panies identify, understand and serve customers. New entrants and the most agile incumbents are rapidly
exploiting technologies such as customer and pricing analytics to transform their commercial capabilities. Big
Data has dramatically improved the precision of market and customer-segmentation efforts as fi rms tap into
large streams of transactions, advanced analytics, social media activity and other windows on customer behavior.
PE fi rms that underestimate a company’s exposure to disruption in these areas can see value evaporate rapidly.
But there’s an upside too: Diagnosing opportunities to improve commercial capabilities can produce step changes
in top- and bottom-line performance by allowing companies to open new markets and generate more sales with
increased effi ciency.
This was precisely the approach that Carver Korea, a leading Korean cosmetics brand, and its PE owners used to
multiply its value 4.5 times within 15 months. The company had tripled its top-line growth every year from 2012
to 2015 before selling a 60% stake to Bain Capital and Goldman Sachs in 2016 (see Figure 3.2). In order to
sustain the momentum, the investors and management had to redefi ne Carver Korea’s growth strategy and
quickly transform the business.
Four key initiatives fueled the spectacular rise in value. The company overhauled customer segmentation,
expanding its loyal customer base while targeting a new segment—younger cosmetics customers—with an
online pilot program. It sharpened its “Aesthetic” brand identity and eliminated inconsistent messages. It also
simplifi ed its product lines, eliminating underperforming product models. Finally, the company lowered its
channel risk by expanding online, in drugstores and duty-free shops, and improving exports to China. To ensure
those changes would stick, owners and management agreed to a major organizational change, moving from the
one-man founder organization to a functional structure led by expert teams.
Diagnosing opportunities to improve commercial capabilities can produce step changes in top- and bottom-line performance by allowing companies to open new markets and generate more sales with increased effi ciency.
Starting early in diligence
Because it can take time for commercial acceleration efforts to bear fruit, the most effective PE funds start early—
most often in due diligence—so they can launch a full set of initiatives right after acquisition. The fi rms most
adept at sorting through these issues have developed a diagnostic capability that they can use repeatedly during
due diligence to evaluate a company’s upside. That diagnostic then suggests which initiatives will help the com-
pany reach its goals and what tools or technologies will help accelerate results. Gathering that information prior
to the sale gives GPs a valuable jump-start after the acquisition.
As one PE fund conducted due diligence on a China-based IT company, the big question was whether it would
be able to achieve the margins of its competitors in India. An analysis of the profi t profi le of the two countries
highlighted structural differences that were unlikely to change under PE ownership, but it also pointed to two
main areas where the company could improve its margins—pricing and sales productivity, which was far lower

Asia-Pacific Private Equity Report 2018 | Bain & Company, Inc.
Page 21
than the competition. New initiatives to improve profi ts showed the company could boost its EBITDA by 3 to 4
percentage points, or more, depending on execution. That analysis gave the PE fund added confi dence to pitch
and a plan to quickly start improving the company’s performance.
Agility and rigor after the acquisition
Leading PE funds improve commercial excellence in sprints as soon as the deal closes. They quickly review
customer segmentation based on the potential and lifetime value of current and new accounts, as opposed to
their value today. Next, they identify growth opportunities and quick wins, and set new initiatives in motion.
A well-designed commercial acceleration plan can power a major fi nancial turnaround. Swisse Wellness, a lead-
ing Australian vitamin and health-products company, reversed a cash-fl ow shortfall and raised its EBITDA by 75
times in two years, thanks to a commercial excellence program designed together with investor Goldman Sachs
(see Figure 3.2).
By 2012, Swisse’s attempt to enter the US market had begun to strain cash fl ow. The company received a
A$70 million capital injection from Goldman Sachs Special Situations Group in 2013 to help it return to profi t-
able growth. Swisse started to implement rigorous cost-reduction and profi t-improvement programs, as well
as commercial acceleration initiatives to build a strong foundation for longer-term growth. The effort overhauled
Swisse’s pricing and promotion strategy, which had been cannibalizing the market’s profi t pool. It put in place
a more disciplined promotion strategy, harnessed data science to track the effectiveness of its promotions
and created a more structured marketing calendar. The new approach helped push industry prices up and
increase margins.
At the same time, it turned to China to turbocharge growth. Building on the powerful equity of Australia-branded
products and China’s growing interest in health trends, Swisse triggered a wave of Chinese demand for Aus-
tralian consumer products. Improving its supply chain muscle, it strengthened its network of contract manufac-
turers and secured contracts with key suppliers. It also managed a complex demand scenario, designing a new
cross-border pricing strategy and a more systematic go-to-market approach. When Goldman Sachs exited in
September 2015, selling to Biostime in a deal that valued the company at A$1.7 billion, Swisse had an EBITDA
close to A$150 million, up from A$2 million in 2013.
Companies that continually identify new customer groups, understand their preferences and serve them better
have always excelled. But as digital technologies rapidly transform industries and markets, the risk of being
outmaneuvered by savvier competitors is growing. PE companies that develop commercial excellence as a core
capability will help their portfolio companies stay ahead of the market-disruption curve, grow faster and deliver
top returns.
• • •
Making the most of digital technologies
Big Data, analytics and connectivity are accelerating change in every sector of the global economy. As these tech-
nologies reshape industries, companies face a growing risk of digital disruption. Leading PE funds are turning
these trends to their advantage, by using advanced analytics tools and capabilities to seize new opportunities and
lead change. Digital competence enhances a fund’s ability to assess companies during diligence and improve
their performance during the period they are held, creating a signifi cant competitive advantage.

Asia-Pacifi c Private Equity Report 2018 | Bain & Company, Inc.
Page 22
To date, only a few investors have fi gured out how to take advantage of new technologies. Our research shows
fewer than 5% of Asia-Pacifi c GPs believe they are fully prepared to help their portfolio companies manage
digital disruption. Many have begun building new capabilities, but about 30% say they have a long way to go to
develop the added competence needed for due diligence or post-acquisition, and almost 60% claim they don’t
have a digital X-ray tool to identify where to focus in the portfolio (see Figure 3.4).
For private equity funds, the best way to look at the digital risks and opportunities is through the classic PE invest-
ment lens: How can I increase cash fl ow over the next three to fi ve years, and how can I increase the company’s
franchise value at exit? Many managers view the digital challenge as confusing or overwhelming. Bain’s approach
is to focus on the business problems that technology is solving in each industry. That allows companies to
quickly identify the digital actions that matter most.
The level of disruption differs for each industry and company, and is constantly evolving. To assess the risks
and opportunities for a given company, leading PE fi rms start with a few important questions: Is digital expand-
ing or reducing the profi t pool for a target company’s industry, and how does the impact vary from one industry
segment to another? The speed of change is also important. Will the goalposts for success change within the next
12 months or the next fi ve years? What could the target company do to develop new opportunities and reduce the
risk? Finally, what impact would those moves have on deal return? The answers will vary widely, depending on
the company.
Figure 3.4: Most Asia-Pacifi c GPs feel unprepared to help their portfolio companies address digital disruption
Source: Bain Asia-Pacific private equity survey, January 2018 (n=136)
Percentage of GPs who say they have …
A repeatable way to assessthe target’s digital readiness
during due diligence
The right capabilities to help portfolio firms lead
digital initiatives
A digital X-ray tool to identify where
to focus in the portfolio
Fullyoperational
Maturingmodel
Experimentingstage
A longway to go
5% 4% 2%
23% 25% 13%
41% 43% 26%
32% 28% 58%

Asia-Pacific Private Equity Report 2018 | Bain & Company, Inc.
Page 23
Supercharged growth
Our experience shows that when PE investors help portfolio companies align digital transformation programs
with strategy, they can deliver big wins. Courts Asia, a Southeast Asian retailer, is a striking example. When
Baring Private Equity Asia acquired a majority stake in Courts in 2007, it was a loss-making brick-and-mortar
retailer. The retailer had an overextended store network and poor customer feedback, and it sold few products
online. In 2010, Courts and PE partner Baring developed an omnichannel strategy that supercharged its growth
as part of a broader transformation. When they launched an IPO in October 2012, Courts had a leading position
in its markets, the value of Baring’s stake had more than doubled and the IPO was heavily oversubscribed.
Courts’s fi rst step was a rapid turnaround program that restructured its store footprint, cut costs and improved
salesforce effectiveness. As the company turned profi table, Baring and Courts focused on accelerating growth
and delighting customers. Both saw an opportunity for the company to pioneer omnichannel retailing in South-
east Asia. Management set to work building a leading position in online retailing and developing new ways to
enhance customer loyalty, including a one-stop mobile shop. Finally, it developed touch points to gather continual
feedback from customers and deepen its relationship with them through targeted promotions. By 2014, Courts
ranked fi rst among traditional retailers based on website traffi c in Singapore, and in 2016, an online poll named
it the best home and electronics retailer in Asia.
For private equity funds, the best way to look at the digital risks and opportunities is through the classic PE investment lens: How can I increase cash fl ow over the next three to fi ve years, and how can I increase the company’s franchise value at exit?
Courts’s growth story underscores how digital tools can help companies identify new opportunities and make
the most of them. China’s Qingdao Haier, a global household electrical appliances company, provides another
example. KKR acquired a 10% stake in Haier in September 2013, becoming its strategic partner. At that point,
Haier suffered from slowing growth in white goods, a weak position in brown goods and a shrinking market
share. Working together, the two companies determined that Haier could increase its sales by putting Big Data
at the core of its marketing strategy. When KKR sold part of its stake four years later, Haier’s stock price had
almost tripled and the company had won several prestigious industry awards.
Haier had already begun reshaping its business model for a digital economy before KKR invested, and was
betting on a new online strategy to position the company for long-term growth. KKR worked closely with Haier
to develop a digital sales and marketing strategy that used Big Data to better understand customers’ needs and
preferences such as reducing costs, improving security or seeking out leisure opportunities. That helped the
company identify the right categories of products and services to offer. The goal was to use data to create a win-
win marketing ecosystem powered by user interactions.
Initially, Haier created a few pilot initiatives in priority areas, including a heat map of potential consumer
spending and profi les. Sharing the map with the front line helped the company run more targeted marketing
campaigns. Despite its distributor-led business model, Haier developed powerful tools to connect with end
customers, monitoring each interaction between distributor sales representative and customers. Haier used a

Asia-Pacifi c Private Equity Report 2018 | Bain & Company, Inc.
Page 24
cloud platform to analyze millions of data messages about their equipment every day and wielded Big Data and
artifi cial intelligence to optimize products and improve customers’ experience. Ultimately, the digital strategy
helped Haier shift from a technology-focused mindset to a customer-centric company, giving it more resilience
to adapt to a fast-changing market.
Today forward, future back
Companies trying to develop a digital strategy need to do two things well: improve existing products or services
and anticipate how technological advances may revolutionize them in the future. For some management teams,
this dual approach may feel overwhelming. In reality, the leadership teams at most companies have a reasonably
good idea about where their industry is headed in the next 10 years or so. For example, retailers know that fi rst-
generation e-commerce is being replaced by increasingly sophisticated omnichannel offerings. Auto suppliers
are watching the development of autonomous and electric vehicles and can anticipate how they will change the
market in the coming decade.
The problem for many companies is that they set in motion too many digital initiatives, not too few. PE fi rms
face the same challenge: choosing the right strategy for portfolio companies amid market turbulence and rapid
change. Industry-specifi c analysis can help investors narrow the focus and create a pragmatic plan to improve
short-term performance while moving toward longer-term goals.
The most pragmatic approach is to look at each target company’s business from two perspectives: What are the
risks and opportunities today, and what will they be in 10 years? We call this dual view today forward, future back
(see Figure 3.5).
Figure 3.5: Leading companies are moving toward digital leadership by thinking “today forward” and “future back”
Source: Bain & Company
Today forwardHow can digital drive the cashflow and the EBITDA NOW?
Point ofdigital
departure
Future point of arrival
Future backHow can I boost the company’s
franchise value AT EXIT?DREAMERS
DOERS

Asia-Pacific Private Equity Report 2018 | Bain & Company, Inc.
Page 25
Starting with today forward, leadership teams need to assess how digital technology already is affecting their
profi t pool and how the company should respond. That involves using digital X-ray tools to diagnose a company’s
strengths or weaknesses. Using those insights, leadership teams can develop initiatives that will produce a big
leap in performance over the next three to fi ve years.
Future back comes from the other direction. It means envisioning how technology is likely to transform the
profi t pool over the longer term. With that perspective, companies can start preparing for long-term change
concurrently.
Of course, shaping a digital strategy that responds to those questions is just the beginning. To keep pace with
innovation, PE funds must continue to review digital opportunities and risk throughout the investment cycle,
from due diligence through exit.
Companies trying to develop a digital strategy need to do two things well: improve existing products or services and anticipate how technological advances may revolu-tionize them in the future.
Balancing current and future strategies
PE investors are generally focused on creating value over the next three to fi ve years, so their primary focus in
both diligence and ownership is today forward, or what can they do now to generate EBITDA and improve top-
line growth. That said, investors can profi t from the future-back perspective for two very practical reasons. First,
a thorough, fact-based analysis of what’s knowable about the future is the best defense against paying too much
for an asset or getting blindsided later. Second, a fi rm grasp of what’s coming provides the foundation for the
most effective value-creation plan. It gives direction to the short-term initiatives and helps the fund build the
most compelling exit story.
Today-forward and future-back analysis helped generate early substantial gains at a slow-growing Asia-based
digital company purchased by a group of global PE funds. The future growth prospects looked strong as the deal
closed. The company was operating in a market with double-digit growth, and it had nascent but promising rela-
tionships with a set of large customers. But the business was burning cash at a rapid clip, and competition was
fl ooding into the market.
Together with its new PE owners, the company revamped its strategy. It repositioned its service offering
around select businesses likely to benefi t from digital shifts. That helped clarify brand positioning. Changes to
the sales team culture and the operating model helped the company better identify opportunities with clients and
prospects, and directed frontline staff to the most important opportunities. Finally, it shifted global resources,
doubling down in some areas and pulling back in others.

Asia-Pacifi c Private Equity Report 2018 | Bain & Company, Inc.
Page 26
Less than 18 months later, sales had grown by seven times and the company was nearly profi table. The digital
strategy had improved its annual contribution margin by 10 percentage points, and the share of repeat clients had
grown 60 to 70 percentage points (see Figure 3.6). The turnaround was a major win from a today-forward
standpoint. But it also incorporated a future-back gain. The company’s new focus on speed, agility and the most
promising future markets made it more resilient in a fast-changing market.
Make the most of digital during due diligence
Striking the right balance between today-forward initiatives and future-back priorities is diffi cult, but it is critical
to have both in hand early to avoid being blindsided later. Leading companies start using digital tools during due
diligence to glean better insights about future growth opportunities and risks.
As one global PE investor considered acquiring a stake in an Indian fashion manufacturer, a key question cen-
tered on market growth and the company’s ability to win market share. To create value, the company needed to
progressively shift its sales online. But it was starting from scratch: brick-and-mortar retailers made up almost
all of its revenue, and management had no plan for a radical shift to online sales.
Advanced web-scraping analysis of leading e-commerce platforms highlighted why the company’s online posi-
tioning lagged the competition. Its discounting policy was not competitive, the price range for the products
offered online was extremely limited, the company was diffi cult to fi nd on the web, and it did not have the lead-
ership or platform partnerships to differentiate its online presence.
Figure 3.6: When aligned with strategy, digital transformation programs can lead to big wins
Case studies
Business stopped burning cash andwas on track to be cash-positive
Rolled out game-changinginitiatives and developed foundations
for digital ecosystem
Digital company Agribusiness firm
Note: Results are indexedSource: Bain & Company
Sales growth
Without digital
With digitalinitiatives
Repeat customers
Before
After
Before
After
60 to 70 percentage points 7x
EBIT
10%

Asia-Pacific Private Equity Report 2018 | Bain & Company, Inc.
Page 27
Using global industry benchmarks and an extensive customer survey, the fund determined that the company had
the potential to multiply its online revenue by 20 to 50 times during a typical PE ownership cycle. The deal team
also realized that the company could develop its own e-commerce capabilities, adding to the potential upside. The
PE company’s analysis ultimately allowed it to formulate a bid that matched the company’s potential, and to
begin work quickly on a set of high-priority initiatives using digital technologies to create value.
A stepping-stone approach
The most effective value-creation plans identify a clear objective on the horizon and aim the company in that
direction by laying out a set of practical initiatives that can create progress in the short term. These are stepping-
stones, or concrete measures that generate EBITDA now while bringing the company closer to its objective over
the next couple of years.
One Asian agribusiness company majority owned by an institutional investor developed a digital strategy aimed
at increasing returns by 10% within three years (see Figure 3.6). The leadership team wanted to get ahead
of competitors who were starting to use digital tools to transform their businesses. As they designed a compre-
hensive digital roadmap, however, they realized the company did not have adequate resources to launch all the
initiatives at once.
Rethinking its approach, the team assessed digital challenges in the industry through a double lens—today forward
and future back. They gathered input from internal stakeholders, suppliers, clients and a cross-functional team.
From a long list of possible initiatives, management placed a few big bets that could both create signifi cant value
and help the company’s products stand out in the market.
The fi rst stepping-stone was an e-commerce platform to help the company access smaller customers, reduce
marketing ineffi ciencies and create greater customer loyalty. In a rapid 12-week sprint, the company collected
input from customers and staff, designed a working prototype of the platform and identifi ed potential vendors.
Quickly, a number of small customers registered on the pilot platform and generated multiple transactions.
Those results were promising enough for the company to decide to roll it out to the entire organization.
The most effective value-creation plans identify a clear objective on the horizon and aim the company in that direction by laying out a set of practical initiatives that can create progress in the short term.
Making products in their supply chain more traceable—a critical capability in agribusiness—was a second im-
portant stepping-stone. A prototype digital tool helped management identify both farmers and their products and
increased the visibility of stock in the warehouse. That generated new business opportunities, giving the
company a strong advantage selling to customers who demand a high degree of traceability. It also allowed the
company to reward farmers based on the quality of their products.

Asia-Pacifi c Private Equity Report 2018 | Bain & Company, Inc.
Page 28
The company’s digital strategy and game-changing initiatives helped it quickly take a digital lead, improve its
margins and accelerate sales. The pilot initiatives are on track to increase profi ts by 10% over three years, based
on lower costs, increased margins and higher output.
Diagnosing strengths and weakness across the portfolio
Many PE funds are also understandably concerned about assessing the digital readiness of the assets they already
own. Performing a digital diagnostic across the portfolio can be an effective way to identify which initiatives will
produce the most value.
A portfolio scan should identify the most important sources of digital disruption facing each company and assess
how ready it is to compete in a changed market. We fi nd it useful to score sectors on a digital disruption index,
which tracks how digital technology is affecting key aspects of doing business in that industry—products and
services, customer and channel engagement, operations and new business models (see Figure 3.7). It’s then
possible to rank companies according to how thoroughly they have kept pace with these changes and to what
degree they are deploying technology across the value chain.
The most effective scans engage the leadership of portfolio companies, to help determine how much digital
technology has seeped into the organization’s DNA. The assessment looks at the company’s digital systems and
infrastructure, its technology stack, its fl uency in analytics and the management systems in place supporting
digital transformation. It aims to measure the quality of activity, not the quantity. Most companies are brimming
with digital initiatives, but fewer are able to sort and prioritize them based on their potential impact.
Figure 3.7: A digital portfolio scan assesses each industry’s level of disruption and each company’s level of readiness
Industry: Five degrees of digital disruption Company: Five degrees of digital readiness
DRS1
DRS2
DRS3
DRS4
DRS5
Isolated Clustered Connected Inter-connected
No digital activity
Digital is 100% embedded in everything the company does
Digital is 50% embedded in everything the company does
Developing digital strategy and prioritization of activities; central/cross-unit coordination
Digital exists in areas of the company, with limited visibility, oversight or strategy
DDI1
DDI2
DDI3
DDI4
DDI5
Digital disruptions have virtually no impact
Value chain revolution; incumbent players replaced or required to adapt business model
Transformation becomes inevitable; new competitors enter the market
Change takes hold; new channels and customer experience, new products and services
Digital drives modifications/optimization of existing processes
Notes: DDI–Digital Disruption Index; DRS–Digital Readiness ScoreSource: Bain & Company

Asia-Pacific Private Equity Report 2018 | Bain & Company, Inc.
Page 29
PE funds can use a digital scan to benchmark portfolio companies against their competition and begin to assign
value to initiatives that close readiness gaps or exploit strengths. This process will also identify sources of weak-
ness or strength across the portfolio, such as opportunities to create a digital marketing center of expertise or
effective ways to share best practices in supply chain transparency. The objective is to shine a light on which two
or three initiatives deserve the fi rm’s immediate attention so its leadership can marshal the resources to acceler-
ate those projects. Ultimately, PE funds can make digital benchmarking a standard process at relevant portfolio
companies. Having access to industry-specifi c digital developments on an ongoing basis, through the right part-
nerships, gives GPs a handy radar for potential disruption.
Create a digital ecosystem
Top-performing PE fi rms recognize the importance of building digital capabilities. But few believe that having
in-house digital experts would help them make smarter investment decisions. The reason is clear: It’s hard for
individual experts to possess the breadth of industry-specifi c knowledge required to generate effective insights.
In our experience, fi rms are better off building an ecosystem of capabilities to support the digital needs and ana-
lytic ambitions of their portfolio companies. An ecosystem could include the following elements.
• A network of IT providers, advanced analytics vendors or digital partners, sector by sector, to be a resource of
digital support for portfolio companies.
• Centers of excellence within the fi rm that give portfolio companies access to proven solutions or best prac-
tices in areas like digital marketing or social media.
• Connections to outside thinkers with expertise in technologies or industries with special importance to the
fi rm. This pool could provide perspectives on digital trends and what they mean for the portfolio companies.
• An internal team to manage the ecosystem and oversee initiatives for the entire portfolio. This group should
be available to help the fund’s investors better understand major technology trends and how they affect the
industries in the portfolio.
Over the last three decades, private equity fi rms have helped portfolio companies build the management skills to
deal with sweeping changes to the business landscape, including globalization and e-commerce. Digital innova-
tion, like those previous business challenges, presents another opportunity for the PE industry to lead in shaping
new strategies for shifting markets.
• • •
Managing talent
PE fi rms often spend a lot of time searching for the right company in the right sector, but fi nding talented leaders
is just as important to performance. Bain research shows that leadership problems in portfolio companies are
common throughout the Asia-Pacifi c region and have substantial impact on value creation.
According to our 2018 survey, talent is the most important factor behind deal success and failure in the Asia-
Pacifi c PE market, based on recent exits. But putting the right leaders in place is diffi cult: 70% of GPs told us they
struggle with organizational challenges in a majority of their portfolio companies (see Figure 3.8). Few GPs
in the region feel fully capable of assessing and managing the leadership team of their portfolio companies.

Asia-Pacifi c Private Equity Report 2018 | Bain & Company, Inc.
Page 30
Because market growth has propelled Asia-Pacifi c PE multiples until recently, GPs focused on the region tradi-
tionally have not devoted a lot of energy to talent management. That is one reason few Asia-Pacifi c GPs feel they
have the skills to do it well. But with market growth slowing, managing talent has become essential. As PE fi rms
turn their focus to improving operations to create value, their portfolio companies will need different leadership
skills to meet their performance targets. That means GPs will need new capabilities to assess top talent and build
out their teams faster.
Finding talent that can deliver on the investment plan is critical, especially when the deal thesis requires a fun-
damental shift in strategy or operating model. Yet, in our experience, PE fi rms often neglect to make important
talent decisions early on, both in the C-suite and in other mission-critical roles.
Asia-Pacifi c GPs in particular struggle to identify the right talent for the right job. One reason is that founding
families are still involved in running many companies, making leadership change tricky. Minority-stake deals have
also limited the ability for PE funds to infl uence people decisions. Although in 2017, buyouts were the fi rst subas-
set class by far in value, 85% of Asia-Pacifi c deals over the past fi ve years were minority-stake deals. Third, and not
specifi c to this part of the world, PE funds may fi nd their access to management limited prior to the announce-
ment of a sale, especially when there is no exclusivity. Also, soon after closing the deal, GPs often go through a
honeymoon period in which they tend to avoid tough issues, including those involving leadership. Finally, man-
agement assessment is an art, not a science, and all companies struggle to get it right, including PE fi rms.
Match talent to the value-creation roadmap
Of course, the defi nition of good leadership differs from company to company. The golden rule for PE funds is
identifying the capabilities required to deliver on the investment thesis and value-creation plan. The leadership
Figure 3.8: Industry participants say organizational challenges are the key factor behind deal success or failure
Main sources of deal success for recent exits Key reasons when exits were not successful
Source: Bain Asia-Pacific private equity survey, January 2018 (n=136)
Top-decile management team
Solid market growth
Keen buyers at exit
Strong alignment between fundand portfolio company
Successful margin growth
Gained market share
Reduced costs
Drove adjacencies
Management team lacks requisite skills
Unfavorable shift after the close
Macroeconomic headwinds
Inability to influence portfolio company
Plan overly ambitious
Focus on wrong issues
Management team not fully bought in
Lack of resources9
14
18
19
43
47
65
65%72%
58
46
45
37
22
11
10
of Asia-Pacific funds have organizational issueswith a majority of their portfolio companies70%

Asia-Pacific Private Equity Report 2018 | Bain & Company, Inc.
Page 31
qualities that worked in the past won’t necessarily work in the future. Strategy frequently shifts under PE owner-
ship and so do the capabilities required for success. If the investment thesis depends on pursing mergers and
acquisitions, for example, the leadership team will need individuals with business development expertise and
fi nancial acumen.
Getting talent right doesn’t stop at the C-suite. One important mistake many GPs make is to overlook the roles further down the organization that are central to the deal’s success.
GPs should be able to identify the critical management capabilities for success during due diligence—well before
the company has fully shaped a new strategy. When the GP of one global PE fi rm assessed an oil and gas com-
pany in Asia, management quality was a big question mark. Some members of the leadership team had departed
after a larger fi rm acquired the target company’s parent, and the quality of the remaining team was unclear.
Using new data sources and web scraping of sites like LinkedIn and Glassdoor, the GP analyzed management
turnover and the strengths of its remaining leadership team. The data showed the company was better posi-
tioned than most of its competitors on these two fronts. Further analysis and interviews confi rmed that the com-
pany had lost few of its most talented managers. That gave the PE fund confi dence that the current management
team could implement the value-creation plan.
Start at the top
When assessing portfolio company teams, it’s important to begin at the top and focus on the mission-critical
roles. The CEO should have the right profi le to lead the planned changes. Top executives have differing strengths
and may excel as commercial executors, fi nancial value drivers or corporate entrepreneurs. The value-creation
plan determines what kind of bench strength the company needs.
Of course, the CEO should to be able to work well with private equity partners and understand their focus on
delivering returns within a given time frame. The most effective portfolio company CEOs strike a good balance
between short- and long-term goals that will lead to the deal’s success. They appreciate the analytical perspective
that PE funds bring and are ready to depart from “business as usual,” to improve performance.
The next step is making sure the entire C-suite is aligned to the company’s new mission and strategy. A top CEO
may bring A-level talent with him or her. But C-suite roles should align with the company’s new mission and
strategy. Leading PE fi rms defi ne the leadership roles and help determine who fi lls them. That might involve
creating C-suite positions that didn’t exist before or eliminating others. It may also require rescoping or reshap-
ing roles to focus on new imperatives.
Getting talent right doesn’t stop at the C-suite. One important mistake many GPs make is to overlook the roles
further down the organization that are central to the deal’s success. These are typically complex roles fundamen-
tal to value creation—and roles where outperformance is key to success. Mission-critical roles tend to involve a
high degree of ambiguity and trade-offs. They require quick thinking and the ability to make decisions that will
directly affect the company’s performance against its plan.

Asia-Pacifi c Private Equity Report 2018 | Bain & Company, Inc.
Page 32
Leading GPs identify these roles and make it a priority to fi ll them with top talent. These roles typically include
sensitive frontline interactions and customer negotiations that can have a major effect on the company’s busi-
ness. A PE fi rm helping an apparel company expand into a new region, for example, will need to hire top-notch
talent in that channel. Even middle managers can make the difference between success and failure.
Assessing talent
A few leading PE funds in this region are developing best practices for assessing talent. According to Bain’s 2018
Asia-Pacifi c private equity survey, most fi rms are still developing leadership-assessment capabilities, with 84%
claiming they do not have a chief of talent to do this. And about 60% recognize they don’t have a fully functioning
process to assess the management team during due diligence or after the acquisition (see Figure 3.9).
Some PE fi rms are closing the gap by hiring global or regional talent directors that can help evaluate target com-
pany teams and strengthen portfolio company leadership. They can canvass external candidates and fi ll key roles
quickly, and may look outside the region or industry, if necessary.
In Asia-Pacifi c, GPs also mine adviser networks for talent. They build these networks throughout the investment
value chain, from deal sourcing and due diligence through the ownership period. Advisers may take on value-
creation roles, including board seats or more direct management roles.
More broadly, we also see data-based assessment and human-development specialist fi rms emerging in more
mature private equity markets. These companies are using data and analytics to enhance the accuracy and effec-
tiveness of predicting how well current leaders and future recruits will deliver against an investment thesis.
Figure 3.9: Many Asia-Pacifi c GPs say they need new capabilities to successfully assess and manage portfolio talent
Dedicated chief of talentfor portfolio companies
Repeatable process to assessthe management team during due diligence
Ability to assess leadershipteam after acquisition
Source: Bain Asia-Pacific private equity survey, January 2018 (n=136)
At full potential Not at full potential
84% 64% 59%

Asia-Pacific Private Equity Report 2018 | Bain & Company, Inc.
Page 33
Choosing the best management talent for a portfolio company is not a one-time drill. As a company’s strategy
evolves, staffi ng and assessment priorities will shift as well. Top PE fi rms perform regular check-ins to ensure
that the right team is in place and performing well. They also continue to refi ne their criteria for what great looks
like, based on how the company is evolving.
Asia-Pacifi c GPs that build stronger talent management capabilities will be better positioned to produce top
returns as the sources of value for PE performance in the region shift.

Asia-Pacifi c Private Equity Report 2018 | Bain & Company, Inc.
Page 34
4. Conclusion
The Asia-Pacifi c PE market crossed several key milestones in 2017: the highest deal value ever, peak exit activity,
the largest Asia-Pacifi c-focused PE fund ever and a record share of the global buyout market. Four years of
successful investment cycles and positive cash fl ow have given investors confi dence in the strength and reli-
ability of the market. Those changes signal a maturing market and the start of a new era—one in which private
equity is of increasing importance to the region’s economy.
However, PE funds focused on the region face several new challenges, including an accelerating shift in the
sources of value. To continue producing solid returns, GPs will need to add new capabilities. Digital competence,
commercial excellence and talent assessment are some of the critical skills that winning funds already have
started to develop. Four questions can help GPs assess whether they are positioned to win in a changing market,
and where they may still need to build muscle.
• Have you begun to take advantage of shifting sources of profi ts in the private equity market, including
greater emphasis on organic growth?
• Do you analyze and recommend changes to portfolio companies’ go-to-market model?
• Does your fund have a repeatable model to help portfolio companies make the most of digital technologies?
• How robust is your fi rm’s assessment of management talent at target and portfolio companies?
The pace of change for most industries will be rapid in 2018 and beyond, as companies grapple with ongoing
technological shifts and market disruption. But that setting also creates new opportunities for GPs to distin-
guish themselves from the competition and deliver superior returns. Those who help their portfolio companies
develop new sources of value will be tomorrow’s leaders.
1 The total value of the transaction, which is under regulatory review, was $17.9 billion, with private equity investors contributing $14.7 billion.
2 Total buyout value for the Asia-Pacifi c region was $83 billion if the calculations also included add-on deals, which involve assets that are then added to existing platform companies.

Asia-Pacific Private Equity Report 2018 | Bain & Company, Inc.
Page 35
Market defi nition
The Asia-Pacifi c private equity market as defi ned for this report
Includes
• Investments and exits with announced values of more than $10 million
• Investments and exits completed in the Asia-Pacifi c region: Greater China (China, Taiwan and Hong Kong), India, Japan, South Korea, Australia, New Zealand, Southeast Asia (Singapore, Indonesia, Malaysia, Thailand, Vietnam, the Philippines, Laos, Cambodia, Brunei and Myanmar) and other countries in the region
• Investments that have closed and those at the agreement-in-principle or defi nitive agreement stage
Excludes
• Franchise funding, seed and R&D deals
• Any non-PE, non-VC deals (e.g., M&A, consolidations)
• Real estate and infrastructure (e.g., airport, railroad, highway and street construction; heavy construction; ports and containers; and other transport infrastructure)

Copyright © 2018 Bain & Company, Inc. All rights reserved.
This work is based on secondary market research, analysis of fi nancial information available or provided to Bain & Company and a range of interviews with industry participants. Bain & Company has not independently verifi ed any such information provided or available to Bain and makes no representation or warranty, express or implied, that such information is accurate or complete. Projected market and fi nancial information, analyses and conclusions contained herein are based on the information described above and on Bain & Company’s judgment, and should not be construed as defi nitive forecasts or guarantees of future performance or results. The information and analysis herein does not constitute advice of any kind, is not intended to be used for investment purposes, and neither Bain & Company nor any of its subsidiaries or their respective offi cers, directors, shareholders, employees or agents accept any responsibility or liability with respect to the use of or reliance on any information or analysis contained in this document. Bain & Company does not endorse, and nothing herein should be construed as a recommendation to invest in, any fund described in this report. This work is copyright Bain & Company and may not be published, transmitted, broadcast, copied, reproduced or reprinted in whole or in part without the explicit written permission of Bain & Company.
Key contacts in Bain’s Global Private Equity practice
Global Hugh MacArthur ([email protected])
Asia-Pacifi c Suvir Varma ([email protected]), Andrew Tymms ([email protected]) and Kiki Yang
Australia Andrew Rodd (andrew.rodd @bain.com)
Greater China Kiki Yang ([email protected])
India Arpan Sheth ([email protected])
Japan Jim Verbeeten ([email protected])
South Korea Wonpyo Choi ([email protected])
Southeast Asia Suvir Varma ([email protected])
Europe, Middle East and Africa Graham Elton ([email protected])
Americas Daniel Haas ([email protected])
Reporters and news media Please direct requests to
Nicholas Worley
Tel: +852 2978 8830
Acknowledgments
This report was prepared by Suvir Varma, a Bain & Company partner based in Singapore and senior member of
Bain’s Private Equity practice; Lalit Reddy, a partner based in Bangalore and a member of Bain’s India Private
Equity practice; and a team led by Johanne Dessard, a practice director in Bain’s Private Equity practice.
The authors wish to thank Kiki Yang, Vinit Bhatia, Michael Thorneman, Weiwen Han, Sebastien Lamy, Usman
Akhtar, Arpan Sheth, Wonpyo Choi, Jim Verbeeten, James Viles and Raymond Hass for their contributions; Rahul
Singh, Sindhu Nair and Pallavi Singh for their analytic support and research assistance; and Gail Edmondson for
her editorial support.
We are grateful to Preqin and the Asian Venture Capital Journal (AVCJ) for the valuable data they provided and for
their responsiveness.

For more information, visit www.bain.com
Shared Ambit ion, True Re sults
Bain & Company is the management consulting fi rm that the world’s business leaders come to when they want results.
Bain advises clients on strategy, operations, technology, organization, private equity and mergers and acquisitions. We develop
practical, customized insights that clients act on and transfer skills that make change stick. Founded in 1973, Bain has
55 offi ces in 36 countries, and our deep expertise and client roster cross every industry and economic sector. Our clients have
outperformed the stock market 4 to 1.
What sets us apart
We believe a consulting fi rm should be more than an adviser. So we put ourselves in our clients’ shoes, selling outcomes, not
projects. We align our incentives with our clients’ by linking our fees to their results and collaborate to unlock the full potential
of their business. Our Results Delivery® process builds our clients’ capabilities, and our True North values mean we do the
right thing for our clients, people and communities—always.
Amsterdam • Atlanta • Bangkok • Beijing • Bengaluru • Boston • Brussels • Buenos Aires • Chicago • Copenhagen • Dallas • Doha • Dubai
Düsseldorf • Frankfurt • Helsinki • Hong Kong • Houston • Istanbul • Jakarta • Johannesburg • Kuala Lumpur • Kyiv • Lagos • London
Los Angeles • Madrid • Melbourne • Mexico City • Milan • Moscow • Mumbai • Munich • New Delhi • New York • Oslo • Palo Alto • Paris
Perth • Rio de Janeiro • Riyadh • Rome • San Francisco • Santiago • São Paulo • Seoul • Shanghai • Singapore • Stockholm • Sydney • Tokyo
Toronto • Warsaw • Washington, D.C. • Zurich