Embed Size (px)
Citation preview

arX
iv:a
stro
-ph/
0506
539v
1 2
2 Ju
n 20
05
Mon. Not. R. Astron. Soc. 000, 1–22 (2004) Printed 2 February 2008 (MN LATEX style file v2.2)
The Ages and Metallicities of Galaxies in the Local
Universe
Anna Gallazzi1⋆, Stephane Charlot1,2, Jarle Brinchmann3, Simon D.M. White1,
Christy A. Tremonti41Max-Planck-Institut fur Astrophysik, Karl-Schwarzschild-Str. 1, D-85748 Garching bei Munchen, Germany2Institut d’Astrophysique de Paris, UMR 7095, 98 bis Boulevard Arago, F-75014 Paris, France3Centro de Astrofısica da Universidade do Porto, Rua das Estrelas - 4150-762 Porto, Portugal4Steward Observatory, University of Arizona, 933 North Cherry Avenue, Tucson, AZ 85721
Accepted . Received ; in original form...
ABSTRACT
We derive stellar metallicities, light-weighted ages and stellar masses for a magnitude-limited sample of 175,128 galaxies drawn from the Sloan Digital Sky Survey DataRelease Two (SDSS DR2). We compute median-likelihood estimates of these param-eters using a large library of model spectra at medium-high resolution, covering acomprehensive range of star formation histories. The constraints we derive are set bythe simultaneous fit of five spectral absorption features, which are well reproduced byour population synthesis models. By design, these constraints depend only weakly onthe α/Fe element abundance ratio. Our sample includes galaxies of all types spanningthe full range in star formation activity, from dormant early-type to actively star-forming galaxies. By analysing a subsample of 44,254 high-quality spectra, we showthat, in the mean, galaxies follow a sequence of increasing stellar metallicity, age andstellar mass at increasing 4000 A-break strength. For galaxies of intermediate mass,stronger Balmer absorption at fixed 4000 A-break strength is associated with highermetallicity and younger age. We investigate how stellar metallicity and age depend ontotal galaxy stellar mass. Low-mass galaxies are typically young and metal-poor, mas-sive galaxies old and metal-rich, with a rapid transition between these regimes overthe stellar mass range 3× 10⁹ . M∗ . 3× 10¹⁰M⊙. Both high- and low-concentrationgalaxies follow these relations, but there is a large dispersion in stellar metallicityat fixed stellar mass, especially for low-concentration galaxies of intermediate mass.Despite the large scatter, the relation between stellar metallicity and stellar massis similar to the correlation between gas-phase oxygen abundance and stellar massfor star-forming galaxies. This is confirmed by the good correlation between stellarmetallicity and gas-phase oxygen abundance for galaxies with both measures. Thesubstantial range in stellar metallicity at fixed gas-phase oxygen abundance suggeststhat gas ejection and/or accretion are important factors in galactic chemical evolution.
Key words: galaxies: formation, galaxies: evolution, galaxies: stellar content
1 INTRODUCTION
The ages and metallicities of stellar populations in nearbygalaxies are direct tracers of the star formation and chemicalenrichment histories of the Universe. Clues to the ages andmetallicities of the stars may be inferred from the integratedspectra of galaxies, using ‘stellar population synthesis mod-els’ (Tinsley 1978; Bruzual A. 1983; Bruzual A. & Charlot1993; Bressan et al. 1994; Fioc & Rocca-Volmerange 1997;
⋆ E-mail: [email protected]
Maraston 1998; Vazdekis 1999). Analyses based on thesemodels have been traditionally limited by the difficulty ofderiving independent constraints on the age, star formationhistory, metallicity and dust content of a galaxy. For exam-ple, changes in age, metallicity and attenuation by dust allhave similar effects on the colours and low-resolution spectraof galaxies. This gives rise to well-known ‘near-degeneracies’in the constraints derived on these different parameters.
The expectation is that these degeneracies may bebroken, at least in part, by appealing to refined spec-tral diagnostics which are not sensitive to attenuation by
2 A. Gallazzi et al.
dust and have different sensitivities to age and metallic-ity. Studies in this area have focused on a set of 25 ab-sorption features defined and calibrated in the spectra of460 nearby Galactic stars obtained at Lick Observatory(e.g. Faber 1973; Worthey et al. 1994; Worthey & Ottaviani1997). These studies all pertain to early-type galaxies, be-cause the lack of hot stars in the Lick library does not al-low the spectral interpretation of star-forming galaxies. Theconclusion from these studies is that, for early-type galax-ies, comparisons of the strengths of metallic lines and age-sensitive Balmer lines can break the age-metallicity degener-acy, but only in a relative way: the derived ages and metal-licities appear to depend strongly on the specific choice ofmetal indices (e.g. Kuntschner et al. 2001; Eisenstein et al.2003; Thomas et al. 2004). This is because the Galactic starsused to calibrate the Lick indices have approximately solarmetal abundance ratios at any metallicity, whereas the ra-tio of α-elements to iron is seen to increase from dwarf tomassive early-type galaxies (e.g. Worthey et al. 1992).
A main weakness of the original calibration of Lick in-dices is that it relies on spectra which were not calibratedin flux, and for which the resolution (∼ 9 A FWHM) isthree times lower than achieved by modern spectroscopicgalaxy surveys, such as the Sloan Digital Sky Survey (SDSS;York et al. 2000). Thus, the high-quality spectra from thesesurveys must be degraded to the calibration and resolu-tion of the original Lick spectra for index-strength anal-yses to be performed. The situation has changed recentlywith the development of medium-high resolution (. 3 AFWHM), flux-calibrated population synthesis models in-cluding stars in the full temperature range (Vazdekis 2001;Bruzual & Charlot 2003). These models can be compareddirectly to high-quality observed spectra of both early-typeand late-type galaxies. Several studies have also quantifiedthe sensitivity of stellar absorption features to changes inelement abundance ratios in galaxy spectra (Tantalo et al.1998; Trager et al. 2000; Thomas et al. 2003b). These de-velopments coincide with the advent of large homogeneoussamples of galaxy spectra gathered by modern surveys suchas the SDSS.
This is the first paper of a series in which we combinemodern population synthesis techniques with the statisticalpower of the SDSS to investigate the connection betweenmetallicity, age and stellar mass in nearby galaxies. Here, weuse the medium-high resolution population synthesis codeof Bruzual & Charlot (2003, hereafter BC03) to derive esti-mates of the metallicities, ages and stellar masses of a sampleof ∼ 2 × 10⁵ nearby galaxies from the SDSS Data ReleaseTwo (DR2). We adopt a Bayesian statistical approach andderive full likelihood distributions for these physical param-eters by comparing the observed spectrum of each galaxywith a comprehensive library of model spectra correspond-ing to different star formation histories. The comparison isdriven by the strengths of 5 spectral features selected to de-pend only weakly on the α/Fe ratio, which we measure inthe same way in model and observed spectra.
An important specificity of our work is that we de-rive the above constraints not only for quiescent, early-typegalaxies, but also for late-type, star-forming galaxies, forwhich the contamination of stellar absorption features bynebular emission must be removed. We explore the relation-ships between metallicity, age and stellar mass and the de-
pendence of these relationships on galaxy structure. In acompanion paper, we exploit these results to investigate thephysical origin of the colour-magnitude relation and of therelation between Mg2-index strength and velocity disper-sion for early-type galaxies. The total metal content of thelocal Universe and the distribution of metals as a function ofgalaxy properties will be the subject of a subsequent paper.
The paper is organized as follows. In Section 2 below,we present our sample of SDSS spectra and the models usedto interpret them. We also describe our method for derivingmetallicities, ages and stellar masses from observed galaxyspectra. The results are presented in Section 3, where westudy the dependence of metallicity and age on total stellarmass and the age-metallicity relation as a function of galaxystructure. We also address in that section the influence ofaperture bias on our derived parameters. We summarize andbriefly discuss our results in Section 4.
2 THE APPROACH
In this section, we describe our approach for deriving esti-mates of light-weighted ages and metallicities from the ob-served spectra of SDSS galaxies. These spectra are discussedin Section 2.1, along with the models we use to interpretthem. In Section 2.2, we select a set of spectral absorptionfeatures which we argue should most robustly constrain ageand metallicity. Then, in Section 2.3, we outline the statisti-cal approach we adopt to derive ages and metallicities fromgalaxy spectra. We also highlight the sensitivity of our con-straints on age and metallicity to the observational signal-to-noise ratio (S/N) of the spectra.
2.1 Observed and model spectra
The observed spectra we consider are drawn from the SDSSDR2 (Abazajian et al. 2004). The SDSS is an imaging andspectroscopic survey of the high Galactic latitude sky, whichwill obtain u, g, r, i and z photometry of almost a quarter ofthe sky and spectra of at least 700,000 objects (York et al.2000). The spectra are taken using 3′′-diameter fibres, posi-tioned as close as possible to the centres of the target galax-ies. The flux- and wavelength-calibrated spectra cover therange from 3800 to 9200 A with a resolution of ∼ 1800.Our sample, drawn from the SDSS DR2, includes uniquespectra of 196,673 galaxies with Petrosian r-band magni-tudes in the range 14.5 < r < 17.77 (after correction forforeground Galactic extinction using the extinction mapsof Schlegel et al. 1998). The galaxies span the full range oftypes, from actively star-forming, late-type galaxies to dor-mant, early-type galaxies. The median redshift is 0.13. Amore detailed description of this sample is given in Section3 below.
To interpret these observed spectra in terms of physicalparameters such as age, metallicity and stellar mass, we usethe recent population synthesis models of BC03. These mod-els are based on ‘STELIB’, a newly available library of ob-served stellar spectra assembled by Le Borgne et al. (2003).The models have a spectral resolution of 3 A FWHM acrossthe whole wavelength range from 3200 to 9500 A. They arethus ideally matched to the SDSS spectra.
We note that, to interpret the spectra of star-forming

The Ages and Metallicities of Galaxies in the Local Universe 3
and active galaxies with these models, we must first removethe contamination of the observed spectra by nebular emis-sion lines. This is achieved using the procedure outlinedby Tremonti et al. (2004), which is optimized for use withSDSS galaxy spectra (see also Tremonti 2003). This consistsin performing first a non-negative least-squares fit of theemission-line-free regions of the observed spectrum, using aset of model template spectra broadened to the observedvelocity dispersion (the template spectra correspond to 30instantaneous-burst models of different ages and metallici-ties computed using the BC03 code). Once the fitted spec-trum is subtracted from the observed spectrum, the residu-als can be fitted to Gaussian-broadened emission-line tem-plates. The method assumes a single broadening width forall the Balmer lines, and another (independent) width forall the forbidden lines. The strength of each line is fitted in-dependently. Then, the fitted emission lines are subtractedfrom the original observed spectrum to produce a ‘pure’absorption-line spectrum suited to our analysis.
2.2 Stellar absorption diagnostics of age and
metallicity
The strongest stellar absorption features in the opti-cal spectra of galaxies form the basis of the Lick sys-tem of spectral indices (Burstein et al. 1984; Gorgas et al.1993; Worthey et al. 1994; Worthey & Ottaviani 1997;Trager et al. 1998; see also Section 1). Each index in thissystem is defined by a central ‘feature bandpass’ and twoadjacent ‘pseudo-continuum bandpasses’. The above studieshave shown that some Lick indices are primarily sensitive toage, such as those based on H-Balmer lines, while others areprimarily sensitive to metallicity, such as several Fe- and Mg-based indices at wavelengths between 4500 and 5700 A. Wealso consider here the 4000-A break index of Balogh et al.(1999), which we denote D4000, which is defined as the ra-tio of the average flux densities in the narrow bands 4000–4100 A and 3850–3950 A.1 This index depends somewhaton metallicity but correlates more with the ratio of presentto past-averaged star formation rates in galaxies (see fig. 2of Kauffmann et al. 2003a and fig. 27 of Brinchmann et al.2004).
In previous studies based on models with low spectralresolution, the strengths of Lick indices had to be mod-elled analytically as functions of the effective temperatures,gravities and metallicities of the stars (Worthey et al. 1994;Worthey & Ottaviani 1997; Gorgas et al. 1999). These ‘fit-ting functions’ were not appropriate for hot stars, and hence,index-strength analyses had to be restricted to old stellarpopulations. Moreover, as mentioned in Section 1, the stel-lar spectra on which the Lick indices were originally cali-brated had lower resolution than typical galaxy spectra to-day and were not flux-calibrated. These various weaknessesare resolved here by our adoption of the medium-high res-olution, flux-calibrated BC03 models. These models can becompared directly to the SDSS spectra of galaxies with anystar formation history, and the Lick indices can be measuredin the same way in model and observed spectra.
Like previous models, however, the BC03 models rely on
1 This index is sometimes denoted by Dn(4000).
a spectral library of nearby stars with near solar metal abun-dance ratios at any metallicity. The models are thereforeexpected to show discrepancies when compared to galax-ies where the abundance ratios differ from those of nearbystars.2 In fact, such discrepancies appear to be responsiblefor the fact that some spectral features, such as CN1, CN2,TiO1, TiO2, Ca4227 and several Mg and Fe lines, were notwell reproduced when BC03 compared their models witha sample of high-quality galaxy spectra drawn from SDSSEarly Data Release (Stoughton et al. 2002).
Several studies have addressed the dependence of Lickindex strengths on changes in the relative ratios of heavy el-ements (Gonzalez 1993; Tripicco & Bell 1995; Tantalo et al.1998; Trager et al. 2000; Vazdekis 2001; Thomas et al.2003b; Tantalo & Chiosi 2004; Thomas et al. 2004, see alsoBC03). These studies have led to the identification of com-posite Mg+Fe indices, which are sensitive to metallicity (i.e.the fraction by mass of all elements heavier than helium overthe total gas mass) but show little sensitivity to α/Fe (i.e.the ratio of the total mass of α elements to the mass of iron;see footnote 2). Among these, we use here
[MgFe]′ =√
Mgb (0.72 Fe5270 + 0.28 Fe5335), (1)
as proposed by Thomas et al. 2003b, and
[Mg2Fe] = 0.6 Mg2 + 0.4 log(Fe4531 + Fe5015), (2)
as defined in BC03.We wish to extract ages and metallicities from the SDSS
galaxy spectra. We therefore fit simultaneously both metal-sensitive and age-sensitive indices. Among the 28 spectralindices studied by BC03, we concentrate on those that arebest reproduced by the models. This requirement alreadyexcludes several Fe-based indices, the three Mg-based in-dices, Ca4227, Ca4455, the CN, TiO and NaD features (seefig. 18 of BC03). Among the remaining indices we identifythose that are known to have at most a weak dependenceon α/Fe. [Mg2Fe] and [MgFe]′ are suitable metal-sensitiveindices and Hβ is a suitable age-sensitive index. We also in-clude D4000, which is sensitive to the ratio of present topast-averaged star formation rate (see above). We are notaware of any study indicating the dependence of this indexon α/Fe. Finally, to better constrain age we decided to in-clude also the two higher-order Balmer lines, HδA and HγA.These indices have been recently shown to depend on varia-tions in element abundance ratios at metallicities around so-lar and above (Thomas et al. 2004; Korn et al. 2005). How-ever, we find that including them in our procedure does notproduce results systematically different from those obtainedwithout them, while it provides smaller errors on both ageand metallicity estimates. Therefore, we decide to use alsoHδA+HγA. We choose the sum of HδA and HγA becauseit is better reproduced by the models than the two indicesseparately (see fig. 18 of BC03). Thus, our final set of in-dices is composed of D4000, Hβ, HδA+HγA, [Mg2Fe] and
2 The abundance ratio of α elements (such as N, O, Mg, Ca,Na, Ne, S, Si, Ti), which are produced mainly by Type II super-novae, to Fe-peak elements (such as Cr, Mn, Fe, Co, Ni, Cu, Zn),which are produced mainly by Type Ia supernovae, is observed tovary in external galaxies (e.g., Worthey et al. 1992; Thomas et al.2003a).
4 A. Gallazzi et al.
[MgFe]′. This is the minimum set that allows us to derivegood constraints on metallicity and age simultaneously andto recover well the parameters of simulated galaxies (see sec-tion 2.4 below).
The solid histograms in Fig. 1 show the distributionsin ‘resolving power’ of these five spectral features for thegalaxies in our sample. The resolving power is defined asthe ratio between the 5–95 percent percentile range of thedistribution of index strengths for all galaxies in the sam-ple, ∆I , and the observational error for each galaxy, σI .The resolving power is largest (∼ 30) for D4000 and slightlylower (∼ 10) for the other indices. Also shown as dotted his-tograms in Fig. 1 are the analogous distributions in resolvingpower for a subsample of galaxies with mean signal-to-noiseper pixel greater than 20. As expected, the distributions forthese galaxies are shifted to higher values, because of thesmaller observational errors.
We note that the strengths of some spectral absorp-tion indices are sensitive to the stellar velocity dispersionin a galaxy (e.g. Davies et al. 1993; Longhetti et al. 1998;Trager et al. 1998; Kuntschner 2004). The indices that aremost affected are those measured with the narrowest pseudo-continuum bandpass definitions. In particular this effect isseen in Fe-based indices and therefore also in the compos-ite Mg+Fe indices. The BC03 population synthesis codeprovides SSP spectra broadened to different velocity dis-persions. This allows us to compare each galaxy spectrawith models that have a similar velocity dispersion (see Sec-tion 2.3).
2.3 Statistical estimates of age and metallicity
We wish to estimate not only the most likely values ofthe ages and metallicities of SDSS galaxies, but also theaccuracy of these values. To this purpose, we adopt aBayesian statistical approach, similar to the one outlinedby Kauffmann et al. (2003a). The goal is to obtain the like-lihood distribution of a given parameter X in the space of allpossible values of X. This is obtained by comparing the ob-servational data with a set of models that populate the spaceof all possible X according to a prior distribution which rep-resents our prejudice about the relative likelihood of differ-ent X values in absence of any data.
We generate a library of 150,000 Monte Carlo realiza-tions of a full range of physically plausible star formation his-tories. Following Kauffmann et al. (2003a), each star forma-tion history is parametrized in terms of a continuous modelin which stars are formed from the time tform to the presentaccording to the law ψ(t) ∝ exp(−γt). Random bursts ofstar formation are superposed on this continuous model. Wetake the formation time tform to be uniformly distributedbetween 13.5 and 1.5 Gyr and the star formation time-scaleparameter γ to be uniform over the interval from 0 to 1Gyr−1. The bursts can occur at all times after tform withequal probability, set in such a way that 10 percent of thegalaxies in the library experience a burst in the last 2 Gyr.3
3 In Kauffmann et al. (2003a) this parameter was set such that50 percent of the models in the library experienced a burst inthe last 2 Gyr. We reduce this fraction to 10 percent becauseit provides a more uniform distribution of the models in light-
They are parametrized in terms of the fraction A of stellarmass produced during the burst relative to the total massformed by the continuous model. The ratio A is logarithmi-cally distributed between 0.03 and 4. During a burst, starsform at a constant rate for a time distributed uniformlyin the range 3 × 10⁷–3 × 10⁸ yr. The velocity dispersionsof the models are distributed uniformly in the range 50–350 km s−1. We further take the models to be distributedlogarithmically in metallicity in the range 0.2–2.5Z⊙ andmake the density of models drop smoothly as (logZ)1/3 atmetallicities from 0.2 down to 0.02Z⊙, in order not to over-represent extremely metal-poor models. All stars in a givenmodel have the same fixed metallicity, which we interpret asthe ‘(optical) light-weighted’ metallicity.
For each model in the library we compute the followingproperties:
(i) the strengths of the D4000, Hβ, HδA+HγA, [Mg2Fe]and [MgFe]′ spectral indices, measured in the same way asin the SDSS spectra;
(ii) the r-band light-weighted age, evaluated by the in-tegral tr =
∫ t
0[dτ ψ(t− τ ) fr(τ ) τ ] /
∫ t
0[dτ ψ(t− τ ) fr(τ )],
where fr(τ ) is the total r-band flux produced by stars ofage τ . We refer below to the r-band light-weighted age sim-ply as the ‘age’ of a galaxy;
(iii) the z-band stellar mass-to-light ratio M∗/Lz, whichaccounts for the gas mass returned to the ISM by evolvedstars (see also section 3.1 of BC03);
(iv) the apparent u, g, r, i and z magnitudes of the modelat redshifts between 0 and 0.3 in steps of 0.01.
The models in the library provide accurate simultane-ous fits to the strengths of the 5 spectral indices D4000,Hβ, HδA+HγA, [Mg2Fe] and [MgFe]′ that we have selectedto derive age and metallicity estimates from SDSS galaxyspectra. To illustrate this, Fig. 2 shows the distribution ofthe differences between the best-fit and observed strengths ofeach index, in units of the observational error, for the galax-ies in our sample. Because of the dependence of the com-posite Mg+Fe indices on stellar velocity dispersion, whenfitting the index strengths of an observed galaxy, we onlyinclude those models for which the stellar velocity disper-sion is within ±15 km s−1 of the observed one.4 The plainhistograms in Fig. 2 show the distributions for the sampleas a whole, while the hatched histograms show the distribu-tions for those galaxies with a median S/N per pixel greaterthan 20. For both samples, the deviations between observa-tions and best-fit models are within the observational errorsfor all indices, as indicated by the comparison with a Gaus-sian distribution of unit standard deviation (dotted line).There is no strong correlation between the residuals of thedifferent indices.
The comparison of the strengths of D4000, Hβ,HδA+HγA, [Mg2Fe] and [MgFe]′ in the spectrum of an ob-served SDSS galaxy with the strengths of these indices in ev-ery model spectrum in the library allows us to construct theprobability density functions (PDFs) of physical parameters
weighted age. The influence on our results from changing thisfraction is discussed in Section 2.4.2.4 The median uncertainty on velocity dispersion is ∼ 15 km s−1
for the full sample and only ∼ 7 kms−1 for galaxies with S/N>20.

The Ages and Metallicities of Galaxies in the Local Universe 5
Figure 1. Distributions in ‘resolving power’ of the 5 spectral features selected to constrain the ages and metallicities of SDSS galaxies,as indicated. The resolving power is defined as the ratio between the 5%–95% percentile range ∆I of index strengths in the sample andthe observational error σI of each galaxy. In each panel, the solid histogram shows the distribution for our sample of 196,673 SDSS-DR2galaxies, and the dotted histogram the distribution for the subsample of 44,347 galaxies with mean signal-to-noise per pixel greater than20.
Figure 2. Simultaneous fit of the 5 spectral features chosen to derive age and metallicity estimates from SDSS galaxy spectra using themodel library described in Section 2.3. The histograms show the distributions of the differences between the best-fit (Ifit) and observed(Iobs) strengths of each index (as indicated), in units of the observational error (σI ). The plain histograms are for the full sample of196,673 galaxies, while the hatched histograms are for the subsample of 44,347 galaxies with mean S/N per pixel greater than 20. Onlythose models for which the stellar velocity dispersion is within ±15 km s−1 of the observed one are included in the fit for each galaxy.For reference, the dotted line in each panel shows a Gaussian distribution with unit standard deviation.
(such as age, metallicity and mass-to-light ratio) for thatgalaxy. This is achieved by assigning to each model a weightw = exp(−χ2/2), where χ2 is calculated by comparing thestrengths of the 5 indices measured in the observed spec-trum with those measured in the model spectrum, given theobservational measurement errors. The PDF of a selectedphysical parameter is then simply given by the distributionin that parameter of the weights w of all the models in thelibrary.
The PDF of a given parameter can then be character-ized by its mode, which corresponds to the most likely valueof the parameter, its median, which can differ from the modefor non-symmetric distributions, and by a confidence inter-val within which the parameter is constrained at a certain
probability level. We often quote below the 68 percent con-fidence interval corresponding to the 16%–84% percentilerange of the PDF, which would be equivalent to the ±1σrange for a Gaussian distribution.
2.4 Accuracy of the estimates
2.4.1 Dependence on observational properties
We now want to illustrate the kind of constraints that canbe obtained on the ages and metallicities of SDSS galaxieswith different spectral properties using the method outlinedabove. Kauffmann et al. (2003a) have shown that the com-bination of H-Balmer lines and D4000 is a discriminatingdiagnostic of the recent star formation activity in galaxies.
6 A. Gallazzi et al.
We therefore draw 4 galaxies from our sample with high-quality spectra (median S/N per pixel larger than 30) lo-cated at different positions along the sequence occupied bySDSS galaxies in the HδA+HγA versus D4000 diagnostic di-agram.
The solid distributions in Fig. 3 show the constraints ob-tained on the metallicities (left-hand plot) and ages (right-hand plot) of these galaxies in two cases: when includingonly the age-sensitive indices D4000, Hβ and HδA+HγA toconstrain the fits (bottom panels), and when including alsothe metal-sensitive indices [Mg2Fe] and [MgFe]′ (top pan-els). As expected, the ages are well constrained by D4000,Hβ and HδA+HγA alone, and the corresponding PDFs donot change appreciably when including also the constraintsfrom metal-sensitive indices. In contrast, the metallicitiesare well constrained only when the metal-sensitive indicesare included in the fit. In each panel in Fig. 3, the arrowsindicate the median (longer one) and the 16th and 84th per-centiles (shorter ones) of the PDF. The 68 percent confi-dence interval becomes narrower when all the five indicesare included, and the median of the distribution in this caseis consistent with that obtained when including only theage-sensitive indices. We note that age and metallicity ap-pear to correlate with D4000 (indicated on the figure) forthese 4 galaxies, and that the constraints on metallicity areweakest for the galaxy with the lowest D4000. This is not acoincidence, as we shall see in Section 3 below.
It is important to note that the observed S/N directlyinfluences the uncertainties in the age and metallicity esti-mates. To investigate this, we consider a set of galaxies withindex strengths similar to those of the galaxies in Fig. 3, butwith lower median S/N per pixel, e.g. 20. We take the aver-age errors in the index strengths of these low-S/N galaxiesto be typical of errors that would be measured at the sameS/N for the galaxies in Fig. 3. We then mimic 100 real-izations of ‘degraded spectra’ of the high-S/N galaxies byrandomly drawing index strengths from Gaussian distribu-tions centered on their index values, of widths the typicalerrors obtained from the lower-S/N galaxies. The PDFs ofage and metallicity may be computed for each realization,and the average PDF of the 100 realizations is a good esti-mator of the results that would be obtained at low S/N forthese galaxies.
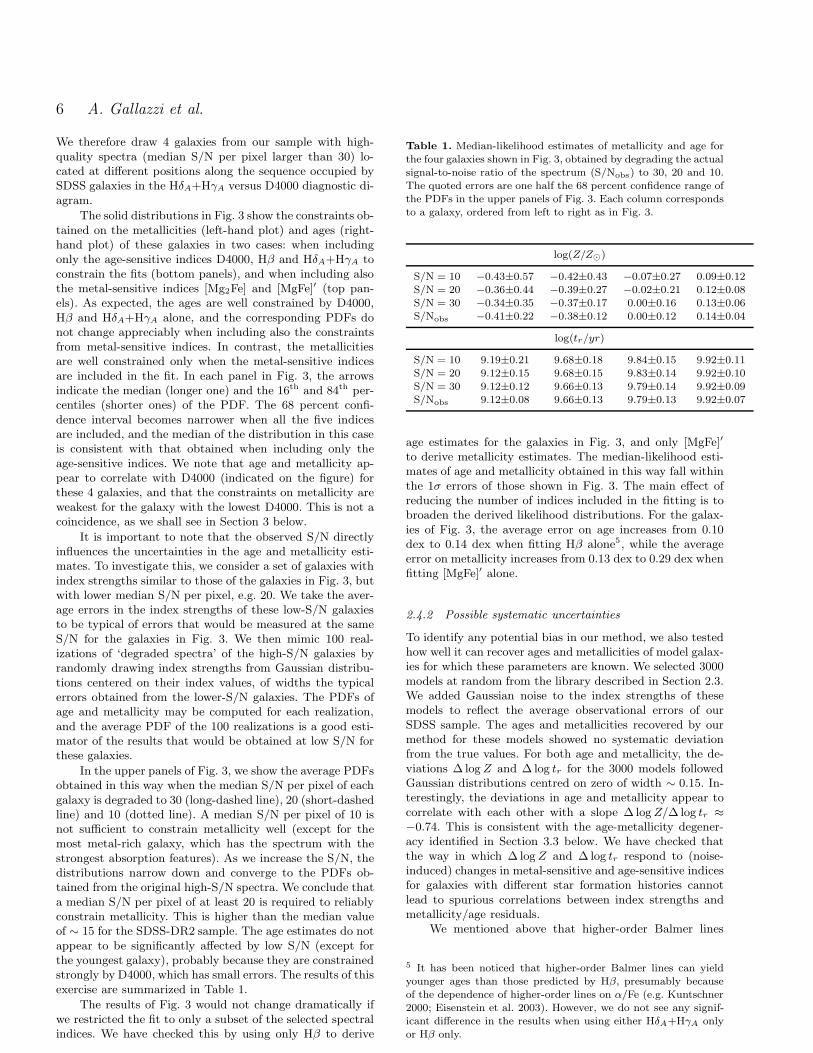
In the upper panels of Fig. 3, we show the average PDFsobtained in this way when the median S/N per pixel of eachgalaxy is degraded to 30 (long-dashed line), 20 (short-dashedline) and 10 (dotted line). A median S/N per pixel of 10 isnot sufficient to constrain metallicity well (except for themost metal-rich galaxy, which has the spectrum with thestrongest absorption features). As we increase the S/N, thedistributions narrow down and converge to the PDFs ob-tained from the original high-S/N spectra. We conclude thata median S/N per pixel of at least 20 is required to reliablyconstrain metallicity. This is higher than the median valueof ∼ 15 for the SDSS-DR2 sample. The age estimates do notappear to be significantly affected by low S/N (except forthe youngest galaxy), probably because they are constrainedstrongly by D4000, which has small errors. The results of thisexercise are summarized in Table 1.
The results of Fig. 3 would not change dramatically ifwe restricted the fit to only a subset of the selected spectralindices. We have checked this by using only Hβ to derive
Table 1. Median-likelihood estimates of metallicity and age forthe four galaxies shown in Fig. 3, obtained by degrading the actualsignal-to-noise ratio of the spectrum (S/Nobs) to 30, 20 and 10.The quoted errors are one half the 68 percent confidence range ofthe PDFs in the upper panels of Fig. 3. Each column correspondsto a galaxy, ordered from left to right as in Fig. 3.
log(Z/Z⊙)
S/N = 10 −0.43±0.57 −0.42±0.43 −0.07±0.27 0.09±0.12S/N = 20 −0.36±0.44 −0.39±0.27 −0.02±0.21 0.12±0.08S/N = 30 −0.34±0.35 −0.37±0.17 0.00±0.16 0.13±0.06S/Nobs −0.41±0.22 −0.38±0.12 0.00±0.12 0.14±0.04
log(tr/yr)
S/N = 10 9.19±0.21 9.68±0.18 9.84±0.15 9.92±0.11S/N = 20 9.12±0.15 9.68±0.15 9.83±0.14 9.92±0.10S/N = 30 9.12±0.12 9.66±0.13 9.79±0.14 9.92±0.09S/Nobs 9.12±0.08 9.66±0.13 9.79±0.13 9.92±0.07
age estimates for the galaxies in Fig. 3, and only [MgFe]′
to derive metallicity estimates. The median-likelihood esti-mates of age and metallicity obtained in this way fall withinthe 1σ errors of those shown in Fig. 3. The main effect ofreducing the number of indices included in the fitting is tobroaden the derived likelihood distributions. For the galax-ies of Fig. 3, the average error on age increases from 0.10dex to 0.14 dex when fitting Hβ alone5, while the averageerror on metallicity increases from 0.13 dex to 0.29 dex whenfitting [MgFe]′ alone.
2.4.2 Possible systematic uncertainties
To identify any potential bias in our method, we also testedhow well it can recover ages and metallicities of model galax-ies for which these parameters are known. We selected 3000models at random from the library described in Section 2.3.We added Gaussian noise to the index strengths of thesemodels to reflect the average observational errors of ourSDSS sample. The ages and metallicities recovered by ourmethod for these models showed no systematic deviationfrom the true values. For both age and metallicity, the de-viations ∆ logZ and ∆ log tr for the 3000 models followedGaussian distributions centred on zero of width ∼ 0.15. In-terestingly, the deviations in age and metallicity appear tocorrelate with each other with a slope ∆ logZ/∆ log tr ≈
−0.74. This is consistent with the age-metallicity degener-acy identified in Section 3.3 below. We have checked thatthe way in which ∆ logZ and ∆ log tr respond to (noise-induced) changes in metal-sensitive and age-sensitive indicesfor galaxies with different star formation histories cannotlead to spurious correlations between index strengths andmetallicity/age residuals.
We mentioned above that higher-order Balmer lines
5 It has been noticed that higher-order Balmer lines can yieldyounger ages than those predicted by Hβ, presumably becauseof the dependence of higher-order lines on α/Fe (e.g. Kuntschner2000; Eisenstein et al. 2003). However, we do not see any signif-icant difference in the results when using either HδA+HγA onlyor Hβ only.

The Ages and Metallicities of Galaxies in the Local Universe 7
Figure 3. Probability density functions of stellar metallicity (left-hand plot) and r-band light-weighted age (right-hand plot) for 4 SDSSgalaxies with high-quality spectra (median S/N per pixel larger than 30) and different D4000 and HδA+HγA strengths (indicated in thebottom panels of the left-hand plot). The solid PDFs in the bottom panels were obtained when including only the age-sensitive indicesD4000, Hβ and HδA+HγA to constrain the fits. Those in the top panels were obtained after including also the metal-sensitive indices[Mg2Fe] and [MgFe]′. In each panel, the arrows indicate the median (longer one) and the 16th and 84th percentiles (shorter ones) of
the PDF. The long-dashed, short-dashed and dotted PDFs in the top panels show the constraints obtained when degrading the originalgalaxy spectra to a median S/N per pixel of 30, 20 and 10, respectively (see text for detail).
may be sensitive to the α/Fe ratio. To quantify the potentialerror on our metallicity and age estimates for galaxies withenhanced α/Fe relative to solar, we compared the predic-tions of the Thomas et al. (2004) stellar populations modelsat solar element abundance ratio, α/Fe = 0, with those forα/Fe = 0.3 (a typical ratio for massive elliptical galaxies).We chose 3000 models at random from our library and per-turbed their index strengths with Gaussian noise, as above.In addition, we increased the values of HδA and HγA to re-flect the difference between the α/Fe = 0 and α/Fe = 0.3tracks, interpolating in metallicity and age to the valuesfor each model considered. The distributions in ∆ logZ and∆ log tr are well represented by Gaussian centred on +0.05and −0.05, respectively, of width given by the average erroron metallicity and age (0.2 and 0.13 respectively). This testindicates that we tend to overestimate the stellar metallic-ities and underestimate the light-weighted ages of galaxieswith supersolar abundance ratios by ∼ 0.05 dex. However,this seems in contradiction with the fact that the resultson the galaxies in our sample do not vary systematicallyif we include or exclude HδA+HγA in the fit. This is truealso for massive early-type galaxies, which are likely to beα-enhanced (e.g. Worthey et al. 1992). The offset of ∼ 0.05dex may thus be regarded as an upper limit to the error inthe ages and metallicities derived from our analysis in thecase of non-solar abundance ratios.
Another possible source of systematic error is the choiceof prior according to which our model library populates theparameter space. In particular, the mix of continuous andbursty star formation histories may influence the physicalparameters in which we are interested, mainly the light-weighted age. To test for this effect, we generated a Monte
Carlo library with a modified prior, by increasing to 50 per-cent (instead of 10 percent) the fraction of models that canundergo a burst of star formation in the last 2 Gyrs. Wethen compared the (median-likelihood) estimates of light-weighted age and stellar metallicity derived with this mod-ified prior and with our standard prior. Increasing the frac-tion of bursts, we derive ages ∼0.07 dex younger, on aver-age, than those derived with our standard prior. This biasmainly affects old, early-type galaxies. Similarly the metal-licities are on average 0.04 dex higher than those derivedwith the standard prior. The effect of these offsets on therelations between age, metallicity and stellar mass that wediscuss in Section 3.2 is very small. The zeropoint of therelations changes according to the offsets in metallicity andage reported above, but the shape of the relations remainsidentical.
2.4.3 Stellar mass estimates
In the remainder of this paper, we will be interested in thedependence of age and metallicity not only on directly ob-served properties, such as spectral features and morphol-ogy, but also on ‘derived’ quantities, such as stellar mass.Kauffmann et al. (2003a) derived Bayesian likelihood esti-mates of the stellar masses of a sample of SDSS galaxies,based on fits of the HδA and D4000 absorption indices. Weuse a similar approach here and estimate stellar masses forall the galaxies in our sample, based on the fits of D4000,Hβ, HδA+HγA, [Mg2Fe] and [MgFe]′. We compute the PDFof the stellar mass for each galaxy by scaling the z-bandmass-to-light ratio M∗/Lz of each model to the observed,

8 A. Gallazzi et al.
total z-band luminosity of the galaxy.6 We compute M∗/Lz
at the observed galaxy redshift and include the effects ofattenuation by dust. The z-band attenuation Az is inferredfrom the difference between the emission-line corrected fi-bre r − i colour7 of the galaxy and the r − i colour of theredshifted (dust-free) model, assuming a single power law(∝ λ−0.7) attenuation curve (Charlot & Fall 2000).
The true attenuation can of course not be negative,but imposing strictly Az > 0 would not account for the er-rors affecting the measurements of indices and magnitudes.Moreover, at high metallicities, there is a potential prob-lem that the dust-free models providing the best fits to theobserved absorption-line strengths can be redder than theobserved galaxy (implying negative apparent attenuations).This problem arises because of a discrepancy between thespectral absorption features and the integrated colours ofthe BC03 models at the metallicity 2.5Z⊙. The colours ofthese models correspond to stellar evolutionary tracks with(and colour-temperature calibrations for) Z = 2.5Z⊙, butthe absorption-line strengths had to be calibrated using stel-lar spectra for slightly lower metallicity, 1.6 . Z/Z⊙ . 2 (seeAppendix A of BC03). Hence, the metallicity scale, which islinked to the evolutionary tracks and colours, may be biasedhigh at supra-solar metallicities. This problem affects mainlythe most metal-rich, early-type galaxies. To account for thisbias, we include models producing dust attenuations downto Az = −0.1 when computing the PDFs of stellar mass,stellar metallicity and age.8
A comparison of our stellar mass estimates with thosederived by Kauffmann et al. (2003a, which were based ona preliminary version of the BC03 models and an early cal-ibration of the SDSS spectra) for the galaxies in commonbetween the two samples shows overall consistency, with ascatter of ∼ 0.16 dex. Our stellar mass estimates tend to besystematically larger than theirs by ∼ 0.1 dex. A differenceof almost +0.04 dex can be attributed to the different priorused to generate the Monte Carlo library. The remainingoffset is likely to originate from their exclusion of all modelswith r−i colour redder than that observed, while we includemodels which imply Az ‘attenuations’ down to −0.1.
3 THE AGES AND METALLICITIES OF
NEARBY GALAXIES
We now use the models described in Section 2 to estimateages and metallicities for a sample of 196,673 galaxies drawnfrom the SDSS-DR2 (Abazajian et al. 2004, see also Sec-tion 2.1 above). Fig. 4 shows the distributions in median
6 We assume that the M∗/Lz ratio is the same for the wholegalaxy as it is in the region sampled by the fibre. See Fig. 13 forthe typical fraction of light that enters the fibre.7 Fibre magnitudes are obtained using the SDSS photometry di-rectly out to the radius covered by the fibre. They are thus directlycomparable to quantites derived from spectroscopy, provided thatthe fibre is positioned at the centre of the galaxy. Corrections foremission lines are obtained by comparing the magnitudes mea-sured off the spectrum before and after removing emission lines.8 The difference in r−i colour between two old stellar populationsof metallicities 2.5 Z⊙ and 2 Z⊙, when interpreted as a colourexcess, corresponds to a z-band attenuation Az ∼ 0.1.
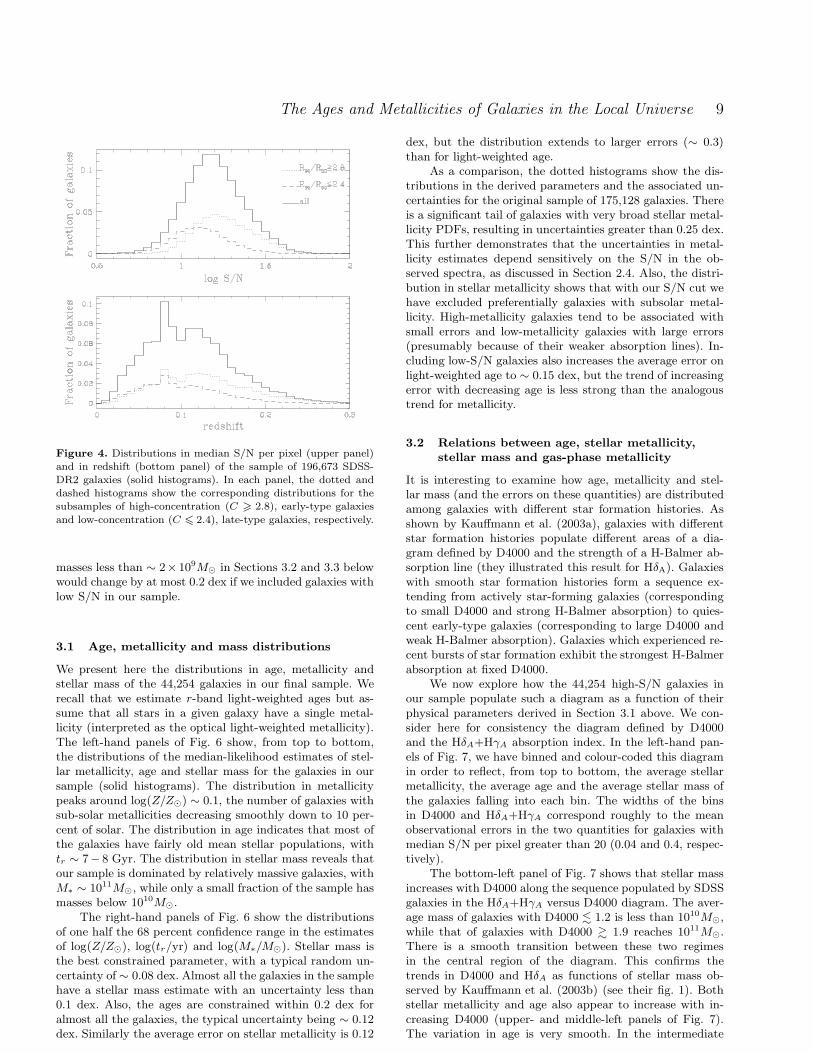
S/N per pixel (upper panel) and in redshift (lower panel) ofthis sample. Although the distribution in redshift extendsup to 0.3, in what follows we discuss results only for galax-ies in the redshift range 0.005 < z 6 0.22. The lower limitis intended to avoid redshifts for which deviations from theHubble flow can be substantial, but still allows us to includegalaxies at very low luminosity (corresponding roughly to alower mass limit of ∼ 108M⊙). The upper limit correspondsroughly to the redshift at which a typical 1011M⊙ galaxy isdetected with median S/N per pixel greater than 20. Thesecuts leave us with 175,128 galaxies.
In some applications below, it will be useful to distin-guish between different morphological types of galaxies. Thiscan be achieved on the basis of the ‘concentration param-eter’ C = R90/R50, defined as the ratio of the radii en-closing 90 and 50 percent of the Petrosian r-band luminos-ity of a galaxy. Strateva et al. (2001) and Shimasaku et al.(2001) have shown that the concentration parameter al-lows a rough classification into galaxy morphological types.Strateva et al. (2001) propose a cut at C = 2.6 to sepa-rate early- from late-type galaxies. To limit the contamina-tion between the two types, here we define those galaxieswith C > 2.8 to be ‘early-type’ and those galaxies withC 6 2.4 to be ‘late-type’. The dotted and dashed lines inFig. 4 show separately the distributions in median S/N perpixel and in redshift of the resulting subsamples of early-and late-type galaxies, respectively. Early-type galaxies gen-erally have a higher median S/N per pixel and are detectedout to higher redshifts than late-type galaxies, as expectedfrom their higher surface brightnesses.
We have shown in Section 2.4.1 and Fig. 3 the im-pact of the signal-to-noise ratio on our ability to derivereliable constraints on age and, especially, metallicity. Inthe remainder of this paper we focus on the subsample of44,254 galaxies with median S/N per pixel greater than 20,for which the constraints on metallicity are the most ac-curate. The properties of these high-S/N galaxies are sum-marized in Fig. 5 where we show their distribution (shadedhistogram) in z-band surface brightness (averaged withinthe Petrosian R50 radius), Petrosian r-band absolute mag-nitude, redshift and D4000, compared to the distributionsfor the original sample (dot-dashed line). The red and bluelines distinguish early-type from late-type (high-S/N) galax-ies. The S/N requirement excludes about 75 percent of oursample. As can be seen from Fig. 5, this biases the sampletoward higher-surface brightness, more concentrated, lower-redshift galaxies. There is not a bias instead in the lumi-nosity distribution. In the redshift range 0.005 < z 6 0.22,high-S/N galaxies typically have z-band surface brightnessesbrighter than 21 mag arcsec−2. They lie primarily at red-shifts less than 0.15, where they account for about 40 per-cent of the galaxies. They also represent roughly 40 percentof the high-concentration sample but only 10 percent of thelow-concentration sample. Similarly, they constitute about30 percent of the galaxies with D4000 > 1.6 and 15 percentof those with D4000 < 1.6. Our selection in S/N thereforeexcludes a substantial fraction of diffuse systems, with po-tentially subsolar metallicities. We will turn our attention tothese systems in the third paper of this series. Their omis-sion here does not alter significantly the results presentedin the next sections. In particular, we have checked that themedian ages and metallicities found for galaxies with stellar
The Ages and Metallicities of Galaxies in the Local Universe 9
Figure 4. Distributions in median S/N per pixel (upper panel)and in redshift (bottom panel) of the sample of 196,673 SDSS-DR2 galaxies (solid histograms). In each panel, the dotted anddashed histograms show the corresponding distributions for thesubsamples of high-concentration (C > 2.8), early-type galaxies
and low-concentration (C 6 2.4), late-type galaxies, respectively.
masses less than ∼ 2× 10⁹M⊙ in Sections 3.2 and 3.3 belowwould change by at most 0.2 dex if we included galaxies withlow S/N in our sample.
3.1 Age, metallicity and mass distributions
We present here the distributions in age, metallicity andstellar mass of the 44,254 galaxies in our final sample. Werecall that we estimate r-band light-weighted ages but as-sume that all stars in a given galaxy have a single metal-licity (interpreted as the optical light-weighted metallicity).The left-hand panels of Fig. 6 show, from top to bottom,the distributions of the median-likelihood estimates of stel-lar metallicity, age and stellar mass for the galaxies in oursample (solid histograms). The distribution in metallicitypeaks around log(Z/Z⊙) ∼ 0.1, the number of galaxies withsub-solar metallicities decreasing smoothly down to 10 per-cent of solar. The distribution in age indicates that most ofthe galaxies have fairly old mean stellar populations, withtr ∼ 7− 8 Gyr. The distribution in stellar mass reveals thatour sample is dominated by relatively massive galaxies, withM∗ ∼ 1011M⊙, while only a small fraction of the sample hasmasses below 1010M⊙.
The right-hand panels of Fig. 6 show the distributionsof one half the 68 percent confidence range in the estimatesof log(Z/Z⊙), log(tr/yr) and log(M∗/M⊙). Stellar mass isthe best constrained parameter, with a typical random un-certainty of ∼ 0.08 dex. Almost all the galaxies in the samplehave a stellar mass estimate with an uncertainty less than0.1 dex. Also, the ages are constrained within 0.2 dex foralmost all the galaxies, the typical uncertainty being ∼ 0.12dex. Similarly the average error on stellar metallicity is 0.12
dex, but the distribution extends to larger errors (∼ 0.3)than for light-weighted age.
As a comparison, the dotted histograms show the dis-tributions in the derived parameters and the associated un-certainties for the original sample of 175,128 galaxies. Thereis a significant tail of galaxies with very broad stellar metal-licity PDFs, resulting in uncertainties greater than 0.25 dex.This further demonstrates that the uncertainties in metal-licity estimates depend sensitively on the S/N in the ob-served spectra, as discussed in Section 2.4. Also, the distri-bution in stellar metallicity shows that with our S/N cut wehave excluded preferentially galaxies with subsolar metal-licity. High-metallicity galaxies tend to be associated withsmall errors and low-metallicity galaxies with large errors(presumably because of their weaker absorption lines). In-cluding low-S/N galaxies also increases the average error onlight-weighted age to ∼ 0.15 dex, but the trend of increasingerror with decreasing age is less strong than the analogoustrend for metallicity.
3.2 Relations between age, stellar metallicity,
stellar mass and gas-phase metallicity
It is interesting to examine how age, metallicity and stel-lar mass (and the errors on these quantities) are distributedamong galaxies with different star formation histories. Asshown by Kauffmann et al. (2003a), galaxies with differentstar formation histories populate different areas of a dia-gram defined by D4000 and the strength of a H-Balmer ab-sorption line (they illustrated this result for HδA). Galaxieswith smooth star formation histories form a sequence ex-tending from actively star-forming galaxies (correspondingto small D4000 and strong H-Balmer absorption) to quies-cent early-type galaxies (corresponding to large D4000 andweak H-Balmer absorption). Galaxies which experienced re-cent bursts of star formation exhibit the strongest H-Balmerabsorption at fixed D4000.
We now explore how the 44,254 high-S/N galaxies inour sample populate such a diagram as a function of theirphysical parameters derived in Section 3.1 above. We con-sider here for consistency the diagram defined by D4000and the HδA+HγA absorption index. In the left-hand pan-els of Fig. 7, we have binned and colour-coded this diagramin order to reflect, from top to bottom, the average stellarmetallicity, the average age and the average stellar mass ofthe galaxies falling into each bin. The widths of the binsin D4000 and HδA+HγA correspond roughly to the meanobservational errors in the two quantities for galaxies withmedian S/N per pixel greater than 20 (0.04 and 0.4, respec-tively).
The bottom-left panel of Fig. 7 shows that stellar massincreases with D4000 along the sequence populated by SDSSgalaxies in the HδA+HγA versus D4000 diagram. The aver-age mass of galaxies with D4000 . 1.2 is less than 1010M⊙,while that of galaxies with D4000 & 1.9 reaches 1011M⊙.There is a smooth transition between these two regimesin the central region of the diagram. This confirms thetrends in D4000 and HδA as functions of stellar mass ob-served by Kauffmann et al. (2003b) (see their fig. 1). Bothstellar metallicity and age also appear to increase with in-creasing D4000 (upper- and middle-left panels of Fig. 7).The variation in age is very smooth. In the intermediate

10 A. Gallazzi et al.
Figure 5. From top-left to bottom-right: distribution in z-band surface brightness, r-band absolute Petrosian magnitude (k-corrected atz = 0), redshift and 4000A-break strength for the galaxies in our sample. The dot-dashed line represents the distribution for the originalsample of 175,128 galaxies in the redshift range 0.005 < z 6 0.22. The shaded histogram describes the distribution for the final sample of44,254 high-S/N galaxies, while the red and blue histograms separate (high-S/N) early-type (C > 2.8) and late-type (C 6 2.4) galaxies,respectively. (Note that the dot-dashed and the shaded histograms are both normalized to unit area.)
regime, age appears to decrease with increasing HδA+HγA
at almost fixed D4000. The variation in metallicity is morenoisy, partly because of the larger errors associated withmetallicity estimates, especially for low D4000 (see Sec-tion 3.1). Near the middle of the galaxy sequence, i.e., for1.4 . D4000 . 1.8, stronger H-Balmer absorption appearsto be associated to not only younger but also more metal-rich stellar populations. This is consistent with the ideathat these galaxies could have experienced a burst of metal-enriched star formation about 1–2 Gyr ago.9
We have checked that the above trends in stellar metal-licity, age and stellar mass do not change significantly if weinclude galaxies with lower S/N values. The main effect is toincrease the scatter in these physical parameters along theHδA+HγA versus D4000 sequence, mainly because of thelarger observational errors in these two indices. Moreover,the average S/N for the full sample does not vary signifi-cantly along the relation. For these reasons, we believe thatour results are not strongly biased by our cut in S/N.
In the right-hand panels of Fig. 7, we have colour-codedthe HδA+HγA versus D4000 diagram to reflect the averageuncertainties in the determinations of stellar metallicity, ageand stellar mass (from top to bottom) for the galaxies fallinginto each bin. These diagrams illustrate how the tightness of
9 At fixed D4000 ∼ 1.5, this trend in age and metallicity is notconsistent with (and more pronounced than) the age-metallicitydegeneracy described in Section 3.3.
the constraints derived on the various physical parametersdepends on the strengths of HδA+HγA and D4000. The er-rors in all three parameters tend to be larger at lower D4000,the trend being especially strong for stellar metallicity. Weemphasize that the right-hand panels of Fig. 7 do not re-flect the rms scatter in the various physical parameters, butrather the average uncertainties associated with determina-tions of these parameters. For reference, the rms scatter istypically comparable to (or smaller than) the average uncer-tainty for stellar metallicity and age, but always larger thanthe average uncertainty for stellar mass.
The results of Fig. 7 suggest that both stellar metal-licity and age correlate with stellar mass. We investigatethis further in Fig. 8, where we show the distributions ofmetallicity (panel a) and age (panel b) as function of stel-lar mass for the 44,254 high-S/N galaxies in our sample.Rather than assigning each galaxy its median-likelihood es-timate of each of the three parameters, we keep here thewhole information contained in the PDFs. In Fig. 8a, thelikelihood distribution of stellar metallicity as a function ofstellar mass was obtained by coadding the normalized 2-Dlikelihood distributions of metallicity and stellar mass forall the galaxies and then re-normalizing along the metallic-ity axis in bins of stellar mass (we adopted a bin width of0.2 dex, roughly comparable to the 68 percent confidencerange in stellar mass estimates). The solid line indicates themedian of the final conditional distribution, and the dashedlines the 16th and 84th percentiles. The percentiles of the

The Ages and Metallicities of Galaxies in the Local Universe 11
Figure 6. Distributions of the median-likelihood estimates of stellar metallicity (top-left panel), age (middle-left panel) and stellar mass(bottom-left panel) for 44,254 SDSS-DR2 galaxies with redshifts in the range 0.005 < z 6 0.22 and median S/N per pixel greater than 20(solid histograms). The right-hand panels show the corresponding distributions of errors, computed as one half the 68 percent confidenceranges in the estimates of log(Z/Z⊙), log(tr/yr) and log(M∗/M⊙). The dotted histograms are for the original sample of 175,128 galaxies(all histograms are normalized to unit area).
metallicity and age distributions at fixed stellar mass areprovided in Table 2.
The median shows that metallicity increases with stel-lar mass, from roughly 20 percent of solar for galaxies withmasses below 1010M⊙ to about 1.4 times solar for thosewith masses above 1011M⊙. In between, stellar metallic-ity increases rapidly with stellar mass, the trend becom-ing shallower at M∗ & 1010.5M⊙. Fig. 8b shows the anal-ogous conditional distribution of age as a function of stel-lar mass. The median (r-band light-weighted) age increasesfrom roughly 1Gyr for galaxies with masses around 109M⊙
to about 6.5 Gyr for those with masses around 1010.5M⊙.For more massive galaxies, the median age continues to in-crease, but only by about 0.2 dex (∼ 1.6 Gyr) over one orderof magnitude in stellar mass.
Although the median metallicity and age both increasewith increasing stellar mass, the probability levels (indicatedby the colour) and the 68 percent confidence ranges revealbroad distributions in the estimates of both parameters. Wenow explore whether the larger scatter in both distributionsat smaller masses can be accounted for by the larger uncer-tainties in metallicity and age estimates for more metal-poorand younger galaxies, or whether it is indicative of an intrin-sically broad distribution in metallicity and age for low-massgalaxies. In the bottom panels of Fig. 8, we compare thescatter in these relations with the uncertainties in the es-timates of metallicity (panel c) and age (panel d) at fixedstellar mass. In each panel, the diamonds show the differ-ence between the 16th and 84th percentiles of the conditional
Table 2. Median (P50) and percentiles (P16, P84) of the distri-butions in stellar metallicity and age as a function of stellar mass(Fig. 8a,b).
log(Z/Z⊙) log(tr/yr)log(M∗/M⊙) P50 P16 P84 P50 P16 P84
8.91 -0.60 -1.11 -0.00 9.06 8.80 9.469.11 -0.61 -1.07 -0.00 9.09 8.81 9.489.31 -0.65 -1.10 -0.05 9.11 8.85 9.449.51 -0.61 -1.03 -0.01 9.17 8.89 9.499.72 -0.52 -0.97 0.05 9.23 8.94 9.579.91 -0.41 -0.90 0.09 9.32 9.00 9.7110.11 -0.23 -0.80 0.14 9.46 9.09 9.8510.31 -0.11 -0.65 0.17 9.61 9.23 9.9310.51 -0.01 -0.41 0.20 9.73 9.34 9.9810.72 0.04 -0.24 0.22 9.82 9.48 10.0310.91 0.07 -0.14 0.24 9.87 9.60 10.0611.11 0.10 -0.09 0.25 9.90 9.67 10.0811.31 0.12 -0.06 0.26 9.92 9.72 10.0911.51 0.13 -0.04 0.28 9.94 9.75 10.1111.72 0.14 -0.03 0.29 9.95 9.76 10.1211.91 0.15 -0.03 0.30 9.96 9.77 10.12
distribution shown above as a function of stellar mass. Thestars show the mean 68 percent confidence range in the indi-vidual estimates of metallicity or age for the galaxies falling

12 A. Gallazzi et al.
Figure 7. Physical parameters of 44,254 SDSS-DR2 galaxies with median S/N per pixel greater than 20 as a function of position in theHδA+HγA versus D4000 diagram. In the left-hand panels, the diagram has been binned and colour-coded in order to reflect the averagestellar metallicity (top), age (middle) and stellar mass (bottom) of the galaxies falling into each bin. In the right-hand panels, the diagramhas been binned and colour-coded to reflect the average uncertainty (corresponding to one half the 68 percent confidence interval) in thederived stellar metallicities (top), ages (middle) and stellar masses (bottom) of the galaxies falling into each bin. The widths of the binsin D4000 and HδA+HγA correspond roughly to the mean observational errors in these quantities (0.04 and 0.4, respectively).
into each stellar-mass bin.10 Fig. 8c shows that the scatter inthe mass-metallicity relation is always larger than the uncer-tainties in the metallicity estimates, by at least 0.1 dex, andis largest (compared to the error) at about 1010M⊙. Simi-larly, the scatter in the mass-age relation (Fig. 8d) is alwayslarger than the uncertainties in the age estimates and is alsolargest at about 1010M⊙. Fig. 8 clearly indicates that moremassive galaxies are older and more metal-rich, while lessmassive galaxies are younger and more metal-poor. Metal-licity and age, however, are not uniquely determined by stel-lar mass. There is an intrinsic scatter in both parameters,
10 The stars in Fig. 8c,d are not computed using the joint likeli-hood distribution, but rather by adopting the median of the M∗
PDF as our estimate of stellar mass. The comparison of the starswith the diamonds is consistent, given that the width of the stellarmass bins is comparable with the error in stellar mass estimates.
which is particularly evident at intermediate stellar masses.The results of Section 3.3 below indicate that part of this in-trinsic scatter can be accounted for by differences in galaxymorphology, the intermediate-mass regime corresponding tothe transition between disc-dominated and bulge-dominatedgalaxies. However, a significant scatter persists even whenconsidering the two classes of galaxies separately.
Tremonti et al. (2004) have shown that the emission-line galaxies in the DR2 sample exhibit a tight relationbetween stellar mass and gas-phase oxygen abundance, asdetermined from their nebular spectra. The gas-phase oxy-gen abundance increases steadily from low to high stel-lar masses, and then gradually flattens around masses of1010.5M⊙. There is a striking similarity between the relationTremonti et al. (2004) found for star forming galaxies andthe relation found in Fig. 8 above between stellar metallicityand stellar mass, which includes both star-forming and qui-

The Ages and Metallicities of Galaxies in the Local Universe 13
Figure 8. Panels a and b: conditional distribution of stellar metallicity and age as a function of stellar mass for 44,254 SDSS-DR2 galaxieswith median S/N per pixel greater than 20. Each distribution was obtained by coadding the normalized 2-D likelihood distributions ofthe desired parameter (stellar metallicity or age) and stellar mass for all the galaxies and then re-normalizing along the y-axis in bins ofstellar mass (of width 0.2 dex). The solid line indicates the median of the final conditional distribution, and the dashed lines the 16th
and 84th percentiles. Panels c and d: comparison of the scatter in the metallicity and age distributions with the mean uncertainty of themetallicity and age estimates as a function of stellar mass. The diamonds show the difference in log(Z/Z⊙) or log(tr/yr) between the16th and 84th percentiles of the conditional distributions of panels a and b, while the stars represent the mean 68 percent confidencerange in log(Z/Z⊙) or log(tr/yr) for the galaxies in each stellar mass bin.
escent galaxies. However, the dispersion in the stellar metal-licity versus stellar mass relation is much larger than that inthe relation between gas-phase oxygen abundance and stel-lar mass (±0.1 dex). This may partly reflect the larger errorsassociated with stellar metallicity determinations.
In Fig. 9, we plot stellar metallicity against gas-phaseoxygen abundance, 12+log(O/H), for the 7462 high-S/Ngalaxies of our sample for which both measures are avail-able. We note that gas-phase metallicity is best determinedfor star-forming galaxies, whereas stellar metallicity is bestdetermined for early-type galaxies. The small dots showthe median-likelihood estimates of the stellar and gas-phasemetallicities for each galaxy. The larger points indicate themedian stellar metallicity in bins of 12+log(O/H), while theouter solid lines show the corresponding 16th and 84th per-centiles. There is a relation between the two parameterswith approximately unit slope. However, the stellar metal-
licity is generally lower than the gas-phase metallicity (by∼ 0.5dex), as demonstrated by the one-to-one relation (dot-dashed line). This is expected since the nebular metallicitytraces the metallicity of the last generations of stars to form,whereas the stellar metallicity represents an average overthe entire star formation history of the galaxy. Notably, thelarge scatter in stellar metallicity at fixed gas-phase oxygenabundance (solid lines) cannot be solely accounted for bythe errors in stellar metallicity estimates (indicated by thedashed lines).
To investigate the origin of this scatter, we computethe residuals in log(Z/Z⊙) with respect to a simple lin-ear fit of the median relation (large dots) in Fig. 9. Theresiduals are plotted in Fig. 10 as a function of variousgalaxy properties, including the star formation rate (fromBrinchmann et al. 2004) and an indirect estimate of the gasmass fraction inferred from the star formation rate (see eq. 5

14 A. Gallazzi et al.
Figure 9. Stellar metallicity estimates (present work)plotted against gas-phase oxygen abundance 12+log(O/H)(Tremonti et al. 2004) for 7462 high-S/N SDSS-DR2 galaxiesfor which both measures are available. The small dots showthe median-likelihood estimates of the two parameters for eachgalaxy. The larger points (joined by a solid line) show the medianstellar metallicity in bins of 12+log(O/H) (each bin containing∼ 300 galaxies), while the outer solid lines show the corre-sponding 16th and 84th percentiles. The dashed lines indicatethe mean 68 percent confidence range in the stellar metallicityestimates for the galaxies in each bin of 12+log(O/H). Solarmetallicity is 8.69 in these units (Allende Prieto et al. 2001). Thedot-dashed line represents the one-to-one relation, showing thatstellar metallicity is always lower than gas-phase metallicity.
of Tremonti et al. 2004). In each panel, we indicate the me-dian trend of the residuals as a function of the property un-der consideration for galaxies in five bins of gas-phase oxygenabundance, from 8.70±0.075 (blue) to 9.3±0.075 (red). Thelog(Z/Z⊙) residuals show positive correlations with stellarmass, surface mass density, concentration parameter andD4000 and negative correlations with specific star forma-tion rate, gas mass fraction and HδA+HγA. These varioustrends are almost independent of gas-phase oxygen abun-dance.11 They imply that, at fixed 12+log(O/H), the starsare most metal-rich in massive, high-concentration galaxies,which have exhausted most of their gas and form stars ata lower rate than in the past. The existence of a substan-tial range of stellar metallicities at fixed gas-phase oxygenabundance in Fig. 9 further suggests that the galaxies inour sample are not well approximated by ‘closed-box’ sys-tems, for which stellar and interstellar metallicities shouldbe tightly related (e.g., Tinsley 1980). This indicates that
11 We checked that the trends of log(Z/Z⊙) residuals with thestrengths of D4000 and HδA+HγA are not caused by any bias inour estimates of stellar metallicity (see Section 2.4.2).
gas ejection and/or accretion may be important factors ingalaxy chemical evolution.
3.3 Age versus metallicity
Most previous population synthesis studies of the age-metallicity relation for nearby galaxies have focused onearly-type galaxies (e.g. Gonzalez et al. 1993; Worthey 1997;Bernardi et al. 1998; Terlevich et al. 1999; Ferreras et al.1999; Trager et al. 2000). A few studies have also in-cluded the bulges of spiral galaxies (Jablonka et al.1996; Goudfrooij et al. 1999; Terlevich & Forbes 2002;Proctor & Sansom 2002). Our determination, with a newmethod, of the ages and metallicities of a large sample ofnearby galaxies spanning a wide range of star formation ac-tivities allows us to re-assess the relation between these twophysical parameters.
We separate here high-concentration, bulge-dominatedearly-type galaxies and low-concentration, disk-dominatedlate-type galaxies as described above to understand whetherdifferent conclusions can be drawn for different types ofgalaxies. We have shown in Fig. 8 that both metallicityand age increase with stellar mass. We may therefore ex-pect that the distribution of galaxies over metallicity andage will change when different masses are considered. Thismass dependence may also be different for different types ofgalaxies. For this reason, we divide each morphological sub-sample into six bins of stellar mass. Figs 11 and 12 show theage-metallicity relation in these different stellar-mass binsfor late-type and early-type galaxies, respectively. The stel-lar mass increases from log(M/M⊙) 6 10 in the top-leftpanel to log(M/M⊙) > 11 in the bottom-right panel. Theserelations were obtained by simply coadding the normalizedjoint likelihood distributions of age and metallicity for in-dividual galaxies, without further normalization. The greylevels indicate the probability associated with each value ofmetallicity and age in a square-root scale, while the contoursenclose 26, 68, 95 and 99 percent of the total probability.
Fig. 11 shows that the ages and metallicities of low-concentration, late-type galaxies change significantly as afunction of stellar mass. Galaxies less massive than 1010M⊙
have typically low metallicities (Z ≈ 10−0.6Z⊙) and youngages (0.8 . tr/Gyr . 2.5). At intermediate stellar masses,i.e. for 1010 . M∗/M⊙ . 1010.5, the distribution in metal-licity becomes broader and shifts gradually to higher metal-licities. The overall spread in age is roughly 0.8 dex, and thedistribution shifts slightly to older ages. Late-type galax-ies more massive than 1010.5M⊙ have predominantly highmetallicities (Z & Z⊙) and old ages (3.2 . tr/Gyr . 10).The fraction of young metal-poor galaxies nearly vanishesat the highest masses.
Fig. 12 shows that the ages and metallicities ofhigh-concentration, early-type galaxies depend much moreweakly on stellar mass than those of low-concentration, late-type galaxies. The gradual increase of metallicity with stel-lar mass is still appreciable for early-type galaxies. Galax-ies less massive than 1010M⊙ have metallicities typically inthe range 10−0.4–100.1Z⊙, while galaxies more massive than1011M⊙ have metallicities typically above solar. The agerange does not exhibit any significant variation with stellarmass, except for a population of young metal-poor galaxiesin the lowest-mass bin, which does not show up at higher

The Ages and Metallicities of Galaxies in the Local Universe 15
Figure 10. Residuals in log(Z/Z⊙) with respect to a simple linear fit of the median relation between stellar metallicity and gas-phaseoxygen abundance in Fig. 9, plotted against various galaxy properties. From left to right, top raw: star formation rate (in units of
M⊙yr−1), specific star formation rate (in units of yr−1) and gas mass fraction. Middle raw: r-band light-weighted age (in units of yr),D4000 and HδA+HγA index strengths. Bottom raw: total stellar mass (in units of M⊙), surface mass density within the Petrosian r-bandR50 radius (in units of M⊙kpc−2) and r-band concentration parameter. In each panel, curves of different colors indicate the medianrelations in different bins of gas-phase oxygen abundance, increasing from 8.7 ± 0.075 (blue) to 9.3 ± 0.075 (red).
masses. At low stellar masses, we also notice a small fraction(∼ 1 percent) of galaxies clumping at much higher metallici-ties and younger ages than the bulk of the early-type galaxysample. Detailed inspection reveals that these galaxies arephotometric outliers, for which we are uncertain of the ac-curacy of our fits. Follow-up observations would be requiredto understand whether the unusual metallicities and agesof these galaxies are consistent with a substantial recentepisode of metal-enriched star formation.
We note that the typical light-weighted age for the mas-sive early-type galaxies in our sample is ∼8 Gyr, which issomewhat younger than the ages usually quoted for (clus-ter) ellipticals. Differences can arise from differences in theadopted methods. In particular, the ages usually quoted inthe literature are derived by comparing the observed dis-tributions in spectral indices with simple stellar populationpredictions. What we quote here is a proper light-weightedage, calculated by weighting the age of each generation ofstars by their luminosity along the entire SFH of each modelgalaxy. Nevertheless, the relatively young ages we find couldreflect an environmental dependence, since the SDSS sam-ple is composed predominantly of galaxies in lower densityregions than those used in most studies of early-type galax-
ies. Indeed, several studies have reported an age differencebetween early-type galaxies in clusters and in low-density re-gions from ∼1.2 Gyr (Bernardi et al. 1998) up to 2− 3 Gyr(Kuntschner et al. 2002; Thomas et al. 2005). We will dis-cuss the properties of the early-type galaxies in our samplein more detail in the second paper of this series.
A comparison of Figs 11 and 12 suggests that the agesand metallicities of late- and early-type galaxies differ pri-marily at the low-mass end. Low-mass late-type galaxiestend to be younger and more metal-poor than their early-type counterparts (by about 0.6 dex in both age and metal-licity). In contrast, massive late-type galaxies tend to haveold ages and high metallicities similar to those of their early-type counterparts, even though there is a tail of young(tr . 109.5 yr), metal-poor (Z ≈ 10−0.5Z⊙) late-type galax-ies with masses greater than 1011M⊙ in our sample. Thehigh metallicities of most massive late-type galaxies mightreflect the influence of their metal-rich bulges. This may beenhanced by the fact that the SDSS spectra sample only theinner regions of the galaxies (see Section 3.4 below).
Figs 11 and 12 also indicate that the relation betweenstellar metallicity and stellar mass discussed in Section 3.2holds for both late-type and early-type galaxies. In con-

16 A. Gallazzi et al.
trast, the relation between age and stellar mass is muchmore pronounced for late-type galaxies, which cover a sig-nificant range in age (∼ 9 Gyr). Early-type galaxies donot show such a clear trend, at least above 1010.5M⊙.This is in agreement with previous findings of no signifi-cant relation between the ages of early-type galaxies andluminosity (Kuntschner & Davies 1998; Kuntschner 1998;Terlevich & Forbes 2002). At fainter luminosities, however,there are indications of a spread to younger ages (see alsoWorthey & Ottaviani 1997; Caldwell & Rose 1998). We alsofind that the fraction of young early-type galaxies increasesat lower stellar masses. This is true in particular below1010M⊙, reflecting a possible contamination by S0 galaxies(e.g. Poggianti et al. 2001). Finally, we note that for bothearly-type galaxies and high-mass late-type galaxies, theprobability contours of Figs 11 and 12 hint at an anticorre-lation between age and stellar metallicity, at given mass.Other workers have pointed out this anticorrelation (e.g.Worthey et al. 1995; Colless et al. 1999; Jørgensen 1999;Rakos et al. 2001; Poggianti et al. 2001), but it is difficultto assess its significance here because of the correlated er-rors on age and metallicity (see below).
The dependence of the properties of SDSS galaxies onstellar mass has been addressed in previous studies (e.g.Shen et al. 2003; Brinchmann et al. 2004; Tremonti et al.2004; Kannappan 2004; Salim et al. 2005; Jimenez et al.2005). In particular, Kauffmann et al. (2003b) point outthat, at masses around ∼ 1010.5M⊙, galaxies separate intotwo distinct classes of spectral and structural properties.Baldry et al. (2004) have recently shown that this transi-tion around (2− 3)× 1010M⊙ can be seen directly from thecolour-magnitude relation. Moreover, this mass range seemsalso to correspond to a shift in gas richness (Kannappan2004). It is interesting to note that, around the same valueof stellar mass, there appears to be also a gradual transitionin the ages and metallicities of the galaxies. This transition,which is particularly evident for late-type galaxies, causesthe dispersion in age and metallicity to be highest for galax-ies of intermediate mass.
We have not mentioned so far the potential influenceof the ‘age-metallicity degeneracy’ on the results of Figs 11and 12 (see Section 1). This degeneracy, which arises fromthe competing effects of age and metallicity on absorption-line strengths, can cause the confusion between old, metal-poor galaxies and young, metal-rich ones (Worthey 1994).To address this issue, we first evaluate the slope of the age-metallicity degeneracy from the two-dimensional likelihooddistribution of each individual galaxy in our sample. Thisis achieved by computing the matrix of second moments ofthe likelihood distribution (inside the 68 percent probabilitycontour) with respect to the median logZ and log tr values.The direction of the eigenvector corresponding to the largesteigenvalue of this matrix defines the slope ∆ logZ/∆ log trof the age-metallicity degeneracy. In each panel of Figs 11and 12, the straight line indicates the mean ∆ logZ/∆ log trfor the galaxies falling into the corresponding bin of stellarmass. The slopes are listed in Table 3.12 They tend to be
12 These values are consistent with the results of Worthey (1996),which imply that the change in metallicity needed to compensatea change in age at fixed index strength in the spectrum of an old
Table 3. Average slope of the age-metallicity degeneracy in dif-ferent bins of stellar mass, for the low-concentration and high-concentration galaxies of Figs 11 and 12.
Stellar mass (M⊙) ∆ log Z/∆log tr
C 6 2.4 C > 2.8
log M∗ 6 10 −1.78 −1.2910 < log M∗ 6 10.3 −1.41 −0.8510.3 < log M∗ 6 10.5 −1.28 −0.8410.5 < log M∗ 6 10.8 −1.15 −0.8010.8 < log M∗ 6 11 −1.05 −0.78log M∗ > 11 −0.95 −0.75
steeper for low-concentration galaxies (−1.78 to −0.95) thanfor high-concentration ones (−1.29 to −0.75).
The orientation of the age-metallicity degeneracy inFigs 11 and 12 indicates that it cannot be responsible for thetrends in age and metallicity as a function of stellar massidentified above. However, it can account for the shape ofthe joint age-metallicity probability contours for early-typegalaxies and the most massive late-type galaxies at highmetallicities (Z & Z⊙).
3.4 Aperture bias
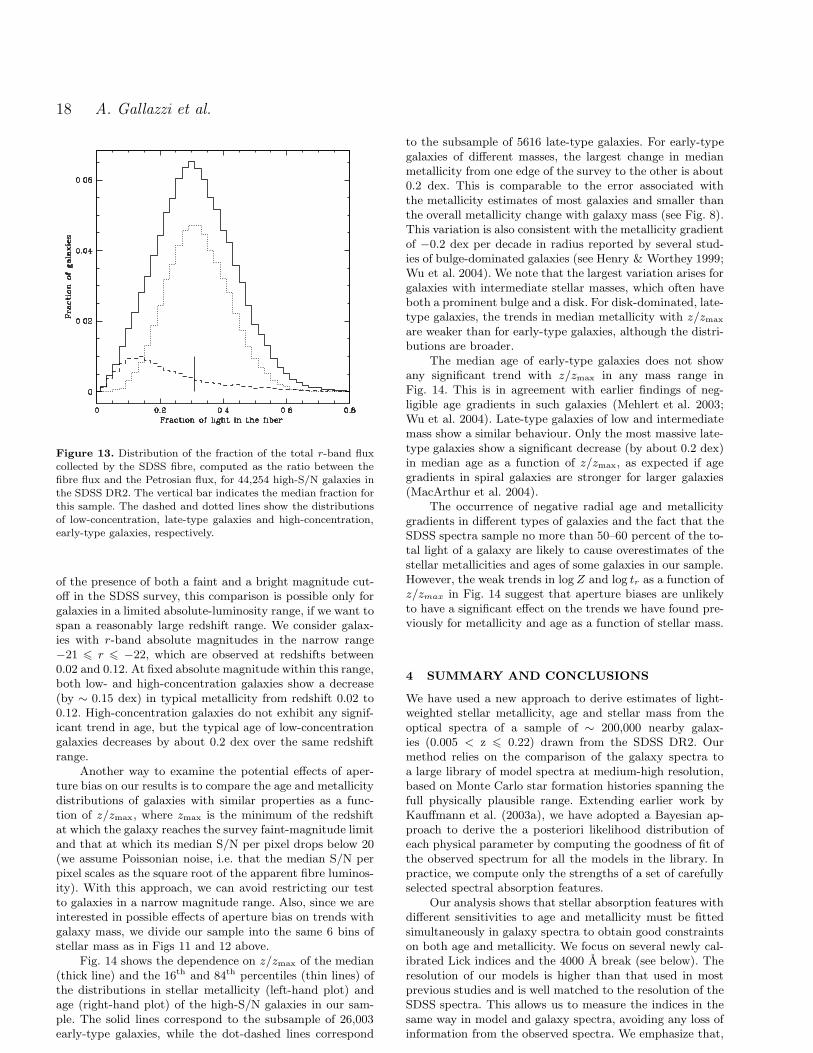
The SDSS galaxy spectra on which our analysis is basedare taken using 3′′-diameter fibres, which collect only thelight coming from limited inner regions of the galaxies. Wecan estimate the fraction of the total galaxy light enter-ing a fibre from the ratio between the fibre flux and thetotal Petrosian flux. Fig. 13 shows the distribution of thisratio for the 44,254 high-S/N galaxies in our sample. Themedian value is about 30 percent, and the maximum valueabout 60 percent. The dashed and dotted lines show thedistributions for low-concentration, late-type galaxies andhigh-concentration, early-type galaxies, respectively. As ex-pected, the fibre tends to collect a smaller fraction of thetotal light for low-concentration galaxies than for high-concentration galaxies.
Radial gradients in the properties of stellar pop-ulations are known to exist for both bulge-dominated(Henry & Worthey 1999; Saglia et al. 2000; Mehlert et al.2003) and disk-dominated (Bell & de Jong 2000;MacArthur et al. 2004) galaxies. Thus, aperture effects area significant concern for our age and metallicity estimates.Fortunately, the distribution of the fraction of total galaxylight that enters an SDSS fibre does not vary appreciablywith redshift (except at very low redshift), because largergalaxies are also brighter and hence selected out to largerdistances.
One way to test for the effects of aperture bias on ourresults is to compare the ages and metallicities of galaxiesof similar luminosity located at different redshifts. Because
stellar population should correspond to values of ∆ log Z/∆log trranging from −1.7 for age-sensitive indices to −0.2 for metal-sensitive indices.

The Ages and Metallicities of Galaxies in the Local Universe 17
Figure 11. Two-dimensional distribution of stellar metallicity and age in 6 bins of stellar mass (as indicated) for the subsample of 5616late-type (C 6 2.4) SDSS-DR2 galaxies with median S/N per pixel greater than 20. Each distribution was obtained by coadding thenormalized joint likelihood distributions of age and metallicity for individual galaxies. The grey levels indicate the probability associatedwith each value of metallicity and age in a square-root scale, while the contours enclose 26, 68, 95 and 99 percent of the total probability.The straight line (which intersects the peak of the probability distribution) indicates the mean slope of the age-metallicity degeneracyfor the galaxies falling into each stellar-mass bin.
Figure 12. Same as Fig. 11, but for the subsample of 26,003 early-type (C > 2.8) SDSS-DR2 galaxies with median S/N per pixel greaterthan 20.
18 A. Gallazzi et al.
Figure 13. Distribution of the fraction of the total r-band fluxcollected by the SDSS fibre, computed as the ratio between thefibre flux and the Petrosian flux, for 44,254 high-S/N galaxies inthe SDSS DR2. The vertical bar indicates the median fraction forthis sample. The dashed and dotted lines show the distributions
of low-concentration, late-type galaxies and high-concentration,early-type galaxies, respectively.
of the presence of both a faint and a bright magnitude cut-off in the SDSS survey, this comparison is possible only forgalaxies in a limited absolute-luminosity range, if we want tospan a reasonably large redshift range. We consider galax-ies with r-band absolute magnitudes in the narrow range−21 6 r 6 −22, which are observed at redshifts between0.02 and 0.12. At fixed absolute magnitude within this range,both low- and high-concentration galaxies show a decrease(by ∼ 0.15 dex) in typical metallicity from redshift 0.02 to0.12. High-concentration galaxies do not exhibit any signif-icant trend in age, but the typical age of low-concentrationgalaxies decreases by about 0.2 dex over the same redshiftrange.
Another way to examine the potential effects of aper-ture bias on our results is to compare the age and metallicitydistributions of galaxies with similar properties as a func-tion of z/zmax, where zmax is the minimum of the redshiftat which the galaxy reaches the survey faint-magnitude limitand that at which its median S/N per pixel drops below 20(we assume Poissonian noise, i.e. that the median S/N perpixel scales as the square root of the apparent fibre luminos-ity). With this approach, we can avoid restricting our testto galaxies in a narrow magnitude range. Also, since we areinterested in possible effects of aperture bias on trends withgalaxy mass, we divide our sample into the same 6 bins ofstellar mass as in Figs 11 and 12 above.
Fig. 14 shows the dependence on z/zmax of the median(thick line) and the 16th and 84th percentiles (thin lines) ofthe distributions in stellar metallicity (left-hand plot) andage (right-hand plot) of the high-S/N galaxies in our sam-ple. The solid lines correspond to the subsample of 26,003early-type galaxies, while the dot-dashed lines correspond
to the subsample of 5616 late-type galaxies. For early-typegalaxies of different masses, the largest change in medianmetallicity from one edge of the survey to the other is about0.2 dex. This is comparable to the error associated withthe metallicity estimates of most galaxies and smaller thanthe overall metallicity change with galaxy mass (see Fig. 8).This variation is also consistent with the metallicity gradientof −0.2 dex per decade in radius reported by several stud-ies of bulge-dominated galaxies (see Henry & Worthey 1999;Wu et al. 2004). We note that the largest variation arises forgalaxies with intermediate stellar masses, which often haveboth a prominent bulge and a disk. For disk-dominated, late-type galaxies, the trends in median metallicity with z/zmax
are weaker than for early-type galaxies, although the distri-butions are broader.
The median age of early-type galaxies does not showany significant trend with z/zmax in any mass range inFig. 14. This is in agreement with earlier findings of neg-ligible age gradients in such galaxies (Mehlert et al. 2003;Wu et al. 2004). Late-type galaxies of low and intermediatemass show a similar behaviour. Only the most massive late-type galaxies show a significant decrease (by about 0.2 dex)in median age as a function of z/zmax, as expected if agegradients in spiral galaxies are stronger for larger galaxies(MacArthur et al. 2004).
The occurrence of negative radial age and metallicitygradients in different types of galaxies and the fact that theSDSS spectra sample no more than 50–60 percent of the to-tal light of a galaxy are likely to cause overestimates of thestellar metallicities and ages of some galaxies in our sample.However, the weak trends in logZ and log tr as a function ofz/zmax in Fig. 14 suggest that aperture biases are unlikelyto have a significant effect on the trends we have found pre-viously for metallicity and age as a function of stellar mass.
4 SUMMARY AND CONCLUSIONS
We have used a new approach to derive estimates of light-weighted stellar metallicity, age and stellar mass from theoptical spectra of a sample of ∼ 200,000 nearby galax-ies (0.005 < z 6 0.22) drawn from the SDSS DR2. Ourmethod relies on the comparison of the galaxy spectra toa large library of model spectra at medium-high resolution,based on Monte Carlo star formation histories spanning thefull physically plausible range. Extending earlier work byKauffmann et al. (2003a), we have adopted a Bayesian ap-proach to derive the a posteriori likelihood distribution ofeach physical parameter by computing the goodness of fit ofthe observed spectrum for all the models in the library. Inpractice, we compute only the strengths of a set of carefullyselected spectral absorption features.
Our analysis shows that stellar absorption features withdifferent sensitivities to age and metallicity must be fittedsimultaneously in galaxy spectra to obtain good constraintson both age and metallicity. We focus on several newly cal-ibrated Lick indices and the 4000 A break (see below). Theresolution of our models is higher than that used in mostprevious studies and is well matched to the resolution of theSDSS spectra. This allows us to measure the indices in thesame way in model and galaxy spectra, avoiding any loss ofinformation from the observed spectra. We emphasize that,

The Ages and Metallicities of Galaxies in the Local Universe 19
Figure 14. Dependence on z/zmax of the median (thick line) and the 16th and 84th percentiles (thin lines) of the distributions in stellarmetallicity (left-hand plot) and age (right-hand plot) of SDSS-DR2 galaxies with median S/N per pixel greater than 20. The quantityzmax is the minimum of the redshift at which the galaxy reaches the survey magnitude limit and that at which its median S/N perpixel drops below 20. The solid lines correspond to the subsample of 26,003 early-type (C > 2.8) galaxies, while the dot-dashed linescorrespond to the subsample of 5616 late-type (C 6 2.4) galaxies.
while most previous studies were restricted to the analy-sis of old stellar populations, our sample includes galaxiesin the full range of star formation activities. For activelystar-forming galaxies, the higher resolution of the models iscrucial to separate strong emission lines from the underlyingstellar absorption.
Using this approach, we are able to constrain stellarmetallicity and light-weighted age to within ±0.15 dex forthe majority of the galaxies in the sample. Our stellar-massestimates, determined within less than ±0.1 dex for thewhole sample, are in good agreement with those derived byKauffmann et al. (2003a). While the uncertainties on thestellar mass are almost independent of galaxy type, we findthat, as expected, the smallest errors on age and especiallymetallicity are obtained for galaxies with the strongest ab-sorption lines.
The estimates we derive of galaxy parameters are af-fected by limitations of both model and observed spectra.For example, the models do not include the effects of vari-ations in heavy-element abundance ratios, while systematicdeviations from the solar abundance ratios are known toarise in external galaxies (e.g. Worthey et al. 1992). Whenestimating metallicity, we therefore consider only those spec-tral features that have been shown by previous studies todepend negligibly on α/Fe abundance ratio (Trager et al.2000; Thomas et al. 2003b; Tantalo & Chiosi 2004). The in-clusion of higher-order Balmer lines, which may depend onelement abundance ratio at high metallicities (Thomas et al.2004), could lead to an overestimate of the metallicity andan underestimate of the age by ∼0.05 dex for galaxies withnon-solar abundance ratios in our sample. Another system-atic uncertainty in our metallicity and age estimates comesfrom the discrepancy between integrated colours and spec-tral index strengths for supra-solar metallicity models (the
model spectral indices correspond to lower metallicities thanthe colours). Therefore, we expect metallicities inferred us-ing these models to be biased toward high values at highmetallicities. This problem mainly affects massive, early-type galaxies with strong absorption lines.
We have shown that, in addition to these model un-certainties, the signal-to-noise ratio in a galaxy spectrumstrongly affects our estimates of age and especially metallic-ity. We choose to rely primarily on results for galaxies withmedian S/N per pixel greater than 20. This cut reduces theoriginal sample by about 75 percent and biases our analysistoward high surface brightness, high concentration galaxies.Our main results appear unaffected by this cut in S/N; in-cluding lower-S/N galaxies mainly increases the scatter inthe relations we find, because of the larger associated uncer-tainties on metallicity.
Another observational limitation is the small aperturesampled by the SDSS spectra. The fraction of light collectedby an SDSS fibre depends on the apparent size of the targetgalaxy, and this fraction is less than 30 percent for mostgalaxies in our sample. The stellar mass we derive fromthe spectrum has been scaled to the total luminosity of thegalaxy, and hence, it represents the total stellar mass of thatgalaxy. However, the age and the metallicity derived fromthe fibre spectrum cannot be easily extrapolated to totalvalues without information about radial gradients. We haveshown that these two parameters vary weakly as a func-tion of the fraction of light entering the fibre. This reassuresus that aperture bias does not have a major effect on therelations between metallicity, age and stellar mass that wederive.
We have explored how galaxies are distributed inmetallicity, age and stellar mass in the diagram definedby 4000-A break and Balmer-line strength. As shown by

20 A. Gallazzi et al.
Kauffmann et al. (2003a) the principal sequence in thisplane reflects an increase in present to past-averagedstar formation rate with decreasing D4000 (see alsoBrinchmann et al. 2004). Galaxies with particularly strongBalmer absorption at given D4000 have undergone recentstarbursts. By including metallicity dependence in the mod-elling, we have shown that:
• In this diagram, the average stellar mass increases alongthe sequence populated by galaxies in our sample, from lessthan 1010M⊙ to more than 1011M⊙ from end to end of thesequence. The transition at intermediate D4000 is smoothbetween the two regimes. These results are in agreementwith those of Kauffmann et al. (2003b).
• Both stellar metallicity and light-weighted age also in-crease with D4000. Galaxies with particularly strong Balmerabsorption at intermediate 4000-A breaks (D4000 ∼ 1.5)are on average younger and more metal-rich than the bulkof the sequence. This supports the idea that these galaxiesmay have recently undergone a burst of metal-enriched starformation.
In addition, we have constructed the conditional dis-tributions of metallicity and age estimates as a function ofstellar mass. This analysis shows that:
• Both stellar metallicity and light-weighted age increasewith stellar mass, the increase being rapid at intermediatemasses. At masses above ∼ 3×10¹⁰M⊙, a gradual flatteningoccurs in both relations. This stellar mass corresponds tothe transition mass identified by Kauffmann et al. (2003b)in plots of D4000, surface mass density and concentrationagainst stellar mass.
• Despite the above clear relations, metallicity and ageare not uniquely determined by mass; there is an intrinsicscatter in both relations, which is largest at stellar massesaround 1010M⊙. This scatter persists even when consideringlow- and high-concentration galaxies separately.
• The relation we find between stellar metallicity and stel-lar mass is similar to that found by Tremonti et al. (2004)between gas-phase oxygen abundance and stellar mass. Weconfirm that higher stellar metallicities are indeed associatedwith higher gas-phase metallicities. However, the relationbetween stellar and gas-phase metallicities has a substantialscatter, which can only partly be attributed to the uncer-tainties in stellar-metallicity estimates. This suggests that asimple ‘closed-box’ scenario is not sufficient to explain therelation, and that a variety of gas accretion/ejection histo-ries may be required.
We have also explored relationships between metallic-ity, age and stellar mass for separate subsamples of high-concentration, early-type and low-concentration, late-typegalaxies. The distribution in age-metallicity space in bins ofstellar mass shows that (Figs 11 and 12):
• Relations between stellar metallicity, age and stellarmass hold for both early- and late-type galaxies. However,the age range of the sample is less mass-dependent for early-type than for late-type galaxies.
• At masses below 1010M⊙, late-type galaxies are youngerand more metal-poor than early-type galaxies. At massesabove 1011M⊙ the metallicities and ages of late-type galaxiesare similar to those of early-type galaxies.
The above results indicate that young, metal-poor stel-lar populations are found predominantly in low-mass galax-ies. This is consistent with a ‘downsizing’ scenario, in whichthe mass and luminosity of the galaxies undergoing activestar formation become progressively lower as the Universebecomes older (Cowie et al. 1996). Taken at face value, thiswould imply that the low metallicities of low-mass galax-ies just reflect the fact that these galaxies have had lesstime to produce metals. This naive conclusion is not consis-tent with that of Tremonti et al. (2004), who showed thatthe effective yields (from indirect gas-mass fraction measure-ments) of low-mass, star-forming galaxies in the SDSS DR2are too low for these galaxies to be interpreted as youngclosed-box systems. This led Tremonti et al. (2004) to favorgalatic winds as the most likely origin of the relation betweengas-phase metallicity and stellar mass. This interpretation issupported here by the fact that galaxies with no Hα emissionin our sample (which have presumably completed their starformation) also show a trend of decreasing stellar metallic-ity with decreasing stellar mass for M∗ . 2 × 10¹⁰M⊙ (themetallicity of closed-box galaxies should tend to the yieldnear gas exhaustion, independently of mass). The large scat-ter present in all relations between stellar metallicity, ageand stellar mass (even when separated into late-type andearly-type galaxies) further indicates that stellar mass is notthe unique parameter determining the star formation historyand hence the physical parameters of present-day galaxies.Additional variations in star formation and enrichment his-tory (e.g. driven by gas infall or outflow) are required toexplain these parameters.
An advantage of the large samples available from theSDSS is that they allow us to study not only the mean re-lations between physical parameters of galaxies, but alsothe dependence of these parameters on various galaxy prop-erties. Our results are particularly useful for studying thephysical origin of well-known observed relations, such as forexample the colour-magnitude relation and the relation be-tween Mg2-index strength and velocity dispersion for early-type galaxies. Our analysis also enables us to estimate thetotal metal content of the local Universe and the distributionof these metals over different galaxy types. We will addressthese questions in forthcoming papers.
A complete census of the physical parameters of galax-ies out to z ∼ 0.1 is essential for constraining models of thestar formation and chemical enrichment histories of galaxies.The application of our method to large samples of galaxiesat higher redshifts will enable us to study how the distri-bution of the physical parameters of galaxies evolves withlookback time. Ongoing deep redshift surveys, such as VVDS(Le Fevre et al. 2004) and DEEP2 (Davis et al. 2003) in theoptical and GALEX in the ultraviolet (Martin et al. 2004),are already assembling large samples of high-redshift galax-ies. Quantitative comparison with the SDSS samples shouldsubstantially deepen our understanding of galaxy evolution.
ACKNOWLEDGMENTS
We thank Guinevere Kauffmann and an anonymous ref-eree for useful comments. A.G. thanks Stefano Zibetti andGabriella De Lucia for useful discussions. A.G. and S.C.thank the Alexander von Humboldt Foundation, the Federal

The Ages and Metallicities of Galaxies in the Local Universe 21
Ministry of Education and Research, and the Programme forInvestment in the Future (ZIP) of the German Governmentfor funding through a Sofja Kovalevskaja award. J.B. ac-knowledges the support of an ESA post-doctoral fellowship.
Funding for the creation and distribution of the SDSSArchive has been provided by the Alfred P. Sloan Founda-tion, the Participating Institutions, the National Aeronau-tics and Space Administration, the National Science Foun-dation, the US Department of Energy, the Japanese Mon-bukagakusho, and the Max Planck Society. The SDSS Website is http://www.sdss.org/. The Participating Institutionsare the University of Chicago, Fermilab, the Institute forAdvanced Study, the Japan Participation Group, the JohnsHopkins University, the Max Planck Institute for Astron-omy (MPIA), the Max Planck Institute for Astrophysics(MPA), New Mexico State University, Princeton University,the United States Naval Observatory, and the University ofWashington.
REFERENCES
Abazajian K., et al. 2004, AJ, 128, 502Allende Prieto C., Lambert D. L., Asplund M., 2001, ApJ,556, L63
Baldry I. K., Glazebrook K., Brinkmann J., Ivezic Z., Lup-ton R. H., Nichol R. C., Szalay A. S., 2004, ApJ, 600,681
Balogh M. L., Morris S. L., Yee H. K. C., Carlberg R. G.,Ellingson E., 1999, ApJ, 527, 54
Bell E. F., de Jong R. S., 2000, MNRAS, 312, 497Bernardi M., Renzini A., da Costa L. N., Wegner G.,Alonso M. V., Pellegrini P. S., Rite C., Willmer C. N. A.,1998, ApJ, 508, L143
Bressan A., Chiosi C., Fagotto F., 1994, ApJS, 94, 63Brinchmann J., Charlot S., White S. D. M., Tremonti C.,Kauffmann G., Heckman T., Brinkmann J., 2004, MN-RAS, 351, 1151
Bruzual G., Charlot S., 2003, MNRAS, 344, 1000Bruzual A. G., 1983, ApJ, 273, 105Bruzual A. G., Charlot S., 1993, ApJ, 405, 538Burstein D., Faber S. M., Gaskell C. M., Krumm N., 1984,ApJ, 287, 586
Caldwell N., Rose J. A., 1998, AJ, 115, 1423Charlot S., Fall S. M., 2000, ApJ, 539, 718Colless M., et al 1999, MNRAS, 303, 813Cowie L. L., Songaila A., Hu E. M., Cohen J. G., 1996, AJ,112, 839
Davies R. L., Sadler E. M., Peletier R. F., 1993, MNRAS,262, 650
Davis M., et al. 2003, in Discoveries and ResearchProspects from 6- to 10-Meter-Class Telescopes II. Editedby Guhathakurta, Puragra. Proceedings of the SPIE, Vol-ume 4834, pp. 161-172 (2003). Science Objectives andEarly Results of the DEEP2 Redshift Survey. pp 161–172
Eisenstein D. J., et al. 2003, ApJ, 585, 694Faber S. M., 1973, ApJ, 179, 731Ferreras I., Charlot S., Silk J., 1999, ApJ, 521, 81Fioc M., Rocca-Volmerange B., 1997, A&A, 326, 950Gonzalez J. J., 1993, Ph.D. ThesisGonzalez J. J., Faber S. M., Worthey G., 1993, Bulletin ofthe American Astronomical Society, 25, 1355
Gorgas J., Cardiel N., Pedraz S., Gonzalez J. J., 1999,A&AS, 139, 29
Gorgas J., Faber S. M., Burstein D., Gonzalez J. J.,Courteau S., Prosser C., 1993, ApJS, 86, 153
Goudfrooij P., Gorgas J., Jablonka P., 1999, Ap&SS, 269,109
Henry R. B. C., Worthey G., 1999, PASP, 111, 919
Jablonka P., Martin P., Arimoto N., 1996, AJ, 112, 1415
Jimenez R., Panter B., Heavens A. F., Verde L., 2005, MN-RAS, 356, 495
Jørgensen I., 1999, MNRAS, 306, 607
Kannappan S. J., 2004, ApJ, 611, L89
Kauffmann G., et al. 2003a, MNRAS, 341, 33
Kauffmann G., et al. 2003b, MNRAS, 341, 54
Korn A. J., Maraston C., Thomas D., 2005,astro-ph/0504574
Kuntschner H., 1998, Ph.D. Thesis
Kuntschner H., 2000, MNRAS, 315, 184
Kuntschner H., 2004, A&A, 426, 737
Kuntschner H., Davies R. L., 1998, MNRAS, 295, L29+
Kuntschner H., Lucey J. R., Smith R. J., Hudson M. J.,Davies R. L., 2001, MNRAS, 323, 615
Kuntschner H., Smith R. J., Colless M., Davies R. L.,Kaldare R., Vazdekis A., 2002, MNRAS, 337, 172
Le Borgne J.-F., Bruzual G., Pello R., Lancon A., Rocca-Volmerange B., Sanahuja B., Schaerer D., Soubiran C.,Vılchez-Gomez R., 2003, A&A, 402, 433
Le Fevre O., et al. 2004, A&A, 417, 839
Longhetti M., Rampazzo R., Bressan A., Chiosi C., 1998,A&AS, 130, 251
MacArthur L. A., Courteau S., Bell E., Holtzman J. A.,2004, ApJS, 152, 175
Maraston C., 1998, MNRAS, 300, 872
Martin C. D., et al. 2004, astro-ph/0411302
Mehlert D., Thomas D., Saglia R. P., Bender R., WegnerG., 2003, A&A, 407, 423
Poggianti B. M., Bridges T. J., Carter D., Mobasher B.,Doi M., Iye M., Kashikawa N., Komiyama Y., OkamuraS., Sekiguchi M., Shimasaku K., Yagi M., Yasuda N., 2001,ApJ, 563, 118
Poggianti B. M., Bridges T. J., Mobasher B., Carter D.,Doi M., Iye M., Kashikawa N., Komiyama Y., OkamuraS., Sekiguchi M., Shimasaku K., Yagi M., Yasuda N., 2001,ApJ, 562, 689
Proctor R. N., Sansom A. E., 2002, MNRAS, 333, 517
Rakos K., Schombert J., Maitzen H. M., Prugovecki S.,Odell A., 2001, AJ, 121, 1974
Saglia R. P., Maraston C., Greggio L., Bender R., ZieglerB., 2000, A&A, 360, 911
Salim S., et al. 2005, ApJ, 619, L39
Schlegel D. J., Finkbeiner D. P., Davis M., 1998, ApJ, 500,525
Shen S., et al. 2003, MNRAS, 343, 978
Shimasaku K., et al. 2001, AJ, 122, 1238
Stoughton C., et al. 2002, AJ, 123, 485
Strateva I., et al. 2001, AJ, 122, 1861
Tantalo R., Chiosi C., 2004, MNRAS, 353, 917
Tantalo R., Chiosi C., Bressan A., 1998, A&A, 333, 419
Terlevich A. I., Forbes D. A., 2002, MNRAS, 330, 547
Terlevich A. I., Kuntschner H., Bower R. G., Caldwell N.,Sharples R. M., 1999, MNRAS, 310, 445

22 A. Gallazzi et al.
Thomas D., Maraston C., Bender R., 2003a, MNRAS, 343,279
Thomas D., Maraston C., Bender R., 2003b, MNRAS, 339,897
Thomas D., Maraston C., Bender R., de Oliveira C. M.,2005, ApJ, 621, 673
Thomas D., Maraston C., Korn A., 2004, MNRAS, 351,L19
Tinsley B. M., 1978, ApJ, 222, 14Tinsley B. M., 1980, Fundamentals of Cosmic Physics, 5,287
Trager S. C., Faber S. M., Worthey G., Gonzalez J. J.,2000, AJ, 120, 165
Trager S. C., Worthey G., Faber S. M., Burstein D., Gon-zalez J. J., 1998, ApJS, 116, 1
Tremonti C. A., 2003, Ph.D. ThesisTremonti C. A., et al. 2004, ApJ, 613, 898Tripicco M. J., Bell R. A., 1995, AJ, 110, 3035Vazdekis A., 1999, ApJ, 513, 224Vazdekis A., 2001, Ap&SS, 276, 921Worthey G., 1994, ApJS, 95, 107Worthey G., 1996, in ASP Conf. Ser. 98: From Stars toGalaxies: the Impact of Stellar Physics on Galaxy Evo-lution Elliptical Galaxies: Abundance Ratio Trends andImplications. pp 467–+
Worthey G., 1997, in American Institute of Physics Confer-ence Series Star Formation History of Elliptical Galaxiesfrom Low-Redshift Evidence. pp 525–+
Worthey G., Faber S. M., Gonzalez J. J., 1992, ApJ, 398,69
Worthey G., Faber S. M., Gonzalez J. J., Burstein D., 1994,ApJS, 94, 687
Worthey G., Ottaviani D. L., 1997, ApJS, 111, 377Worthey G., Trager S. C., Faber S. M., 1995, in ASP Conf.Ser. 86: Fresh Views of Elliptical Galaxies The GalaxianAge-Metallicity Relation. pp 203–+
Wu H., Shao Z., Mo H. J., Xia X., Deng Z., 2004,astro-ph/0404226
York D. G., et al. 2000, AJ, 120, 1579